Embed Size (px)
Citation preview

A CITIZEN’S GUIDE TO
THE FEDERAL BUDGET
BUDGET OF THE UNITED STATES GOVERNMENT
Fiscal Year 1997


Table of Contents
A Note to the Reader . . . . . . . . . . . . . . . . . . . iii
1. What Is the Budget? . . . . . . . . . . . . . . . . . . 1
2. Where the Money Comes From—and WhereIt Goes. . . . . . . . . . . . . . . . . . . . . . . . . . . 5
Revenues . . . . . . . . . . . . . . . . . . . . . . . . . . . . . . . . . . . . 7
Spending . . . . . . . . . . . . . . . . . . . . . . . . . . . . . . . . . . . . 10
“On” and “Off” Budget. . . . . . . . . . . . . . . . . . . . . . . . . 15
3. How Does the Government Create a Budget? 17
The President’s Budget . . . . . . . . . . . . . . . . . . . . . . . . . 17
The Budget Process . . . . . . . . . . . . . . . . . . . . . . . . . . . . 18
Action in Congress . . . . . . . . . . . . . . . . . . . . . . . . . . . . 19
Monitoring the Budget. . . . . . . . . . . . . . . . . . . . . . . . . . 20
4. Deficits and the Debt. . . . . . . . . . . . . . . . . . 23
Why the Deficit is a Problem . . . . . . . . . . . . . . . . . . . . 25
Deficits and Debt. . . . . . . . . . . . . . . . . . . . . . . . . . . . . . 26
Deficit Reduction Efforts . . . . . . . . . . . . . . . . . . . . . . . . 28
5. The President’s 1997 Budget. . . . . . . . . . . . 31
Reaching Balance . . . . . . . . . . . . . . . . . . . . . . . . . . . . . 31
Maintaining Our Values . . . . . . . . . . . . . . . . . . . . . . . . 32
Making Government Work . . . . . . . . . . . . . . . . . . . . . . . 33
Glossary. . . . . . . . . . . . . . . . . . . . . . . . . . . . . . 37
List of Charts and Tables . . . . . . . . . . . . . . . . . 41
i
A Note to the Reader
Next year, your Federal Government will spend over $1.6 trillion.
Needless to say, that’s a lot of money. And the Government spends it on lotsof things—on programs as large and popular as Social Security, and onactivities as small and unknown as repairs to the National Zoo. Together,these programs are what make up the Federal budget.
How much do you know about the budget? If your answer is “not much,”you’re not alone. In fact, hardly anybody knows everything that’s in thethousands of pages, and several books, that make up the budget each year.
But we know you care a lot about how the Government spends your money.That’s why we created A Citizen’s Guide to the Federal Budget last year,and why we have published this second edition. With it, we hope to makethe budget more accessible and understandable.
The Guide is designed to give you a walking tour of the budget. In thesepages, we will outline for you how the Government raises revenues andspends money, how the President and Congress enact the budget, why thebudget deficit and Federal debt are problems, and what the President hopesto accomplish with his 1997 budget.
After you read these pages, we hope that you will think the tour was worthyour time. And we hope you will give us your suggestions about how we canmake the Guide more useful to you in the future.
iii

1. What Is the Budget?
What is “the Federal budget”? It is:
• a plan for how the Government spends your money.
What activities are funded? How much does it spend for defense,national parks, the FBI, Medicare, issuing passports, and meat andfish inspection?
• a plan for how the Government pays for its activities.
How much revenue does it raise through different kinds oftaxes—income taxes, excise taxes, and social insurance payrolltaxes?
• a plan for Government borrowing.
If spending is greater than revenues, the Government runs a deficit.To finance deficits, the Government has to borrow money.Government borrowing adds to the national debt.
• something that affects the Nation’s economy.
Some types of spending—such as improvements in education andsupport for science and technology—increase productivity and raiseincomes in the future.
Taxes, on the other hand, reduce incomes, leaving people with lessmoney to spend.
• something that is affected by the Nation’s economy.
When the economy is doing well, people are earning more andunemployment is low. In this atmosphere, revenues increase andthe deficit shrinks.
• an historical record.
The budget reports on how the Government has spent money inthe past, and how that spending was financed.
The 1997 budget is a document that embodies the President’s budgetproposal to Congress for fiscal 1997, the fiscal year that begins on October1, 1996. It reflects the President’s priorities and his plan to balance thebudget by 2002.
1

The Federal budget, of course, is not the only budget that affects theeconomy or the American people. The budgets of State and localgovernments have an impact as well. While the Federal Government spendsabout 22 percent of the Gross Domestic Product (or GDP, which measuresthe size of the economy), State and local governments spend about another11 percent (see Chart 1–1).
State and local governments are independent of the Federal Government,and they have their own sources of revenue (taxes and borrowing). But theFederal Government supplements State and local revenues by making grantsto them. Of the $961 billion that State and local governments spent in1995, $213 billion came from Federal grants.
Compared to six other industrialized nations, the United States allocates thesmallest share of its GDP to government (Federal, State, and localcombined), except for Japan (see Chart 1–2).
Chart 1–1. Government Spending as a Share of GDP, 1995
Total GovernmentSpending in the U.S.
(32%)
Total Federal
Spending
(22%)
Federal Grants toState and LocalGovernments
(3%)
Total State
and
Local Spending
(14%)
Note: Numbers do not add due to rounding.
Private
68%
Spending from
State and Local
Revenues
(11%)
Spending forDirect Federal
Programs
(19%)Government
32%
Total Government spending accounts for about one-third of the
national economy. Federal spending is about two-thirds of this
amount, or 22 percent of GDP.
2

Chart 1–2. Total Government Outlays as a Percent of GDP
Source: OECD, calendar year data.
1981 1984 1987 1990 1993
20%
30%
40%
50%
60%
FRANCE
CANADA
JAPAN
UNITED STATES
ITALY
GERMANY
UNITED
KINGDOM
The United States allocates a smaller portion of its GDP to
government than any other nation shown, except Japan.
3

2. Where the Money Comes From—and
Where it Goes
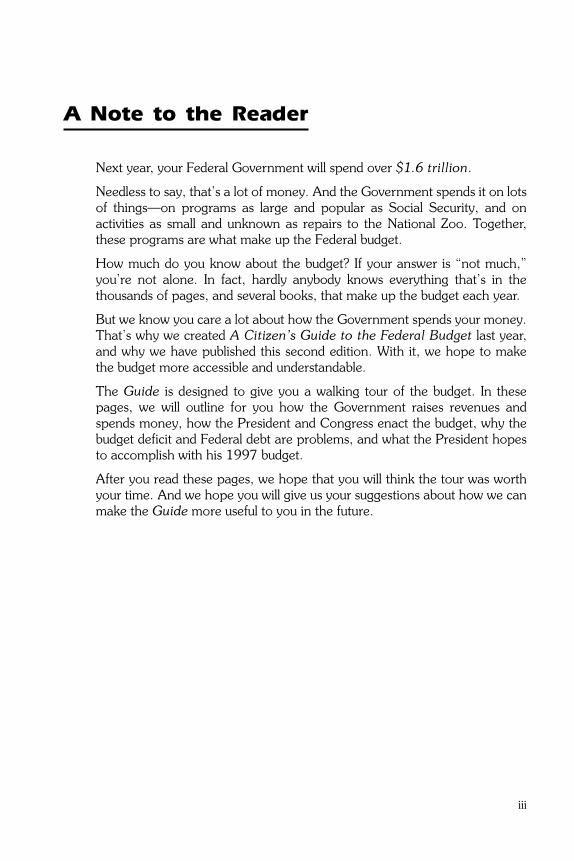
In a typical American household, a father and mother might sit around thekitchen table to review the family budget. They might discuss how much theyexpect to earn each year, how much they can spend on food, shelter,clothing, transportation, and perhaps a vacation, and how much they mightbe able to save for their future needs.
If they do not have enough money to make ends meet, they might discusshow they can spend less, such as by cutting back on restaurants, movies, orother entertainment. They also might consider whether to try to earn moreby working more hours or taking another job. If they expect their shortfall tobe temporary, they might try to borrow.
SOURCES: CASH AND CREDIT
TRANSPORTATION
HOUSEHOLDAPPLIANCES
HOUSING
FOOD EDUCATION
CLOTHING
RESTAURANTS/
ENTERTAINMENT
?
?
?
?
?
?
?
?
Chart 2–1. Family Budgeting
5
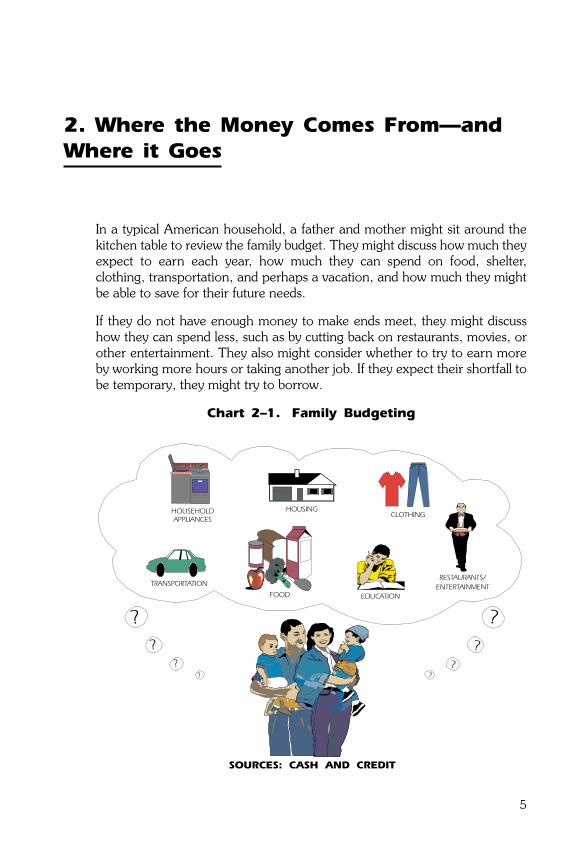
Generally speaking, the Federal Government plans its budget much likefamilies do. The President and Congress determine how much money theyexpect the Government to receive in each of the next several years, where itwill come from, and how much to spend to reach their goals—goals fornational defense, foreign affairs, social insurance for the elderly, healthinsurance for the elderly and poor, law enforcement, education, transporta-tion, science and technology, and others.
They decide how much spending they will finance through taxes and howmuch through borrowing. They debate how to use the budget to help theeconomy grow, or to redistribute income. And, especially lately, they debatehow to reduce spending in order to eliminate the deficit and balance thebudget.
In this chapter, we will discuss these decisions in some detail—that is, howthe Government raises revenues and where it spends money.
SOURCES: TAXES AND BORROWING
?
?
?
?
?
?
?
?
CRIME
PREVENTION
HEALTH CARE
EDUCATION
CHILD NUTRITIONRESEARCH
ENVIRONMENTAL CLEANUP
MILITARY
Chart 2–2. National Budgeting
6

Revenues
The money that the Federal Government uses to pay its bills—itsrevenues—comes mostly from taxes. In recent years, revenues have beenlower than spending, and the Government has borrowed to finance thedifference between revenues and spending—that is, the deficit.
Revenues come from these sources:
• Individual income taxes will raise an estimated $645 billion in 1997, equalto about 8 percent of GDP—about the same percent as in each of the last40 years.
• Social insurance payroll taxes—the fastest growing category of Federalrevenues—include Social Security taxes, Medicare taxes, unemploymentinsurance taxes, and Federal employee retirement payments. Thiscategory has grown from two percent of GDP in 1955 to seven percent in1997.
• Corporate income taxes, which will raise an estimated $185 billion in1997, have shrunk steadily as a percent of GDP, from 4.6 percent in1955 to 2.2 percent today.
CORPORATE
INCOME TAXES
11%
SOCIAL INSURANCE
PAYROLL TAXES
33%
BORROWING
9%
OTHER
4%
INDIVIDUALINCOME TAXES
39%
EXCISE
TAXES
4%
Chart 2–3. The Federal Government Dollar—
Where It Comes From
7

• Excise taxes apply to various products, including alcohol, tobacco,transportation fuels, and telephone services. The Government earmarkssome of these taxes to support certain activities—including highways,airports and airways, and the cleanup of hazardous substances—anddeposits others in the general fund.
• The Government also collects miscellaneous revenues—e.g., customsduties, Federal Reserve earnings, fines, penalties, and forfeitures.
Table 2–1. Revenues By Source—Summary
(In billions of dollars)
Source1995Actual
Estimate
1996 1997 1998 1999 2000 2001 2002
Individual income taxes . . . . . . . . . . . 590 631 645 683 714 749 790 835
Corporate income taxes . . . . . . . . . . 157 167 185 202 213 225 237 246
Payroll taxes . . . . . . . . . . . . . . . . . . . 484 508 536 561 589 619 647 679
Excise taxes . . . . . . . . . . . . . . . . . . . 57 54 60 60 62 63 64 66
Estate and gift taxes . . . . . . . . . . . . . 15 16 17 18 19 21 22 24
Customs duties . . . . . . . . . . . . . . . . . 19 19 20 21 21 22 22 24
Miscellaneous receipts . . . . . . . . . . . . 32 32 32 33 34 35 37 38
Total revenues . . . . . . . . . . . . . . 1,355 1,427 1,495 1,578 1,653 1,734 1,820 1,912
Notes: The revenues listed in this table do not include revenues from the Government’s business-likeactivities—e.g., the sale of electricity and fees to national parks. The Government counts these revenueson the spending side of the budget, deducting them from other spending to calculate its outlays for theyear.Numbers may not add to the totals due to rounding.
8

1955 1960 1965 1970 1975 1980 1985 1990 1995 2000
0
20
40
60
80
100
CORPORATION
INCOME TAXES
INDIVIDUAL
INCOME TAXES
OTHER
SOCIAL INSURANCETAXES
EXCISE TAXES
PERCENT
1955 1960 1965 1970 1975 1980 1985 1990 1995 2000
0
20
40
60
80
100
CORPORATION
INCOME TAXES
INDIVIDUAL
INCOME TAXES
OTHER
SOCIAL INSURANCETAXES
EXCISE TAXES
PERCENT
Between 1960 and 1995, payroll taxes have increased substantially as a
percent of GDP, and corporate income taxes have declined, but individual
income taxes have remained roughly constant. These trends are not expected
to change over the next five years.
Chart 2–4. Composition of Revenues Over the Last 40
Years
Source: OECD, calendar year data.
1981 1984 1987 1990 1993
20%
25%
30%
35%
40%
45%
50%
55%
ITALY
JAPAN
CANADA
UNITED KINGDOM
UNITED STATES
FRANCE
GERMANY
The United States and Japan have the lowest revenues as a percent of GDP
of the seven countries listed above.
Chart 2–5. Revenues as a Percent of GDP—Comparison
With Other Countries
9

Spending
As we have said, the Federal Government will spend over $1.6 trillion1 in1997, which we divided into eight large categories as shown in Chart 2–6.
• The largest Federal program is Social Security, which provides monthlybenefits to more than 43 million retired and disabled workers, theirdependents, and survivors. It accounts for 22 percent of all Federalspending.
• Medicare, which provides health care coverage for over 37 million elderlyAmericans and people with disabilities, consists of Part A (hospitalinsurance) and Part B (insurance for physician costs and other services).Since its birth in 1965, Medicare has accounted for an ever-growing shareof spending. In 1997, it will comprise 11 percent.
Note: Numbers do not add due to rounding.
MANDATORY
NET
INTEREST
15%
SOCIAL
SECURITY
22%
MEDICARE
11%
6%
MEDICAID
REMAININGENTITLEMENTS
6%
OTHER MEANS - TESTEDENTITLEMENTS /1
6%
NATIONAL
DEFENSE
16%
NON-DEFENSE
DISCRETIONARY
17%
DISCRETIONARY
1 Means-tested entitlements are those for which eligibility is abased on income. The Medicaidprogram is also a means-tested entitlement.
Chart 2–6. The Federal Government Dollar—
Where It Goes
10
1 In calculating Federal spending, the Government deducts collections (or revenues) generated by theGovernment’s business-like activities, such as fees to national parks. These collections will total anestimated $190 billion in 1997. Without them, spending would total an estimated $1.8 trillion in1997, not $1.6 trillion.

• Medicaid provides health care services to over 36 million Americans,including the poor, people with disabilities, and senior citizens in nursinghomes. Unlike Medicare, the Federal Government shares the costs ofMedicaid with the States, paying between 50 and 83 percent of the total(depending on each State’s requirements). Federal and State costs aregrowing rapidly. Medicaid accounts for six percent of the Federal budget.
• Other means-tested entitlements provide benefits to people and familieswith incomes below certain minimum levels that vary from program toprogram. The major means-tested entitlements are Food Stamps and foodaid to Puerto Rico, Aid to Families with Dependent Children,Supplemental Security Income, Child Nutrition, the Earned Income TaxCredit, and veterans’ pensions. This category will account for anestimated six percent of the budget in 1997.
• The remaining entitlements, which mainly consist of Federal retirementand insurance programs and payments to farmers, comprise six percentof the budget.
• National defense discretionary spending will total an estimated $259billion in 1997, comprising 16 percent of the budget and 3.3 percent ofGDP.
• Non-defense discretionary spending—a wide array of programs thatinclude education, training, science, technology, housing, transportation,and foreign aid—has shrunk as a share of the budget from 23 percent in1966 to an estimated 17 percent in 1997.
• Interest payments, primarily the result of previous budget deficits,averaged seven percent of Federal spending in the 1960s and 1970s.But, due to the large budget deficits that began in the 1980s, that sharequickly doubled to 15 percent, where it stands today.
11

Table 2–2. Spending Summary
(Outlays, in billions of dollars)
Category1995Actual
Estimate
1996 1997 1998 1999 2000 2001 2002
Discretionary:
National Defense . . . . . . . . . . . . . . 274 266 259 256 257 264 267 276
International . . . . . . . . . . . . . . . . . 20 20 20 19 19 18 18 19
Domestic . . . . . . . . . . . . . . . . . . . . 252 255 263 264 260 255 264 278
Subtotal, discretionary. . . . . . . . . 546 541 542 539 536 537 548 573
Mandatory:
Programmatic:
Social Security . . . . . . . . . . . . . . 333 348 365 383 402 421 442 464
Medicare . . . . . . . . . . . . . . . . . . 157 175 187 202 216 228 246 264
Medicaid . . . . . . . . . . . . . . . . . . 89 95 106 111 117 122 129 133
Means-tested entitlements (exceptMedicaid) . . . . . . . . . . . . . . . . . 92 97 104 109 114 121 121 129
Other. . . . . . . . . . . . . . . . . . . . . 114 118 134 138 142 147 147 151
Subtotal, programmatic . . . . . . 786 832 896 943 990 1,040 1,084 1,141
Undistributed offsetting receipts. . −44 −42 −41 −42 −43 −46 −48 −69
Subtotal, mandatory . . . . . . . . 741 790 855 901 947 955 1,036 1,072
Net interest . . . . . . . . . . . . . . . . 232 241 238 236 235 230 227 223
Subtotal, mandatory and netinterest. . . . . . . . . . . . . . . . . 973 1,031 1,093 1,137 1,181 1,225 1,263 1,295
Total . . . . . . . . . . . . . . . . . . . 1,519 1,572 1,635 1,676 1,717 1,761 1,812 1,868
Note: Numbers may not add to the totals due to rounding.
12

Table 2–3. Spending by Function
(Outlays, in billions of dollars)
Function1995Actual
Estimate
1996 1997 1998 1999 2000 2001 2002
National defense:
Department of Defense-Military . . . . . 259 254 247 244 246 254 257 265
Other . . . . . . . . . . . . . . . . . . . . . . . . 13 11 11 11 10 9 9 11
Total, National defense. . . . . . . . . . 272 266 259 255 256 263 266 275
International affairs . . . . . . . . . . . . . . 16 15 15 14 14 13 14 15
General science, space, and technology 17 17 17 17 16 15 15 17
Energy . . . . . . . . . . . . . . . . . . . . . . . 5 3 2 2 2 1 2 *
Natural resources and environment. . . 22 22 22 21 21 20 21 22
Agriculture. . . . . . . . . . . . . . . . . . . . . 10 8 8 9 9 8 7 7
Commerce and housing credit . . . . . . −14 −11 6 6 7 7 5 5
Transportation . . . . . . . . . . . . . . . . . . 39 40 39 39 37 35 34 35
Community and regional development 11 13 12 10 9 8 8 8
Education, training, employment, andsocial services . . . . . . . . . . . . . . . . . 54 54 54 54 56 57 59 62
Health. . . . . . . . . . . . . . . . . . . . . . . . 115 121 135 141 147 152 156 162
Medicare . . . . . . . . . . . . . . . . . . . . . . 160 178 190 205 218 231 248 267
Income security . . . . . . . . . . . . . . . . . 220 228 237 245 253 264 269 282
Social Security. . . . . . . . . . . . . . . . . . 336 351 368 386 405 424 445 467
Veterans benefits and services . . . . . . 38 38 40 39 37 37 36 40
Administration of justice. . . . . . . . . . . 16 19 22 24 25 26 26 25
General government . . . . . . . . . . . . . 14 14 15 14 14 14 15 15
Net interest . . . . . . . . . . . . . . . . . . . . 232 241 238 236 235 230 227 223
Allowances . . . . . . . . . . . . . . . . . . . . . . . . . −* −* −* −* −* 5 9
Undistributed offsetting receipts . . . . . −44 −42 −41 −42 −43 −46 −48 −69
Total. . . . . . . . . . . . . . . . . . . . . . 1,519 1,572 1,635 1,676 1,717 1,761 1,812 1,868
* $500 million or less.Notes: Spending that is shown as a minus means that receipts exceed outlays.
Numbers may not add to the totals due to rounding.
13

Table 2–4. Spending by Agency
(Outlays, in billions of dollars)
Function1995Actual
Estimate
1996 1997 1998 1999 2000 2001 2002
Legislative Branch . . . . . . . . . . . . . . . 3 3 3 3 3 3 3 3
The Judiciary . . . . . . . . . . . . . . . . . . 3 3 4 4 4 4 4 4
Executive Office of the President . . . . * * * * * * * *
Funds Appropriated to the President . 11 10 10 10 10 10 9 10
Agriculture . . . . . . . . . . . . . . . . . . . . 57 55 56 58 59 59 61 63
Commerce . . . . . . . . . . . . . . . . . . . . 3 4 4 4 5 6 4 4
Defense—Military . . . . . . . . . . . . . . . 260 254 247 244 246 254 257 265
Defense—Civil. . . . . . . . . . . . . . . . . . 32 32 33 34 35 36 37 38
Education . . . . . . . . . . . . . . . . . . . . . 31 30 30 29 30 31 32 33
Energy . . . . . . . . . . . . . . . . . . . . . . . 18 15 15 14 13 12 12 12
Health and Human Services . . . . . . . 303 327 354 378 397 416 439 465
Housing and Urban Development . . . 29 26 32 33 33 31 30 30
Interior . . . . . . . . . . . . . . . . . . . . . . . 7 7 7 7 7 7 7 7
Justice . . . . . . . . . . . . . . . . . . . . . . . 11 13 16 18 19 20 20 19
Labor . . . . . . . . . . . . . . . . . . . . . . . . 32 34 35 36 37 38 40 41
State. . . . . . . . . . . . . . . . . . . . . . . . . 5 6 6 5 5 5 5 5
Transportation. . . . . . . . . . . . . . . . . . 39 39 38 38 36 34 33 35
Treasury . . . . . . . . . . . . . . . . . . . . . . 349 365 369 370 374 376 377 381
Veterans Affairs. . . . . . . . . . . . . . . . . 38 38 40 39 37 37 36 40
Environmental Protection Agency. . . . 6 6 6 7 7 7 7 7
General Services Administration . . . . . 1 * 1 1 * * * *
National Aeronautics and SpaceAdministration . . . . . . . . . . . . . . . . 13 14 14 14 13 12 12 13
Office of Personnel Management . . . . 41 42 45 47 49 51 54 57
Small Business Administration . . . . . . 1 1 * * * * * 1
Social Security Administration . . . . . . 362 377 398 418 438 462 480 506
Other Independent Agencies . . . . . . . 2 9 21 20 20 19 19 20
Allowances . . . . . . . . . . . . . . . . . . . . . . . . . −1 −5 −7 −6 −7 −2 *
Undistributed offsetting receipts . . . . . −138 −140 −143 −148 −153 −161 -166 -192
Total. . . . . . . . . . . . . . . . . . . . . 1,519 1,572 1,635 1,676 1,717 1,761 1,812 1,868
* $500 million or less.Notes: Spending that is shown as a minus means that receipts exceed outlays.
Numbers may not add to the totals due to rounding.
14

“On” and “Off” Budget
From time to time, you may hear about programs that are “off-budget,”meaning that the Government categorizes them separately from otherprograms.
Specifically, the law requires that the spending and revenues of two Federalprograms, Social Security and the Postal Service, be excluded from thebudget totals—that is, categorized as “off-budget.” Therefore, the budgetdisplays “on-budget,” “off-budget,” and “unified budget” totals to satisfy thislegal requirement.
The unified budget is the most useful display of the Government’s finances;it is vital in calculating how much the Government has to borrow.
The “off-budget” category is designed to give special status to certainprograms. Over the years, the Government has placed numerous programs“off-budget,” then returned them to the unified budget. But the mere listingof programs as “off-budget” does not, by itself, protect them from thebudget process—e.g., Administration and congressional review, possiblecuts, and hiring and procurement rules.
Chart 2–7 illustrates the relationship between on- and off-budget items, andthe unified budget.
1995 1996 1997 1998 1999 2000 2001 2002
-50
0
50
100
150
200
250
SURPLU
SD
EFIC
IT
BILLIONS OF DOLLARS
BUDGET DEFICIT EXCLUDING
"OFF-BUDGET" ITEMS:
SOCIAL SECURITY AND POSTAL SERVICE1
_
+
_
_
_
_
UNIFIED BUDGET DEFICIT
1 By law, the Social Security trust funds and the Postal Service are “off-budget.’’
Chart 2–7. On- and Off-Budget Deficit Projections
15


3. How Does the Government Create a
Budget?
The President and Congress both play major roles in developing the Federalbudget.
The President’s Budget
The law requires that, by the first Monday in February, the President submitto Congress his proposed Federal budget for the next fiscal year, whichbegins October 1.
The White House’s Office of Management and Budget (OMB) prepares thebudget proposal, after receiving direction from the President and consultingwith his senior advisors and officials from Cabinet departments and otheragencies.
The President’s budget—which typically includes a main book and severalaccompanying books—covers thousands of pages and provides reams ofdetails.
This year, President Clinton faced unusual challenges in presenting hisbudget. At a time when OMB normally would have prepared that budget,the President and congressional leaders of both parties were negotiating aplan to balance the budget over seven years, and Congress had not finishedthe necessary spending bills for 1996.
As a result, the President submitted a brief budget document on February 5to comply with the legal requirement, and the rest of the budget books,1 withthe traditional amount of back-up details, in March.
17
1 They are the main budget book, entitled, Budget of the United States Government—Supplement:
Fiscal Year 1997, as well as Analytical Perspectives, Appendix, Historical Tables, and A Citizen’s
Guide to the Federal Budget, which you are now reading.

The Budget Process
Through the budget process, the President and Congress decide how muchto spend and tax in any one fiscal year. More specifically, they decide howmuch to spend on each activity, ensure that the Government spends nomore and spends it only for that activity, and report on that spending at theend of each budget cycle.
The President’s budget is his plan for the next year. But it’s just a proposal.After receiving it, Congress has its own budget process to follow. Only afterthe Congress passes, and the President signs, the required spending bills hasthe Government created its actual budget.
For fiscal 1997—that is, October 1, 1996 to September 30, 1997—themajor steps in the budget process are outlined in Chart 3–1.
Chart 3–1. Major Steps in the Budget Process
Formulation of the President’sbudget for fiscal 1997.
Executive Branch agencies developrequests for funds and submit themto the Office of Management andBudget. The President reviews therequests and makes the fiscaldecisions on what goes in hisbudget.
February–December1995
Budget preparation and trans-mittal.
The budget documents are preparedand transmitted to the Congress.
December 1995–February/March1996 1
Congressional action on thebudget.
The Congress reviews thePresident’s proposed budget,develops its own budget, andapproves spending and revenue bills.
March–September1996
The fiscal year begins. October 1, 1996
Agency program managers execute the budget provided in law. October 1, 1996–September 30,1997
Data on actual spending and receipts for the completed fiscal yearbecome available.
October–November1997
1 Due to unusual circumstances, the President submitted the 1997 budget in two steps—one in February, the other inMarch.
18

Action in Congress
Congress first must pass a “budget resolution”—a framework within whichthe Members will make their decisions about spending and taxes. It includestargets for total spending, total revenues, and the deficit, and allocationswithin the spending target for the two types of spending—discretionary andmandatory—explained below:
• Discretionary spending, which accounts for 33 percent of all Federalspending, is what the President and Congress must decide to spend forthe next year through the 13 annual appropriations bills. It includesmoney for such activities as the FBI and the Coast Guard, for housing andeducation, for space exploration and highway construction, and fordefense and foreign aid.
• Mandatory spending, which accounts for 67 percent of all spending, isauthorized by permanent laws, not by the 13 annual appropriations bills.It includes entitlements—such as Social Security, Medicare, veterans’benefits, and Food Stamps—through which individuals receive benefitsbecause they are eligible based on their age, income, or other criteria. Italso includes interest on the national debt, which the Government pays toindividuals and institutions that hold Treasury bonds and other Govern-ment securities. The President and Congress can change the law in orderto change the spending on entitlements and other mandatory pro-grams—but they don’t have to.
Think of it this way: For discretionary programs, Congress and the Presidentmust act each year to provide spending authority. For mandatory programs,they may act in order to change the spending that current laws require.
Currently, the law imposes a limit, or “cap,” through 1998 on total annualdiscretionary spending. Within the cap, however, the President andCongress can, and often do, change the spending levels from year to yearfor the thousands of individual Federal spending programs.
In addition, the law requires that legislation that would raise mandatoryspending or lower revenues—compared to existing law—be offset byspending cuts or revenue increases. This requirement, called “pay-as-you-go,” is designed to prevent new legislation from increasing the deficit.
Once Congress passes the budget resolution, it turns its attention to passingthe 13 annual appropriations bills and, if it chooses, “authorizing” bills tochange the laws governing mandatory spending and revenues.
19

Congress begins by examining the President’s budget in detail. Scores ofcommittees and subcommittees hold hearings on proposals under theirjurisdiction. The House and Senate Armed Services Authorizing Commit-tees, and the Defense and Military Construction Subcommittees of theAppropriations Committees, for instance, hold hearings on the President’sdefense plan. If the President’s budget proposed changes in taxes, theHouse Ways and Means and the Senate Finance Committees would holdhearings. The Budget Director, Cabinet officers, and other Administrationofficials work with Congress as it accepts some of the President’s proposals,rejects others, and changes still others. Congressional rules require that thesecommittees and subcommittees take actions that reflect the budgetresolution.
If you read through the President’s budget, the budget resolution, or theappropriations or authorizing bills that Congress drafts, you will notice thatthe Government measures spending in two ways —“budget authority” and“outlays”:
Budget authority (or BA) is what the law authorizes the FederalGovernment to spend for certain programs, projects, or activities. What theGovernment actually spends in a particular year, however, is an outlay. Tosee the difference, consider what happens when the Government decides tobuild a space exploration system.
The President and Congress may agree to spend $1 billion for the spacesystem. Congress appropriates $1 billion in BA. But the system may take 10years to build. Thus, the Government may spend $100 million in outlays inthe first year to begin construction and the remaining $900 million over thenext nine years as construction continues.
Monitoring the Budget
Once the President and Congress approve spending, the Governmentmonitors the budget through:
• agency program managers and budget officials, including the InspectorsGeneral, or IGs, who report only to the agency head;
• OMB;
• congressional committees; and
• the General Accounting Office, an auditing arm of Congress.
20

This oversight is designed to:
• ensure that agencies comply with legal limits on spending, and that theyuse budget authority only for the purposes intended;
• see that programs are operating consistently with legal requirements andexisting policy; and, finally,
• ensure that programs are well managed and achieving the intendedresults.
The Government has paid more attention to good management of late,through the work of Vice President Gore’s National Performance Reviewand implementation of the 1993 Government Performance and ResultsAct. This law is designed to improve Government programs by using bettermeasurements of their results in order to evaluate their effectiveness.
21

4. Deficits and the Debt
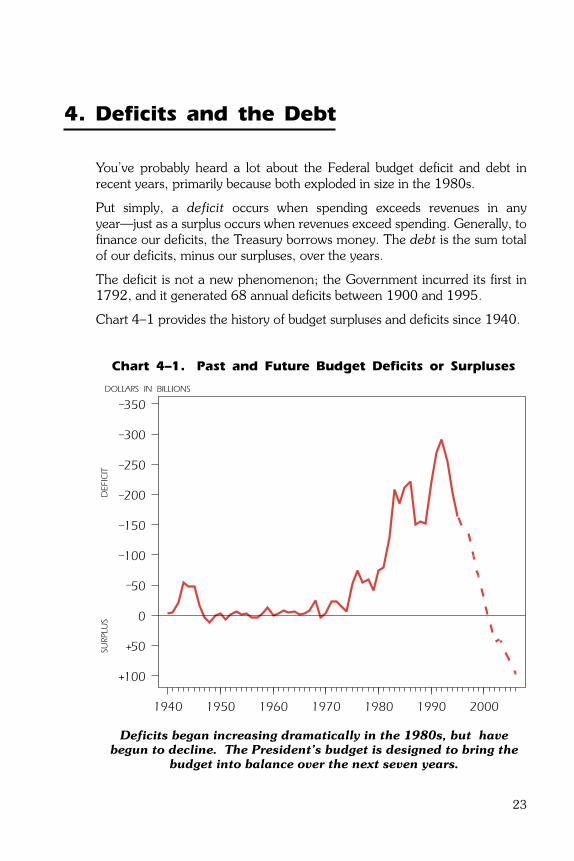
You’ve probably heard a lot about the Federal budget deficit and debt inrecent years, primarily because both exploded in size in the 1980s.
Put simply, a deficit occurs when spending exceeds revenues in anyyear—just as a surplus occurs when revenues exceed spending. Generally, tofinance our deficits, the Treasury borrows money. The debt is the sum totalof our deficits, minus our surpluses, over the years.
The deficit is not a new phenomenon; the Government incurred its first in1792, and it generated 68 annual deficits between 1900 and 1995.
Chart 4–1 provides the history of budget surpluses and deficits since 1940.
DOLLARS IN BILLIONS
PROJECTEDACTUAL
_
_
_
+
_
_
_
+
_
1940 1950 1960 1970 1980 1990 2000
-100
-50
0
50
100
150
200
250
300
350
SURPLU
SD
EFIC
IT
Deficits began increasing dramatically in the 1980s, but have
begun to decline. The President’s budget is designed to bring the
budget into balance over the next seven years.
Chart 4–1. Past and Future Budget Deficits or Surpluses
23
For most of the Nation’s history, deficits were the result of either wars orrecessions. Wars necessitated major increases in military spending, whilerecessions reduced Federal tax revenues from businesses and individuals.
The Government generated deficits during the War of 1812, the recessionof 1837, the Civil War, the depression of the 1890s, and World War I. Oncethe war ended or the economy began to grow, the Government followed itsdeficits with budget surpluses, with which it paid down the debt.
Deficits returned in 1931 and remained for the rest of the decade—due tothe Great Depression and the spending associated with PresidentRoosevelt’s New Deal. Then, World War II forced the Nation to spendunprecedented amounts on defense and to incur unprecedented deficits.Since then—with Democratic and Republican Presidents, Democratic andRepublican Congresses—the Government has balanced its books only eighttimes, most recently in 1969.
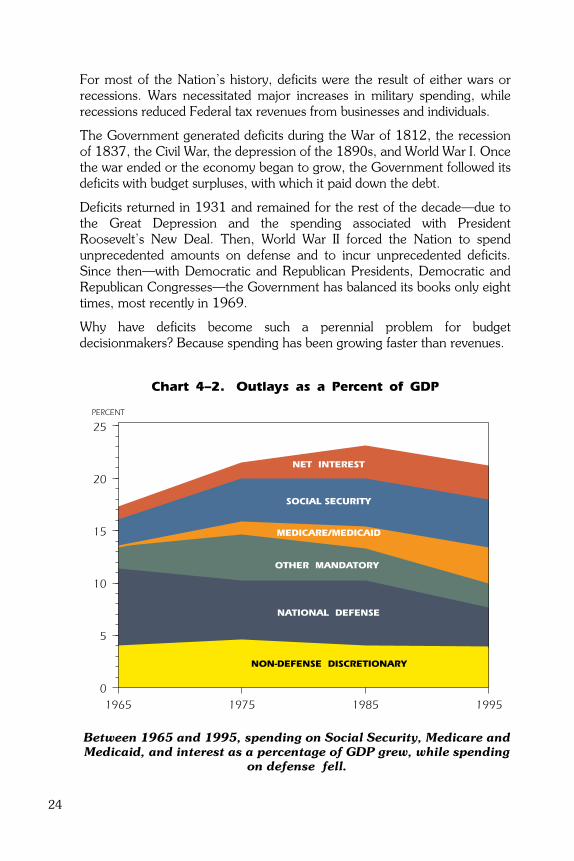
Why have deficits become such a perennial problem for budgetdecisionmakers? Because spending has been growing faster than revenues.
1965 1975 1985 1995
0
5
10
15
20
25
PERCENT
NET INTEREST
MEDICARE/MEDICAID
NATIONAL DEFENSE
NON-DEFENSE DISCRETIONARY
SOCIAL SECURITY
OTHER MANDATORY
Between 1965 and 1995, spending on Social Security, Medicare and
Medicaid, and interest as a percentage of GDP grew, while spending
on defense fell.
Chart 4–2. Outlays as a Percent of GDP
24

Revenues have stayed relatively constant, at around 19 percent of GDP,since the 1960s. In that time, however, outlays have grown from below 18percent of GDP in 1965 to up to 24 percent in 1983 before falling to 21percent today. Much of the spending growth has come in Social Security,Medicare, Medicaid, and interest payments (see Chart 4–2).
Nevertheless, the deficits before 1981 paled in comparison to whatfollowed. That year, the Government cut income tax rates and greatlyincreased defense spending, but it did not cut non-defense programs enoughto make up the difference. Also, the recession of the early 1980s reducedFederal revenues, increased Federal outlays for unemployment insuranceand similar programs that are closely tied to economic conditions, andforced the Government to pay interest on more national debt at a time wheninterest rates were high. As a result, the deficit soared.
Why the Deficit is a Problem
The United States is not alone in struggling with budget deficits. As Chart4–3 illustrates, this Nation has an average record when compared to therecent history of six other major developed economies. (To make accuratecomparisons with the governments of other nations, the U.S. data includethe activities of State and local governments).
If budget deficits occur so frequently, here and abroad, should we worryabout them?
The short answer is, yes. The deficit forces the Government to borrowmoney in the private capital markets. That borrowing competes with (1)borrowing by businesses that want to build factories and machines that makeworkers more productive and raise incomes, and (2) borrowing by familieswho hope to buy new homes, cars, and other goods. The competition forfunds tends to produce higher interest rates.
Deficits increase the Federal debt and, with it, the Government’s obligationto pay interest. The more it must pay in interest, the less it has available tospend on education, law enforcement, and other important services, or themore it must collect in taxes—forever after. Today, the Government spends15 percent of its budget to pay interest.
As shown in Chart 4–4, the Federal interest burden grew substantially in the1980s. By 1997, net interest spending will be nearly as much as theGovernment will spend on national defense.
In the end, the deficit is a decision about our future. We can provide a solidfoundation for future generations, just as parents try to do within a family by
25

limiting the amount of debt that they pass on; or we can generate largedeficits and debt for those who come after us.
Deficits and Debt
If the Government incurs a deficit, it must borrow from the public.
Table 4–1 summarizes the relationship between the budget deficit andFederal borrowing.
Federal borrowing involves the sale, to the public, of notes and bonds ofvarying sizes and time periods. The cumulative amount of borrowing fromthe public—i.e., the debt held by the public—is the most important measureof Federal debt because it is what the Government has borrowed in theprivate markets over the years, and it determines how much theGovernment pays in interest to the public.
Source: OECD, calendar year data.
1981 1984 1987 1990 1993
-5%
0%
5%
10%
15%
SURPLU
SD
EFIC
IT
FRANCE
CANADA
ITALY
JAPAN
UNITED KINGDOM
GERMANY
UNITED STATES
-
+
-
-
Relative to the above economies, the total Government budget
deficit in the United States is average.
Chart 4–3. Total Government Surplus or Deficit as a
Percent of GDP
26
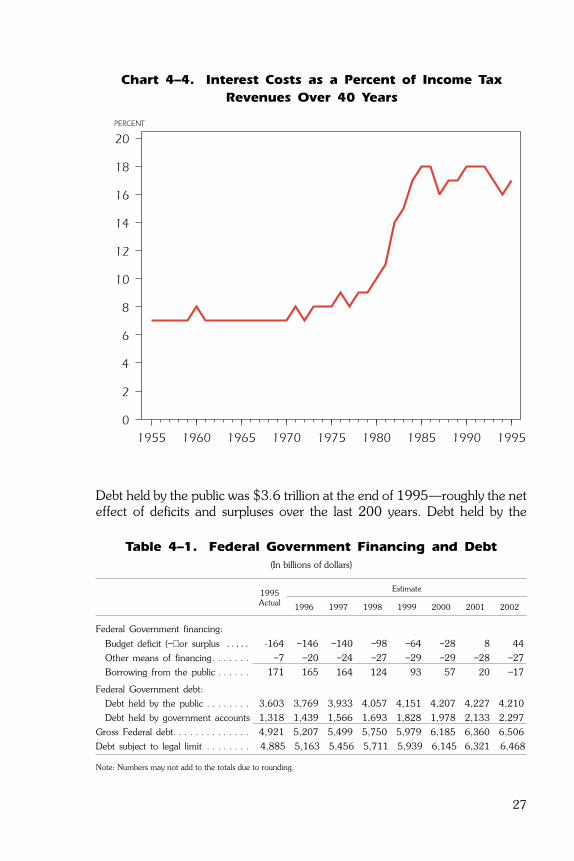
Debt held by the public was $3.6 trillion at the end of 1995—roughly the neteffect of deficits and surpluses over the last 200 years. Debt held by the
1955 1960 1965 1970 1975 1980 1985 1990 1995
0
2
4
6
8
10
12
14
16
18
20
PERCENT
Chart 4–4. Interest Costs as a Percent of Income Tax
Revenues Over 40 Years
Table 4–1. Federal Government Financing and Debt
(In billions of dollars)
1995Actual
Estimate
1996 1997 1998 1999 2000 2001 2002
Federal Government financing:
Budget deficit (−) or surplus . . . . . -164 −146 −140 −98 −64 −28 8 44
Other means of financing. . . . . . . −7 −20 −24 −27 −29 −29 −28 −27
Borrowing from the public . . . . . . 171 165 164 124 93 57 20 −17
Federal Government debt:
Debt held by the public . . . . . . . . 3,603 3,769 3,933 4,057 4,151 4,207 4,227 4,210
Debt held by government accounts 1,318 1,439 1,566 1,693 1,828 1,978 2,133 2,297
Gross Federal debt. . . . . . . . . . . . . . 4,921 5,207 5,499 5,750 5,979 6,185 6,360 6,506
Debt subject to legal limit . . . . . . . . 4,885 5,163 5,456 5,711 5,939 6,145 6,321 6,468
Note: Numbers may not add to the totals due to rounding.
27
public does not include debt the Government owes itself—the total of all trustfund surpluses and deficits over the years, like the Social Security surpluses,that the law says must be invested in Federal securities.
The sum of debt held by the public and debt the Government owes itself iscalled Gross Federal Debt. At the end of 1995, it totaled $4.9 trillion.
Another measure of Federal debt is debt subject to legal limit, which is similarto Gross Federal Debt. When the Government reaches the limit, it loses itsauthority to borrow more to finance its spending; then, the President andCongress must enact a law to increase the limit.
The Government’s ability to finance its debt is tied to the size and strength ofthe economy, or GDP. Debt held by the public exceeded 50 percent of GDPat the end of 1996. As a share of GDP, debt held by the public was highestat the end of World War II, at 114 percent, then fell to 24 percent in 1974before gradually rising to current levels.
That decline, from 114 to 24 percent, occurred because the economy grewfaster than the debt accumulated; debt held by the public rose from $242billion to $344 billion in those years, but the economy grew faster.
Individuals and institutions in the United States hold over 75 percent of debtheld by the public. The rest is held in foreign countries.
Deficit Reduction Efforts
Ever since the deficit soared in the early 1980s, successive Presidents andCongresses have tried to cut it. Until recently, they met with only limitedsuccess.
In the early 1980s, President Reagan and Congress agreed on a large taxcut, but could not agree about cutting spending; the President wanted to cutdomestic spending more than Congress, while Congress soughtfewerdefense funds than the President wanted. They wound up spending more ondomestic programs than the President wanted, and more on defense thanCongress wanted. At the same time, a recession led to more spending to aidthose affected by the recession, and reductions in tax revenues due to lowerincomes and corporate profits.
By 1985, both sides were ready for drastic measures. That year, theyenacted the Balanced Budget and Emergency Deficit Control Act, betterknown as Gramm-Rudman-Hollings (GRH). It set annual deficit targets forfive years, declining to a balanced budget in 1991. If necessary, GRHrequired across-the-board cuts in programs to comply with the deficit targets.
28

Faced with the prospect of huge spending cuts in 1987, however, thePresident and Congress amended the law, postponing a balanced budgetuntil 1993. The President and Congress never achieved those revisedtargets, in part because of the extraordinary costs of returning the Nation’ssavings and loan industry to a sound financial footing.
By 1990, President Bush and Congress enacted spending cuts and taxincreases that were designed to cut the accumulated deficits by about $500billion over five years. They also enacted the Budget Enforcement Act(BEA)—rather than set annual deficit targets, the BEA was designed to limitdiscretionary spending while ensuring that any new entitlement programs ortax cuts did not make the deficit worse.
First, the BEA set annual limits on total discretionary spending for defense,international affairs, and domestic programs. Second, it created “pay-as-you-go” rules for entitlements and taxes: those who proposed new spendingon entitlements or lower taxes were forced to offset the costs by cuttingother entitlements or raising other taxes.
For what it was designed to do, the law worked. It did, in fact, limitdiscretionary spending and force proponents of new entitlements and taxcuts to find ways to finance them. But the deficit, which Government andprivate experts said would fall, actually rose.
Why? Because the recession of the early 1990s reduced individual andcorporate tax revenues and increased spending that is tied to economicfluctuations. Federal health care spending also continued to grow rapidly.
In 1993, President Clinton and the Congress made another effort to cut thedeficit. They enacted a five-year deficit reduction package of spending cutsand higher revenues. The law was designed to cut the accumulated deficitsfrom 1994 to 1998 by about $500 billion. The new law extended the limitson discretionary spending and the “pay-as-you-go” rules.
Clearly, the President’s deficit reduction efforts have paid off. The deficit fellfrom $290 billion in 1992 to $164 billion in 1995, and by over half as ashare of GDP, to 2.3 percent. Now, as you will see in the next chapter, thePresident wants to finish the job by balancing the budget over the next sevenyears.
29


5. The President’s 1997 Budget
As we have said, the President released his 1997 budget in two steps thisyear. On February 5, he released a brief document that outlined hispriorities. Then in March, he released the budget books with the details thattraditionally comprise the annual budget proposal.
The President’s 1997 budget would reach balance over the next seven yearsby cutting unnecessary and lower priority spending.
The budget would strengthen Medicare and Medicaid; invest in educationand training, the environment, science and technology, and other priorities;reform welfare; maintain a strong defense; and provide tax relief to helpfamilies raise their children, send them to college, and save for the future.
Like his earlier budgets, this budget contributes to two of the President’s keygoals—strengthening the economy and making Government work.
Reaching Balance
The President’s budget saves $593 billion 1 over seven years (aftersubtracting the costs of his proposed tax cut). Among its major elements, thebudget:
• saves $297 billion in discretionary spending, cutting unnecessary andlower priority spending but investing in education and training, theenvironment, science and technology, law enforcement, and otherpriorities that will raise living standards and improve the quality ofAmerican life;
• saves $124 billion in Medicare, strengthening and improving the programand guaranteeing the solvency of its trust fund for over a decade;
• saves $59 billion in Medicaid, reforming the program but continuing theguarantee of meaningful health and long-term care coverage for the mostvulnerable Americans;
31
1 Using the last available assumptions of the Congressional Budget Office.

• saves $40 billion through real welfare reform, moving recipients to workwhile protecting children;
• saves $49 billion by reforming a host of other mandatory programs;
• saves $62 billion by ending corporate subsidies and other tax loopholes;and
• cuts taxes by $100 billion, providing tax relief to tens of millions ofmiddle-income Americans and to small businesses.
Maintaining Our Values
From the start, the President’s economic program has emphasized oneprimary concern—to raise the standard of living for average Americans nowand in the future. His budget policy has played a central role.
The President’s budget plan of 1993, which he enacted with the lastCongress, has cut the budget deficit nearly in half in three years—from $290billion in 1992 to $164 billion in 1995. That, in turn, has cut Federalborrowing, making more funds available in the private markets so businessescan invest, grow more productive, expand, and create jobs.
Working with Congress, the President also has shifted Federal resources toeducation and training, science and technology, and other priorities, notonly to make businesses more competitive but to give Americans the skillsthey need to compete in the new economy.
This budget maintains or expands his investments in these key areas.
In education and training, these investments include the Head Start programfor disadvantaged children; the Safe and Drug-Free Schools and Communi-ties program to create safe learning environments; Goals 2000, which helpsStates and school systems extend high academic standards, better teaching,and better learning to all students; AmeriCorps, through which 25,000Americans this year are serving their communities and earning money forcollege; Pell grant scholarships for needy students; and Skill Grants (or jobtraining vouchers) for dislocated workers and low-income adults.
The budget also protects environmental enforcement through the Environ-mental Protection Agency’s operating program; funds programs to protectnational parks and other sensitive resources; and invests in basic and appliedresearch and technology.
The budget funds the Community Oriented Policing Services (COPS)initiative to put 100,000 more police on the street by the year 2000; more
32

border patrols to prevent illegal immigration and more inspections toprevent the hiring of illegal immigrants; and the Community DevelopmentFinancial Institutions fund to spur growth and create jobs in communitiesthat have been left behind.
In addition, the budget includes funds to launch the important initiatives thatthe President outlined in his State of the Union address:
• for education, it funds a Technology Literacy Challenge to connect everyclassroom to the information superhighway by the year 2000; expandedwork-study to help one million students work their way through college by2000; a $1,000 merit scholarship for the top five percent of graduates inevery high school; and Charter Schools to let parents, teachers, andcommunities create public schools to meet their own children’s needs;
• for workers, it funds initiatives to make it easier for small businesses andfarmers to establish their own pension plans; to encourage these andother employees to establish flexible pension plans that workers can takewith them when they change jobs; and to help workers who lose theirhealth insurance when they lose their jobs pay for private insurancecoverage for up to six months;
• for the environment, it funds tax incentives to encourage companies toclean up “brownfields”—abandoned, contaminated industrial properties indistressed areas; and
• for law enforcement, it provides funds with which the FBI and other lawenforcement agencies will launch a war on juvenile crime and gangs thatinvolve juveniles.
Making Government Work
“The era of big Government is over,” President Clinton declared in his Stateof the Union address in late January 1996. “But we cannot go back to thetime when our citizens were left to fend for themselves.”
The President has worked hard to create a leaner, but not meaner, FederalGovernment, one that works hand-in-hand with States, localities, busi-nesses, and community and civic associations to manage resources wiselywhile helping those Americans who cannot help themselves.
In 1993, the President pledged to cut the Federal workforce by 252,000full-time equivalent (FTE) positions. A year later, the President and Congressenacted the Federal Workforce Restructuring Act, requiring cuts of 272,900
33

FTEs by the end of this decade. (An FTE is not necessarily synonymous withan employee. One full-time employee counts as one FTE, and two half-timeemployees also count as one FTE.)
To date, the Administration has cut the workforce by over 200,000employees out of 2.2 million in January 1993, giving us the smallest Federalworkforce in 30 years. This corresponds to a reduction of 185,000 FTEs(see Chart 5–1).
While Americans want a smaller Government, they also deserve one thatworks better—that treats them as valued customers at Social Security,veterans’, and other offices; that uses their tax dollars wisely; and that makesa real impact on their lives when it addresses the problems of crime andpoverty and the challenges of work and education.
1993 1994 1995 1996 19970
50
100
150
200
250
16
103
185
214
245ALREADY CUT PROJECTED
Note: In 1993, the President pledged to cut the Federal work force by 252,000 full-time equivalent (FTE) positions. Simplyput, one full-time employee counts as one FTE, and two employees who work half-time also count as one FTE.
FTE CUTS IN THOUSANDS
In the future, the number of Federal workers will decline even
further.
Chart 5–1. Cuts in Civilian Employment
34

From the start, the President has stressed the importance of providing betterservice to Government’s customers—the tens of millions of Americans whocome in contact with it. His efforts are bearing fruit:
Social Security Administration’s (SSA) Customer Service Hotline:Business Week reported in mid-1995 that an independent survey ofsome of the Nation’s best 1-800 customer services hotlines rankedSSA’s hotline on top, ahead of companies like L.L. Bean, FederalExpress, and Disney. SSA’s reputation for solving problems quicklyand courteously earned it the highest overall score.
Customs Service—Streamlining Inspections: In Miami, the airlinesand Federal agencies formed partnerships to overhaul Customsprocedures for international travelers, eliminating three-hour delays andmissed connecting flights. Officials from the Customs Service, theImmigration and Naturalization Service, and the Agriculture Depart-ment worked with airline officials to reduce waiting times to 45minutes, on average.
Veterans Affairs (VA) Department Responding to Customers:Responding to complaints about long waits to see benefits counselors,the VA promised veterans that it would cut waiting times to 30minutes or less. Having met that promise, the VA has aimed higher; itnow promises veterans no more than a 20-minute wait and is meetingthat goal 90 percent of the time.
Americans want a Government that uses common sense when it makesdecisions that affect their lives. The Administration is answering their call.
35


Glossary
Appropriation
An appropriation is an act of Congress that enables Federal agencies tospend money for specific purposes.
Authorization
An authorization is an act of Congress that establishes or continues aFederal program or agency, and sets forth the guidelines to which itmust adhere.
Balanced Budget
A balanced budget occurs when total revenues equal total outlays for afiscal year.
Budget Authority (BA)
Budget authority is what the law authorizes, or allows, the FederalGovernment to spend for programs, projects, or activities.
Budget Enforcement Act (BEA) of 1990
The BEA is the law that was designed to limit discretionary spendingwhile ensuring that any new entitlement program or tax cuts did notmake the deficit worse. It set annual limits on total discretionaryspending and created “pay-as-you-go” rules for any changes inentitlements and taxes. (See “pay-as-you-go.”)
Balanced Budget and Emergency Deficit Control Act of 1985(Gramm-Rudman-Hollings, or GRH)
The Balanced Budget and Emergency Deficit Control Act of 1985 wasdesigned to end deficit spending. It set annual deficit targets for fiveyears, declining to a balanced budget in 1991. If necessary, it requiredacross-the-board cuts in programs to comply with the deficit targets. Itwas never fully implemented.
Budget Resolution
The budget resolution is the annual framework within which Congressmakes its decisions about spending and taxes. This framework includestargets for total spending, total revenues, and the deficit, as well asallocations, within the spending target, for discretionary and mandatoryspending.
37

“Cap”
A “cap” is a legal limit on total annual discretionary spending.
Deficit
The deficit is the difference produced when spending exceeds revenuesin a fiscal year.
Discretionary Spending
Discretionary spending is what the President and Congress must decideto spend for the next fiscal year through 13 annual appropriations bills.Examples include money for such activities as the FBI and the CoastGuard, housing and education, space exploration and highwayconstruction, and defense and foreign aid.
Entitlement
An entitlement is a program that legally obligates the FederalGovernment to make payments to any person who meets the legalcriteria for eligibility. Examples include Social Security, Medicare, andMedicaid.
Excise Taxes
Excise taxes apply to various products, including alcohol, tobacco,transportation fuels, and telephone service.
Federal Debt
The gross Federal debt is divided into two categories: debt held by thepublic, and debt the Government owes itself. Another category is debtsubject to legal limit.
Debt Held by the Public
Debt held by the public is the total of all Federal deficits, minussurpluses, over the years. This is the cumulative amount of money theFederal Government has borrowed from the public, through the saleof notes and bonds of varying sizes and time periods.
Debt the Government Owes Itself
Debt the Government owes itself is the total of all trust fund surplusesover the years, like the Social Security surpluses, that the law saysmust be invested in Federal securities.
Debt Subject to Legal Limit
Debt subject to legal limit, which is roughly the same as gross Federaldebt, is the maximum amount of Federal securities that may be legally
38

outstanding at any time. When the limit is reached, the President andCongress must enact a law to increase it.
Fiscal Year
The fiscal year is the Government’s accounting period. It beginsOctober 1 and ends on September 30. For example, fiscal 1997 endsSeptember 30, 1997.
Gramm-Rudman-Hollings
See Balanced Budget and Emergency Deficit Control Act of 1985.
Gross Domestic Product (GDP)
GDP is the standard measurement of the size of the economy. It is thetotal production of goods and services within the United States.
Mandatory Spending
Mandatory spending is authorized by permanent law. An example isSocial Security. The President and Congress can change the law tochange the level of spending on mandatory programs — but they don’thave to.
“Off-Budget”
By law, the Government must distinguish “off-budget” programsseparate from the budget totals. Social Security and the Postal Serviceare “off-budget.”
Outlays
Outlays are the amount of money the Government actually spends in agiven fiscal year.
“Pay-As-You-Go”
Set forth by the BEA, “pay-as-you-go” refers to requirements that newspending proposals on entitlements or tax cuts must be offset by cuts inother entitlements or by other tax increases, to ensure that the deficitdoes not rise. (See BEA.)
Revenue
Revenue is money collected by the Government.
Social Insurance Payroll Taxes
This tax category includes Social Security taxes, Medicare taxes,unemployment insurance taxes, and Federal employee retirementpayments.
39

Surplus
A surplus is the amount by which revenues exceed outlays.
Trust Funds
Trust funds are Government accounts, set forth by law as trust funds,for revenues and spending designated for specific purposes.
Unified Federal Budget
The unifiedbudget, the most useful display of the Government’sfinances, is the presentation of the Federal budget in which revenuesfrom all sources and outlays to all activities are consolidated.
40

List of Charts and Tables
List of Charts Page
What Is the Budget?
1–1 Government Spending as a Share of GDP, 1995 . . . . . 2
1–2 Total Government Outlays as a Percent of GDP . . . . . . 3
Where the Money Comes From—and Where It Goes
2–1 Family Budgeting . . . . . . . . . . . . . . . . . . . . . 5
2–2 National Budgeting . . . . . . . . . . . . . . . . . . . . 6
2–3 The Federal Government Dollar—Where It Comes From . . 7
2–4 Composition of Revenues Over the Last 40 Years . . . . . 9
2–5 Revenues as a Percent of GDP—Comparison With Other
2–5 Countries . . . . . . . . . . . . . . . . . . . . . . . . . 9
2–6 The Federal Government Dollar—Where It Goes . . . . . . 10
2–7 On- and Off-Budget Deficit Projections . . . . . . . . . . . 15
How Does the Government Create a Budget?
3–1 Major Steps in the Budget Process . . . . . . . . . . . . . 18
Deficits and the Debt
4–1 Past and Future Budget Deficits or Surpluses . . . . . . . . 23
4–2 Outlays as a Percent of GDP . . . . . . . . . . . . . . . 24
4–3 Total Government Surplus or Deficit as a Percent of GDP . 26
4–4 Interest Costs as a Percent of Income Tax Revenues Over
4–4 40 Years . . . . . . . . . . . . . . . . . . . . . . . . . 27
The President’s 1997 Budget
5–1 Cuts in Civilian Employment . . . . . . . . . . . . . . . . 34
41
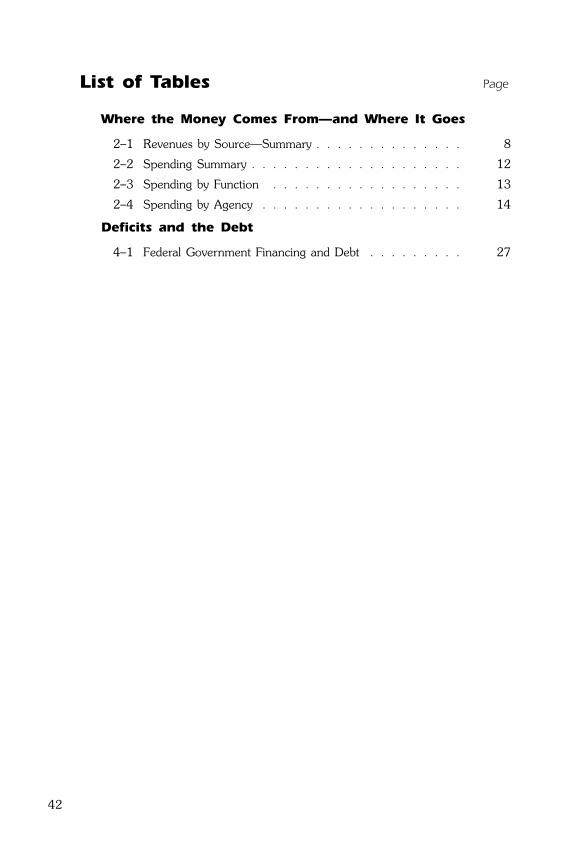
List of Tables Page
Where the Money Comes From—and Where It Goes
2–1 Revenues by Source—Summary . . . . . . . . . . . . . . 8
2–2 Spending Summary . . . . . . . . . . . . . . . . . . . . 12
2–3 Spending by Function . . . . . . . . . . . . . . . . . . 13
2–4 Spending by Agency . . . . . . . . . . . . . . . . . . . 14
Deficits and the Debt
4–1 Federal Government Financing and Debt . . . . . . . . . 27
42

ORDER FORM
MAIL ORDER FORM To:
Superintendent of Documents
U.S. Government Printing Office
Washington, DC 20402
Enclosed find $..... .... .... .... .... .... ..
(Check or money order payable to the Superintendent of Documents)
(Please do not send cash or stamps.)
Please send me the publications I have indicated.
Please charge this orderto my Deposit Account
Deposit Account Number
Name .... ..... .... .... .... .... .... .... .... .... .... .... .... .... .... .... .... .... .... .... .... .... .... .... .... .... .... ..... .... .... .... .... .... .... .... .... .... .... .... .... .... .... .... .... .... .... .... ..
Street address .... .... .... .... .... .... .... .... .... .... .... .... .... .... .... .... .... .... .... .... .... ..... .... .... .... .... .... .... .... .... .... .... .... .... .... .... .... .... .... .... .... .... .... .... .
City and State .. .... .... .... .... .... .... .... .... .... .... .... .... .... .... .... .... .... .... .... .... .... .... .... .... .... ..... .... .... ... ZIP Code .. .... .... .... .... .... .... .... .... .... .....
Credit Card Orders OnlyTotal charges $________________ Fill in the boxes below.
CreditCard No.
Expiration Date Month/Year
No. of
copies
PUBLICATIONSPrice
per copyTotal cost
............ The Budget of the United States Government, FY 1997,S/N 041�001�00464�5.... .... .... .... .... .... .... .... .... .... .... ..... .... .... .... .... .... . $1.75 .............
............ The Budget of the Un ited States Government�Supplement, FY 1997, S/N 041�001�00465�3............. 15.00 .............
............ The Budget of the United States Government, FY1997�Appendix, S/N 041�001�00466�1 .... .... .... .... .... .... .... .. 44.00 .............
............ Analytical Perspectives, FY 1997, S/N 041�001�00467�0 .. .... .... .... .... ..... .... .... .... .... .... .... .... .... .... .... .... .... .... .... .... .... .... .... .... .. 29.00 .............
............ Historical Tables, FY 1997, S/N 041�001�00468�8 ... .... .. 16.00 .............
............ A Citizen�s Guide to the Federal Budget, FY 1997, S/N041�001�00469�6 . .... .... .... .... .... .... .... .... .... .... .... .... .... .... .... .... .... .... .... .. 1.25 .............
............ The Budget System and Concepts, FY 1997, S/N041�001�00470�0 . .... .... .... .... .... .... .... .... .... .... .... .... .... .... .... .... .... .... .... .. 1.50 .............
............ The Budget on CD-ROM, FY 1997, S/N 041�001�00471�8 .. .... .... .... .... ..... .... .... .... .... .... .... .... .... .... .... .... .... .... .... .... .... .... .... .... .. 19.00 .............
Total . .... .... .... .... .... .... .... .... .... .... .... .... .... .... .... .... .... .. ............. .............
CHECK HERE IF YOU WISH TO RECEIVE PRIORITY ANNOUNCEMENTS OF FUTURE BUDGET PUBLICATIONS.
FOR OFFICE USE ONLY
Quantity Charges
.... ....Publications ... .... .... .... .... .... ..
.... ....Subscriptions ... .... .... .... .... .... ..
Special Shipping Charges ... .... .... .... .... .... ..
International Handling ....... ... .... .... .... .... .... ..
Special Charges... .... .... ..... ... .... .... .... .... .... ..
OPNR ....... .... .... .... .... .... ..... ... .... .... .... .... .... ..
.... .... .... ..... .... .... .UPNS
.... .... .... ..... .... ....Balance Due
.... .... .... ..... .... ....Discount
.... .... .... ..... .... ....Refund
There is a 25% d iscount on all orders for 100 or more copies of a single title mailed to a
single address. No discount is allowed if such orders are mailed to multiple addresses.
�


![PDF] LOK SABHA DEBATES (English Version)interim budget railway, 1998-99 . supplementary demands for grants-railways, 1997-98 . interim budget, general 1998-99 . supplementary demands](https://img.pdfslide.us/doc/110x75/612d1af01ecc51586941fb6a/lok-sabha-debates-english-versioninterim-budget-railway-1998-99-supplementary.jpg)