Embed Size (px)
Citation preview
Table of Contents
A Note to the Reader . . . . . . . . . . . . . . . . . . . . iii
1. What Is the Budget? . . . . . . . . . . . . . . . . . . . 1
2. Where the Money Comes From�and Where ItGoes . . . . . . . . . . . . . . . . . . . . . . . . . . . . . 5
Revenues . . . . . . . . . . . . . . . . . . . . . . . . . . . . . . . . . . . . . . . 7
Spending . . . . . . . . . . . . . . . . . . . . . . . . . . . . . . . . . . . . . . . 10
�On� and �Off� Budget . . . . . . . . . . . . . . . . . . . . . . . . . . . . . 15
3. How Does the Government Create a Budget? . . 17The President�s Budget. . . . . . . . . . . . . . . . . . . . . . . . . . . . . . 17
The Budget Process . . . . . . . . . . . . . . . . . . . . . . . . . . . . . . . . 17
Action in Congress . . . . . . . . . . . . . . . . . . . . . . . . . . . . . . . . 18
Monitoring the Budget . . . . . . . . . . . . . . . . . . . . . . . . . . . . . . 20
4. Deficits and the Debt . . . . . . . . . . . . . . . . . . 21Why the Deficit is a Problem . . . . . . . . . . . . . . . . . . . . . . . . . . 23
Deficits and Debt. . . . . . . . . . . . . . . . . . . . . . . . . . . . . . . . . . 24
Deficit Reduction Efforts . . . . . . . . . . . . . . . . . . . . . . . . . . . . . 26
5. The President�s 1999 Budget . . . . . . . . . . . . . 29Investing in the Future . . . . . . . . . . . . . . . . . . . . . . . . . . . . . . 29
Improving Performance Through Better Management . . . . . . . . . 32
Glossary . . . . . . . . . . . . . . . . . . . . . . . . . . . . . 35
List of Charts and Tables . . . . . . . . . . . . . . . . . . 39
i

ii
iii
A Note to the Reader
Next year, your Federal Government will spend over $1.7 trillion.
Needless to say, that�s a lot of money. And the Government spends it on lotsof things�on programs as large and popular as Social Security, and onactivities as small and unknown as repairs to the National Zoo. Together,these programs are what make up the Federal budget.
How much do you know about the budget? If your answer is �not much,�you�re not alone. In fact, hardly anybody knows everything that�s in thethousands of pages, and several books, that make up the budget each year.
But we know you care a lot about how the Government spends your money.That�s why we created A Citizen�s Guide to the Federal Budget three yearsago, and why we have published this fourth edition. With it, we hope to makethe budget more accessible and understandable.
The Guide is designed to give you a walking tour of the budget. In thesepages, we will outline for you how the Government raises revenues andspends money, how the President and Congress enact the budget, why thebudget deficit and Federal debt have been problems, and what the Presidenthopes to accomplish with his 1999 budget.
After you read these pages, we hope that you will think the tour was worthyour time. And we hope you will give us your suggestions about how we canmake the Guide more useful to you in the future.

iv
1
1. What Is the Budget?
The Federal budget is:
• a plan for how the Government spends your money.
What activities are funded? How much does it spend for defense,national parks, the FBI, Medicare, and meat and fish inspection?
• a plan for how the Government pays for its activities.
How much revenue does it raise through different kinds of taxes�income taxes, excise taxes, and social insurance payroll taxes?
• a plan for Government borrowing.
If spending is greater than revenues, the Government runs a deficit. Tofinance deficits, the Government has to borrow money. Governmentborrowing adds to the national debt.
• something that affects the Nation�s economy.
Some types of spending�such as improvements in education andsupport for science and technology�increase productivity and raiseincomes in the future.
Taxes, on the other hand, reduce incomes, leaving people with lessmoney to spend.
• something that is affected by the Nation�s economy.
When the economy is doing well, people are earning more andunemployment is low. In this atmosphere, revenues increase and thedeficit shrinks.
• an historical record.
The budget reports on how the Government has spent money in thepast, and how that spending was financed.
The 1999 budget is a document that embodies the President�s budgetproposal to Congress for fiscal 1999, the fiscal year that begins on October1, 1998. It reflects the President�s priorities and the first proposed balancedbudget in nearly three decades.
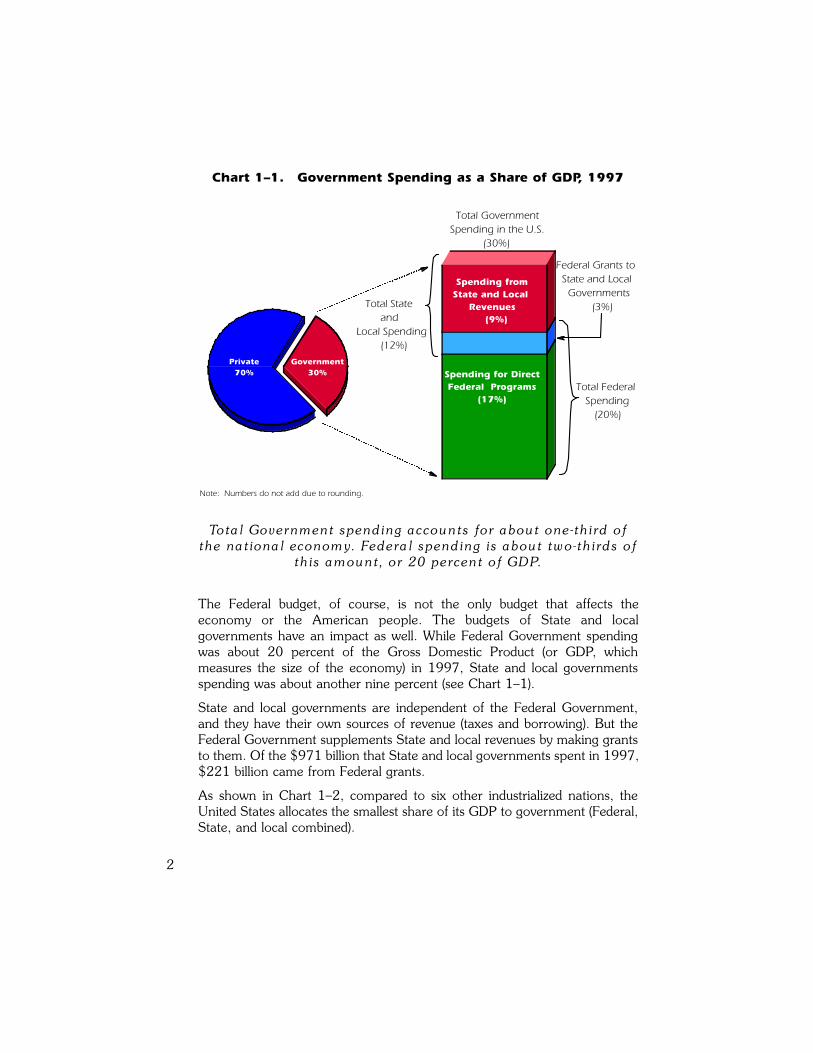
The Federal budget, of course, is not the only budget that affects theeconomy or the American people. The budgets of State and localgovernments have an impact as well. While Federal Government spendingwas about 20 percent of the Gross Domestic Product (or GDP, whichmeasures the size of the economy) in 1997, State and local governmentsspending was about another nine percent (see Chart 1�1).
State and local governments are independent of the Federal Government,and they have their own sources of revenue (taxes and borrowing). But theFederal Government supplements State and local revenues by making grantsto them. Of the $971 billion that State and local governments spent in 1997,$221 billion came from Federal grants.
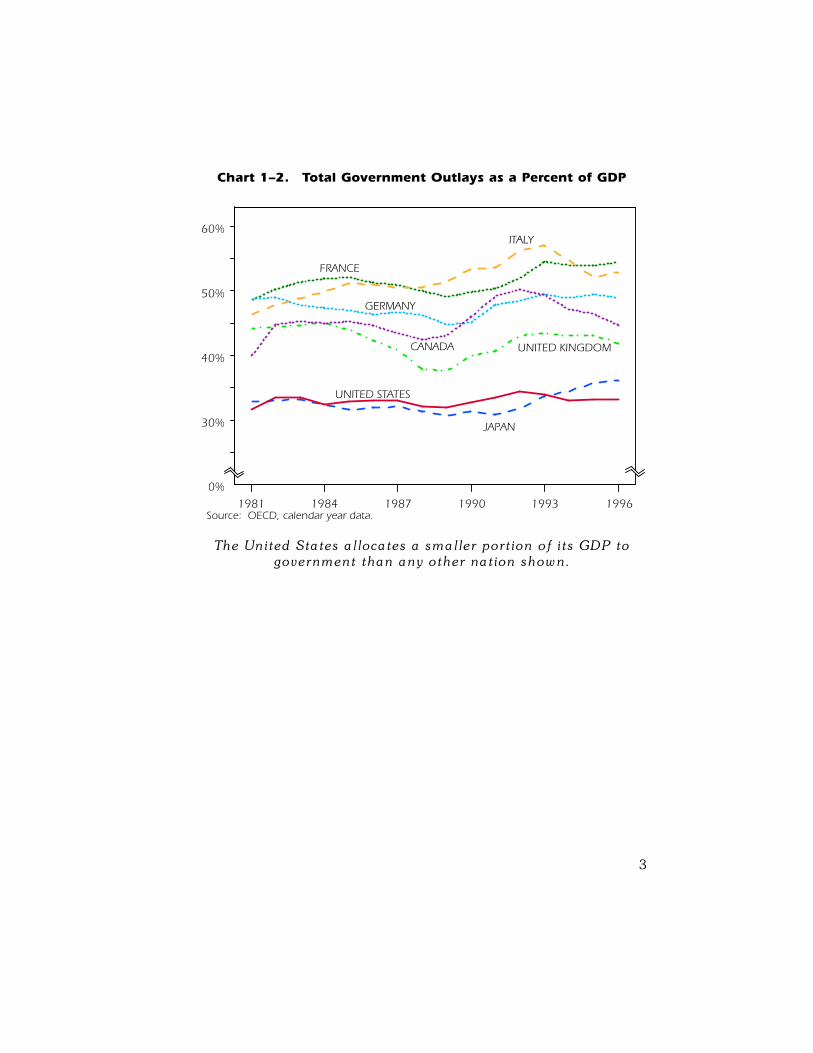
As shown in Chart 1�2, compared to six other industrialized nations, theUnited States allocates the smallest share of its GDP to government (Federal,State, and local combined).
2
Pie 1
0
10
20
30
40
50
60
70
80
90
100
Total Federal Spending (20%)
Spending for DirectFederal Programs
(17%)
Spending from State and Local Revenues (9%)
Note: Numbers do not add due to rounding.
Private70%
Total State andLocal Spending (12%)
Government30%
Total GovernmentSpending in the U.S. (30%)
Federal Grants to State and Local Governments (3%)
Chart 1�1. Government Spending as a Share of GDP, 1997
Total Government spending accounts for about one-third ofthe national economy. Federa l spending is about two-thirds of
this amount, or 20 percent of GDP.
3
1981 1984 1987 1990 1993 199620%
30%
40%
50%
60%
FRANCE
ITALY
GERMANY
CANADA UNITED KINGDOM
UNITED STATES
JAPAN
Source: OECD, calendar year data.
Chart 1�2. Total Government Outlays as a Percent of GDP
The United States a llocates a smaller portion of its GDP togovernment than any other nation shown.

4
2. Where the Money Comes From�and Where it Goes
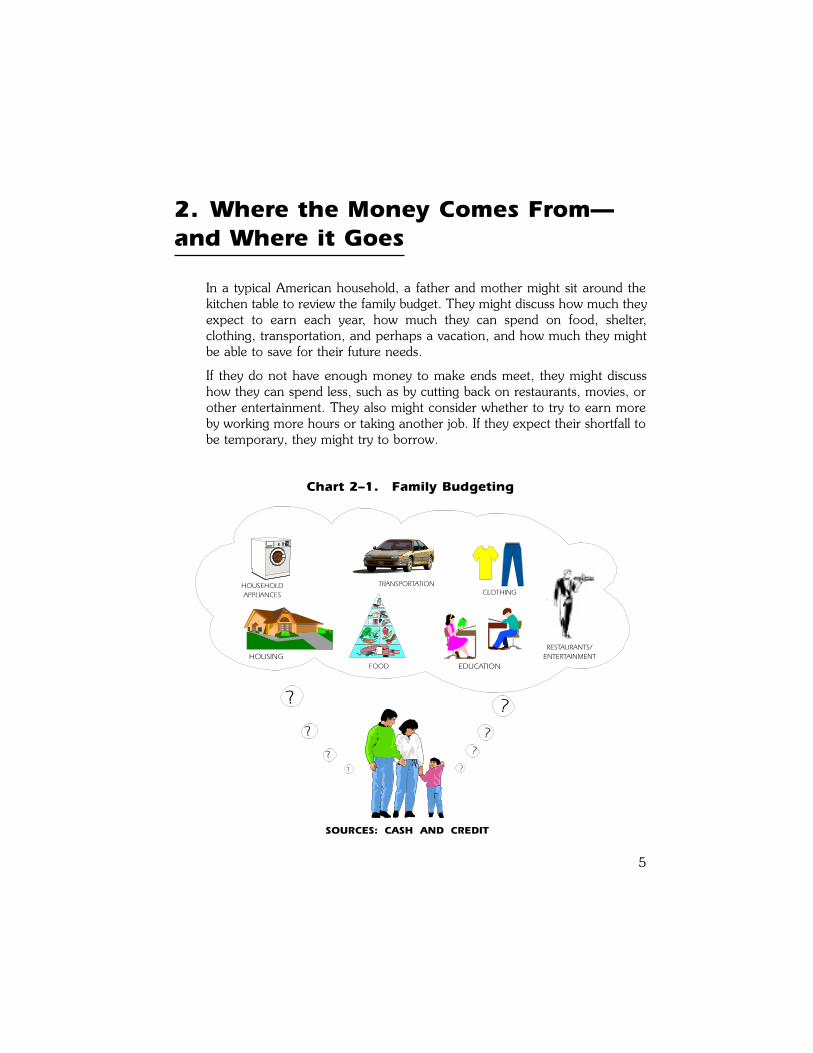
In a typical American household, a father and mother might sit around thekitchen table to review the family budget. They might discuss how much theyexpect to earn each year, how much they can spend on food, shelter,clothing, transportation, and perhaps a vacation, and how much they mightbe able to save for their future needs.
If they do not have enough money to make ends meet, they might discusshow they can spend less, such as by cutting back on restaurants, movies, orother entertainment. They also might consider whether to try to earn moreby working more hours or taking another job. If they expect their shortfall tobe temporary, they might try to borrow.
5
Chart 2�1. Family Budgeting
SOURCES: CASH AND CREDIT
TRANSPORTATION
FOOD
HOUSEHOLDAPPLIANCES CLOTHING
RESTAURANTS/ENTERTAINMENT
?
?
?
??
?
?
?
HOUSINGEDUCATION
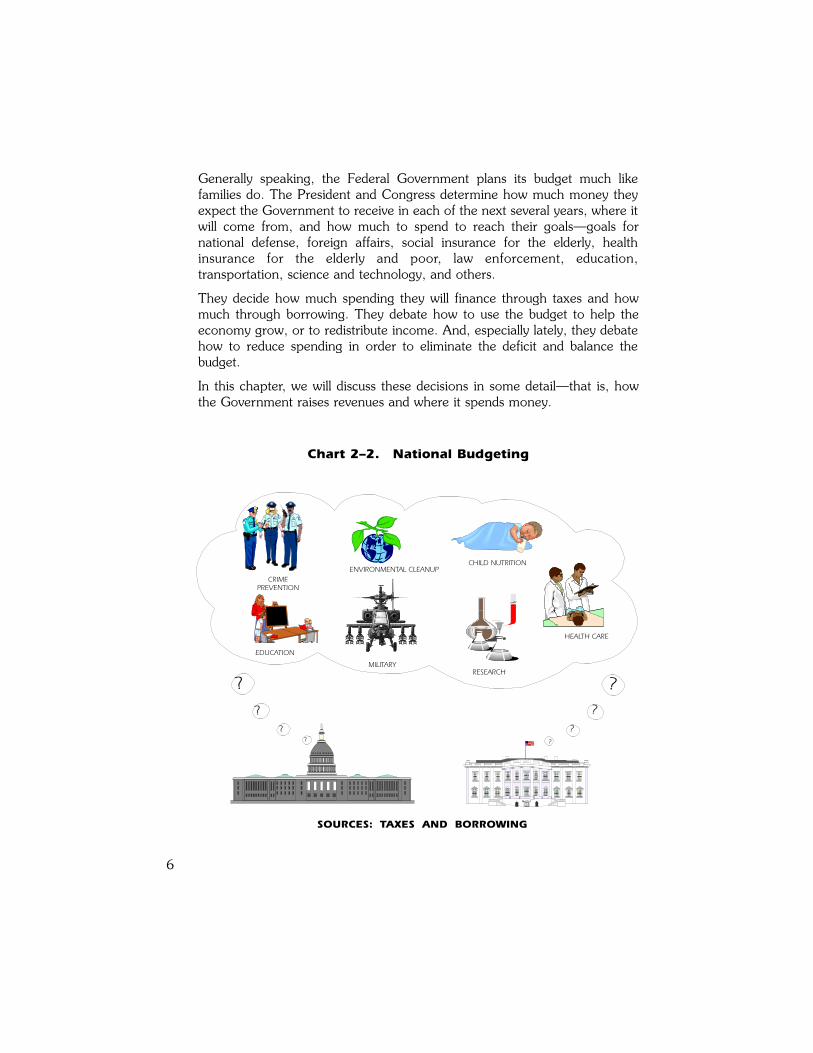
Generally speaking, the Federal Government plans its budget much likefamilies do. The President and Congress determine how much money theyexpect the Government to receive in each of the next several years, where itwill come from, and how much to spend to reach their goals�goals fornational defense, foreign affairs, social insurance for the elderly, healthinsurance for the elderly and poor, law enforcement, education,transportation, science and technology, and others.
They decide how much spending they will finance through taxes and howmuch through borrowing. They debate how to use the budget to help theeconomy grow, or to redistribute income. And, especially lately, they debatehow to reduce spending in order to eliminate the deficit and balance thebudget.
In this chapter, we will discuss these decisions in some detail�that is, howthe Government raises revenues and where it spends money.
6
Chart 2�2. National Budgeting
EDUCATION
MILITARY
ENVIRONMENTAL CLEANUP
HEALTH CARE
CHILD NUTRITION
RESEARCH
CRIMEPREVENTION
SOURCES: TAXES AND BORROWING
?
??
?
?
??
?
Revenues
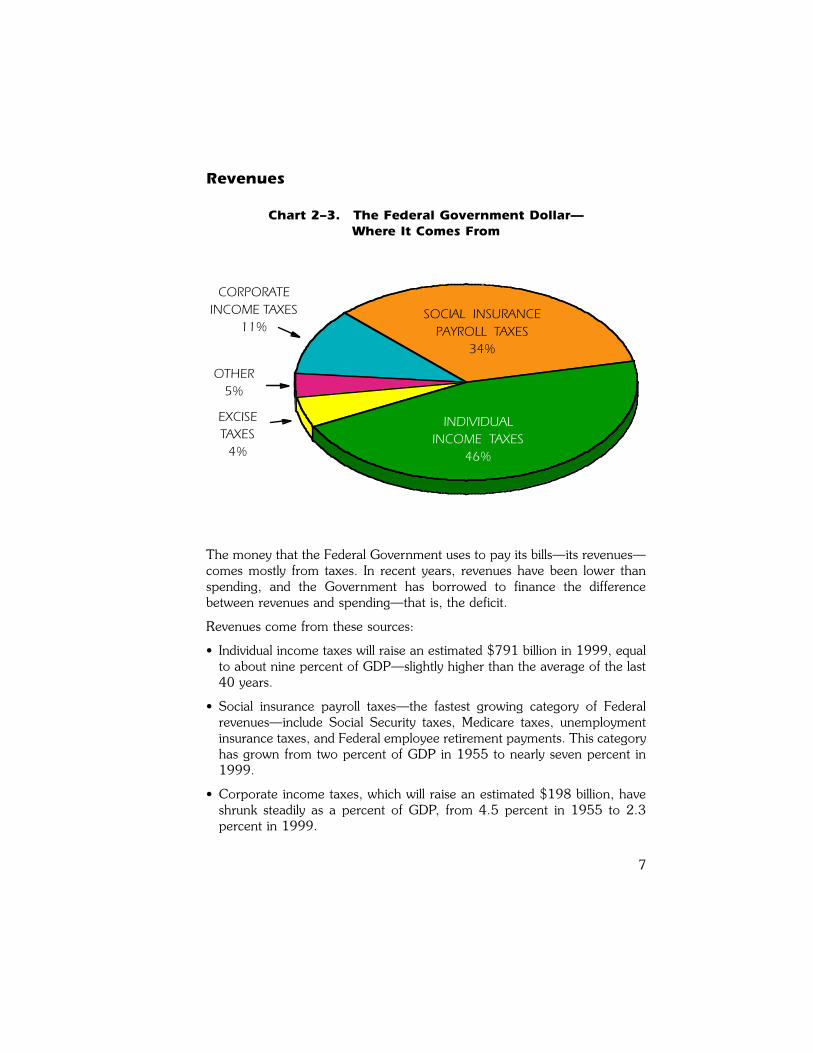
The money that the Federal Government uses to pay its bills�its revenues�comes mostly from taxes. In recent years, revenues have been lower thanspending, and the Government has borrowed to finance the differencebetween revenues and spending�that is, the deficit.
Revenues come from these sources:
� Individual income taxes will raise an estimated $791 billion in 1999, equalto about nine percent of GDP�slightly higher than the average of the last40 years.
� Social insurance payroll taxes�the fastest growing category of Federalrevenues�include Social Security taxes, Medicare taxes, unemploymentinsurance taxes, and Federal employee retirement payments. This categoryhas grown from two percent of GDP in 1955 to nearly seven percent in1999.
� Corporate income taxes, which will raise an estimated $198 billion, haveshrunk steadily as a percent of GDP, from 4.5 percent in 1955 to 2.3percent in 1999.
7
SOCIAL INS
INDIV TAX
OTHER
EXCISE
CORP
INDIVIDUALINCOME TAXES
46%
SOCIAL INSURANCEPAYROLL TAXES
34%
CORPORATEINCOME TAXES
11%
OTHER5%
EXCISETAXES
4%
Chart 2�3. The Federal Government Dollar�Where It Comes From
� Excise taxes apply to various products, including alcohol, tobacco,transportation fuels, and telephone services. The Government earmarkssome of these taxes to support certain activities�including highways andairports and airways�and deposits others in the general fund.
� The Government also collects miscellaneous revenues�e.g., customsduties, Federal Reserve earnings, fines, penalties, and forfeitures.
8
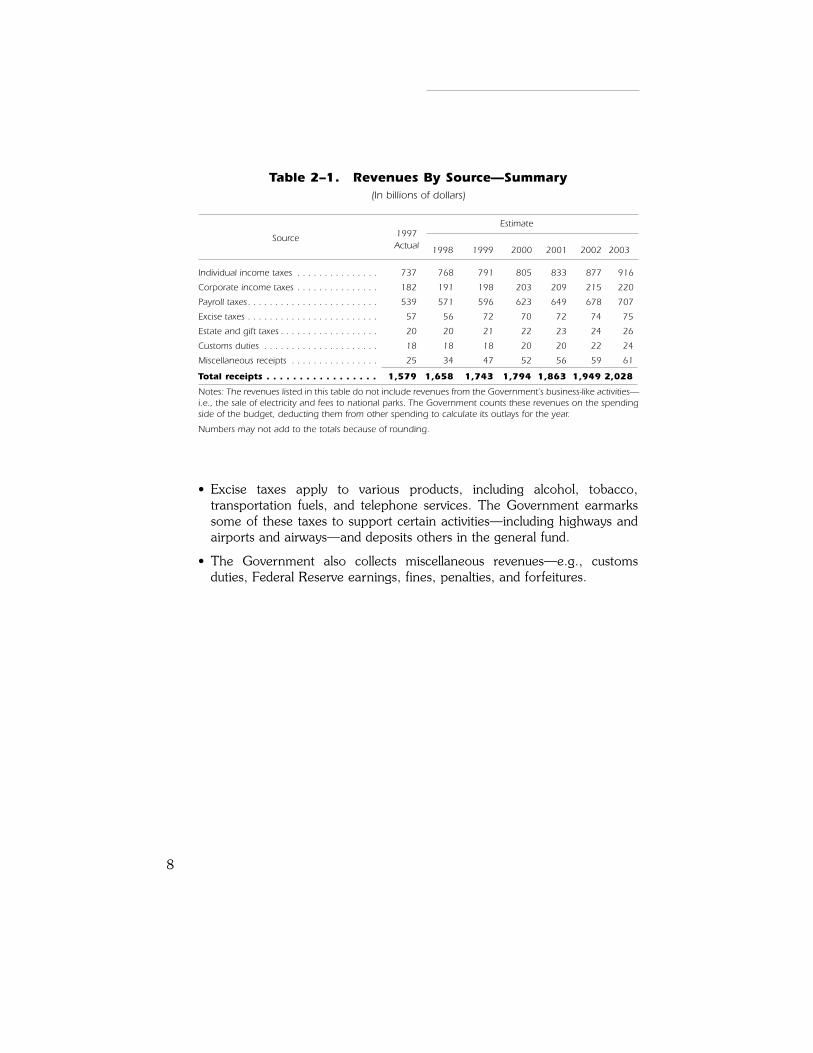
Table 2�1. Revenues By Source�Summary(In billions of dollars)
Estimate
Source 1997Actual 1998 1999 2000 2001 2002 2003
Individual income taxes . . . . . . . . . . . . . . . 737 768 791 805 833 877 916
Corporate income taxes . . . . . . . . . . . . . . . 182 191 198 203 209 215 220
Payroll taxes. . . . . . . . . . . . . . . . . . . . . . . . 539 571 596 623 649 678 707
Excise taxes . . . . . . . . . . . . . . . . . . . . . . . . 57 56 72 70 72 74 75
Estate and gift taxes . . . . . . . . . . . . . . . . . . 20 20 21 22 23 24 26
Customs duties . . . . . . . . . . . . . . . . . . . . . 18 18 18 20 20 22 24
Miscellaneous receipts . . . . . . . . . . . . . . . . 25 34 47 52 56 59 61
Total receipts . . . . . . . . . . . . . . . . . 1,579 1,658 1,743 1,794 1,863 1,949 2,028
Notes: The revenues listed in this table do not include revenues from the Government�s business-like activities�i.e., the sale of electricity and fees to national parks. The Government counts these revenues on the spendingside of the budget, deducting them from other spending to calculate its outlays for the year.
Numbers may not add to the totals because of rounding.
9
1961 1967 1973 1979 1985 1991 1997 2003
0
20
40
60
80
100
PERCENT
SOCIAL INSURANCE TAXES
EXCISE TAXES
CORPORATION INCOME TAXES
INDIVIDUAL INCOME TAXES
OTHER1956
1981 1984 1987 1990 1993 1996
20%
25%
30%
35%
40%
45%
50%
55%
Source: OECD, calendar year data.
FRANCE
GERMANY
CANADA
UNITED KINGDOM ITALY
JAPAN
UNITED STATES
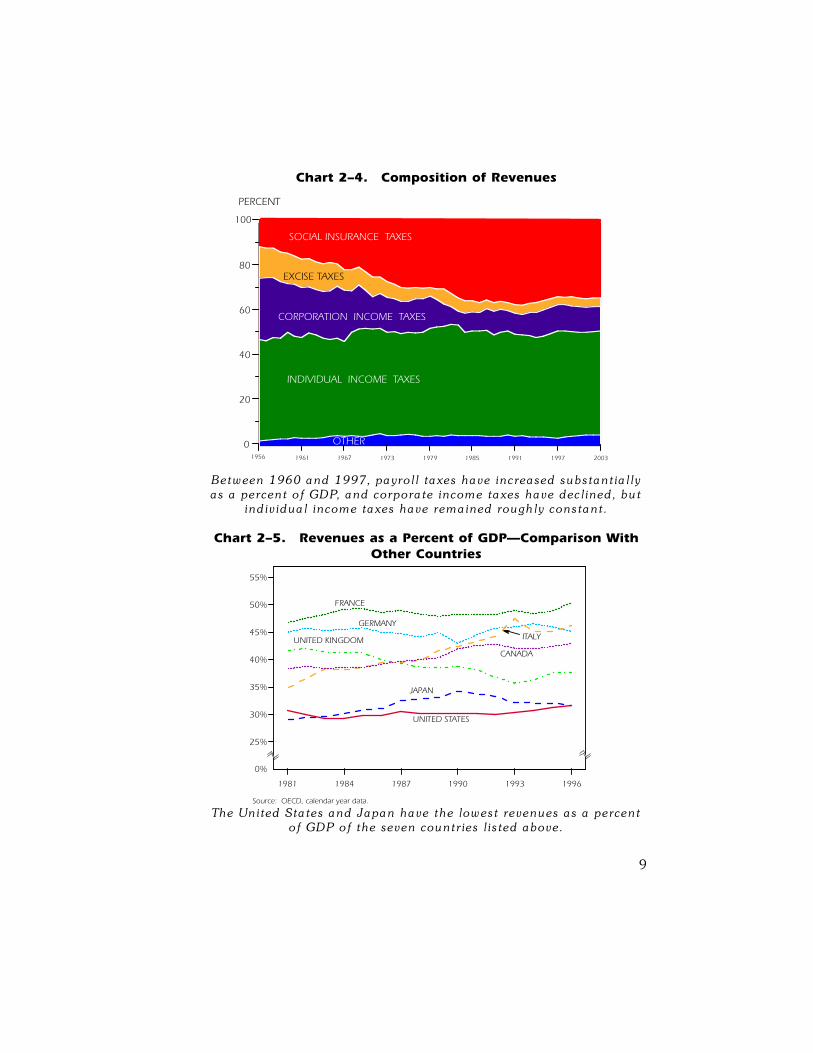
Chart 2�4. Composition of Revenues
Chart 2�5. Revenues as a Percent of GDP�Comparison WithOther Countries
Between 1960 and 1997, payroll taxes have increased substantia llyas a percent of GDP, and corporate income taxes have declined, but
individual income taxes have remained roughly constant.
The United States and Japan have the lowest revenues as a percentof GDP of the seven countries listed above.
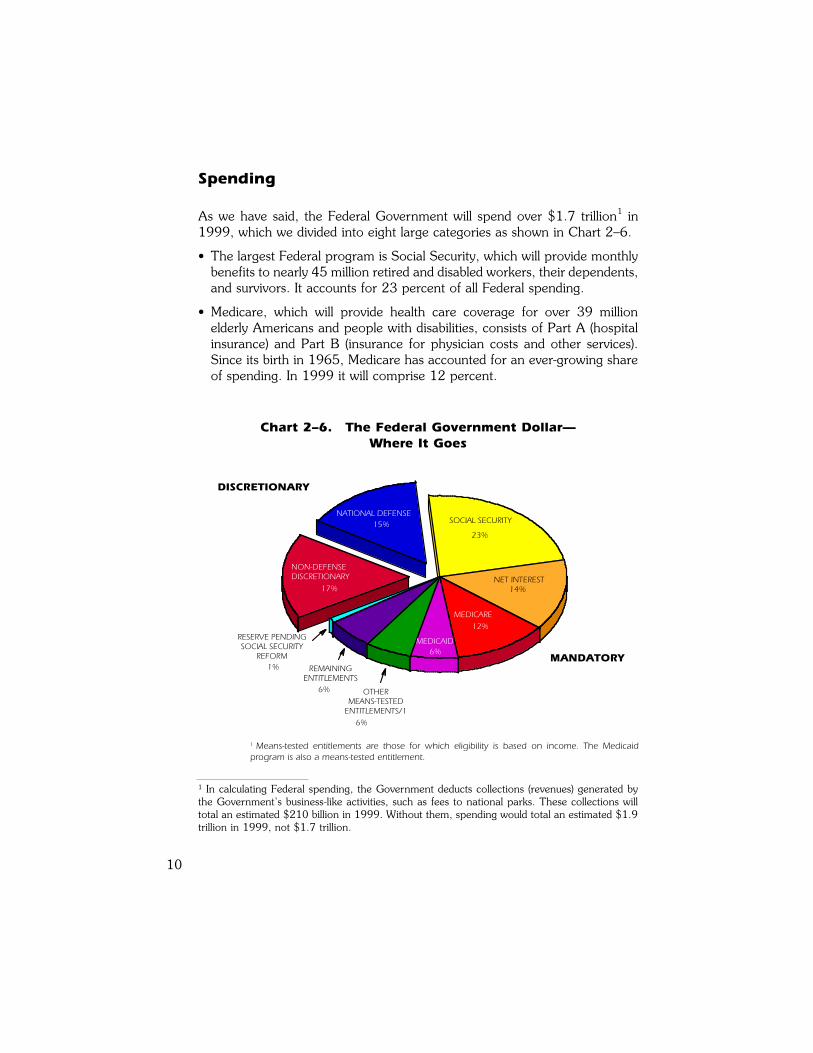
Spending
As we have said, the Federal Government will spend over $1.7 trillion1 in1999, which we divided into eight large categories as shown in Chart 2�6.
� The largest Federal program is Social Security, which will provide monthlybenefits to nearly 45 million retired and disabled workers, their dependents,and survivors. It accounts for 23 percent of all Federal spending.
� Medicare, which will provide health care coverage for over 39 millionelderly Americans and people with disabilities, consists of Part A (hospitalinsurance) and Part B (insurance for physician costs and other services).Since its birth in 1965, Medicare has accounted for an ever-growing shareof spending. In 1999 it will comprise 12 percent.
10
1 In calculating Federal spending, the Government deducts collections (revenues) generated bythe Government�s business-like activities, such as fees to national parks. These collections willtotal an estimated $210 billion in 1999. Without them, spending would total an estimated $1.9trillion in 1999, not $1.7 trillion.
NON-DEFENSE DISCRETIONARY
17%
NATIONAL DEFENSE15% SOCIAL SECURITY
23%
NET INTEREST14%
MEDICARE12%
MEDICAID6%
OTHER MEANS-TESTED
ENTITLEMENTS/16%
REMAINING ENTITLEMENTS
6%
RESERVE PENDING SOCIAL SECURITY
REFORM1%
1 Means-tested entitlements are those for which eligibility is based on income. The Medicaidprogram is also a means-tested entitlement.
DISCRETIONARY
MANDATORY
Chart 2�6. The Federal Government Dollar�Where It Goes
1 Means-tested entitlements are those for which eligibility is based on income. The Medicaidprogram is also a means-tested entitlement.
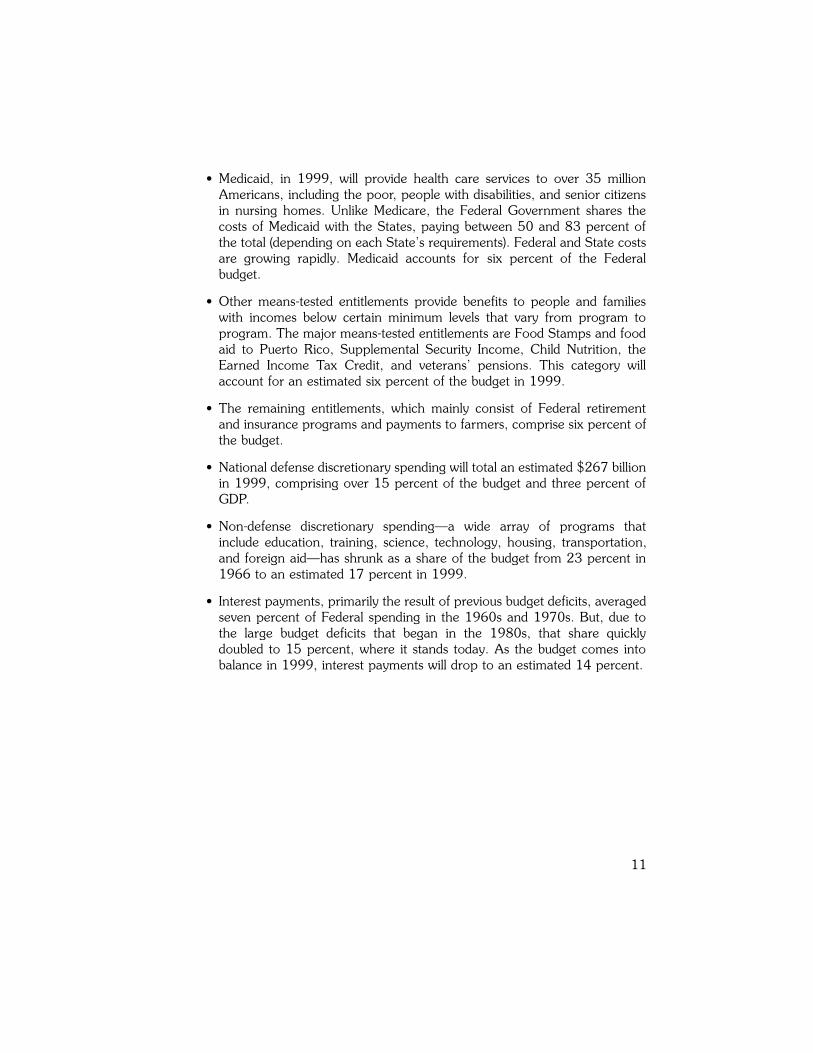
� Medicaid, in 1999, will provide health care services to over 35 millionAmericans, including the poor, people with disabilities, and senior citizensin nursing homes. Unlike Medicare, the Federal Government shares thecosts of Medicaid with the States, paying between 50 and 83 percent ofthe total (depending on each State�s requirements). Federal and State costsare growing rapidly. Medicaid accounts for six percent of the Federalbudget.
� Other means-tested entitlements provide benefits to people and familieswith incomes below certain minimum levels that vary from program toprogram. The major means-tested entitlements are Food Stamps and foodaid to Puerto Rico, Supplemental Security Income, Child Nutrition, theEarned Income Tax Credit, and veterans� pensions. This category willaccount for an estimated six percent of the budget in 1999.
� The remaining entitlements, which mainly consist of Federal retirementand insurance programs and payments to farmers, comprise six percent ofthe budget.
� National defense discretionary spending will total an estimated $267 billionin 1999, comprising over 15 percent of the budget and three percent ofGDP.
� Non-defense discretionary spending�a wide array of programs thatinclude education, training, science, technology, housing, transportation,and foreign aid�has shrunk as a share of the budget from 23 percent in1966 to an estimated 17 percent in 1999.
� Interest payments, primarily the result of previous budget deficits, averagedseven percent of Federal spending in the 1960s and 1970s. But, due tothe large budget deficits that began in the 1980s, that share quicklydoubled to 15 percent, where it stands today. As the budget comes intobalance in 1999, interest payments will drop to an estimated 14 percent.
11
12
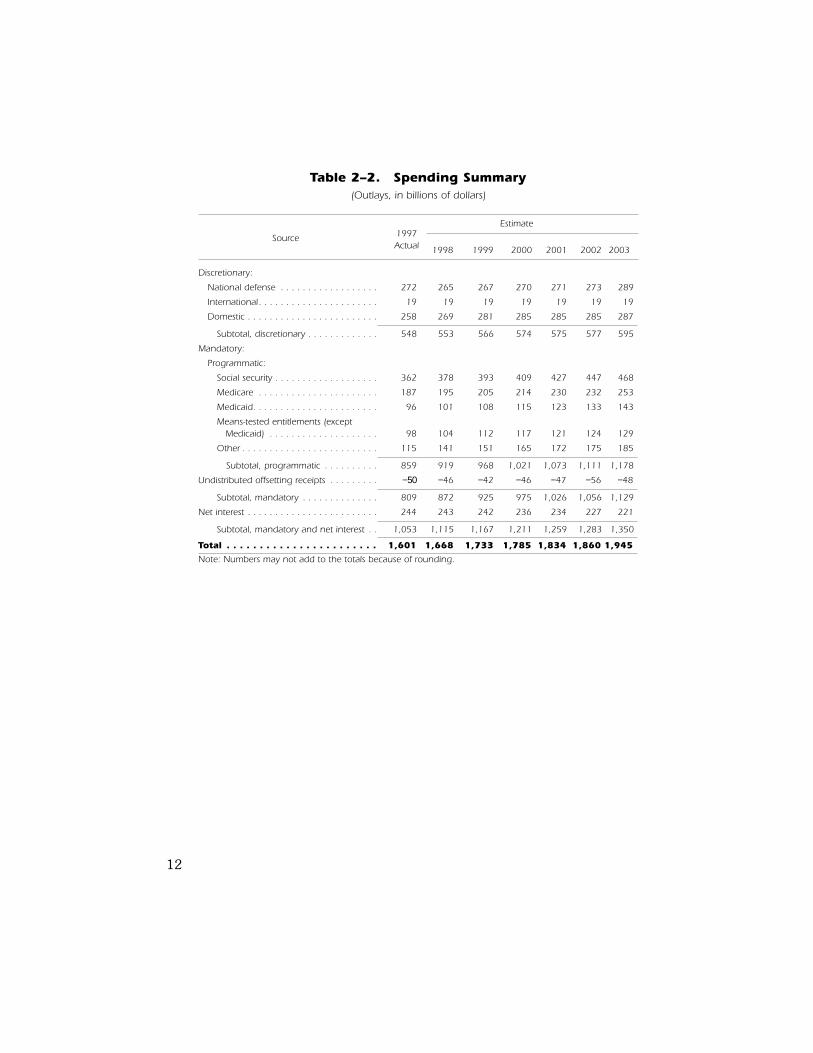
Table 2�2. Spending Summary(Outlays, in billions of dollars)
Estimate
Source 1997Actual 1998 1999 2000 2001 2002 2003
Discretionary:
National defense . . . . . . . . . . . . . . . . . . 272 265 267 270 271 273 289
International. . . . . . . . . . . . . . . . . . . . . . 19 19 19 19 19 19 19
Domestic . . . . . . . . . . . . . . . . . . . . . . . . 258 269 281 285 285 285 287
Subtotal, discretionary . . . . . . . . . . . . . 548 553 566 574 575 577 595
Mandatory:
Programmatic:
Social security . . . . . . . . . . . . . . . . . . . 362 378 393 409 427 447 468
Medicare . . . . . . . . . . . . . . . . . . . . . . 187 195 205 214 230 232 253
Medicaid. . . . . . . . . . . . . . . . . . . . . . . 96 101 108 115 123 133 143
Means-tested entitlements (exceptMedicaid) . . . . . . . . . . . . . . . . . . . . 98 104 112 117 121 124 129
Other . . . . . . . . . . . . . . . . . . . . . . . . . 115 141 151 165 172 175 185
Subtotal, programmatic . . . . . . . . . . 859 919 968 1,021 1,073 1,111 1,178
Undistributed offsetting receipts . . . . . . . . . −50 −46 −42 −46 −47 −56 −48
Subtotal, mandatory . . . . . . . . . . . . . . 809 872 925 975 1,026 1,056 1,129
Net interest . . . . . . . . . . . . . . . . . . . . . . . . 244 243 242 236 234 227 221
Subtotal, mandatory and net interest . . 1,053 1,115 1,167 1,211 1,259 1,283 1,350
Total . . . . . . . . . . . . . . . . . . . . . . . 1,601 1,668 1,733 1,785 1,834 1,860 1,945
Note: Numbers may not add to the totals because of rounding.
13
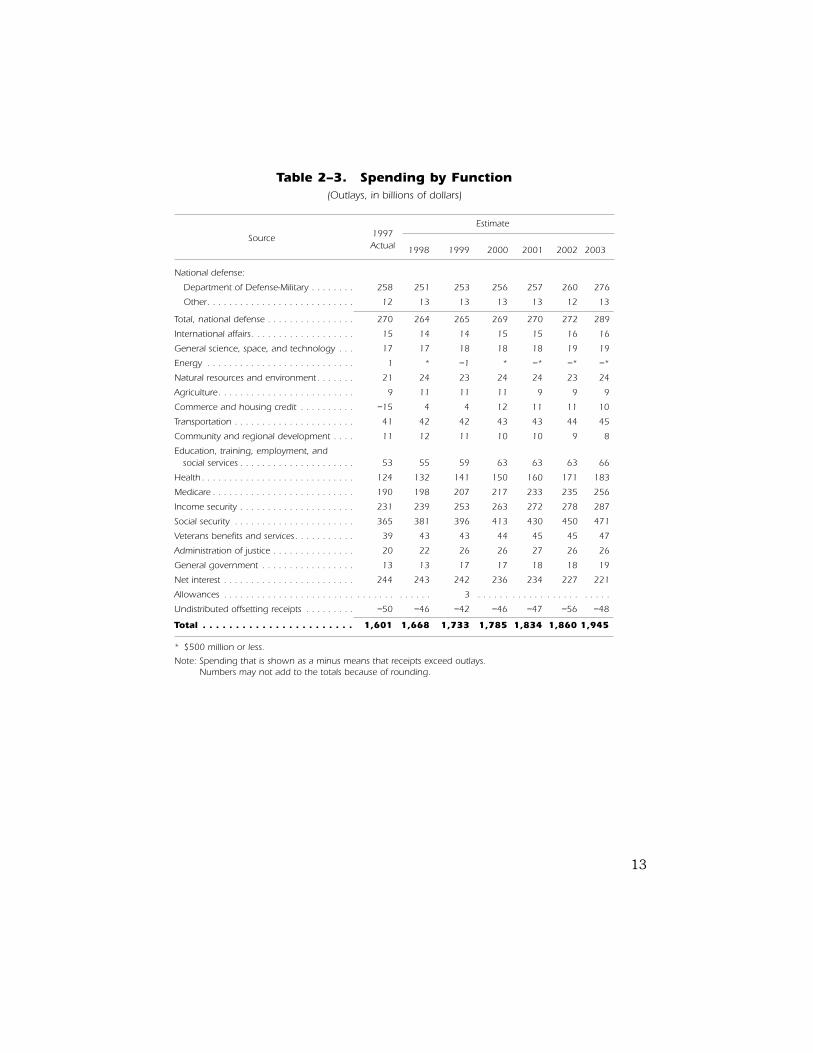
Table 2�3. Spending by Function(Outlays, in billions of dollars)
Estimate
Source 1997Actual 1998 1999 2000 2001 2002 2003
National defense:
Department of Defense-Military . . . . . . . . 258 251 253 256 257 260 276
Other. . . . . . . . . . . . . . . . . . . . . . . . . . . 12 13 13 13 13 12 13
Total, national defense . . . . . . . . . . . . . . . . 270 264 265 269 270 272 289
International affairs. . . . . . . . . . . . . . . . . . . 15 14 14 15 15 16 16
General science, space, and technology . . . 17 17 18 18 18 19 19
Energy . . . . . . . . . . . . . . . . . . . . . . . . . . . 1 * −1 * −* −* −*
Natural resources and environment . . . . . . . 21 24 23 24 24 23 24
Agriculture. . . . . . . . . . . . . . . . . . . . . . . . . 9 11 11 11 9 9 9
Commerce and housing credit . . . . . . . . . . −15 4 4 12 11 11 10
Transportation . . . . . . . . . . . . . . . . . . . . . . 41 42 42 43 43 44 45
Community and regional development . . . . 11 12 11 10 10 9 8
Education, training, employment, andsocial services . . . . . . . . . . . . . . . . . . . . . 53 55 59 63 63 63 66
Health . . . . . . . . . . . . . . . . . . . . . . . . . . . . 124 132 141 150 160 171 183
Medicare . . . . . . . . . . . . . . . . . . . . . . . . . . 190 198 207 217 233 235 256
Income security . . . . . . . . . . . . . . . . . . . . . 231 239 253 263 272 278 287
Social security . . . . . . . . . . . . . . . . . . . . . . 365 381 396 413 430 450 471
Veterans benefits and services . . . . . . . . . . . 39 43 43 44 45 45 47
Administration of justice . . . . . . . . . . . . . . . 20 22 26 26 27 26 26
General government . . . . . . . . . . . . . . . . . 13 13 17 17 18 18 19
Net interest . . . . . . . . . . . . . . . . . . . . . . . . 244 243 242 236 234 227 221
Allowances . . . . . . . . . . . . . . . . . . . . . . . . . . . . . . . . . . . . . 3 . . . . . . . . . . . . . . . . . . . . . . .
Undistributed offsetting receipts . . . . . . . . . −50 −46 −42 −46 −47 −56 −48
Total . . . . . . . . . . . . . . . . . . . . . . . 1,601 1,668 1,733 1,785 1,834 1,860 1,945
* $500 million or less.
Note: Spending that is shown as a minus means that receipts exceed outlays.Note: Numbers may not add to the totals because of rounding.
14
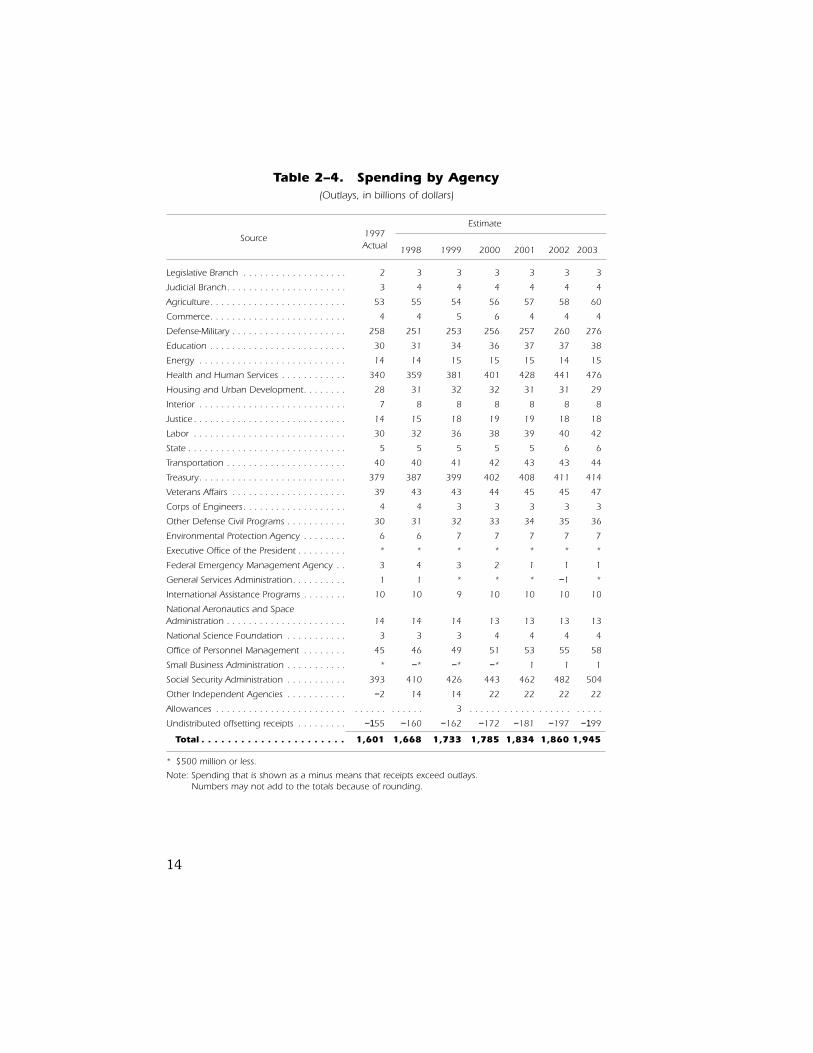
Table 2�4. Spending by Agency(Outlays, in billions of dollars)
Estimate
Source 1997Actual 1998 1999 2000 2001 2002 2003
Legislative Branch . . . . . . . . . . . . . . . . . . . 2 3 3 3 3 3 3
Judicial Branch. . . . . . . . . . . . . . . . . . . . . . 3 4 4 4 4 4 4
Agriculture. . . . . . . . . . . . . . . . . . . . . . . . . 53 55 54 56 57 58 60
Commerce. . . . . . . . . . . . . . . . . . . . . . . . . 4 4 5 6 4 4 4
Defense-Military . . . . . . . . . . . . . . . . . . . . . 258 251 253 256 257 260 276
Education . . . . . . . . . . . . . . . . . . . . . . . . . 30 31 34 36 37 37 38
Energy . . . . . . . . . . . . . . . . . . . . . . . . . . . 14 14 15 15 15 14 15
Health and Human Services . . . . . . . . . . . . 340 359 381 401 428 441 476
Housing and Urban Development. . . . . . . . 28 31 32 32 31 31 29
Interior . . . . . . . . . . . . . . . . . . . . . . . . . . . 7 8 8 8 8 8 8
Justice . . . . . . . . . . . . . . . . . . . . . . . . . . . . 14 15 18 19 19 18 18
Labor . . . . . . . . . . . . . . . . . . . . . . . . . . . . 30 32 36 38 39 40 42
State . . . . . . . . . . . . . . . . . . . . . . . . . . . . . 5 5 5 5 5 6 6
Transportation . . . . . . . . . . . . . . . . . . . . . . 40 40 41 42 43 43 44
Treasury. . . . . . . . . . . . . . . . . . . . . . . . . . . 379 387 399 402 408 411 414
Veterans Affairs . . . . . . . . . . . . . . . . . . . . . 39 43 43 44 45 45 47
Corps of Engineers. . . . . . . . . . . . . . . . . . . 4 4 3 3 3 3 3
Other Defense Civil Programs . . . . . . . . . . . 30 31 32 33 34 35 36
Environmental Protection Agency . . . . . . . . 6 6 7 7 7 7 7
Executive Office of the President . . . . . . . . . * * * * * * *
Federal Emergency Management Agency . . 3 4 3 2 1 1 1
General Services Administration. . . . . . . . . . 1 1 * * * −1 *
International Assistance Programs . . . . . . . . 10 10 9 10 10 10 10
National Aeronautics and SpaceAdministration . . . . . . . . . . . . . . . . . . . . . . 14 14 14 13 13 13 13
National Science Foundation . . . . . . . . . . . 3 3 3 4 4 4 4
Office of Personnel Management . . . . . . . . 45 46 49 51 53 55 58
Small Business Administration . . . . . . . . . . . * −* −* −* 1 1 1
Social Security Administration . . . . . . . . . . . 393 410 426 443 462 482 504
Other Independent Agencies . . . . . . . . . . . −2 14 14 22 22 22 22
Allowances . . . . . . . . . . . . . . . . . . . . . . . . . . . . . . . . . . . . 3 . . . . . . . . . . . . . . . . . . . . . . .
Undistributed offsetting receipts . . . . . . . . . −155 −160 −162 −172 −181 −197 −199
Total . . . . . . . . . . . . . . . . . . . . . . 1,601 1,668 1,733 1,785 1,834 1,860 1,945
* $500 million or less.
Note: Spending that is shown as a minus means that receipts exceed outlays.Note: Numbers may not add to the totals because of rounding.
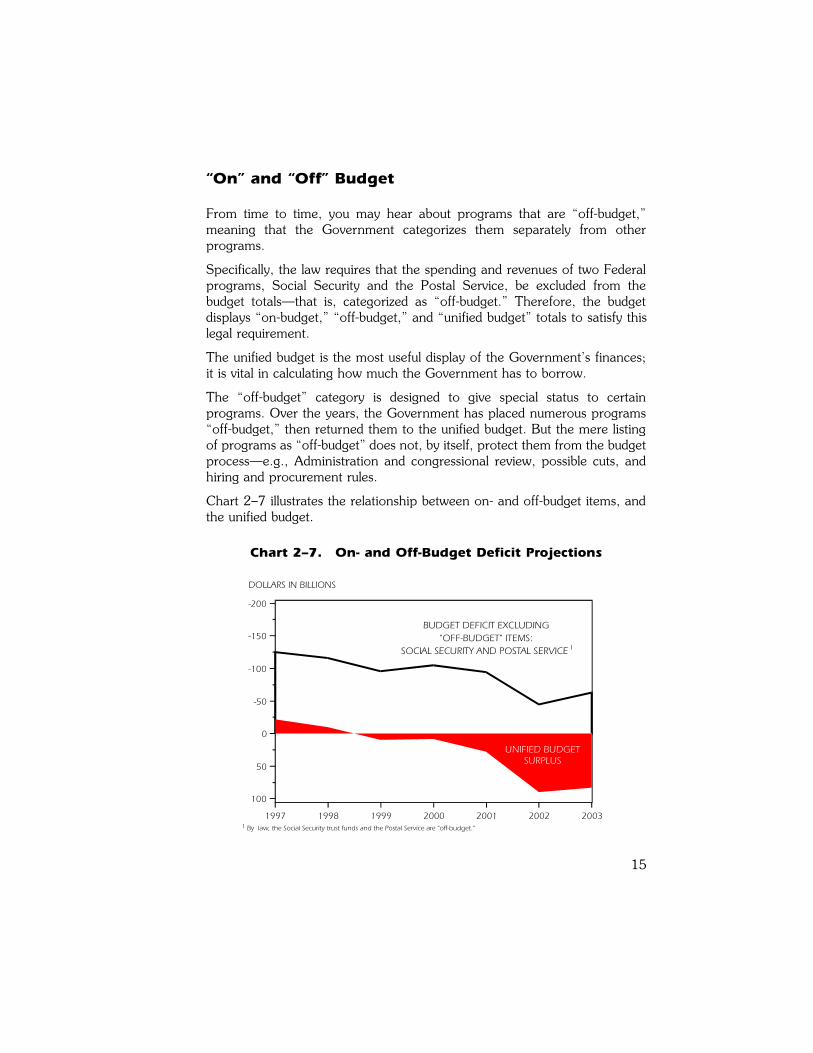
�On� and �Off� Budget
From time to time, you may hear about programs that are �off-budget,�meaning that the Government categorizes them separately from otherprograms.
Specifically, the law requires that the spending and revenues of two Federalprograms, Social Security and the Postal Service, be excluded from thebudget totals�that is, categorized as �off-budget.� Therefore, the budgetdisplays �on-budget,� �off-budget,� and �unified budget� totals to satisfy thislegal requirement.
The unified budget is the most useful display of the Government�s finances;it is vital in calculating how much the Government has to borrow.
The �off-budget� category is designed to give special status to certainprograms. Over the years, the Government has placed numerous programs�off-budget,� then returned them to the unified budget. But the mere listingof programs as �off-budget� does not, by itself, protect them from the budgetprocess�e.g., Administration and congressional review, possible cuts, andhiring and procurement rules.
Chart 2�7 illustrates the relationship between on- and off-budget items, andthe unified budget.
15
1997 1998 1999 2000 2001 2002 2003
-200
-150
-100
-50
0
50
100
DOLLARS IN BILLIONS
BUDGET DEFICIT EXCLUDING "OFF-BUDGET" ITEMS:
SOCIAL SECURITY AND POSTAL SERVICE
UNIFIED BUDGET SURPLUS
By law, the Social Security trust funds and the Postal Service are "off-budget." 1
1
Chart 2�7. On- and Off-Budget Deficit Projections

16
17
3. How Does the Government Createa Budget?
The President and Congress both play major roles in developing the Federalbudget.
The President�s Budget
The law requires that, by the first Monday in February, the President submitto Congress his proposed Federal budget for the next fiscal year, whichbegins October 1.
The White House�s Office of Management and Budget (OMB) prepares thebudget proposal, after receiving direction from the President and consultingwith his senior advisors and officials from Cabinet departments and otheragencies.
The President�s budget�which typically includes a main book and severalaccompanying books1�covers thousands of pages and provides reams ofdetails.
The Budget Process
Through the budget process, the President and Congress decide how muchto spend and tax in any one fiscal year. More specifically, they decide howmuch to spend on each activity, ensure that the Government spends no moreand spends it only for that activity, and report on that spending at the end ofeach budget cycle.
The President�s budget is his plan for the next year. But it�s just a proposal.After receiving it, Congress has its own budget process to follow. Only afterthe Congress passes, and the President signs, the required spending bills hasthe Government created its actual budget.
1 They are the main budget book, entitled, Budget of the United States Government: FiscalYear 1999, as well as Analytical Perspectives, Appendix, Historical Tables, and A Citizen�sGuide to the Federal Budget, which you are now reading.
18
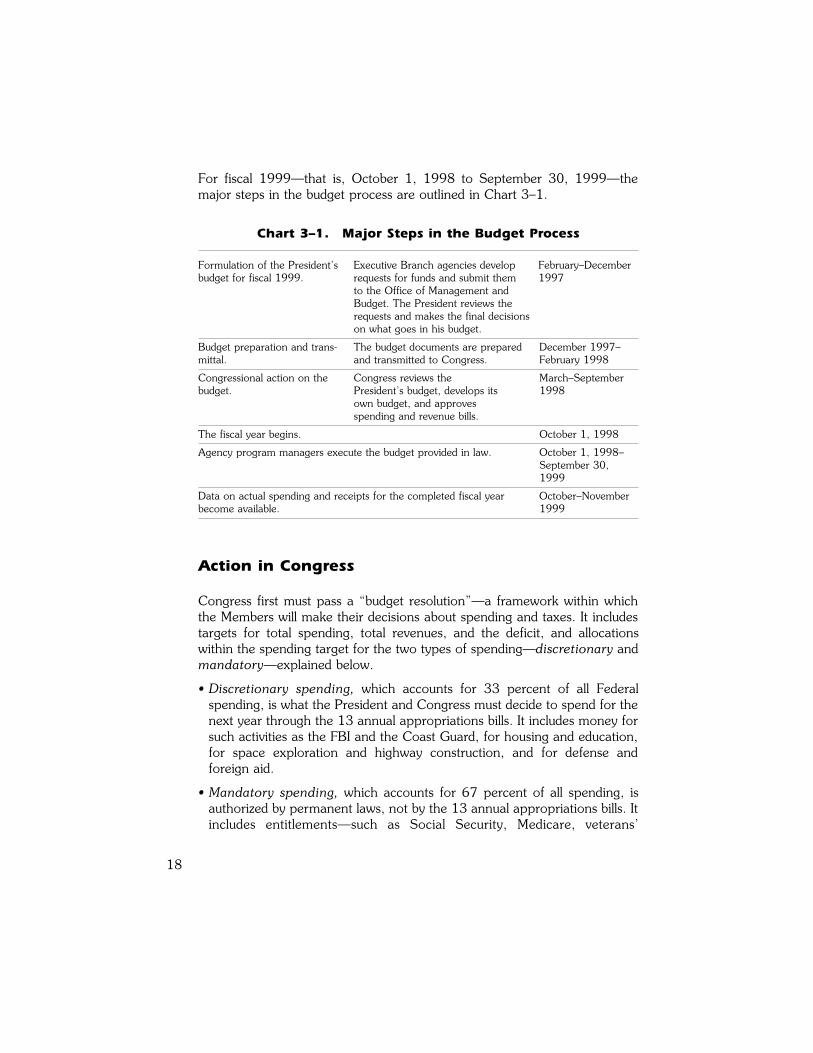
For fiscal 1999�that is, October 1, 1998 to September 30, 1999�themajor steps in the budget process are outlined in Chart 3�1.
Action in Congress
Congress first must pass a �budget resolution��a framework within whichthe Members will make their decisions about spending and taxes. It includestargets for total spending, total revenues, and the deficit, and allocationswithin the spending target for the two types of spending�discretionary andmandatory�explained below.
� Discretionary spending, which accounts for 33 percent of all Federalspending, is what the President and Congress must decide to spend for thenext year through the 13 annual appropriations bills. It includes money forsuch activities as the FBI and the Coast Guard, for housing and education,for space exploration and highway construction, and for defense andforeign aid.
� Mandatory spending, which accounts for 67 percent of all spending, isauthorized by permanent laws, not by the 13 annual appropriations bills. Itincludes entitlements�such as Social Security, Medicare, veterans�
Chart 3�1. Major Steps in the Budget Process
Formulation of the President�s Executive Branch agencies develop February�Decemberbudget for fiscal 1999. requests for funds and submit them 1997
to the Office of Management andBudget. The President reviews therequests and makes the final decisions on what goes in his budget.
Budget preparation and trans- The budget documents are prepared December 1997�mittal. and transmitted to Congress. February 1998
Congressional action on the Congress reviews the March�Septemberbudget. President�s budget, develops its 1998
own budget, and approves spending and revenue bills.
The fiscal year begins. October 1, 1998
Agency program managers execute the budget provided in law. October 1, 1998�September 30,1999
Data on actual spending and receipts for the completed fiscal year October�Novemberbecome available. 1999
19
benefits, and Food Stamps�through which individuals receive benefitsbecause they are eligible based on their age, income, or other criteria. Italso includes interest on the national debt, which the Government pays toindividuals and institutions that hold Treasury bonds and other Governmentsecurities. The President and Congress can change the law in order tochange the spending on entitlements and other mandatory programs�butthey don�t have to.
Think of it this way: For discretionary programs, Congress and the Presidentmust act each year to provide spending authority. For mandatory programs,they may act in order to change the spending that current laws require.
Currently, the law imposes a limit, or �cap,� through 2002 on total annualdiscretionary spending. Within the cap, however, the President and Congresscan, and often do, change the spending levels from year to year for thethousands of individual Federal spending programs.
In addition, the law requires that legislation that would raise mandatoryspending or lower revenues�compared to existing law�be offset byspending cuts or revenue increases. This requirement, called �pay-as-you-go,� is designed to prevent new legislation from increasing the deficit.
Once Congress passes the budget resolution, it turns its attention to passingthe 13 annual appropriations bills and, if it chooses, �authorizing� bills tochange the laws governing mandatory spending and revenues.
Congress begins by examining the President�s budget in detail. Scores ofcommittees and subcommittees hold hearings on proposals under theirjurisdiction. The House and Senate Armed Services Authorizing Committees,and the Defense and Military Construction Subcommittees of theAppropriations Committees, for instance, hold hearings on the President�sdefense plan. If the President�s budget proposed changes in taxes, the HouseWays and Means and the Senate Finance Committees would hold hearings.The Budget Director, Cabinet officers, and other Administration officialswork with Congress as it accepts some of the President�s proposals, rejectsothers, and changes still others. Congressional rules require that thesecommittees and subcommittees take actions that reflect the budgetresolution.
If you read through the President�s budget, the budget resolution, or theappropriations or authorizing bills that Congress drafts, you will notice thatthe Government measures spending in two ways��budget authority� and�outlays.�
20
Budget authority (or BA) is what the law authorizes the Federal Governmentto spend for certain programs, projects, or activities. What the Governmentactually spends in a particular year, however, is an outlay. To see thedifference, consider what happens when the Government decides to build aspace exploration system.
The President and Congress may agree to spend $1 billion for the spacesystem. Congress appropriates $1 billion in BA. But the system may take 10years to build. Thus, the Government may spend $100 million in outlays inthe first year to begin construction and the remaining $900 million over thenext nine years as construction continues.
Monitoring the Budget
Once the President and Congress approve spending, the Governmentmonitors the budget through:
� agency program managers and budget officials, including the InspectorsGeneral, or IGs, who report only to the agency head;
� OMB;
� congressional committees; and
� the General Accounting Office, an auditing arm of Congress.
This oversight is designed to:
� ensure that agencies comply with legal limits on spending, and that they usebudget authority only for the purposes intended;
� see that programs are operating consistently with legal requirements andexisting policy; and, finally,
� ensure that programs are well managed and achieving the intended results.
The Government has paid more attention to good management of late,through the work of Vice President Gore�s National Performance Review andimplementation of the 1993 Government Performance and Results Act. Thislaw is designed to improve Government programs by using bettermeasurements of their results in order to evaluate their effectiveness.
21
4. Deficits and the Debt
You�ve probably heard a lot about the Federal budget deficit and debt inrecent years, primarily because both exploded in size in the 1980s.
Put simply, a deficit occurs when spending exceeds revenues in any year�just as a surplus occurs when revenues exceed spending. Generally, tofinance our deficits, the Treasury borrows money. The debt is the sum totalof our deficits, minus our surpluses, over the years.
The deficit is not a new phenomenon; the Government incurred its first in1792, and it generated 70 annual deficits between 1900 and 1997.
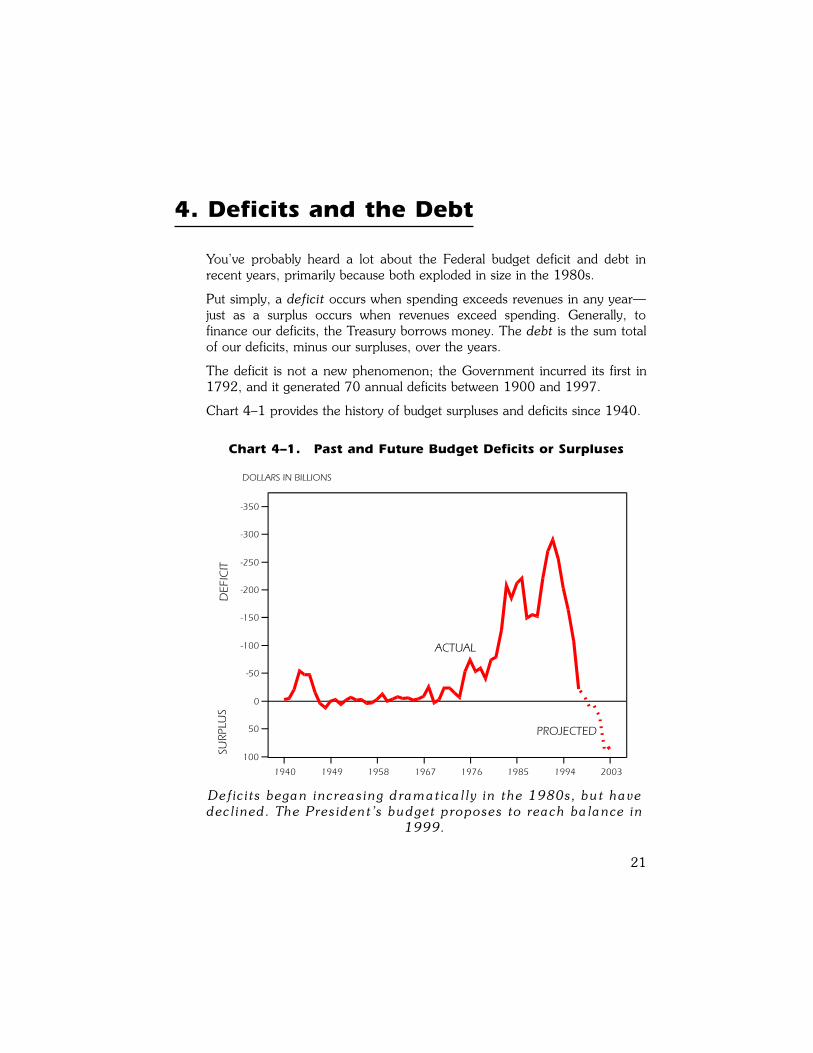
Chart 4�1 provides the history of budget surpluses and deficits since 1940.
1940 1949 1958 1967 1976 1985 1994 2003
-350
-300
-250
-200
-150
-100
-50
0
50
100
DOLLARS IN BILLIONS
ACTUAL
PROJECTED
SURP
LUS
DEF
ICIT
Deficits began increasing dramatica lly in the 1980s, but havedeclined. The President�s budget proposes to reach ba lance in
1999.
Chart 4�1. Past and Future Budget Deficits or Surpluses
For most of the Nation�s history, deficits were the result of either wars orrecessions. Wars necessitated major increases in military spending, whilerecessions reduced Federal tax revenues from businesses and individuals.
The Government generated deficits during the War of 1812, the recession of1837, the Civil War, the depression of the 1890s, and World War I. Oncethe war ended or the economy began to grow, the Government followed itsdeficits with budget surpluses, with which it paid down the debt.
Deficits returned in 1931 and remained for the rest of the decade�due tothe Great Depression and the spending associated with President Roosevelt�sNew Deal. Then, World War II forced the Nation to spend unprecedentedamounts on defense and to incur unprecedented deficits. Since then�withDemocratic and Republican Presidents, Democratic and RepublicanCongresses�the Government has balanced its books only eight times, mostrecently in 1969.
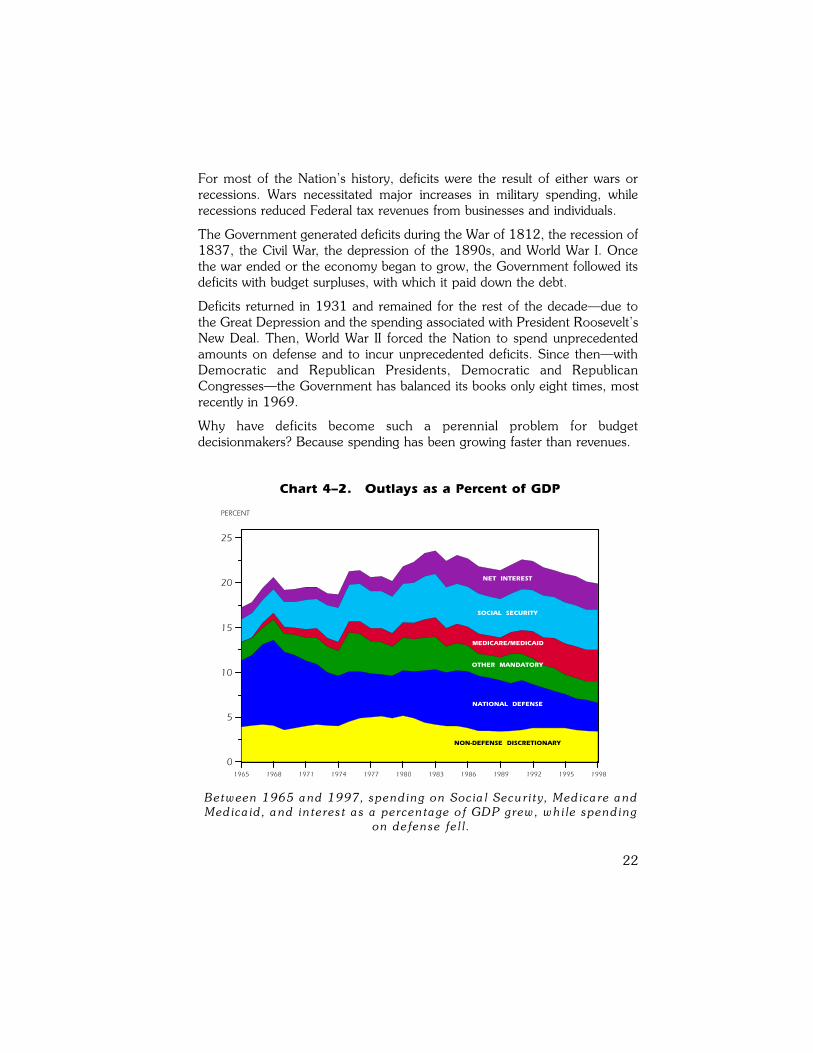
Why have deficits become such a perennial problem for budgetdecisionmakers? Because spending has been growing faster than revenues.
22
Between 1965 and 1997, spending on Socia l Security, Medicare andMedica id, and interest as a percentage of GDP grew, while spending
on defense fell.
1965 1968 1971 1974 1977 1980 1983 1986 1989 1992 1995 1998
0
5
10
15
20
25
PERCENT
NON-DEFENSE DISCRETIONARY
NATIONAL DEFENSE
OTHER MANDATORY
MEDICARE/MEDICAID
SOCIAL SECURITY
NET INTEREST
Chart 4�2. Outlays as a Percent of GDP
23
Revenues have stayed relatively constant, at around 17 to 20 percent ofGDP, since the 1960s. In that time, however, outlays have grown from about17 percent of GDP in 1965 to up to nearly 24 percent in 1983 before fallingto 20 percent today. Much of the spending growth has come in SocialSecurity, Medicare, Medicaid, and interest payments (see Chart 4�2).
Nevertheless, the deficits before 1981 paled in comparison to what followed.That year, the Government cut income tax rates and greatly increaseddefense spending, but it did not cut non-defense programs enough to makeup the difference. Also, the recession of the early 1980s reduced Federalrevenues, increased Federal outlays for unemployment insurance and similarprograms that are closely tied to economic conditions, and forced theGovernment to pay interest on more national debt at a time when interestrates were high. As a result, the deficit soared.
Why the Deficit is a Problem
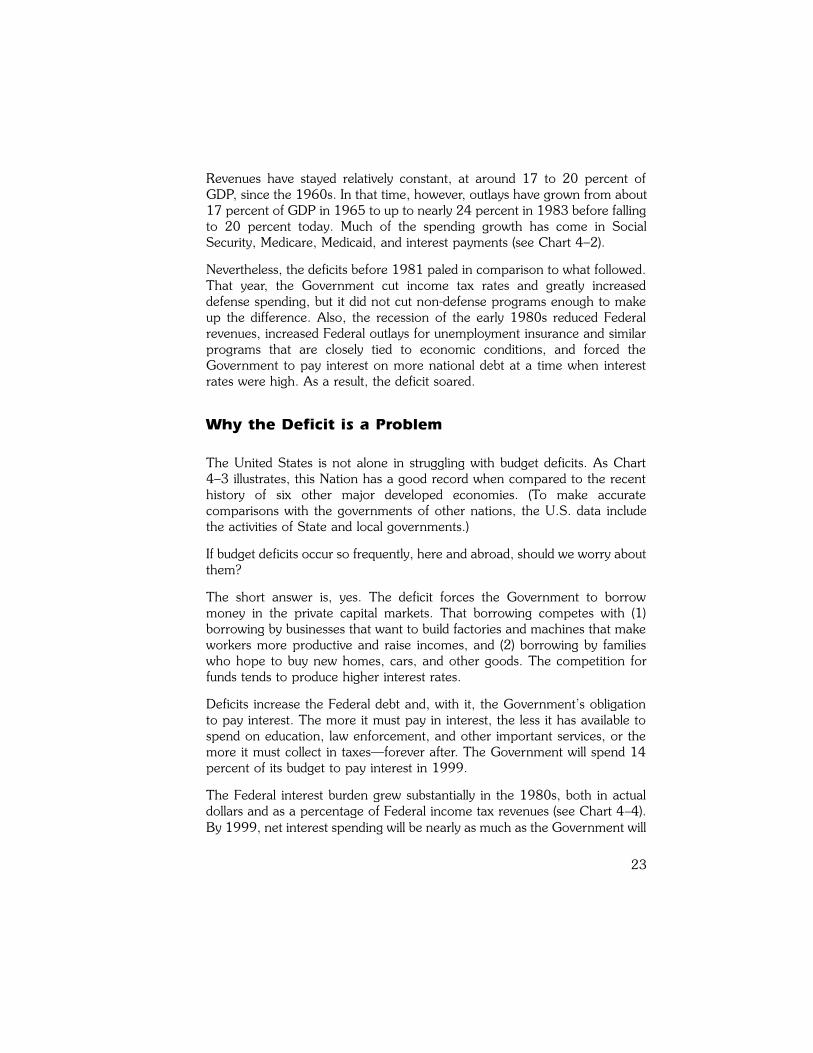
The United States is not alone in struggling with budget deficits. As Chart4�3 illustrates, this Nation has a good record when compared to the recenthistory of six other major developed economies. (To make accuratecomparisons with the governments of other nations, the U.S. data includethe activities of State and local governments.)
If budget deficits occur so frequently, here and abroad, should we worry aboutthem?
The short answer is, yes. The deficit forces the Government to borrowmoney in the private capital markets. That borrowing competes with (1)borrowing by businesses that want to build factories and machines that makeworkers more productive and raise incomes, and (2) borrowing by familieswho hope to buy new homes, cars, and other goods. The competition forfunds tends to produce higher interest rates.
Deficits increase the Federal debt and, with it, the Government�s obligationto pay interest. The more it must pay in interest, the less it has available tospend on education, law enforcement, and other important services, or themore it must collect in taxes�forever after. The Government will spend 14percent of its budget to pay interest in 1999.
The Federal interest burden grew substantially in the 1980s, both in actualdollars and as a percentage of Federal income tax revenues (see Chart 4�4).By 1999, net interest spending will be nearly as much as the Government will
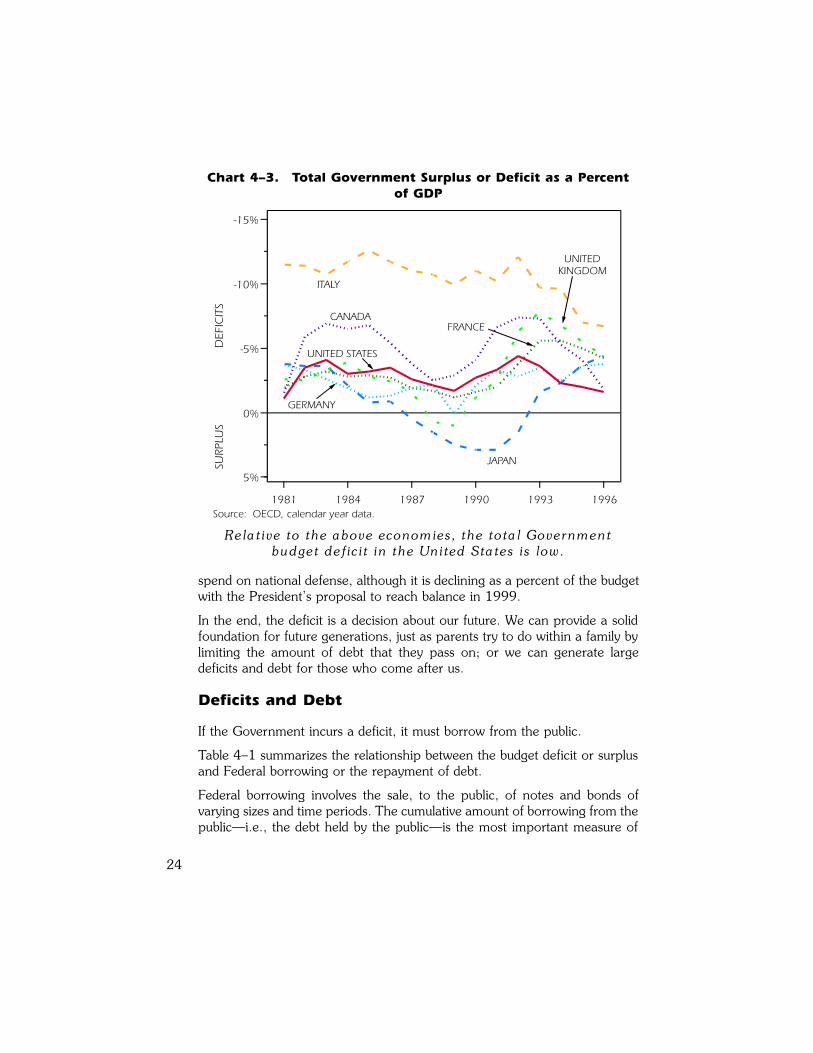
spend on national defense, although it is declining as a percent of the budgetwith the President�s proposal to reach balance in 1999.
In the end, the deficit is a decision about our future. We can provide a solidfoundation for future generations, just as parents try to do within a family bylimiting the amount of debt that they pass on; or we can generate largedeficits and debt for those who come after us.
Deficits and Debt
If the Government incurs a deficit, it must borrow from the public.
Table 4�1 summarizes the relationship between the budget deficit or surplusand Federal borrowing or the repayment of debt.
Federal borrowing involves the sale, to the public, of notes and bonds ofvarying sizes and time periods. The cumulative amount of borrowing from thepublic�i.e., the debt held by the public�is the most important measure of
24
1981 1984 1987 1990 1993 1996
-15%
-10%
-5%
0%
5%
DEF
ICIT
S
Source: OECD, calendar year data.
SURP
LUS
ITALY
UNITEDKINGDOM
CANADAFRANCE
GERMANY
UNITED STATES
JAPAN
Relative to the above economies, the tota l Governmentbudget deficit in the United States is low.
Chart 4�3. Total Government Surplus or Deficit as a Percentof GDP
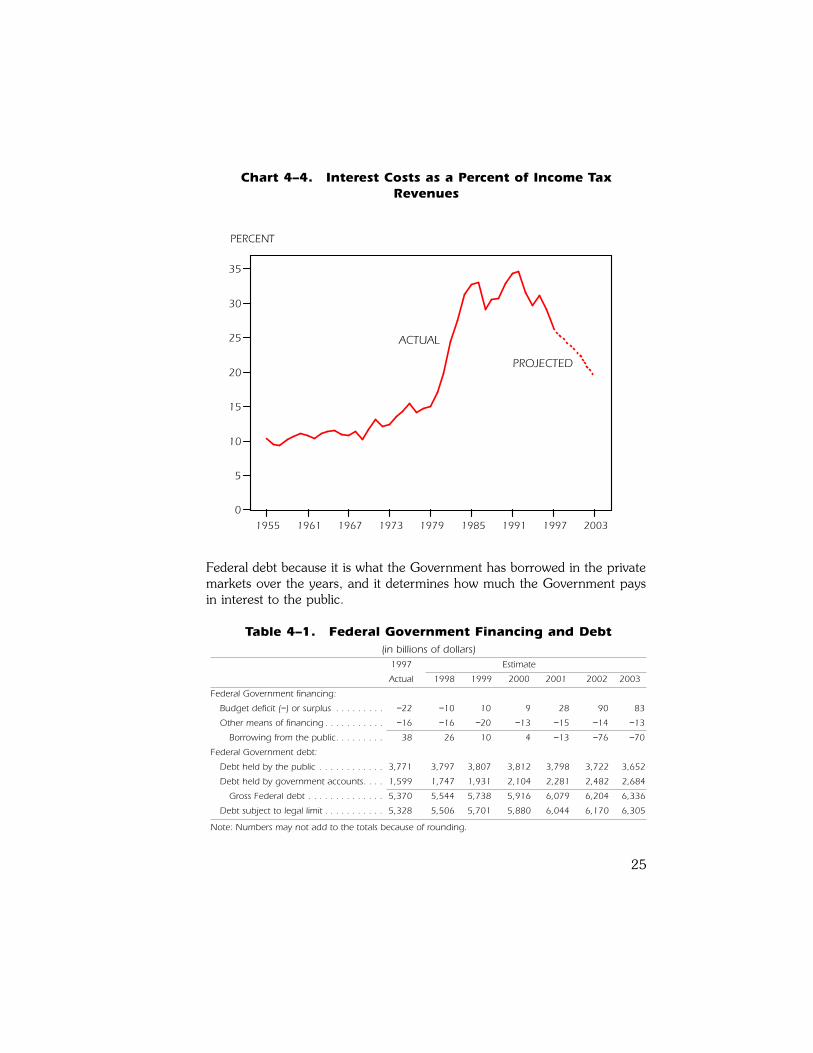
Federal debt because it is what the Government has borrowed in the privatemarkets over the years, and it determines how much the Government paysin interest to the public.
25
Chart 4�4. Interest Costs as a Percent of Income TaxRevenues
1955 1961 1967 1973 1979 1985 1991 1997 2003
0
5
10
15
20
25
30
35
PERCENT
ACTUAL
PROJECTED
Table 4�1. Federal Government Financing and Debt(in billions of dollars)
1997 Estimate
Actual 1998 1999 2000 2001 2002 2003
Federal Government financing:
Budget deficit (−) or surplus . . . . . . . . . −22 −10 10 9 28 90 83
Other means of financing . . . . . . . . . . . −16 −16 −20 −13 −15 −14 −13
Borrowing from the public. . . . . . . . . 38 26 10 4 −13 −76 −70
Federal Government debt:
Debt held by the public . . . . . . . . . . . . 3,771 3,797 3,807 3,812 3,798 3,722 3,652
Debt held by government accounts. . . . 1,599 1,747 1,931 2,104 2,281 2,482 2,684
Gross Federal debt . . . . . . . . . . . . . . 5,370 5,544 5,738 5,916 6,079 6,204 6,336
Debt subject to legal limit . . . . . . . . . . . 5,328 5,506 5,701 5,880 6,044 6,170 6,305
Note: Numbers may not add to the totals because of rounding.
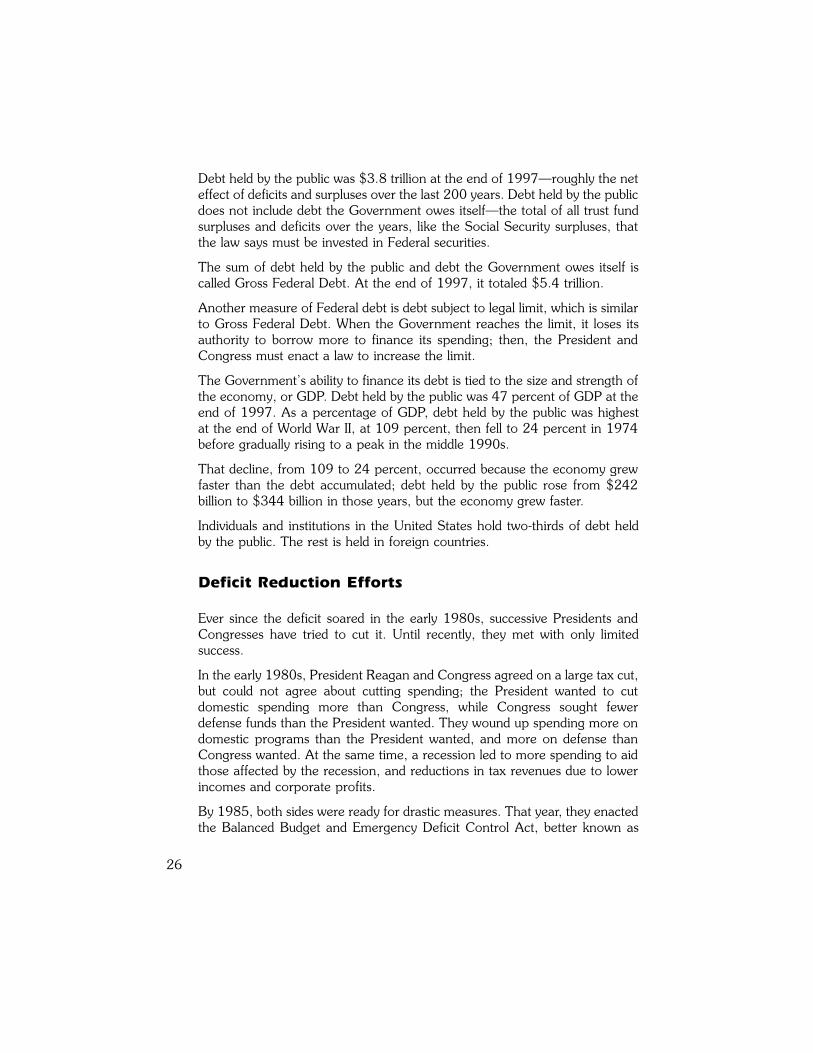
Debt held by the public was $3.8 trillion at the end of 1997�roughly the neteffect of deficits and surpluses over the last 200 years. Debt held by the publicdoes not include debt the Government owes itself�the total of all trust fundsurpluses and deficits over the years, like the Social Security surpluses, thatthe law says must be invested in Federal securities.
The sum of debt held by the public and debt the Government owes itself iscalled Gross Federal Debt. At the end of 1997, it totaled $5.4 trillion.
Another measure of Federal debt is debt subject to legal limit, which is similarto Gross Federal Debt. When the Government reaches the limit, it loses itsauthority to borrow more to finance its spending; then, the President andCongress must enact a law to increase the limit.
The Government�s ability to finance its debt is tied to the size and strength ofthe economy, or GDP. Debt held by the public was 47 percent of GDP at theend of 1997. As a percentage of GDP, debt held by the public was highestat the end of World War II, at 109 percent, then fell to 24 percent in 1974before gradually rising to a peak in the middle 1990s.
That decline, from 109 to 24 percent, occurred because the economy grewfaster than the debt accumulated; debt held by the public rose from $242billion to $344 billion in those years, but the economy grew faster.
Individuals and institutions in the United States hold two-thirds of debt heldby the public. The rest is held in foreign countries.
Deficit Reduction Efforts
Ever since the deficit soared in the early 1980s, successive Presidents andCongresses have tried to cut it. Until recently, they met with only limitedsuccess.
In the early 1980s, President Reagan and Congress agreed on a large tax cut,but could not agree about cutting spending; the President wanted to cutdomestic spending more than Congress, while Congress sought fewerdefense funds than the President wanted. They wound up spending more ondomestic programs than the President wanted, and more on defense thanCongress wanted. At the same time, a recession led to more spending to aidthose affected by the recession, and reductions in tax revenues due to lowerincomes and corporate profits.
By 1985, both sides were ready for drastic measures. That year, they enactedthe Balanced Budget and Emergency Deficit Control Act, better known as
26
Gramm-Rudman-Hollings (GRH). It set annual deficit targets for five years,declining to a balanced budget in 1991. If necessary, GRH required across-the-board cuts in programs to comply with the deficit targets.
Faced with the prospect of huge spending cuts in 1987, however, thePresident and Congress amended the law, postponing a balanced budget until1993. The President and Congress never achieved those revised targets, inpart because of the extraordinary costs of returning the Nation�s savings andloan industry to a sound financial footing.
By 1990, President Bush and Congress enacted spending cuts and taxincreases that were designed to cut the accumulated deficits by about $500billion over five years. They also enacted the Budget Enforcement Act(BEA)�rather than set annual deficit targets, the BEA was designed to limitdiscretionary spending while ensuring that any new entitlement programs ortax cuts did not make the deficit worse.
First, the BEA set annual limits on total discretionary spending for defense,international affairs, and domestic programs. Second, it created ``pay-as-you-go�� rules for entitlements and taxes: those who proposed new spending onentitlements or lower taxes were forced to offset the costs by cutting otherentitlements or raising other taxes.
For what it was designed to do, the law worked. It did, in fact, limitdiscretionary spending and force proponents of new entitlements and tax cutsto find ways to finance them. But the deficit, which Government and privateexperts said would fall, actually rose.
Why? Because the recession of the early 1990s reduced individual andcorporate tax revenues and increased spending that is tied to economicfluctuations. Federal health care spending also continued to grow rapidly.
In 1993, President Clinton and the Congress made another effort to cut thedeficit. They enacted a five-year deficit reduction package of spending cutsand higher revenues. The law was designed to cut the accumulated deficitsfrom 1994 to 1998 by about $500 billion. The new law extended the limitson discretionary spending and the �pay-as-you-go�� rules.
Clearly, the President�s deficit reduction efforts have paid off. The deficit fellfrom $290 billion in 1992 to $22 billion in 1997, and by nearly 95 percentas a share of GDP, to 0.3 percent.
Although the 1993 plan had exceeded all expectations in reducing the deficit,the task of reaching balance would require one final push. That would come
27
with the historic 1997 Balanced Budget Act (BBA), on which the Presidentand Congress agreed last summer.
Originally designed to balance the budget by 2002, the BBA provided for$247 billion in savings over five years. It also extended the solvency ofMedicare�s trust fund for at least 10 years while providing for the largestinvestment in higher education since the G.I. Bill in 1945, the largestinvestment in children�s health care since the creation of Medicaid in 1965,and a $500-per-child tax credit for about 27 million working families.
The President is now proposing to balance the budget three years ahead ofschedule, in 1999, but the challenge for both the President and Congress isthe same: keeping the budget in balance while continuing to invest in theAmerican people. The next chapter describes the President�s plans forachieving that goal.
28
5. THE PRESIDENT�S 1999 BUDGET
The President�s balanced budget builds on his efforts to invest in the skills ofthe American people. It continues his policy of helping working families withtheir basic needs�raising their children, sending them to college, and payingfor health care. It also invests in education and training, the environment,science and technology, and other priorities to help raise the standard ofliving and quality of life of average Americans.
Within tight constraints, the budget proposes major initiatives that willcontinue the President�s investments in high-priority areas�from helpingworking families with their child care expenses to allowing Americans aged55 to 65 to buy into Medicare; from helping States and school districts recruitand prepare thousands more teachers and build thousands more classroomsto addressing the world-wide problem of global warming. The budget pays forevery initiative�in the President�s words, �line by line, dime by dime.�
Investing in the Future
For the President, balancing the budget is not an end in itself. Instead, it helpsfulfill his main economic goal�to raise the standard of living for averageAmericans, both now and in the future. So do his investment priorities.
The budget continues the President�s commitment to helping workingfamilies balance the demands of work and family with a major effort to makechild care more affordable, accessible, and safe. It proposes a Child CareInitiative that would provide tax breaks to help families pay for care; taxincentives to help businesses create or expand child care facilities; directsubsidies for over two million poor or near-poor children; increased fundingfor before- and after-school programs; and funds to help States enforce safetyand quality, to train child care staff, to promote early childhood development,and to improve the health of young children in child care. Also to helpworking families, the budget proposes tax incentives to encourage smallbusinesses to create pension plans for more workers.
For health care, the budget proposes initiatives to expand health carecoverage and improve the Nation�s health. It would give new insuranceoptions to hundreds of thousands of Americans aged 55 to 65 and itproposes new initiatives to ensure that as many uninsured children as possible
29
are covered. In addition, the budget provides for unprecedented investmentsin biomedical research at the National Institutes of Health; advocatesbipartisan national legislation that would reduce tobacco use among theyoung; expands access to new AIDS therapies through the Ryan Whiteprogram; enables more Medicare recipients to receive promising cancertreatments by participating more easily in �clinical trials�; expands substanceabuse prevention and treatment activities; and enhances food safety. It alsofunds full participation in the Special Supplemental Nutrition Program forWomen, Infants, and Children (WIC), which will provide benefits to 7.5million people by the end of 1999.
Continuing the President�s efforts to enhance access to, and the quality of,education and training, the budget takes the next step�helping States andschool districts to reduce class size by recruiting and preparing thousandsmore teachers and building thousands more classrooms; and creating newEducation Opportunity Zones to provide needed support for high-poverty,low-achieving urban and rural districts while holding them accountable toboost student achievement. The budget also proposes to move further towardthe President�s commitment to put a million disadvantaged children in HeadStart by 2002; begin field testing voluntary national tests; mobilize and trainreading tutors for children; help parents, teachers, and communities createmore charter schools that are free of most State regulations; integratetechnology into the classroom as we connect every classroom to the Internet;enable more Americans to serve their communities and earn money forcollege; expand college work-study to a million students; make it easier forparents and students to borrow and repay college loans; raise the maximumPell Grant college scholarship to its highest level ever; expand assistance toworkers dislocated as a result of global trade and technological change;increase G.I. Bill educational benefits for veterans; and expand resources forveterans who lose their jobs.
For the environment, the budget builds on the President�s efforts to addressclimate change by proposing tax incentives and spending that will spurenergy efficiency and help develop low-carbon emission energy sources. Itincludes incentives for buying new, highly fuel-efficient cars with technologiesto reduce carbon emissions; for investing in energy-saving equipment forcommercial and residential buildings; for commuting by public transit orvanpool; and for developing innovative energy generation techniques, suchas biomass, wind, and photovoltaics. The budget also would restore andrehabilitate national parks, forests, and public lands and facilities; expandefforts to restore and protect the water quality of rivers and lakes; continueefforts to double the pace of Superfund clean-ups; extend the Brownfields
30
initiative to promote local cleanup and redevelopment; better protectendangered species; continue to restore Florida�s Everglades and California�sBay-Delta and protect Yellowstone National Park and California�sHeadwaters Forest; improve the roads through national parks; and expandthe public�s access to information about environmental conditions in theirneighborhoods.
The budget invests heavily in basic and applied research. Along withincreasing funds for biomedical research at the National Institutes of Health,the budget would promote science and engineering research at the NationalScience Foundation; support space-related activities that enhance ourknowledge of Earth; invest in Federal-private ventures to more quicklydevelop cutting-edge technologies that create jobs; strengthen university-based research; invest in environmental research on safe food and clean airand water; expand support for energy efficiency and renewable energyprograms; enable Americans to travel more safely, more quickly, and moreefficiently; and put commercial industry�s technical know-how and economiesof scale to work for national defense.
Challenging times demand innovative solutions, and this budget meets thechallenge by proposing three new investment funds for America�forresearch, the environment, and transportation�that will focus attention onthese critical priorities. Together, the funds provide $75.5 billion, a $4.7billion increase over the 1998 level for the programs they contain.
� The Research Fund for America , which includes a broad range ofinvestments in knowledge, including programs of the National Institutes ofHealth, the Centers for Disease Control and Prevention, the NationalScience Foundation, the National Aeronautics and Space Administration,the Energy Department, the Commerce Department�s National Institute ofStandards and Technology, Agriculture Department research programs,the multi-agency Climate Change Technology Initiative, and otherprograms. The budget finances this Fund, in part, through receipts fromtobacco legislation and savings in mandatory programs.
� The Environmenta l Resources Fund for America , whichencompasses the multi-agency Clean Water Initiative; the new Land,Water, and Facility Restoration Initiative of the Interior and AgricultureDepartments; the Agriculture Department�s water and wastewaterprogram for rural communities; and the Environmental ProtectionAgency�s programs for cleaning up hazardous waste sites (within theSuperfund) and upgrading clean water and safe drinking water
31
infrastructure. The budget finances the Fund, in part, through an extensionof Federal taxes that support the Superfund.
� The Transporta tion Fund for America , which includes theTransportation Department�s highway, highway safety, and transitprograms; the Flight 2000 free flight demonstration program; and theFederal Aviation Administration�s programs, including Airport Grants. Thebudget finances the Fund, in part, through a new Federal aviation user fee.
Improving Performance Through Better Management
The President has challenged the Federal Government to do more with less�and with good reason.
Departments and agencies, which once could count on more funds from yearto year, no longer can; indeed, with the Administration committed tobalancing the budget, some agencies will get less. But public demands formore and better services have not shrunk. Americans continue to want goodschools, a clean environment, high-quality health care, and secure retirementbenefits. Thus, the Government must satisfy these demands by managingbetter and improving the performance of programs.
The Administration has answered the call. Vice President Gore, working withthe departments, agencies, and inter-agency working groups, and drawing onthe expertise of the private sector, has led an unprecedented effort to cut thesize of the Federal Government and make it more efficient and effective.Through these reinvention efforts, the Administration has saved $137 billionover the last five years.
The Administration has cut the civilian Federal work force by over 316,000employees, creating the smallest work force in 35 years and, as a share oftotal civilian employment, the smallest work force since 1931 (see Chart5�1). Almost all of the 14 Cabinet Departments have cut their work forces;only the Justice Department�s work force is growing due to theAdministration�s expanded war on crime and drugs, while the CommerceDepartment�s work force is growing due to the decennial census.
In addition, the Vice President has challenged the leaders of 32 agencies,with over 1.4 million full-time equivalent positions, to commit to achievingsignificant, concrete, measurable goals over the next three years. These�High Impact Agencies� include the Immigration and Naturalization Service,National Park Service, and Social Security Administration.
32
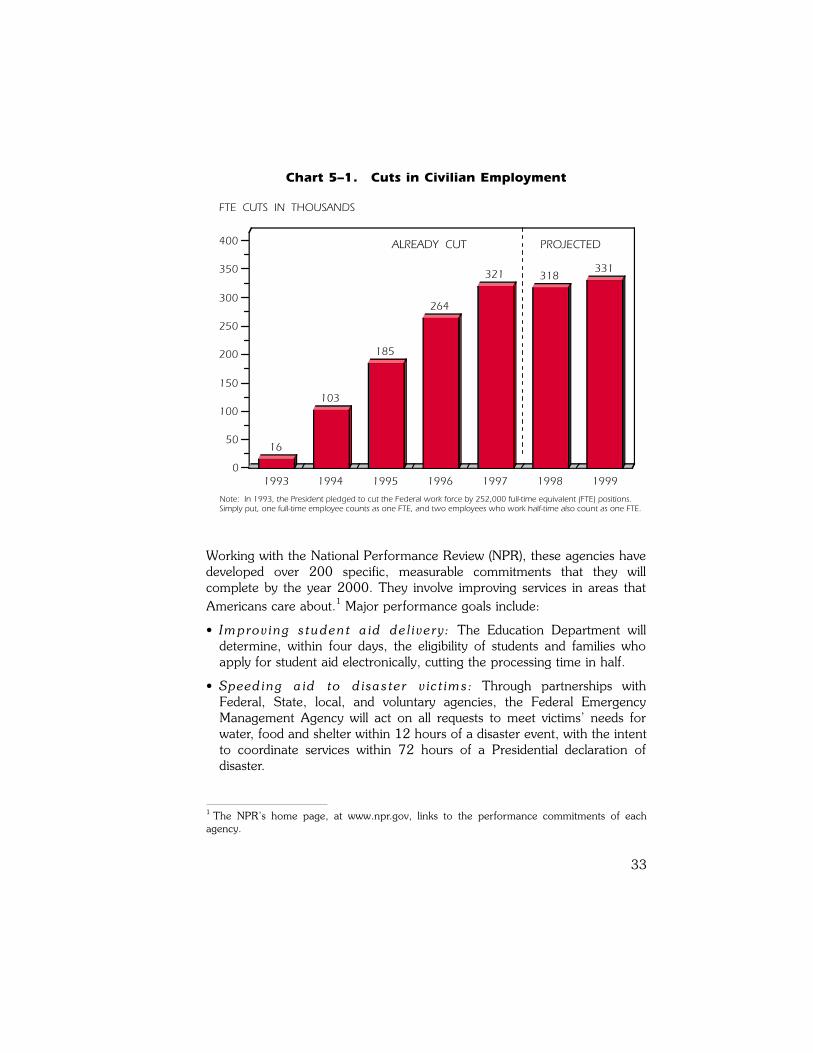
Working with the National Performance Review (NPR), these agencies havedeveloped over 200 specific, measurable commitments that they willcomplete by the year 2000. They involve improving services in areas thatAmericans care about.1 Major performance goals include:
� Improving student a id delivery: The Education Department willdetermine, within four days, the eligibility of students and families whoapply for student aid electronically, cutting the processing time in half.
� Speeding a id to disaster victims: Through partnerships withFederal, State, local, and voluntary agencies, the Federal EmergencyManagement Agency will act on all requests to meet victims� needs forwater, food and shelter within 12 hours of a disaster event, with the intentto coordinate services within 72 hours of a Presidential declaration ofdisaster.
33
16
103
185
264
321 318331
1993 1994 1995 1996 1997 1998 19990
50
100
150
200
250
300
350
400
FTE CUTS IN THOUSANDS
Note: In 1993, the President pledged to cut the Federal work force by 252,000 full-time equivalent (FTE) positions. Simply put, one full-time employee counts as one FTE, and two employees who work half-time also count as one FTE.
ALREADY CUT PROJECTED
Chart 5�1. Cuts in Civilian Employment
1 The NPR�s home page, at www.npr.gov, links to the performance commitments of eachagency.
� Finding the right agency on the first try: The General ServicesAdministration will restructure Federal listings in the blue pages of localtelephone books, ensuring that Americans can find the Governmentservice they need the first time they look.
� Reducing time for clearance at U.S. a irports: Working with theAgriculture Department and the Customs Service, the JusticeDepartment�s Immigration and Naturalization Service will clearinternational passengers at airports in 30 minutes or less while improvingenforcement and regulatory processing.
� Reducing injury and illnesses in the workplace: The LaborDepartment�s Occupational Safety and Health Administration will cutinjury and illness rates by a fifth in at least 50,000 of the most hazardousworkplaces.
� Increasing access to Federa l recreation opportunities: TheNational Park Service will create, with other Federal natural resourceagencies, an integrated Nation-wide outdoor recreation information systemthat gives all Americans electronic access to information about recreationon Federal lands, recreation use permits, and reservations.
� Speeding Socia l Security information: The Social SecurityAdministration will provide overnight electronic Social Security numberverification for employers. Today, verification can take up to two weeks.
Already, agencies are assessing what their programs actually accomplish andwhat they must do to improve their performance.
Under the 1993 Government Performance and Results Act, Cabinetdepartments and agencies have prepared individual performance plans thatthey will send to Congress with the performance goals they plan to meet in1999. These plans, in turn, form the basis for the first Government-wideperformance plan, which the Administration is sending to Congress alongwith the budget.
This plan is a good first step in the area of performance measurement, andthe President is committed to working with Congress to help agenciescontinue to improve their performance in a balanced budget world.
34
Glossary
Appropriation
An appropriation is an act of Congress that enables Federal agencies tospend money for specific purposes.
Authorization
An authorization is an act of Congress that establishes or continues aFederal program or agency, and sets forth the guidelines to which it mustadhere.
Balanced Budget
A balanced budget occurs when total revenues equal total outlays for afiscal year.
Budget Authority (BA)
Budget authority is what the law authorizes, or allows, the FederalGovernment to spend for programs, projects, or activities.
Budget Enforcement Act (BEA) of 1990
The BEA is the law that was designed to limit discretionary spendingwhile ensuring that any new entitlement program or tax cuts did notmake the deficit worse. It set annual limits on total discretionary spendingand created �pay-as-you-go�� rules for any changes in entitlements andtaxes. (See �pay-as-you-go.��)
Balanced Budget and Emergency Deficit Control Act of 1985(Gramm-Rudman-Hollings, or GRH)
The Balanced Budget and Emergency Deficit Control Act of 1985 wasdesigned to end deficit spending. It set annual deficit targets for fiveyears, declining to a balanced budget in 1991. If necessary, it requiredacross-the-board cuts in programs to comply with the deficit targets. Itwas never fully implemented.
Budget Resolution
The budget resolution is the annual framework within which Congressmakes its decisions about spending and taxes. This framework includestargets for total spending, total revenues, and the deficit, as well as
35
allocations, within the spending target, for discretionary and mandatoryspending.
�Cap��
A �cap�� is a legal limit on annual discretionary spending.
Deficit
The deficit is the difference produced when spending exceeds revenuesin a fiscal year.
Discretionary Spending
Discretionary spending is what the President and Congress must decideto spend for the next fiscal year through 13 annual appropriations bills.Examples include money for such activities as the FBI and the CoastGuard, housing and education, space exploration and highwayconstruction, and defense and foreign aid.
Entitlement
An entitlement is a program that legally obligates the FederalGovernment to make payments to any person who meets the legalcriteria for eligibility. Examples include Social Security, Medicare, andMedicaid.
Excise Taxes
Excise taxes apply to various products, including alcohol, tobacco,transportation fuels, and telephone service.
Federal Debt
The gross Federal debt is divided into two categories: debt held by thepublic, and debt the Government owes itself. Another category is debtsubject to legal limit.
Debt Held by the Public
Debt held by the public is the total of all Federal deficits, minussurpluses, over the years. This is the cumulative amount of money theFederal Government has borrowed from the public, through the saleof notes and bonds of varying sizes and time periods.
Debt the Government Owes Itself
Debt the Government owes itself is the total of all trust fund surplusesover the years, like the Social Security surpluses, that the law says mustbe invested in Federal securities.
36
Debt Subject to Legal Limit
Debt subject to legal limit, which is roughly the same as gross Federaldebt, is the maximum amount of Federal securities that may be legallyoutstanding at any time. When the limit is reached, the President andCongress must enact a law to increase it.
Fiscal Year
The fiscal year is the Government�s accounting period. It begins October1 and ends on September 30. For example, fiscal 1999 ends September30, 1999.
Gramm-Rudman-Hollings
See Balanced Budget and Emergency Deficit Control Act of 1985.
Gross Domestic Product (GDP)
GDP is the standard measurement of the size of the economy. It is thetotal production of goods and services within the United States.
Mandatory Spending
Mandatory spending is authorized by permanent law. An example isSocial Security. The President and Congress can change the law tochange the level of spending on mandatory programs�but they don�thave to.
�Off-Budget��
By law, the Government must distinguish �off-budget�� programsseparate from the budget totals. Social Security and the Postal Serviceare �off-budget.��
Outlays
Outlays are the amount of money the Government actually spends in agiven fiscal year.
�Pay-As-You-Go��
Set forth by the BEA, �pay-as-you-go�� refers to requirements that newspending proposals on entitlements or tax cuts must be offset by cuts inother entitlements or by other tax increases, to ensure that the deficitdoes not rise. (See BEA.)
Revenue
Revenue is money collected by the Government.
37
Social Insurance Payroll Taxes
This tax category includes Social Security taxes, Medicare taxes,unemployment insurance taxes, and Federal employee retirementpayments.
Surplus
A surplus is the amount by which revenues exceed outlays.
Trust Funds
Trust funds are Government accounts, set forth by law as trust funds, forrevenues and spending designated for specific purposes.
Unified Federal Budget
The unified budget, the most useful display of the Government�sfinances, is the presentation of the Federal budget in which revenuesfrom all sources and outlays to all activities are consolidated.
38
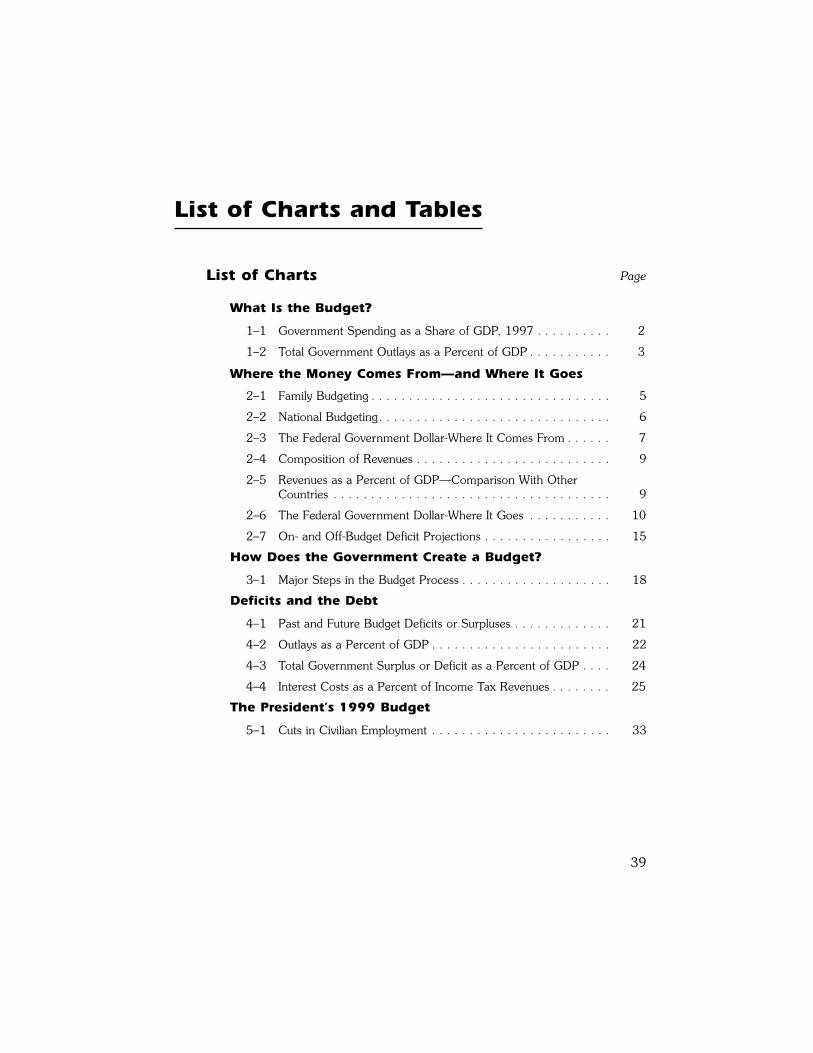
List of Charts and Tables
List of Charts Page
What Is the Budget?
1�1 Government Spending as a Share of GDP, 1997 . . . . . . . . . . 2
1�2 Total Government Outlays as a Percent of GDP . . . . . . . . . . . 3
Where the Money Comes From�and Where It Goes
2�1 Family Budgeting . . . . . . . . . . . . . . . . . . . . . . . . . . . . . . . . 5
2�2 National Budgeting. . . . . . . . . . . . . . . . . . . . . . . . . . . . . . . 6
2�3 The Federal Government Dollar-Where It Comes From . . . . . . 7
2�4 Composition of Revenues . . . . . . . . . . . . . . . . . . . . . . . . . . 9
2�5 Revenues as a Percent of GDP�Comparison With Other Countries . . . . . . . . . . . . . . . . . . . . . . . . . . . . . . . . . . . . . 9
2�6 The Federal Government Dollar-Where It Goes . . . . . . . . . . . 10
2�7 On- and Off-Budget Deficit Projections . . . . . . . . . . . . . . . . . 15
How Does the Government Create a Budget?
3�1 Major Steps in the Budget Process . . . . . . . . . . . . . . . . . . . . 18
Deficits and the Debt
4�1 Past and Future Budget Deficits or Surpluses . . . . . . . . . . . . . 21
4�2 Outlays as a Percent of GDP . . . . . . . . . . . . . . . . . . . . . . . . 22
4�3 Total Government Surplus or Deficit as a Percent of GDP . . . . 24
4�4 Interest Costs as a Percent of Income Tax Revenues . . . . . . . . 25
The President�s 1999 Budget
5�1 Cuts in Civilian Employment . . . . . . . . . . . . . . . . . . . . . . . . 33
39
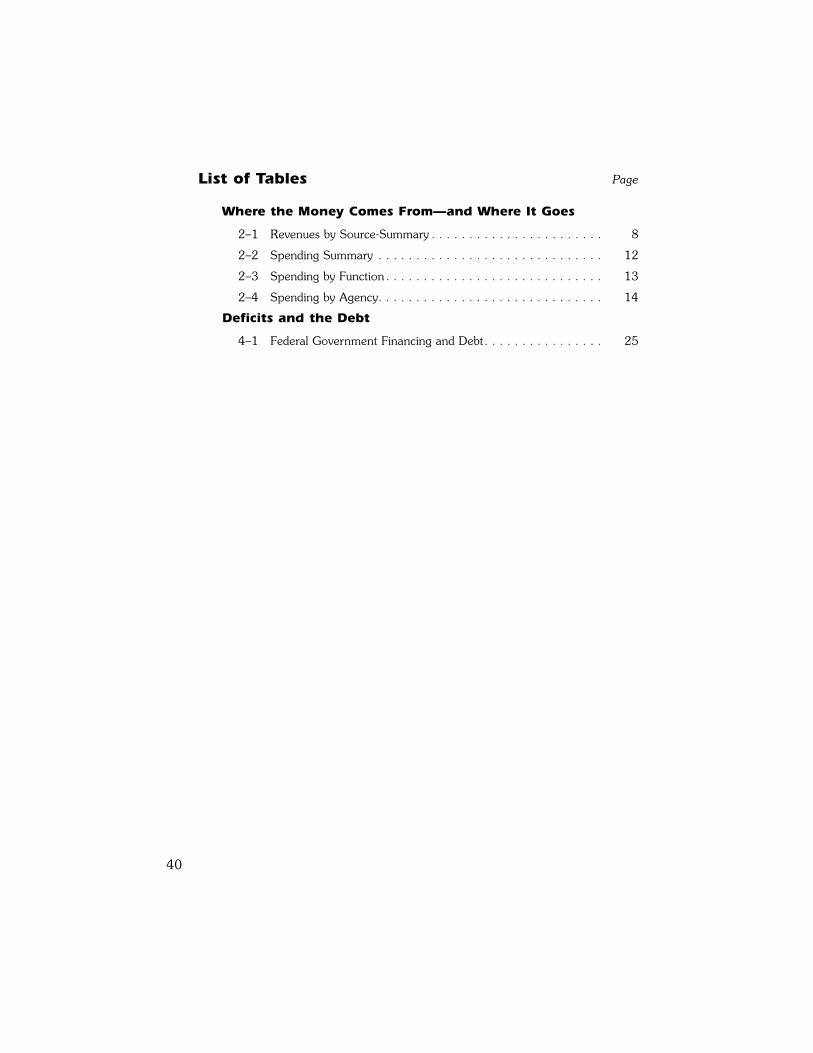
List of Tables Page
Where the Money Comes From�and Where It Goes
2�1 Revenues by Source-Summary . . . . . . . . . . . . . . . . . . . . . . . 8
2�2 Spending Summary . . . . . . . . . . . . . . . . . . . . . . . . . . . . . . 12
2�3 Spending by Function . . . . . . . . . . . . . . . . . . . . . . . . . . . . . 13
2�4 Spending by Agency. . . . . . . . . . . . . . . . . . . . . . . . . . . . . . 14
Deficits and the Debt
4�1 Federal Government Financing and Debt. . . . . . . . . . . . . . . . 25
40