Embed Size (px)
Citation preview
A CITIZEN’S GUIDE TO
THE FEDERAL BUDGET
Fiscal Year 2001
BUDGET OF THE UNITED STATES GOVERNMENT
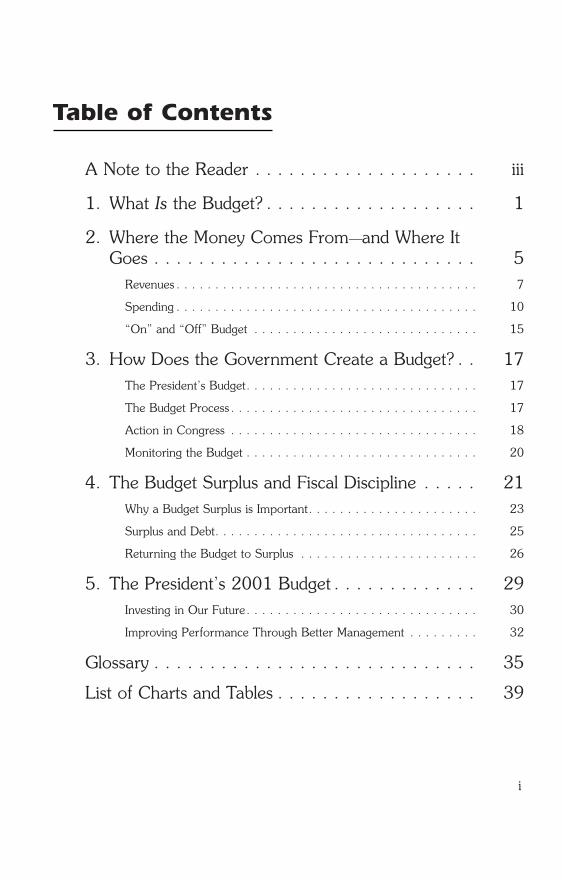
Table of Contents
A Note to the Reader . . . . . . . . . . . . . . . . . . . . iii
1. What Is the Budget? . . . . . . . . . . . . . . . . . . . 1
2. Where the Money Comes From�and Where ItGoes . . . . . . . . . . . . . . . . . . . . . . . . . . . . . 5
Revenues . . . . . . . . . . . . . . . . . . . . . . . . . . . . . . . . . . . . . . . 7
Spending . . . . . . . . . . . . . . . . . . . . . . . . . . . . . . . . . . . . . . . 10
�On� and �Off� Budget . . . . . . . . . . . . . . . . . . . . . . . . . . . . . 15
3. How Does the Government Create a Budget? . . 17The President�s Budget. . . . . . . . . . . . . . . . . . . . . . . . . . . . . . 17
The Budget Process . . . . . . . . . . . . . . . . . . . . . . . . . . . . . . . . 17
Action in Congress . . . . . . . . . . . . . . . . . . . . . . . . . . . . . . . . 18
Monitoring the Budget . . . . . . . . . . . . . . . . . . . . . . . . . . . . . . 20
4. The Budget Surplus and Fiscal Discipline . . . . . 21Why a Budget Surplus is Important. . . . . . . . . . . . . . . . . . . . . . 23
Surplus and Debt. . . . . . . . . . . . . . . . . . . . . . . . . . . . . . . . . . 25
Returning the Budget to Surplus . . . . . . . . . . . . . . . . . . . . . . . 26
5. The President�s 2001 Budget . . . . . . . . . . . . . 29Investing in Our Future. . . . . . . . . . . . . . . . . . . . . . . . . . . . . . 30
Improving Performance Through Better Management . . . . . . . . . 32
Glossary . . . . . . . . . . . . . . . . . . . . . . . . . . . . . 35
List of Charts and Tables . . . . . . . . . . . . . . . . . . 39
i
GUIDE01.QXD 2/2/2000 2:41 PM Page i
iii
A Note to the Reader
Next year, your Federal Government will spend over $1.8 trillion.
Needless to say, that�s a lot of money. And the Government spends it on lotsof things�on programs as large and popular as Social Security, and onactivities as small and unknown as repairs to the National Zoo. Together,these programs are what make up the Federal budget.
How much do you know about the budget? If your answer is �not much,�you�re not alone. In fact, hardly anybody knows everything that�s in thethousands of pages, and several books, that make up the budget each year.
But we know you care a lot about how the Government spends your money.That�s why we created A Citizen�s Guide to the Federal Budget five yearsago, and why we have published this sixth edition. With it, we hope to makethe budget more accessible and understandable.
The Guide is designed to give you a walking tour of the budget. In thesepages, we will outline for you how the Government raises revenues andspends money, how the President and Congress enact the budget, how wehave been able to move from deficit to surplus, and what the President hopesto accomplish with his 2001 budget.
After you read these pages, we hope that you will think the tour was worthyour time.
GUIDE01.QXD 2/2/2000 2:41 PM Page iii
1
1. What Is the Budget?
The Federal budget is:
· a plan for how the Government spends your money.
What activities are funded? How much does it spend for defense,national parks, the FBI, Medicare, and meat and fish inspection?
· a plan for how the Government pays for its activities.
How much revenue does it raise through different kinds of taxes�income taxes, excise taxes, and social insurance payroll taxes?
· a plan for Government borrowing or repayment of borrowing.
If revenues are greater than spending, the Government runs a surplus.When there is a surplus, the Government can reduce the national debt.
· something that affects the Nation�s economy.
Some types of spending�such as improvements in education andsupport for science and technology�increase productivity and raiseincomes in the future.
Taxes, on the other hand, reduce incomes, leaving people with lessmoney to spend.
· something that is affected by the Nation�s economy.
When the economy is doing well, people are earning more andunemployment is low. In this atmosphere, revenues increase and thedeficit shrinks.
· an historical record.
The budget reports on how the Government has spent money in thepast, and how that spending was financed.
The 2001 Budget is a document that embodies the President�s budgetproposal to Congress for fiscal 2001, the fiscal year that begins on October1, 2000. It reflects the President�s priorities and proposes that Social Securitybe protected and solvency of the trust funds extended. With enactment ofthese reforms, as well as strengthening of Medicare, additional resources
GUIDE01.QXD 2/2/2000 2:41 PM Page 1
would be made available for national needs, including health care initiativesand a tax cut.
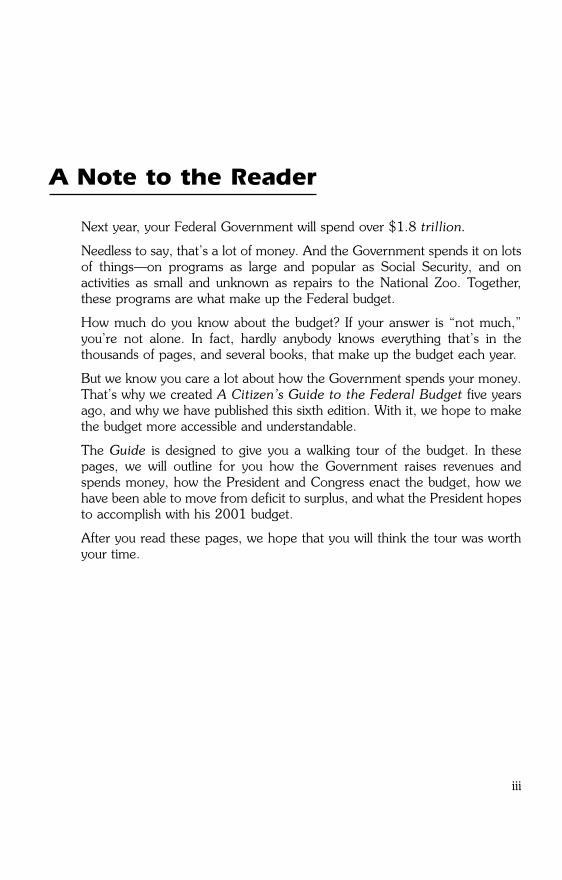
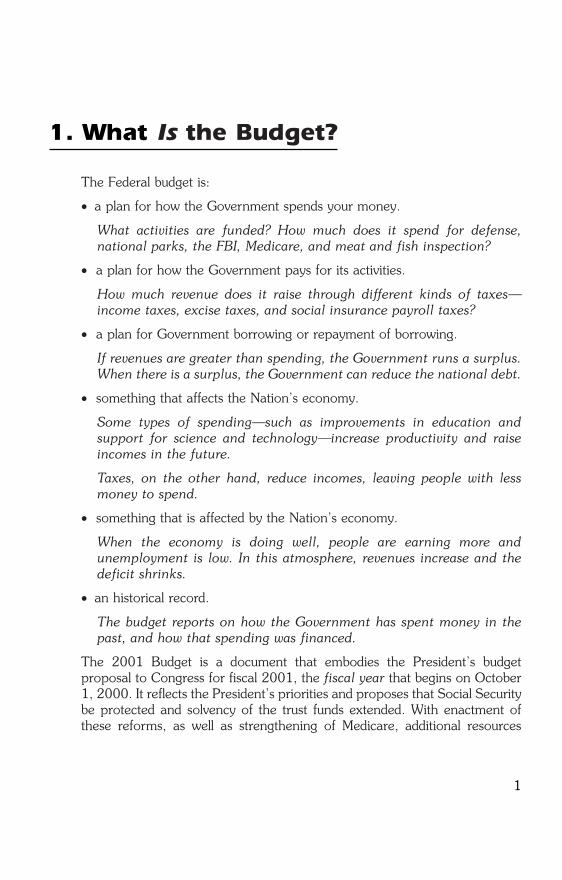
The Federal budget, of course, is not the only budget that affects theeconomy or the American people. The budgets of State and localgovernments have an impact as well. While Federal Government spendingwas a little less than 19 percent of the Gross Domestic Product (or GDP,which measures the size of the economy) in 1999, State and localgovernments spending was about another nine percent (see Chart 1�1).
State and local governments are independent of the Federal Government,and they have their own sources of revenue (taxes and borrowing). But theFederal Government supplements State and local revenues by making grantsto them. Of the $1,072 billion that State and local governments spent in1999, $220 billion came from Federal grants.
2
Pie 1
00
1100
2200
3300
4400
5500
6600
7700
8800
9900
110000
Total Federal Spending (19%)
SSppeennddiinngg ffoorr DDiirreeccttFFeeddeerraall PPrrooggrraammss
((1166%%))
SSppeennddiinngg ffrroomm SSttaattee aanndd LLooccaall RReevveennuueess ((99%%))
Note: Numbers do not add due to rounding.
PPrriivvaattee7722%%
Total State andLocal Spending (12%)GGoovveerrnnmmeenntt
2288%%
Total GovernmentSpending in the U.S. (28%)
Federal Grants to State and Local Governments (2%)
Chart 1�1. Government Spending as a Share of GDP, 1999
Total Government spending accounts for less than one-thirdof the national economy. Federal spending is about two-thirds
of this amount, or about 19 percent of GDP.
GUIDE01.QXD 2/2/2000 2:41 PM Page 2
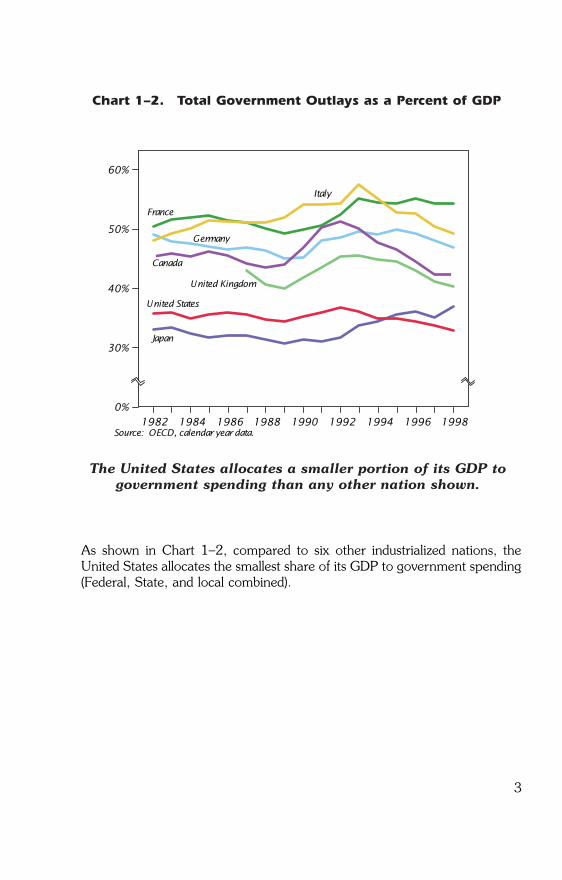
As shown in Chart 1�2, compared to six other industrialized nations, theUnited States allocates the smallest share of its GDP to government spending(Federal, State, and local combined).
3
1982 1984 1986 1988 1990 1992 1994 1996 199820%
30%
40%
50%
60%
Source: OECD, calendar year data.
Italy
United Kingdom
Canada
France
Germany
United States
Japan
Chart 1�2. Total Government Outlays as a Percent of GDP
The United States allocates a smaller portion of its GDP togovernment spending than any other nation shown.
GUIDE01.QXD 2/2/2000 2:41 PM Page 3
2. Where the Money Comes From�and Where it Goes
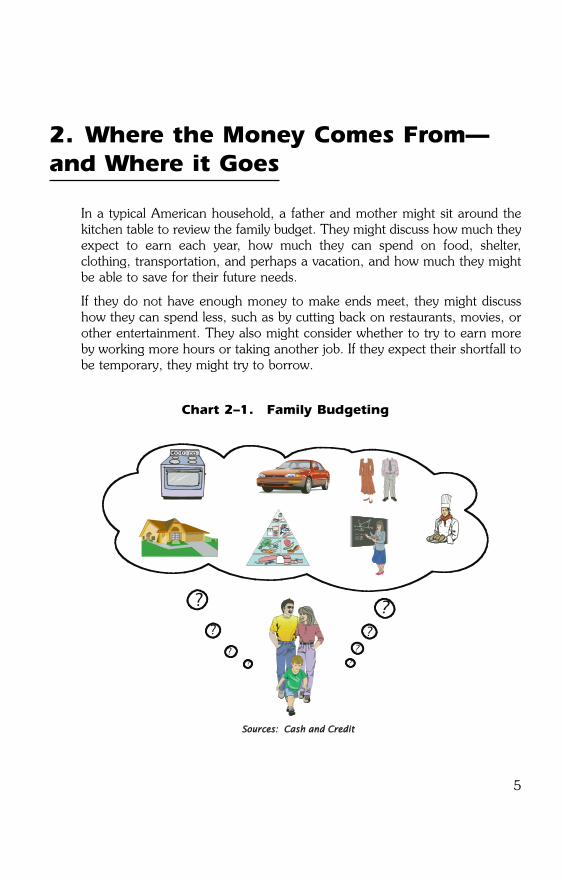
In a typical American household, a father and mother might sit around thekitchen table to review the family budget. They might discuss how much theyexpect to earn each year, how much they can spend on food, shelter,clothing, transportation, and perhaps a vacation, and how much they mightbe able to save for their future needs.
If they do not have enough money to make ends meet, they might discusshow they can spend less, such as by cutting back on restaurants, movies, orother entertainment. They also might consider whether to try to earn moreby working more hours or taking another job. If they expect their shortfall tobe temporary, they might try to borrow.
5
Chart 2�1. Family Budgeting
SSoouurrcceess:: CCaasshh aanndd CCrreeddiitt
?
?
?
??
?
?
?
GUIDE01.QXD 2/2/2000 2:41 PM Page 5
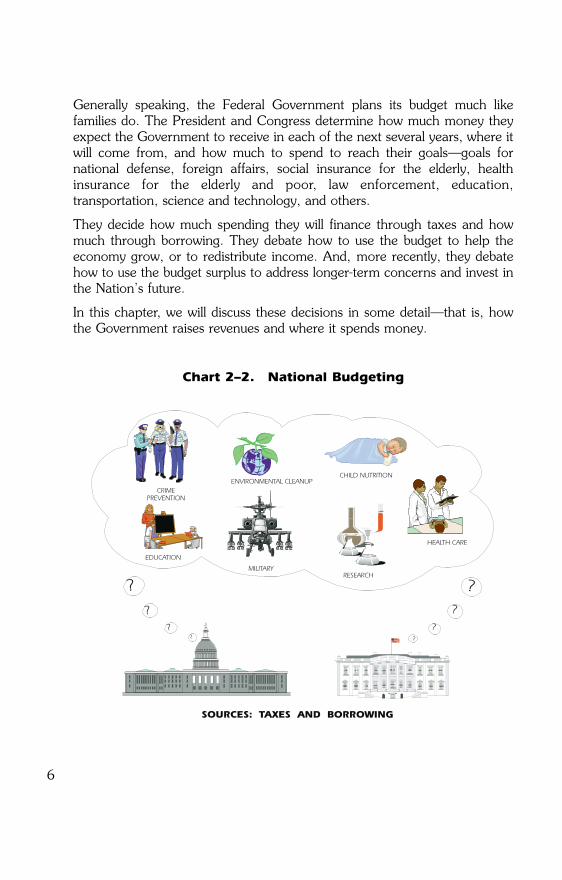
Generally speaking, the Federal Government plans its budget much likefamilies do. The President and Congress determine how much money theyexpect the Government to receive in each of the next several years, where itwill come from, and how much to spend to reach their goals�goals fornational defense, foreign affairs, social insurance for the elderly, healthinsurance for the elderly and poor, law enforcement, education,transportation, science and technology, and others.
They decide how much spending they will finance through taxes and howmuch through borrowing. They debate how to use the budget to help theeconomy grow, or to redistribute income. And, more recently, they debatehow to use the budget surplus to address longer-term concerns and invest inthe Nation�s future.
In this chapter, we will discuss these decisions in some detail�that is, howthe Government raises revenues and where it spends money.
6
Chart 2�2. National Budgeting
EDUCATION
MILITARY
ENVIRONMENTAL CLEANUP
HEALTH CARE
CHILD NUTRITION
RESEARCH
CRIMEPREVENTION
SOURCES: TAXES AND BORROWING
?
??
?
?
??
?
GUIDE01.QXD 2/2/2000 2:41 PM Page 6
Revenues
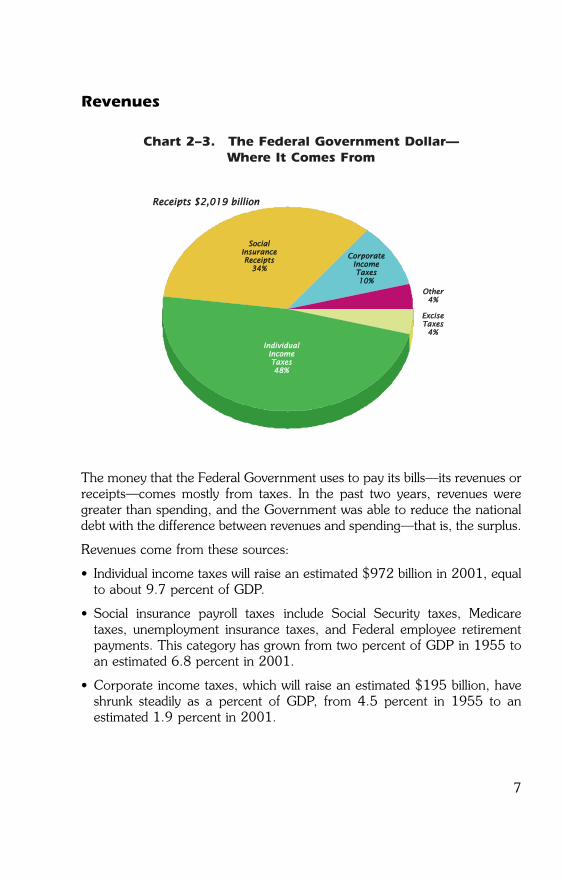
The money that the Federal Government uses to pay its bills�its revenues orreceipts�comes mostly from taxes. In the past two years, revenues weregreater than spending, and the Government was able to reduce the nationaldebt with the difference between revenues and spending�that is, the surplus.
Revenues come from these sources:
� Individual income taxes will raise an estimated $972 billion in 2001, equalto about 9.7 percent of GDP.
� Social insurance payroll taxes include Social Security taxes, Medicaretaxes, unemployment insurance taxes, and Federal employee retirementpayments. This category has grown from two percent of GDP in 1955 toan estimated 6.8 percent in 2001.
� Corporate income taxes, which will raise an estimated $195 billion, haveshrunk steadily as a percent of GDP, from 4.5 percent in 1955 to anestimated 1.9 percent in 2001.
7
EExxcciisseeTTaaxxeess
44%%
OOtthheerr44%%
CCoorrppoorraatteeIInnccoommeeTTaaxxeess1100%%
SSoocciiaallIInnssuurraanncceeRReecceeiippttss
3344%%
IInnddiivviidduuaallIInnccoommeeTTaaxxeess4488%%
RReecceeiippttss $$22,,001199 bbiilllliioonn
Chart 2�3. The Federal Government Dollar�Where It Comes From
GUIDE01.QXD 2/2/2000 2:41 PM Page 7
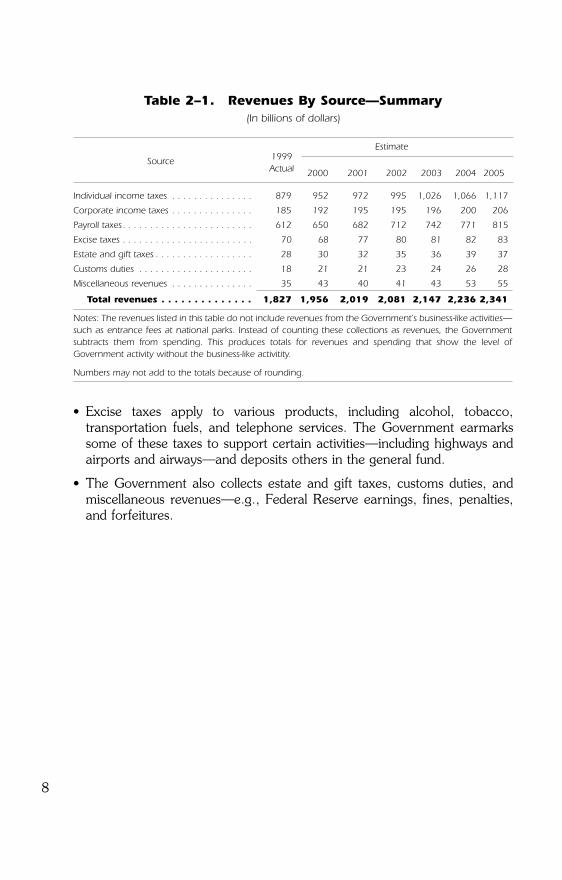
� Excise taxes apply to various products, including alcohol, tobacco,transportation fuels, and telephone services. The Government earmarkssome of these taxes to support certain activities�including highways andairports and airways�and deposits others in the general fund.
� The Government also collects estate and gift taxes, customs duties, andmiscellaneous revenues�e.g., Federal Reserve earnings, fines, penalties,and forfeitures.
8
Table 2�1. Revenues By Source�Summary(In billions of dollars)
Estimate
Source 1999Actual 2000 2001 2002 2003 2004 2005
Individual income taxes . . . . . . . . . . . . . . . 879 952 972 995 1,026 1,066 1,117
Corporate income taxes . . . . . . . . . . . . . . . 185 192 195 195 196 200 206
Payroll taxes. . . . . . . . . . . . . . . . . . . . . . . . 612 650 682 712 742 771 815
Excise taxes . . . . . . . . . . . . . . . . . . . . . . . . 70 68 77 80 81 82 83
Estate and gift taxes . . . . . . . . . . . . . . . . . . 28 30 32 35 36 39 37
Customs duties . . . . . . . . . . . . . . . . . . . . . 18 21 21 23 24 26 28
Miscellaneous revenues . . . . . . . . . . . . . . . 35 43 40 41 43 53 55
Total revenues . . . . . . . . . . . . . . 1,827 1,956 2,019 2,081 2,147 2,236 2,341
Notes: The revenues listed in this table do not include revenues from the Government�s business-like activities�such as entrance fees at national parks. Instead of counting these collections as revenues, the Governmentsubtracts them from spending. This produces totals for revenues and spending that show the level ofGovernment activity without the business-like activitity.
Numbers may not add to the totals because of rounding.
GUIDE01.QXD 2/2/2000 2:41 PM Page 8
9
1956 1962 1968 1974 1980 1986 1992 1998 2004
0
20
40
60
80
100
Percent
SSoocciiaall IInnssuurraannccee TTaaxxeess
EExxcciissee TTaaxxeess
CCoorrppoorraattiioonn IInnccoommee TTaaxxeess
IInnddiivviidduuaall IInnccoommee TTaaxxeess
OTHER
OOtthheerr
1982 1984 1986 1988 1990 1992 1994 1996 199820%
25%
30%
35%
40%
45%
50%
55%
Source: OECD, calendar year data.
France
Germany
Canada
United Kingdom
Japan
Italy
United States
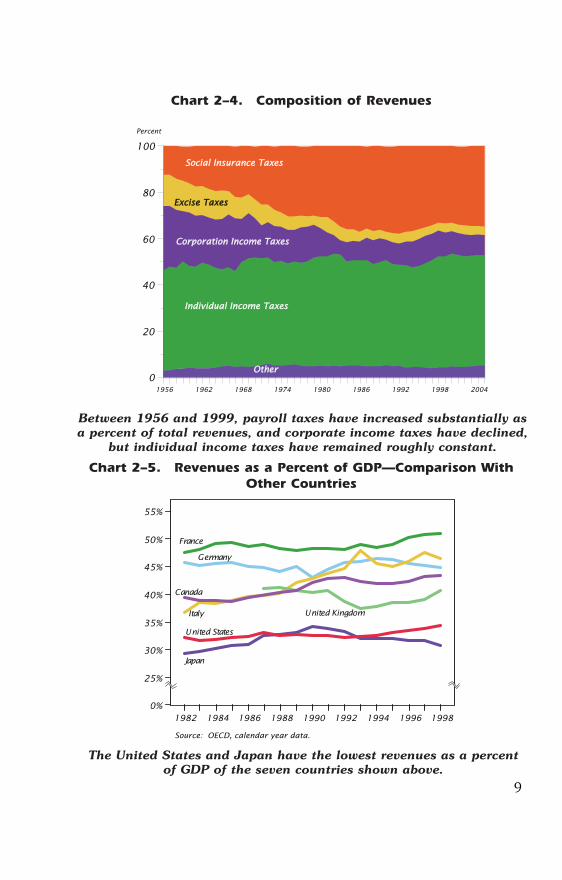
Chart 2�4. Composition of Revenues
Chart 2�5. Revenues as a Percent of GDP�Comparison WithOther Countries
Between 1956 and 1999, payroll taxes have increased substantially asa percent of total revenues, and corporate income taxes have declined,
but individual income taxes have remained roughly constant.
The United States and Japan have the lowest revenues as a percentof GDP of the seven countries shown above.
GUIDE01.QXD 2/2/2000 2:41 PM Page 9
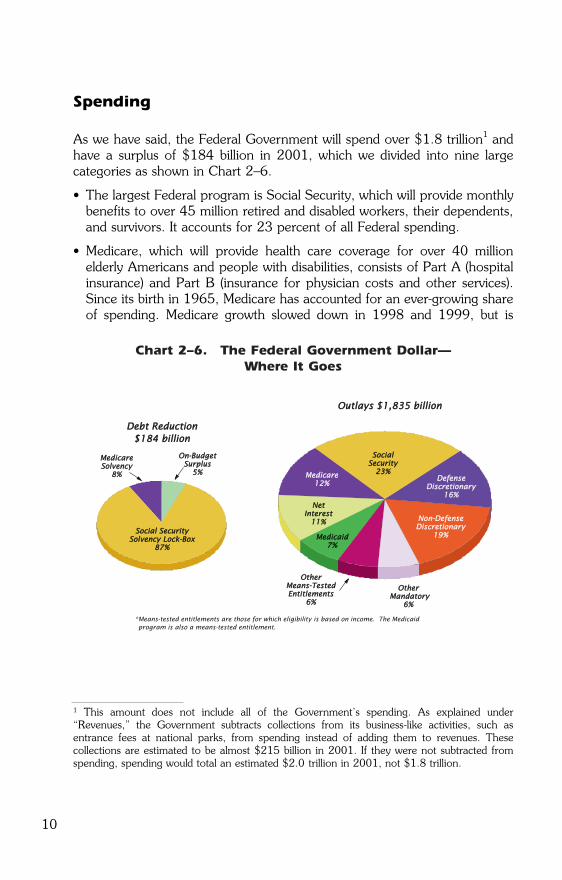
Spending
As we have said, the Federal Government will spend over $1.8 trillion1 andhave a surplus of $184 billion in 2001, which we divided into nine largecategories as shown in Chart 2�6.
� The largest Federal program is Social Security, which will provide monthlybenefits to over 45 million retired and disabled workers, their dependents,and survivors. It accounts for 23 percent of all Federal spending.
� Medicare, which will provide health care coverage for over 40 millionelderly Americans and people with disabilities, consists of Part A (hospitalinsurance) and Part B (insurance for physician costs and other services).Since its birth in 1965, Medicare has accounted for an ever-growing shareof spending. Medicare growth slowed down in 1998 and 1999, but is
10
1 This amount does not include all of the Government�s spending. As explained under�Revenues,� the Government subtracts collections from its business-like activities, such asentrance fees at national parks, from spending instead of adding them to revenues. Thesecollections are estimated to be almost $215 billion in 2001. If they were not subtracted fromspending, spending would total an estimated $2.0 trillion in 2001, not $1.8 trillion.
*Means-tested entitlements are those for which eligibility is based on income. The Medicaidprogram is also a means-tested entitlement.
OOtthheerrMMeeaannss--TTeesstteedd EEnnttiittlleemmeennttss
66%%
OOtthheerr MMaannddaattoorryy
66%%
DDeebbtt RReedduuccttiioonn$$118844 bbiilllliioonn
OOuuttllaayyss $$11,,883355 bbiilllliioonn
NNeettIInntteerreesstt
1111%%
DDeeffeennsseeDDiissccrreettiioonnaarryy
1166%%
SSoocciiaallSSeeccuurriittyy
2233%%MMeeddiiccaarree1122%%
NNoonn--DDeeffeennsseeDDiissccrreettiioonnaarryy
1199%%MMeeddiiccaaiidd77%%
SSoocciiaall SSeeccuurriittyySSoollvveennccyy LLoocckk--BBooxx
8877%%
MMeeddiiccaarreeSSoollvveennccyy
88%%
OOnn--BBuuddggeettSSuurrpplluuss
55%%
Chart 2�6. The Federal Government Dollar�Where It Goes
GUIDE01.QXD 2/2/2000 2:41 PM Page 10
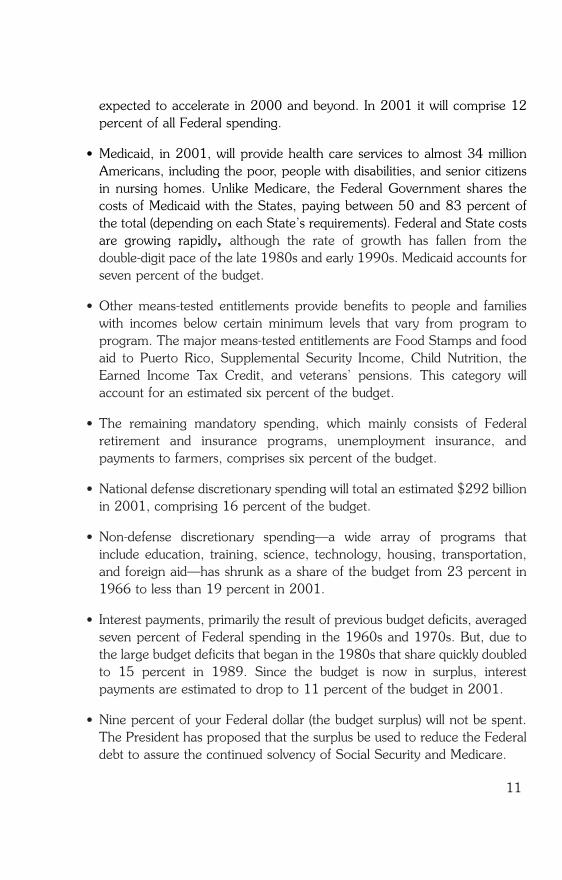
expected to accelerate in 2000 and beyond. In 2001 it will comprise 12percent of all Federal spending.
� Medicaid, in 2001, will provide health care services to almost 34 millionAmericans, including the poor, people with disabilities, and senior citizensin nursing homes. Unlike Medicare, the Federal Government shares thecosts of Medicaid with the States, paying between 50 and 83 percent ofthe total (depending on each State�s requirements). Federal and State costsare growing rapidly, although the rate of growth has fallen from thedouble-digit pace of the late 1980s and early 1990s. Medicaid accounts forseven percent of the budget.
� Other means-tested entitlements provide benefits to people and familieswith incomes below certain minimum levels that vary from program toprogram. The major means-tested entitlements are Food Stamps and foodaid to Puerto Rico, Supplemental Security Income, Child Nutrition, theEarned Income Tax Credit, and veterans� pensions. This category willaccount for an estimated six percent of the budget.
� The remaining mandatory spending, which mainly consists of Federalretirement and insurance programs, unemployment insurance, andpayments to farmers, comprises six percent of the budget.
� National defense discretionary spending will total an estimated $292 billionin 2001, comprising 16 percent of the budget.
� Non-defense discretionary spending�a wide array of programs thatinclude education, training, science, technology, housing, transportation,and foreign aid�has shrunk as a share of the budget from 23 percent in1966 to less than 19 percent in 2001.
� Interest payments, primarily the result of previous budget deficits, averagedseven percent of Federal spending in the 1960s and 1970s. But, due tothe large budget deficits that began in the 1980s that share quickly doubledto 15 percent in 1989. Since the budget is now in surplus, interestpayments are estimated to drop to 11 percent of the budget in 2001.
� Nine percent of your Federal dollar (the budget surplus) will not be spent.The President has proposed that the surplus be used to reduce the Federaldebt to assure the continued solvency of Social Security and Medicare.
11
GUIDE01.QXD 2/2/2000 2:41 PM Page 11
12
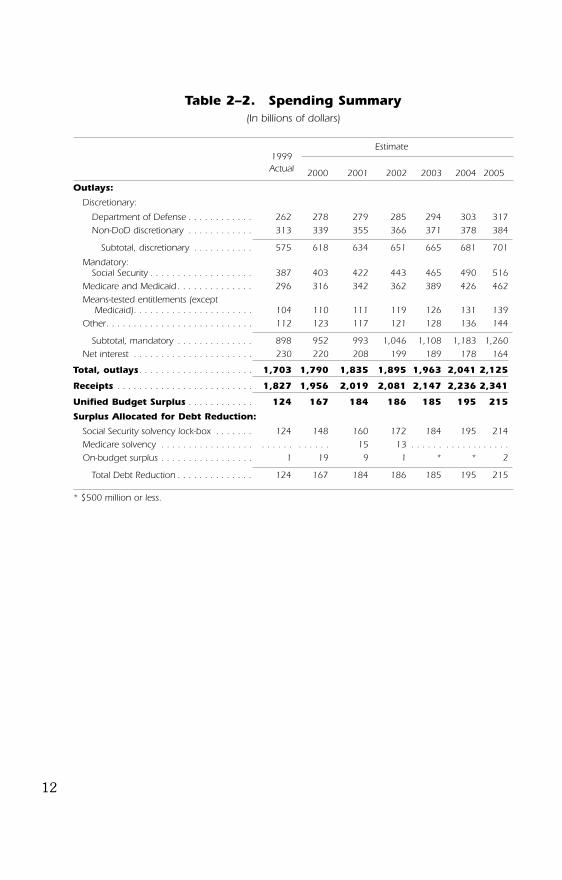
Table 2�2. Spending Summary(In billions of dollars)
Estimate1999Actual 2000 2001 2002 2003 2004 2005
Outlays:
Discretionary:
Department of Defense . . . . . . . . . . . . 262 278 279 285 294 303 317Non-DoD discretionary . . . . . . . . . . . . 313 339 355 366 371 378 384
Subtotal, discretionary . . . . . . . . . . . 575 618 634 651 665 681 701
Mandatory:Social Security . . . . . . . . . . . . . . . . . . . 387 403 422 443 465 490 516
Medicare and Medicaid . . . . . . . . . . . . . . 296 316 342 362 389 426 462Means-tested entitlements (except
Medicaid). . . . . . . . . . . . . . . . . . . . . . 104 110 111 119 126 131 139Other. . . . . . . . . . . . . . . . . . . . . . . . . . . 112 123 117 121 128 136 144
Subtotal, mandatory . . . . . . . . . . . . . . 898 952 993 1,046 1,108 1,183 1,260Net interest . . . . . . . . . . . . . . . . . . . . . . 230 220 208 199 189 178 164
Total, outlays. . . . . . . . . . . . . . . . . . . . . 1,703 1,790 1,835 1,895 1,963 2,041 2,125
Receipts . . . . . . . . . . . . . . . . . . . . . . . . . 1,827 1,956 2,019 2,081 2,147 2,236 2,341
Unified Budget Surplus . . . . . . . . . . . . 124 167 184 186 185 195 215
Surplus Allocated for Debt Reduction:
Social Security solvency lock-box . . . . . . . 124 148 160 172 184 195 214Medicare solvency . . . . . . . . . . . . . . . . . . . . . . . . . . . . . 15 13 . . . . . . . . . . . . . . . . . .On-budget surplus . . . . . . . . . . . . . . . . . 1 19 9 1 * * 2
Total Debt Reduction . . . . . . . . . . . . . . 124 167 184 186 185 195 215
* $500 million or less.
GUIDE01.QXD 2/2/2000 2:41 PM Page 12
13
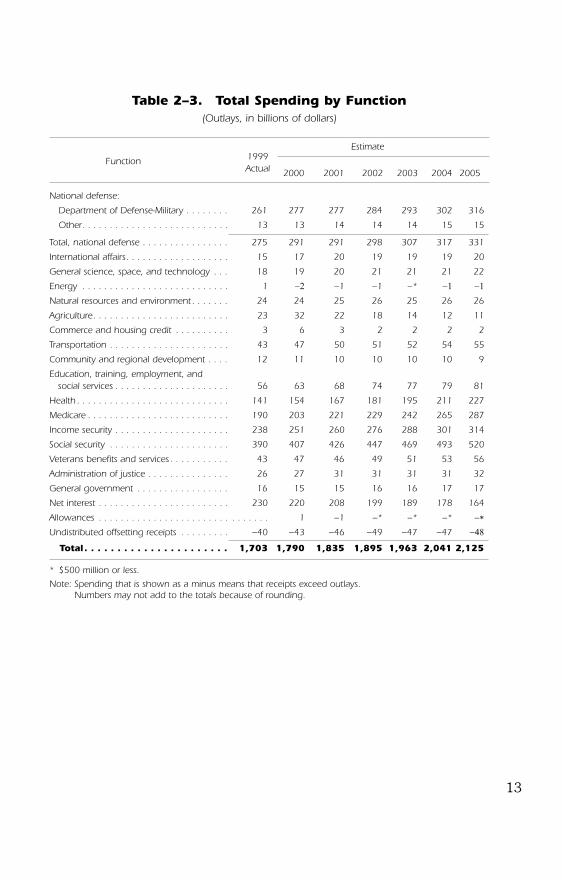
Table 2�3. Total Spending by Function(Outlays, in billions of dollars)
Estimate
Function 1999Actual 2000 2001 2002 2003 2004 2005
National defense:
Department of Defense-Military . . . . . . . . 261 277 277 284 293 302 316
Other. . . . . . . . . . . . . . . . . . . . . . . . . . . 13 13 14 14 14 15 15
Total, national defense . . . . . . . . . . . . . . . . 275 291 291 298 307 317 331
International affairs. . . . . . . . . . . . . . . . . . . 15 17 20 19 19 19 20
General science, space, and technology . . . 18 19 20 21 21 21 22
Energy . . . . . . . . . . . . . . . . . . . . . . . . . . . 1 -2 -1 -1 -* -1 -1
Natural resources and environment . . . . . . . 24 24 25 26 25 26 26
Agriculture. . . . . . . . . . . . . . . . . . . . . . . . . 23 32 22 18 14 12 11
Commerce and housing credit . . . . . . . . . . 3 6 3 2 2 2 2
Transportation . . . . . . . . . . . . . . . . . . . . . . 43 47 50 51 52 54 55
Community and regional development . . . . 12 11 10 10 10 10 9
Education, training, employment, andsocial services . . . . . . . . . . . . . . . . . . . . . 56 63 68 74 77 79 81
Health . . . . . . . . . . . . . . . . . . . . . . . . . . . . 141 154 167 181 195 211 227
Medicare . . . . . . . . . . . . . . . . . . . . . . . . . . 190 203 221 229 242 265 287
Income security . . . . . . . . . . . . . . . . . . . . . 238 251 260 276 288 301 314
Social security . . . . . . . . . . . . . . . . . . . . . . 390 407 426 447 469 493 520
Veterans benefits and services . . . . . . . . . . . 43 47 46 49 51 53 56
Administration of justice . . . . . . . . . . . . . . . 26 27 31 31 31 31 32
General government . . . . . . . . . . . . . . . . . 16 15 15 16 16 17 17
Net interest . . . . . . . . . . . . . . . . . . . . . . . . 230 220 208 199 189 178 164
Allowances . . . . . . . . . . . . . . . . . . . . . . . . . . . . . . . 1 -1 -* -* -* -*
Undistributed offsetting receipts . . . . . . . . . -40 -43 -46 -49 -47 -47 -48
Total. . . . . . . . . . . . . . . . . . . . . . 1,703 1,790 1,835 1,895 1,963 2,041 2,125
* $500 million or less.
Note: Spending that is shown as a minus means that receipts exceed outlays.Note: Numbers may not add to the totals because of rounding.
GUIDE01.QXD 2/2/2000 2:41 PM Page 13
14
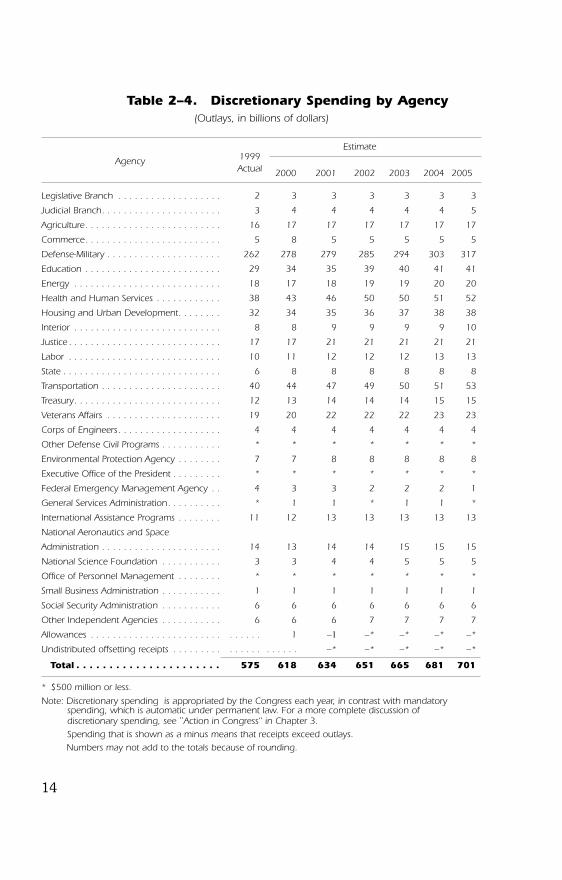
Table 2�4. Discretionary Spending by Agency(Outlays, in billions of dollars)
Estimate
Agency 1999Actual 2000 2001 2002 2003 2004 2005
Legislative Branch . . . . . . . . . . . . . . . . . . . 2 3 3 3 3 3 3
Judicial Branch. . . . . . . . . . . . . . . . . . . . . . 3 4 4 4 4 4 5
Agriculture. . . . . . . . . . . . . . . . . . . . . . . . . 16 17 17 17 17 17 17
Commerce. . . . . . . . . . . . . . . . . . . . . . . . . 5 8 5 5 5 5 5
Defense-Military . . . . . . . . . . . . . . . . . . . . . 262 278 279 285 294 303 317
Education . . . . . . . . . . . . . . . . . . . . . . . . . 29 34 35 39 40 41 41
Energy . . . . . . . . . . . . . . . . . . . . . . . . . . . 18 17 18 19 19 20 20
Health and Human Services . . . . . . . . . . . . 38 43 46 50 50 51 52
Housing and Urban Development. . . . . . . . 32 34 35 36 37 38 38
Interior . . . . . . . . . . . . . . . . . . . . . . . . . . . 8 8 9 9 9 9 10
Justice . . . . . . . . . . . . . . . . . . . . . . . . . . . . 17 17 21 21 21 21 21
Labor . . . . . . . . . . . . . . . . . . . . . . . . . . . . 10 11 12 12 12 13 13
State . . . . . . . . . . . . . . . . . . . . . . . . . . . . . 6 8 8 8 8 8 8
Transportation . . . . . . . . . . . . . . . . . . . . . . 40 44 47 49 50 51 53
Treasury. . . . . . . . . . . . . . . . . . . . . . . . . . . 12 13 14 14 14 15 15
Veterans Affairs . . . . . . . . . . . . . . . . . . . . . 19 20 22 22 22 23 23
Corps of Engineers. . . . . . . . . . . . . . . . . . . 4 4 4 4 4 4 4
Other Defense Civil Programs . . . . . . . . . . . * * * * * * *
Environmental Protection Agency . . . . . . . . 7 7 8 8 8 8 8
Executive Office of the President . . . . . . . . . * * * * * * *
Federal Emergency Management Agency . . 4 3 3 2 2 2 1
General Services Administration. . . . . . . . . . * 1 1 * 1 1 *
International Assistance Programs . . . . . . . . 11 12 13 13 13 13 13
National Aeronautics and Space
Administration . . . . . . . . . . . . . . . . . . . . . . 14 13 14 14 15 15 15
National Science Foundation . . . . . . . . . . . 3 3 4 4 5 5 5
Office of Personnel Management . . . . . . . . * * * * * * *
Small Business Administration . . . . . . . . . . . 1 1 1 1 1 1 1
Social Security Administration . . . . . . . . . . . 6 6 6 6 6 6 6
Other Independent Agencies . . . . . . . . . . . 6 6 6 7 7 7 7
Allowances . . . . . . . . . . . . . . . . . . . . . . . . . . . . . . 1 -1 -* -* -* -*
Undistributed offsetting receipts . . . . . . . . . . . . . . . . . . . . . -* -* -* -* -*
Total . . . . . . . . . . . . . . . . . . . . . . 575 618 634 651 665 681 701
* $500 million or less.
Note: Discretionary spending is appropriated by the Congress each year, in contrast with mandatoryspending, which is automatic under permanent law. For a more complete discussion of discretionary spending, see `̀ Action in Congress�� in Chapter 3.Spending that is shown as a minus means that receipts exceed outlays.
Note: Numbers may not add to the totals because of rounding.
GUIDE01.QXD 2/2/2000 2:41 PM Page 14
�On� and �Off� Budget
From time to time, you may hear about the �on-budget� which is the budgetexcluding certain programs that are legally designated as �off-budget.�
Traditionally, the President�s budget has focused on the totals for the unifiedbudget. The unified budget encompasses all of the budgetary activities of theGovernment, and the unified budget surplus or deficit is the measure that bestdetermines how much the Government has to borrow from the public (in thecase of a deficit), or how much past borrowing can be repaid (in the case ofa surplus).
More recently, the on-budget surplus has received increasing attention. Forall practical purposes, the off-budget surplus is the surplus in the SocialSecurity program. This means that the on-budget surplus is the budgetsurplus excluding the Social Security surplus.2
Social Security is running large surpluses right now, because the payroll taxesof the relatively large �baby-boom� generation exceed the Social Securitybenefits paid to the relatively small generation of current retirees. Thesesurpluses have held down the unified deficit, by offsetting part of the deficitin the on-budget accounts. When the unified budget first booked a surplus of$69 billion in 1998, the on-budget accounts were still in deficit by $30billion. In 1999, the unified budget ran a $124 billion surplus, nearly all ofwhich was the result of the Social Security surplus. The on-budget accountswere almost exactly in balance.
Under the President�s proposals, the off-budget surplus would be reserved fordebt reduction to enhance Social Security solvency. The President�s budgetalso proposes that part of the on-budget surplus be reserved for Medicaresolvency and for catastrophic prescription drug coverage. The President�soverall budgetary framework is discussed in Chapter 5.
15
2 The Postal Service is also designated as off-budget, which is why the off-budget surplus andthe Social Security surplus are not exactly the same.
GUIDE01.QXD 2/2/2000 2:41 PM Page 15
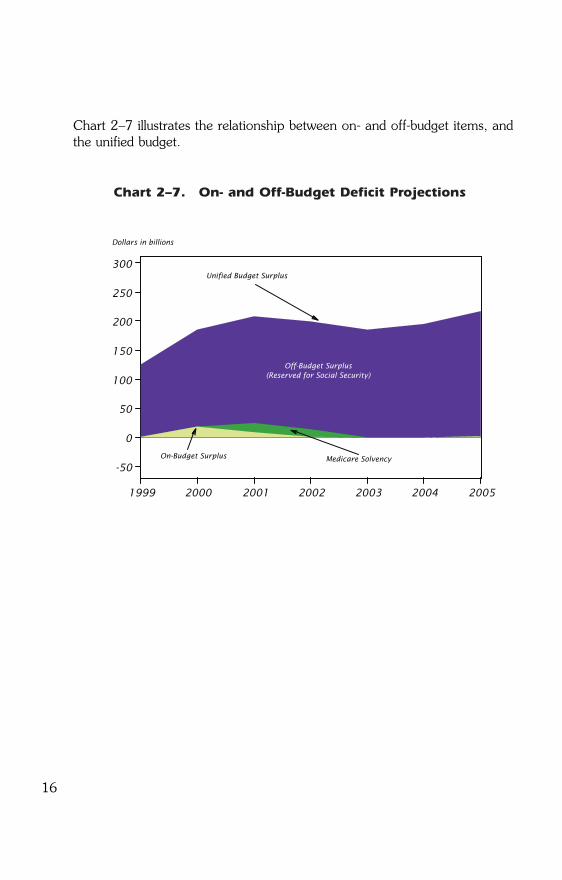
Chart 2�7 illustrates the relationship between on- and off-budget items, andthe unified budget.
16
1999 2000 2001 2002 2003 2004 2005
-50
0
50
100
150
200
250
300
Dollars in billions
On-Budget Surplus
Off-Budget Surplus(Reserved for Social Security)
Unified Budget Surplus
Medicare Solvency
Chart 2�7. On- and Off-Budget Deficit Projections
GUIDE01.QXD 2/2/2000 2:41 PM Page 16
17
3. How Does the Government Createa Budget?
The President and Congress both play major roles in developing the Federalbudget.
The President�s Budget
The law requires that, by the first Monday in February, the President submitto Congress his proposed Federal budget for the next fiscal year, whichbegins October 1.
The White House�s Office of Management and Budget (OMB) prepares thebudget proposal, after receiving direction from the President and consultingwith his senior advisors and officials from Cabinet departments and otheragencies.
The President�s budget�which typically includes a main book and severalaccompanying books1�covers thousands of pages and provides anabundance of details.
The Budget Process
Through the budget process, the President and Congress decide how muchto spend and tax in any one fiscal year. More specifically, they decide howmuch to spend on each activity, ensure that the Government spends no moreand spends it only for that activity, and report on that spending at the end ofeach budget cycle.
The President�s budget is his plan for the next year. But it�s just a proposal.After receiving it, Congress has its own budget process to follow. Only afterthe Congress passes, and the President signs, the required spending bills hasthe Government created its actual budget.
1 They are the main budget book, entitled, Budget of the United States Government: FiscalYear 2001, as well as Analytical Perspectives, Appendix, Historical Tables, and A Citizen�sGuide to the Federal Budget, which you are now reading.
GUIDE01.QXD 2/2/2000 2:41 PM Page 17
18
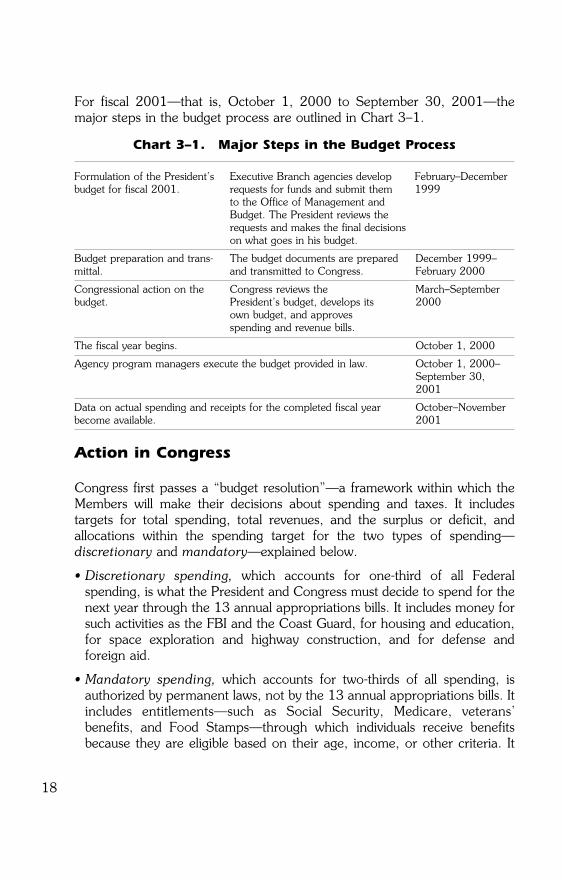
For fiscal 2001�that is, October 1, 2000 to September 30, 2001�themajor steps in the budget process are outlined in Chart 3�1.
Action in Congress
Congress first passes a �budget resolution��a framework within which theMembers will make their decisions about spending and taxes. It includestargets for total spending, total revenues, and the surplus or deficit, andallocations within the spending target for the two types of spending�discretionary and mandatory�explained below.
� Discretionary spending, which accounts for one-third of all Federalspending, is what the President and Congress must decide to spend for thenext year through the 13 annual appropriations bills. It includes money forsuch activities as the FBI and the Coast Guard, for housing and education,for space exploration and highway construction, and for defense andforeign aid.
� Mandatory spending, which accounts for two-thirds of all spending, isauthorized by permanent laws, not by the 13 annual appropriations bills. Itincludes entitlements�such as Social Security, Medicare, veterans�benefits, and Food Stamps�through which individuals receive benefitsbecause they are eligible based on their age, income, or other criteria. It
Chart 3�1. Major Steps in the Budget Process
Formulation of the President�s Executive Branch agencies develop February�Decemberbudget for fiscal 2001. requests for funds and submit them 1999
to the Office of Management andBudget. The President reviews therequests and makes the final decisions on what goes in his budget.
Budget preparation and trans- The budget documents are prepared December 1999�mittal. and transmitted to Congress. February 2000
Congressional action on the Congress reviews the March�Septemberbudget. President�s budget, develops its 2000
own budget, and approves spending and revenue bills.
The fiscal year begins. October 1, 2000
Agency program managers execute the budget provided in law. October 1, 2000�September 30,2001
Data on actual spending and receipts for the completed fiscal year October�Novemberbecome available. 2001
GUIDE01.QXD 2/2/2000 2:41 PM Page 18
19
also includes interest on the national debt, which the Government pays toindividuals and institutions that hold Treasury bonds and other Governmentsecurities. The President and Congress can change the law in order tochange the spending on entitlements and other mandatory programs�butthey don�t have to.
Think of it this way: For discretionary programs, Congress and the Presidentmust act each year to provide spending authority. For mandatory programs,they may act in order to change the spending that current laws require.
Currently, the law imposes a limit, or �cap,� through 2002 on total annualdiscretionary spending. The budget proposes to revise these caps beginningin 2001 to recognize changing fiscal conditions, and extend the caps to2010. Within the cap, however, the President and Congress can, and oftendo, change the spending levels from year to year for the thousands ofindividual Federal spending programs.
In addition, the law requires that legislation that would raise mandatoryspending or lower revenues�compared to existing law�be offset byspending cuts or revenue increases. This requirement, called �pay-as-you-go,� or PAYGO, is designed to prevent new legislation from reducing thesurplus or increasing the deficit. The budget also proposes extending thePAYGO system to 2010.
Once Congress passes the budget resolution, it turns its attention to passingthe 13 annual appropriations bills and, if it chooses, �authorizing� bills tochange the laws governing mandatory spending and revenues.
Congress begins by examining the President�s budget in detail. Scores ofcommittees and subcommittees hold hearings on proposals under theirjurisdiction. The House and Senate Armed Services Authorizing Committees,and the Defense and Military Construction Subcommittees of theAppropriations Committees, for instance, hold hearings on the President�sdefense plan. If the President�s budget proposed changes in taxes, the HouseWays and Means and the Senate Finance Committees would hold hearings.The Budget Director, Cabinet officers, and other Administration officialswork with Congress as it accepts some of the President�s proposals, rejectsothers, and changes still others. Congressional rules require that thesecommittees and subcommittees take actions that reflect the budgetresolution.
If you read through the President�s budget, the budget resolution, or theappropriations or authorizing bills that Congress drafts, you will notice that
GUIDE01.QXD 2/2/2000 2:41 PM Page 19
20
the Government measures spending in two ways��budget authority� and�outlays.�
Budget authority (or BA) is what the law authorizes the Federal Governmentto spend for certain programs, projects, or activities. What the Governmentactually spends in a particular year, however, is an outlay. To see thedifference, consider what happens when the Government decides to build aspace exploration system.
The President and Congress may agree to spend $1 billion for the spacesystem. Congress appropriates $1 billion in BA. But the system may take 10years to build. Thus, the Government may spend $100 million in outlays inthe first year to begin construction and the remaining $900 million over thenext nine years as construction continues.
Monitoring the Budget
Once the President and Congress approve spending, the Governmentmonitors the budget through:
� agency program managers and budget officials, including the InspectorsGeneral, or IGs;
� OMB;
� congressional committees; and
� the General Accounting Office, an auditing arm of Congress.
This oversight is designed to:
� ensure that agencies comply with legal limits on spending, and that they usebudget authority only for the purposes intended;
� see that programs are operating consistently with legal requirements andexisting policy; and, finally,
� ensure that programs are well managed and achieving the intended results.
The Government has paid more attention to good management of late,through the work of Vice President Gore�s National Partnership forReinventing Government and implementation of the 1993 GovernmentPerformance and Results Act. This law is designed to improve Governmentprograms by using better measurements of their results in order to evaluatetheir effectiveness.
GUIDE01.QXD 2/2/2000 2:41 PM Page 20
21
4. The Budget Surplus and FiscalDiscipline
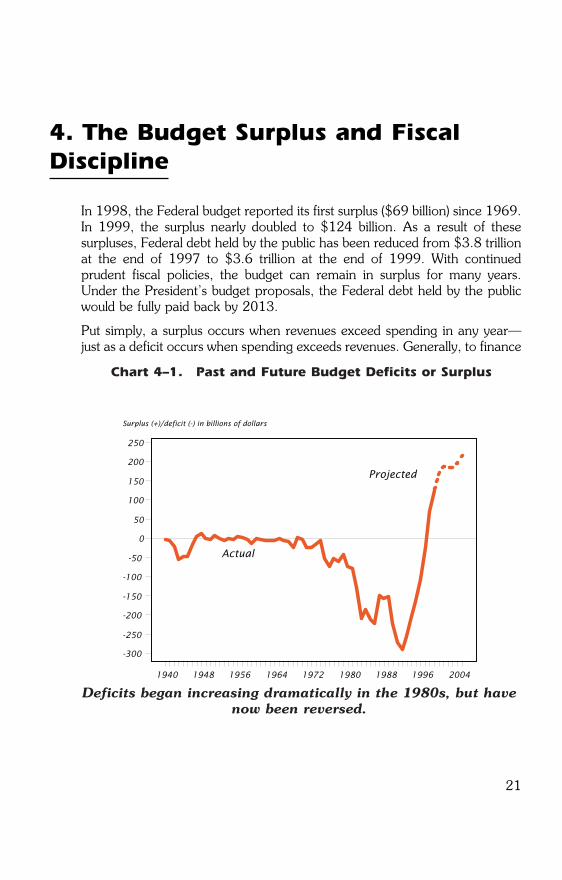
In 1998, the Federal budget reported its first surplus ($69 billion) since 1969.In 1999, the surplus nearly doubled to $124 billion. As a result of thesesurpluses, Federal debt held by the public has been reduced from $3.8 trillionat the end of 1997 to $3.6 trillion at the end of 1999. With continuedprudent fiscal policies, the budget can remain in surplus for many years.Under the President�s budget proposals, the Federal debt held by the publicwould be fully paid back by 2013.
Put simply, a surplus occurs when revenues exceed spending in any year�just as a deficit occurs when spending exceeds revenues. Generally, to finance
1940 1948 1956 1964 1972 1980 1988 1996 2004
-300
-250
-200
-150
-100
-50
0
50
100
150
200
250
Surplus (+)/deficit (-) in billions of dollars
Actual
Projected
Deficits began increasing dramatically in the 1980s, but havenow been reversed.
Chart 4�1. Past and Future Budget Deficits or Surplus
GUIDE01.QXD 2/2/2000 2:41 PM Page 21
past deficits, the Treasury has borrowed money. With certain exceptions, thedebt is the sum total of our deficits, minus our surpluses, over the years.
The Government incurred its first deficit in 1792, and it generated 70 annualdeficits between 1900 and 1997.
Chart 4�1 provides the history of budget surplus and deficits since 1940.
For most of the Nation�s history, deficits were the result of either wars orrecessions. Wars necessitated major increases in military spending, whilerecessions reduced Federal tax revenues from businesses and individuals.
The Government generated deficits during the War of 1812, the recession of1837, the Civil War, the depression of the 1890s, and World War I. Oncethe war ended or the economy began to grow, the Government followed itsdeficits with budget surpluses, with which it paid down the debt.
Deficits returned in 1931 and remained for the rest of the decade�due tothe Great Depression and the spending associated with President Roosevelt�sNew Deal. Then, World War II forced the Nation to spend unprecedentedamounts on defense and to incur corresponding unprecedented deficits.
22
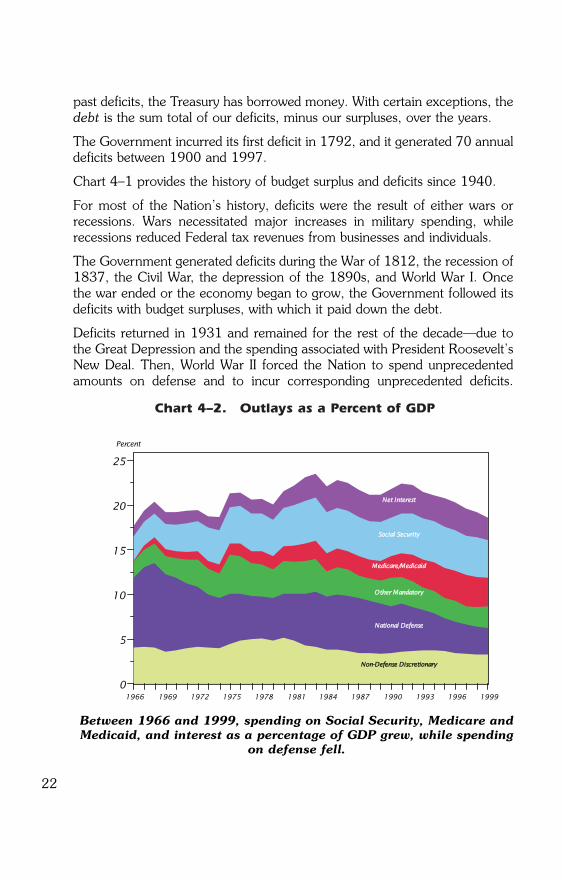
Between 1966 and 1999, spending on Social Security, Medicare andMedicaid, and interest as a percentage of GDP grew, while spending
on defense fell.
1966 1969 1972 1975 1978 1981 1984 1987 1990 1993 1996 1999
0
5
10
15
20
25
Percent
NNoonn--DDeeffeennssee DDiissccrreettiioonnaarryy
NNaattiioonnaall DDeeffeennssee
OOtthheerr MMaannddaattoorryy
MMeeddiiccaarree//MMeeddiiccaaiidd
SSoocciiaall SSeeccuurriittyy
NNeett IInntteerreesstt
Chart 4�2. Outlays as a Percent of GDP
GUIDE01.QXD 2/2/2000 2:41 PM Page 22
23
Since then�with Democratic and Republican Presidents, Democratic andRepublican Congresses�the Government has balanced its books only tentimes, most recently last year.
Nevertheless, the deficits before 1981 paled in comparison to what followed.That year, the Government cut income tax rates and greatly increaseddefense spending, but it did not cut non-defense programs enough to makeup the difference. Also, the recession of the early 1980s reduced Federalrevenues, increased Federal outlays for unemployment insurance and similarprograms that are closely tied to economic conditions, and forced theGovernment to pay interest on more national debt at a time when interestrates were high. As a result, the deficit soared.
Why have we been able to move from deficit to balance? Because spendinggrowth has been restrained. Outlays are growing slower than revenues.
Revenues have stayed relatively constant, at around 16 to 20 percent ofGDP, since the 1960s. In that time, however, outlays grew from about 17percent of GDP in 1965 to nearly 24 percent in 1983 before falling below19 percent today.
Since 1983, spending has been reduced or held constant as a percent ofGDP across a wide variety of programs. The most significant reduction hasoccurred in discretionary spending, which has fallen from 10.3 percent to6.3 percent in 1999. Combined spending on social security and net interesthas remained roughly constant at about 71/2 percent of GDP from 1983 to1997. However, the debt reduction of the last two years has brought thisspending down to 6.7 percent of GDP in 1999. A similar path has beenfollowed in the rest of mandatory spending in total, but only because thegrowth in Medicare and Medicaid has been offset by declines in othermandatory spending (see Chart 4�2).
Why a Budget Surplus is Important
As Chart 4�3 illustrates, this Nation has a good record when compared tothe recent history of the six other major developed economies. (To makeaccurate comparisons with the governments of other nations, the U.S. datainclude the activities of State and local governments.)
Should we worry about the possibility of a return to budget deficits?
GUIDE01.QXD 2/2/2000 2:41 PM Page 23
The 2001 Budget forecasts surplus for decades to come, if we maintain thepolicy of fiscal discipline and strategic investments in the American people.
We must do all we can to keep the days of deficits in the past. Budget deficitsforce the Government to borrow money in the private capital markets. Thatborrowing competes with (1) borrowing by businesses that want to buildfactories and machines that make workers more productive and raiseincomes, and (2) borrowing by families who hope to buy new homes, cars,and other goods. The competition for funds tends to produce higher interestrates.
Deficits increase the Federal debt and, with it, the Government�s obligationto pay interest. The more it must pay in interest, the less it has available tospend on education, law enforcement, and other important services, or themore it must collect in taxes�forever after. As recently as 1997, theGovernment spent over 15 percent of its budget to pay interest, in contrast
24
1982 1984 1986 1988 1990 1992 1994 1996 1998
-15%
-10%
-5%
0%
5%
Source: OECD, calendar year data.
Italy United Kingdom
Canada France
Germany
United States
Japan
Surplus (+)/deficit (-) in billions of dollars
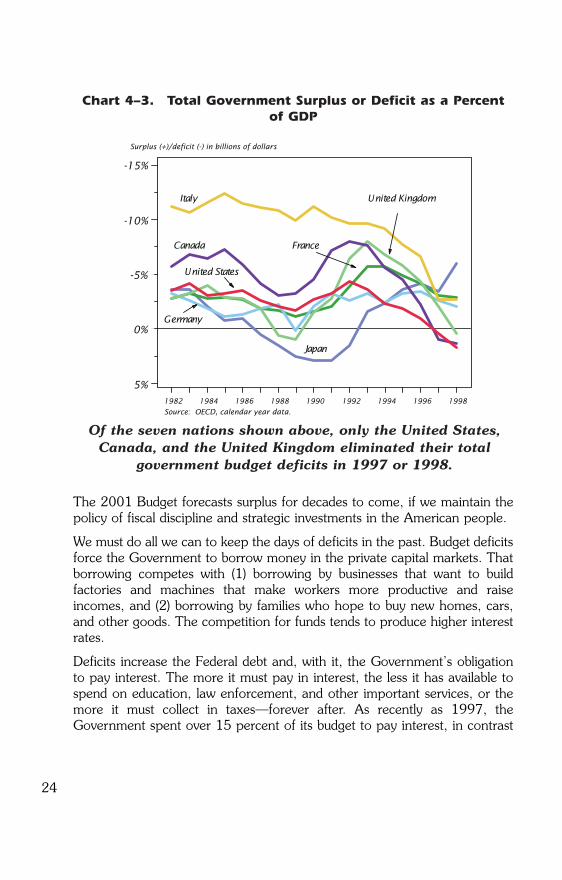
Of the seven nations shown above, only the United States,Canada, and the United Kingdom eliminated their total
government budget deficits in 1997 or 1998.
Chart 4�3. Total Government Surplus or Deficit as a Percentof GDP
GUIDE01.QXD 2/2/2000 2:41 PM Page 24
��� �� �������� ��� ������� ��� ����������������� ������������� ����� ����������������������� ���������� ������������
��������������������������������������������� �������������������������� ��������� ��� ������������������� ���������������� ���� �������������� ������ �����!���������������������������������������������������������������"����������������������������� ������� ������������ ��� �������������� �������
������������ �
� �����#��������������������������������������������������������������������
$�����%&���������'��������������������������������������������������������������� � ����������
������ ���������� ��������� ���� ������ ��� ���� ������� � � ������ ��� ����� � �������� ��'��� ��� ����� ������� ������ ���������� $��� ���������� ������� � ���������� ���� ���� �����(������ ���� ���� ���� ��� ���� �����(��� ��������������������������� � ����������������� ��� �������� ����#���������������������������������������)�����������������������������������������������#����������������������������������������
*�������������������������+,�-��������������������� ��...(���������������� ���� �� �����������������������������������������*������������������������������������������#�������������������� (����������� ����������� ���������������� �����������������������)������/�����/���������������������������������������������������� ����������������
�0
�� ������� ��������������������������� �������������������� ����� �������
������ ���� ���� ���� ���� ���� ����
���� ������� ������������� !"��������� ���� #�� $�$�$�$�$�$�$�$�$�$�$�$�$� ��� �%& �'� �'% �'� ��� ���(������(��� ��)�������)����*+��,!-+��� �� $�$�$�$�$�$�$�$�$�$�$�$�$�$�$�$�$�$� ��� ��' �%� �&� �'� ��� ���
.����� ��������)$�$�$�$�$�$�$�$�$�$�$�$�$�$�$� $�$�$�$�$ $�$�$�$�$ �� �� $�$�$�$�$ $�$�$�$�$ $�$�$�$�$
-�+��� �� $�$�$�$�$�$�$�$�$�$�$�$�$�$�$�$�$�$�$�$� � �� � � / / �
-�0� ��������������� $�$�$�$�$�$�$�$�$�$�$� ��% �� ��� ��� ��� ��� ���1�#�)������������0�����)��0��#����� '� ��& �&� �&� �&� �'� ���
���� ������� ����������!!2������3��������� �������� $�$�$�$�$�$�$�$�$�$�$� �4�%' �4%�' �4&�� �4'�� �4��� �4��� %4�'%� ������ ������� $�$�$�$�$�$�$�$�$�$�$�$�$�$�$�$� �4%�% �4%'% �4&%� �4'�� �4��& %4��� %4��'2����0�����)� ��� ������������� $�$� �4�&� �4��� �4�%� �4&�� �4�'� �4��� �4���2����0�����)��0��#����� $�$�$�$�$�$�$�$�$�$�$� �4%�� �4�&% �4��� �4��� �4�%� �4&'� �4�&'
/�������������� ���$5���!�5���� ���)�������������0����������������� ������ $
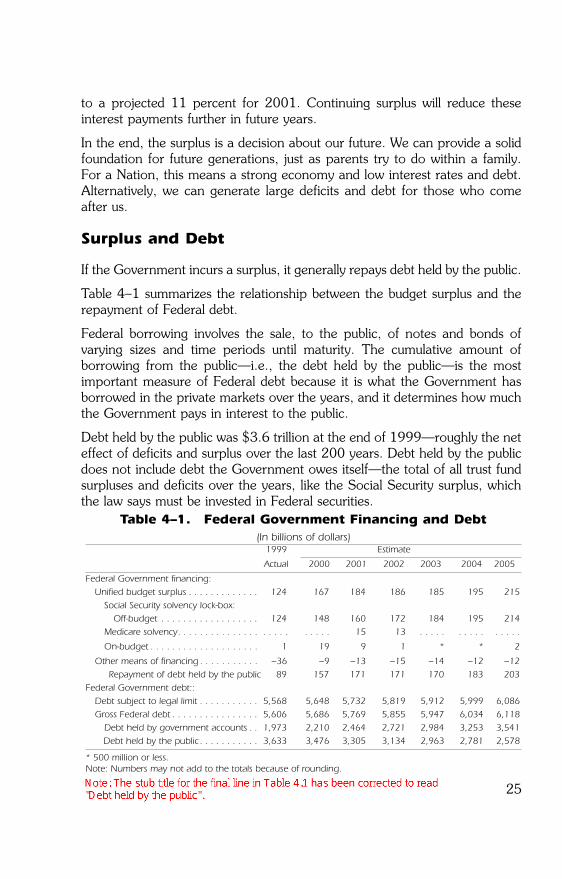
Because the large budget deficit has been turned into a surplus, the debt heldby the public was reduced in the last two years for the first time since 1969.
The sum of debt held by the public and debt the Government owes itself iscalled Gross Federal Debt. At the end of 1999, it totaled $5.6 trillion.
Another measure of Federal debt is debt subject to legal limit, which is similarto Gross Federal Debt. When the Government reaches the limit, it loses itsauthority to borrow more to finance its spending; then, the President andCongress must enact a law to increase the limit. Because the budget hasreturned to surplus and publicly held debt is being reduced, there will be noneed to increase the statutory limit in 2001.
The Government�s ability to finance its debt is tied to the size and strength ofthe economy, or GDP. Debt held by the public was less than 40 percent ofGDP at the end of 1999. As a percentage of GDP, debt held by the publicwas highest at the end of World War II, at 109 percent, then fell to 24percent in 1974 before gradually rising to a peak of over 49 percent in themiddle 1990s.
That decline, from 109 to 24 percent, occurred because the economy grewfaster than the debt accumulated; debt held by the public rose from $242billion to $344 billion in those years, but the economy grew faster.
Individuals and institutions in the United States hold about two-thirds of debtheld by the public. The rest is held in foreign countries.
Returning the Budget to Surplus
Ever since the deficit soared in the early 1980s, successive Presidents andCongresses have tried to cut it. Until recently, they met with only limitedsuccess.
In the early 1980s, President Reagan and Congress agreed on a large tax cut,but could not agree about cutting spending; the President wanted to cutdomestic spending more than Congress, while Congress sought fewerdefense funds than the President wanted. They wound up spending more ondomestic programs than the President wanted, and more on defense thanCongress wanted. At the same time, a recession led to more spending to aidthose affected by the recession, and reductions in tax revenues due to lowerincomes and corporate profits.
By 1985, both sides were ready for drastic measures. That year, they enactedthe Balanced Budget and Emergency Deficit Control Act (GRH). It set annual
26
GUIDE01.QXD 2/2/2000 2:41 PM Page 26
deficit targets for five years, declining to a balanced budget in 1991. Ifnecessary, GRH required across-the-board cuts in programs to comply withthe deficit targets.
Faced with the prospect of huge spending cuts in 1987, however, thePresident and Congress amended the law, postponing a balanced budget until1993. The President and Congress never achieved those revised targets, inpart because of the extraordinary costs of returning the Nation�s savings andloan industry to a sound financial footing.
By 1990, President Bush and Congress enacted spending cuts and taxincreases that were designed to cut the accumulated deficits by about $500billion over five years. They also enacted the Budget Enforcement Act(BEA)�rather than set annual deficit targets. The BEA was designed to limitdiscretionary spending while ensuring that any new entitlement programs ortax cuts did not make the deficit worse.
First, the BEA set annual limits on total discretionary spending for defense,international affairs, and domestic programs. Second, it created �pay-as-you-go�� rules for entitlements and taxes: those who proposed new spending onentitlements or lower taxes were forced to offset the costs by cutting otherentitlements or raising other taxes.
For what it was designed to do, the law worked. It did, in fact, limitdiscretionary spending and force proponents of new entitlements and tax cutsto find ways to finance them. But the deficit, which Government and privateexperts said would fall, actually rose.
Why? Because the recession of the early 1990s reduced individual andcorporate tax revenues and increased spending that is tied to economicfluctuations. Federal health care spending also continued to grow rapidly.
In 1993, President Clinton and the Congress made another effort to cut thedeficit. They enacted a five-year deficit reduction package of spending cutsand higher revenues. The law was designed to cut the accumulated deficitsfrom 1994 to 1998 by about $500 billion. The new law extended the limitson discretionary spending and the �pay-as-you-go�� rules.
Although the 1993 plan exceeded all expectations in reducing the deficit, thetask of reaching balance would require one final push. That would come withthe historic 1997 Balanced Budget Act (BBA).
Originally designed to balance the budget by 2002, the BBA provided for$247 billion in savings over five years. It also extended the solvency ofMedicare�s trust fund for at least 10 years while providing for the largest
27
GUIDE01.QXD 2/2/2000 2:41 PM Page 27
investment in higher education since the G.I. Bill in 1945, the largestinvestment in children�s health care since the creation of Medicaid in 1965,and a $500-per-child tax credit for about 27 million working families.
Clearly, the President�s deficit reduction efforts have paid off. The deficit fellfrom $290 billion in 1992 to a surplus of $124 billion in 1999.
The President is now proposing that Social Security be protected and thesolvency of its trust funds be extended. With enactment of these reforms, aswell as strengthening of Medicare, additional resources would be madeavailable for national needs, including health care initiatives and a tax cut.The next chapter describes the President�s plans for achieving that goal.
28
GUIDE01.QXD 2/2/2000 2:41 PM Page 28
5. THE PRESIDENT�S 2001 BUDGET
The President�s 2001 Budget promises the fourth balanced budget of thisAdministration. With it, the Nation�s fiscal house is in order. The budgetupholds fiscal discipline while investing wisely in our Nation�s priorities. Thepolicy of fiscal discipline which President Clinton pursued from the start ofhis term has produced a profound reversal of course, replacing the largestFederal budget deficit in history with the largest surplus in history. As a result,we have created the conditions for unprecedented prosperity, and weprepared to meet the challenges of the new century by expandingopportunity and prosperity to all reaches of the Nation.
The President is committed to saving Social Security and Medicare andensuring the long-range health of these plans. The pending retirement ofAmerica�s baby boomers will put significant pressure on these importantprograms. The President�s efforts have led to a general acceptance of thevital importance of protecting the Social Security surplus. The next step is toextend Social Security solvency through debt reduction. The President�s planto save Social Security will protect the entire Social Security surplus,dedicating it to pay down the debt and extend the solvency of the programto mid-century. This plan will extend Medicare until 2025, modernizing itwith a needed prescription drug benefit.
While respecting fiscal discipline, the budget also invests wisely in theAmerican people, through investments that will promote economic growth,advance our quality of life, including health, safety and a clean environment,protect our national security, and otherwise provide for our Nation�s needs inthe future. The budget invests in education and training so Americans canmake the most of this economy�s opportunities. It invests in health and theenvironment to improve our quality of life. It invests in our security at homeand abroad and strengthens law enforcement with the resources they need tosafeguard our national interests.
The President�s budget makes these investments while maintaining thediscipline that has been the hallmark of this Administration�s fiscal policy.The budget forecasts that the Government will produce a surplus again thisyear, and will continue to do so for decades to come. Our success ineliminating the budget deficit has brought with it unprecedented prosperity tothe Nation. It is now our responsibility to maintain this fiscal discipline at a
29
GUIDE01.QXD 2/2/2000 2:41 PM Page 29
time of prosperity, to meet the challenges of the aging of America and toprovide for the investments that will keep our Nation strong in the future.
Investing in Our Future
The President�s budget maintains fiscal discipline while building on efforts toinvest in the American people. It continues his policy of helping workingfamilies with their basic needs�raising their children, sending them tocollege, and expanding access to health care. It invests in education andtraining, the environment, science and technology, law enforcement, andother priorities to help raise the standard of living and quality of life ofAmericans.
In this budget, the President is proposing major initiatives that will continuehis investments in high-priority areas�from expanding access to healthinsurance for low-income children and extending it to their hard-workingparents, to helping working parents with their child care expenses; to helpingStates and school districts recruit and prepare thousands more teachers andbuild thousands more classrooms, and, to making every effort to fight gunviolence.
The President has sought to support working families, to encourageresponsibility and to help balance the demands of work and family. In thisbudget he proposes an expansion of the Earned Income Tax Credit to liftmore hard-pressed working families out of poverty. He proposes makingchild care more affordable, accessible and safe, by expanding tax credits formiddle-income families and for businesses to expand their child careresources. The budget proposes an Early Learning Fund, to promoteactivities to improve early childhood education and the quality of child carefor those under age five.
The President has worked hard to expand health care coverage and improvethe Nation�s health. The budget seeks to expand the State Children�s HealthInsurance Initiative, established in 1997, to provide access to health carecoverage for low-income children and to extend it to their hard-workingparents. The budget gives new insurance options to hundreds of thousandsof Americans aged 55 to 65. The President�s budget proposes initiatives tohelp patients, families, and care givers cope with the burdens of long-termcare. It enables more Medicare beneficiaries to receive promising cancertreatments by participating more easily in clinical trials. And, it improves thefiscal soundness of Medicare and Medicaid through new managementproposals, including programs to combat waste, fraud, and abuse.
30
GUIDE01.QXD 2/2/2000 2:41 PM Page 30

The President�s efforts have also enhanced access to, and the quality of,education and training. The budget takes the next step by continuing to helpStates and school districts reduce class size by recruiting and preparingthousands more teachers and repairing and building thousands moreclassrooms. The budget proposes a peer review initiative to raise teacherstandards and teacher pay, and a school accountability initiative holdingStates and schools accountable for results by providing resources to identifyand turn around the worst-performing schools, and incentives to rewardStates that do the most to improve student performance and close theachievement gap. The budget also proposes further increases in themaximum Pell Grant to help low-income undergraduates complete theircollege education.
The budget expands the interagency Lands Legacy initiative, which preservesour national heritage by protecting the Nation�s natural treasures and historicplaces and advancing preservation of open spaces in communities. Theresources will give State and local governments the tools for orderly growthwhile protecting and enhancing green spaces, clean water, wildlife habitats,and outdoor recreation. The budget proposes a dedicated and protectedstream of funding for Lands Legacy to continue to meet these needs in thefuture. It also proposes an initiative to help reduce the threat of globalwarming through clean energy technologies and an action plan to combatpollution in the Great Lakes.
The President has worked to bring peace to troubled parts of the world, andhe has played a leadership role in Northern Ireland, Bosnia, and the MiddleEast. Last year, the United States stood against the vicious campaign ofethnic cleansing in Kosovo and is now helping to build stability anddemocracy there. We have worked to detect and counter terrorist threats andcontinue efforts with Russia and other former Soviet nations to halt thespread of dangerous weapons materials. The budget seeks to build on theseefforts, with funding to build a more stable society in Kosovo, to furtherprotect our men and women serving the Nation�s interests through diplomacyoverseas, and, in a 2000 emergency supplemental appropriations request, toprovide critical assistance to the Government of Colombia in its fight againstnarcotics traffickers.
The Armed Forces of the United States serve as the backbone of our nationalsecurity strategy. As it did successfully last year in Kosovo, the military mustbe in a position to protect our national security interests and guard againstthe major threats to U.S. security. This budget builds upon the majorcommitment last year to maintain military readiness, with additionalresources for required training standards, maintain equipment in top
31
GUIDE01.QXD 2/2/2000 2:41 PM Page 31
condition, recruit and retain quality personnel, and procure sufficient spareparts and other equipment. This budget also provides resources to combatemerging threats, including terrorism, weapons of mass destruction andcyber crime, and to protect critical infrastructure.
Improving Performance Through Better Management
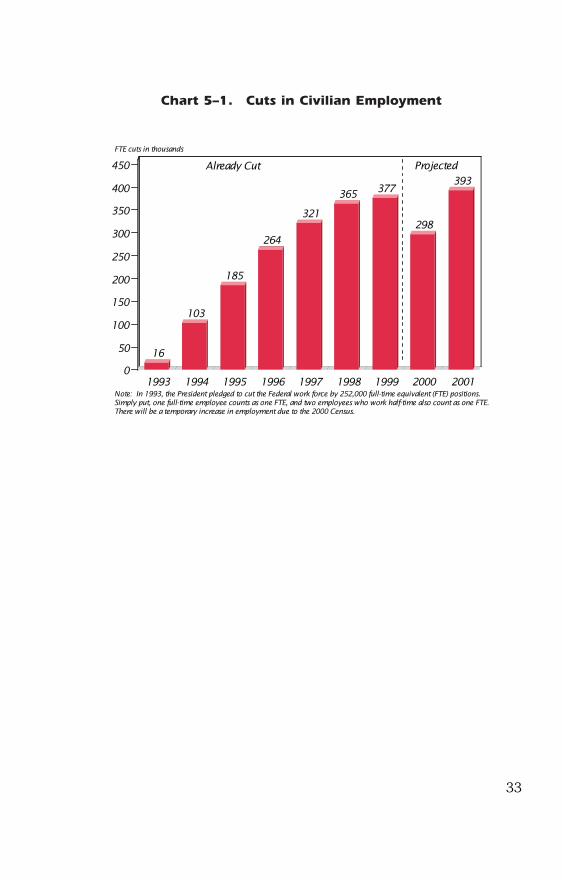
A key element in the Administration�s ability to expand strategic investments,while balancing the budget, is improving performance through bettermanagement. Improved stewardship of the Government can help it betterachieve its mission and improve the quality of life for all Americans. To thisend, the President and Vice President have streamlined Government,reducing its work force by 377,000, and eliminated obsolete or duplicativeprograms (see Chart 5�1).
The Administration is working to create not just a smaller Government�buta better one, Government that provides services and benefits to its ultimatecustomers, the American people. When Government works for the people�when citizens receive good basic services and have faith in the Governmentthat provides them�their trust in Government can be restored.
Therefore, the Administration is forging ahead with new and additionalefforts to improve the quality of the service that the Government offers itscustomers. It has identified its highest priorities�24 Priority ManagementObjectives (PMOs) that will receive heightened attention to ensure positivechanges in the way Government works. These PMOs include modernizingstudent aid delivery, implementing IRS reforms, and improving themanagement of the Health Care Financing Administration, which overseesMedicare.
32
GUIDE01.QXD 2/2/2000 2:41 PM Page 32
33
16
103
185
264
321
365 377
298
393
1993 1994 1995 1996 1997 1998 1999 2000 20010
50
100
150
200
250
300
350
400
450 Already Cut Projected
FTE cuts in thousands
Note: In 1993, the President pledged to cut the Federal work force by 252,000 full-time equivalent (FTE) positions. Simply put, one full-time employee counts as one FTE, and two employees who work half-time also count as one FTE. There will be a temporary increase in employment due to the 2000 Census.
Chart 5�1. Cuts in Civilian Employment
GUIDE01.QXD 2/2/2000 2:41 PM Page 33
Glossary
Appropriation
An appropriation is an act of Congress that enables Federal agencies tospend money for specific purposes.
Authorization
An authorization is an act of Congress that establishes or continues aFederal program or agency, and sets forth the guidelines to which it mustadhere.
Balanced Budget
A balanced budget occurs when total revenues equal total outlays for afiscal year.
Budget Authority (BA)
Budget authority is what the law authorizes, or allows, the FederalGovernment to spend for programs, projects, or activities.
Budget Enforcement Act (BEA) of 1990
The BEA is the law that was designed to limit discretionary spendingwhile ensuring that any new entitlement program or tax cuts did notmake the deficit worse. It set annual limits on total discretionary spendingand created �pay-as-you-go�� rules for any changes in entitlements andtaxes (see �pay-as-you-go��).
Balanced Budget and Emergency Deficit Control Act of 1985(Gramm-Rudman-Hollings, or GRH)
The Balanced Budget and Emergency Deficit Control Act of 1985 wasdesigned to end deficit spending. It set annual deficit targets for fiveyears, declining to a balanced budget in 1991. If necessary, it requiredacross-the-board cuts in programs to comply with the deficit targets. Itwas never fully implemented.
Budget Resolution
The budget resolution is the annual framework within which Congressmakes its decisions about spending and taxes. This framework includestargets for total spending, total revenues, and the deficit, as well as
35
GUIDE01.QXD 2/2/2000 2:41 PM Page 35
allocations, within the spending target, for discretionary and mandatoryspending.
�Cap��
A �cap�� is a legal limit on annual discretionary spending.
Deficit
The deficit is the difference produced when spending exceeds revenuesin a fiscal year.
Discretionary Spending
Discretionary spending is what the President and Congress must decideto spend for the next fiscal year through 13 annual appropriations bills.Examples include money for such activities as the FBI and the CoastGuard, housing and education, space exploration and highwayconstruction, and defense and foreign aid.
Entitlement
An entitlement is a program that legally obligates the FederalGovernment to make payments to any person who meets the legalcriteria for eligibility. Examples include Social Security, Medicare, andMedicaid.
Excise Taxes
Excise taxes apply to various products, including alcohol, tobacco,transportation fuels, and telephone service.
Federal Debt
The gross Federal debt is divided into two categories: debt held by thepublic, and debt the Government owes itself. Another category is debtsubject to legal limit.
Debt Held by the Public
Debt held by the public is the total of all Federal deficits, minus surplus,over the years. This is the cumulative amount of money the FederalGovernment has borrowed from the public, through the sale of notesand bonds of varying sizes and time periods until maturity.
Debt the Government Owes Itself
Debt the Government owes itself is the total of all trust fund surplusesover the years, like the Social Security surplus, that the law says mustbe invested in Federal securities.
36
GUIDE01.QXD 2/2/2000 2:41 PM Page 36
Debt Subject to Legal Limit
Debt subject to legal limit, which is roughly the same as gross Federaldebt, is the maximum amount of Federal securities that may be legallyoutstanding at any time. When the limit is reached, the President andCongress must enact a law to increase it.
Fiscal Year
The fiscal year is the Government�s accounting period. It begins October1 and ends on September 30. For example, fiscal 2001 ends September30, 2001.
Gramm-Rudman-Hollings
See Balanced Budget and Emergency Deficit Control Act of 1985.
Gross Domestic Product (GDP)
GDP is the standard measurement of the size of the economy. It is thetotal production of goods and services within the United States.
Mandatory Spending
Mandatory spending is authorized by permanent law. An example isSocial Security. The President and Congress can change the law tochange the level of spending on mandatory programs�but they don�thave to.
�Off-Budget��
By law, the Government must distinguish �off-budget�� programsseparate from the budget totals. Social Security and the Postal Serviceare �off-budget.��
�On-Budget��
Those programs not legally designated as off-budget.
Outlays
Outlays are the amount of money the Government actually spends in agiven fiscal year.
�Pay-As-You-Go��
Set forth by the BEA, �pay-as-you-go�� refers to requirements that newspending proposals on entitlements or tax cuts must be offset by cuts inother entitlements or by other tax increases, to ensure that the deficitdoes not rise (see BEA).
37
GUIDE01.QXD 2/2/2000 2:41 PM Page 37
Receipt
This is another word for revenue.
Revenue
This is another word for receipt. Revenues include the collections thatresult from Government activity, such as taxes. They do not includecollections that result from the Government�s business-like activities, suchas the entrance fees at national parks. Business-like collections aresubtracted from total spending to calculate outlays for the year.
Social Insurance Payroll Taxes
This tax category includes Social Security taxes, Medicare taxes,unemployment insurance taxes, and Federal employee retirementpayments.
Surplus
A surplus is the amount by which revenues exceed outlays.
Trust Funds
Trust funds are Government accounts, set forth by law as trust funds, forrevenues and spending designated for specific purposes.
Unified Federal Budget
The unified budget, the most comprehensive display of theGovernment�s finances, is the presentation of the Federal budget inwhich revenues from all sources and outlays to all activities areconsolidated.
38
GUIDE01.QXD 2/2/2000 2:41 PM Page 38
List of Charts and Tables
List of Charts Page
What Is the Budget?
1�1 Government Spending as a Share of GDP, 1999 . . . . . . . . . . 2
1�2 Total Government Outlays as a Percent of GDP . . . . . . . . . . . 3
Where the Money Comes From�and Where It Goes
2�1 Family Budgeting . . . . . . . . . . . . . . . . . . . . . . . . . . . . . . . . 5
2�2 National Budgeting. . . . . . . . . . . . . . . . . . . . . . . . . . . . . . . 6
2�3 The Federal Government Dollar�Where It Comes From . . . . . 7
2�4 Composition of Revenues . . . . . . . . . . . . . . . . . . . . . . . . . . 9
2�5 Revenues as a Percent of GDP�Comparison With Other Countries . . . . . . . . . . . . . . . . . . . . . . . . . . . . . . . . . . . . . 9
2�6 The Federal Government Dollar�Where It Goes . . . . . . . . . . 10
2�7 On- and Off-Budget Deficit Projections . . . . . . . . . . . . . . . . . 16
How Does the Government Create a Budget?
3�1 Major Steps in the Budget Process . . . . . . . . . . . . . . . . . . . . 18
The Budget Surplus and Fiscal Discipline
4�1 Past and Future Budget Deficits or Surplus . . . . . . . . . . . . . . 21
4�2 Outlays as a Percent of GDP . . . . . . . . . . . . . . . . . . . . . . . . 22
4�3 Total Government Surplus or Deficit as a Percent of GDP . . . . 24
The President�s 2001 Budget
5�1 Cuts in Civilian Employment . . . . . . . . . . . . . . . . . . . . . . . . 33
39
GUIDE01.QXD 2/2/2000 2:41 PM Page 39
List of Tables Page
Where the Money Comes From�and Where It Goes
2�1 Revenues by Source�Summary . . . . . . . . . . . . . . . . . . . . . . 8
2�2 Spending Summary . . . . . . . . . . . . . . . . . . . . . . . . . . . . . . 12
2�3 Total Spending by Function . . . . . . . . . . . . . . . . . . . . . . . . . 13
2�4 Discretionary Spending by Agency . . . . . . . . . . . . . . . . . . . . 14
Deficits and the Debt
4�1 Federal Government Financing and Debt. . . . . . . . . . . . . . . . 25
40
GUIDE01.QXD 2/2/2000 2:41 PM Page 40
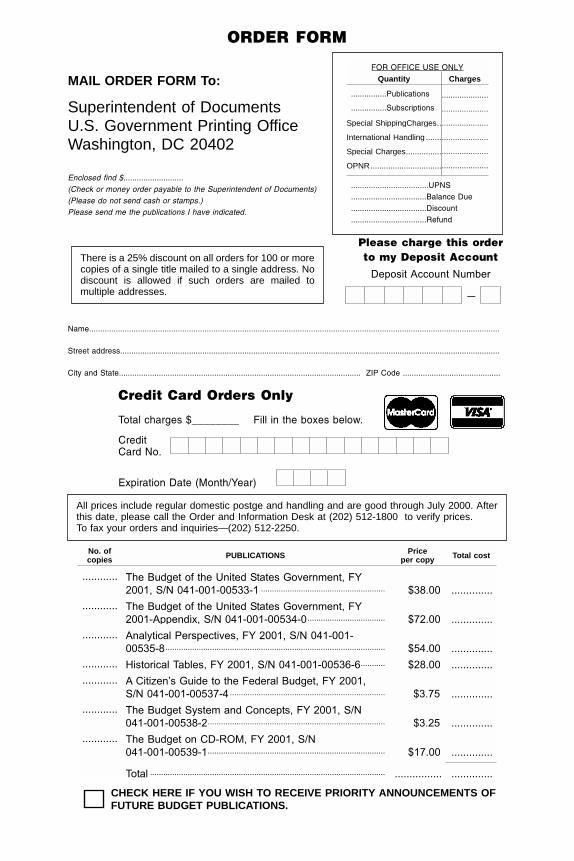
ORDER FORM
MAIL ORDER FORM To:
Superintendent of DocumentsU.S. Government Printing OfficeWashington, DC 20402
Enclosed find $...........................
(Check or money order payable to the Superintendent of Documents)
(Please do not send cash or stamps.)
Please send me the publications I have indicated.
Please charge this order
to my Deposit Account
Deposit Account Number
Name.........................................................................................................................................................................................
Street address...........................................................................................................................................................................
City and State............................................................................................................. ZIP Code ............................................
Credit Card Orders Only
Total charges $________ Fill in the boxes below.
CreditCard No.
Expiration Date (Month/Year)
No. ofcopies PUBLICATIONS Price
per copy Total cost
............ The Budget of the United States Government, FY2001, S/N 041-001-00533-1 ........................................................ $38.00 ..............
............ The Budget of the United States Government, FY2001-Appendix, S/N 041-001-00534-0................................... $72.00 ..............
............ Analytical Perspectives, FY 2001, S/N 041-001-00535-8................................................................................................... $54.00 ..............
............ Historical Tables, FY 2001, S/N 041-001-00536-6........... $28.00 ..............
............ A Citizen’s Guide to the Federal Budget, FY 2001,S/N 041-001-00537-4 ...................................................................... $3.75 ..............
............ The Budget System and Concepts, FY 2001, S/N041-001-00538-2................................................................................ $3.25 ..............
............ The Budget on CD-ROM, FY 2001, S/N041-001-00539-1................................................................................ $17.00 ..............
Total .......................................................................................................... ................ ..............
CHECK HERE IF YOU WISH TO RECEIVE PRIORITY ANNOUNCEMENTS OFFUTURE BUDGET PUBLICATIONS.
FOR OFFICE USE ONLY
Quantity Charges
................Publications .....................
................Subscriptions .....................
Special ShippingCharges.......................
International Handling ............................
Special Charges.....................................
OPNR.....................................................
...................................UPNS
..................................Balance Due
..................................Discount
..................................Refund
All prices include regular domestic postge and handling and are good through July 2000. Afterthis date, please call the Order and Information Desk at (202) 512-1800 to verify prices.To fax your orders and inquiries—(202) 512-2250.
—
There is a 25% discount on all orders for 100 or morecopies of a single title mailed to a single address. Nodiscount is allowed if such orders are mailed tomultiple addresses.