Embed Size (px)
Citation preview
29th September, 2018
The Manager, Listing Department, National Stock Exchange of India Ltd. “Exchange Plaza”, C-1, Block G, Bandra-Kurla Complex, Bandra (E), Mumbai – 400 051 Symbol: HPL
BSE Limited 25th Floor, New Trading Ring, Rotunda Building, Phiroze Jeejeebhoy Towers, Dalal Street, Fort, Mumbai – 400 001 Scrip Code: 540136
Sub:- Annual Report 2017-18 of HPL Electric & Power Limited
Dear Sir, In reference with the captioned subject, we are submitting herewith the Annual Report for the Financial Year 2017-18 which has been approved and adopted in the 26th Annual General Meeting of HPL Electric & Power Limited held on 27th September, 2018, in terms of Regulation 34 of SEBI (Listing Obligations and Disclosure Requirements) Regulations, 2015. This is for your kind information and record.
Thanking You
Yours Faithfully
For HPL ELECTRIC & POWER LIMITED
Vivek Kumar
Company Secretary
Encl: As above

Ready. Connect.
Grow.
Annual Report 2017-18
Contents
C 71 Standalone Financial Statements
118 Consolidated Financial Statements
Attendance Slip
Proxy Form
Financial Statements
Notice
71-166
167-174
A
B
01 Corporate Information
04 Company Profile
06 Business Highlights
07 Financial Highlights
08 Chairman’s Message
10 Strong Platform for Growth
12 Powering a Deeper Connect
14 Ready with Smart Solutions
16 Ready to Meet Growing Demand
18 Ready to Light Up India
20 Ready to Electrify India
22 Board of Directors
24 Management Discussion and Analysis
29 Directors’ Report
55 Corporate Governance Report
Corporate Overview
Statutory Reports
01-23
24-70
Forward-looking statementThis report may contain some statements on the Company’s business or financials which may be construed as forward looking based on the management’s plans and assumptions. The actual results may be materially different from these forward - looking based statements although we believe we have been prudent in our assumptions.
Corporate Information
BOARD OF DIRECTORS
Mr. Lalit Seth
Chairman and Managing Director
Mr. Rishi Seth
Jt. Managing Director
Mr. Gautam Seth
Jt. Managing Director
Mr. Chandra Prakash Jain
Whole-time Director
Mr. Vinod Ratan Gupta
Whole-time Director
Mr. Jatinder Singh Sabharwal
Independent Director
Mrs. Madhu Bala Nath
Independent Director
Mr. Tarun Sehgal
Independent Director
Mr. Jainul Haque
Independent Director
Mr. Hargovind Sachdev
Independent Director
CHIEF FINANCIAL OFFICER
Mr. Sudhir Barik
COMPANY SECRETARY
Mr. Vivek Kumar
CORPORATE IDENTIFICATION NO. (CIN)
L74899DL1992PLC048945
REGISTERED & CORPORATE OFFICE
Registered Office:
1/20, Asaf Ali Road, New Delhi - 110 002
Tel.: +91-11-23234411
Fax: +91-11-23232639
Corporate Office:
Windsor Business Park, B-1D, Sector - 10,
Noida-201 301 (UP)
Email: [email protected]
Website: www.hplindia.com
Tel.: +91-120-4656300
Fax: +91-120-4656333
STATUTORY AUDITORS
M/s. Kharabanda Associates
Chartered Accountants, New Delhi
INTERNAL AUDITORS
PricewaterhouseCoopers
Private Limited (PwC)
Chartered Accountants, New Delhi
COST AUDITORS
M/s. Bikram Jain & Associates
Cost Accountants, Jaipur
SECRETARIAL AUDITORS
M/s. AVA Associates
Practising Company Secretaries
New Delhi
REGISTRAR & TRANSFER AGENT
Karvy Computershare Private Limited
Karvy Selenium Tower B, Plot 31-32,
Gachibowli Financial District,
Nanakramguda, Hyderabad - 500 032
Toll Free No. : 1800-345-4001
Fax: 040-23001153
Email: [email protected]
Website: www.karvy.com
WORKS
» Plot No. 132-133, Pace City-I,
Sector -37, Gurgaon, Haryana
» Plot No. 357-Q, , Pace City-II,
Sector-37, Gurgaon, Haryana
» Vill: Shavela, P.O. Jabli, Distt. Solan,
Himachal Pradesh
» Vill: Bigan, Dhaturi Road, Tehsil
Gannaur, Sonepat, Haryana
» Plot No. 76-B, Phase IV,
Sector-57, HSIIDC
Industrial Area, Kundli - 131 028
Sonepat, Haryana
» Main GT Karnal Road, Village-
Bastawa, Tehsil Gharonda,
District-Karnal, Haryana
BANKERS/LENDERS
State Bank of India
Oriental Bank of Commerce
IDBI Bank Ltd.
DBS Bank Ltd.
IndusInd Bank Ltd.
Axis Bank Ltd.
HDFC Bank Ltd.
Karnataka Bank Ltd.
ICICI Bank Ltd.
Canara Bank
RBL Bank Ltd.
Bank of Bahrain & Kuwait B.S.C.
Bank of Baroda
Yes Bank

India’s electrical equipment industry stands on the threshold of unprecedented growth. Sustained economic growth combined with the Government flagship programmes such as ‘Power for All’, ‘Housing for All’ and 100 Smart Cities Mission are just a few of the promising developments expected to provide a strong impetus to market demand.
Our state-of-the-art infrastructure is well-equipped to manufacture the quality electrical solutions that India needs. An extensive and growing product range means that we provide the ideal one-stop shop for all electrical needs. And with our sustained focus on R&D, are continually upgrading our technologies and products to serve our customers in the best way possible.
We are ready to respond.
We are charged to connect.
02
HPL Electric & Power Limited

We have amplified our brand visibility and recall with an aggressive marketing and advertising strategy. Our robust distribution network ensures easy availability of our products and we continue to deepen our relationship with our trade partners. At the same time, our strong credentials rank us high with our customers.
All in all, we have the capability and connect to scale new echelons of success. We are moving forward, intent on our purpose; there is no looking back. A future of greater heights is our destination.
The electrifying future we see for HPL electric & Power Limited
Ready. Connect. Grow.
We are poised to grow.
03
Annual Report 2017-18C
orporate R
eview
*
Company Profile
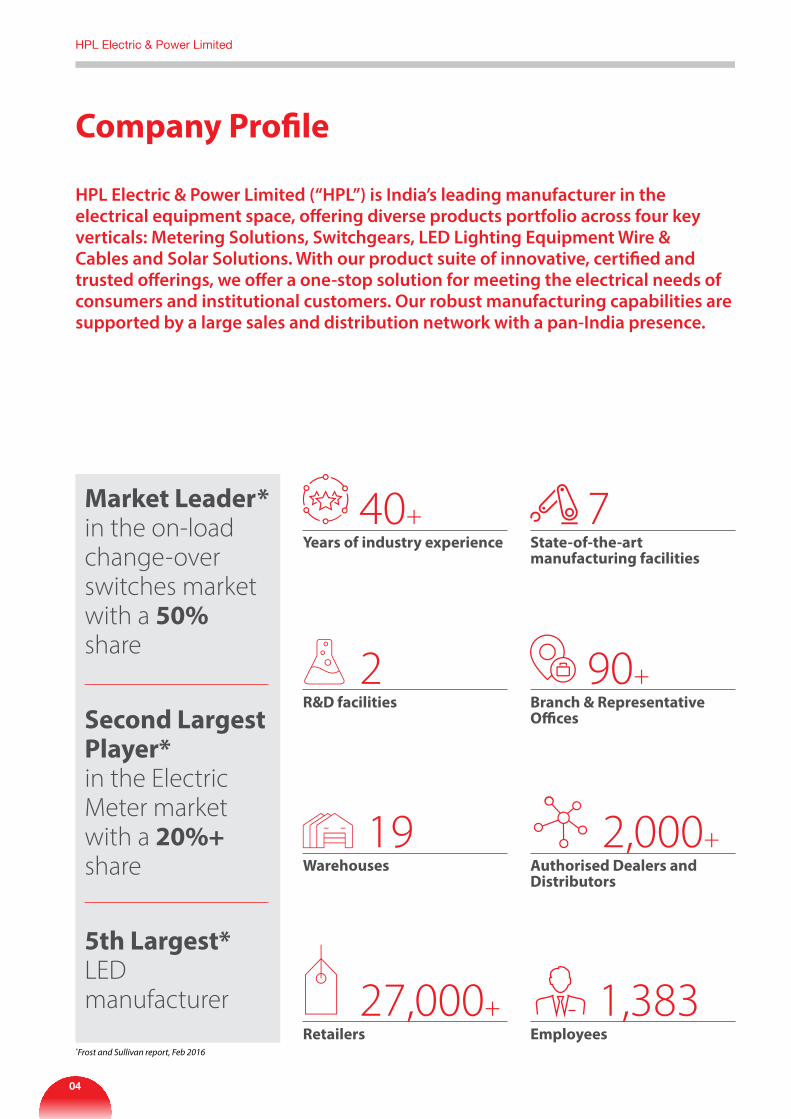
HPL electric & Power Limited (“HPL”) is India’s leading manufacturer in the electrical equipment space, offering diverse products portfolio across four key verticals: Metering Solutions, Switchgears, LeD Lighting equipment Wire & Cables and Solar Solutions. With our product suite of innovative, certified and trusted offerings, we offer a one-stop solution for meeting the electrical needs of consumers and institutional customers. Our robust manufacturing capabilities are supported by a large sales and distribution network with a pan-India presence.
Market Leader in the on-load change-over switches market with a 50% share
Second Largest Player* in the Electric Meter market with a 20%+ share
5th Largest* LED manufacturer
40+Years of industry experience
7State-of-the-art manufacturing facilities
2R&D facilities
90+Branch & Representative Offices
19Warehouses
2,000+Authorised Dealers and Distributors
27,000+Retailers
1,383Employees
*Frost and Sullivan report, Feb 2016
04
HPL Electric & Power Limited
PRODuCT PORTfOLI
O
Switchgears Lighting equipment Wires and CablesSolar Products
SuB BRaNDS
Group Meter
Metering Solutions
Smart Meter
Prepaid Meter
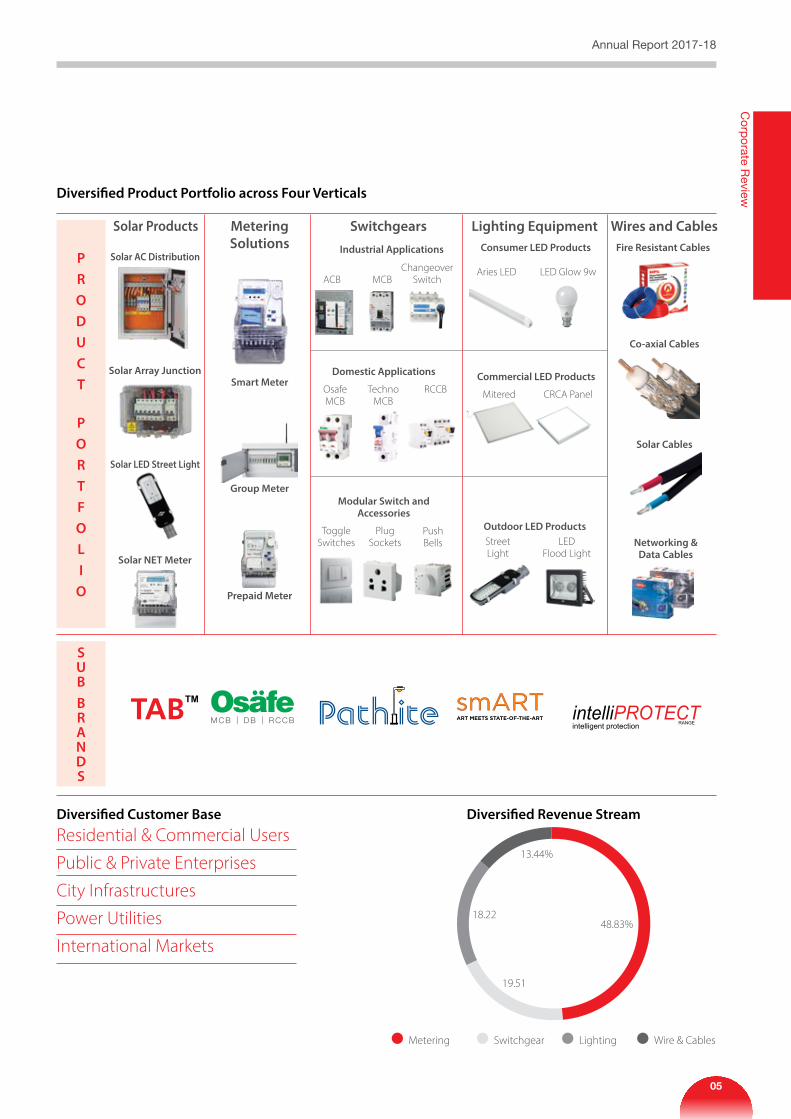
Diversified Product Portfolio across four Verticals
Diversified Revenue Stream
Industrial applications Consumer LeD Products fire Resistant CablesSolar aC Distribution
Co-axial Cables
Solar Cables
Networking &Data Cables
Aries LED
Mitered
StreetLight
CRCA Panel
LEDFlood Light
LED Glow 9w
Domestic applications Commercial LeD Products
Outdoor LeD Products
Modular Switch and accessories
ACB
OsafeMCB
Techno MCB
RCCB
MCBChangeover
Switch
Toggle Switches
Plug Sockets
Push Bells
Solar array Junction
Solar LeD Street Light
Solar NeT Meter
48.83%
19.51
18.22
13.44%
Diversified Customer Base Residential & Commercial Users
Public & Private Enterprises
City Infrastructures
Power Utilities
International Markets
Metering Switchgear Lighting Wire & Cables
TM
05
Annual Report 2017-18C
orporate R
eview
Business Highlights
Strong business growth in the second half of the fiscal: H2 fY2018 revenues increased by 33% compared to H1 fY2018 driven by an improved performance across all business segments.
Operating profitability significantly improved in the second half of the fiscal: H2 fY2018 eBITDa and PaT grew by 23% and 42% respectively compared to H1 fY2018.
Robust order book of ₹450.5 crore as on May 2018; improvement in order book to lead to increase in turnover and profitability.
Capacity utilisation levels significantly improved across all business segments over the last two quarters.
Completed the project of installation of smart lighting solutions in Bhopal as part of the Government of India’s Smart Cities Mission, making Bhopal the ‘first Smart City’.
Received BIS IS 16444 certification for our smart meters.
High brand visibility through aggressive marketing and brand promotion: Total spend on advertising was ₹15.03 crore in 2018 as compared to ₹10.35 crore in the previous year.
Continued focus on reducing working capital requirements: Number of days for receivables has decreased from 203 days (on net basis) in September 2017 to 164 days in March 2018.
Developed a complete range of solar solutions across meters, switchgears, lighting and wires & cables to tap opportunities in the renewable energy space.
Continued focus on R&D to launch and market exciting new innovative products loaded with improved features, energy efficiency, automation and communication.
06
HPL Electric & Power Limited
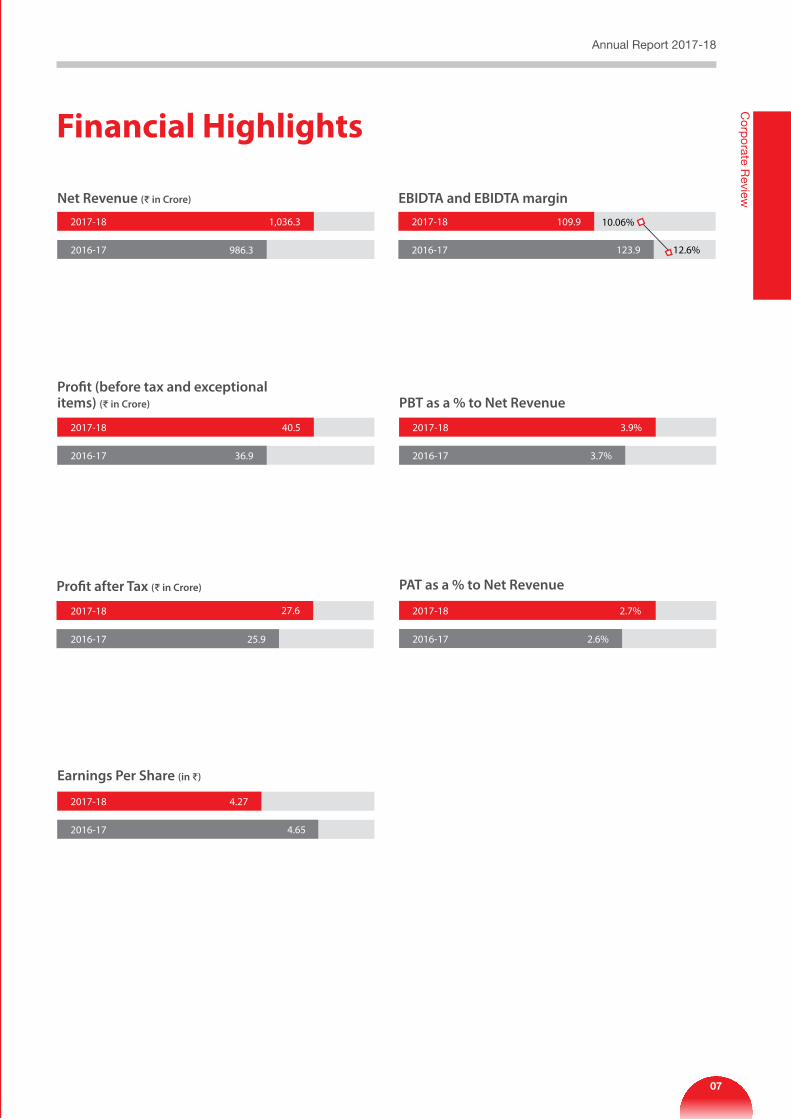
Financial Highlights
earnings Per Share (in ₹)
2017-18
4.65
4.27
2016-17
Profit (before tax and exceptional items) (₹ in Crore) PBT as a % to Net Revenue
2017-18 2017-18
36.9
40.5 3.9%
3.7%2016-17 2016-17
PaT as a % to Net RevenueProfit after Tax (₹ in Crore)
2017-182017-18
2.6%25.9
27.6
2016-172016-17
Net Revenue (₹ in Crore) eBIDTa and eBIDTa margin
2017-18 2017-181,036.3 109.9
986.3 123.9 12.6%
10.06%
2016-17 2016-17
2.7%
07
Annual Report 2017-18C
orporate R
eview
Chairman’s Message
Dear Shareholders,We stand at the cusp of dynamic transformation of India’s infrastructure; against this backdrop, we successfully leveraged our robust foundation to deliver improved results across most of our business segments. It is my privilege and pleasure to take you through this performance as well as the other highlights of the year and the way forward, as I present the 26th annual Report of your Company.
In India, the first half of fiscal 2018 was marked by the adjustment to the Goods and Services Tax (GST), arguably the biggest and most decisive tax reform in the country post-Independence. The GST is a welcome measure as from the longer term perspective as it leads to greater formalisation of the economy and eliminates the cascading effect of diverse taxes. While this reform moderated economic growth in the first half of the year, with stabilisation of the GST, the economy bounced back in the second half to reclaim its position as the fastest growing major economy in the world.
The implementation of GST disrupted demand in our trade business in the first half of the fiscal. Channel partners opted for pre-GST inventory destocking due to lack of clarity and uncertainty over availability of input tax credit. Restocking by channel partners took time till the teething issues of the new tax regime were largely resolved. Post stabilisation of trade channels, our trade business displayed healthy growth. Switchgear, lighting and wires & cables revenues went up 58%, 32% and 26% respectively in the second half of the year compared to the first half, underlining the strong recovery. On a year-on-year basis, switchgear business grew by 12%. While the lighting segment de-grew by 17% due to higher phase of a large bulk LED order in 2017 and also due to phase out of CFL lighting, we remain enthused by the strong traction displayed by the LED trade business. The wires and cables segment also remained stable during the year driven by speciality cable orders.
Our biggest achievement for the year was the impressive revival in our metering business. Successful bids for the right contracts and its efficient execution resulted in metering business growing by 14% on a year-on-basis. More importantly, as on May 31, 2018, we have a robust order book of ₹477.6 crore, providing strong revenue visibility over the coming year.
Gaining momentum across all our business verticals in the second half of the fiscal, we achieved steady growth in overall revenues. Total revenues for the year (net of excise) stood at ₹1,036 crore as against ₹986 crore in the previous year, an increase of 5.1%. Our margins were, however, impacted due to unprecedented increase in the raw material prices. Our recent tenders reflect the raw material price increase and thus we are now better placed to protect our margins.
We would like to mention that our channel financing scheme has shown good progress and the benefits are visible at the operational level. We are also committed to improve the quality of our dealer network by bringing on board, dealers with clean financial records and those focussed on product redistribution. This will ensure fiscal discipline as well as boost our B2C business.
Another important pillar for driving our B2C business is our conscious investment in brand building. We firmly believe that our
08
HPL Electric & Power Limited
brand is a tremendous asset which can help us to enhance our realisations and also our margins. Our advertising and marketing spend increased by almost 50% on a year-on-year basis. HPL was one of the sponsor to the Royal Challengers Bangalore cricket team of the Indian Premier League (IPL). While cricket enjoys huge viewership across the country, our association has led to strong brand visibility and recall.
We are delighted to share that our smart meters received the BIS certification, making HPL among the select few companies in India to be recognised with this qualification. This milestone enhances our status as a technologically advanced meter supplier and gives us an edge by way of pre-qualification in the smart metering opportunity. On the back of the Government’s focus on smart grids and smart cities, the market for smart meters is tipped to grow exponentially; with our new certification, we are confident of ushering in promising prospects.
In another landmark achievement, we completed the installation of smart lighting solutions in Bhopal in accordance with the Smart Cities initiative undertaken by the Government. Among the 100 shortlisted smart cities, Bhopal is the first to have completed the project of smart lighting. We are proud to partner the Government in their efforts to build a New India. At the same time, the experience we have gained will prove valuable in our future endeavours.
The next energy revolution is upon us: clean energy is here to stay. At HPL, building on our culture of innovation, we have developed a complete range of solar energy solutions. The product diversification will enable us to embrace a brighter tomorrow for all our stakeholders. This innovation is the outcome of sustained thrust on research and development. We continue to focus on developing new products incorporating solar technology and making the existing product line flexible enough to cater to and accommodate the various specifications of our end customers in India and the International Market.
We finished 2018 on a strong note despite a sluggish start. We are now poised for moving to an even higher growth trajectory. Our positivity has strong roots. As India seeks to provide more affordable, more accessible, reliable and sustainable power to all its people, Government projects such as Saubhagya, Integrated Power Development Scheme (IPDS) and Deen Dayal Upadhyaya Gram Jyoti Yojana (DDUGJ) should gain vigour. All of them have a meter requirement which improves the prospects for our metering business. In addition, initiatives such as ‘Housing for All’, Smart Cities Mission, 4G installation in the telecom sector augur well for our different verticals. Switchgear and lighting segments continue to be largely been driven by robust sales in trade business while the wires & cables segment is set to see strong traction driven by trade & speciality cables orders.
The next energy revolution is upon us: Clean energy is here to stay. at HPL, building on our culture of innovation, we have developed a complete range of solar energy solutions. The product diversification will enable us to embrace a brighter tomorrow for all our stakeholders.
We completed the installation of smart lighting solutions in Bhopal in accordance with the Smart Cities initiative undertaken by the Government.
All the opportunities aside, we understand, of course, that you would like us to shed light on our internal workings. Here is what you can expect from HPL in the months ahead: strong execution in our metering business; increased focus on controlling costs, driving procurement efficiency and maintaining working capital requirements at existing levels while ensuring healthy sales growth, further strengthening our balance sheet; and continued management efforts to drive double digit revenue growth across all verticals.
In closing, I would like to acknowledge the efforts and commitment shown by our people. Their collective experience and expertise keeps us on top of our game. I am also thankful to our stakeholders, including Central and State government bodies, customers, bankers, investors, creditors and dealers, for reposing their trust in our vision and strategies. HPL remains committed to a future of continuous growth. Thank you for joining us on the journey; we aim to make it a rewarding one.
Sincerely,
Lalit Seth Chairman and Managing Director
09
Annual Report 2017-18C
orporate R
eview
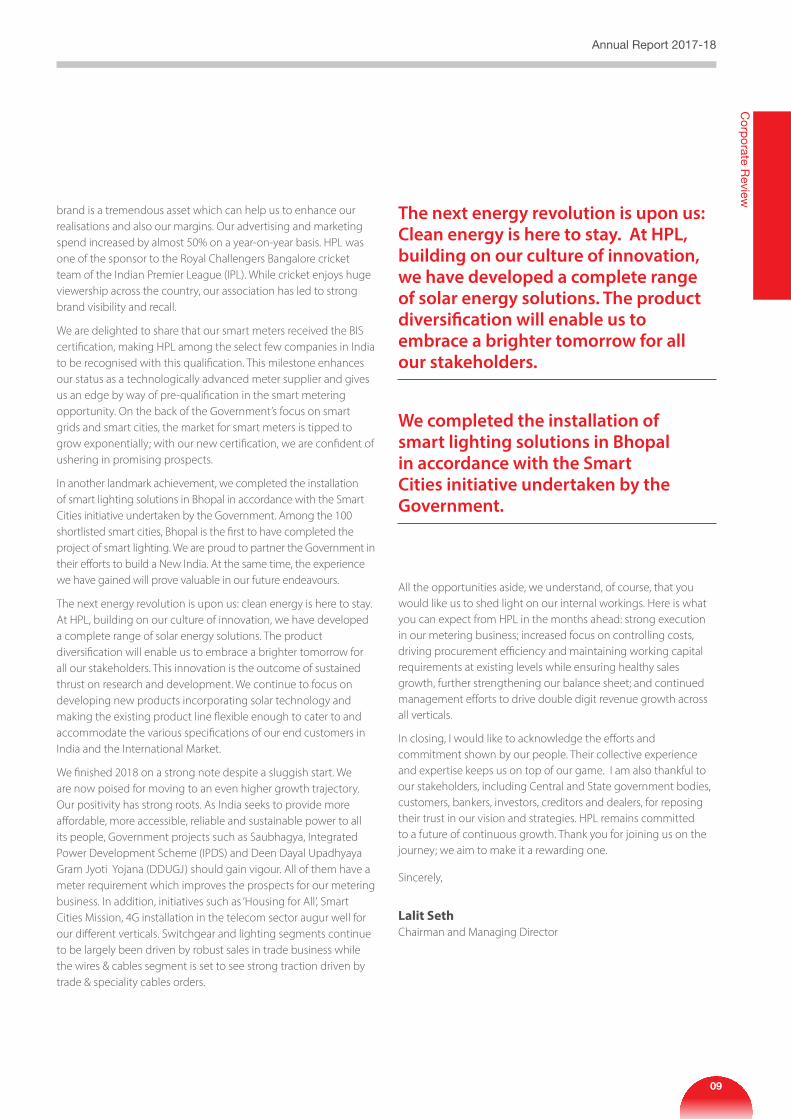
Strong Platform for GrowthThere’s a confidence that comes with competence; steadiness that builds on itself through years of experience, connect that deepens with trust delivered consistently, agility that stems from innovation and relevance that emanates from embedding latest technology. HPL embodies that premise, catalysing our efforts for growing to new heights.
Manufacturing ProcessWe have seven state-of-the-art manufacturing plants located across the states of Haryana and Himachal Pradesh. Our facilities are equipped to handle design and product development, component designing, tool making and commercial production. HPL’s manufacturing edge also lies in its capability to manufacture customised products for institutional customers and undertake modifications in products for OEMs and other corporate customers. Integrated manufacturing capabilities also help to keep our costs at a reasonable level and give us the flexibility to adopt new technologies at a very quick pace.
HPL has sufficient available capacity to achieve revenues of ₹ 2,500 crore without any major capex in the near future
Jabli Facility, Himachal Pradesh
10
HPL Electric & Power Limited

Comprehensive PortfolioWe offer a one-stop solution for Low Voltage Electrical Equipments across market segments and price ranges. With our large product portfolio, we are well-positioned to address the diverse market requirements and capture growth opportunity. Further, our complementary product offerings enable cross-selling and lead to strong brand recall.
Quality excellenceOur plants are ISO 9001:2000, ISO 14001 and ISO 27001:2005 certified, which makes us compliant with various international standards. We manufacture all our products in-house, as well as several components used therein. All of this helps us keep our quality at the highest level and brings consistency to our manufacturing across all product lines.
established RelationshipsWe have long-standing associations with institutional customers, power utilities and government agencies across India. In our metering and switchgear segments, we have created formidable entry barriers through high-end processes and solutions. Having already proved our mettle in the industry, we are well-positioned to capture emerging market opportunity.
Strong Pre-qualification CredentialsWe work with power utilities and government agencies pursuant to direct contractual arrangements, obtained through a bidding process, requiring certain pre-qualification requirements. HPL meets all pre-qualification credentials including past experience, technical requirements, quality and safety compliances, financial strength, price competitiveness.
Robust Distribution Our extensive distribution network enables us to reach out across the length and breadth of the country. Recognising the huge potential in the B2C segment, we are further enhancing our retail footprint. We are aggressively reaching out to new distributors who have a large retail network and are integrating those networks into our system. Our concerted efforts will help us to penetrate deeper into the market and boost the sales of our consumer-facing products. We are also strengthening our channel partner network through retail meets, engagement programmes, consistent promotional activities and incentive schemes.
Intense R&DProduct and process innovation across all our verticals is driven by the intense efforts of our research & development (R&D) team comprising over 100 engineers. We have two R & D centres which are approved by the Department of Scientific and Industrial Research, Ministry of Science and Technology, Government of India. Our testing facility is NABL accredited and ISO/IEC 17025:2005 compliant. These centres also help to upgrade the existing products, which needs to be done every two to three years to meet the new standards or to replace them with feedback from the market. In-house R&D efforts enable us reduce the price as well as our cost, thus retaining our margins.
extensive experienceThere is no substitute for experience; HPL has over four decades of proven track record in the industry. Further, the Company is led by a competent team at the strategic and management level. While the promoters have over 40 years of domain experience, the senior management team has an average experience of more than 20 years. Our solid grounding in the industry has enhanced our business credibility.
Kundli Facility, Haryana
Gharaunda Facility, Haryana
11
Annual Report 2017-18C
orporate R
eview
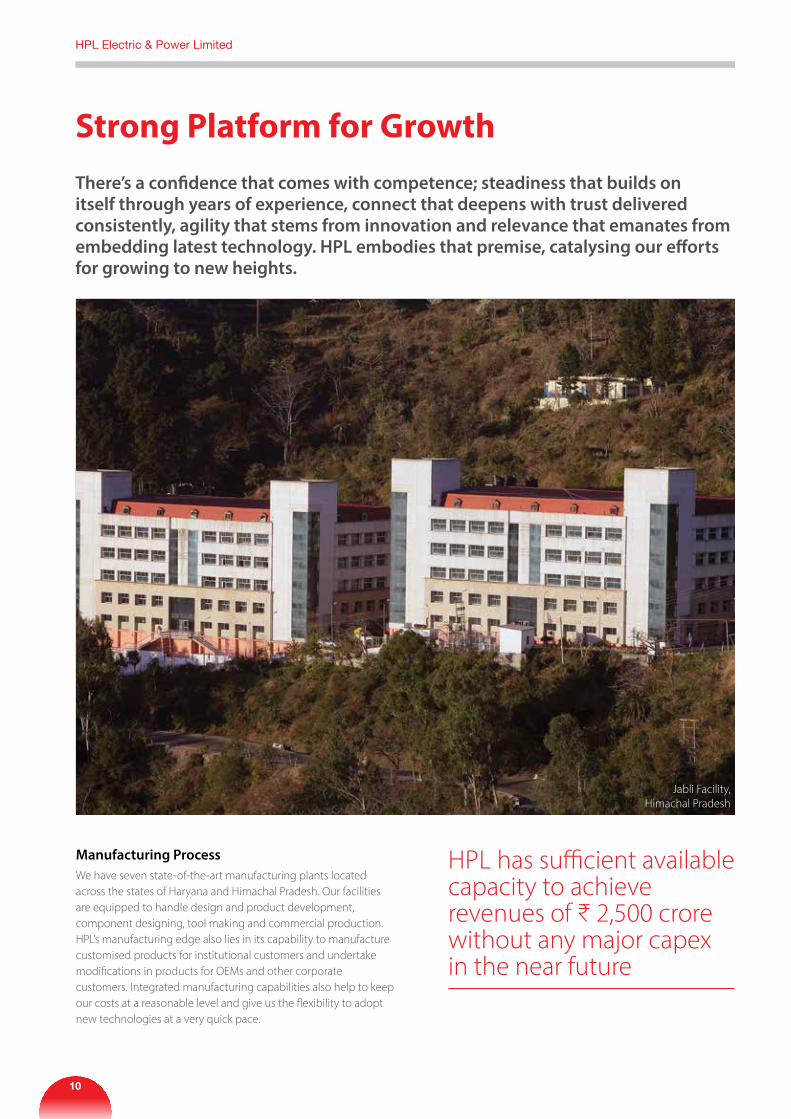
Powering a Deeper ConnectIndia with its favourable demographics provides a compelling retail opportunity. To provide a greater thrust to our trade business, we further deepened our brand connect through a slew of branding and marketing initiatives during the year.
Sponsorship of Royal Challengers Bangalore Cricket Team The highlight of our brand promotion efforts enabled our association with the Royal Challengers Bangalore (RCB) team at the Indian Premier League (IPL) 2018, as their official LED and switchgear partner. The RCB team included several leading cricket players including Virat Kohli, India’s captain and a batting genius. As part of our team endorsement, HPL Logo branding featured on the team uniform. With cricket enjoying mass viewership and the immense popularity of the IPL tournament, our brand promotion strategy has gone a long way to increase brand recall and drive increased trade sales.
The association with the IPL team allows us to utilise the image of marquee players on our product packaging for nearly one year. Most of our consumer-related products, such as lighting, LED bulbs, MCBs, switches and wires, feature the image of RCB players on the packaging. The association also gave us the opportunity to conduct ‘Meet & Greet’ sessions with the RCB team for our top dealers.
Digital / Social Media CampaignsWe are also leveraging the power of digital media to deepen our engagement. Online marketing and social media campaigns have struck the right chord with our target audience.
Meet & Greet with Team RCB
12
HPL Electric & Power Limited
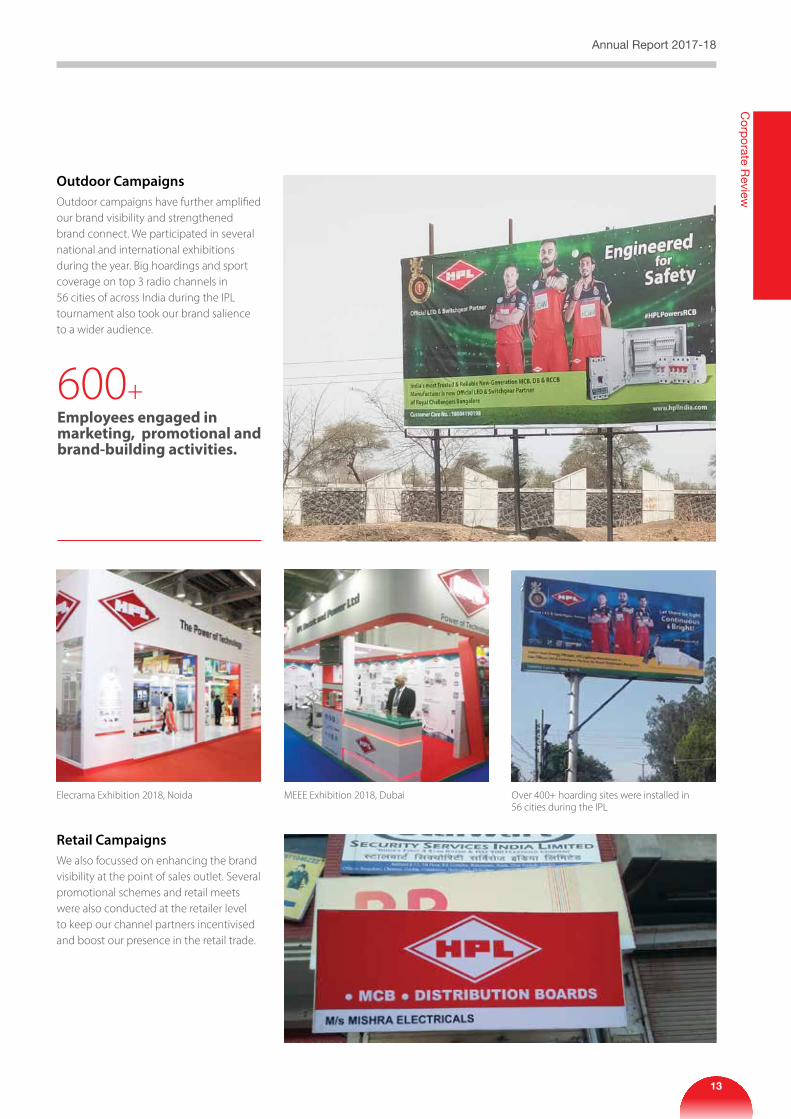
Outdoor CampaignsOutdoor campaigns have further amplified our brand visibility and strengthened brand connect. We participated in several national and international exhibitions during the year. Big hoardings and sport coverage on top 3 radio channels in 56 cities of across India during the IPL tournament also took our brand salience to a wider audience.
600+Employees engaged in marketing, promotional and brand-building activities.
Elecrama Exhibition 2018, Noida MEEE Exhibition 2018, Dubai Over 400+ hoarding sites were installed in 56 cities during the IPL
Retail CampaignsWe also focussed on enhancing the brand visibility at the point of sales outlet. Several promotional schemes and retail meets were also conducted at the retailer level to keep our channel partners incentivised and boost our presence in the retail trade.
13
Annual Report 2017-18C
orporate R
eview
Ready with Smart SolutionsM e T e R I N G S e G M e N T
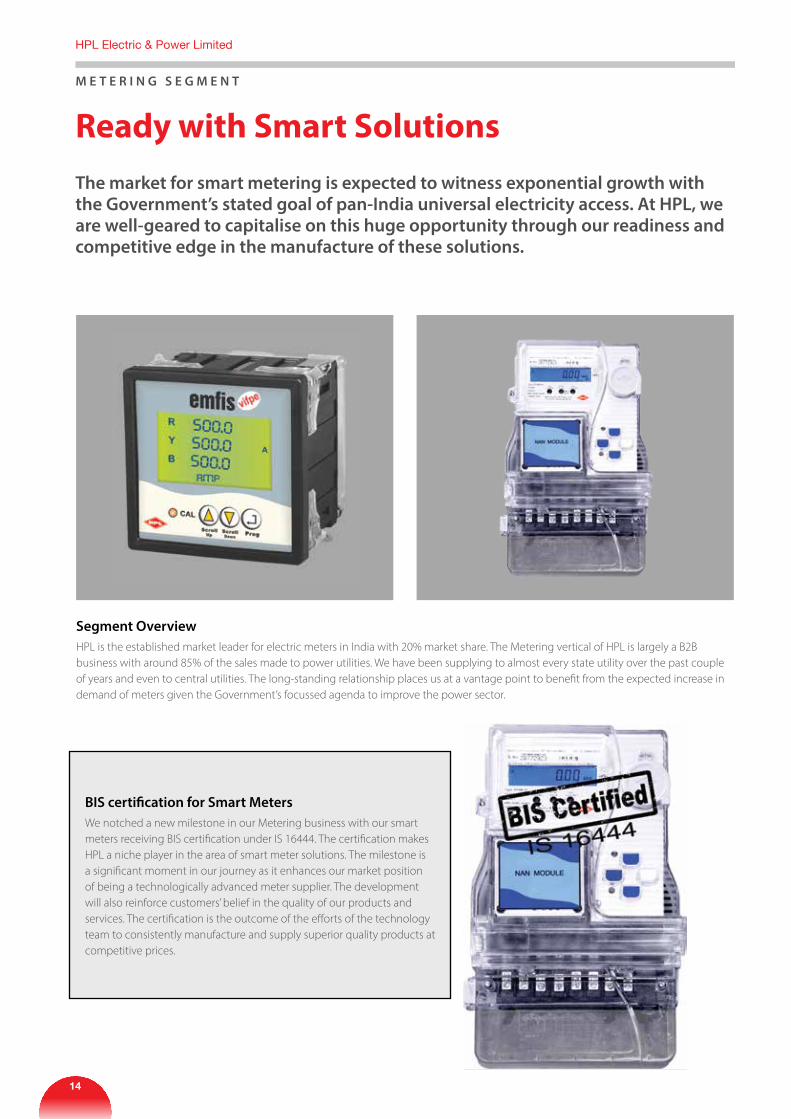
The market for smart metering is expected to witness exponential growth with the Government’s stated goal of pan-India universal electricity access. at HPL, we are well-geared to capitalise on this huge opportunity through our readiness and competitive edge in the manufacture of these solutions.
Segment OverviewHPL is the established market leader for electric meters in India with 20% market share. The Metering vertical of HPL is largely a B2B business with around 85% of the sales made to power utilities. We have been supplying to almost every state utility over the past couple of years and even to central utilities. The long-standing relationship places us at a vantage point to benefit from the expected increase in demand of meters given the Government’s focussed agenda to improve the power sector.
BIS certification for Smart Meters We notched a new milestone in our Metering business with our smart meters receiving BIS certification under IS 16444. The certification makes HPL a niche player in the area of smart meter solutions. The milestone is a significant moment in our journey as it enhances our market position of being a technologically advanced meter supplier. The development will also reinforce customers’ belief in the quality of our products and services. The certification is the outcome of the efforts of the technology team to consistently manufacture and supply superior quality products at competitive prices.
14
HPL Electric & Power Limited
Operational Highlights• 48.83% of the total revenue earned in 2018 is attributable to
the metering segment
• Metering business grew by 21.14% (net of excise) YoY, driven by revival in metering orders and strong execution
• Received the BIS certification IS 16444 for smart meters
• Revival in the metering business leading to one of the highest metering order books
• As of May 31, 2018, Metering business has an order book worth ₹ 477.6 crore (Net of GST)
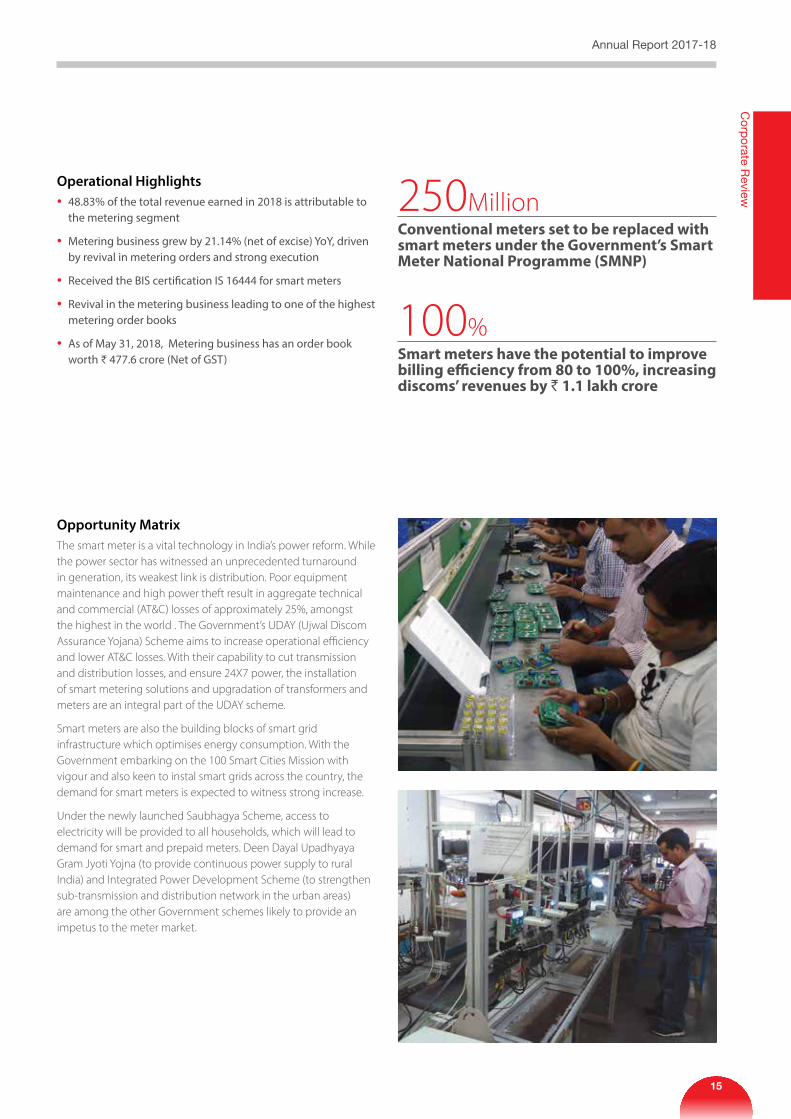
Opportunity Matrix The smart meter is a vital technology in India’s power reform. While the power sector has witnessed an unprecedented turnaround in generation, its weakest link is distribution. Poor equipment maintenance and high power theft result in aggregate technical and commercial (AT&C) losses of approximately 25%, amongst the highest in the world . The Government’s UDAY (Ujwal Discom Assurance Yojana) Scheme aims to increase operational efficiency and lower AT&C losses. With their capability to cut transmission and distribution losses, and ensure 24X7 power, the installation of smart metering solutions and upgradation of transformers and meters are an integral part of the UDAY scheme.
Smart meters are also the building blocks of smart grid infrastructure which optimises energy consumption. With the Government embarking on the 100 Smart Cities Mission with vigour and also keen to instal smart grids across the country, the demand for smart meters is expected to witness strong increase.
Under the newly launched Saubhagya Scheme, access to electricity will be provided to all households, which will lead to demand for smart and prepaid meters. Deen Dayal Upadhyaya Gram Jyoti Yojna (to provide continuous power supply to rural India) and Integrated Power Development Scheme (to strengthen sub-transmission and distribution network in the urban areas) are among the other Government schemes likely to provide an impetus to the meter market.
250MillionConventional meters set to be replaced with smart meters under the Government’s Smart Meter National Programme (SMNP)
100%Smart meters have the potential to improve billing efficiency from 80 to 100%, increasing discoms’ revenues by ` 1.1 lakh crore
15
Annual Report 2017-18C
orporate R
eview

Ready to Meet Growing DemandS W I T C H G e a R S e G M e N T
from an air circuit breaker to the final modular switch to solar distribution box, we are a single manufacturer providing a complete suite of switchgear products. Our impressive product portfolio is only matched by our extensive distribution connect. HPL is ready to serve existing and emerging market needs.
Segment OverviewHPL is among the oldest manufacturers of LV switchgear in India. We hold leadership position in the changeover switches category with nearly 50% market share. Overall, we have 5% market share in LV switchgears. Our Switchgear business is largely a B2C sales model. We also export our switchgears to other countries in East Africa, SAARC, Middle East and South East Asia. Every product is tested in third-party labs to ensure compliance with domestic and international standards. With our strong R&D capabilities, we have the technology to customise our products as per customer requirements.
Solar Switchgear from the HPL StableFor the solar segment, we were already doing net meters and cables. We have expanded our solar electrical equipment range by introducing switchgears as well. Array junction boxes and a large amount of AC/DC distribution boards are now available with the HPL brand promise. From the product viewpoint, we are therefore moving towards becoming a complete solar-solution based.
Solar AC Distribution Box Solar DC Distribution Box
16
HPL Electric & Power Limited

Operational Highlights• 19.51% of the total revenue earned in 2018 is attributable to
the switchgear segment
• The segment witnessed significant improvement in the year, growing by 11.81% (net of excise) YoY, largely driven by robust sales in trade business
• Switchgear segment continued to provide high margins, thus enhancing overall profitability
• As of May 31, 2018, Switchgear business has an order book worth ₹23.5 crore
Opportunity Matrix Flagship schemes of the Government such as Housing for All and Smart Cities Mission will drive the LV switchgear demand over the next few years. With our continual emphasis on strengthening our distribution network and reinforcing our product range, we are confident of harnessing the unfolding opportunities.
In addition, emerging segments such as renewable energy augur well for the demand of switchgears in the Indian market. Increased Government spending on infrastructure projects such as airports and metros and revival of manufacturing segment driven by policy initiatives such as Make in India are also likely to boost switchgear demand.
To meet the growing demand of uninterrupted energy, the Government is ramping up the country’s transmission and distribution system. This will require replacement of outdated switchgears with modern and advanced switchgears. This is expected to propel the growth in the country’s switchgear market in the coming years.
175GW of Solar Capacity by 2022India is building the world’s largest solar plants, which will boost the demand for solar switchgear.
₹11,050 CrorePresent size of the LV Switchgear industry (including domestic modular switches).
17
Annual Report 2017-18C
orporate R
eview
Ready to Light Up India L I G H T I N G S e G M e N T
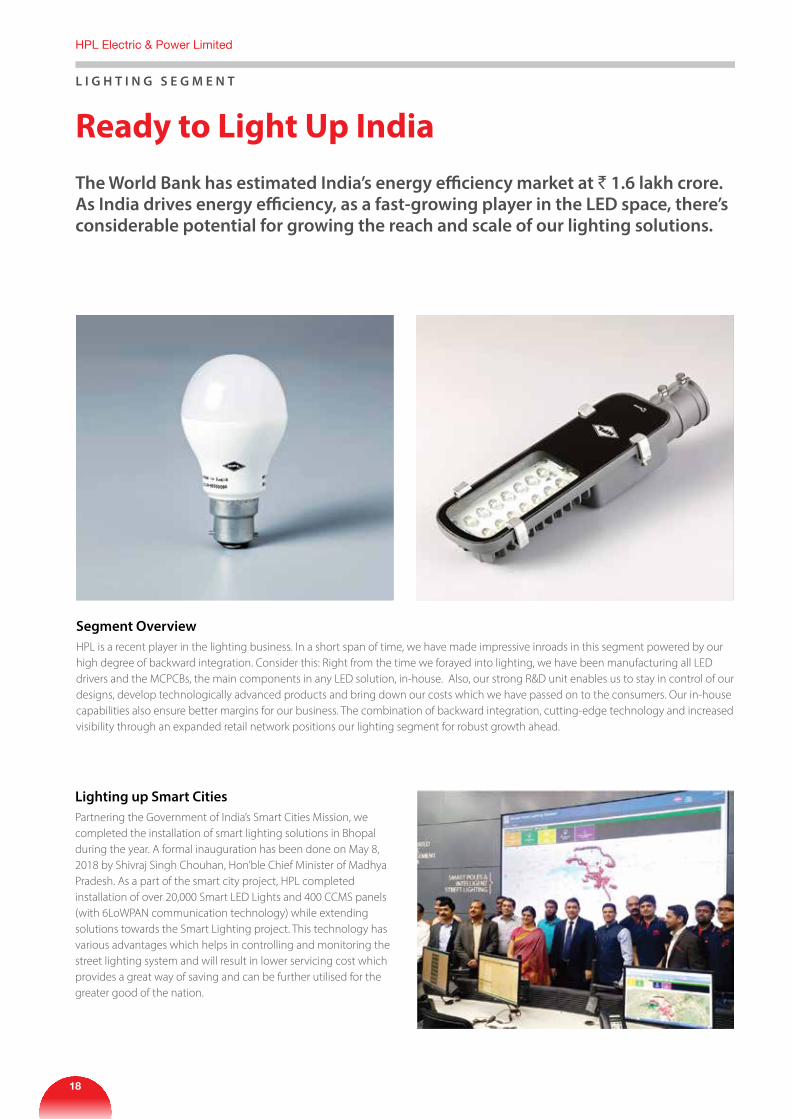
The World Bank has estimated India’s energy efficiency market at ` 1.6 lakh crore. as India drives energy efficiency, as a fast-growing player in the LeD space, there’s considerable potential for growing the reach and scale of our lighting solutions.
Segment OverviewHPL is a recent player in the lighting business. In a short span of time, we have made impressive inroads in this segment powered by our high degree of backward integration. Consider this: Right from the time we forayed into lighting, we have been manufacturing all LED drivers and the MCPCBs, the main components in any LED solution, in-house. Also, our strong R&D unit enables us to stay in control of our designs, develop technologically advanced products and bring down our costs which we have passed on to the consumers. Our in-house capabilities also ensure better margins for our business. The combination of backward integration, cutting-edge technology and increased visibility through an expanded retail network positions our lighting segment for robust growth ahead.
Lighting up Smart Cities Partnering the Government of India’s Smart Cities Mission, we completed the installation of smart lighting solutions in Bhopal during the year. A formal inauguration has been done on May 8, 2018 by Shivraj Singh Chouhan, Hon’ble Chief Minister of Madhya Pradesh. As a part of the smart city project, HPL completed installation of over 20,000 Smart LED Lights and 400 CCMS panels (with 6LoWPAN communication technology) while extending solutions towards the Smart Lighting project. This technology has various advantages which helps in controlling and monitoring the street lighting system and will result in lower servicing cost which provides a great way of saving and can be further utilised for the greater good of the nation.
18
HPL Electric & Power Limited
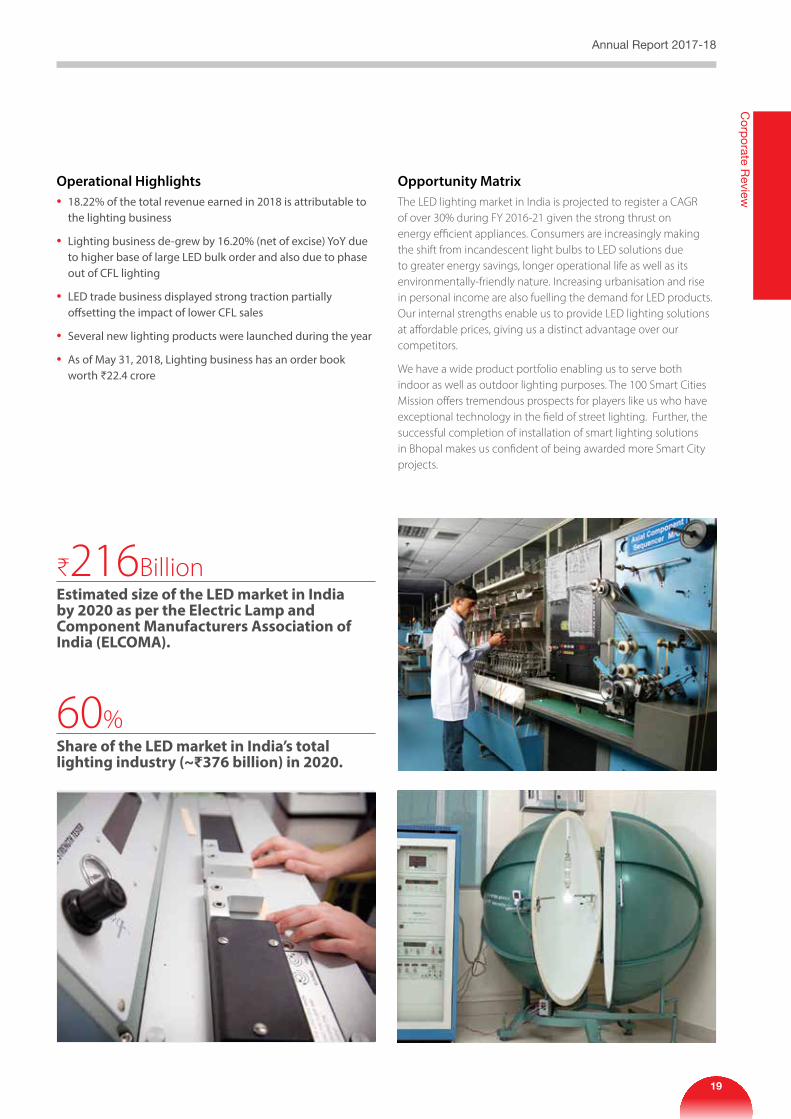
Operational Highlights• 18.22% of the total revenue earned in 2018 is attributable to
the lighting business
• Lighting business de-grew by 16.20% (net of excise) YoY due to higher base of large LED bulk order and also due to phase out of CFL lighting
• LED trade business displayed strong traction partially offsetting the impact of lower CFL sales
• Several new lighting products were launched during the year
• As of May 31, 2018, Lighting business has an order book worth ₹22.4 crore
Opportunity Matrix The LED lighting market in India is projected to register a CAGR of over 30% during FY 2016-21 given the strong thrust on energy efficient appliances. Consumers are increasingly making the shift from incandescent light bulbs to LED solutions due to greater energy savings, longer operational life as well as its environmentally-friendly nature. Increasing urbanisation and rise in personal income are also fuelling the demand for LED products. Our internal strengths enable us to provide LED lighting solutions at affordable prices, giving us a distinct advantage over our competitors.
We have a wide product portfolio enabling us to serve both indoor as well as outdoor lighting purposes. The 100 Smart Cities Mission offers tremendous prospects for players like us who have exceptional technology in the field of street lighting. Further, the successful completion of installation of smart lighting solutions in Bhopal makes us confident of being awarded more Smart City projects.
₹216BillionEstimated size of the LED market in India by 2020 as per the Electric Lamp and Component Manufacturers Association of India (ELCOMA).
60%Share of the LED market in India’s total lighting industry (~₹376 billion) in 2020.
19
Annual Report 2017-18C
orporate R
eview

Ready to Electrify IndiaW I R e S a N D C a B L e S S e G M e N T
With infrastructure development a priority for the Government, the demand for wires and cables is only growing. at HPL, we are ready with our reliable and diversified range of wiring and cable solutions to be an active partner in nation-building.
Segment OverviewOur Wires & Cables segment focusses on domestic and flexible wires, speciality cables and solar cables. The speciality range includes zero halogen, low-smoke, fire resistant, oil resistant wires. We also make data networking cables, cables for CCTV, cables for telecom applications and recently, for elevators. Deployment of newer technologies and consistent delivery of quality products has enabled us to considerably build our cable business in the promising 4G telecom market.
Diversification into Solar and other Speciality CablesIn the power sector, the country’s investment thrust is steadily moving towards renewable energy. Keeping in focus emerging demand, we have successfully forayed into the manufacture of solar cables. We are also manufacturing certain specialised cables for telecom applications. The diversification of cable range complements well with our other verticals, making HPL move towards becoming a solution-based company.
₹10,000 CroreThe size of the specialised cable industry in India.
20%Expected CAGR of the wires and cables industry over the next 5 years.
20
HPL Electric & Power Limited
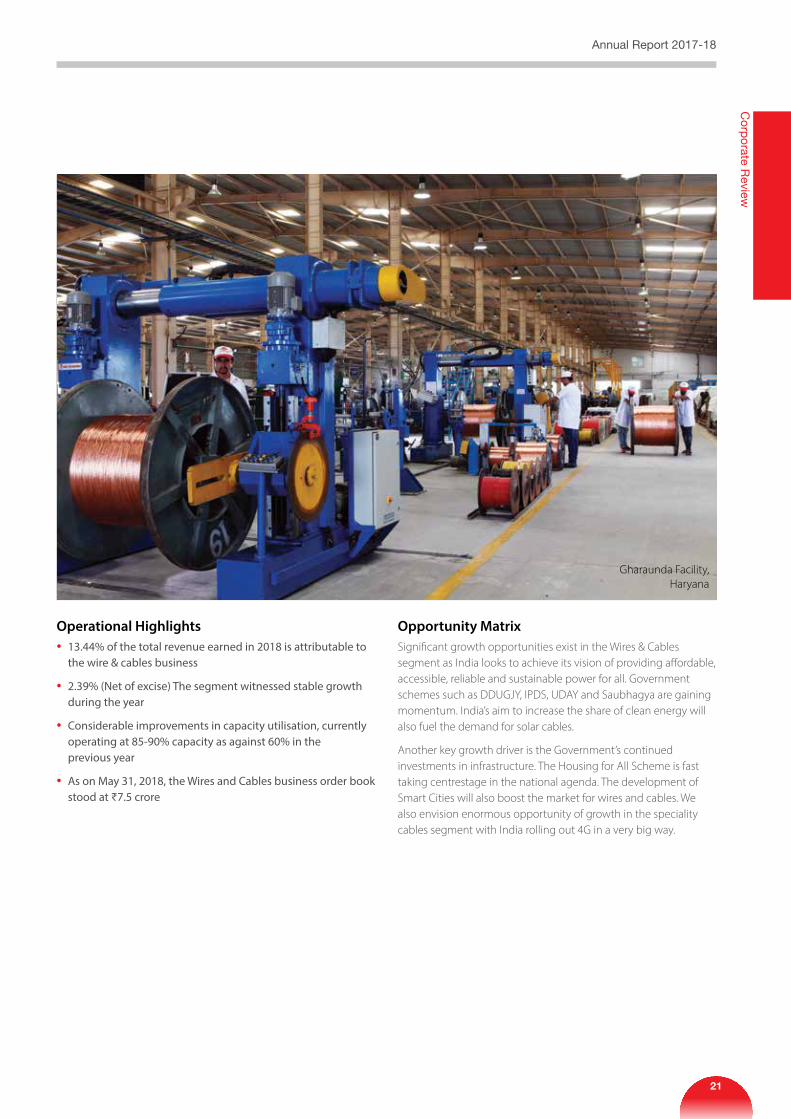
Operational Highlights• 13.44% of the total revenue earned in 2018 is attributable to
the wire & cables business
• 2.39% (Net of excise) The segment witnessed stable growth during the year
• Considerable improvements in capacity utilisation, currently operating at 85-90% capacity as against 60% in the previous year
• As on May 31, 2018, the Wires and Cables business order book stood at ₹7.5 crore
Opportunity Matrix Significant growth opportunities exist in the Wires & Cables segment as India looks to achieve its vision of providing affordable, accessible, reliable and sustainable power for all. Government schemes such as DDUGJY, IPDS, UDAY and Saubhagya are gaining momentum. India’s aim to increase the share of clean energy will also fuel the demand for solar cables.
Another key growth driver is the Government’s continued investments in infrastructure. The Housing for All Scheme is fast taking centrestage in the national agenda. The development of Smart Cities will also boost the market for wires and cables. We also envision enormous opportunity of growth in the speciality cables segment with India rolling out 4G in a very big way.
Gharaunda Facility, Haryana
21
Annual Report 2017-18C
orporate R
eview
Board of Directors
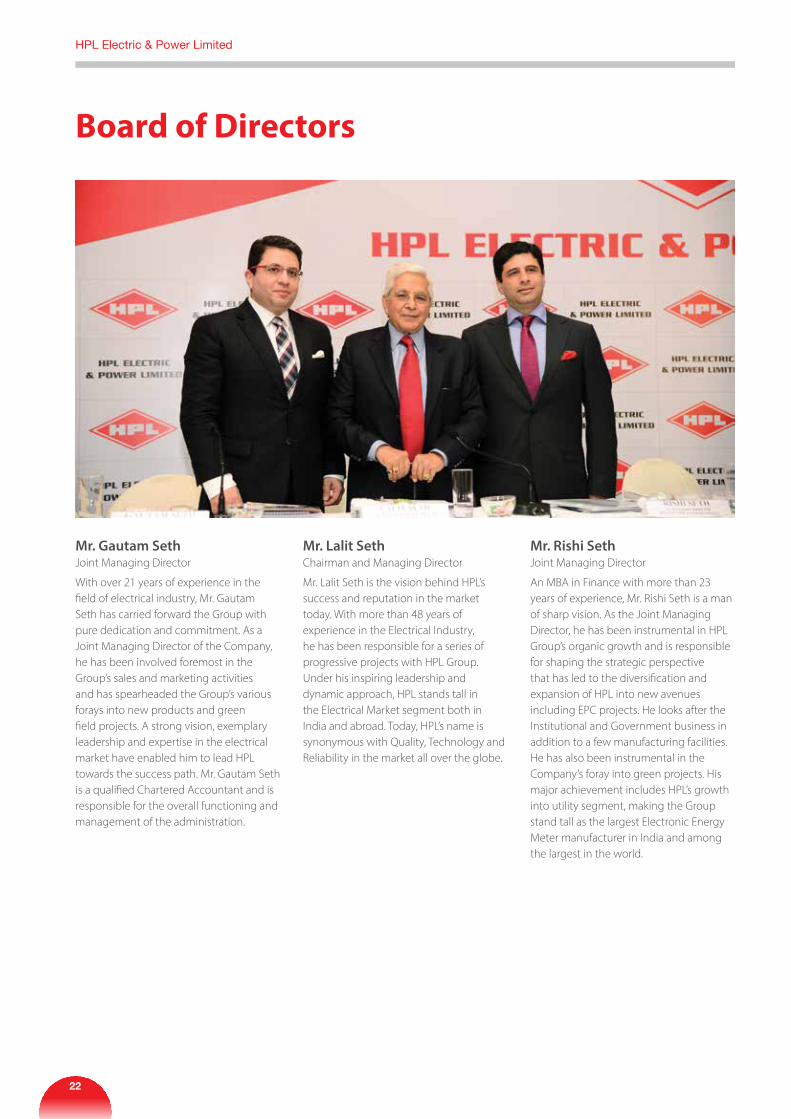
Mr. Lalit Seth Chairman and Managing Director
Mr. Lalit Seth is the vision behind HPL’s success and reputation in the market today. With more than 48 years of experience in the Electrical Industry, he has been responsible for a series of progressive projects with HPL Group. Under his inspiring leadership and dynamic approach, HPL stands tall in the Electrical Market segment both in India and abroad. Today, HPL’s name is synonymous with Quality, Technology and Reliability in the market all over the globe.
Mr. Gautam Seth Joint Managing Director
With over 21 years of experience in the field of electrical industry, Mr. Gautam Seth has carried forward the Group with pure dedication and commitment. As a Joint Managing Director of the Company, he has been involved foremost in the Group’s sales and marketing activities and has spearheaded the Group’s various forays into new products and green field projects. A strong vision, exemplary leadership and expertise in the electrical market have enabled him to lead HPL towards the success path. Mr. Gautam Seth is a qualified Chartered Accountant and is responsible for the overall functioning and management of the administration.
Mr. Rishi Seth Joint Managing Director
An MBA in Finance with more than 23 years of experience, Mr. Rishi Seth is a man of sharp vision. As the Joint Managing Director, he has been instrumental in HPL Group’s organic growth and is responsible for shaping the strategic perspective that has led to the diversification and expansion of HPL into new avenues including EPC projects. He looks after the Institutional and Government business in addition to a few manufacturing facilities. He has also been instrumental in the Company’s foray into green projects. His major achievement includes HPL’s growth into utility segment, making the Group stand tall as the largest Electronic Energy Meter manufacturer in India and among the largest in the world.
22
HPL Electric & Power Limited
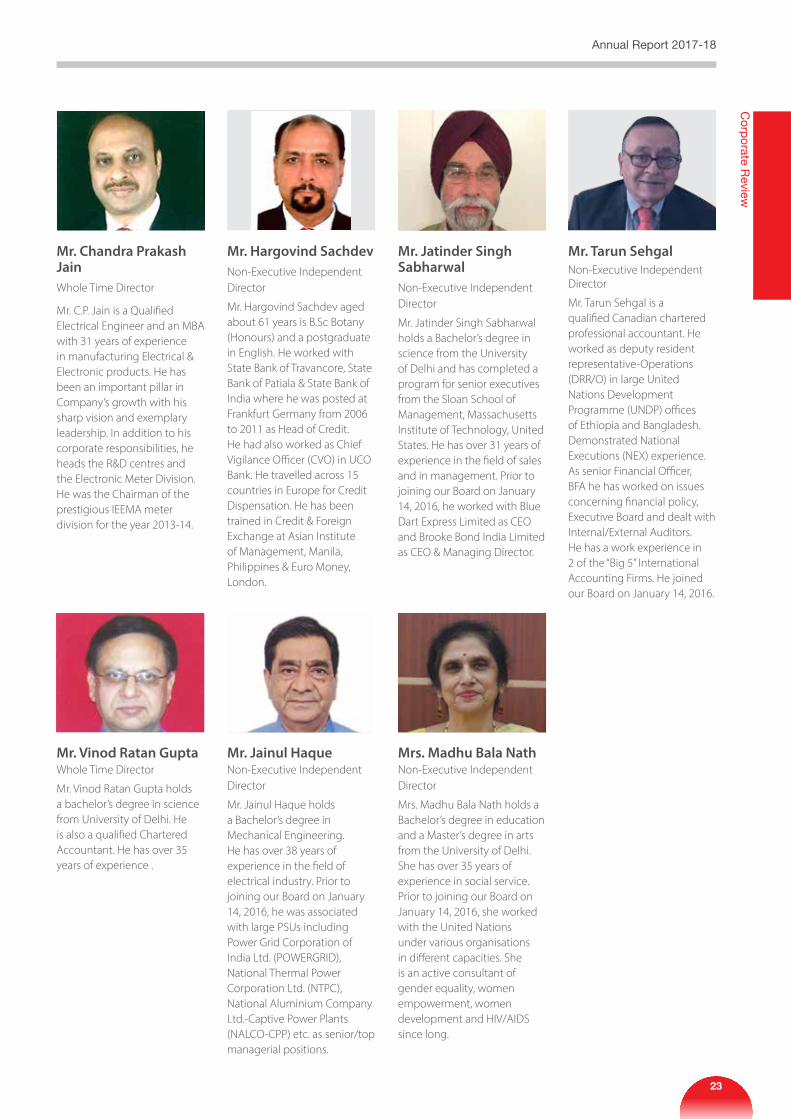
Mr. Chandra Prakash JainWhole Time Director
Mr. C.P. Jain is a Qualified Electrical Engineer and an MBA with 31 years of experience in manufacturing Electrical & Electronic products. He has been an important pillar in Company’s growth with his sharp vision and exemplary leadership. In addition to his corporate responsibilities, he heads the R&D centres and the Electronic Meter Division. He was the Chairman of the prestigious IEEMA meter division for the year 2013-14.
Mr. Vinod Ratan Gupta Whole Time Director
Mr. Vinod Ratan Gupta holds a bachelor’s degree in science from University of Delhi. He is also a qualified Chartered Accountant. He has over 35 years of experience .
Mr. Jainul Haque Non-Executive Independent Director
Mr. Jainul Haque holds a Bachelor’s degree in Mechanical Engineering. He has over 38 years of experience in the field of electrical industry. Prior to joining our Board on January 14, 2016, he was associated with large PSUs including Power Grid Corporation of India Ltd. (POWERGRID), National Thermal Power Corporation Ltd. (NTPC), National Aluminium Company Ltd.-Captive Power Plants (NALCO-CPP) etc. as senior/top managerial positions.
Mrs. Madhu Bala Nath Non-Executive Independent Director
Mrs. Madhu Bala Nath holds a Bachelor’s degree in education and a Master’s degree in arts from the University of Delhi. She has over 35 years of experience in social service. Prior to joining our Board on January 14, 2016, she worked with the United Nations under various organisations in different capacities. She is an active consultant of gender equality, women empowerment, women development and HIV/AIDS since long.
Mr. Hargovind Sachdev Non-Executive Independent Director
Mr. Hargovind Sachdev aged about 61 years is B.Sc Botany (Honours) and a postgraduate in English. He worked with State Bank of Travancore, State Bank of Patiala & State Bank of India where he was posted at Frankfurt Germany from 2006 to 2011 as Head of Credit. He had also worked as Chief Vigilance Officer (CVO) in UCO Bank. He travelled across 15 countries in Europe for Credit Dispensation. He has been trained in Credit & Foreign Exchange at Asian Institute of Management, Manila, Philippines & Euro Money, London.
Mr. Jatinder Singh SabharwalNon-Executive Independent Director
Mr. Jatinder Singh Sabharwal holds a Bachelor’s degree in science from the University of Delhi and has completed a program for senior executives from the Sloan School of Management, Massachusetts Institute of Technology, United States. He has over 31 years of experience in the field of sales and in management. Prior to joining our Board on January 14, 2016, he worked with Blue Dart Express Limited as CEO and Brooke Bond India Limited as CEO & Managing Director.
Mr. Tarun SehgalNon-Executive Independent Director
Mr. Tarun Sehgal is a qualified Canadian chartered professional accountant. He worked as deputy resident representative-Operations (DRR/O) in large United Nations Development Programme (UNDP) offices of Ethiopia and Bangladesh. Demonstrated National Executions (NEX) experience. As senior Financial Officer, BFA he has worked on issues concerning financial policy, Executive Board and dealt with Internal/External Auditors. He has a work experience in 2 of the “Big 5” International Accounting Firms. He joined our Board on January 14, 2016.
23
Annual Report 2017-18C
orporate R
eview
Management Discussion and Analysis
Global economic review
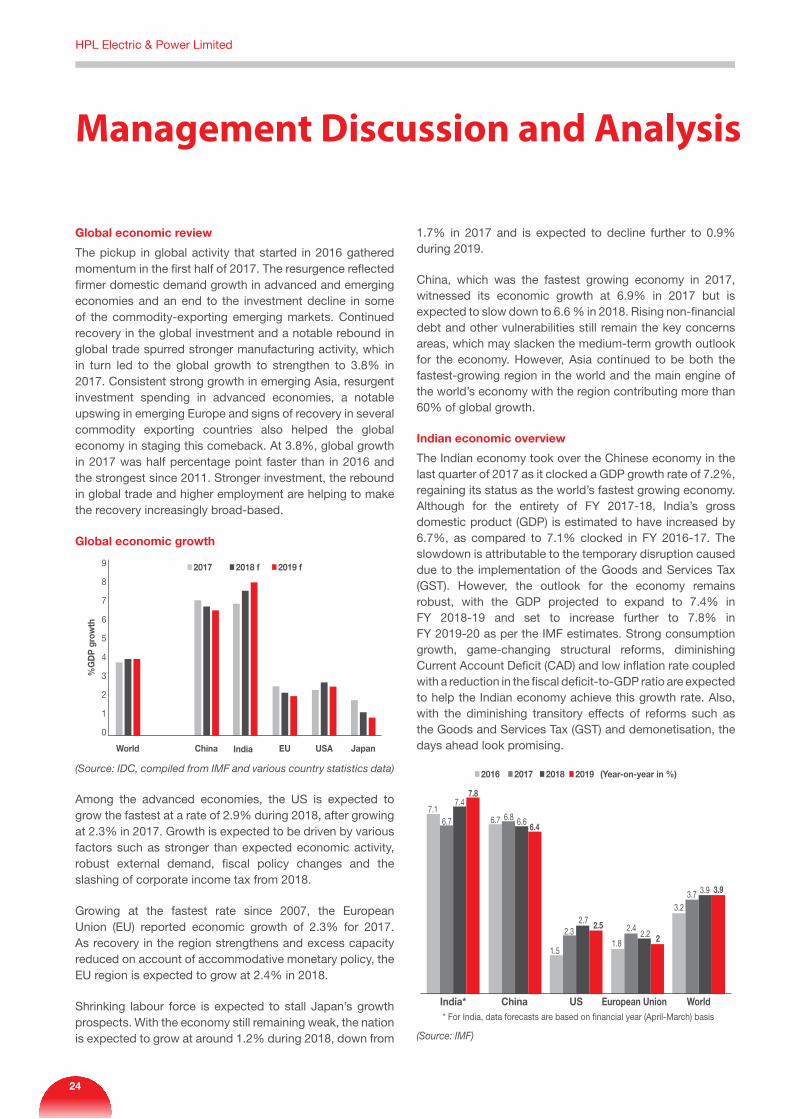
The pickup in global activity that started in 2016 gathered momentum in the first half of 2017. The resurgence reflected firmer domestic demand growth in advanced and emerging economies and an end to the investment decline in some of the commodity-exporting emerging markets. Continued recovery in the global investment and a notable rebound in global trade spurred stronger manufacturing activity, which in turn led to the global growth to strengthen to 3.8% in 2017. Consistent strong growth in emerging Asia, resurgent investment spending in advanced economies, a notable upswing in emerging Europe and signs of recovery in several commodity exporting countries also helped the global economy in staging this comeback. At 3.8%, global growth in 2017 was half percentage point faster than in 2016 and the strongest since 2011. Stronger investment, the rebound in global trade and higher employment are helping to make the recovery increasingly broad-based.
Global economic growth
2018 f2017 2019 f
World
%G
DP
gro
wth
China India EU USA Japan
9
8
7
6
5
4
3
2
1
0
(Source: IDC, compiled from IMF and various country statistics data)
Among the advanced economies, the US is expected to grow the fastest at a rate of 2.9% during 2018, after growing at 2.3% in 2017. Growth is expected to be driven by various factors such as stronger than expected economic activity, robust external demand, fiscal policy changes and the slashing of corporate income tax from 2018.
Growing at the fastest rate since 2007, the European Union (EU) reported economic growth of 2.3% for 2017. As recovery in the region strengthens and excess capacity reduced on account of accommodative monetary policy, the EU region is expected to grow at 2.4% in 2018.
Shrinking labour force is expected to stall Japan’s growth prospects. With the economy still remaining weak, the nation is expected to grow at around 1.2% during 2018, down from
1.7% in 2017 and is expected to decline further to 0.9% during 2019.
China, which was the fastest growing economy in 2017, witnessed its economic growth at 6.9% in 2017 but is expected to slow down to 6.6 % in 2018. Rising non-financial debt and other vulnerabilities still remain the key concerns areas, which may slacken the medium-term growth outlook for the economy. However, Asia continued to be both the fastest-growing region in the world and the main engine of the world’s economy with the region contributing more than 60% of global growth.
Indian economic overview
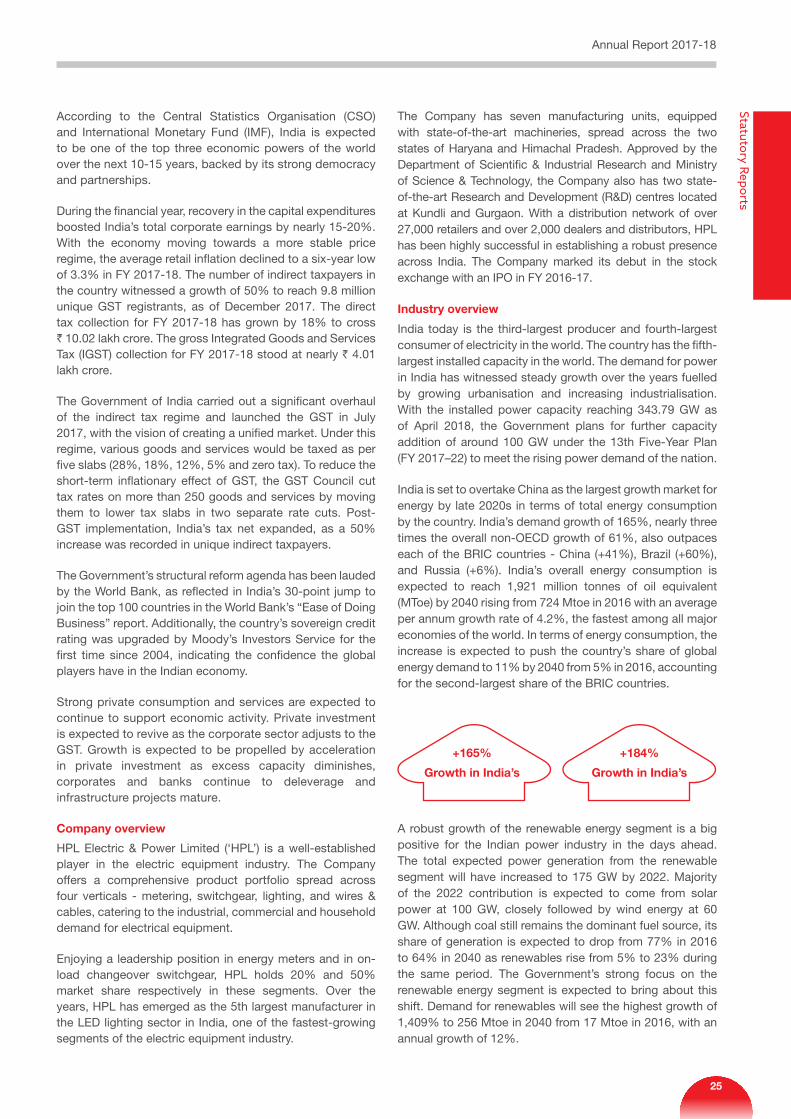
The Indian economy took over the Chinese economy in the last quarter of 2017 as it clocked a GDP growth rate of 7.2%, regaining its status as the world’s fastest growing economy. Although for the entirety of FY 2017-18, India’s gross domestic product (GDP) is estimated to have increased by 6.7%, as compared to 7.1% clocked in FY 2016-17. The slowdown is attributable to the temporary disruption caused due to the implementation of the Goods and Services Tax (GST). However, the outlook for the economy remains robust, with the GDP projected to expand to 7.4% in FY 2018-19 and set to increase further to 7.8% in FY 2019-20 as per the IMF estimates. Strong consumption growth, game-changing structural reforms, diminishing Current Account Deficit (CAD) and low inflation rate coupled with a reduction in the fiscal deficit-to-GDP ratio are expected to help the Indian economy achieve this growth rate. Also, with the diminishing transitory effects of reforms such as the Goods and Services Tax (GST) and demonetisation, the days ahead look promising.
2016 2017 2018 2019 (Year-on-year in %)
* For India, data forecasts are based on financial year (April-March) basis
(Source: IMF)
India* China US European Union World
7.16.7 6.8 6.6
1.51.8
3.23.7 3.9
2.42.22.3
2.7
6.7
7.47.8
6.4
2.52
3.9
HPL Electric & Power Limited
24
According to the Central Statistics Organisation (CSO) and International Monetary Fund (IMF), India is expected to be one of the top three economic powers of the world over the next 10-15 years, backed by its strong democracy and partnerships.
During the financial year, recovery in the capital expenditures boosted India’s total corporate earnings by nearly 15-20%. With the economy moving towards a more stable price regime, the average retail inflation declined to a six-year low of 3.3% in FY 2017-18. The number of indirect taxpayers in the country witnessed a growth of 50% to reach 9.8 million unique GST registrants, as of December 2017. The direct tax collection for FY 2017-18 has grown by 18% to cross ` 10.02 lakh crore. The gross Integrated Goods and Services Tax (IGST) collection for FY 2017-18 stood at nearly ` 4.01 lakh crore.
The Government of India carried out a significant overhaul of the indirect tax regime and launched the GST in July 2017, with the vision of creating a unified market. Under this regime, various goods and services would be taxed as per five slabs (28%, 18%, 12%, 5% and zero tax). To reduce the short-term inflationary effect of GST, the GST Council cut tax rates on more than 250 goods and services by moving them to lower tax slabs in two separate rate cuts. Post-GST implementation, India’s tax net expanded, as a 50% increase was recorded in unique indirect taxpayers.
The Government’s structural reform agenda has been lauded by the World Bank, as reflected in India’s 30-point jump to join the top 100 countries in the World Bank’s “Ease of Doing Business” report. Additionally, the country’s sovereign credit rating was upgraded by Moody’s Investors Service for the first time since 2004, indicating the confidence the global players have in the Indian economy.
Strong private consumption and services are expected to continue to support economic activity. Private investment is expected to revive as the corporate sector adjusts to the GST. Growth is expected to be propelled by acceleration in private investment as excess capacity diminishes, corporates and banks continue to deleverage and infrastructure projects mature.
Company overview
HPL Electric & Power Limited (‘HPL’) is a well-established player in the electric equipment industry. The Company offers a comprehensive product portfolio spread across four verticals - metering, switchgear, lighting, and wires & cables, catering to the industrial, commercial and household demand for electrical equipment.
Enjoying a leadership position in energy meters and in on-load changeover switchgear, HPL holds 20% and 50% market share respectively in these segments. Over the years, HPL has emerged as the 5th largest manufacturer in the LED lighting sector in India, one of the fastest-growing segments of the electric equipment industry.
The Company has seven manufacturing units, equipped with state-of-the-art machineries, spread across the two states of Haryana and Himachal Pradesh. Approved by the Department of Scientific & Industrial Research and Ministry of Science & Technology, the Company also has two state-of-the-art Research and Development (R&D) centres located at Kundli and Gurgaon. With a distribution network of over 27,000 retailers and over 2,000 dealers and distributors, HPL has been highly successful in establishing a robust presence across India. The Company marked its debut in the stock exchange with an IPO in FY 2016-17.
Industry overview
India today is the third-largest producer and fourth-largest consumer of electricity in the world. The country has the fifth-largest installed capacity in the world. The demand for power in India has witnessed steady growth over the years fuelled by growing urbanisation and increasing industrialisation. With the installed power capacity reaching 343.79 GW as of April 2018, the Government plans for further capacity addition of around 100 GW under the 13th Five-Year Plan (FY 2017–22) to meet the rising power demand of the nation.
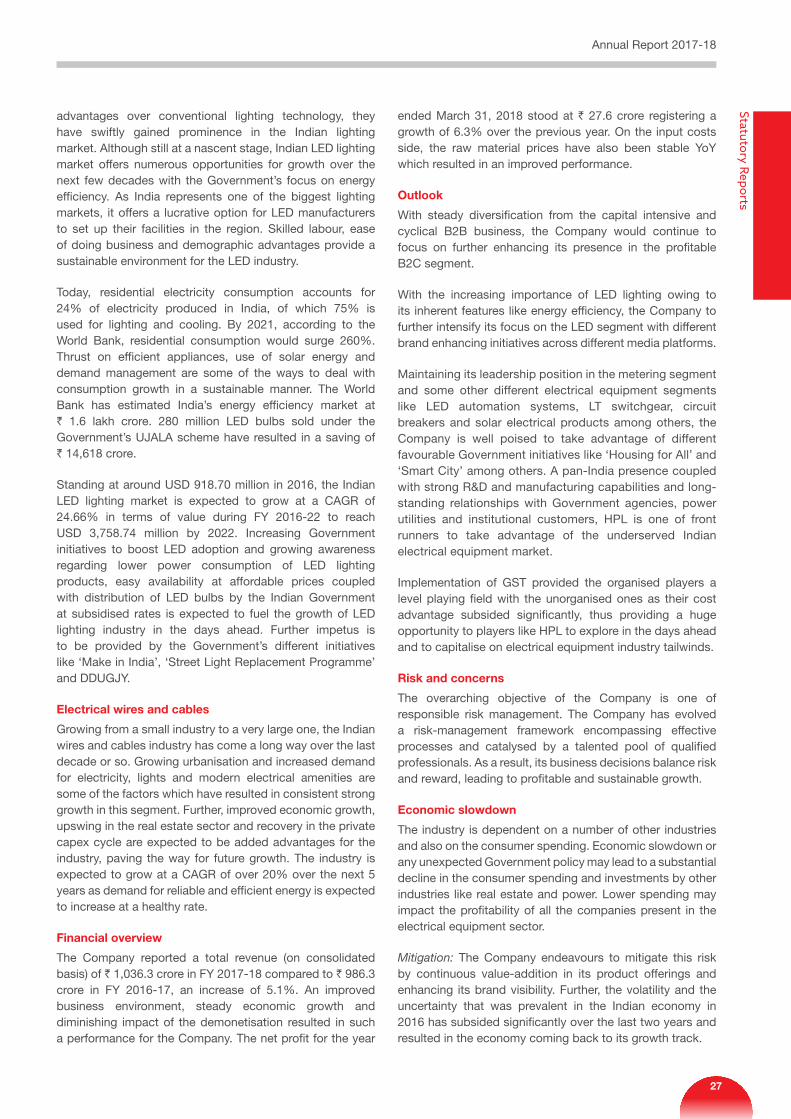
India is set to overtake China as the largest growth market for energy by late 2020s in terms of total energy consumption by the country. India’s demand growth of 165%, nearly three times the overall non-OECD growth of 61%, also outpaces each of the BRIC countries - China (+41%), Brazil (+60%), and Russia (+6%). India’s overall energy consumption is expected to reach 1,921 million tonnes of oil equivalent (MToe) by 2040 rising from 724 Mtoe in 2016 with an average per annum growth rate of 4.2%, the fastest among all major economies of the world. In terms of energy consumption, the increase is expected to push the country’s share of global energy demand to 11% by 2040 from 5% in 2016, accounting for the second-largest share of the BRIC countries.
+165%
Growth in India’s
+184%
Growth in India’s
A robust growth of the renewable energy segment is a big positive for the Indian power industry in the days ahead. The total expected power generation from the renewable segment will have increased to 175 GW by 2022. Majority of the 2022 contribution is expected to come from solar power at 100 GW, closely followed by wind energy at 60 GW. Although coal still remains the dominant fuel source, its share of generation is expected to drop from 77% in 2016 to 64% in 2040 as renewables rise from 5% to 23% during the same period. The Government’s strong focus on the renewable energy segment is expected to bring about this shift. Demand for renewables will see the highest growth of 1,409% to 256 Mtoe in 2040 from 17 Mtoe in 2016, with an annual growth of 12%.
Annual Report 2017-18Statutory Reports
25
Indian electrical equipment industry
India’s electrical equipment industry accounts for nearly 8% of the country’s manufacturing activity in terms of value and 1.3% of India’s GDP. In FY 2017-18, the industry once again gained momentum by clocking a double-digit growth of 12.8%, the highest in seven years. The strong growth was driven majorly by the Government’s increased spending on rural and household electrification schemes along with programmes aimed at strengthening the transmission system.
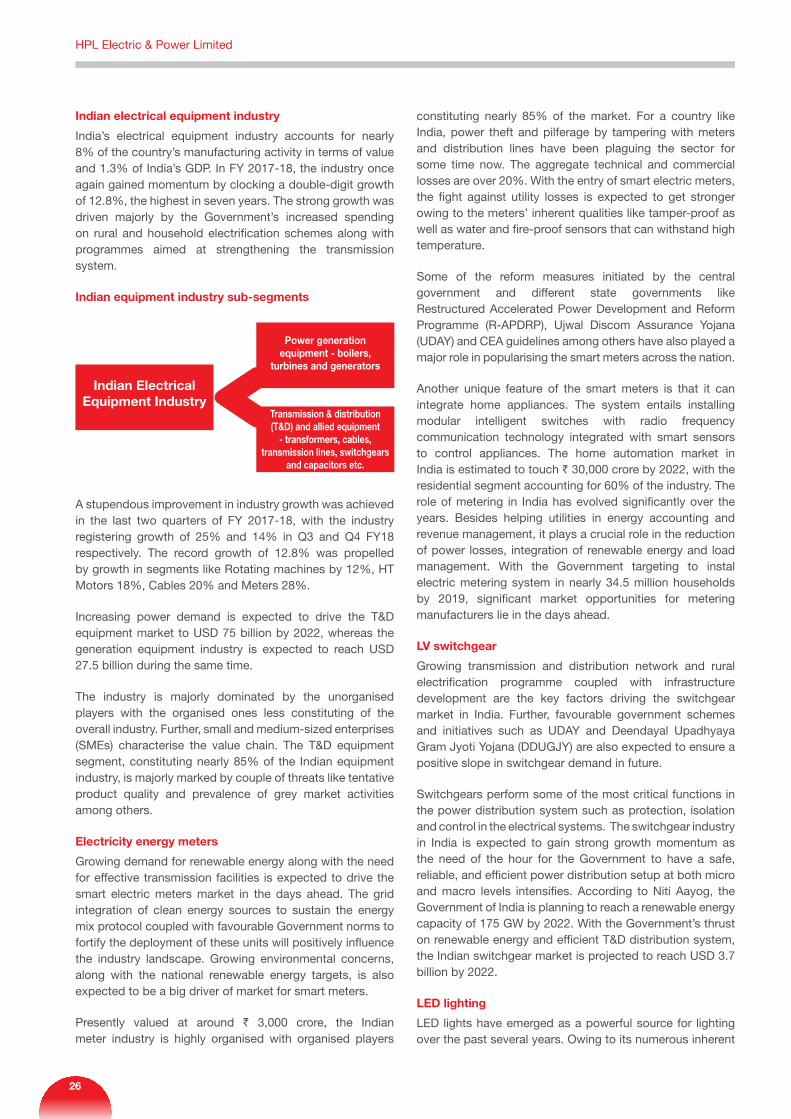
Indian equipment industry sub-segments
Indian Electrical Equipment Industry
Power generation equipment - boilers,
turbines and generators
Transmission & distribution (T&D) and allied equipment
- transformers, cables, transmission lines, switchgears
and capacitors etc.
A stupendous improvement in industry growth was achieved in the last two quarters of FY 2017-18, with the industry registering growth of 25% and 14% in Q3 and Q4 FY18 respectively. The record growth of 12.8% was propelled by growth in segments like Rotating machines by 12%, HT Motors 18%, Cables 20% and Meters 28%.
Increasing power demand is expected to drive the T&D equipment market to USD 75 billion by 2022, whereas the generation equipment industry is expected to reach USD 27.5 billion during the same time.
The industry is majorly dominated by the unorganised players with the organised ones less constituting of the overall industry. Further, small and medium-sized enterprises (SMEs) characterise the value chain. The T&D equipment segment, constituting nearly 85% of the Indian equipment industry, is majorly marked by couple of threats like tentative product quality and prevalence of grey market activities among others.
Electricity energy meters
Growing demand for renewable energy along with the need for effective transmission facilities is expected to drive the smart electric meters market in the days ahead. The grid integration of clean energy sources to sustain the energy mix protocol coupled with favourable Government norms to fortify the deployment of these units will positively influence the industry landscape. Growing environmental concerns, along with the national renewable energy targets, is also expected to be a big driver of market for smart meters.
Presently valued at around ` 3,000 crore, the Indian meter industry is highly organised with organised players
constituting nearly 85% of the market. For a country like India, power theft and pilferage by tampering with meters and distribution lines have been plaguing the sector for some time now. The aggregate technical and commercial losses are over 20%. With the entry of smart electric meters, the fight against utility losses is expected to get stronger owing to the meters’ inherent qualities like tamper-proof as well as water and fire-proof sensors that can withstand high temperature.
Some of the reform measures initiated by the central government and different state governments like Restructured Accelerated Power Development and Reform Programme (R-APDRP), Ujwal Discom Assurance Yojana (UDAY) and CEA guidelines among others have also played a major role in popularising the smart meters across the nation.
Another unique feature of the smart meters is that it can integrate home appliances. The system entails installing modular intelligent switches with radio frequency communication technology integrated with smart sensors to control appliances. The home automation market in India is estimated to touch ` 30,000 crore by 2022, with the residential segment accounting for 60% of the industry. The role of metering in India has evolved significantly over the years. Besides helping utilities in energy accounting and revenue management, it plays a crucial role in the reduction of power losses, integration of renewable energy and load management. With the Government targeting to instal electric metering system in nearly 34.5 million households by 2019, significant market opportunities for metering manufacturers lie in the days ahead.
LV switchgear
Growing transmission and distribution network and rural electrification programme coupled with infrastructure development are the key factors driving the switchgear market in India. Further, favourable government schemes and initiatives such as UDAY and Deendayal Upadhyaya Gram Jyoti Yojana (DDUGJY) are also expected to ensure a positive slope in switchgear demand in future.
Switchgears perform some of the most critical functions in the power distribution system such as protection, isolation and control in the electrical systems. The switchgear industry in India is expected to gain strong growth momentum as the need of the hour for the Government to have a safe, reliable, and efficient power distribution setup at both micro and macro levels intensifies. According to Niti Aayog, the Government of India is planning to reach a renewable energy capacity of 175 GW by 2022. With the Government’s thrust on renewable energy and efficient T&D distribution system, the Indian switchgear market is projected to reach USD 3.7 billion by 2022.
LED lighting
LED lights have emerged as a powerful source for lighting over the past several years. Owing to its numerous inherent
HPL Electric & Power Limited
26
advantages over conventional lighting technology, they have swiftly gained prominence in the Indian lighting market. Although still at a nascent stage, Indian LED lighting market offers numerous opportunities for growth over the next few decades with the Government’s focus on energy efficiency. As India represents one of the biggest lighting markets, it offers a lucrative option for LED manufacturers to set up their facilities in the region. Skilled labour, ease of doing business and demographic advantages provide a sustainable environment for the LED industry.
Today, residential electricity consumption accounts for 24% of electricity produced in India, of which 75% is used for lighting and cooling. By 2021, according to the World Bank, residential consumption would surge 260%.Thrust on efficient appliances, use of solar energy and demand management are some of the ways to deal with consumption growth in a sustainable manner. The World Bank has estimated India’s energy efficiency market at ` 1.6 lakh crore. 280 million LED bulbs sold under the Government’s UJALA scheme have resulted in a saving of ` 14,618 crore.
Standing at around USD 918.70 million in 2016, the Indian LED lighting market is expected to grow at a CAGR of 24.66% in terms of value during FY 2016-22 to reach USD 3,758.74 million by 2022. Increasing Government initiatives to boost LED adoption and growing awareness regarding lower power consumption of LED lighting products, easy availability at affordable prices coupled with distribution of LED bulbs by the Indian Government at subsidised rates is expected to fuel the growth of LED lighting industry in the days ahead. Further impetus is to be provided by the Government’s different initiatives like ‘Make in India’, ‘Street Light Replacement Programme’ and DDUGJY.
Electrical wires and cables
Growing from a small industry to a very large one, the Indian wires and cables industry has come a long way over the last decade or so. Growing urbanisation and increased demand for electricity, lights and modern electrical amenities are some of the factors which have resulted in consistent strong growth in this segment. Further, improved economic growth, upswing in the real estate sector and recovery in the private capex cycle are expected to be added advantages for the industry, paving the way for future growth. The industry is expected to grow at a CAGR of over 20% over the next 5 years as demand for reliable and efficient energy is expected to increase at a healthy rate.
Financial overview
The Company reported a total revenue (on consolidated basis) of ` 1,036.3 crore in FY 2017-18 compared to ` 986.3 crore in FY 2016-17, an increase of 5.1%. An improved business environment, steady economic growth and diminishing impact of the demonetisation resulted in such a performance for the Company. The net profit for the year
ended March 31, 2018 stood at ` 27.6 crore registering a growth of 6.3% over the previous year. On the input costs side, the raw material prices have also been stable YoY which resulted in an improved performance.
Outlook
With steady diversification from the capital intensive and cyclical B2B business, the Company would continue to focus on further enhancing its presence in the profitable B2C segment.
With the increasing importance of LED lighting owing to its inherent features like energy efficiency, the Company to further intensify its focus on the LED segment with different brand enhancing initiatives across different media platforms.
Maintaining its leadership position in the metering segment and some other different electrical equipment segments like LED automation systems, LT switchgear, circuit breakers and solar electrical products among others, the Company is well poised to take advantage of different favourable Government initiatives like ‘Housing for All’ and ‘Smart City’ among others. A pan-India presence coupled with strong R&D and manufacturing capabilities and long-standing relationships with Government agencies, power utilities and institutional customers, HPL is one of front runners to take advantage of the underserved Indian electrical equipment market.
Implementation of GST provided the organised players a level playing field with the unorganised ones as their cost advantage subsided significantly, thus providing a huge opportunity to players like HPL to explore in the days ahead and to capitalise on electrical equipment industry tailwinds.
Risk and concerns
The overarching objective of the Company is one of responsible risk management. The Company has evolved a risk-management framework encompassing effective processes and catalysed by a talented pool of qualified professionals. As a result, its business decisions balance risk and reward, leading to profitable and sustainable growth.
Economic slowdown
The industry is dependent on a number of other industries and also on the consumer spending. Economic slowdown or any unexpected Government policy may lead to a substantial decline in the consumer spending and investments by other industries like real estate and power. Lower spending may impact the profitability of all the companies present in the electrical equipment sector.
Mitigation: The Company endeavours to mitigate this risk by continuous value-addition in its product offerings and enhancing its brand visibility. Further, the volatility and the uncertainty that was prevalent in the Indian economy in 2016 has subsided significantly over the last two years and resulted in the economy coming back to its growth track.
Annual Report 2017-18Statutory Reports
27
Policy risk
Any sudden and abrupt change in the Government’s policy stance may have a negative impact on the economy along with prospects of the centrally funded schemes, resulting subdued performance across different industries.
Mitigation: In order to safeguard against such anomalies, the Company has diversified into different business segments which are more immune to these risks.
Raw material risk
Skewed aberrations in the raw material prices may lead to inventory losses, which in turn may impact the bottomline.
Mitigation: Owing to its leadership position in certain key business segments, the Company has been able to wheel better bargaining power with its customers and raw-material suppliers. The Company’s market position has thus enabled it to successfully mitigate the risk.
Client concentration risk
Over dependence on a single client or a handful of clients for majority of its business may harm the Company in case the client goes through a rough patch.
Mitigation: With an industry experience of 40+ years, the Company has forged strong long-standing business relationships with a number of clients, resulting into the Company achieving leadership status in some of the key segments. Business diversification has resulted in widening of customer base, showcasing the Company’s pro-activeness in risk mitigation.
Internal controls framework
The Company’s robust internal control systems ascertains the protection of its assets. The Company follows
Standardised Operating Procedures (SOPs), policies and guidelines, including regular monitoring procedures, and carries out self-assessment exercises.
The Company has instituted the Code of Conduct to guide the employees in the workplace. The Company observes the highest standards of ethical code and encourages its employees to actively participate in the work culture of the Company in which any unethical activity that may conflict Company’s business interest is speedily reported. The Company has also put in place a robust process of self-monitoring mechanism to ensure that the Company’s operations remain efficient, effective and free of fraudulent activities.
Internal Auditors and Corporate Audit Department of the Company ensure that Company’s internal control systems are followed meticulously as well as the competitiveness and accuracy of accounting methods are also observed.
Internal Control function helps the Company to observe laws and statutory requirements. It also ensures all compliance-related requirements are fulfilled in due course.
Human resources
HPL is a research-oriented Company and believes that people are its biggest asset. The Company insists its employees to upgrade their skills and achieve a higher level of capabilities. To achieve this, it regularly arranges training programmes for its employees. The Company has also employed a trained team of more than [100] engineers to drive the innovation and lay the foundation for future growth. The Company guides its people to strike a good work-life balance, encouraging them to participate in recreation activities as well. The total employee strength of the Company was over 1,383 as on March 31, 2018.
HPL Electric & Power Limited
28
Director’s Report
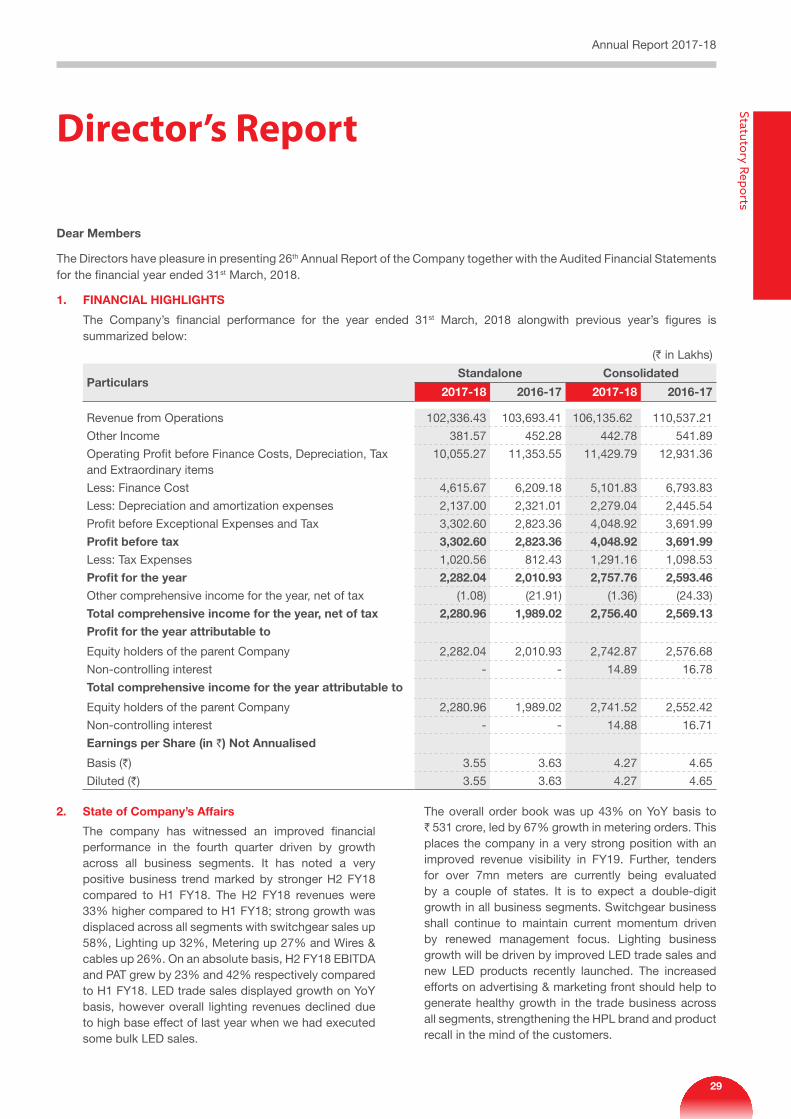
2. State of Company’s Affairs
The company has witnessed an improved financial performance in the fourth quarter driven by growth across all business segments. It has noted a very positive business trend marked by stronger H2 FY18 compared to H1 FY18. The H2 FY18 revenues were 33% higher compared to H1 FY18; strong growth was displaced across all segments with switchgear sales up 58%, Lighting up 32%, Metering up 27% and Wires & cables up 26%. On an absolute basis, H2 FY18 EBITDA and PAT grew by 23% and 42% respectively compared to H1 FY18. LED trade sales displayed growth on YoY basis, however overall lighting revenues declined due to high base effect of last year when we had executed some bulk LED sales.
The overall order book was up 43% on YoY basis to ` 531 crore, led by 67% growth in metering orders. This places the company in a very strong position with an improved revenue visibility in FY19. Further, tenders for over 7mn meters are currently being evaluated by a couple of states. It is to expect a double-digit growth in all business segments. Switchgear business shall continue to maintain current momentum driven by renewed management focus. Lighting business growth will be driven by improved LED trade sales and new LED products recently launched. The increased efforts on advertising & marketing front should help to generate healthy growth in the trade business across all segments, strengthening the HPL brand and product recall in the mind of the customers.
Dear Members
The Directors have pleasure in presenting 26th Annual Report of the Company together with the Audited Financial Statements for the financial year ended 31st March, 2018.
1. FinAnCiAl HigHligHtS
The Company’s financial performance for the year ended 31st March, 2018 alongwith previous year’s figures is summarized below:
(` in Lakhs)
ParticularsStandalone Consolidated
2017-18 2016-17 2017-18 2016-17
Revenue from Operations 102,336.43 103,693.41 106,135.62 110,537.21
Other Income 381.57 452.28 442.78 541.89
Operating Profit before Finance Costs, Depreciation, Tax and Extraordinary items
10,055.27 11,353.55 11,429.79 12,931.36
Less: Finance Cost 4,615.67 6,209.18 5,101.83 6,793.83
Less: Depreciation and amortization expenses 2,137.00 2,321.01 2,279.04 2,445.54
Profit before Exceptional Expenses and Tax 3,302.60 2,823.36 4,048.92 3,691.99
Profit before tax 3,302.60 2,823.36 4,048.92 3,691.99
Less: Tax Expenses 1,020.56 812.43 1,291.16 1,098.53
Profit for the year 2,282.04 2,010.93 2,757.76 2,593.46
Other comprehensive income for the year, net of tax (1.08) (21.91) (1.36) (24.33)
total comprehensive income for the year, net of tax 2,280.96 1,989.02 2,756.40 2,569.13
Profit for the year attributable to
Equity holders of the parent Company 2,282.04 2,010.93 2,742.87 2,576.68
Non-controlling interest - - 14.89 16.78
total comprehensive income for the year attributable to
Equity holders of the parent Company 2,280.96 1,989.02 2,741.52 2,552.42
Non-controlling interest - - 14.88 16.71
Earnings per Share (in `) not Annualised
Basis (`) 3.55 3.63 4.27 4.65
Diluted (`) 3.55 3.63 4.27 4.65
Annual Report 2017-18Statutory Reports
29
3. Subsidiaries/ Joint Ventures/ Associates
As on 31st March, 2018, the company is having only one subsidiary namely Himachal Energy Private Limited and two Joint Ventures (JVs) namely HPL Electric & Power Pvt. Ltd. – Shriji Designs (JV) and HPL Electric & Power Pvt. Ltd. – Trimurthi Hitech Co. Pvt. Ltd. - Shriji Designs (JV). These JVs are established as Association of Person (AOP) and not registered under the Companies Act and accordingly are not Associate Companies as per section 2(6) of the Companies Act, 2013.
The annual accounts of the subsidiary Company is available on the website of the Company i.e. www.hplindia.com.
A statement containing the salient features of the financial statement of a company’s subsidiary or subsidiaries, associate company or joint venture or ventures in Form AOC-1 is annexed as Annexure i.
4. Consolidated Financial Statement
In accordance with the provisions of the Companies Act, 2013 (“the Act”) and Ind AS 110 – Consolidated Financial Statement read with Ind AS - 28 Investments in Associates and Ind AS 31 – Interests in Joint Ventures, the audited consolidated financial statement is provided in this Annual Report.
5. Material Changes affecting the Company
There have been no material changes and commitments affecting the financial position of the Company between the end of the financial year and date of this report. There has been no change in the nature of business of the Company.
6. Reserves
During the period under report, the company do not propose to transfer any amount to the General Reserve.
7. Dividend
The Directors are pleased to recommend a dividend of ` 1.00 per equity share (10%) for the financial year ended 31st March, 2018, subject to the approval of the shareholders at the ensuing Annual General Meeting of the Company.
The dividend distribution would results in cash outgo of ` 7,75,17,640 (including tax on dividend of ` 1,32,17,154). The dividend would be payable to all those Shareholders whose names appear in the Register of Members as on 20th September, 2018.
8. Credit Rating
During the year under report, India Rating & Research Pvt. Ltd. has revised the company’s rating to IND A/IND A1 with Stable outlook from IND A/IND A1 with positive Outlook.
9. Public deposits
During the period under report, the Company has not accepted any deposit within the meaning of Sections 73 and 74 of the Companies Act, 2013 read together with the Companies (Acceptance of Deposits) Rules, 2014.
10. Directors and Key Managerial Personnel and change therein
During the period under report, Mr. Virender Kumar Bajaj (DIN: 07401106), an Independent Director, ceased to be a director of the company w.e.f. 14th January, 2018. The Board places on record its appreciation towards valuable contribution made by Mr. Virender Kumar Bajaj during his tenure as an Independent Director of the company.
The Board on the recommendation of the Nomination & Remuneration committee, by way of circulation, appointed Mr. Hargovind Sachdev (DIN: 08105319) as an Additional (Independent) Director w.e.f. 13th April, 2018 to hold office upto the date of the ensuing Annual General Meeting. The company has received consent in writing from Mr. Hargovind Sachdev to act as director in the form DIR-2 and intimation in the Form DIR- 8 to the effect that he is not disqualified U/s 164 (2) of the companies Act, 2013 to act as Director.
In the opinion of the Board, Mr. Hargovind Sachdev is a person of integrity and possess relevant expertise and experience and therefore his appointment requires the approval of the members at the ensuing Annual General Meeting.
Pursuant to the provisions of Section 152 of the Companies Act, 2013 and other applicable provisions of the Act, Mr. Vinod Ratan Gupta (DIN: 07401017), Whole- time Director of the Company, who retires by rotation at the ensuing Annual General Meeting and being eligible offers himself for re-appointment.
The Company has received declarations from all the Independent Directors of the Company confirming that they meet the criteria of independence prescribed under the Act and the SEBI Listing Regulations.
During the period under report, Mr. Neeraj Kumar ceased to be the Chief Financial Officer of the Company w.e.f 12th August, 2017 and Mr. Sudhir Barik was appointed as the Chief Financial Officer of the Company w.e.f 14th August, 2017.
Brief details of the directors being recommended for appointment/re-appointment as required under SEBI (Listing Obligations and Disclosure Requirements) Regulations, 2015 have been furnished in the Notice dated 2nd August, 2018 convening the 26th Annual General Meeting. Appropriate resolutions for their appointment/re-appointment are proposed for approval of the members at the Annual General Meeting.
HPL Electric & Power Limited
30
11. number of meetings of the Board
During the period under report, the Board of Directors of the Company met 4 (Four) times on 22nd May, 2017; 14th August, 2017; 14th November, 2017 and 12th February, 2018. Particulars of attendance of each director are mentioned in the Corporate Governance Report.
12. Formal Annual Evaluation
Pursuant to the provisions of Section 178 of the Companies Act, 2013 read with Companies (Amendment) Act, 2017 and SEBI (Listing Obligations and Disclosure Requirements) Regulations 2015, the Nomination and remuneration committee has laid down the manner for effective evaluation of performance of Board, its committees and individual directors and accordingly the performance of the Board; its committees and individual directors were evaluated by the Board.
While evaluating the performance of Board, the Board had considered the composition and structure of the Board in terms of size, experience, diversity, effectiveness of the board process, dissemination of information etc.
The performance of the committees were evaluated by the board taking into consideration the factors such as composition of the committee; effectiveness of committee meetings; independence of the committee from the Board and contribution in decision making by the Board etc.
The performance evaluation of all the individual directors including the Independent Directors was carried out after taking into account their individual contribution to the board and committee meetings such as preparedness on the issues to be discussed, effective contribution in the discussion on the various agenda items etc. Therefore the outcome of the performance evaluation for the period under report, was satisfactory and reflect how well the directors, board and committees are carrying their respective activities.
The independent directors in its separate meeting without the attendance of non-independent directors and members of management, reviewed -
(a) the performance of non-independent directors and the Board as a whole;
(b) the performance of the Chairperson of the company, taking into account the views of executive directors and non-executive directors;
(c) assess the quality, quantity and timeliness of flow of information between the company management and the Board that is necessary for the Board to effectively and reasonably perform their duties.
13. Policy on Appointment and Remuneration of Directors and Key Managerial Personnel and other employees
The Company has framed a Nomination and Remuneration Policy pursuant to Section 178 of the Companies Act, 2013 and Regulation 19(4) of Securities and Exchange Board of India (Listing Obligations and Disclosure Requirements) Regulations, 2015 (Specified in Part D of the Schedule II).
The detailed Nomination & Remuneration Policy is annexed as Annexure ii and forms part of this Report and is also available on the website of the Company at www.hplindia.com.
14. Extract of Annual Return
The extract of Annual Return in Form MGT-9 is annexed as Annexure iii.
15. listing
The equity shares of the Company are listed on the National Stock Exchange of India Ltd. and BSE Limited. The listing fee for the financial year 2018-19 has been paid to both the Stock Exchanges.
16. Audit Committee
The details pertaining to the composition of the Audit Committee are included in the Corporate Governance Report which is a part of this Annual Report.
17. Vigil mechanism
Pursuant to the provisions of Companies Act, 2013 and SEBI Listing Regulations, the Company has established a robust vigil Mechanism for directors and employees to report to the management instances of unethical behavior, actual or suspected, fraud or violation of the Company’s code of conduct. The Vigil Mechanism Policy provided that the company investigates in such incidents, when reported, in an impartial manner and shall take appropriate action as and when required to do so. The policy also provides the mechanism for adequate safeguard against the victimization of Director(s)/employees who avail the mechanism and also provide for the direct access to the Chairman of the Audit Committee in exceptional cases. A vigil Mechanism policy is available on the website of the company i.e. www.hplindia.com.
18. Risk Management
The Company has in place a robust risk management policy to anticipate, identify, measure, manage, mitigate, monitor and report the risk and uncertainties that may have an impact to achieve the business objective of the company. The Company recognizes these risks which need to be managed and mitigated to protect the interest of the stakeholders, to achieve business objectives and enable sustainable growth. The risk management framework is aimed at effectively
Annual Report 2017-18Statutory Reports
31
mitigating the Company’s various business and operational risks, through strategic actions. The risks are reviewed for the change in the nature and extent of the major risks identified since the last assessment. It also provides control measures for risk and future action plans.
An extensive program of internal audits and regular reviews by the Audit Committee is carried out to ensure compliance with the best practices.
19. Policy on Material Subsidiary
The Company has framed a Policy on Material Subsidiary under Regulations 16(c) of SEBI (Listing Obligations and Disclosures Requirements) Regulations, 2015 which is available on the website of the company i.e. www.hplindia.com.
20. Corporate Social Responsibility (CSR)
It is the responsibility of the corporations operating within society to contribute towards social and environmental development that will help in creating a positive impact on society at large.
The Corporate Social Responsibility committee comprises of Mrs. Madhu Bala Nath as Chairperson, Mr. Lalit Seth, Mr. Rishi Seth and Mr. Jainul Haque as members of the committee.
The company discharges its CSR obligations by making contribution through its Trust, Seth Inder Narain Foundation towards supporting projects in Eradicating hunger, poverty and malnutrition promoting health care; promoting education, including special education and employment enhancing vocation skills especially among children, women, elderly and the differently abled and livelihood enhancement projects. The company also extends its objective towards CSR in supporting the rural development projects.
The Board of Directors have approved the CSR Policy of the Company as formulated and recommended by the CSR Committee which is available on the website of the Company i.e. www.hplindia.com. A report on Corporate Social Responsibility is annexed as Annexure iV.
21. Particulars of Contracts or Arrangements with related Parties
All transactions entered into with related parties as defined under the Companies Act, 2013 and Securities and Exchange Board of India (Listing Obligations and Disclosure Requirements) Regulations, 2015 during the financial year ended 31st March, 2018 were in the ordinary course of business and at arm’s length basis. As per the provisions of Section 188 of the Companies Act, 2013 and Rules made thereunder read with Regulation 23 of Securities and Exchange Board of India (Listing Obligations and Disclosure Requirements)
Regulations, 2015, the Company had obtained the necessary prior approval of the Audit Committee for such transactions.
None of the transactions with any of the related parties were in conflict with the interest of the Company rather, they synchronize and synergies with the Company’s operations.
The Company has framed a Policy on Related Party Transactions in accordance with Securities and Exchange Board of India (Listing Obligations and Disclosure Requirements) Regulations, 2015 and as per the amended provisions of the Companies Act, 2013. The Policy intends to ensure that proper reporting; approval and disclosure processes are in place for all transactions between the Company and related parties. The policy is available on the website of the company i.e. www.hplindia.com and the Details of Related Party Transactions are annexed as per Form AOC-2 in Annexure V.
22. Auditors
A) Statutory Auditors
As per the provisions of Section 139(1) of the Act, the Company has appointed M/s. Kharabanda Associates, Chartered Accountants (Regn. No. 003456N) as Statutory Auditors for a period of 5 (Five) years in the Annual General Meeting of the company held on 28th September, 2017.
Statutory Auditors Report
There are no observations (including any qualification, reservation, adverse remark or disclaimer) of the Auditors in their Audit Report that may call for any explanation from the Directors. Further, the notes to accounts referred to in the Auditors’ Report are self-explanatory.
B) Cost Auditors
Pursuant to the provisions of Section 148 of the Companies Act, 2013 read with Companies (Cost Records and Audit) Rules, 2014 and other applicable provision of the Act, the company is required to maintain the cost records as specified by the Central Government and accordingly such accounts and records were made and maintained and M/s Bikram Jain & Associates, Cost Accountants, (Firm Registration No. 101610) has been re-appointed as Cost Auditor of the Company to conduct audit of Cost Records maintained by the Company for the financial year 2018-19.
The company has received his consent and certificate under Section 139, 141 and 148 of the Companies Act, 2013 read with the Companies (Audit and Auditors) Rules, 2014 to this effect.
HPL Electric & Power Limited
32
The remuneration payable to the Cost Auditor of the Company has been proposed for the ratification by the members of the Company and shall form part of the notice of the 26th Annual General Meeting.
C) Secretarial Auditors
Pursuant to the provisions of Section 204 of the Companies Act, 2013 read with corresponding rules made there under M/s. AVA Associates, Company Secretaries has been re-appointed as Secretarial Auditors of the Company to conduct Secretarial Audit of the Company for the financial year 2018-19.
Secretarial Audit Report
The Secretarial Audit Report for the FY 2017-18 as submitted by Secretarial Auditors in Form MR-3 is annexed to this Report as Annexure Vi.
There are no observations (including any qualification, reservation, adverse remark or disclaimer) of the Secretarial Auditors in their Secretarial Audit Report that may call for any explanation from the Directors.
23. Particulars of loans, guarantees or investments
The investment made by the company in the subsidiary company in the form of equity share capital is disclosed in the notes to the Audited Financial Statements forming part of this Annual Report. The company has not given any loans, guarantees or provided any security in connection with a loan to any body corporate or person as per section 186 of the Companies Act, 2013 during the period under report.
24. Particulars of remuneration of Directors/ KMP/Employees
The information required to be disclosed in the Director’s Report pursuant to Section 197 of the Companies Act, 2013 read with Rule 5 of the Companies (Appointment and Remuneration of Managerial Personnel) Rules, 2014 is set out in Annexure Vii to this report.
25. Research and Development:
HPL with its passion for innovation has under taken many initiatives to accelerate the business growth curve in the upward direction. Company has been regularly investing in infrastructure and its R&D centers to make world class products, meeting stringent Quality standards. All the R&D labs in various units have been focusing on design and development of innovative products in the field of Switchgear, Lighting and Metering etc. to meet the growing technological challenges of the times.
During the year, two new products were developed, viz. Automatic Transfer Switch(40~125A) & Double Break type MCCB(up to 250A). ATS (40~125A) was
successfully developed and commercialized too during the FY 2017-18. Double Break type MCCB (up to 250A) is in the tooling stage after successful development of prototypes. Once fully tested and productionized, it will cater to a whole new range of requirements. The products are user friendly from application point of view, safe & maintenance free. As such, these products were “Star of attraction” in HPL stall during Elecrama’18 exhibition held this year. The R&D team has been continuously working on improving the reliability and life cycle of HPL products. Most of the products are “CE” marked. All the plants are RoHS compliant to meet the demands of the new era of business globally.
Timely delivery of new products under development is of primary focus of R&D department. It works on a cohesive approach to narrow the gap between Design and Manufacturing by investing money in 3D model prototypes before commencing tool manufacturing. This saves a lot of time, energy and money while developing new products thereby increasing the efficiency of the company.
Company is continuously working on many more smart engineering electrical products to meet the future demand.
26. Conservation of Energy, technology Absorption, foreign Exchange Earnings and Outgo
The information on conservation of energy, technology absorption and foreign exchange earnings and outgo as stipulated under Section 134(3)(m) of the Companies Act, 2013 read with Rule 8 of the Companies (Accounts) Rules, 2014, is attached as Annexure Viii to this report.
27. Corporate governance Report
The Company is committed to maintain the highest standards of Corporate Governance and adhere to the Corporate Governance requirements set out by Securities and Exchange Board of India. The Company has also implemented several best corporate governance practices as prevalent globally. The report on Corporate Governance as stipulated under the Securities and Exchange Board of India (Listing Obligations and Disclosure Requirements) Regulations, 2015 forms an integral part of this Report. The requisite certificate from M/s. Kharabanda Associates, Statutory Auditors of the Company confirming compliance of conditions of corporate governance is also annexed to the Corporate Governance Report.
28. Directors’ Responsibility Statement
Pursuant to Section 134(3) (c) and 134(5) of the Companies Act, 2013, the Directors confirm that:
a. in the preparation of the annual accounts, the applicable accounting standards had been followed alongwith proper explanation relating to material departures;
Annual Report 2017-18Statutory Reports
33
b. the directors had selected such accounting policies and applied them consistently and made judgments and estimates that are reasonable and prudent so as to give a true and fair view of the state of affairs of the Company at the end of the financial year and of the profit of the Company for that period;
c. the Directors had taken proper and sufficient care for the maintenance of adequate accounting records in accordance with the provisions of this Act for safeguarding the assets of the Company and for preventing and detecting fraud and other irregularities;
d. the Directors had prepared the annual accounts on a going concern basis;
e. the Directors had laid down internal financial controls to be followed by the Company and that such internal financial controls are adequate and were operating effectively; and
f. the Directors had devised proper systems to ensure compliance with the provisions of all applicable laws and that such systems were adequate and operating effectively.
29. Disclosure under the sexual harassment of women at workplace (Prevention, Prohibition and Redressal) Act, 2013
The Company has always believed in providing a safe and harassment free workplace for every individual working in the Company premises through various interventions and practices. The Company always endeavors to create and provide an environment that is free from discrimination and harassment including sexual harassment.
The Company has in place robust policy on prevention of sexual harassment at workplace which is applicable to all employees of the company as per the provisions of Sexual Harassment of woman at work place (Prevention, prohibition and Redressal) Act, 2013.
During the year under report, the company has not received any complaints pertaining to sexual harassment.
30. Significant/material orders passed by the regulators
There are no significant/material orders passed by the Regulators or Courts or Tribunals impacting the going concern status of the Company and its operations in future.
31. internal Control Systems and adequacy of internal Financial Controls
The Company has adopted policies and procedures for effective internal controls system. This ensures that all transactions are authorized, recorded & timely preparation of reliable financial information, the safeguarding of its assets, the prevention and detection of frauds and errors. The Company has an Internal Control System, commensurate with the size, scale and complexity of its operations.
32. Management Discussion and Analysis Report
Management Discussion and Analysis Report for the year under report, as stipulated under the Companies Act, 2013 and Securities and Exchange Board of India (Listing Obligations and Disclosure Requirements) Regulations, 2015 is also presented in a separate section forming part of this Annual Report.
33. CEO and CFO Certificate
CEO and CFO Certificate as prescribed under Schedule II part B of Securities and Exchange Board of India (Listing Obligations and Disclosure Requirements) Regulations, 2015 is annexed to the Corporate Governance Report forming part of this Annual Report.
34. Disclosure of commission paid to managing or whole time directors
There is no commission paid or payable by the company to the managing director or the Whole-time directors.
35. Acknowledgement
The Board of Directors acknowledges the continued co-operation, assistance and support the Company has received from various Government Departments, Banks/ financial Institutions and shareholders. The Board also places on record its appreciation for the sincere services rendered by employees of the company at all levels and the support and co-operation extended by the valued business associates and the continuous patronage of the customers of the Company.
For and on Behalf of the Board
For HPl Electric & Power limited
lalit SethDate: 2nd August, 2018 Chairman and Managing DirectorPlace: Noida DIN: 00312007
HPL Electric & Power Limited
34
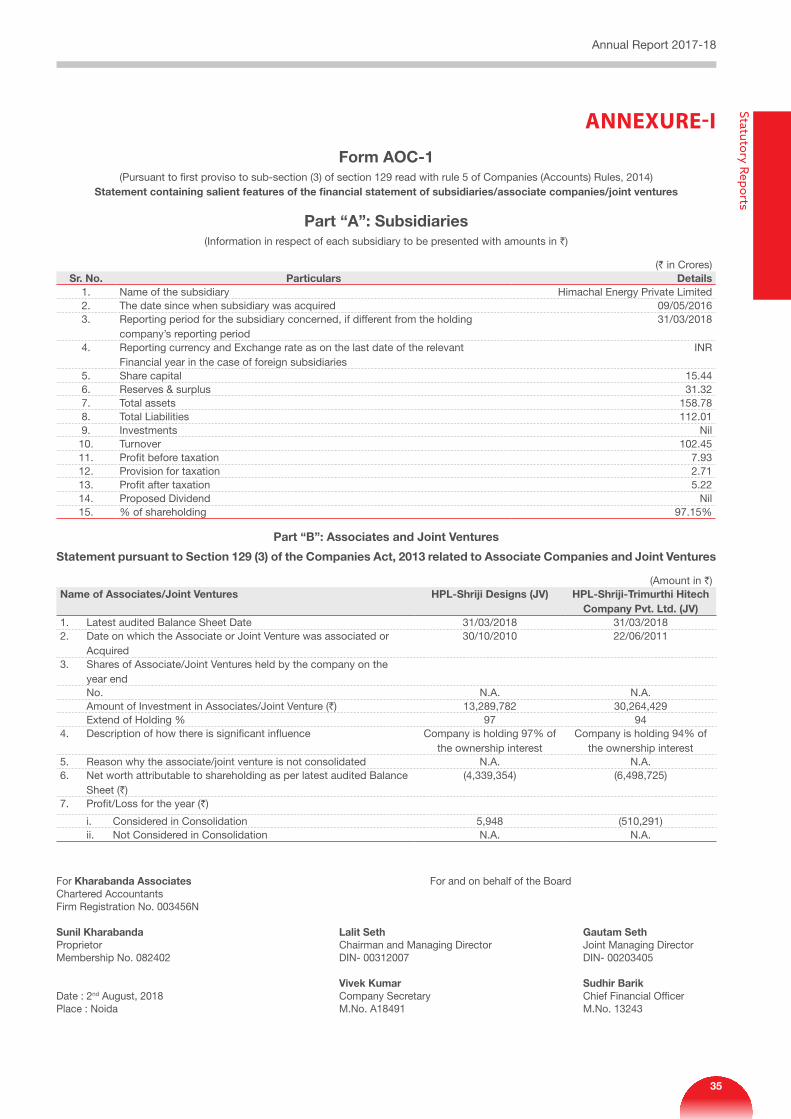
ANNEXURE-IForm AOC-1
(Pursuant to first proviso to sub-section (3) of section 129 read with rule 5 of Companies (Accounts) Rules, 2014)Statement containing salient features of the financial statement of subsidiaries/associate companies/joint ventures
Part “A”: Subsidiaries(Information in respect of each subsidiary to be presented with amounts in `)
(` in Crores)Sr. no. Particulars Details
1. Name of the subsidiary Himachal Energy Private Limited2. The date since when subsidiary was acquired 09/05/20163. Reporting period for the subsidiary concerned, if different from the holding
company’s reporting period31/03/2018
4. Reporting currency and Exchange rate as on the last date of the relevant Financial year in the case of foreign subsidiaries
INR
5. Share capital 15.446. Reserves & surplus 31.327. Total assets 158.788. Total Liabilities 112.019. Investments Nil
10. Turnover 102.4511. Profit before taxation 7.9312. Provision for taxation 2.7113. Profit after taxation 5.2214. Proposed Dividend Nil15. % of shareholding 97.15%
Part “B”: Associates and Joint Ventures
Statement pursuant to Section 129 (3) of the Companies Act, 2013 related to Associate Companies and Joint Ventures
(Amount in `)name of Associates/Joint Ventures HPl-Shriji Designs (JV) HPl-Shriji-trimurthi Hitech
Company Pvt. ltd. (JV)1. Latest audited Balance Sheet Date 31/03/2018 31/03/20182. Date on which the Associate or Joint Venture was associated or
Acquired30/10/2010 22/06/2011
3. Shares of Associate/Joint Ventures held by the company on the year end
No. N.A. N.A. Amount of Investment in Associates/Joint Venture (`) 13,289,782 30,264,429 Extend of Holding % 97 944. Description of how there is significant influence Company is holding 97% of
the ownership interestCompany is holding 94% of
the ownership interest5. Reason why the associate/joint venture is not consolidated N.A. N.A.6. Net worth attributable to shareholding as per latest audited Balance
Sheet (`)(4,339,354) (6,498,725)
7. Profit/Loss for the year (`)
i. Considered in Consolidation 5,948 (510,291) ii. Not Considered in Consolidation N.A. N.A.
For Kharabanda Associates For and on behalf of the BoardChartered AccountantsFirm Registration No. 003456N
Sunil Kharabanda lalit Seth gautam Seth Proprietor Chairman and Managing Director Joint Managing Director Membership No. 082402 DIN- 00312007 DIN- 00203405
Vivek Kumar Sudhir Barik Date : 2nd August, 2018 Company Secretary Chief Financial OfficerPlace : Noida M.No. A18491 M.No. 13243
Annual Report 2017-18Statutory Reports
35
ANNEXURE-IInOMinAtiOn AnD REMUnERAtiOn POliCY
This Nomination and Remuneration Policy is being formulated in compliance with Section 178 of the Companies Act, 2013 read along with the applicable rules thereto and Regulation 19 of the SEBI (Listing Obligations and Disclosure Requirements) Regulations, 2015, as amended from time to time. This policy on nomination and remuneration of Directors, Key Managerial Personnel and Senior Management has been formulated by the Nomination and Remuneration Committee (NRC or the Committee) and has been approved by the Board of Directors.
Definitions:
“Remuneration” means any money or its equivalent given or passed to any person for services rendered by him and includes perquisites as defined under the Income Tax Act, 1961;
“Key Managerial Personnel” means:
i. Managing Director, Joint Managing Director or Chief Executive Officer and Whole-time Director;
ii. Chief Financial Officer;
iii. Company Secretary; and
iv. Such other officer as may be prescribed.
“Senior Managerial Personnel” mean the personnel of the company who are members of its core management team excluding Board of Directors comprising all members of management, one level below the Executive Directors, including the functional heads.
Objective:
The objective of the policy is to ensure that
• thelevelandcompositionofremunerationisreasonableand sufficient to attract, retain and motivate directors of the quality required to run the company successfully;
• relationship of remuneration to performance is clearand meets appropriate performance benchmarks; and
• Remuneration to directors, keymanagerial personneland senior management involves a balance between fixed and incentive pay reflecting short and long-term performance objectives appropriate to the working of the company and its goals.
Role of the Committee:
The role of the NRC are inter alia, includes the following:
(a) Formulation of the criteria for determining qualifications, positive attributes and independence of a director and recommend to the Board of Directors a policy relating to, the remuneration of the directors, key managerial personnel and other employees;
(b) Formulation of criteria for evaluation of Independent Directors and the Board;
(c) Devising a policy on Board of Directors diversity;
(d) Identifying persons who are qualified to become directors of the Company and who may be appointed in senior management in accordance with the criteria laid down, and recommend to the Board of Directors their appointment and removal; and
(e) Extension or Continuation of the term of appointment of Independent Directors, on the basis of the report of performance evaluation of Independent Directors.
APPOintMEnt AnD REMOVAl OF DiRECtOR, KEY MAnAgERiAl PERSOnnEl AnD SEniOR MAnAgEMEnt
a) The Committee shall identify and ascertain the integrity, qualification, expertise and experience of the person for appointment as Director, KMP or at Senior Management level and recommend his / her appointment, as per Company’s Policy.
b) A person should possess adequate qualification, expertise and experience for the position he / she is considered for appointment. The Committee has authority to decide whether qualification, expertise and experience possessed by a person are sufficient / satisfactory for the position.
c) The Company shall not appoint or continue the employment of any person as Managing Director, Joint Managing Director or Whole-time Director, who has attained the age of seventy years, unless the same is approved by the shareholders through special resolution.
tERM/ tEnURE
a) Managing Director/Whole-time Director:
The Company shall appoint or re-appoint any person as its Executive Chairman, Managing Director or Executive Director for a term not exceeding five years at a time. No re-appointment shall be made earlier than one year before the expiry of term.
b) independent Director:
An Independent Director shall hold office for a term up to a maximum five consecutive years on the Board of the Company and will be eligible for re-appointment on passing of a special resolution by the Company and disclosure of such appointment in the Board’s report.
No Independent Director shall hold office for more than two consecutive terms of upto maximum of 5years each, but such Independent Director shall be eligible for appointment after expiry of three years of ceasing to become an Independent Director.
Provided that an Independent Director shall not, during the aforesaid period of three years, be appointed in or be associated with the Company in any other capacity, either directly or indirectly.
HPL Electric & Power Limited
36
At the time of appointment of Independent Director it should be ensured that number of Boards on which such Independent Director serves is restricted to seven listed companies as an Independent Director and three listed companies as an Independent Director in case such person is serving as a Whole-time Director of a listed company or such other number as may be prescribed under the Act.
EVAlUAtiOn
The Committee shall carry out evaluation of performance of Director, KMP and Senior Management Personnel yearly or at such intervals as may be considered necessary.
REMOVAl
The Committee may recommend with reasons recorded in writing, removal of a Director, KMP or Senior Management Personnel subject to the provisions and compliance of the Companies Act, 2013, rules and regulations and the policy of the Company.
REtiREMEnt
The Director, KMP and Senior Management Personnel shall retire as per the applicable provisions of the Law and the prevailing policy of the Company. The Board will have the discretion to retain the Director, KMP, Senior Management Personnel in the same position/ remuneration or otherwise even after attaining the retirement age, for the benefit of the Company.
POliCY FOR REMUnERAtiOn tO DiRECtORS/KMP/SEniOR MAnAgEMEnt PERSOnnEl
1) Remuneration to Managing Director/ Joint Managing Director/ Whole-time Directors:
a) The Remuneration/ Commission etc. to be paid to Managing Director/ Joint Managing Director/ Whole-time Directors, etc. shall be governed as per provisions of the Companies Act, 2013 and rules made there under or any other enactment for the time being in force and the approvals obtained from the Members of the Company.
b) The Nomination and Remuneration Committee shall make such recommendations to the Board of Directors, as it may consider appropriate with regard to remuneration to Managing Director/ Joint Managing Director/ Whole-time Directors.
2) Remuneration to non-Executive / independent Directors:
a) The Non-Executive/ Independent Directors may receive sitting fees and such other remuneration as permissible under the provisions of Companies Act, 2013. The amount of sitting fees shall be such as may be approved by the Board of Directors.
b) All the remuneration of the Non-Executive / Independent Directors (excluding remuneration for attending meetings as prescribed under Section 197 (5) of the Companies Act, 2013) shall be subject
to ceiling/ limits as provided under Companies Act, 2013 and rules made there under or any other enactment for the time being in force. The amount of such remuneration shall be such as may be recommended by the Nomination and Remuneration Committee and approved by the Board of Directors or shareholders, as the case may be.
c) An Independent Director shall not be eligible to get any Stock Options (if any) and also shall not be eligible to participate in any share based payment schemes of the Company.
d) Any remuneration paid to Non-Executive/ Independent Directors for services rendered which are of professional in nature shall not be considered as part of the remuneration for the purposes of clause (b) above if the following conditions are satisfied:
i) The Services are rendered by such Director in his capacity as the professional; and
i) In the opinion of the Committee, the director possesses the requisite qualification for the practice of that profession.
3) Remuneration to Key Managerial Personnel and Senior Management:
a) The remuneration to Key Managerial Personnel and Senior Management shall consist of fixed pay and incentive pay, in compliance with the provisions of the Companies Act, 2013 and in accordance with the Company’s Policy.
b) The Fixed pay shall include monthly remuneration, employer’s contribution to Provident Fund, contribution to pension fund, pension schemes, allowances etc. as decided from to time.
c) The Incentive pay shall be decided based on the balance between performance of the Company and performance of the Key Managerial Personnel and Senior Management, to be decided annually or at such intervals as may be considered appropriate.
iMPlEMEntAtiOn
• The Committee may issue guidelines, procedures,formats, reporting mechanism and manuals in supplement and for better implementation of this policy as considered appropriate.
• Company shall disclose the remuneration policy andevaluation criteria in its Annual Report.
• TheCommitteemayDelegateanyofitspowerstooneor more of its members.
For and on Behalf of the Board
For HPl Electric & Power limited
lalit SethDate: 2nd August, 2018 Chairman and Managing DirectorPlace: Noida DIN: 00312007
Annual Report 2017-18Statutory Reports
37
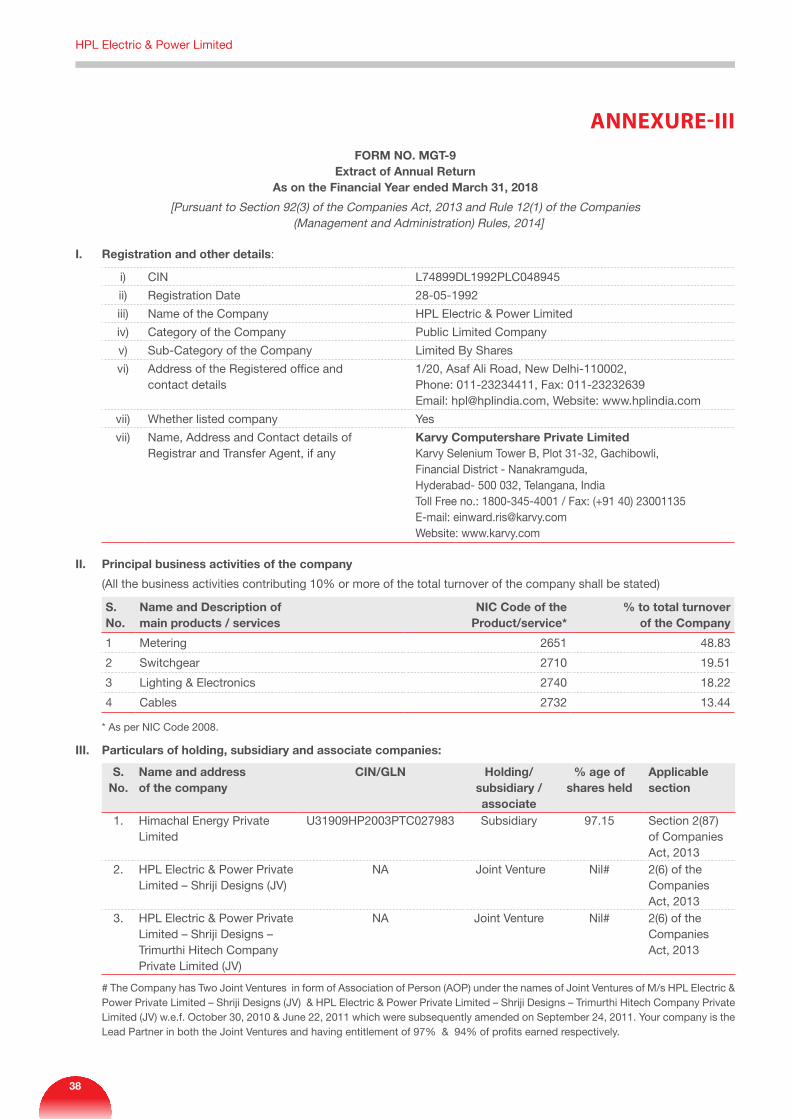
FORM nO. Mgt-9Extract of Annual Return
As on the Financial Year ended March 31, 2018
[Pursuant to Section 92(3) of the Companies Act, 2013 and Rule 12(1) of the Companies (Management and Administration) Rules, 2014]
i. Registration and other details:
i) CIN L74899DL1992PLC048945
ii) Registration Date 28-05-1992
iii) Name of the Company HPL Electric & Power Limited
iv) Category of the Company Public Limited Company
v) Sub-Category of the Company Limited By Shares
vi) Address of the Registered office and contact details
1/20, Asaf Ali Road, New Delhi-110002,Phone: 011-23234411, Fax: 011-23232639Email: [email protected], Website: www.hplindia.com
vii) Whether listed company Yes
vii) Name, Address and Contact details of Registrar and Transfer Agent, if any
Karvy Computershare Private limitedKarvy Selenium Tower B, Plot 31-32, Gachibowli, Financial District - Nanakramguda, Hyderabad- 500 032, Telangana, IndiaToll Free no.: 1800-345-4001 / Fax: (+91 40) 23001135E-mail: [email protected]: www.karvy.com
ii. Principal business activities of the company
(All the business activities contributing 10% or more of the total turnover of the company shall be stated)
S. no.
name and Description of main products / services
niC Code of the Product/service*
% to total turnover of the Company
1 Metering 2651 48.83
2 Switchgear 2710 19.51
3 Lighting & Electronics 2740 18.22
4 Cables 2732 13.44
* As per NIC Code 2008.
iii. Particulars of holding, subsidiary and associate companies:
S. no.
name and address of the company
Cin/gln Holding/ subsidiary / associate
% age of shares held
Applicable section
1. Himachal Energy Private Limited
U31909HP2003PTC027983 Subsidiary 97.15 Section 2(87) of Companies Act, 2013
2. HPL Electric & Power Private Limited – Shriji Designs (JV)
NA Joint Venture Nil# 2(6) of theCompanies Act, 2013
3. HPL Electric & Power Private Limited – Shriji Designs – Trimurthi Hitech Company Private Limited (JV)
NA Joint Venture Nil# 2(6) of theCompanies Act, 2013
# The Company has Two Joint Ventures in form of Association of Person (AOP) under the names of Joint Ventures of M/s HPL Electric & Power Private Limited – Shriji Designs (JV) & HPL Electric & Power Private Limited – Shriji Designs – Trimurthi Hitech Company Private Limited (JV) w.e.f. October 30, 2010 & June 22, 2011 which were subsequently amended on September 24, 2011. Your company is the Lead Partner in both the Joint Ventures and having entitlement of 97% & 94% of profits earned respectively.
ANNEXURE-III
HPL Electric & Power Limited
38
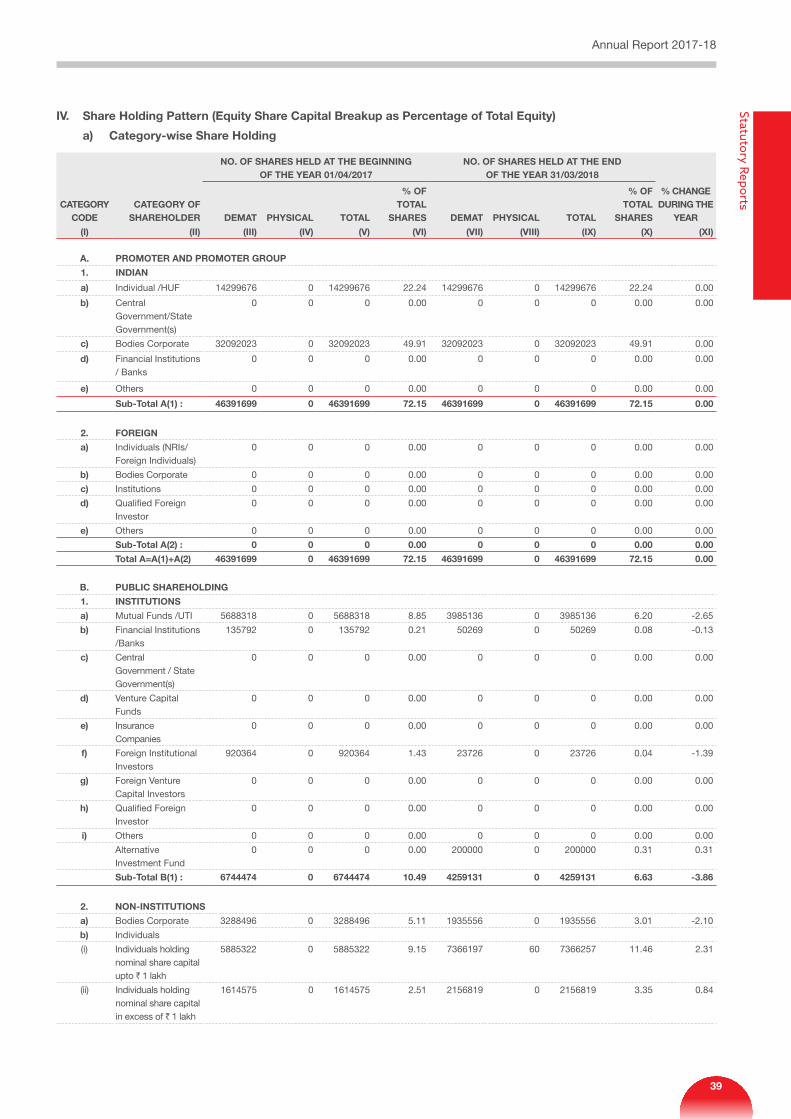
iV. Share Holding Pattern (Equity Share Capital Breakup as Percentage of total Equity)
a) Category-wise Share Holding
CAtEgORY CODE
CAtEgORY OF SHAREHOlDER
nO. OF SHARES HElD At tHE BEginning OF tHE YEAR 01/04/2017
nO. OF SHARES HElD At tHE EnD OF tHE YEAR 31/03/2018
% CHAngE DURing tHE
YEAR DEMAt PHYSiCAl tOtAl
% OF tOtAl
SHARES DEMAt PHYSiCAl tOtAl
% OF tOtAl
SHARES
(i) (ii) (iii) (iV) (V) (Vi) (Vii) (Viii) (iX) (X) (Xi)
A. PROMOtER AnD PROMOtER gROUP
1. inDiAn
a) Individual /HUF 14299676 0 14299676 22.24 14299676 0 14299676 22.24 0.00
b) Central Government/State Government(s)
0 0 0 0.00 0 0 0 0.00 0.00
c) Bodies Corporate 32092023 0 32092023 49.91 32092023 0 32092023 49.91 0.00
d) Financial Institutions / Banks
0 0 0 0.00 0 0 0 0.00 0.00
e) Others 0 0 0 0.00 0 0 0 0.00 0.00
Sub-total A(1) : 46391699 0 46391699 72.15 46391699 0 46391699 72.15 0.00
2. FOREign
a) Individuals (NRIs/Foreign Individuals)
0 0 0 0.00 0 0 0 0.00 0.00
b) Bodies Corporate 0 0 0 0.00 0 0 0 0.00 0.00
c) Institutions 0 0 0 0.00 0 0 0 0.00 0.00
d) Qualified Foreign Investor
0 0 0 0.00 0 0 0 0.00 0.00
e) Others 0 0 0 0.00 0 0 0 0.00 0.00
Sub-total A(2) : 0 0 0 0.00 0 0 0 0.00 0.00
total A=A(1)+A(2) 46391699 0 46391699 72.15 46391699 0 46391699 72.15 0.00
B. PUBliC SHAREHOlDing
1. inStitUtiOnS
a) Mutual Funds /UTI 5688318 0 5688318 8.85 3985136 0 3985136 6.20 -2.65
b) Financial Institutions /Banks
135792 0 135792 0.21 50269 0 50269 0.08 -0.13
c) Central Government / State Government(s)
0 0 0 0.00 0 0 0 0.00 0.00
d) Venture Capital Funds
0 0 0 0.00 0 0 0 0.00 0.00
e) Insurance Companies
0 0 0 0.00 0 0 0 0.00 0.00
f) Foreign Institutional Investors
920364 0 920364 1.43 23726 0 23726 0.04 -1.39
g) Foreign Venture Capital Investors
0 0 0 0.00 0 0 0 0.00 0.00
h) Qualified Foreign Investor
0 0 0 0.00 0 0 0 0.00 0.00
i) Others 0 0 0 0.00 0 0 0 0.00 0.00
Alternative Investment Fund
0 0 0 0.00 200000 0 200000 0.31 0.31
Sub-total B(1) : 6744474 0 6744474 10.49 4259131 0 4259131 6.63 -3.86
2. nOn-inStitUtiOnS
a) Bodies Corporate 3288496 0 3288496 5.11 1935556 0 1935556 3.01 -2.10
b) Individuals
(i) Individuals holding nominal share capital upto ` 1 lakh
5885322 0 5885322 9.15 7366197 60 7366257 11.46 2.31
(ii) Individuals holding nominal share capital in excess of ` 1 lakh
1614575 0 1614575 2.51 2156819 0 2156819 3.35 0.84
Annual Report 2017-18Statutory Reports
39
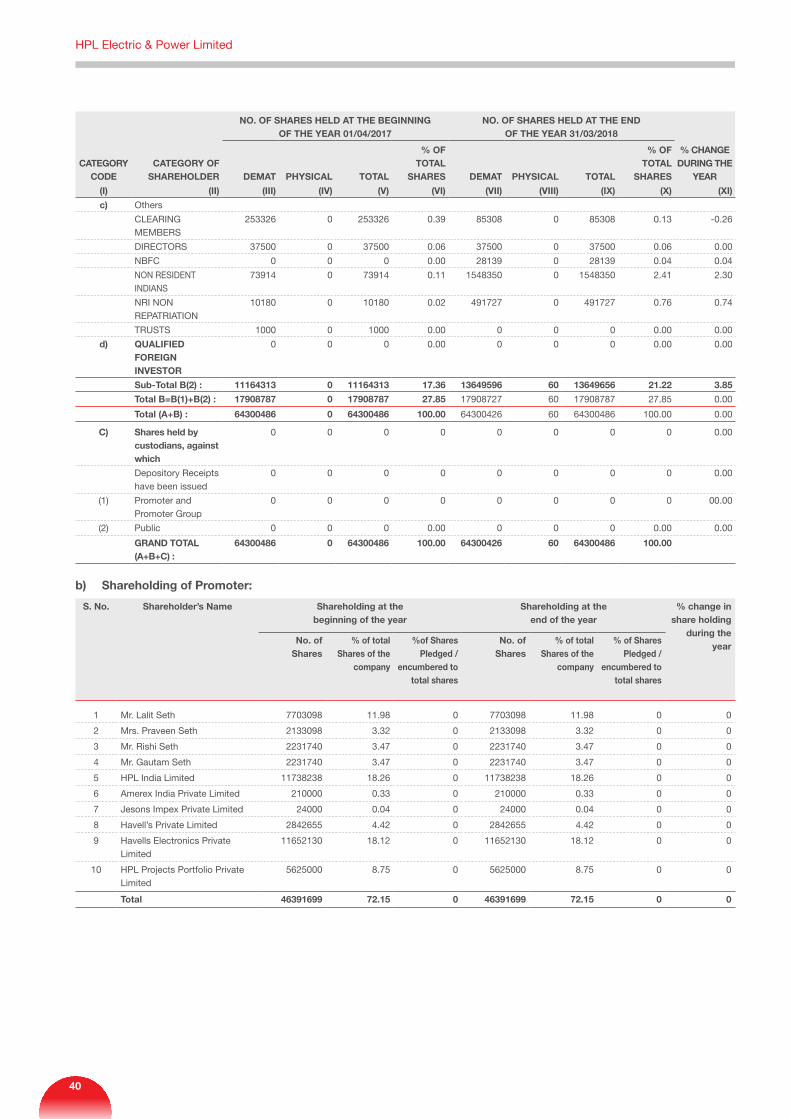
CAtEgORY CODE
CAtEgORY OF SHAREHOlDER
nO. OF SHARES HElD At tHE BEginning OF tHE YEAR 01/04/2017
nO. OF SHARES HElD At tHE EnD OF tHE YEAR 31/03/2018
% CHAngE DURing tHE
YEAR DEMAt PHYSiCAl tOtAl
% OF tOtAl
SHARES DEMAt PHYSiCAl tOtAl
% OF tOtAl
SHARES
(i) (ii) (iii) (iV) (V) (Vi) (Vii) (Viii) (iX) (X) (Xi)
c) Others
CLEARING MEMBERS
253326 0 253326 0.39 85308 0 85308 0.13 -0.26
DIRECTORS 37500 0 37500 0.06 37500 0 37500 0.06 0.00
NBFC 0 0 0 0.00 28139 0 28139 0.04 0.04
NON RESIDENT INDIANS
73914 0 73914 0.11 1548350 0 1548350 2.41 2.30
NRI NON REPATRIATION
10180 0 10180 0.02 491727 0 491727 0.76 0.74
TRUSTS 1000 0 1000 0.00 0 0 0 0.00 0.00
d) QUAliFiED FOREign inVEStOR
0 0 0 0.00 0 0 0 0.00 0.00
Sub-total B(2) : 11164313 0 11164313 17.36 13649596 60 13649656 21.22 3.85
total B=B(1)+B(2) : 17908787 0 17908787 27.85 17908727 60 17908787 27.85 0.00
total (A+B) : 64300486 0 64300486 100.00 64300426 60 64300486 100.00 0.00
C) Shares held by custodians, against which
0 0 0 0 0 0 0 0 0.00
Depository Receipts have been issued
0 0 0 0 0 0 0 0 0.00
(1) Promoter and Promoter Group
0 0 0 0 0 0 0 0 00.00
(2) Public 0 0 0 0.00 0 0 0 0.00 0.00
gRAnD tOtAl (A+B+C) :
64300486 0 64300486 100.00 64300426 60 64300486 100.00
b) Shareholding of Promoter:
S. no. Shareholder’s name Shareholding at the beginning of the year
Shareholding at the end of the year
% change in share holding
during the year
no. of Shares
% of total Shares of the
company
%of Shares Pledged /
encumbered to total shares
no. of Shares
% of total Shares of the
company
% of Shares Pledged /
encumbered to total shares
1 Mr. Lalit Seth 7703098 11.98 0 7703098 11.98 0 0
2 Mrs. Praveen Seth 2133098 3.32 0 2133098 3.32 0 0
3 Mr. Rishi Seth 2231740 3.47 0 2231740 3.47 0 0
4 Mr. Gautam Seth 2231740 3.47 0 2231740 3.47 0 0
5 HPL India Limited 11738238 18.26 0 11738238 18.26 0 0
6 Amerex India Private Limited 210000 0.33 0 210000 0.33 0 0
7 Jesons Impex Private Limited 24000 0.04 0 24000 0.04 0 0
8 Havell’s Private Limited 2842655 4.42 0 2842655 4.42 0 0
9 Havells Electronics Private Limited
11652130 18.12 0 11652130 18.12 0 0
10 HPL Projects Portfolio Private Limited
5625000 8.75 0 5625000 8.75 0 0
total 46391699 72.15 0 46391699 72.15 0 0
HPL Electric & Power Limited
40
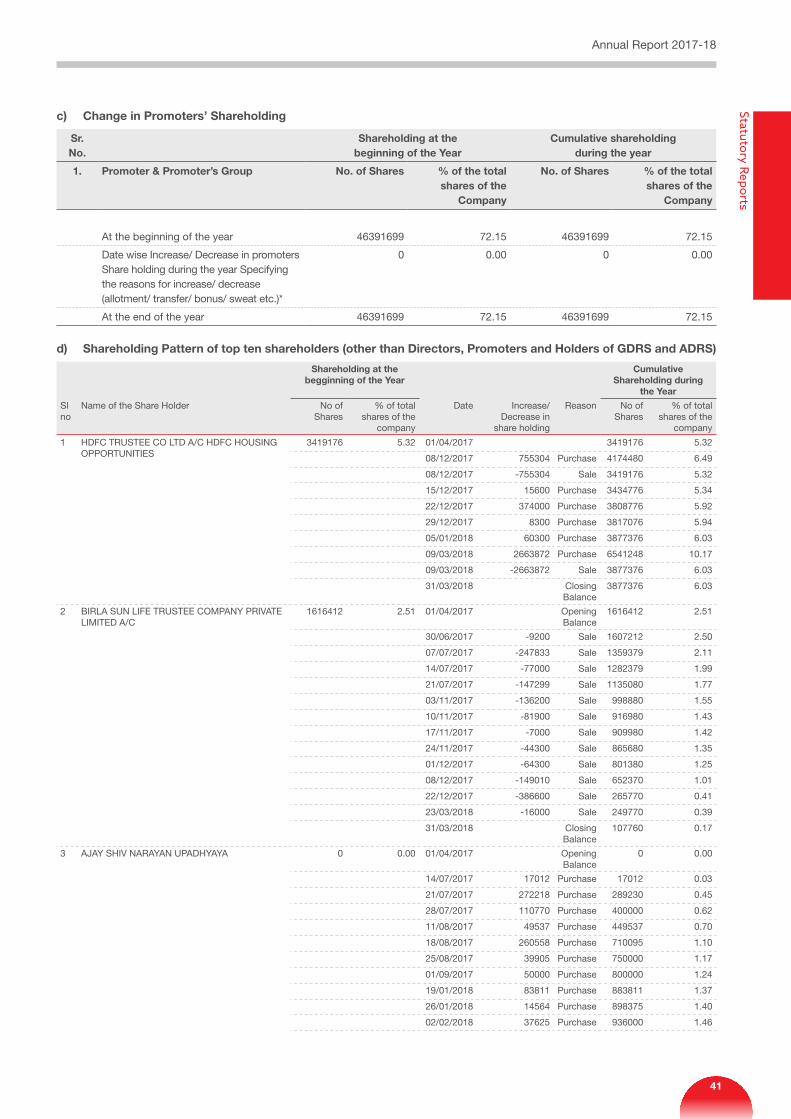
c) Change in Promoters’ Shareholding
Sr. no.
Shareholding at the beginning of the Year
Cumulative shareholding during the year
1. Promoter & Promoter’s group no. of Shares % of the total shares of the
Company
no. of Shares % of the total shares of the
Company
At the beginning of the year 46391699 72.15 46391699 72.15
Date wise Increase/ Decrease in promoters Share holding during the year Specifying the reasons for increase/ decrease (allotment/ transfer/ bonus/ sweat etc.)*
0 0.00 0 0.00
At the end of the year 46391699 72.15 46391699 72.15
d) Shareholding Pattern of top ten shareholders (other than Directors, Promoters and Holders of gDRS and ADRS)
Shareholding at the begginning of the Year
Cumulative Shareholding during
the Year
Sl no
Name of the Share Holder No of Shares
% of total shares of the
company
Date Increase/ Decrease in
share holding
Reason No of Shares
% of total shares of the
company
1 HDFC TRUSTEE CO LTD A/C HDFC HOUSING OPPORTUNITIES
3419176 5.32 01/04/2017 3419176 5.32
08/12/2017 755304 Purchase 4174480 6.49
08/12/2017 -755304 Sale 3419176 5.32
15/12/2017 15600 Purchase 3434776 5.34
22/12/2017 374000 Purchase 3808776 5.92
29/12/2017 8300 Purchase 3817076 5.94
05/01/2018 60300 Purchase 3877376 6.03
09/03/2018 2663872 Purchase 6541248 10.17
09/03/2018 -2663872 Sale 3877376 6.03
31/03/2018 Closing Balance
3877376 6.03
2 BIRLA SUN LIFE TRUSTEE COMPANY PRIVATE LIMITED A/C
1616412 2.51 01/04/2017 Opening Balance
1616412 2.51
30/06/2017 -9200 Sale 1607212 2.50
07/07/2017 -247833 Sale 1359379 2.11
14/07/2017 -77000 Sale 1282379 1.99
21/07/2017 -147299 Sale 1135080 1.77
03/11/2017 -136200 Sale 998880 1.55
10/11/2017 -81900 Sale 916980 1.43
17/11/2017 -7000 Sale 909980 1.42
24/11/2017 -44300 Sale 865680 1.35
01/12/2017 -64300 Sale 801380 1.25
08/12/2017 -149010 Sale 652370 1.01
22/12/2017 -386600 Sale 265770 0.41
23/03/2018 -16000 Sale 249770 0.39
31/03/2018 Closing Balance
107760 0.17
3 AJAY SHIV NARAYAN UPADHYAYA 0 0.00 01/04/2017 Opening Balance
0 0.00
14/07/2017 17012 Purchase 17012 0.03
21/07/2017 272218 Purchase 289230 0.45
28/07/2017 110770 Purchase 400000 0.62
11/08/2017 49537 Purchase 449537 0.70
18/08/2017 260558 Purchase 710095 1.10
25/08/2017 39905 Purchase 750000 1.17
01/09/2017 50000 Purchase 800000 1.24
19/01/2018 83811 Purchase 883811 1.37
26/01/2018 14564 Purchase 898375 1.40
02/02/2018 37625 Purchase 936000 1.46
Annual Report 2017-18Statutory Reports
41
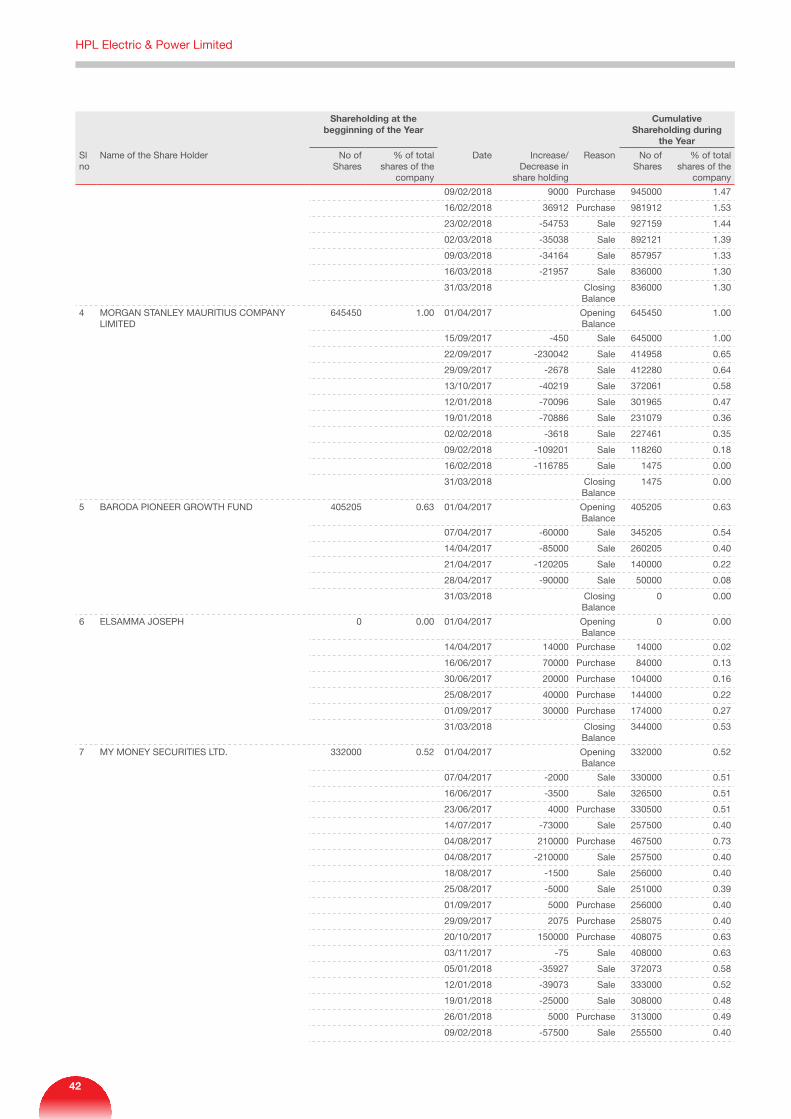
Shareholding at the begginning of the Year
Cumulative Shareholding during
the Year
Sl no
Name of the Share Holder No of Shares
% of total shares of the
company
Date Increase/ Decrease in
share holding
Reason No of Shares
% of total shares of the
company
09/02/2018 9000 Purchase 945000 1.47
16/02/2018 36912 Purchase 981912 1.53
23/02/2018 -54753 Sale 927159 1.44
02/03/2018 -35038 Sale 892121 1.39
09/03/2018 -34164 Sale 857957 1.33
16/03/2018 -21957 Sale 836000 1.30
31/03/2018 Closing Balance
836000 1.30
4 MORGAN STANLEY MAURITIUS COMPANY LIMITED
645450 1.00 01/04/2017 Opening Balance
645450 1.00
15/09/2017 -450 Sale 645000 1.00
22/09/2017 -230042 Sale 414958 0.65
29/09/2017 -2678 Sale 412280 0.64
13/10/2017 -40219 Sale 372061 0.58
12/01/2018 -70096 Sale 301965 0.47
19/01/2018 -70886 Sale 231079 0.36
02/02/2018 -3618 Sale 227461 0.35
09/02/2018 -109201 Sale 118260 0.18
16/02/2018 -116785 Sale 1475 0.00
31/03/2018 Closing Balance
1475 0.00
5 BARODA PIONEER GROWTH FUND 405205 0.63 01/04/2017 Opening Balance
405205 0.63
07/04/2017 -60000 Sale 345205 0.54
14/04/2017 -85000 Sale 260205 0.40
21/04/2017 -120205 Sale 140000 0.22
28/04/2017 -90000 Sale 50000 0.08
31/03/2018 Closing Balance
0 0.00
6 ELSAMMA JOSEPH 0 0.00 01/04/2017 Opening Balance
0 0.00
14/04/2017 14000 Purchase 14000 0.02
16/06/2017 70000 Purchase 84000 0.13
30/06/2017 20000 Purchase 104000 0.16
25/08/2017 40000 Purchase 144000 0.22
01/09/2017 30000 Purchase 174000 0.27
31/03/2018 Closing Balance
344000 0.53
7 MY MONEY SECURITIES LTD. 332000 0.52 01/04/2017 Opening Balance
332000 0.52
07/04/2017 -2000 Sale 330000 0.51
16/06/2017 -3500 Sale 326500 0.51
23/06/2017 4000 Purchase 330500 0.51
14/07/2017 -73000 Sale 257500 0.40
04/08/2017 210000 Purchase 467500 0.73
04/08/2017 -210000 Sale 257500 0.40
18/08/2017 -1500 Sale 256000 0.40
25/08/2017 -5000 Sale 251000 0.39
01/09/2017 5000 Purchase 256000 0.40
29/09/2017 2075 Purchase 258075 0.40
20/10/2017 150000 Purchase 408075 0.63
03/11/2017 -75 Sale 408000 0.63
05/01/2018 -35927 Sale 372073 0.58
12/01/2018 -39073 Sale 333000 0.52
19/01/2018 -25000 Sale 308000 0.48
26/01/2018 5000 Purchase 313000 0.49
09/02/2018 -57500 Sale 255500 0.40
HPL Electric & Power Limited
42
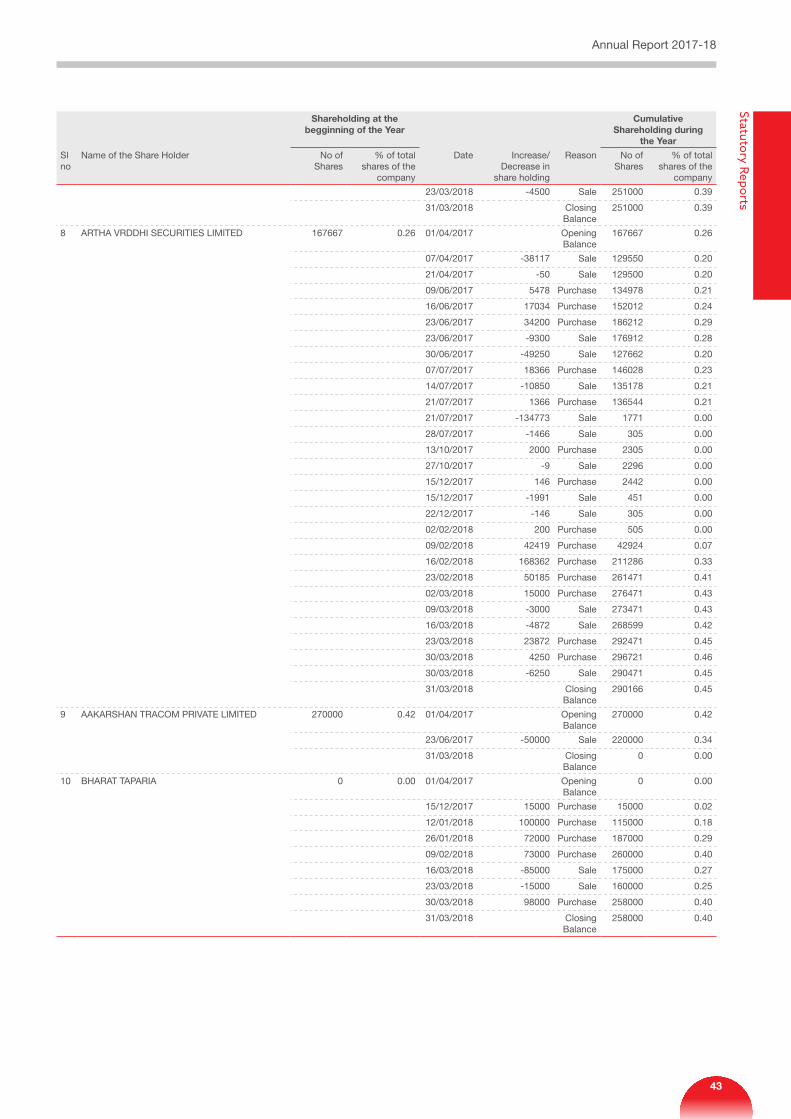
Shareholding at the begginning of the Year
Cumulative Shareholding during
the Year
Sl no
Name of the Share Holder No of Shares
% of total shares of the
company
Date Increase/ Decrease in
share holding
Reason No of Shares
% of total shares of the
company
23/03/2018 -4500 Sale 251000 0.39
31/03/2018 Closing Balance
251000 0.39
8 ARTHA VRDDHI SECURITIES LIMITED 167667 0.26 01/04/2017 Opening Balance
167667 0.26
07/04/2017 -38117 Sale 129550 0.20
21/04/2017 -50 Sale 129500 0.20
09/06/2017 5478 Purchase 134978 0.21
16/06/2017 17034 Purchase 152012 0.24
23/06/2017 34200 Purchase 186212 0.29
23/06/2017 -9300 Sale 176912 0.28
30/06/2017 -49250 Sale 127662 0.20
07/07/2017 18366 Purchase 146028 0.23
14/07/2017 -10850 Sale 135178 0.21
21/07/2017 1366 Purchase 136544 0.21
21/07/2017 -134773 Sale 1771 0.00
28/07/2017 -1466 Sale 305 0.00
13/10/2017 2000 Purchase 2305 0.00
27/10/2017 -9 Sale 2296 0.00
15/12/2017 146 Purchase 2442 0.00
15/12/2017 -1991 Sale 451 0.00
22/12/2017 -146 Sale 305 0.00
02/02/2018 200 Purchase 505 0.00
09/02/2018 42419 Purchase 42924 0.07
16/02/2018 168362 Purchase 211286 0.33
23/02/2018 50185 Purchase 261471 0.41
02/03/2018 15000 Purchase 276471 0.43
09/03/2018 -3000 Sale 273471 0.43
16/03/2018 -4872 Sale 268599 0.42
23/03/2018 23872 Purchase 292471 0.45
30/03/2018 4250 Purchase 296721 0.46
30/03/2018 -6250 Sale 290471 0.45
31/03/2018 Closing Balance
290166 0.45
9 AAKARSHAN TRACOM PRIVATE LIMITED 270000 0.42 01/04/2017 Opening Balance
270000 0.42
23/06/2017 -50000 Sale 220000 0.34
31/03/2018 Closing Balance
0 0.00
10 BHARAT TAPARIA 0 0.00 01/04/2017 Opening Balance
0 0.00
15/12/2017 15000 Purchase 15000 0.02
12/01/2018 100000 Purchase 115000 0.18
26/01/2018 72000 Purchase 187000 0.29
09/02/2018 73000 Purchase 260000 0.40
16/03/2018 -85000 Sale 175000 0.27
23/03/2018 -15000 Sale 160000 0.25
30/03/2018 98000 Purchase 258000 0.40
31/03/2018 Closing Balance
258000 0.40
Annual Report 2017-18Statutory Reports
43
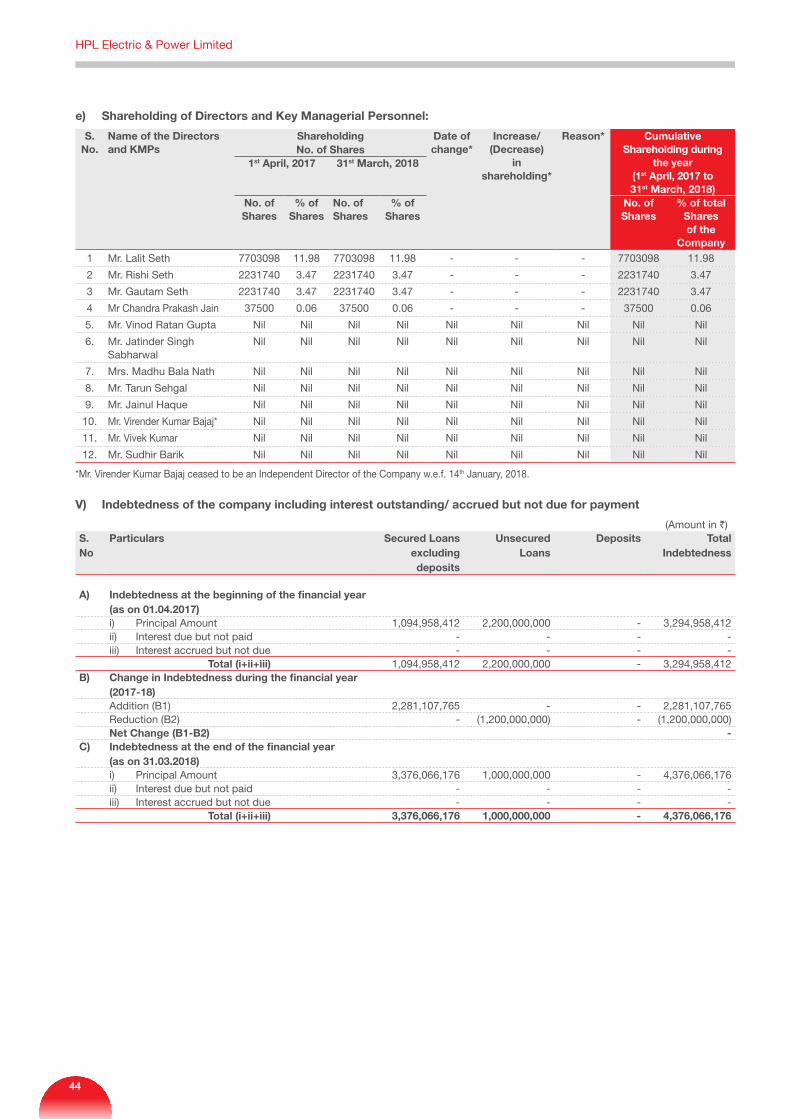
e) Shareholding of Directors and Key Managerial Personnel:
S. no.
name of the Directors and KMPs
Shareholding Date of change*
increase/(Decrease)
in shareholding*
Reason* CumulativeShareholding during
the year (1st April, 2017 to31st March, 2018)
no. of Shares1st April, 2017 31st March, 2018
no. of Shares
% of Shares
no. of Shares
% of Shares
no. ofShares
% of totalSharesof the
Company1 Mr. Lalit Seth 7703098 11.98 7703098 11.98 - - - 7703098 11.98
2 Mr. Rishi Seth 2231740 3.47 2231740 3.47 - - - 2231740 3.47
3 Mr. Gautam Seth 2231740 3.47 2231740 3.47 - - - 2231740 3.47
4 Mr Chandra Prakash Jain 37500 0.06 37500 0.06 - - - 37500 0.06
5. Mr. Vinod Ratan Gupta Nil Nil Nil Nil Nil Nil Nil Nil Nil
6. Mr. Jatinder Singh Sabharwal
Nil Nil Nil Nil Nil Nil Nil Nil Nil
7. Mrs. Madhu Bala Nath Nil Nil Nil Nil Nil Nil Nil Nil Nil
8. Mr. Tarun Sehgal Nil Nil Nil Nil Nil Nil Nil Nil Nil
9. Mr. Jainul Haque Nil Nil Nil Nil Nil Nil Nil Nil Nil
10. Mr. Virender Kumar Bajaj* Nil Nil Nil Nil Nil Nil Nil Nil Nil
11. Mr. Vivek Kumar Nil Nil Nil Nil Nil Nil Nil Nil Nil
12. Mr. Sudhir Barik Nil Nil Nil Nil Nil Nil Nil Nil Nil
*Mr. Virender Kumar Bajaj ceased to be an Independent Director of the Company w.e.f. 14th January, 2018.
V) indebtedness of the company including interest outstanding/ accrued but not due for payment
(Amount in `)S. no
Particulars Secured loans excluding deposits
Unsecured loans
Deposits total indebtedness
A) indebtedness at the beginning of the financial year (as on 01.04.2017)
i) Principal Amount 1,094,958,412 2,200,000,000 - 3,294,958,412ii) Interest due but not paid - - - -iii) Interest accrued but not due - - - -
total (i+ii+iii) 1,094,958,412 2,200,000,000 - 3,294,958,412B) Change in indebtedness during the financial year
(2017-18)Addition (B1) 2,281,107,765 - - 2,281,107,765Reduction (B2) - (1,200,000,000) - (1,200,000,000)net Change (B1-B2) -
C) indebtedness at the end of the financial year (as on 31.03.2018)i) Principal Amount 3,376,066,176 1,000,000,000 - 4,376,066,176ii) Interest due but not paid - - - -iii) Interest accrued but not due - - - -
total (i+ii+iii) 3,376,066,176 1,000,000,000 - 4,376,066,176
HPL Electric & Power Limited
44
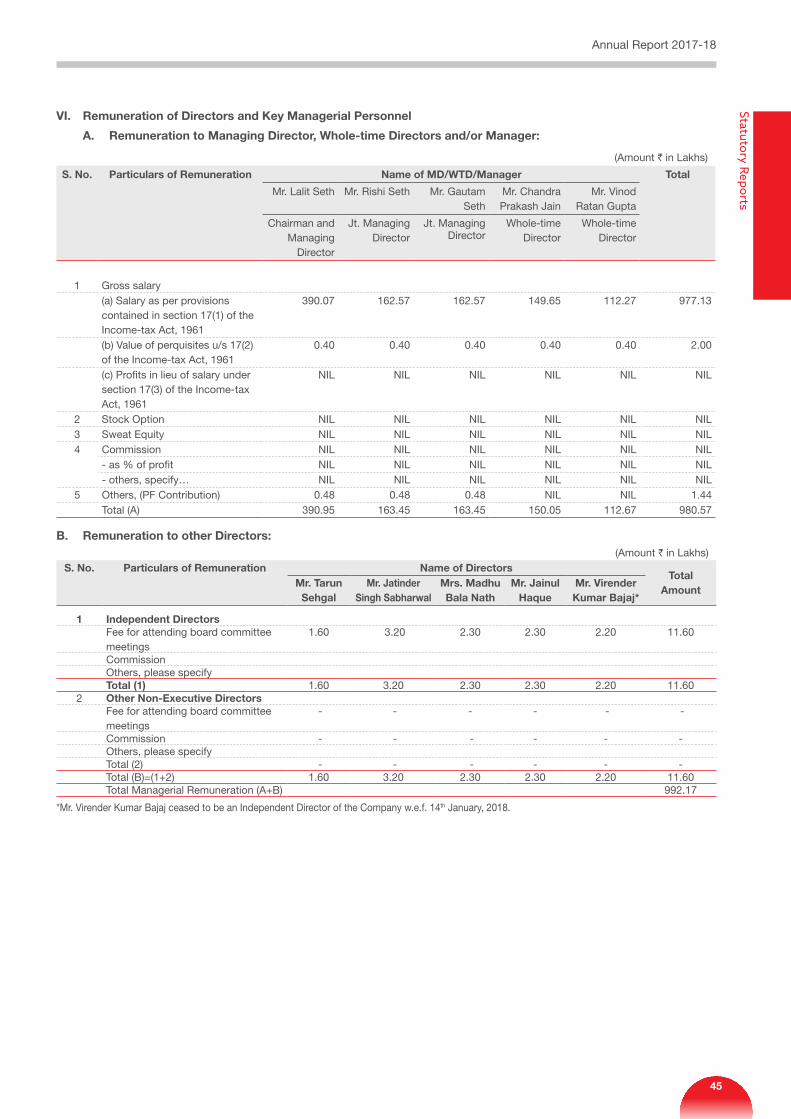
Vi. Remuneration of Directors and Key Managerial Personnel
A. Remuneration to Managing Director, Whole-time Directors and/or Manager:
(Amount ` in Lakhs)
S. no. Particulars of Remuneration name of MD/WtD/Manager total
Mr. Lalit Seth Mr. Rishi Seth Mr. Gautam Seth
Mr. Chandra Prakash Jain
Mr. Vinod Ratan Gupta
Chairman and Managing
Director
Jt. Managing Director
Jt. Managing Director
Whole-time Director
Whole-time Director
1 Gross salary(a) Salary as per provisions contained in section 17(1) of the Income-tax Act, 1961
390.07 162.57 162.57 149.65 112.27 977.13
(b) Value of perquisites u/s 17(2) of the Income-tax Act, 1961
0.40 0.40 0.40 0.40 0.40 2.00
(c) Profits in lieu of salary under section 17(3) of the Income-tax Act, 1961
NIL NIL NIL NIL NIL NIL
2 Stock Option NIL NIL NIL NIL NIL NIL 3 Sweat Equity NIL NIL NIL NIL NIL NIL 4 Commission NIL NIL NIL NIL NIL NIL
- as % of profit NIL NIL NIL NIL NIL NIL - others, specify… NIL NIL NIL NIL NIL NIL
5 Others, (PF Contribution) 0.48 0.48 0.48 NIL NIL 1.44 Total (A) 390.95 163.45 163.45 150.05 112.67 980.57
B. Remuneration to other Directors:(Amount ` in Lakhs)
S. no. Particulars of Remuneration name of Directorstotal
Amount Mr. tarun
SehgalMr. Jatinder
Singh SabharwalMrs. Madhu Bala nath
Mr. Jainul Haque
Mr. Virender Kumar Bajaj*
1 independent DirectorsFee for attending board committee meetings
1.60 3.20 2.30 2.30 2.20 11.60
CommissionOthers, please specifytotal (1) 1.60 3.20 2.30 2.30 2.20 11.60
2 Other non-Executive DirectorsFee for attending board committee meetings
- - - - - -
Commission - - - - - - Others, please specify
Total (2) - - - - - - Total (B)=(1+2) 1.60 3.20 2.30 2.30 2.20 11.60
Total Managerial Remuneration (A+B) 992.17
*Mr. Virender Kumar Bajaj ceased to be an Independent Director of the Company w.e.f. 14th January, 2018.
Annual Report 2017-18Statutory Reports
45
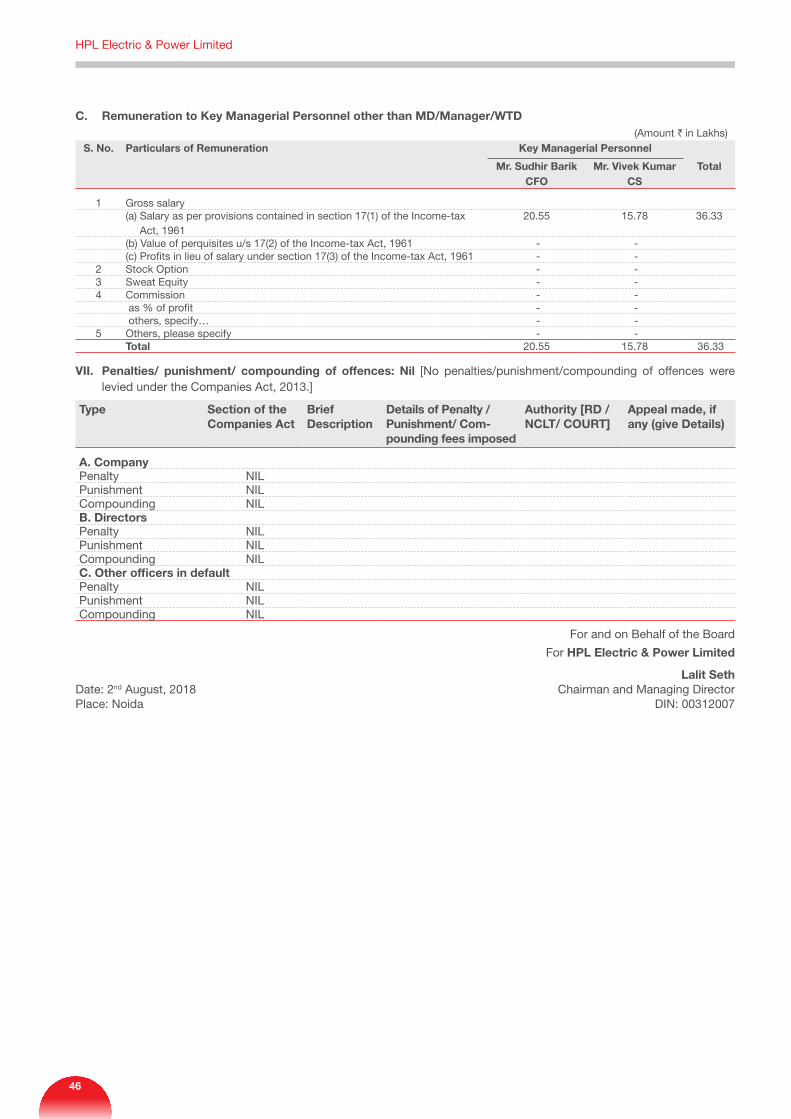
C. Remuneration to Key Managerial Personnel other than MD/Manager/WtD(Amount ` in Lakhs)
S. no. Particulars of Remuneration Key Managerial Personnel
Mr. Sudhir Barik Mr. Vivek Kumar totalCFO CS
1 Gross salary(a) Salary as per provisions contained in section 17(1) of the Income-tax
Act, 196120.55 15.78 36.33
(b) Value of perquisites u/s 17(2) of the Income-tax Act, 1961 - - (c) Profits in lieu of salary under section 17(3) of the Income-tax Act, 1961 - -
2 Stock Option - - 3 Sweat Equity - - 4 Commission - - as % of profit - - others, specify… - - 5 Others, please specify - - total 20.55 15.78 36.33
Vii. Penalties/ punishment/ compounding of offences: nil [No penalties/punishment/compounding of offences were levied under the Companies Act, 2013.]
type Section of the Companies Act
Brief Description
Details of Penalty / Punishment/ Com-pounding fees imposed
Authority [RD / nClt/ COURt]
Appeal made, if any (give Details)
A. CompanyPenalty NIL Punishment NIL Compounding NIL B. DirectorsPenalty NIL Punishment NIL Compounding NIL C. Other officers in defaultPenalty NIL Punishment NIL Compounding NIL
For and on Behalf of the Board
For HPl Electric & Power limited
lalit SethDate: 2nd August, 2018 Chairman and Managing DirectorPlace: Noida DIN: 00312007
HPL Electric & Power Limited
46
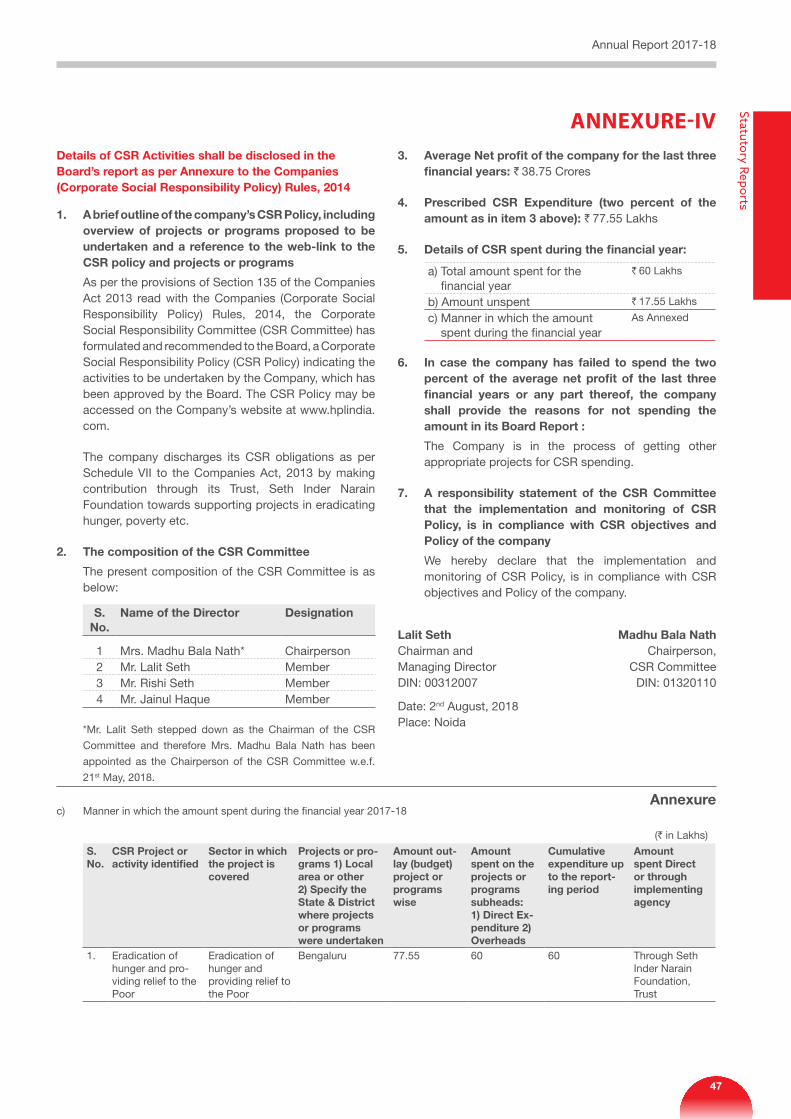
ANNEXURE-IV
Annexure
Details of CSR Activities shall be disclosed in the Board’s report as per Annexure to the Companies (Corporate Social Responsibility Policy) Rules, 2014
1. A brief outline of the company’s CSR Policy, including overview of projects or programs proposed to be undertaken and a reference to the web-link to the CSR policy and projects or programs
As per the provisions of Section 135 of the Companies Act 2013 read with the Companies (Corporate Social Responsibility Policy) Rules, 2014, the Corporate Social Responsibility Committee (CSR Committee) has formulated and recommended to the Board, a Corporate Social Responsibility Policy (CSR Policy) indicating the activities to be undertaken by the Company, which has been approved by the Board. The CSR Policy may be accessed on the Company’s website at www.hplindia.com.
The company discharges its CSR obligations as per Schedule VII to the Companies Act, 2013 by making contribution through its Trust, Seth Inder Narain Foundation towards supporting projects in eradicating hunger, poverty etc.
2. the composition of the CSR Committee
The present composition of the CSR Committee is as below:
S. no.
name of the Director Designation
1 Mrs. Madhu Bala Nath* Chairperson2 Mr. Lalit Seth Member3 Mr. Rishi Seth Member4 Mr. Jainul Haque Member
*Mr. Lalit Seth stepped down as the Chairman of the CSR
Committee and therefore Mrs. Madhu Bala Nath has been
appointed as the Chairperson of the CSR Committee w.e.f.
21st May, 2018.
3. Average net profit of the company for the last three financial years: ` 38.75 Crores
4. Prescribed CSR Expenditure (two percent of the amount as in item 3 above): ` 77.55 Lakhs
5. Details of CSR spent during the financial year:
a) Total amount spent for the financial year
` 60 Lakhs
b) Amount unspent ` 17.55 Lakhs
c) Manner in which the amount spent during the financial year
As Annexed
6. in case the company has failed to spend the two percent of the average net profit of the last three financial years or any part thereof, the company shall provide the reasons for not spending the amount in its Board Report :
The Company is in the process of getting other appropriate projects for CSR spending.
7. A responsibility statement of the CSR Committee that the implementation and monitoring of CSR Policy, is in compliance with CSR objectives and Policy of the company
We hereby declare that the implementation and monitoring of CSR Policy, is in compliance with CSR objectives and Policy of the company.
lalit Seth Madhu Bala nathChairman and Chairperson, Managing Director CSR CommitteeDIN: 00312007 DIN: 01320110
Date: 2nd August, 2018Place: Noida
c) Manner in which the amount spent during the financial year 2017-18
(` in Lakhs)
S. no.
CSR Project or activity identified
Sector in which the project is covered
Projects or pro-grams 1) local area or other2) Specify the State & District where projects or programs were undertaken
Amount out-lay (budget) project or programs wise
Amount spent on the projects or programs subheads:1) Direct Ex-penditure 2) Overheads
Cumulative expenditure up to the report-ing period
Amount spent Direct or through implementing agency
1. Eradication of hunger and pro-viding relief to the Poor
Eradication of hunger and providing relief to the Poor
Bengaluru 77.55 60 60 Through Seth Inder Narain Foundation, Trust
Annual Report 2017-18Statutory Reports
47
ANNEXURE-VFORM nO. AOC -2
(Pursuant to clause (h) of sub-section (3) of section 134 of the Act and Rule 8(2) of the Companies (Accounts) Rules, 2014
Form for Disclosure of particulars of contracts/ arrangements entered into by the company with related parties referred to in sub section (1) of section 188 of the Companies Act, 2013 including certain arms length transaction under third proviso thereto
1. Details of contracts or arrangements or transactions not at Arm’s length basis.
There were no contracts or arrangements or transactions entered into during the year ended 31st March, 2018, which were not at arm’s length basis.
(a) Name(s) of the related party and nature of relationship: N.A.
(b) Nature of contracts/ arrangements/ transactions: N.A.
(c) Duration of the contracts/ arrangements/ transactions: N.A.
(d) Salient terms of the contracts or arrangements or transactions including the value, if any: N.A.
(e) Justification for entering into such contracts or arrangements or transactions: N.A.
(f) Date(s) of approval by the Board: N.A.
(g) Amount paid as advances, if any: N.A.
(h) Date on which the special resolution was passed in general meeting as required under first proviso to section 188: N.A.
2. Details of material contracts or arrangement or transactions at arm’s length basis:
There were no material* contracts or arrangement or transactions at arm’s length basis for the year ended 31st March, 2018:
(*As defined under SEBI (Listing Obligations and Disclosure Requirements) Regulations, 2015 and adopted by the Board of Directors in the Related Party Transactions Policy of the Company, “Material Related Party Transaction” means a transaction with a related party if the transaction/ transactions to be entered into individually or taken together with previous transactions during a Financial Year, exceeds 10% of the annual consolidated turnover of the company as per the last audited financial statements of the company.)
(a) Name(s) of the related party and nature of relationship: N.A.
(b) Nature of contracts/ arrangements/ transactions: N.A.
(c) Duration of the contracts/ arrangements/ transactions: N.A
(d) Salient terms of the contracts or arrangements or transactions including the value, if any: N.A.
(e) Date(s) of approval by the Board, if any: N.A
(f) Amount paid as advances, if any: N.A.
For and on Behalf of the Board
For HPl Electric & Power limited
Mr. lalit SethDate: 2nd August, 2018 Chairman and Managing DirectorPlace: Noida DIN: 00312007
HPL Electric & Power Limited
48
ANNEXURE-VIFORM nO MR-3
SECREtARiAl AUDit REPORt
[Pursuant to section 204(1) of the Companies Act, 2013 and rule No.9 of the Companies (Appointment and Remuneration of Managerial Personnel) Rules, 2014]
FOR tHE FinAnCiAl YEAR EnDED 31st MARCH, 2018
To,
the MembersHPl Electric & Power limited1/20, Asaf Ali Road, new Delhi -110002
We have conducted the secretarial audit of the compliance of applicable statutory provisions and the adherence to good corporate practices by HPl Electric & Power limited (hereinafter called the “Company”). Secretarial Audit was conducted in a manner that provided us a reasonable basis for evaluating the corporate conducts/statutory compliances and expressing our opinion thereon.
Based on our verification of the Company’s books, papers, minute books, forms and returns filed and other records maintained by the Company and also the information provided by the Company, its officers, agents and authorized representatives during the conduct of secretarial audit and the representations made by the Company, we hereby report that in our opinion, the Company has, during the audit period covering the financial year ended on 31st March, 2018 generally complied with the statutory provisions listed hereunder and also that the Company has proper Board processes and compliance mechanism in place to the extent, in the manner and subject to the reporting made hereinafter:
We have examined the books, papers, minute books, forms and returns filed and other records made available to us and maintained by HPl Electric & Power limited for the financial year ended on 31st March, 2018 according to the provisions of:
i. The Companies Act, 2013 (the Act) and the rules made thereunder;
ii. The Securities Contracts (Regulation) Act, 1956 (‘SCRA’) and the rules made thereunder;
iii. The Depositories Act, 1996 and the Regulations and Bye-laws framed thereunder;
iv. Foreign Exchange Management Act, 1999 and the rules and regulations made thereunder to the extent of Foreign Direct Investment, Overseas Direct Investment and External Commercial Borrowings;
v. The following Regulations and Guidelines prescribed under the Securities and Exchange Board of India Act, 1992 (‘SEBI Act’): -
a) The Securities and Exchange Board of India (Substantial Acquisition of Shares and Takeovers) Regulations, 2011;
b) The Securities and Exchange Board of India (Prohibition of Insider Trading) Regulations, 1992;
c) The Securities and Exchange Board of India (Issue of Capital and Disclosure Requirements) Regulations, 2009;
d) The Securities and Exchange Board of India (Employee Stock Option Scheme and Employee Stock Purchase Scheme) Guidelines, 1999;
e) The Securities and Exchange Board of India (Issue and Listing of Debt Securities) Regulations, 2008;
f) The Securities and Exchange Board of India (Registrars to an Issue and Share Transfer Agents) Regulations, 1993 regarding the Companies Act and dealing with client;
g) The Securities and Exchange Board of India (Delisting of Equity Shares) Regulations, 2009;
h) The Securities and Exchange Board of India (Buyback of Securities) Regulations, 1998; and
i) The Securities and Exchange Board of India (Listing Obligations and Disclosure Requirements) Regulations, 2015.
vi. Other laws as are applicable to the Company as per representations made by the Company
a) Central Excise Act
b) Sales Tax Act / Vat Act
c) GST Act
d) The Finance Act
e) Income Tax Act
f) Labour Laws
g) Environmental Laws
We have also examined compliance with the applicable clauses of the following:
Annual Report 2017-18Statutory Reports
49
(i) Secretarial Standards issued by The Institute of Company Secretaries of India with respect to Board and General Meeting.
(ii) The Listing Agreement entered into by the Company with BSE Limited (BSE) and The National Stock Exchange of India Limited (NSE).
(iii) The Companies (Corporate Social Responsibility)Rules, 2014 along with Corporate Social Responsibility Voluntary Guidelines, 2009 issued by the Ministry of Corporate Affairs, Government of India;
Based on our examination and verification of the books, papers, minute books, forms and returns filed and other records produced to us and according to information and explanations given to us by the Company, we do report that the Company has in our opinion, complied with the provisions of the Companies Act, 2013 (Act) and the Rules made thereunder, the Memorandum and Articles of Association of the Company and the applicable provisions of the above mentioned laws, standards, guidelines, agreements, etc.
We report that, during the year under review:
1. The Status of the Company during the financial year has been that of a Listed Public Company, listed at the BSE Limited (BSE), The National Stock Exchange of India Limited (NSE).
2. The Board of Directors of the Company is duly constituted with proper balance of Executive Directors, Non-Executive Directors, Independent Directors and Woman Director.
3. Adequate notice is given to all directors to schedule the Board Meetings, agenda and detailed notes on agenda are sent at least seven days well in advance and a system exists for seeking and obtaining further information and clarifications on the agenda items before the meeting and for meaningful participation at the meeting.
4. Majority decision is carried through while the dissenting members’ views are captured and recorded as part of the minutes.
We further report that compliance of applicable financial laws including Direct and Indirect Tax laws by the Company have not been reviewed in this Audit since the same have been subject to review by the Statutory Financial Audit and other designated professionals.
We further report that (as represented by the Company and relied upon by us) there are adequate systems and processes in the company commensurate with the size and operations of the company to monitor and ensure compliance with applicable laws, rules, regulations and guidelines.
We further report that during the audit period no events occurred which had a major bearing on the Company’s affairs in pursuance of the above referred laws, rules, regulations, guidelines etc.
For AVA AssociatesCompany Secretaries
Date: 2nd August, 2018 CS Vinod Kumar gupta Place: Noida FCS: 3648; CP: 2148
Annexure-A
To,
the MembersHPl Electric & Power limited1/20, Asaf Ali Road, new Delhi -110002
Our report is to be read along with the following:
1. Maintenance of Secretarial records is the responsibility of the management of the Company. Our responsibility is to express an opinion on the secretarial records based on our audit.
2. We have followed the audit practices and processes as were appropriate to obtain responsible assurance about the correctness of the contents of secretarial records. The verification was done on test basis to ensure that correct facts are reflected in secretarial records. We believe that the processes and practices, we follow provide a responsible basis for our opinion.
3. We have not verified the correctness and appropriateness of financial records and books of accounts of the Company.
4. Wherever required, we have obtained the management representation about the compliance of laws, rules and regulations and happening of events, etc.
5. The compliance of the provision of corporate and other applicable laws, rules, regulations, standards is the responsibility of management. Our examination was limited to verification of procedures on test basis.
6. The secretarial audit report is neither an assurance as to the future viability of the Company nor the efficacy or effectiveness with which the management has conducted the affairs of the Company.
For AVA AssociatesCompany Secretaries
Date: 2nd August, 2018 CS Vinod Kumar gupta Place: Noida FCS: 3648; CP: 2148
Responsibility Statement
HPL Electric & Power Limited
50
ANNEXURE-VIIA. Details pursuant to the provisions of Section 197(12) of the Companies Act, 2013 read with Rule 5(1) of the
Companies (Appointment and Remuneration of Managerial Personnel) Rules, 2014:
1. Clause under Rule 5(1): (i), (ii)
name of Director/ KMP and Designation Ratio of remuneration ofeach Director/ to median
remuneration of employees
% increase inremuneration in the
FY 2017-18
1. Mr. Lalit Seth Chairman and Managing Director
87:1 NIL
2. Mr. Rishi Seth Joint Managing Director
36:1 NIL
3. Mr. Gautam Seth Joint Managing Director
36:1 NIL
4. Mr. Chandra Prakash Jain Whole Time Director
33:1 15.20
5. Mr. Vinod Ratan Gupta Whole Time Director
26:1 20
6. Mr. Sudhir Barik CFO
- NIL
8. Mr. Vivek Kumar Company Secretary
- 19
2. Clause under Rule 5(1): (iii), (iv), (viii) & (xii)
Clause underRule 5(1)
Prescribed Requirement Particulars
(iii) Percentage increase in the medianremuneration of employees in the financial year
13.11
(iv) Number of permanent employees on the rolls of Company
1383
(viii) Average percentile increase already made in the salaries of employees other than the managerial personnel in the last financial year and its comparison with the percentile increase in the managerial remuneration and justification thereof and point out if there are any exceptional circumstances for increase in the managerial remuneration
1. Average percentage increase in the salaries of employees other than managerial personnel – 10.57%
2. Average percentage increase in the salaries of managerial personnel – 17.60%
(xii) Affirmation that the remuneration is as perthe remuneration policy of the company
It is hereby affirmed that the remuneration paid to Directors, Key Managerial Personnel and other Employees is as per the Nomination and Remuneration Policy of the Company.
B. the information required pursuant to Section 197 of the Companies Act, 2013 read with Rule 5 (2) of the Companies (Appointment and Remuneration of Managerial Personnel) Rules, 2014 in respect of the top ten Employees
S. no.
name and Designation total gross Remuneration
(in Millions)
nature of Employment, whether contractual or otherwise
Qualifications Experience (in Years)
Date of commencement of employment in the
Company
Age(in Years)
last Employment held before joining the Company
1. Mr. Lalit Seth (Chairman and Managing Director)
39.09 Permanent Undergraduate 48 28.05.1992 72 N.A.
2. Mr. Rishi Seth (Joint Managing Director)
16.34 Permanent B.com, Master of Business Administration
23 14.04.2000 47 N.A.
Annual Report 2017-18Statutory Reports
51
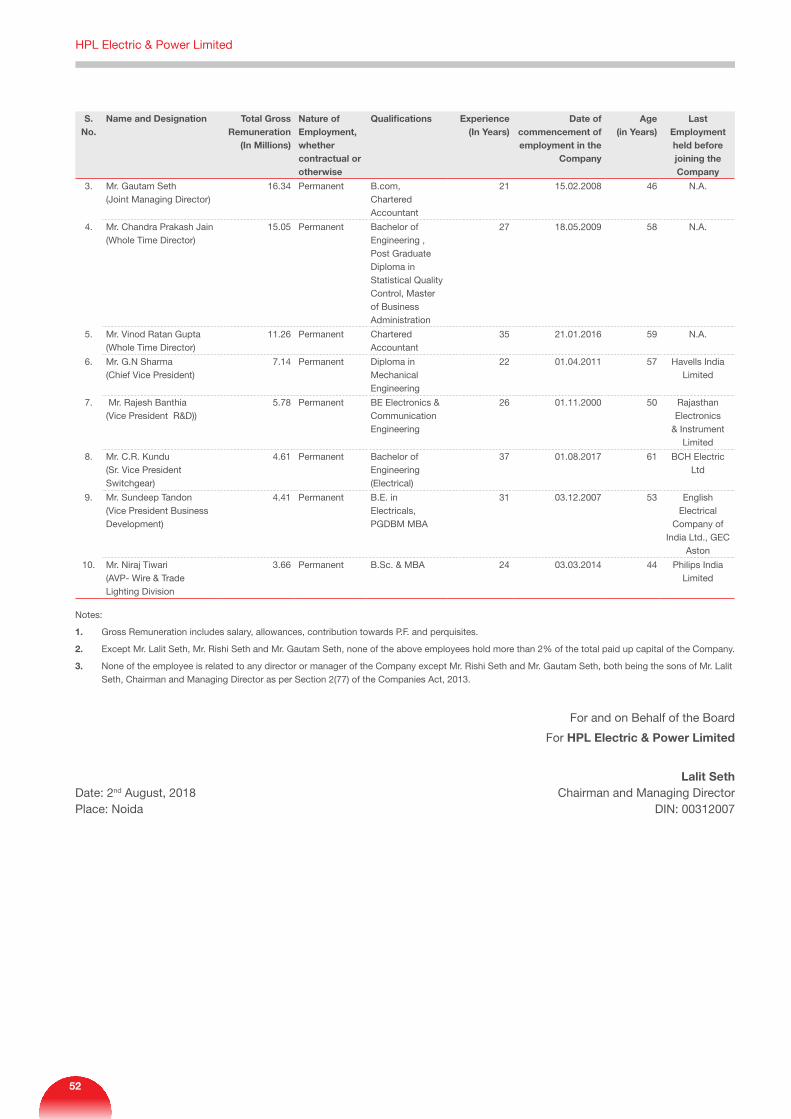
S. no.
name and Designation total gross Remuneration
(in Millions)
nature of Employment, whether contractual or otherwise
Qualifications Experience (in Years)
Date of commencement of employment in the
Company
Age(in Years)
last Employment held before joining the Company
3. Mr. Gautam Seth (Joint Managing Director)
16.34 Permanent B.com, Chartered Accountant
21 15.02.2008 46 N.A.
4. Mr. Chandra Prakash Jain (Whole Time Director)
15.05 Permanent Bachelor of Engineering , Post Graduate Diploma in Statistical Quality Control, Master of Business Administration
27 18.05.2009 58 N.A.
5. Mr. Vinod Ratan Gupta (Whole Time Director)
11.26 Permanent Chartered Accountant
35 21.01.2016 59 N.A.
6. Mr. G.N Sharma (Chief Vice President)
7.14 Permanent Diploma in Mechanical Engineering
22 01.04.2011 57 Havells India Limited
7. Mr. Rajesh Banthia (Vice President R&D))
5.78 Permanent BE Electronics & Communication Engineering
26 01.11.2000 50 Rajasthan Electronics
& Instrument Limited
8. Mr. C.R. Kundu (Sr. Vice President Switchgear)
4.61 Permanent Bachelor of Engineering (Electrical)
37 01.08.2017 61 BCH Electric Ltd
9. Mr. Sundeep Tandon (Vice President Business Development)
4.41 Permanent B.E. in Electricals, PGDBM MBA
31 03.12.2007 53 English Electrical
Company of India Ltd., GEC
Aston
10. Mr. Niraj Tiwari (AVP- Wire & Trade Lighting Division
3.66 Permanent B.Sc. & MBA 24 03.03.2014 44 Philips India Limited
Notes:
1. Gross Remuneration includes salary, allowances, contribution towards P.F. and perquisites.
2. Except Mr. Lalit Seth, Mr. Rishi Seth and Mr. Gautam Seth, none of the above employees hold more than 2% of the total paid up capital of the Company.
3. None of the employee is related to any director or manager of the Company except Mr. Rishi Seth and Mr. Gautam Seth, both being the sons of Mr. Lalit Seth, Chairman and Managing Director as per Section 2(77) of the Companies Act, 2013.
For and on Behalf of the Board
For HPl Electric & Power limited
lalit SethDate: 2nd August, 2018 Chairman and Managing DirectorPlace: Noida DIN: 00312007
HPL Electric & Power Limited
52
ANNEXURE-VIII
(A) Conservation of energy
(i) the steps taken or impact on conservation of energy and the steps taken by the company for utilising alternate sources of energy:
Energy Conservation measures taken
HPL group has been always focused for Energy conservation thereby reducing the effect of global warming. It has been our endeavor to adopt and implement new technologies to conserve energy and keep the environment green. The company has aligned its goal with the Indian government’s National plan on Energy conservation. In the last few decades we have seen alarming change in the climate conditions. As such, it has become the need of the hour to save energy as much as possible. The company has made a mandatory policy to use only energy efficient BEE star rated products in all the plants. It has taken several steps for conserving energy through various initiatives and is continuously working to improve energy conservation and utilization. Main focus has been to reduce the energy cost thereby minimizing the effect on the Environment. Innovative methods and various energy conservation measures have been implemented in all the plants and offices of HPL. Energy utilization cost of the company has come down in the last year compared to previous year’s record. The company has already ventured into Solar projects last year and has started implementation of use of solar energy for all the plants in different stages. This would be a great effort in reducing the carbon footprint thereby conserving energy for the social good. Special efforts have been put on some specific energy conservation projects, which have been mentioned below:
lighting:
Company has tried to reduce and optimize the lighting requirements in the plants through following initiatives:
a. For all lighting circuits, the Lighting load has been optimized.
b. Natural light is used in as many places as possible to save energy. To make this effective signage with “Switch OFF when NOT in USE” are used at various electrical points.
c. Conventional Light fittings have been replaced with LED Light fixtures at factory and office premises leading to savings in energy consumption.
d. All CFL lamps have been replaced with energy efficient LED lamps.
e. All T5 lamps have been replaced with LED tube light fittings in all the assembly sections & offices to conserve energy.
f. More than 80% of conventional light fittings have been replaced with LED lighting fitting in all the plants. Stage wise full plants will be converted to LED lighting.
Replacement of old equipment with new energy efficient equipment:
• Energy efficient AC VFDmotors & drives are inuse.
• All HPSV lights have been replaced with SolarLED lights along the compound walls of factories. These lights are fitted with dusk & dawn sensors to conserve energy.
• HigherlumenratedLEDlightinginuse.
• BEEstarratedAirconditioningunitsarebeinginuse.
• AllmoldingmachinesareconnectedwithUPStomaintain continuous running leading to increase in productivity.
• InsulatingheatersforInjectionmoldingmachinesare being used to conserve energy.
• Integral heating mechanism for ThermosetMoldings tools is in use to create better heating and improve product quality.
All the various energy conservation methods have resulted in
• Optimizingtheenergyconsumption
• Savingsoncostofproduction
• Reductionincarbonfootprint
• Reductioninprocessingtime
• Increaseinproductivity
• Increaseinoverallefficiency
Power factor is being monitored on regular basis continuously to maintain in the range of 0.97- 0.99 against the minimum required standard of 0.95 as per Govt. rules.
COnSERVAtiOn OF EnERgY, tECHnOlOgY ABSORPtiOn AnD FOREign EXCHAngE EARningS AnD OUtgO
Section 134 of the Companies Act, 2013 read with the Companies (Accounts) Rules, 2014
Annual Report 2017-18Statutory Reports
53
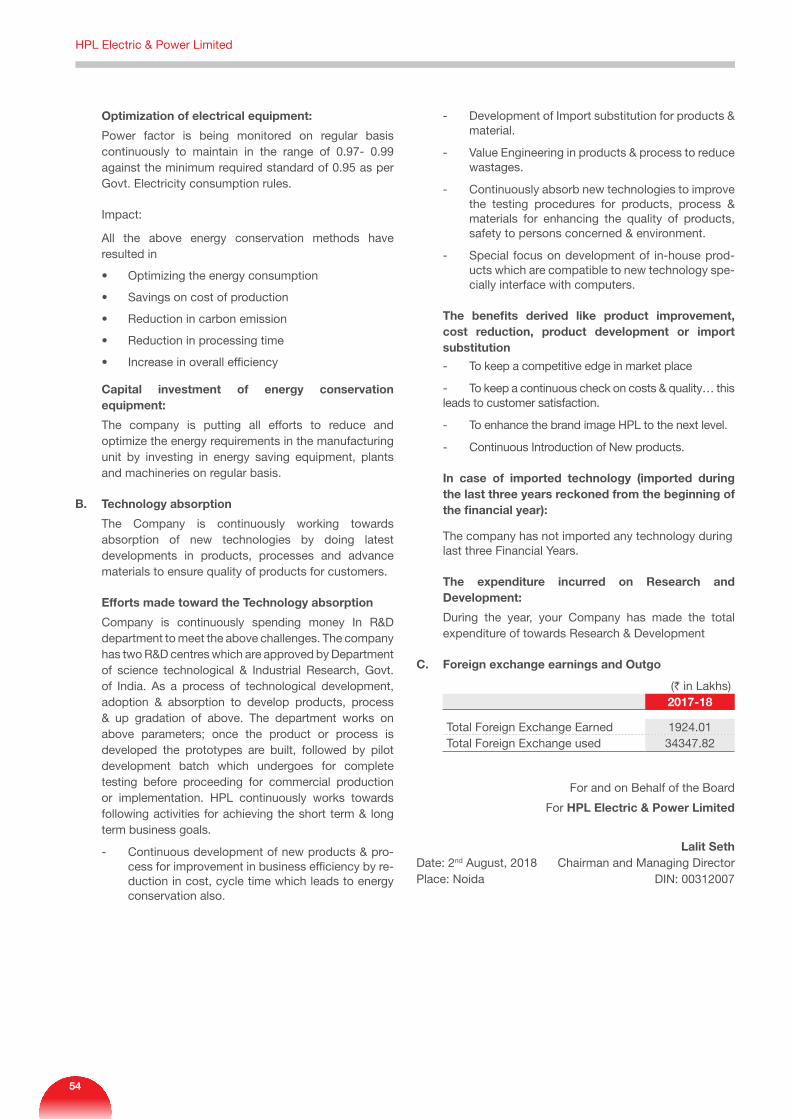
Optimization of electrical equipment:
Power factor is being monitored on regular basis continuously to maintain in the range of 0.97- 0.99 against the minimum required standard of 0.95 as per Govt. Electricity consumption rules.
Impact:
All the above energy conservation methods have resulted in
• Optimizingtheenergyconsumption
• Savingsoncostofproduction
• Reductionincarbonemission
• Reductioninprocessingtime
• Increaseinoverallefficiency
Capital investment of energy conservation equipment:
The company is putting all efforts to reduce and optimize the energy requirements in the manufacturing unit by investing in energy saving equipment, plants and machineries on regular basis.
B. technology absorption
The Company is continuously working towards absorption of new technologies by doing latest developments in products, processes and advance materials to ensure quality of products for customers.
Efforts made toward the technology absorption
Company is continuously spending money In R&D department to meet the above challenges. The company has two R&D centres which are approved by Department of science technological & Industrial Research, Govt. of India. As a process of technological development, adoption & absorption to develop products, process & up gradation of above. The department works on above parameters; once the product or process is developed the prototypes are built, followed by pilot development batch which undergoes for complete testing before proceeding for commercial production or implementation. HPL continuously works towards following activities for achieving the short term & long term business goals.
- Continuous development of new products & pro-cess for improvement in business efficiency by re-duction in cost, cycle time which leads to energy conservation also.
- Development of Import substitution for products & material.
- Value Engineering in products & process to reduce wastages.
- Continuously absorb new technologies to improve the testing procedures for products, process & materials for enhancing the quality of products, safety to persons concerned & environment.
- Special focus on development of in-house prod-ucts which are compatible to new technology spe-cially interface with computers.
the benefits derived like product improvement, cost reduction, product development or import substitution
- To keep a competitive edge in market place
- To keep a continuous check on costs & quality… this leads to customer satisfaction.
- To enhance the brand image HPL to the next level.
- Continuous Introduction of New products.
in case of imported technology (imported during the last three years reckoned from the beginning of the financial year):
The company has not imported any technology during last three Financial Years.
the expenditure incurred on Research and Development:
During the year, your Company has made the total expenditure of towards Research & Development
C. Foreign exchange earnings and Outgo
(` in Lakhs)2017-18
Total Foreign Exchange Earned 1924.01Total Foreign Exchange used 34347.82
For and on Behalf of the Board
For HPl Electric & Power limited
lalit SethDate: 2nd August, 2018 Chairman and Managing DirectorPlace: Noida DIN: 00312007
HPL Electric & Power Limited
54
1. COMPANY’S PHILOSOPHY ON CODE OF CORPORATE GOVERNANCE
Corporate Governance is essentially a system by which Companies are governed and controlled by the management under the direction and supervision of the Board in the best interest of all stakeholders. It is not mere compliance of laws, rules and regulations, but also the application of best management practices and adherence to the highest ethical principles in all its dealings, to achieve the objects of the Company, enhance stakeholder’s value and discharge its social responsibility. Above all, it is a way of life, rather than merely a legal compulsion.
The Company’s philosophy on the Code of Governance is based on the belief that effective Corporate Governance practices constitute a strong foundation on which successful commercial enterprises are built to last. Good Corporate Governance is indispensable to resilient and vibrant capital markets and is, therefore, an important instrument of investor protection. The Company lays great emphasis on a corporate culture of conscience, integrity, fairness, transparency, accountability and responsibility for efficient and ethical conduct of its business.
The Company is in compliance with the requirements stipulated under Regulations 17 to 27 read with Schedule V and clauses (b) to (i) of sub-regulation (2) of Regulation 46 of Securities and Exchange Board of India (Listing Obligations and Disclosure Requirements) Regulations, 2015 (“SEBI Listing Regulations”), as regard to Corporate Governance.
2. BOARD OF DIRECTORS
The Board of Directors is the apex body constituted by the shareholders for overseeing the Company’s overall functioning. The Board provides and evaluates the Company’s strategic direction, management policies and their effectiveness and ensures that the shareholders’ long term interests are being served.
The Board of the Company consists of eminent persons with wide knowledge and experience in technical, commercial, finance, business administration and other related fields, who not only bring wide range of
Corporate Governance Report
expertise, but also impart desired level of independence to the Board.
2.1 Composition of the Board of Directors
The Board of Directors of HPL Electric & Power Limited (the ‘Company’) oversees the conduct of business activities by management and serves to ensure the implementation of management policies in an effective and efficient manner.
As on 31st March, 2018, the Board of Directors comprised of nine directors including one woman director, of which five (i.e., 55%) are executive directors and Four (i.e., 45%) are independent directors. Mr. Virender Kumar Bajaj ceased to be an Independent Director w.e.f. 14th January, 2018. However, the company has appointed Mr. Hargovind Sachdev as an Independent Director w.e.f 13th April, 2018 within the time as prescribed under Regulation 25(6) of the SEBI Listing Regulations and thereafter the Board Composition is in conformity with Regulation 17 of SEBI Listing Regulations and Section 149 of the Companies Act, 2013.
Independent Directors are non- executive directors and have confirmed that they meet the criteria of Independence as mentioned under Regulation 16(1)(b) of the SEBI listing Regulations and Section 149(6) of the Act.
None of the Directors on the board hold directorships in more than ten public Companies and None of the directors on the board is a member of more than 10 committees or act as chairman of more than 5 committees across all the listed companies in which he is a director. Necessary disclosures regarding committee positions in the other public limited companies as on 31st March, 2018 have been made by all the directors.
2.2. Meetings and Attendance of Directors
During the financial year 2017-18, Four Board Meetings were held on 22nd May, 2017, 14th August, 2017, 14th November, 2017 and 12th February, 2018. The maximum interval between the two Board Meetings did not exceed 120 days as prescribed under the Act and Regulation 17 (2) of the SEBI Listing Regulations.
Annual Report 2017-18S
tatutory Rep
orts
55
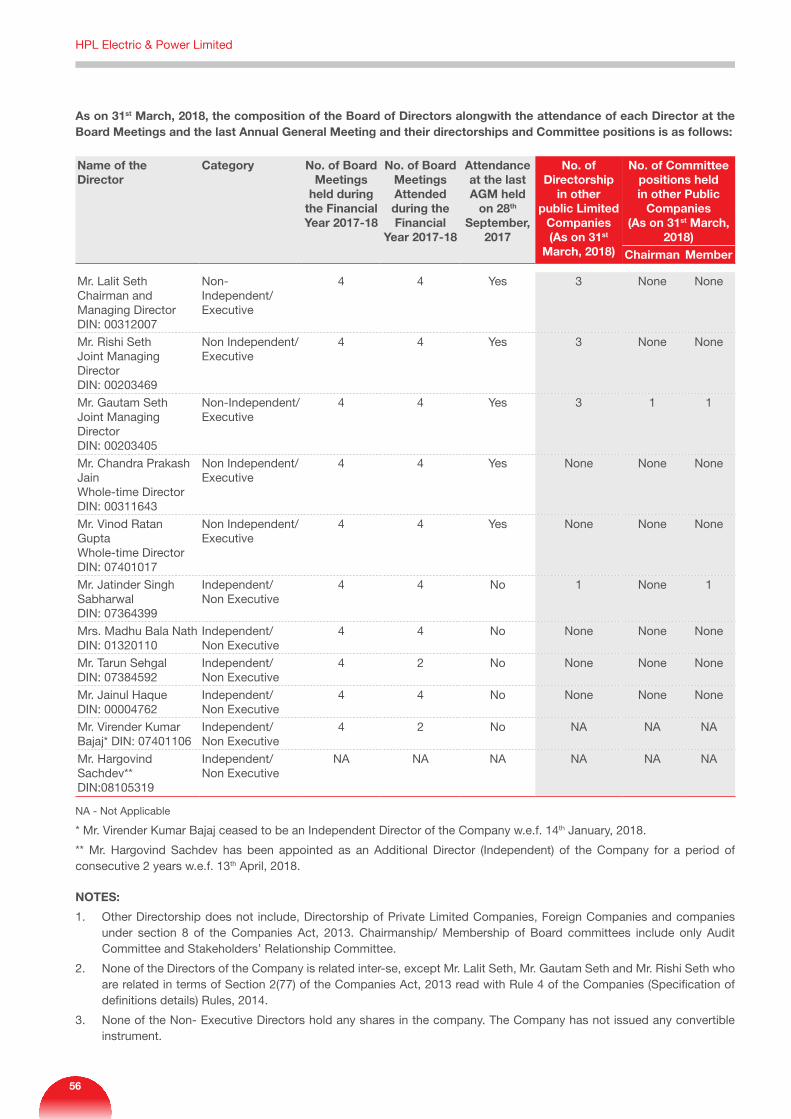
As on 31st March, 2018, the composition of the Board of Directors alongwith the attendance of each Director at the Board Meetings and the last Annual General Meeting and their directorships and Committee positions is as follows:
Name of the Director
Category No. of Board Meetings
held during the Financial Year 2017-18
No. of Board Meetings Attended during the Financial
Year 2017-18
Attendance at the last AGM held
on 28th September,
2017
No. of Directorship
in other public Limited
Companies(As on 31st
March, 2018)
No. of Committee positions held in other Public
Companies(As on 31st March,
2018)Chairman Member
Mr. Lalit SethChairman and Managing DirectorDIN: 00312007
Non- Independent/ Executive
4 4 Yes 3 None None
Mr. Rishi SethJoint Managing DirectorDIN: 00203469
Non Independent/ Executive
4 4 Yes 3 None None
Mr. Gautam SethJoint Managing DirectorDIN: 00203405
Non-Independent/ Executive
4 4 Yes 3 1 1
Mr. Chandra Prakash Jain Whole-time Director DIN: 00311643
Non Independent/ Executive
4 4 Yes None None None
Mr. Vinod Ratan Gupta Whole-time Director DIN: 07401017
Non Independent/ Executive
4 4 Yes None None None
Mr. Jatinder Singh Sabharwal DIN: 07364399
Independent/ Non Executive
4 4 No 1 None 1
Mrs. Madhu Bala NathDIN: 01320110
Independent/ Non Executive
4 4 No None None None
Mr. Tarun Sehgal DIN: 07384592
Independent/ Non Executive
4 2 No None None None
Mr. Jainul Haque DIN: 00004762
Independent/ Non Executive
4 4 No None None None
Mr. Virender Kumar Bajaj* DIN: 07401106
Independent/ Non Executive
4 2 No NA NA NA
Mr. Hargovind Sachdev**DIN:08105319
Independent/ Non Executive
NA NA NA NA NA NA
NA - Not Applicable
* Mr. Virender Kumar Bajaj ceased to be an Independent Director of the Company w.e.f. 14th January, 2018.
** Mr. Hargovind Sachdev has been appointed as an Additional Director (Independent) of the Company for a period of consecutive 2 years w.e.f. 13th April, 2018.
NOTES:
1. Other Directorship does not include, Directorship of Private Limited Companies, Foreign Companies and companies under section 8 of the Companies Act, 2013. Chairmanship/ Membership of Board committees include only Audit Committee and Stakeholders’ Relationship Committee.
2. None of the Directors of the Company is related inter-se, except Mr. Lalit Seth, Mr. Gautam Seth and Mr. Rishi Seth who are related in terms of Section 2(77) of the Companies Act, 2013 read with Rule 4 of the Companies (Specification of definitions details) Rules, 2014.
3. None of the Non- Executive Directors hold any shares in the company. The Company has not issued any convertible instrument.
HPL Electric & Power Limited
56
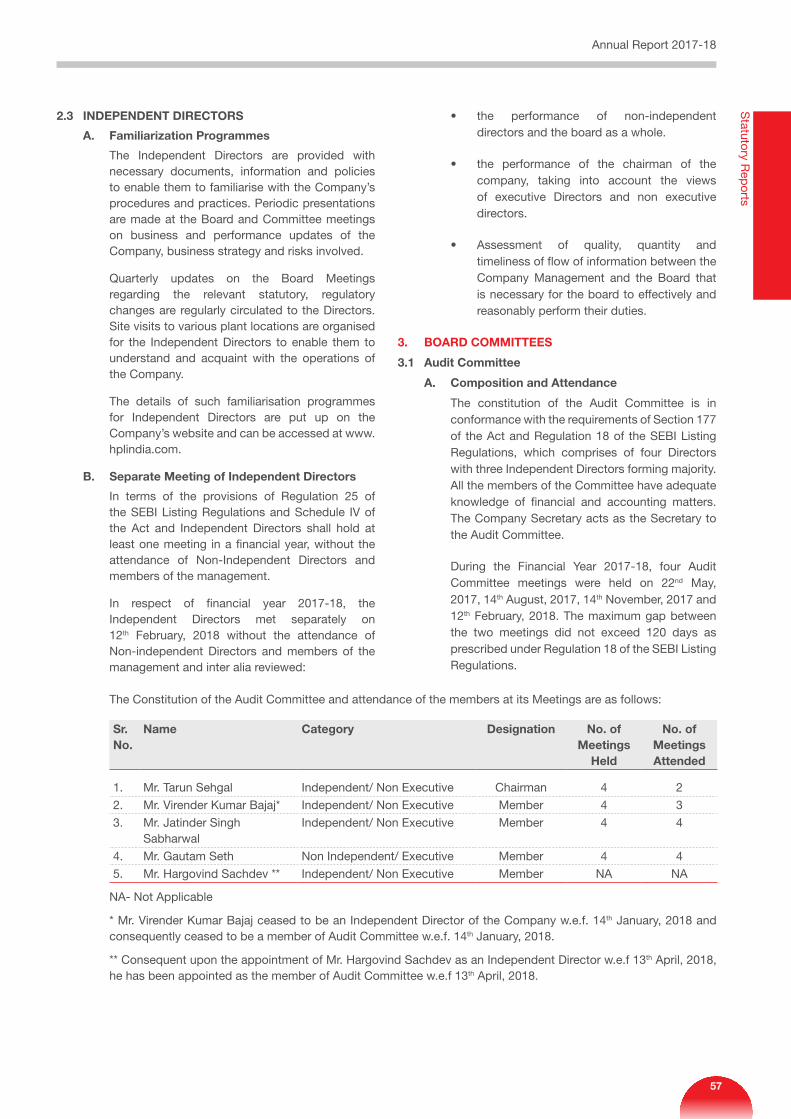
2.3 INDEPENDENT DIRECTORS
A. Familiarization Programmes
The Independent Directors are provided with necessary documents, information and policies to enable them to familiarise with the Company’s procedures and practices. Periodic presentations are made at the Board and Committee meetings on business and performance updates of the Company, business strategy and risks involved.
Quarterly updates on the Board Meetings regarding the relevant statutory, regulatory changes are regularly circulated to the Directors. Site visits to various plant locations are organised for the Independent Directors to enable them to understand and acquaint with the operations of the Company.
The details of such familiarisation programmes for Independent Directors are put up on the Company’s website and can be accessed at www.hplindia.com.
B. Separate Meeting of Independent Directors
In terms of the provisions of Regulation 25 of the SEBI Listing Regulations and Schedule IV of the Act and Independent Directors shall hold at least one meeting in a financial year, without the attendance of Non-Independent Directors and members of the management.
In respect of financial year 2017-18, the Independent Directors met separately on 12th February, 2018 without the attendance of Non-independent Directors and members of the management and inter alia reviewed:
• the performance of non-independentdirectors and the board as a whole.
• the performance of the chairman of thecompany, taking into account the views of executive Directors and non executive directors.
• Assessment of quality, quantity andtimeliness of flow of information between the Company Management and the Board that is necessary for the board to effectively and reasonably perform their duties.
3. BOARD COMMITTEES
3.1 Audit Committee
A. Composition and Attendance
The constitution of the Audit Committee is in conformance with the requirements of Section 177 of the Act and Regulation 18 of the SEBI Listing Regulations, which comprises of four Directors with three Independent Directors forming majority. All the members of the Committee have adequate knowledge of financial and accounting matters. The Company Secretary acts as the Secretary to the Audit Committee.
During the Financial Year 2017-18, four Audit Committee meetings were held on 22nd May, 2017, 14th August, 2017, 14th November, 2017 and 12th February, 2018. The maximum gap between the two meetings did not exceed 120 days as prescribed under Regulation 18 of the SEBI Listing Regulations.
The Constitution of the Audit Committee and attendance of the members at its Meetings are as follows:
Sr. No.
Name Category Designation No. of Meetings
Held
No. of Meetings Attended
1. Mr. Tarun Sehgal Independent/ Non Executive Chairman 4 2
2. Mr. Virender Kumar Bajaj* Independent/ Non Executive Member 4 3
3. Mr. Jatinder Singh Sabharwal
Independent/ Non Executive Member 4 4
4. Mr. Gautam Seth Non Independent/ Executive Member 4 4
5. Mr. Hargovind Sachdev ** Independent/ Non Executive Member NA NA
NA- Not Applicable
* Mr. Virender Kumar Bajaj ceased to be an Independent Director of the Company w.e.f. 14th January, 2018 and consequently ceased to be a member of Audit Committee w.e.f. 14th January, 2018.
** Consequent upon the appointment of Mr. Hargovind Sachdev as an Independent Director w.e.f 13th April, 2018, he has been appointed as the member of Audit Committee w.e.f 13th April, 2018.
Annual Report 2017-18S
tatutory Rep
orts
57
B. Terms of Reference
The terms of reference of Audit Committee are broadly as under:
I. Oversight of our Company’s financial reporting process and the disclosure of its financial information to ensure that the financial statement is correct, sufficient and credible;
II. Recommendation for appointment, remuneration and terms of appointment of auditors of our Company;
III. Approval of payment to statutory auditors for any other services rendered by the statutory auditors;
IV. Reviewing, with the management, the annual financial statements and auditors’ report thereon before submission to the board for approval, with particular reference to:
a) Matters required to be included in the Director’s Responsibility Statement to be included in our Board’s report in terms of clause (c) of sub-section 3 of section 134 of the Act.
b) Changes, if any, in accounting policies and practices and reasons for the same.
c) Major accounting entries involving estimates based on the exercise of judgment by management.
d) Significant adjustments made in the financial statements arising out of audit findings.
e) Compliance with listing and other legal requirements relating to financial statements.
f) Disclosure of any related party transactions; and
g) Modified opinion(s)in the draft audit report.
V. Reviewing, with the management, the quarterly financial statements before submission to our Board for approval;
VI. Reviewing, with the management, the statement of uses / application of funds raised through an issue (public issue, rights issue, preferential issue, etc.), the statement of funds utilized for purposes other than those stated in the offer document / prospectus / notice and the report submitted by the monitoring agency monitoring the utilization of proceeds of a public or rights issue, and making appropriate recommendations to the Board to take up steps in this matter;
VII. Reviewing and monitoring the auditor’s independence and performance, and effectiveness of audit process;
VIII. Approval or any subsequent modification of transactions of the Company with related parties;
IX. Scrutiny of inter-corporate loans and investments;
X. Valuation of undertakings or assets of the Company, wherever it is necessary;
XI. Evaluation of internal financial controls and risk management systems;
XII. Reviewing, with the management, performance of statutory and internal auditors, adequacy of the internal control systems;
XIII. Reviewing the adequacy of internal audit function, if any, including the structure of the internal audit department, staffing and seniority of the official heading the department, reporting structure coverage and frequency of internal audit;
XIV. Discussion with internal auditors of any significant findings and follow up thereon;
XV. Reviewing the findings of any internal investigations by the internal auditors into matters where there is suspected fraud or irregularity or a failure of internal control systems of a material nature and reporting the matter to the Board;
XVI. Discussion with statutory auditors before the audit commences, about the nature and scope of audit as well as post-audit discussion to ascertain any area of concern;
XVII. To look into the reasons for substantial defaults in the payment to depositors, debenture holders, shareholders (in case of non-payment of declared dividends) and creditors;
XVIII. To review the functioning of the whistle blower mechanism;
XIX. Approval of appointment of Chief Financial Officer after assessing the qualifications, experience and background, etc. of the candidate;
XX. Carrying out any other function as is mentioned in the terms of reference of the Audit Committee.
XXI. Mandatorily review the following information:
• Management discussion and analysis offinancial condition and results of operations;
HPL Electric & Power Limited
58
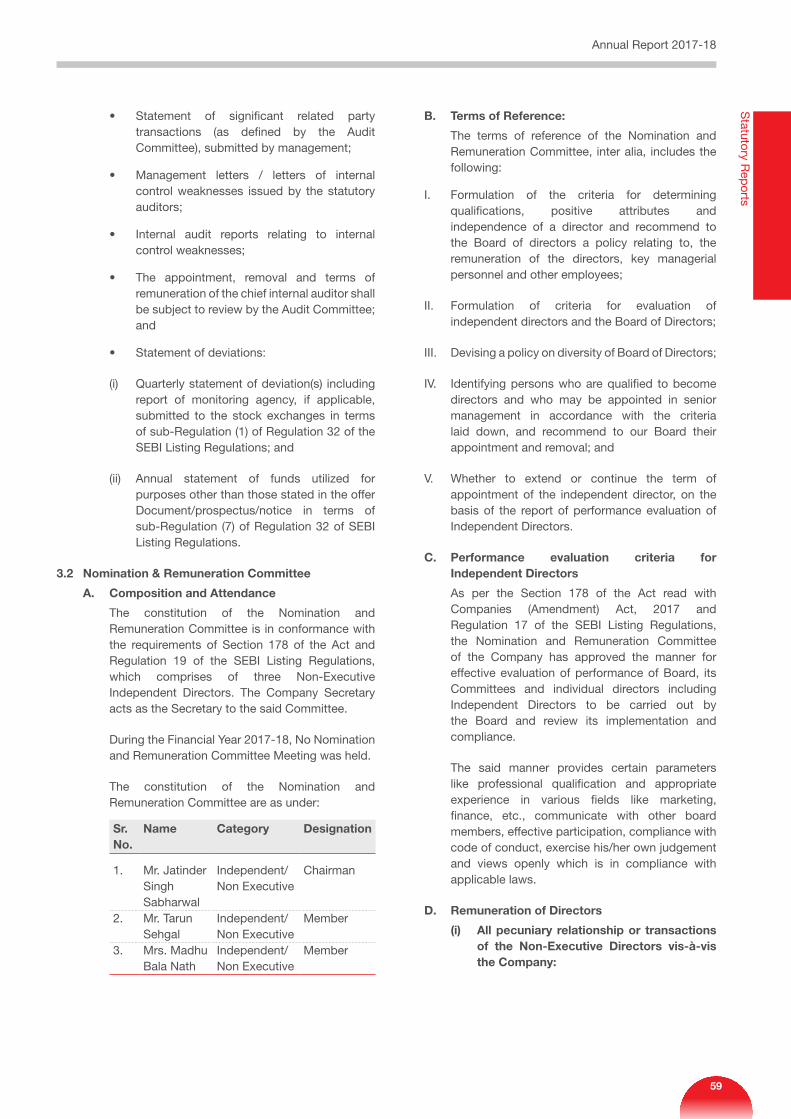
• Statement of significant related partytransactions (as defined by the Audit Committee), submitted by management;
• Management letters / letters of internalcontrol weaknesses issued by the statutory auditors;
• Internal audit reports relating to internalcontrol weaknesses;
• The appointment, removal and terms ofremuneration of the chief internal auditor shall be subject to review by the Audit Committee; and
• Statementofdeviations:
(i) Quarterly statement of deviation(s) including report of monitoring agency, if applicable, submitted to the stock exchanges in terms of sub-Regulation (1) of Regulation 32 of the SEBI Listing Regulations; and
(ii) Annual statement of funds utilized for purposes other than those stated in the offer Document/prospectus/notice in terms of sub-Regulation (7) of Regulation 32 of SEBI Listing Regulations.
3.2 Nomination & Remuneration Committee
A. Composition and Attendance
The constitution of the Nomination and Remuneration Committee is in conformance with the requirements of Section 178 of the Act and Regulation 19 of the SEBI Listing Regulations, which comprises of three Non-Executive Independent Directors. The Company Secretary acts as the Secretary to the said Committee.
During the Financial Year 2017-18, No Nomination and Remuneration Committee Meeting was held.
The constitution of the Nomination and Remuneration Committee are as under:
Sr. No.
Name Category Designation
1. Mr. Jatinder Singh Sabharwal
Independent/ Non Executive
Chairman
2. Mr. Tarun Sehgal
Independent/ Non Executive
Member
3. Mrs. Madhu Bala Nath
Independent/ Non Executive
Member
B. Terms of Reference:
The terms of reference of the Nomination and Remuneration Committee, inter alia, includes the following:
I. Formulation of the criteria for determining qualifications, positive attributes and independence of a director and recommend to the Board of directors a policy relating to, the remuneration of the directors, key managerial personnel and other employees;
II. Formulation of criteria for evaluation of independent directors and the Board of Directors;
III. Devising a policy on diversity of Board of Directors;
IV. Identifying persons who are qualified to become directors and who may be appointed in senior management in accordance with the criteria laid down, and recommend to our Board their appointment and removal; and
V. Whether to extend or continue the term of appointment of the independent director, on the basis of the report of performance evaluation of Independent Directors.
C. Performance evaluation criteria for Independent Directors
As per the Section 178 of the Act read with Companies (Amendment) Act, 2017 and Regulation 17 of the SEBI Listing Regulations, the Nomination and Remuneration Committee of the Company has approved the manner for effective evaluation of performance of Board, its Committees and individual directors including Independent Directors to be carried out by the Board and review its implementation and compliance.
The said manner provides certain parameters like professional qualification and appropriate experience in various fields like marketing, finance, etc., communicate with other board members, effective participation, compliance with code of conduct, exercise his/her own judgement and views openly which is in compliance with applicable laws.
D. Remuneration of Directors
(i) All pecuniary relationship or transactions of the Non-Executive Directors vis-à-vis the Company:
Annual Report 2017-18S
tatutory Rep
orts
59
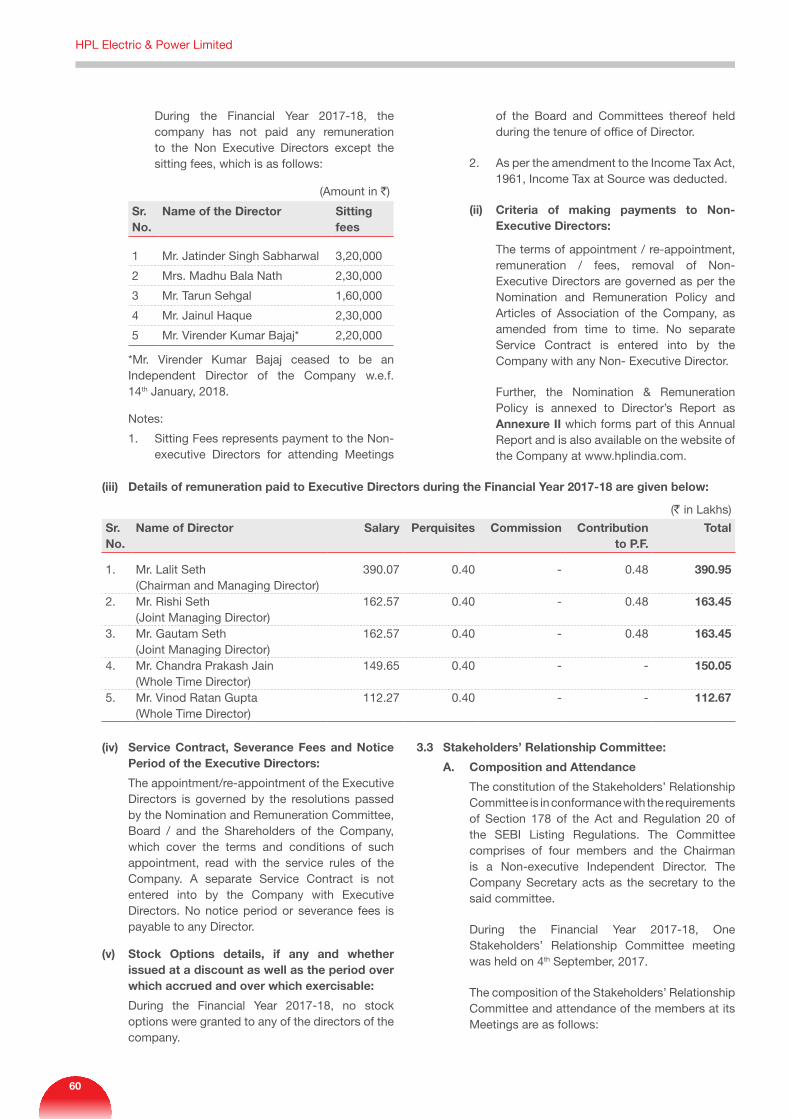
During the Financial Year 2017-18, the company has not paid any remuneration to the Non Executive Directors except the sitting fees, which is as follows:
(Amount in `)
Sr. No.
Name of the Director Sitting fees
1 Mr. Jatinder Singh Sabharwal 3,20,000
2 Mrs. Madhu Bala Nath 2,30,000
3 Mr. Tarun Sehgal 1,60,000
4 Mr. Jainul Haque 2,30,000
5 Mr. Virender Kumar Bajaj* 2,20,000
*Mr. Virender Kumar Bajaj ceased to be an Independent Director of the Company w.e.f. 14th January, 2018.
Notes:
1. Sitting Fees represents payment to the Non-executive Directors for attending Meetings
of the Board and Committees thereof held during the tenure of office of Director.
2. As per the amendment to the Income Tax Act, 1961, Income Tax at Source was deducted.
(ii) Criteria of making payments to Non-Executive Directors:
The terms of appointment / re-appointment, remuneration / fees, removal of Non-Executive Directors are governed as per the Nomination and Remuneration Policy and Articles of Association of the Company, as amended from time to time. No separate Service Contract is entered into by the Company with any Non- Executive Director.
Further, the Nomination & Remuneration Policy is annexed to Director’s Report as Annexure II which forms part of this Annual Report and is also available on the website of the Company at www.hplindia.com.
(iii) Details of remuneration paid to Executive Directors during the Financial Year 2017-18 are given below:
(` in Lakhs)
Sr. No.
Name of Director Salary Perquisites Commission Contribution to P.F.
Total
1. Mr. Lalit Seth(Chairman and Managing Director)
390.07 0.40 - 0.48 390.95
2. Mr. Rishi Seth(Joint Managing Director)
162.57 0.40 - 0.48 163.45
3. Mr. Gautam Seth(Joint Managing Director)
162.57 0.40 - 0.48 163.45
4. Mr. Chandra Prakash Jain(Whole Time Director)
149.65 0.40 - - 150.05
5. Mr. Vinod Ratan Gupta(Whole Time Director)
112.27 0.40 - - 112.67
(iv) Service Contract, Severance Fees and Notice Period of the Executive Directors:
The appointment/re-appointment of the Executive Directors is governed by the resolutions passed by the Nomination and Remuneration Committee, Board / and the Shareholders of the Company, which cover the terms and conditions of such appointment, read with the service rules of the Company. A separate Service Contract is not entered into by the Company with Executive Directors. No notice period or severance fees is payable to any Director.
(v) Stock Options details, if any and whether issued at a discount as well as the period over which accrued and over which exercisable:
During the Financial Year 2017-18, no stock options were granted to any of the directors of the company.
3.3 Stakeholders’ Relationship Committee:
A. Composition and Attendance
The constitution of the Stakeholders’ Relationship Committee is in conformance with the requirements of Section 178 of the Act and Regulation 20 of the SEBI Listing Regulations. The Committee comprises of four members and the Chairman is a Non-executive Independent Director. The Company Secretary acts as the secretary to the said committee.
During the Financial Year 2017-18, One Stakeholders’ Relationship Committee meeting was held on 4th September, 2017.
The composition of the Stakeholders’ Relationship Committee and attendance of the members at its Meetings are as follows:
HPL Electric & Power Limited
60
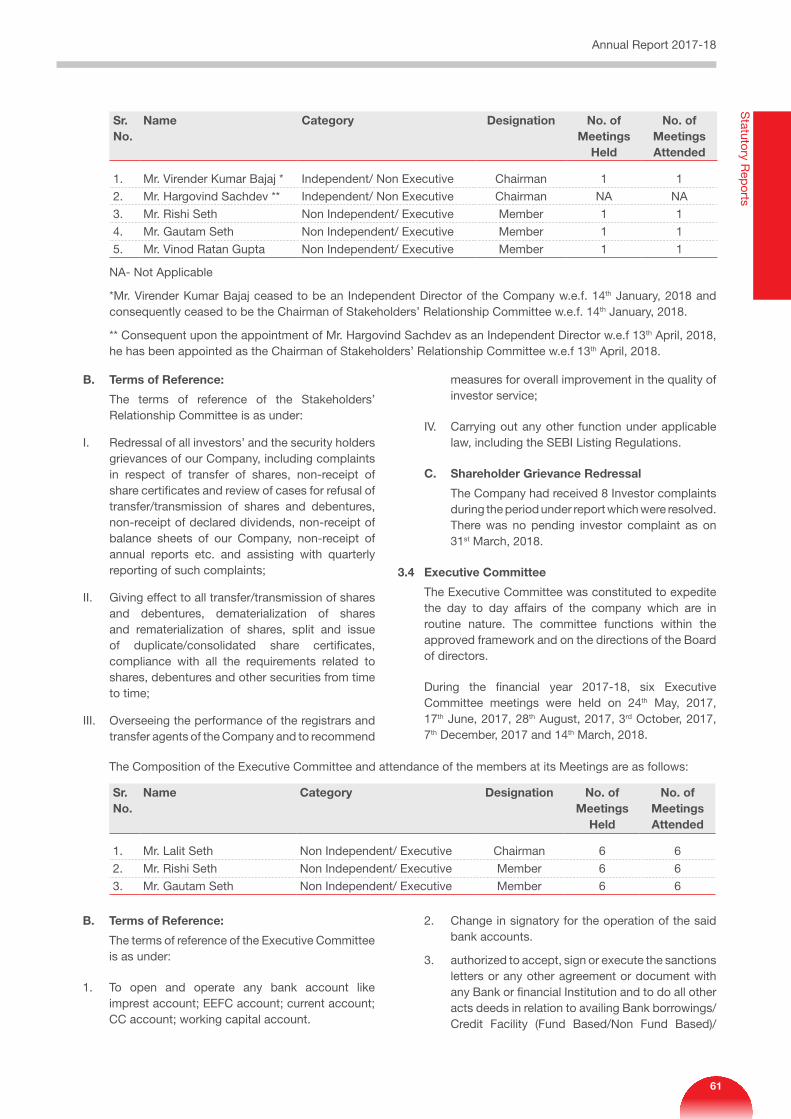
Sr. No.
Name Category Designation No. of Meetings
Held
No. of Meetings Attended
1. Mr. Virender Kumar Bajaj * Independent/ Non Executive Chairman 1 1
2. Mr. Hargovind Sachdev ** Independent/ Non Executive Chairman NA NA
3. Mr. Rishi Seth Non Independent/ Executive Member 1 1
4. Mr. Gautam Seth Non Independent/ Executive Member 1 1
5. Mr. Vinod Ratan Gupta Non Independent/ Executive Member 1 1
NA- Not Applicable
*Mr. Virender Kumar Bajaj ceased to be an Independent Director of the Company w.e.f. 14th January, 2018 and consequently ceased to be the Chairman of Stakeholders’ Relationship Committee w.e.f. 14th January, 2018.
** Consequent upon the appointment of Mr. Hargovind Sachdev as an Independent Director w.e.f 13th April, 2018, he has been appointed as the Chairman of Stakeholders’ Relationship Committee w.e.f 13th April, 2018.
B. Terms of Reference:
The terms of reference of the Stakeholders’ Relationship Committee is as under:
I. Redressal of all investors’ and the security holders grievances of our Company, including complaints in respect of transfer of shares, non-receipt of share certificates and review of cases for refusal of transfer/transmission of shares and debentures, non-receipt of declared dividends, non-receipt of balance sheets of our Company, non-receipt of annual reports etc. and assisting with quarterly reporting of such complaints;
II. Giving effect to all transfer/transmission of shares and debentures, dematerialization of shares and rematerialization of shares, split and issue of duplicate/consolidated share certificates, compliance with all the requirements related to shares, debentures and other securities from time to time;
III. Overseeing the performance of the registrars and transfer agents of the Company and to recommend
measures for overall improvement in the quality of investor service;
IV. Carrying out any other function under applicable law, including the SEBI Listing Regulations.
C. Shareholder Grievance Redressal
The Company had received 8 Investor complaints during the period under report which were resolved. There was no pending investor complaint as on 31st March, 2018.
3.4 Executive Committee
The Executive Committee was constituted to expedite the day to day affairs of the company which are in routine nature. The committee functions within the approved framework and on the directions of the Board of directors.
During the financial year 2017-18, six Executive Committee meetings were held on 24th May, 2017, 17th June, 2017, 28th August, 2017, 3rd October, 2017, 7th December, 2017 and 14th March, 2018.
The Composition of the Executive Committee and attendance of the members at its Meetings are as follows:
Sr. No.
Name Category Designation No. of Meetings
Held
No. of Meetings Attended
1. Mr. Lalit Seth Non Independent/ Executive Chairman 6 6
2. Mr. Rishi Seth Non Independent/ Executive Member 6 6
3. Mr. Gautam Seth Non Independent/ Executive Member 6 6
B. Terms of Reference:
The terms of reference of the Executive Committee is as under:
1. To open and operate any bank account like imprest account; EEFC account; current account; CC account; working capital account.
2. Change in signatory for the operation of the said bank accounts.
3. authorized to accept, sign or execute the sanctions letters or any other agreement or document with any Bank or financial Institution and to do all other acts deeds in relation to availing Bank borrowings/Credit Facility (Fund Based/Non Fund Based)/
Annual Report 2017-18S
tatutory Rep
orts
61
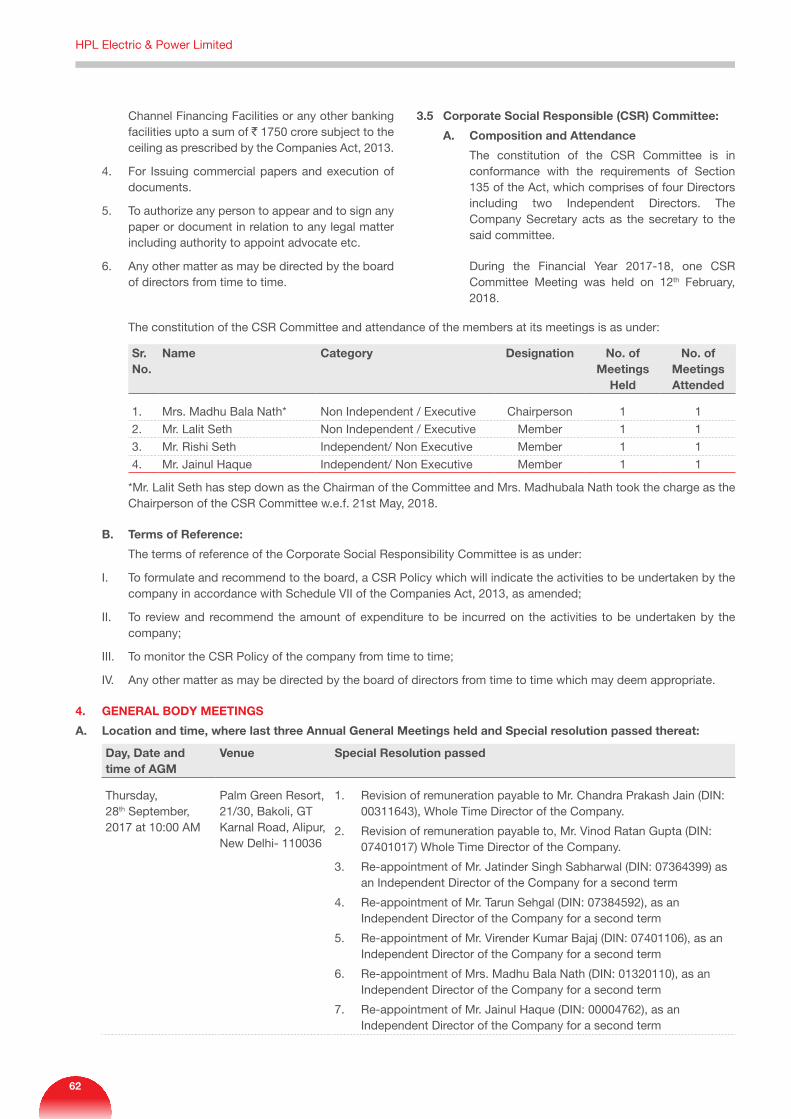
Channel Financing Facilities or any other banking facilities upto a sum of ` 1750 crore subject to the ceiling as prescribed by the Companies Act, 2013.
4. For Issuing commercial papers and execution of documents.
5. To authorize any person to appear and to sign any paper or document in relation to any legal matter including authority to appoint advocate etc.
6. Any other matter as may be directed by the board of directors from time to time.
3.5 Corporate Social Responsible (CSR) Committee:
A. Composition and Attendance
The constitution of the CSR Committee is in conformance with the requirements of Section 135 of the Act, which comprises of four Directors including two Independent Directors. The Company Secretary acts as the secretary to the said committee.
During the Financial Year 2017-18, one CSR Committee Meeting was held on 12th February, 2018.
The constitution of the CSR Committee and attendance of the members at its meetings is as under:
Sr. No.
Name Category Designation No. of Meetings
Held
No. of Meetings Attended
1. Mrs. Madhu Bala Nath* Non Independent / Executive Chairperson 1 1
2. Mr. Lalit Seth Non Independent / Executive Member 1 1
3. Mr. Rishi Seth Independent/ Non Executive Member 1 1
4. Mr. Jainul Haque Independent/ Non Executive Member 1 1
*Mr. Lalit Seth has step down as the Chairman of the Committee and Mrs. Madhubala Nath took the charge as the Chairperson of the CSR Committee w.e.f. 21st May, 2018.
B. Terms of Reference:
The terms of reference of the Corporate Social Responsibility Committee is as under:
I. To formulate and recommend to the board, a CSR Policy which will indicate the activities to be undertaken by the company in accordance with Schedule VII of the Companies Act, 2013, as amended;
II. To review and recommend the amount of expenditure to be incurred on the activities to be undertaken by the company;
III. To monitor the CSR Policy of the company from time to time;
IV. Any other matter as may be directed by the board of directors from time to time which may deem appropriate.
4. GENERAL BODY MEETINGS
A. Location and time, where last three Annual General Meetings held and Special resolution passed thereat:
Day, Date and time of AGM
Venue Special Resolution passed
Thursday, 28th September, 2017 at 10:00 AM
Palm Green Resort, 21/30, Bakoli, GT Karnal Road, Alipur, New Delhi- 110036
1. Revision of remuneration payable to Mr. Chandra Prakash Jain (DIN: 00311643), Whole Time Director of the Company.
2. Revision of remuneration payable to, Mr. Vinod Ratan Gupta (DIN: 07401017) Whole Time Director of the Company.
3. Re-appointment of Mr. Jatinder Singh Sabharwal (DIN: 07364399) as an Independent Director of the Company for a second term
4. Re-appointment of Mr. Tarun Sehgal (DIN: 07384592), as an Independent Director of the Company for a second term
5. Re-appointment of Mr. Virender Kumar Bajaj (DIN: 07401106), as an Independent Director of the Company for a second term
6. Re-appointment of Mrs. Madhu Bala Nath (DIN: 01320110), as an Independent Director of the Company for a second term
7. Re-appointment of Mr. Jainul Haque (DIN: 00004762), as an Independent Director of the Company for a second term
HPL Electric & Power Limited
62
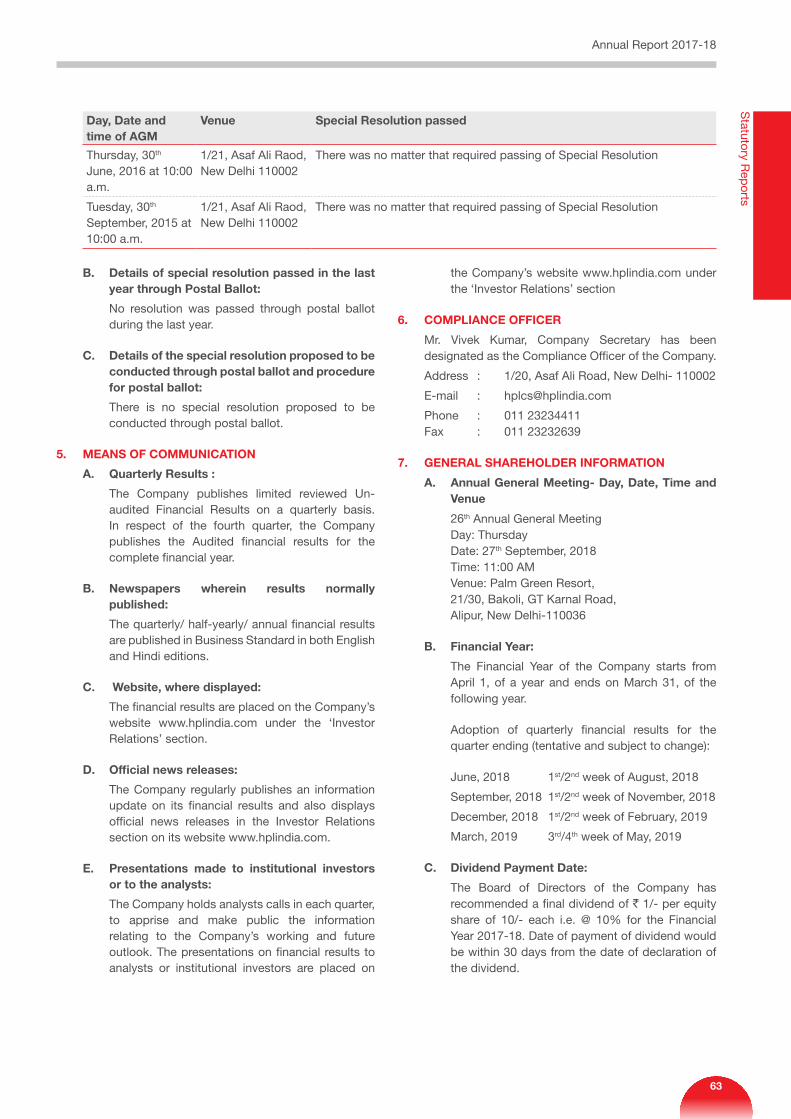
Day, Date and time of AGM
Venue Special Resolution passed
Thursday, 30th June, 2016 at 10:00 a.m.
1/21, Asaf Ali Raod, New Delhi 110002
There was no matter that required passing of Special Resolution
Tuesday, 30th September, 2015 at 10:00 a.m.
1/21, Asaf Ali Raod, New Delhi 110002
There was no matter that required passing of Special Resolution
B. Details of special resolution passed in the last year through Postal Ballot:
No resolution was passed through postal ballot during the last year.
C. Details of the special resolution proposed to be conducted through postal ballot and procedure for postal ballot:
There is no special resolution proposed to be conducted through postal ballot.
5. MEANS OF COMMUNICATION
A. Quarterly Results :
The Company publishes limited reviewed Un-audited Financial Results on a quarterly basis. In respect of the fourth quarter, the Company publishes the Audited financial results for the complete financial year.
B. Newspapers wherein results normally published:
The quarterly/ half-yearly/ annual financial results are published in Business Standard in both English and Hindi editions.
C. Website, where displayed:
The financial results are placed on the Company’s website www.hplindia.com under the ‘Investor Relations’ section.
D. Official news releases:
The Company regularly publishes an information update on its financial results and also displays official news releases in the Investor Relations section on its website www.hplindia.com.
E. Presentations made to institutional investors or to the analysts:
The Company holds analysts calls in each quarter, to apprise and make public the information relating to the Company’s working and future outlook. The presentations on financial results to analysts or institutional investors are placed on
the Company’s website www.hplindia.com under the ‘Investor Relations’ section
6. COMPLIANCE OFFICER
Mr. Vivek Kumar, Company Secretary has been designated as the Compliance Officer of the Company.
Address : 1/20, Asaf Ali Road, New Delhi- 110002
E-mail : [email protected]
Phone : 011 23234411 Fax : 011 23232639
7. GENERAL SHAREHOLDER INFORMATION
A. Annual General Meeting- Day, Date, Time and Venue
26th Annual General Meeting Day: Thursday Date: 27th September, 2018 Time: 11:00 AM Venue: Palm Green Resort, 21/30, Bakoli, GT Karnal Road, Alipur, New Delhi-110036
B. Financial Year:
The Financial Year of the Company starts from April 1, of a year and ends on March 31, of the following year.
Adoption of quarterly financial results for the quarter ending (tentative and subject to change):
June, 2018 1st/2nd week of August, 2018
September, 2018 1st/2nd week of November, 2018
December, 2018 1st/2nd week of February, 2019
March, 2019 3rd/4th week of May, 2019
C. Dividend Payment Date:
The Board of Directors of the Company has recommended a final dividend of ` 1/- per equity share of 10/- each i.e. @ 10% for the Financial Year 2017-18. Date of payment of dividend would be within 30 days from the date of declaration of the dividend.
Annual Report 2017-18S
tatutory Rep
orts
63
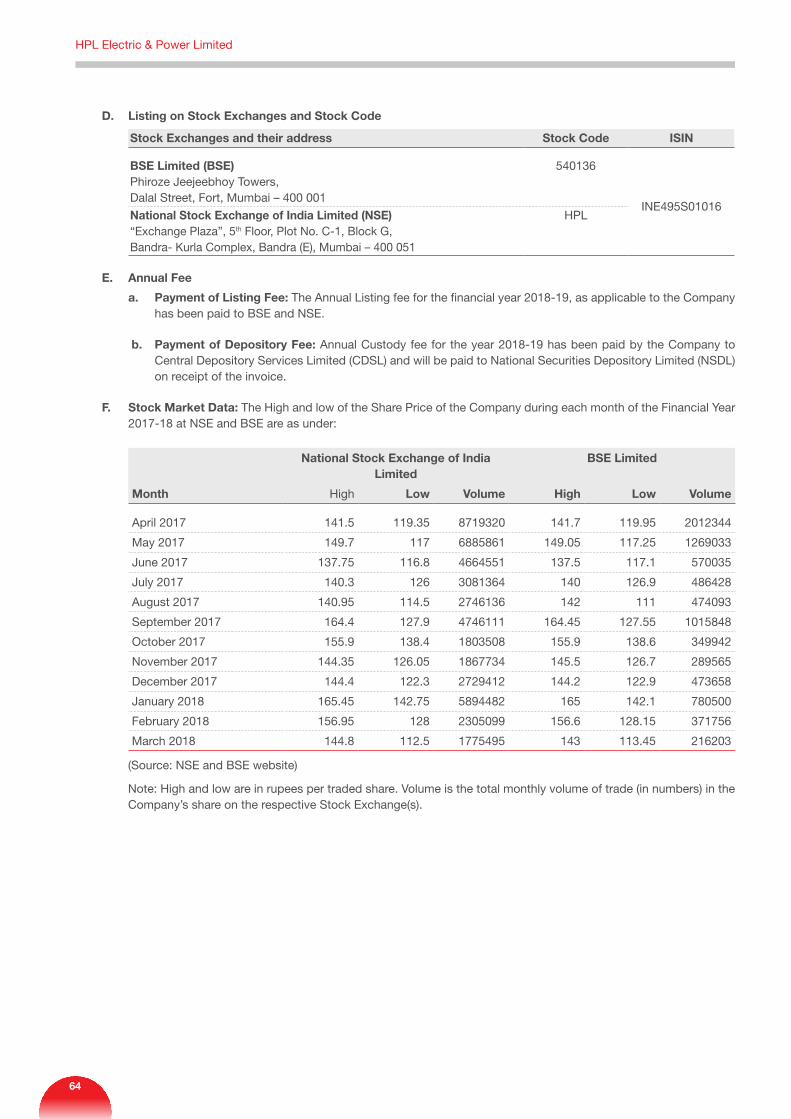
D. Listing on Stock Exchanges and Stock Code
Stock Exchanges and their address Stock Code ISIN
BSE Limited (BSE)Phiroze Jeejeebhoy Towers,Dalal Street, Fort, Mumbai – 400 001
540136
INE495S01016National Stock Exchange of India Limited (NSE)“Exchange Plaza”, 5th Floor, Plot No. C-1, Block G,Bandra- Kurla Complex, Bandra (E), Mumbai – 400 051
HPL
E. Annual Fee
a. Payment of Listing Fee: The Annual Listing fee for the financial year 2018-19, as applicable to the Company has been paid to BSE and NSE.
b. Payment of Depository Fee: Annual Custody fee for the year 2018-19 has been paid by the Company to Central Depository Services Limited (CDSL) and will be paid to National Securities Depository Limited (NSDL) on receipt of the invoice.
F. Stock Market Data: The High and low of the Share Price of the Company during each month of the Financial Year 2017-18 at NSE and BSE are as under:
National Stock Exchange of India Limited
BSE Limited
Month High Low Volume High Low Volume
April 2017 141.5 119.35 8719320 141.7 119.95 2012344
May 2017 149.7 117 6885861 149.05 117.25 1269033
June 2017 137.75 116.8 4664551 137.5 117.1 570035
July 2017 140.3 126 3081364 140 126.9 486428
August 2017 140.95 114.5 2746136 142 111 474093
September 2017 164.4 127.9 4746111 164.45 127.55 1015848
October 2017 155.9 138.4 1803508 155.9 138.6 349942
November 2017 144.35 126.05 1867734 145.5 126.7 289565
December 2017 144.4 122.3 2729412 144.2 122.9 473658
January 2018 165.45 142.75 5894482 165 142.1 780500
February 2018 156.95 128 2305099 156.6 128.15 371756
March 2018 144.8 112.5 1775495 143 113.45 216203
(Source: NSE and BSE website)
Note: High and low are in rupees per traded share. Volume is the total monthly volume of trade (in numbers) in the Company’s share on the respective Stock Exchange(s).
HPL Electric & Power Limited
64
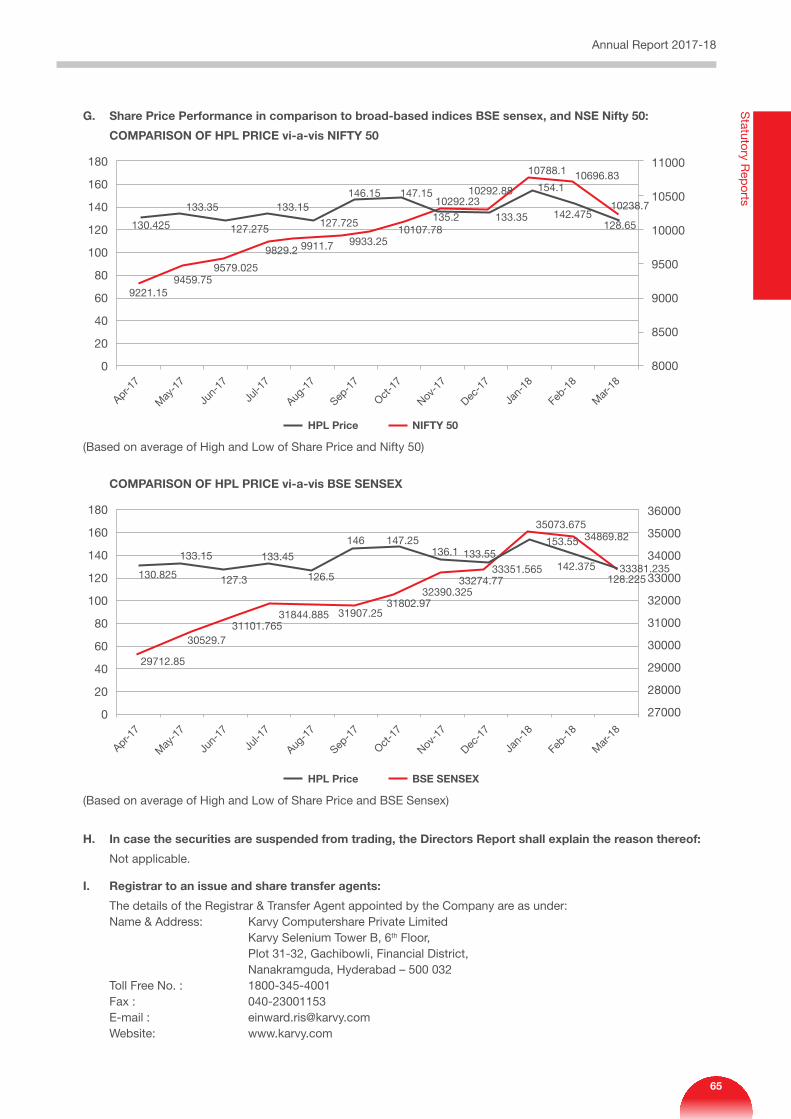
G. Share Price Performance in comparison to broad-based indices BSE sensex, and NSE Nifty 50:
COMPARISON OF HPL PRICE vi-a-vis NIFTY 50
180
160
140
120
100
80
60
40
20
0
11000
10500
10000
9500
9000
8500
8000
Apr-17
May
-17
Jun-
17
Jul-1
7
Aug-1
7
Sep-1
7
Oct-1
7
Nov-1
7
Dec-1
7
Jan-
18
Feb-1
8
Mar-
18
130.425
9221.159459.75
9579.025
9829.2 9911.7 9933.2510107.78
10292.23
10696.8310788.1
10238.7133.35
127.275
133.15
127.725
146.15 147.15
135.2 133.35
154.1
128.65
HPL Price NIFTY 50
10292.88
142.475
(Based on average of High and Low of Share Price and Nifty 50)
COMPARISON OF HPL PRICE vi-a-vis BSE SENSEX
180
160
140
120
100
80
60
40
20
0
36000
35000
34000
33000
32000
31000
30000
29000
28000
27000
Apr-17
May
-17
Jun-
17
Jul-1
7
Aug-1
7
Sep-1
7
Oct-1
7
Nov-1
7
Dec-1
7
Jan-
18
Feb-1
8
Mar-
18
130.825
29712.85
30529.731101.765
31844.885 31907.2531802.97
32390.325
136.1
33381.235
34869.8235073.675
142.375133.15
127.3
133.45
126.5
146 147.25
33274.7733351.565
133.55
128.225
HPL Price BSE SENSEX
153.55
(Based on average of High and Low of Share Price and BSE Sensex)
H. In case the securities are suspended from trading, the Directors Report shall explain the reason thereof:
Not applicable.
I. Registrar to an issue and share transfer agents:
The details of the Registrar & Transfer Agent appointed by the Company are as under: Name & Address: Karvy Computershare Private Limited Karvy Selenium Tower B, 6th Floor, Plot 31-32, Gachibowli, Financial District, Nanakramguda, Hyderabad – 500 032 Toll Free No. : 1800-345-4001 Fax : 040-23001153 E-mail : [email protected] Website: www.karvy.com
Annual Report 2017-18S
tatutory Rep
orts
65
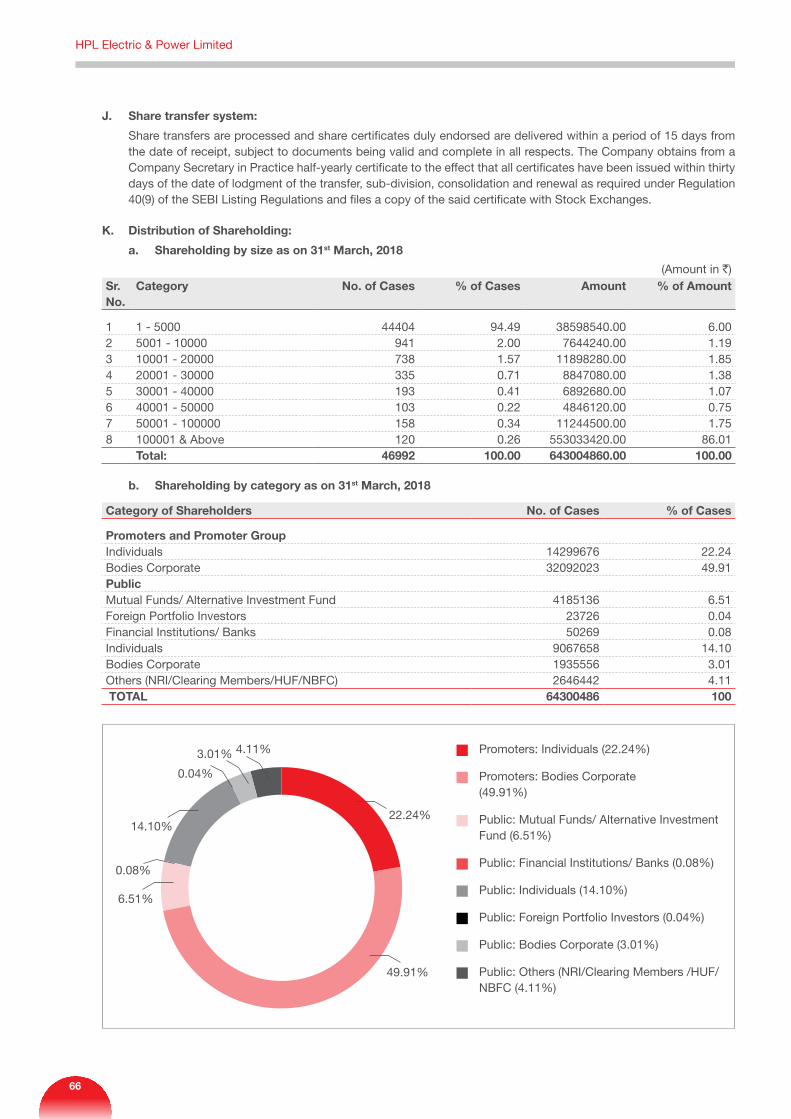
J. Share transfer system:
Share transfers are processed and share certificates duly endorsed are delivered within a period of 15 days from the date of receipt, subject to documents being valid and complete in all respects. The Company obtains from a Company Secretary in Practice half-yearly certificate to the effect that all certificates have been issued within thirty days of the date of lodgment of the transfer, sub-division, consolidation and renewal as required under Regulation 40(9) of the SEBI Listing Regulations and files a copy of the said certificate with Stock Exchanges.
K. Distribution of Shareholding:
a. Shareholding by size as on 31st March, 2018
(Amount in `)Sr. No.
Category No. of Cases % of Cases Amount % of Amount
1 1 - 5000 44404 94.49 38598540.00 6.002 5001 - 10000 941 2.00 7644240.00 1.193 10001 - 20000 738 1.57 11898280.00 1.854 20001 - 30000 335 0.71 8847080.00 1.385 30001 - 40000 193 0.41 6892680.00 1.076 40001 - 50000 103 0.22 4846120.00 0.757 50001 - 100000 158 0.34 11244500.00 1.758 100001 & Above 120 0.26 553033420.00 86.01
Total: 46992 100.00 643004860.00 100.00
b. Shareholding by category as on 31st March, 2018
Category of Shareholders No. of Cases % of Cases
Promoters and Promoter Group Individuals 14299676 22.24Bodies Corporate 32092023 49.91PublicMutual Funds/ Alternative Investment Fund 4185136 6.51Foreign Portfolio Investors 23726 0.04Financial Institutions/ Banks 50269 0.08Individuals 9067658 14.10Bodies Corporate 1935556 3.01Others (NRI/Clearing Members/HUF/NBFC) 2646442 4.11 TOTAL 64300486 100
Promoters: Individuals (22.24%)
Promoters: Bodies Corporate (49.91%)
Public: Mutual Funds/ Alternative Investment Fund (6.51%)
Public: Financial Institutions/ Banks (0.08%)
Public: Individuals (14.10%)
Public: Foreign Portfolio Investors (0.04%)
Public: Bodies Corporate (3.01%)
Public: Others (NRI/Clearing Members /HUF/NBFC (4.11%)
22.24%
49.91%
6.51%
0.08%
14.10%
0.04%
3.01% 4.11%
HPL Electric & Power Limited
66
L. Dematerialization of shares and liquidity:
Trading in Equity Shares of the Company is permitted only in dematerialised form.
Number of shares along with percentage held in dematerialized and physical mode as on 31st March, 2018 are as follows:
Form Number of Shares Percentage
NSDL 19995169 31.10CDSL 44305257 68.90Physical 60 0.00Total 64300486 100
The Company’s Equity Shares are among the most liquid and actively traded shares on the Stock Exchanges.
M. Outstanding global depository receipts or American depository receipts or warrant Or any convertible instruments, conversion date and likely impact on equity:
There are no GDRs/ ADRs/ Warrants outstanding as on 31st March, 2018.
N. Commodity price risk or foreign exchange risk and hedging activities:
The Company has in place Risk Management policy in order to mitigate foreign exchange risk. Pursuant to this policy natural hedge is maintained and when required forward contracts / cover are also used to cover these exposures.
O. Plant locations:
Sr. No.
Address
1. Plot No. 132-133, Pace City –I, Sector -37, Gurgaon, Haryana2 Plot No. 357-Q,Pace City- II, Sector – 37, Gurgaon3 Vill : Shavela, P.O. Jabli, Distt. Solan, Himachal Pradesh4 Vill: Bigan, Dhaturi Road, Tehsil : Gannaur, Sonepat Haryana5 Plot No. 76-B, Phase- IV, Sector – 57,Industrial Estate, Kundli, Sonepat Haryana6 Main GT Karnal Road Village Bastawa, Tehsil Gharaunda, District Karnal, Haryana
P. Address for correspondence:
(A) Company’s address:
Registered Office : 1/20, Asaf Ali Road, New Delhi- 110002
Phone : 011 23234411
Fax : 011 23232639
Corporate Office : Windsor Business Park, B-1D, Sector-10, Noida- 201301
Phone : 0120-4656300
Fax : 0120-4656333
Website : www.hplindia.com
E-mail : [email protected]
(B) Registrar & Share Transfer Agent’s Address:
Address : Karvy Computershare Private Limited
Karvy Selenium Tower B, Plot No. 31-32, Gachibowli, Financial District, Nanakramguda, Hyderabad – 500 032
Toll Free No. : 1800-345-4001
Fax : 040-23001153
E-mail : [email protected]
Website : www.karvy.com
Annual Report 2017-18S
tatutory Rep
orts
67
8. OTHER DISCLOSURES
8.1 Disclosures on materially significant related party transactions that may have potential conflict with the interests of listed entity at large:
During the Financial Year 2017-18, there was no materially significant Related Party Transactions with the company’s Directors, Promoters, the KMPs, management or their relatives that may have potential conflict with the interests of the Company at large. All related party transactions entered into during the year were on arm’s length basis, in the ordinary course of business and were in compliance with the applicable provisions of the Act and SEBI Listing Regulations.
Members may refer to the disclosure of transactions with related parties in the Balance Sheet in Note No. 40.
The Board has framed the policy on the materiality of related party transactions and is available on the website of the company i.e. www. hplindia.com.
8.2 Details of non-compliance by the listed entity, penalties, strictures imposed on the listed entity by stock exchange(s) or the Board or any statutory authority, on any matter related to capital markets, during the last three years:
The Company has not been penalized, nor have the stock exchanges, or the Board or any statutory authority imposed any strictures, during the last three years, on any matter relating to capital markets.
8.3 Details of establishment of vigil mechanism, Whistle Blower Policy and affirmation that no personnel has been denied access to the Audit Committee:
The Company has established a Vigil Mechanism / Whistle Blower Policy pursuant to the provisions of Section 177 of the Companies Act, 2013 and rules made thereunder as amended from time to time and Regulation 22 of the SEBI Listing Regulations for its Directors and Employees to report the genuine concerns about unethical behavior, actual or suspected fraud or violation of the Company’s Code of Conduct. During the year under report, no Director or Employee has been denied access to the Audit Committee.
The Vigil Mechanism / Whistle Blower Policy is available on the website of the company i.e. www. hplindia.com.
8.4 Details of compliance with mandatory requirements and adoption of the non mandatory requirements:
The Company has fully complied with the mandatory requirements of SEBI Listing Regulations. The Company has adopted following non-mandatory/Discretionary requirements of Regulation 27 of the SEBI Listing Regulations:
1. Audit Qualification
The Company is in the regime of unqualified financial statements.
2. Reporting of Internal Auditor
The Internal Auditor directly reports to the Audit Committee.
8.5 Web link where policy for determining ‘material’ subsidiaries is disclosed:
The policy for determining ‘material’ subsidiaries is available on the website of the Company under “Policies and Code” in the Investor Relations section and can be accessed at http://www.hplindia.com/policies-and-codes.aspx.
8.6 Web link where policy on dealing with related party transactions:
The policy on dealing with related party transactions is available on the website of the Company under “Policies and Code” in the Investor Relations section and can be accessed at http://www.hplindia.com/policies-and-codes.aspx.
8.7 Disclosure of commodity price risks and commodity hedging activities:
The Company is not importing commodity and hence commodity price risk & Commodity hedging activities is not applicable.
8.8 The Company has complied with the requirements of Corporate Governance Report as mentioned in sub paras (2) to (10) of Schedule V of the SEBI Listing Regulations.
8.9 SUBSIDIARY COMPANY
The company has one unlisted subsidiary company i.e. Himachal Energy Private Limited. The Audit committee and Board of Directors reviews the financial statements, significant transactions and arrangements entered into by the unlisted subsidiary company and the minutes are placed before the Board. The company does not have any unlisted material subsidiary company.
10. DISCLOSURE WITH RESPECT TO DEMAT SUSPENSE ACCOUNT/UNCLAIMED SUSPENSE ACCOUNT:
The company does not have any shares in the demat suspense account or unclaimed suspense account.
For and on Behalf of the Board
For HPL Electric & Power Limited
Lalit SethDate: 2nd August, 2018 Chairman and Managing DirectorPlace: Noida DIN: 00312007
HPL Electric & Power Limited
68
DECLARATION PURSUANT TO CLAUSE D OF SCHEDULE V OF THE SEBI (LISTING OBLIGATIONS AND DISCLOSURE REQUIREMENTS) REGULATIONS, 2015
I hereby confirm that all the Board Members and Senior Management Personnel of the company have affirmed compliance with the Code of Conduct of Directors and Senior Management, as approved by the Board, for the financial year ended 31st March, 2018.
LALIT SETHDate: 2nd August, 2018 CHAIRMAN AND MANAGING DIRECTORPlace: Noida DIN: 00312007
AUDITOR’S CERTIFICATE ON CORPORATE GOVERNANCE
ToThe Members ofHPL Electric & Power Limited1/20, Asaf Ali RoadNew Delhi-110002
We have examined the compliance of Corporate Governance by HPL Electric & Power Limited (“the Company”), for the year ended 31st March, 2018, as per the relevant provisions of the Securities and exchange Board of India (Listing Obligations and Disclosure Requirements) Regulations, 2015 (“Listing Regulations”).
The compliance of conditions of Corporate Governance is the responsibility of the management. Our examination was limited to procedures and implementation thereof, adopted by the Company for ensuring the compliance of the conditions of the Corporate Governance. It is neither an audit nor an expression of opinion on the financial statements of the Company.
In our opinion and to the best of our information and according to the explanations given to us, we certify that the company has complied with the conditions of corporate governance as stipulated in the above mentioned Listing Regulations.
We further state that such compliance is neither an assurance as to the future viability of the Company nor the efficiency or effectiveness with which the management has conducted the affairs of the Company.
For Kharabanda Associates. Chartered Accountants Firm Registration No. 003456N
Sunil KharabandaDate: 2nd August, 2018 ProprietorPlace: Noida Membership No. 082402
Annual Report 2017-18S
tatutory Rep
orts
69
COMPLIANCE CERTIFICATE
ToThe Board of DirectorsHPL Electric & Power Limited1/20, Asaf Ali RoadNew Delhi – 110002
We, Lalit Seth, Chairman and Managing Director and Sudhir Barik, CFO of HPL Electric & Power Limited (the ‘Company’) to the best of our knowledge and belief, certify that:
A. We have reviewed the, Standalone and Consolidated financial statements and cash flow statement for the year ended on 31st March, 2018 and based on our knowledge and believe certify that:
1) these statements do not contain any materially untrue statement or omit any material fact or contain any statements that might be misleading;
2) these statements together present a true and fair view of the Company’s affairs and are in compliance with existing accounting standards, applicable laws and regulations;
B. There are, to the best of our knowledge and belief, no transaction entered into by the company during the year ended on 31st March, 2018 which are fraudulent, illegal or violative of the company’s code of conduct.
C. We accept responsibility for establishing and maintaining internal controls for financial reporting and we have evaluated the effectiveness of internal control systems of the Company pertaining to financial reporting and we have disclosed to the auditors and the audit committee, deficiencies in the design or operation of such internal controls, if any, of which we are aware and the steps we have taken or propose to take to rectify these deficiencies.
D. We have indicated to auditors and the audit committee, wherever applicable:
1) significant changes in internal control over the financial reporting during the year;
2) significant changes in accounting policies during the year and the same has been disclosed in the notes to the financial statements; and
3) instances of significant fraud of which we have become aware and the involvement therein, of management or an employee having a significant role in the Company’s internal control system over financial reporting.
Lalit Seth Chairman and Managing Director DIN: 00312007
Date: 21st May, 2018 Sudhir BarikPlace: Noida CFO
M. No. 13243
HPL Electric & Power Limited
70
To the Members of HPL ELECTRIC & POWER LTD.
Report on the Standalone Ind AS Financial StatementsWe have audited the accompanying standalone Ind AS financial statement of HPL ELECTRIC & POWER LTD. (‘the Company’) which comprise the balance sheet as at march 31, 2018, statement of Profit and loss (including other comprehensive income) the statement of changes in equity and the Cash Flow Statement for the year then ended, and a summary of significant accounting policies and other explanatory information.
Management’s Responsibility for the Standalone Financial StatementsThe company’s Board of Directors is responsible for the matters stated in Section 134(5) of the Companies Act, 2013 (‘the Act’) with respect to the preparation of these Standalone Ind AS financial statements that give a true and fair view of the financial position, financial performance including other comprehensive income, cash flows and changes in equity of the Company in accordance with the Indian Accounting Standard ( Ind AS ) prescribed under Section 133 of the Act, read with the companies (Indian Accounting Standard) Rules 2015, as amended, and other accounting principles generally accepted in India.
This responsibility also includes maintenance of adequate accounting records in accordance with the provisions of the Act for safeguarding the assets of the Company and for preventing and detecting frauds and other irregularities; selection and application of appropriate accounting policies; making judgments and estimates that are reasonable and prudent; and design, implementation and maintenance of adequate internal financial controls, that were operating effectively for ensuring the accuracy and completeness of the accounting records, relevant to the preparation and presentation of the standalone financial statements that give a true and fair view and are free from material misstatement, whether due to fraud or error.
Auditor’s Responsibility Our responsibility is to express an opinion on these standalone financial Ind AS statements based on our audit.
In conducting our audit we have taken into account the provisions of the Act, the accounting and auditing standards and matters which are required to be included in the audit report under the provisions of the Act and the rules made there under and the Order under section 143(11) of the Act.
We conducted our audit of the standalone Ind AS financial statements in accordance with the Standards on Auditing specified under section 143(10) of the Act. Those Standards require that we comply with ethical requirements and plan and perform the audit to obtain reasonable assurance about
whether the standalone Ind AS financial statements are free from material misstatement.
An audit involves performing procedures to obtain audit evidence about the amounts and the disclosures in the standalone Ind AS financial statements. The procedures selected depend on the auditor’s judgment, including the assessment of the risks of material misstatement of the standalone Ind AS financial statements, whether due to fraud or error. In making those risk assessments, the auditor considers internal financial control relevant to the Company’s preparation of the standalone Ind AS financial statements that give a true and fair view in order to design audit procedures that are appropriate in the circumstances. An audit also includes evaluating the appropriateness of accounting policies used and the reasonableness of the accounting estimates made by the Company’s Directors, as well as evaluating the overall presentation of the standalone Ind AS financial statements.
We believe that the audit evidence we have obtained is sufficient and appropriate to provide a basis for our audit opinion on the standalone Ind AS financial statements.
Opinion
In our opinion and to the best of our information and according to the explanations given to us, the aforesaid standalone Ind AS financial statements give the information required by the Act in the manner so required and give a true and fair view in conformity with the accounting principles generally accepted in India, of the state of affairs of the Company as at 31st March, 2018 and its Profit, total comprehensive income, the change in equity and its Cash Flows for the year ended on that date.
Report on Other Legal and Regulatory Requirements1. As required by section 143(3) of the Act, based on our
audit, we report that:
a) we have sought and obtained all the information and explanations which to the best of our knowledge and belief were necessary for the purposes of our audit.
b) in our opinion, proper books of account as required by law have been kept by the Company so far as it appears from our examination of those books.
c) the Balance Sheet, the Statement of Profit and Loss including other comprehensive income, statement of changes in equity and the Cash Flow Statement dealt with by this Report are in agreement with the books of account.
d) in our opinion, the aforesaid standalone Ind AS financial statements comply with the Indian
Independent Auditor’s Report
Annual Report 2017-18Standalone Financial Statem
ents
71
Accounting Standards specified under section 133 of the Act.
e) on the basis of written representations received from the directors as on 31st March, 2018 and taken on record by the Board of Directors, none of the directors is disqualified as on 31st March, 2018 from being appointed as a director in terms of section 164(2) of the Act, and
f) with respect to the adequacy of the internal financial controls over financial reporting of the company and the operating effectiveness of such controls, refer to our separate report in “Annexure A”. Our report expresses an unmodified opinion on the adequacy and operating effectiveness of the Company’s internal financial controls over financial reporting.
g) with respect to the other matters to be included in the Auditors’ Report in accordance with Rule 11 of the Companies (Audit and Auditors) Rules, 2014, as amended, in our opinion and to the best of our information and according to the explanations given to us.
(Referred to in paragraph 1(f) under ‘Report on Other Legal and Regulatory Requirements’ section of our report to the members of HPL Electric & Power Limited of even date)
Report on the Internal Financial Controls Over Financial Reporting under Clause (i) of Sub-section 3 of Section 143 of the Companies Act, 2013 (‘the Act’)
We have audited the internal financial controls over financial reporting of HPL ELECTRIC & POWER LTD. (‘the Company’) as of March 31, 2018 in conjunction with our audit of the standalone Ind AS financial statement of the company for the year then ended and as on that date.
Management’s Responsibility for the Internal Financial Controls
The Board of Directors of the company is responsible for establishing and maintaining internal financial controls based on the internal control over financial reporting criteria established by the Company considering the essential components of internal control stated in the Guidance Note on Audit of Internal Financial Controls Over financial Reporting issued by the Institute of Chartered Accountants
AnnexuRe ‘A’ To The Independent Auditors’ Report
i. The company has disclosed the impact of pending litigation on its financial position in its standalone Ind AS financial statements.
ii. The company did not have any long term contract including derivative contract for which there were any material foreseeable losses.
iii. There was no amount which was required to be transferred to the Investor Education and Protection Fund by the Company.
2. As required by the Companies (Auditor’s Report) Order, 2016 (‘the Order’) issued by the Central Government of India in term of Sub-Section (11) of Section 143 of the Act, we given in ‘Annexure B’ a statement on the matters specified on paragraph 3 and 4 of the Order.
For Kharabanda AssociatesChartered Accountants
FRN:003456N
Sunil KharabandaPlace: New Delhi ProprietorDate: 21.05.2018 M. No: 082402
of India (the ‘Guidance Note’). These responsibilities include the design, implementation and maintenance of adequate internal financial controls that were operating effectively for ensuring the orderly and efficient conduct of its business, the safeguarding of its assets, the prevention and detection of frauds and errors, the accuracy and completeness of the accounting records, and the timely preparation of reliable financial information, as required under the Companies Act 2013.
Auditor’s ResponsibilityOur responsibility is to express an opinion on the Company’s internal financial controls over financial reporting based on our audit. We conducted our audit in accordance with the Guidance Note on Audit of Internal financial Controls Over Financial Reporting ( The Guidance Note) issued by the Institute of Chartered Accountants of India and the Standards on Auditing prescribed under Section 143(10) of the Companies Act 2013, to the extant applicable to an audit of internal financial controls. Those Standards and the Guidance Note required that we comply with the ethical requirements and plan and perform the audit to obtain reasonable assurance about internal financial controls over
HPL Electric & Power Limited
72
financial reporting was established and maintained and if such controls operated effectively in all material respects.
Our audit involves performing procedures to obtain audit evidence about the adequacy of the internal financial controls system over financial reporting and their operating effectiveness. Our audit of internal financial controls over financial reporting included obtaining an understanding of internal financial controls over financial reporting, assessing the risk that a material weakness exists, and testing and evaluating the design and operating effectiveness of internal control based on the assessed risk. The procedures selected depend of the auditors’ judgment, including the assessment of the risks of material misstatement of the financial statement, whether due to fraud or error.
We believe that the audit evidence we have obtained is sufficient and appropriate to provide a basis for our audit opinion on the Company’s internal financial controls system over financial reporting.
Meaning of Internal Financial Controls Over Financial ReportingA company’s internal financial controls over financial reporting is a process designed to provide reasonable assurance regarding the reliability of financial reporting and the preparation of financial statements for external purpose in accordance with generally accepted accounting principles. A company’s internal financial controls over financial reporting includes those policies and procedures that (1) pertain to the maintenance of records that, in reasonable detail, accurately and fairly reflect the transactions and dispositions of the assets of the company, (2) provide reasonable assurance that transactions are recorded as necessary to permit preparation of financial statement in accordance with generally accepted accounting principles and that receipts and expenditures of the company are being made only in accordance with authorisation of the management and directors of the company, and (3) provide reasonable assurance regarding prevention or timely
detection of unauthorised acquisition, use, or disposition of the company’s assets that could have a material effect on the financial statements.
Inherent Limitations of Internal Financial Controls Over Financial ReportingBecause of the inherent limitation of internal financial controls over financial reporting, including the possibility of collusion or improper management override of controls, material misstatements due to error or fraud may occur and not be detected. Also, projections of any evaluation of the internal financial controls over financial reporting to future periods are subject to the risk that the internal financial controls over financial reporting may become inadequate because of change in conditions, or that the degree of compliance with the policies or procedures may deteriorate.
OpinionIn our opinion, to the best of our information and according to the explanations given to us, the Company has, in all material respects, an adequate internal financial controls system over financial reporting and such internal financial controls over financial reporting were operating effectively as at March 31, 2018, based on the internal financial controls over financial reporting criteria established by the Company considering the essential components of internal control stated in the Guidance Note on Audit of Internal Financial Control over Financial Reporting issued by the Institute of Chartered Accountant of India.
For Kharabanda AssociatesChartered Accountants
FRN:003456N
Sunil KharabandaPlace: New Delhi ProprietorDate: 21.05.2018 M. No: 082402
AnnexuRe ‘B’ To The Independent Auditors’ Report(Referred to in paragraph, under ‘Report on Other Legal and Regulatory Requirements’ section of our Report of even date)
(1) In respect of the Company’s fixed assets:
a) The company has maintained proper records showing full particulars, including quantitative details and situation of fixed assets.
b) The fixed assets were physically verified during the year by the Management in accordance with a regular program of verification which, on our opinion, provides physical verification of all the
fixed assets at reasonable intervals. According to the information and explanations given to us, no material discrepancies were noticed on such verification.
C) According to the information and explanations given to us and the records examined by us and based on the examination of the conveyance deed provided to us, we report that, the title deeds, comprising all the immovable properties of land and buildings which are freehold, are held in the name of the Company as at the balance sheet date.
Annual Report 2017-18Standalone Financial Statem
ents
73
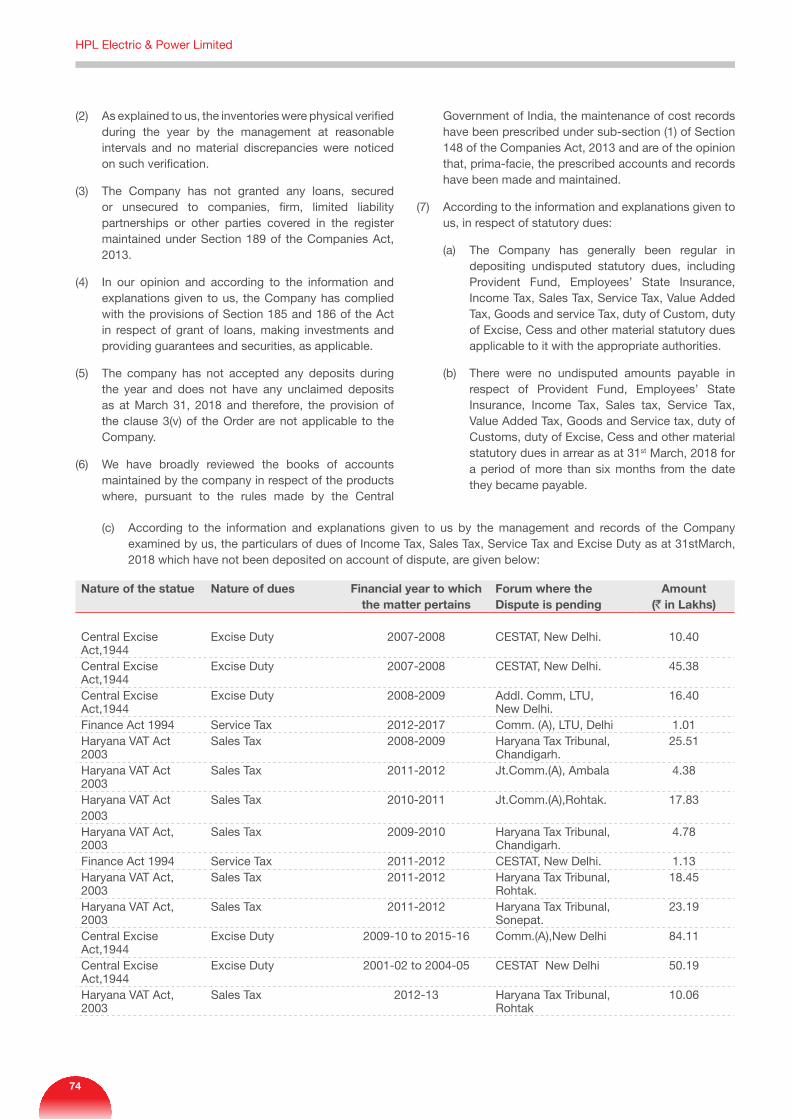
(2) As explained to us, the inventories were physical verified during the year by the management at reasonable intervals and no material discrepancies were noticed on such verification.
(3) The Company has not granted any loans, secured or unsecured to companies, firm, limited liability partnerships or other parties covered in the register maintained under Section 189 of the Companies Act, 2013.
(4) In our opinion and according to the information and explanations given to us, the Company has complied with the provisions of Section 185 and 186 of the Act in respect of grant of loans, making investments and providing guarantees and securities, as applicable.
(5) The company has not accepted any deposits during the year and does not have any unclaimed deposits as at March 31, 2018 and therefore, the provision of the clause 3(v) of the Order are not applicable to the Company.
(6) We have broadly reviewed the books of accounts maintained by the company in respect of the products where, pursuant to the rules made by the Central
Government of India, the maintenance of cost records have been prescribed under sub-section (1) of Section 148 of the Companies Act, 2013 and are of the opinion that, prima-facie, the prescribed accounts and records have been made and maintained.
(7) According to the information and explanations given to us, in respect of statutory dues:
(a) The Company has generally been regular in depositing undisputed statutory dues, including Provident Fund, Employees’ State Insurance, Income Tax, Sales Tax, Service Tax, Value Added Tax, Goods and service Tax, duty of Custom, duty of Excise, Cess and other material statutory dues applicable to it with the appropriate authorities.
(b) There were no undisputed amounts payable in respect of Provident Fund, Employees’ State Insurance, Income Tax, Sales tax, Service Tax, Value Added Tax, Goods and Service tax, duty of Customs, duty of Excise, Cess and other material statutory dues in arrear as at 31st March, 2018 for a period of more than six months from the date they became payable.
(c) According to the information and explanations given to us by the management and records of the Company examined by us, the particulars of dues of Income Tax, Sales Tax, Service Tax and Excise Duty as at 31stMarch, 2018 which have not been deposited on account of dispute, are given below:
Nature of the statue Nature of dues Financial year to which the matter pertains
Forum where the Dispute is pending
Amount (` in Lakhs)
Central ExciseAct,1944
Excise Duty 2007-2008 CESTAT, New Delhi. 10.40
Central ExciseAct,1944
Excise Duty 2007-2008 CESTAT, New Delhi. 45.38
Central ExciseAct,1944
Excise Duty 2008-2009 Addl. Comm, LTU,New Delhi.
16.40
Finance Act 1994 Service Tax 2012-2017 Comm. (A), LTU, Delhi 1.01Haryana VAT Act2003
Sales Tax 2008-2009 Haryana Tax Tribunal, Chandigarh.
25.51
Haryana VAT Act2003
Sales Tax 2011-2012 Jt.Comm.(A), Ambala 4.38
Haryana VAT Act2003
Sales Tax 2010-2011 Jt.Comm.(A),Rohtak. 17.83
Haryana VAT Act, 2003
Sales Tax 2009-2010 Haryana Tax Tribunal, Chandigarh.
4.78
Finance Act 1994 Service Tax 2011-2012 CESTAT, New Delhi. 1.13Haryana VAT Act, 2003
Sales Tax 2011-2012 Haryana Tax Tribunal, Rohtak.
18.45
Haryana VAT Act, 2003
Sales Tax 2011-2012 Haryana Tax Tribunal, Sonepat.
23.19
Central ExciseAct,1944
Excise Duty 2009-10 to 2015-16 Comm.(A),New Delhi 84.11
Central ExciseAct,1944
Excise Duty 2001-02 to 2004-05 CESTAT New Delhi 50.19
Haryana VAT Act, 2003
Sales Tax 2012-13 Haryana Tax Tribunal, Rohtak
10.06
HPL Electric & Power Limited
74
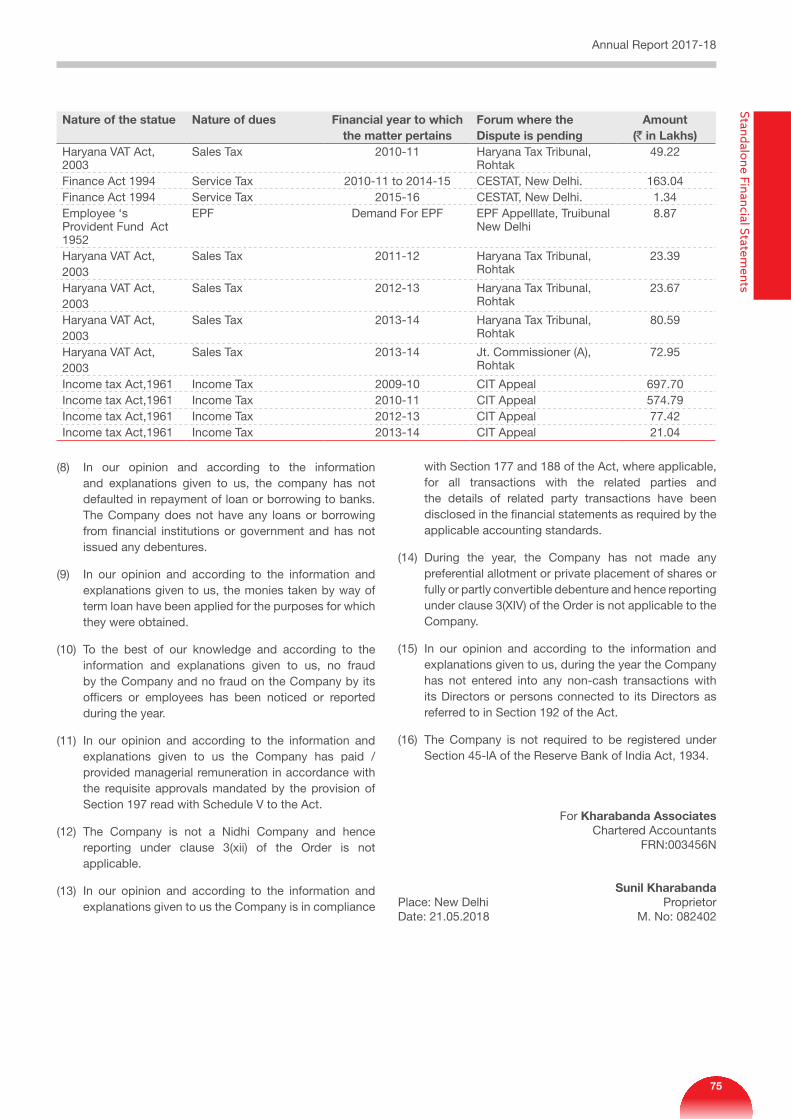
Nature of the statue Nature of dues Financial year to which the matter pertains
Forum where the Dispute is pending
Amount (` in Lakhs)
Haryana VAT Act, 2003
Sales Tax 2010-11 Haryana Tax Tribunal, Rohtak
49.22
Finance Act 1994 Service Tax 2010-11 to 2014-15 CESTAT, New Delhi. 163.04Finance Act 1994 Service Tax 2015-16 CESTAT, New Delhi. 1.34Employee ‘s Provident Fund Act 1952
EPF Demand For EPF EPF Appelllate, Truibunal New Delhi
8.87
Haryana VAT Act, 2003
Sales Tax 2011-12 Haryana Tax Tribunal, Rohtak
23.39
Haryana VAT Act, 2003
Sales Tax 2012-13 Haryana Tax Tribunal, Rohtak
23.67
Haryana VAT Act, 2003
Sales Tax 2013-14 Haryana Tax Tribunal, Rohtak
80.59
Haryana VAT Act, 2003
Sales Tax 2013-14 Jt. Commissioner (A), Rohtak
72.95
Income tax Act,1961 Income Tax 2009-10 CIT Appeal 697.70Income tax Act,1961 Income Tax 2010-11 CIT Appeal 574.79Income tax Act,1961 Income Tax 2012-13 CIT Appeal 77.42Income tax Act,1961 Income Tax 2013-14 CIT Appeal 21.04
(8) In our opinion and according to the information and explanations given to us, the company has not defaulted in repayment of loan or borrowing to banks. The Company does not have any loans or borrowing from financial institutions or government and has not issued any debentures.
(9) In our opinion and according to the information and explanations given to us, the monies taken by way of term loan have been applied for the purposes for which they were obtained.
(10) To the best of our knowledge and according to the information and explanations given to us, no fraud by the Company and no fraud on the Company by its officers or employees has been noticed or reported during the year.
(11) In our opinion and according to the information and explanations given to us the Company has paid / provided managerial remuneration in accordance with the requisite approvals mandated by the provision of Section 197 read with Schedule V to the Act.
(12) The Company is not a Nidhi Company and hence reporting under clause 3(xii) of the Order is not applicable.
(13) In our opinion and according to the information and explanations given to us the Company is in compliance
with Section 177 and 188 of the Act, where applicable, for all transactions with the related parties and the details of related party transactions have been disclosed in the financial statements as required by the applicable accounting standards.
(14) During the year, the Company has not made any preferential allotment or private placement of shares or fully or partly convertible debenture and hence reporting under clause 3(XIV) of the Order is not applicable to the Company.
(15) In our opinion and according to the information and explanations given to us, during the year the Company has not entered into any non-cash transactions with its Directors or persons connected to its Directors as referred to in Section 192 of the Act.
(16) The Company is not required to be registered under Section 45-lA of the Reserve Bank of India Act, 1934.
For Kharabanda AssociatesChartered Accountants
FRN:003456N
Sunil KharabandaPlace: New Delhi ProprietorDate: 21.05.2018 M. No: 082402
Annual Report 2017-18Standalone Financial Statem
ents
75
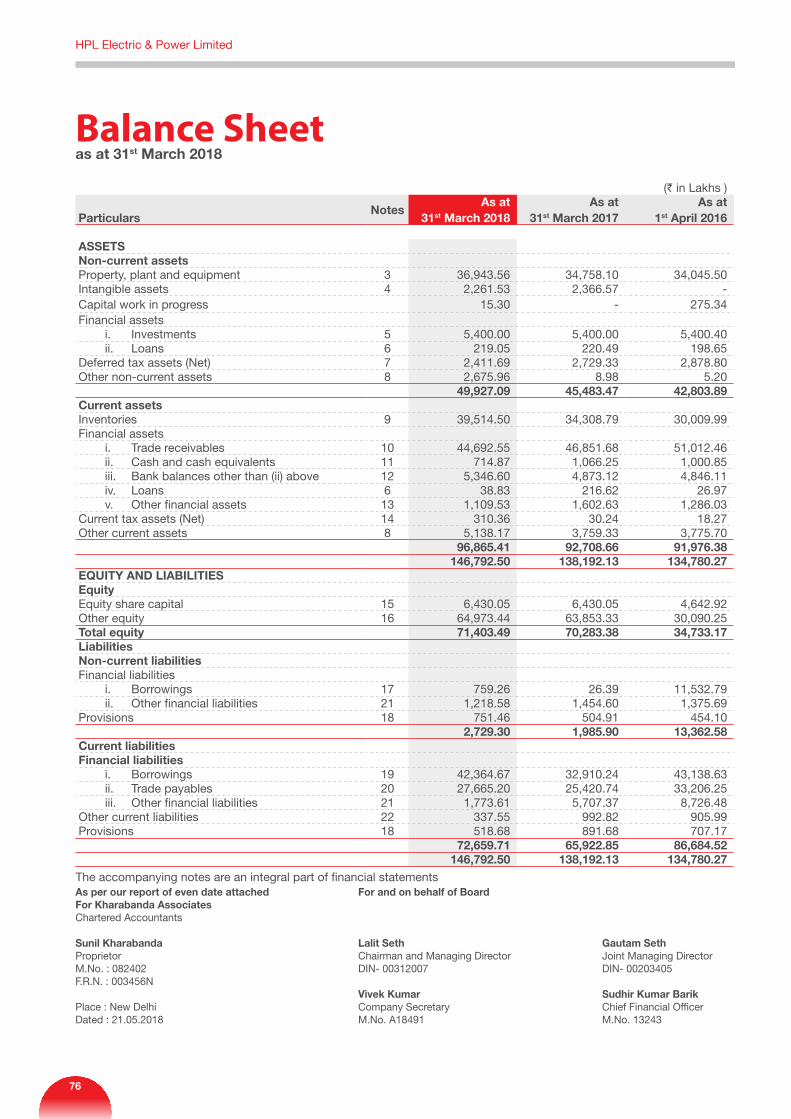
Balance Sheetas at 31st March 2018
(` in Lakhs )
ParticularsNotes
As at 31st March 2018
As at 31st March 2017
As at 1st April 2016
ASSETS Non-current assets Property, plant and equipment 3 36,943.56 34,758.10 34,045.50 Intangible assets 4 2,261.53 2,366.57 - Capital work in progress 15.30 - 275.34 Financial assets i. Investments 5 5,400.00 5,400.00 5,400.40 ii. Loans 6 219.05 220.49 198.65 Deferred tax assets (Net) 7 2,411.69 2,729.33 2,878.80 Other non-current assets 8 2,675.96 8.98 5.20
49,927.09 45,483.47 42,803.89 Current assetsInventories 9 39,514.50 34,308.79 30,009.99 Financial assets i. Trade receivables 10 44,692.55 46,851.68 51,012.46 ii. Cash and cash equivalents 11 714.87 1,066.25 1,000.85 iii. Bank balances other than (ii) above 12 5,346.60 4,873.12 4,846.11 iv. Loans 6 38.83 216.62 26.97 v. Other financial assets 13 1,109.53 1,602.63 1,286.03 Current tax assets (Net) 14 310.36 30.24 18.27 Other current assets 8 5,138.17 3,759.33 3,775.70
96,865.41 92,708.66 91,976.38 146,792.50 138,192.13 134,780.27
EQUITY AND LIABILITIES Equity Equity share capital 15 6,430.05 6,430.05 4,642.92 Other equity 16 64,973.44 63,853.33 30,090.25 Total equity 71,403.49 70,283.38 34,733.17 Liabilities Non-current liabilities Financial liabilities i. Borrowings 17 759.26 26.39 11,532.79 ii. Other financial liabilities 21 1,218.58 1,454.60 1,375.69 Provisions 18 751.46 504.91 454.10
2,729.30 1,985.90 13,362.58 Current liabilities Financial liabilities i. Borrowings 19 42,364.67 32,910.24 43,138.63 ii. Trade payables 20 27,665.20 25,420.74 33,206.25 iii. Other financial liabilities 21 1,773.61 5,707.37 8,726.48 Other current liabilities 22 337.55 992.82 905.99 Provisions 18 518.68 891.68 707.17
72,659.71 65,922.85 86,684.52 146,792.50 138,192.13 134,780.27
The accompanying notes are an integral part of financial statementsAs per our report of even date attached For and on behalf of Board For Kharabanda Associates Chartered Accountants
Sunil Kharabanda Lalit Seth Gautam Seth Proprietor Chairman and Managing Director Joint Managing Director M.No. : 082402 DIN- 00312007 DIN- 00203405F.R.N. : 003456N Vivek Kumar Sudhir Kumar Barik Place : New Delhi Company Secretary Chief Financial OfficerDated : 21.05.2018 M.No. A18491 M.No. 13243
HPL Electric & Power Limited
76
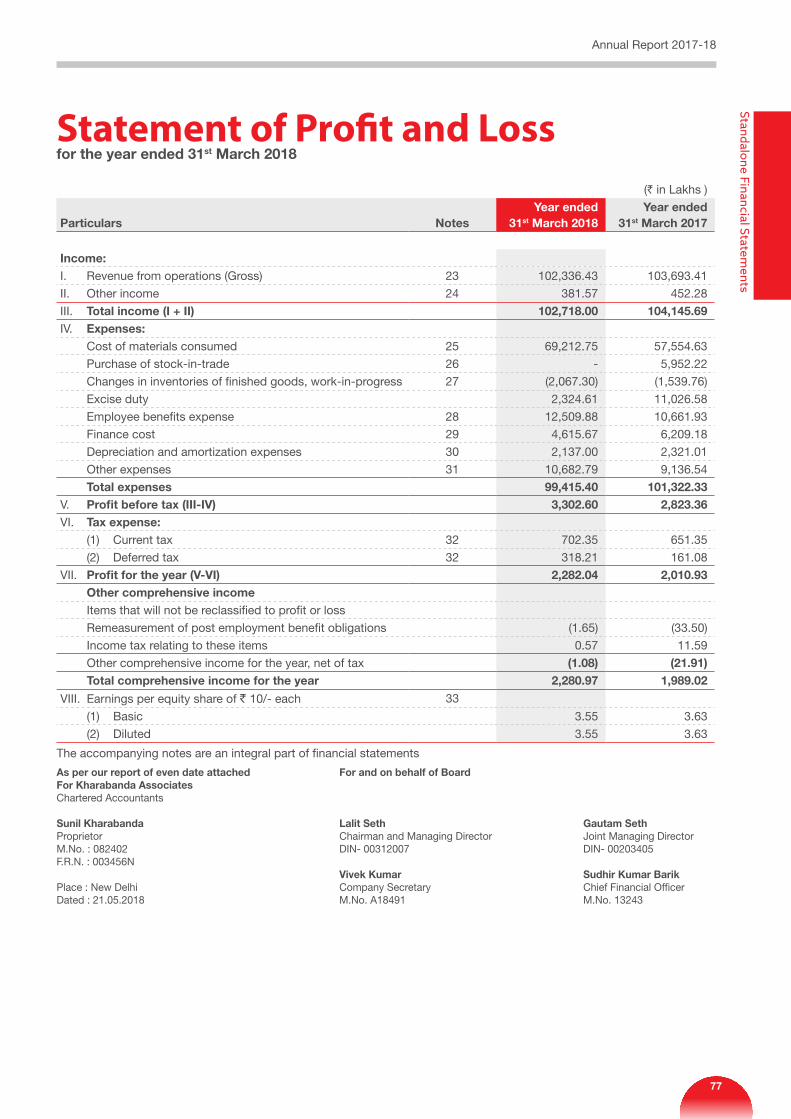
(` in Lakhs )
Particulars NotesYear ended
31st March 2018Year ended
31st March 2017
Income:I. Revenue from operations (Gross) 23 102,336.43 103,693.41
II. Other income 24 381.57 452.28
III. Total income (I + II) 102,718.00 104,145.69 IV. Expenses: Cost of materials consumed 25 69,212.75 57,554.63
Purchase of stock-in-trade 26 - 5,952.22
Changes in inventories of finished goods, work-in-progress 27 (2,067.30) (1,539.76)
Excise duty 2,324.61 11,026.58
Employee benefits expense 28 12,509.88 10,661.93
Finance cost 29 4,615.67 6,209.18
Depreciation and amortization expenses 30 2,137.00 2,321.01
Other expenses 31 10,682.79 9,136.54
Total expenses 99,415.40 101,322.33 V. Profit before tax (III-IV) 3,302.60 2,823.36 VI. Tax expense: (1) Current tax 32 702.35 651.35
(2) Deferred tax 32 318.21 161.08
VII. Profit for the year (V-VI) 2,282.04 2,010.93 Other comprehensive income Items that will not be reclassified to profit or loss
Remeasurement of post employment benefit obligations (1.65) (33.50)
Income tax relating to these items 0.57 11.59
Other comprehensive income for the year, net of tax (1.08) (21.91) Total comprehensive income for the year 2,280.97 1,989.02
VIII. Earnings per equity share of ` 10/- each 33
(1) Basic 3.55 3.63
(2) Diluted 3.55 3.63
The accompanying notes are an integral part of financial statements
Statement of Profit and Lossfor the year ended 31st March 2018
As per our report of even date attached For and on behalf of Board For Kharabanda Associates Chartered Accountants
Sunil Kharabanda Lalit Seth Gautam Seth Proprietor Chairman and Managing Director Joint Managing Director M.No. : 082402 DIN- 00312007 DIN- 00203405F.R.N. : 003456N Vivek Kumar Sudhir Kumar Barik Place : New Delhi Company Secretary Chief Financial OfficerDated : 21.05.2018 M.No. A18491 M.No. 13243
Annual Report 2017-18Standalone Financial Statem
ents
77
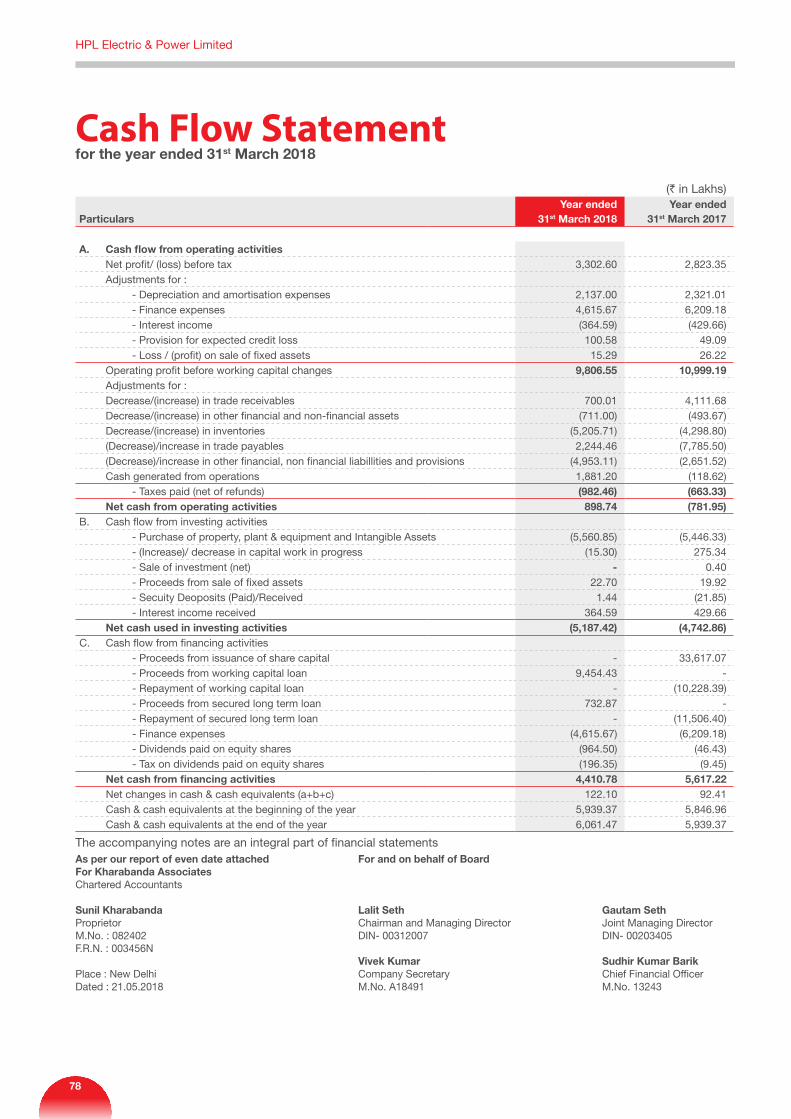
Cash Flow Statementfor the year ended 31st March 2018
(` in Lakhs)
ParticularsYear ended
31st March 2018 Year ended
31st March 2017
A. Cash flow from operating activities Net profit/ (loss) before tax 3,302.60 2,823.35 Adjustments for : - Depreciation and amortisation expenses 2,137.00 2,321.01 - Finance expenses 4,615.67 6,209.18 - Interest income (364.59) (429.66) - Provision for expected credit loss 100.58 49.09 - Loss / (profit) on sale of fixed assets 15.29 26.22 Operating profit before working capital changes 9,806.55 10,999.19 Adjustments for : Decrease/(increase) in trade receivables 700.01 4,111.68 Decrease/(increase) in other financial and non-financial assets (711.00) (493.67) Decrease/(increase) in inventories (5,205.71) (4,298.80) (Decrease)/increase in trade payables 2,244.46 (7,785.50) (Decrease)/increase in other financial, non financial liabillities and provisions (4,953.11) (2,651.52) Cash generated from operations 1,881.20 (118.62) - Taxes paid (net of refunds) (982.46) (663.33) Net cash from operating activities 898.74 (781.95)B. Cash flow from investing activities - Purchase of property, plant & equipment and Intangible Assets (5,560.85) (5,446.33) - (Increase)/ decrease in capital work in progress (15.30) 275.34 - Sale of investment (net) - 0.40 - Proceeds from sale of fixed assets 22.70 19.92 - Secuity Deoposits (Paid)/Received 1.44 (21.85) - Interest income received 364.59 429.66 Net cash used in investing activities (5,187.42) (4,742.86)C. Cash flow from financing activities - Proceeds from issuance of share capital - 33,617.07 - Proceeds from working capital loan 9,454.43 - - Repayment of working capital loan - (10,228.39) - Proceeds from secured long term loan 732.87 - - Repayment of secured long term loan - (11,506.40) - Finance expenses (4,615.67) (6,209.18) - Dividends paid on equity shares (964.50) (46.43) - Tax on dividends paid on equity shares (196.35) (9.45) Net cash from financing activities 4,410.78 5,617.22 Net changes in cash & cash equivalents (a+b+c) 122.10 92.41 Cash & cash equivalents at the beginning of the year 5,939.37 5,846.96 Cash & cash equivalents at the end of the year 6,061.47 5,939.37
The accompanying notes are an integral part of financial statements As per our report of even date attached For and on behalf of Board For Kharabanda Associates Chartered Accountants
Sunil Kharabanda Lalit Seth Gautam Seth Proprietor Chairman and Managing Director Joint Managing Director M.No. : 082402 DIN- 00312007 DIN- 00203405F.R.N. : 003456N Vivek Kumar Sudhir Kumar Barik Place : New Delhi Company Secretary Chief Financial OfficerDated : 21.05.2018 M.No. A18491 M.No. 13243
HPL Electric & Power Limited
78
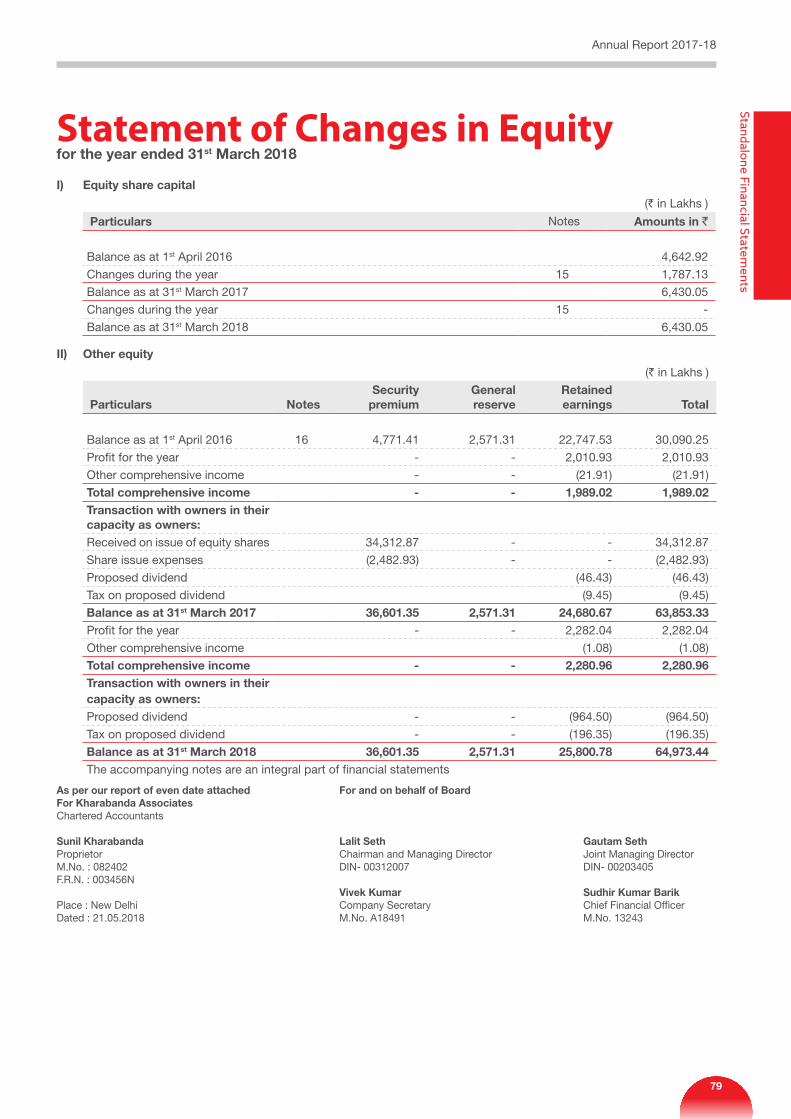
Statement of Changes in equityfor the year ended 31st March 2018
I) Equity share capital
(` in Lakhs )
Particulars Notes Amounts in `
Balance as at 1st April 2016 4,642.92
Changes during the year 15 1,787.13
Balance as at 31st March 2017 6,430.05
Changes during the year 15 -
Balance as at 31st March 2018 6,430.05
II) Other equity
(` in Lakhs )
Particulars Notes Security premium
General reserve
Retained earnings Total
Balance as at 1st April 2016 16 4,771.41 2,571.31 22,747.53 30,090.25
Profit for the year - - 2,010.93 2,010.93
Other comprehensive income - - (21.91) (21.91)
Total comprehensive income - - 1,989.02 1,989.02 Transaction with owners in their capacity as owners:Received on issue of equity shares 34,312.87 - - 34,312.87
Share issue expenses (2,482.93) - - (2,482.93)
Proposed dividend (46.43) (46.43)
Tax on proposed dividend (9.45) (9.45)
Balance as at 31st March 2017 36,601.35 2,571.31 24,680.67 63,853.33 Profit for the year - - 2,282.04 2,282.04
Other comprehensive income (1.08) (1.08)
Total comprehensive income - - 2,280.96 2,280.96 Transaction with owners in their capacity as owners:Proposed dividend - - (964.50) (964.50)
Tax on proposed dividend - - (196.35) (196.35)
Balance as at 31st March 2018 36,601.35 2,571.31 25,800.78 64,973.44 The accompanying notes are an integral part of financial statements
As per our report of even date attached For and on behalf of Board For Kharabanda Associates Chartered Accountants
Sunil Kharabanda Lalit Seth Gautam Seth Proprietor Chairman and Managing Director Joint Managing Director M.No. : 082402 DIN- 00312007 DIN- 00203405F.R.N. : 003456N Vivek Kumar Sudhir Kumar Barik Place : New Delhi Company Secretary Chief Financial OfficerDated : 21.05.2018 M.No. A18491 M.No. 13243
Annual Report 2017-18Standalone Financial Statem
ents
79
Note-1
COMPANY OVERVIEW
HPL Electric & Power Limited (Formerly HPL Electric & Power Private Limited) (‘the Company’) is a limited company domiciled in India and incorporated under the provisions of the Companies Act, 1956 having its registered office at 1/20, Asaf Ali Road, New Delhi. The Company is one of the leading players and India’s fastest growing electrical and power distribution equipment manufacturer with products ranging from Industrial and Domestic Circuit Protection Switchgears, Cables, Energy Saving Meters, CFL & LED Lamps and Luminaries for Domestic, Commercial and Industrial applications, Modular Switches covering the entire range of household, commercial and industrial electrical needs. The Company’s manufacturing facilities are located at 6 locations, 2 units at Gurgaon, 1 unit at village Bastara, Tehsil Gharaunda, Karnal, 1 unit at village Bhigan, Ganauar, Sonipat, 1 unit at Kundli in Haryana and 1 unit at village Shavela, Jabli in Himachal Pradesh.
The Company has R&D facilities located at Gurgaon and Kundli in Haryana, approved by Department of Scientific & Industrial Research (DSIR), Ministry of Science & Technology.
The Financial statements were approved by the Board of Directors for issue in accordance with resolution passed on May 21, 2018.
Note-2
SIGNIFICANT ACCOUNTING POLICIESThis note provides a list of the significant accounting policies adopted in the preparation of these financial statements. These policies have been consistently applied to all the years presented, unless otherwise stated.
A) Basis of Preparation i) Compliance with Ind AS The financial statements comply in all material
aspects with Indian Accounting Standards (Ind AS) notified under Section 133 of the Companies Act, 2013 (the Act)[Companies(Indian Accounting Standards) Rules, 2015] and other relevant provisions of the Act.
The financial statements up to year ended 31 March 2017 were prepared in accordance with the accounting standards notified under Companies (Accounting Standard) Rules, 2006 (as amended) (previous GAAP) and other relevant provisions of the Act.
These financial statements are the first financial statements of the Company under Ind AS. Refer note 41 for an explanation of how the transition from previous GAAP to Ind AS has affected the Company’s financial position, financial performance and cash flows.
ii) Historical cost convention The financial statements have been prepared on
a historical cost basis, except for certain financial assets and liabilities that are measured at fair value.
B) Property plant and equipment Freehold land is carried at cost. All other items of
property, plant and equipment are stated at cost less accumulated depreciation and accumulated impairment, if any. The cost comprises of purchase price, taxes, duties, freight and other incidental expenses directly attributable and related to acquisition and installation of the concerned assets and are further adjusted by the amount of CENVAT /GST/VAT credit availed wherever applicable. The present value of the expected cost for the decommissioning of an asset after its use is included in the cost of the respective asset if the recognition criteria for a provision are met.
Subsequent costs are included in the asset’s carrying amount or recognised as a separate asset, as appropriate, only when it is probable that future economic benefits associated with the item will flow to the Company and the cost of the item can be measured reliably. The carrying amount of any component accounted for as a separate asset is derecognised when replaced. All other repairs and maintenance are charged to profit or loss during the reporting period in which they are incurred.
Transition to Ind AS Under the previous GAAP (Indian GAAP), all assets were
carried in the Balance Sheet at cost, less accumulated depreciation and accumulated impairment losses, if any. On the date of transition to IND AS, all property, plant and equipment have been measured at fair value and same has been considered as deemed cost as at April 01, 2016 (date of transition) in accordance with Ind AS 101 First Time adoption.
Depreciation methods, estimated useful lives and residual value
Depreciation on buildings, machinery and equipments has been provided on straight-line basis over the estimated useful lives of the respective assets. Intangibale assets are amortised over their estimated useful economic lives on straight line basis. Freehold land and work in progress are not depreciated. The estimated useful lives considered for providing depreciation on other substantial assets are as follows:
Building- 35-45 years Plant & Machinery-15-25 years Computers-3-5 years Furniture & Fixtures-10-15 years Office Equipments-5-10 years Vehicles-8-10 years
notes to Accountsforming part of the Financial Statements as on March 31, 2018
HPL Electric & Power Limited
80
The residual values, useful lives and methods of depreciation of property, plant and equipment are reviewed at each financial year end and adjusted prospectively, if appropriate.
C) Intangible assets
Intangible assets acquired separately are measured on initial recognition at cost. Following initial recognition, intangible assets are carried at costless accumulated amortization and accumulated impairment losses, if any. Internally generated intangibles, excluding capitalized development cost, are not capitalized and the related expenditure is reflected in Statement of Profit and Loss in the period in which the expenditure is incurred. Cost comprises the purchase price and any attributable cost of bringing the asset to its working condition for its intended use.
Research and development cost Research expenditure and development expenditure
that do not meet the criteria as given in Ind AS-38 “Intangible Assets” are recognised as an expense as incurred. Development costs previously recognised as an expense are not recognised as an asset in a subsequent period.
Amortisation methods and periods The Company amortises intangible assets with a finite
useful life using the straight-line method over their estimated useful life of 3-6 years.
The amortization period and the amortization method for an intangible asset with a finite useful life is reviewed at least at the end of each reporting period. Changes in the expected useful life or the expected pattern of consumption of future economic benefits embodied in the asset is accounted for by changing the amortization period or method, as appropriate and are treated as changes in accounting estimates. The amortization expense on intangible assets with finite lives is recognised in the Statement of Profit and Loss.
Gains or losses arising from disposal of the intangible assets are measured as the difference between the net disposal proceeds and the carrying amount of the asset and are recognised in the Statement of Profit and Loss when the assets are disposed off.
Transition to Ind AS On transition to Ind AS, the Company has elected to
continue with the carrying value of all of intangible assets recognized as at 1 April 2016 measured as per the previous GAAP and use that carrying value as the deemed cost of intangible assets.
D) Impairment of non-financial assets The carrying amounts of the assets are reviewed at each
Balance sheet date for any indication of impairment based on internal/external factors. If any such indication exists, or when annual impairment testing for an asset is required, the Company estimates the asset’s
recoverable amount. An asset’s recoverable amount is the higher of an asset’s or cash-generating unit’s (CGU) fair value less costs of disposal and its value in use. Recoverable amount is determined for an individual asset, unless the asset does not generate cash inflows that are largely independent of those from other assets. Where the carrying amount of an asset or CGU exceeds its recoverable amount, the asset is considered impaired and is written down to its recoverable amount.
In assessing value in use, the estimated future cash flows are discounted to their present value using a pre-tax discount rate that reflects current market assessments of the time value of money and the risks specific to the asset. In determining fair value less costs of disposal, recent market transactions are taken into account, if available. If no such transactions can be identified, an appropriate valuation model is used. After impairment, depreciation is provided on the revised carrying amount of the asset over its remaining useful life.
Impairment losses including impairment on inventories are recognised in the Statement of Profit and Loss.
E) Financial Instruments i) Financial Assets A) Initial recognition and measurement All financial assets and liabilities are initially
recognised at fair value. Transaction costs that are directly attributable to the acquisition or issue of financial assets and financial liabilities, which are not at fair value through profit or loss, are adjusted to the fair value on initial recognition.
B) Subsequent measurement a) Financial assets carried at amortised
cost A financial asset is measured at
amortised cost if it is held within a business model whose objective is to hold the asset in order to collect contractual cash flows and the contractual terms of the financial asset give rise on specified dates to cash flows that are solely payments of principal and interest on the principal amount outstanding.
b) Financial assets carried at fair value through other comprehensive income (FVTOCI)
A financial asset is measured at FVTOCI if it is held within a business model whose objective is achieved by both collecting contractual cash flows and selling financial assets and the contractual terms of the financial asset give rise on specified dates to cash flows that are solely payments of principal and interest on the principal amount outstanding.
Annual Report 2017-18Standalone Financial Statem
ents
81
c) Financial assets carried at fair value through profit or loss (FVTPL)
A financial asset which is not classified in any of the above categories are measured at FVTPL.
C) Investment in subsidiaries The Company has accounted for its
investments in subsidiary at cost.
D) Other Equity Investments All other equity investments are measured
at fair value with changes in fair value recognised in statement of profit and loss except for those equity investments for which the Company has elected to present the value changes in ‘Other Comprehensive Income’.
E) Impairment of financial assets In accordance with Ind AS 109, the Company
uses ‘Expected Credit Loss’ (ECL) model, for evaluating impairment of financial assets other than those measured at fair value through profit and loss (FVTPL).
Expected credit losses are measured through a loss allowance at an amount equal to:
• The 12 months expected creditlosses(expected credit losses that result from those default events on the financial instrument that are possible within 12 months after the reporting date; or
• Full lifetime expected credit losses(expected credit losses that result from all possible default events over the life of the financial instrument).
For trade receivables Company applies ‘simplified approach’ which requires expected lifetime losses to be recognised from initial recognition of the receivables. The Company uses historical default rates to determine impairment loss on the portfolio of trade receivables. At every reporting date these historical default rates are reviewed and changes in the forward looking estimates are analysed.
For other assets, the Company uses 12 month ECL to provide for impairment loss where there is no significant increase in credit risk. If there is significant increase in credit risk full lifetime ECL is used.
ii) Financial Liabilities A) Initial recognition and measurement All financial liabilities are recognised at fair
value and in case of loans net of directly attributable cost. Fees of recurring nature are directly recognised in the Statement of Profit and Loss as finance cost.
B) Subsequent measurement Financial liabilities are carried at amortised
cost using the effective interest rate method (EIR). Amortised cost is calculated by taking into account any discount or premium on acquisition and fees or costs that are an integral part of EIR. The EIR amortisation is included as finance costs in the Statement of Profit and Loss. For trade and other payables maturing within one year from the balance sheet date, the carrying amounts approximate fair value due to the short maturity of these instruments.
F) Income recognition Interest income Interest income from debt instruments
is recognised using the effective interest rate method. The effective interest rate is the rate that exactly discounts estimated future cash receipts through the expected life of the financial asset to the gross carrying amount of a financial asset. When calculating the effective interest rate, the Company estimates the expected cash flows by considering all the contractual terms of the financial instrument (for example, prepayment, extension, call and similar options) but does not consider the expected credit losses.
Dividends Dividends are recognised in profit or loss
only when the right to receive payment is established, it is probable that the economic benefits associated with the dividend will flow to the Company, and the amount of the dividend can be measured reliably.
F) Inventories Raw materials and stores, work in progress, traded
and finished goods are stated at the lower of cost and net realisable value. Cost of raw materials and traded goods comprises cost of purchases. Cost of work-in-progress and finished goods comprises direct materials, direct labour and an appropriate proportion of variable and fixed overhead expenditure, the latter being allocated on the basis of normal operating capacity. Cost of inventories also include all other costs incurred in bringing the inventories to their present location and condition. Costs are assigned to individual items of inventory on the basis of weighted average cost basis. Costs of purchased inventory are determined after deducting rebates and discounts. Net realisable value is the estimated selling price in the ordinary course of business less the estimated costs
HPL Electric & Power Limited
82
of completion and the estimated costs necessary to make the sale.
G) Revenue Recognition
Revenue from the sales of goods is recognised when the significant risks and rewards of ownership of the goods have passed to the buyer, which is usually at the time of delivery of goods to the customer. Revenue from sale of goods is measured at fair value of consideration received /receivable, net of returns, trade allowances, rebates, value added taxes, Goods and Service Tax (GST) and amounts collected on behalf of third parties. Revenue is recognised when it is probable that economic benefits associated with the transaction will flow to the entity, amount of revenue can be measured reliably and entity retains neither continuing managerial involvement to the degree usually associated with ownership nor effective control over the goods sold.
H) Employee Benefits (i) Short-term obligations Liabilities for wages and salaries, including non-
monetary benefits that are expected to be settled wholly within 12 months after the end of the period in which the employees render the related service are recognised in respect of employees’ services up to the end of the reporting period and are measured at the amounts expected to be paid when the liabilities are settled.
(ii) Post-Employment Benefits Defined Contribution Plan: A defined contribution
plan is a post-employment benefit plan under which the Company pays specified contributions to a separately entity. The Company has defined contribution plans for the post-employment benefits namely provident fund scheme. The Company’s contribution in the above plans is recognised as an expense in the Statement of Profit and Loss during the year in which the employee renders the related service.
Defined Benefit Plans: The Company has defined benefit plan namely Gratuity for employees. The liability in respect of gratuity plans is calculated annually by independent actuary using the projected unit credit method. The Company recognises the following changes in the net defined benefit obligation under Employee benefits expense in statement of profit or loss:
• Service costs comprising current servicecosts, past service costs , gains and losses on curtailment and non-routine-settlements
• NetInterestexpense
Remeasurement gains and losses arising from experience adjustments and changes in actuarial assumptions are recognised in the period in
which they occur, directly in Other comprehensive income. They are included in retained earnings in the Statement of Changes in Equity and in the Balance Sheet. Remeasurements are not reclassified to profit or loss in subsequent periods.
Termination benefits are recognized as an expense immediately.
I) Borrowing Cost General and specific borrowing costs that are
directly attributable to the acquisition, construction or production of a qualifying asset are capitalised during the period of time that is required to complete and prepare the asset for its intended use or sale. Qualifying assets are assets that necessarily take a substantial period of time to get ready for their intended use or sale.
Investment income earned on the temporary investment of specific borrowings pending their expenditure on qualifying assets is deducted from the borrowing costs eligible for capitalisation.
Other borrowing costs are expensed in the period in which they are incurred.
J) Income Tax The income tax expense or credit for the period is the
tax payable on the current period’s taxable income based on the applicable income tax rate adjusted by changes in deferred tax assets and liabilities attributable to temporary differences and to unused tax losses.
The current income tax charge is calculated on the basis of the tax laws enacted or substantively enacted at the end of the reporting period. Management periodically evaluates positions taken in tax returns with respect to situations in which applicable tax regulation is subject to interpretation. It establishes provisions where appropriate on the basis of amounts expected to be paid to the tax authorities.
Deferred income tax is provided in full, using the liability method, on temporary differences arising between the tax bases of assets and liabilities and their carrying amounts in the financial statements. Deferred income tax is also not accounted for if it arises from initial recognition of an asset or liability in a transaction other than a business combination that at the time of the transaction affects neither accounting profit nor taxable profit (tax loss). Deferred income tax is determined using tax rates (and laws) that have been enacted or substantially enacted by the end of the reporting period and are expected to apply when the related deferred income tax asset is realised or the deferred income tax liability is settled.
Deferred tax assets are recognised for all deductible temporary differences and unused tax losses only
Annual Report 2017-18Standalone Financial Statem
ents
83
if it is probable that future taxable amounts will be available to utilise those temporary differences and losses.
Deferred tax assets and liabilities are offset when there is a legally enforceable right to offset current tax assets and liabilities and when the deferred tax balances relate to the same taxation authority. Current tax assets and tax liabilities are offset where the entity has a legally enforceable right to offset and intends either to settle on a net basis, or to realise the asset and settle the liability simultaneously.
Current and deferred tax is recognised in profit or loss, except to the extent that it relates to items recognised in other comprehensive income or directly in equity. In this case, the tax is also recognised in other comprehensive income or directly in equity, respectively.
K) Lease Leases of property, plant and equipment where the
Company, as lessee, has substantially all the risks and rewards of ownership are classified as finance leases. Finance leases are capitalised at the lease’s inception at the fair value of the leased property or, if lower, the present value of the minimum lease payments. The corresponding rental obligations, net of finance charges, are included in borrowings or other financial liabilities as appropriate. Each lease payment is allocated between the liability and finance cost. The finance cost is charged to the profit or loss over the lease period so as to produce a constant periodic rate of interest on the remaining balance of the liability for each period.
Leases in which a significant portion of the risks and rewards of ownership are not transferred to the Company as lessee are classified as operating leases. Payments made under operating leases (net of any incentives received from the lessor) are charged to profit or loss on a straight-line basis over the period of the lease unless the payments are structured to increase in line with expected general inflation to compensate for the lessor’s expected inflationary cost increases.
L) Foreign Currency Transactions Items included in the financial statements of the
Company are measured using the currency of the primary economic environment in which the entity operates (‘the functional currency’). The financial statements are presented in Indian rupee (INR), which is the Company’s functional and presentation currency.
Foreign currency transactions are translated into the functional currency using the exchange rates at the dates of the transactions. Foreign exchange gains and losses resulting from the settlement of such transactions and from the translation of monetary
assets and liabilities denominated in foreign currencies at year end exchange rates are generally recognised in profit or loss.
M) Earnings Per Share (i) Basic earnings per share Basic earnings per share is calculated by
dividing: • the profit attributable to owners of the
Company
• by theweightedaveragenumberof equityshares outstanding during the financial year.
(ii) Diluted earnings per share Diluted earnings per share adjusts the figures
used in the determination of basic earnings per share to take into account:
• the after income tax effect of interest andother financing costs associated with dilutive potential equity shares, wherever applicable, and
• theweightedaveragenumberofadditionalequity shares that would have been outstanding assuming the conversion of all dilutive potential equity shares.
N) Provisions and Contingent liabilities
Provisions for legal claims, service warranties, volume discounts and returns are recognised when the Company has a present legal or constructive obligation as a result of past events, it is probable that an outflow of resources will be required to settle the obligation and the amount can be reliably estimated. Provisions are not recognised for future operating losses.
Provisions are measured at the present value of management’s best estimate of the expenditure required to settle the present obligation at the end of the reporting period. The discount rate used to determine the present value is a pre-tax rate that reflects current market assessments of the time value of money and the risks specific to the liability. The increase in the provision due to the passage of time is recognised as interest expense.
A contingent liability is possible obligation that arises from past events whose existence will be confirmed by the occurrence or non-occurrence of one or more uncertain future events beyond the control of the Company or a present obligation that is not recognised because it is not probable that an outflow of resources will be required to settle the obligation. A contingent liability also arises in extremely rare cases, where there is a liability that cannot be recognised because it cannot be measured reliably. The Company does not recognise a contingent liability but disclose its existence in the financial statements unless the probability of outflow of resource is remote.
HPL Electric & Power Limited
84
O) Government Grant Grants from the government are recognised at their
fair value where there is a reasonable assurance that the grant will be received and the Company will comply with all attached conditions.
Government grants relating to income are deferred and recognised in the profit or loss over the period necessary to match them with the costs that they are intended to compensate and presented within other income.
Government grants relating to the purchase of property, plant and equipment are included in non-current liabilities as deferred income and are credited to profit or loss on a straight-line basis over the expected lives of the related assets and presented within other income.
P) Segment Reporting Operating segments are reported in a manner
consistent with the internal reporting provided to the Chief operating decision maker (CODM). CODM monitors the operating results of all strategic business units separately for the purpose of making decisions about resource allocation and performance assessment. Segment performance is evaluated based on profit and loss and is measured consistently with profit and loss in the financial statements.
Q) Contributed equity Equity shares are classified as equity.
Incremental costs directly attributable to the issue of new shares or options are shown in equity as a deduction, net of tax, from the proceeds.
R) Dividends Provision is made for the amount of any dividend
declared, being appropriately authorised and no longer at the discretion of the entity, on or before the end of the reporting period but not distributed at the end of the reporting period.
S) Cash and Cash Equivalents For the purpose of presentation in the Statement
of Cash flows, Cash and Cash equivalents includes cash on hand, deposits held at call, other short-term, highly liquid investments with original maturities of three months or less that are readily convertible to known amounts of cash and which are subject to an insignificant risk of changes in value, and bank overdrafts. Bank overdrafts are shown within borrowings in current liabilities in the Balance Sheet.
T) Offsetting financial instruments Financial assets and financial liabilities are offset
and the net amount is reported in the Balance Sheet where there is a legally enforceable right to offset the recognised amounts and there is an intention to settle on a net basis or realise the asset and settle the liability simultaneously. The legally enforceable right
must not be contingent on future events and must be enforceable in the normal course of business and in the event of default, insolvency or bankruptcy of the Company or the counterparty.
U) Rounding of amounts All amounts disclosed in the financial statements and
notes have been rounded off to the nearest lakhs as per the requirement of Schedule III, unless otherwise stated.
V) Recent accounting pronouncements Ind AS 115 – Revenue from Contracts with Customers
The Ministry of Corporate Affairs (MCA) has notified the Companies (Indian Accounting Standards) Amendment Rules, 2018 on 28 March 2018 which includes Ind AS 115 ‘Revenue from Contracts with Customers’. This will replace IAS 18 which covers contracts for goods and services and IAS 11 which covers construction contracts.
Ind AS 115 – Revenue from contracts with Customers outlines a single comprehensive model for entities to use in accounting for revenue arising from contracts with customers. The standard replaces most current revenue recognition guidance. The core principle of the new standard is for companies to recognize revenue to depict the transfer of goods or services to customers in amounts that reflect the consideration to which the Group expects to be entitled in exchange for those goods or services. The new standard also will result in enhanced disclosures about revenue, provide guidance for transactions that were not previously addressed comprehensively including service revenues and contract modifications and improve guidance for multiple-element arrangements.
The new standard will come into effect for the annual reporting periods beginning on or after 1 April 2018. The standard permits either a full retrospective or a modified retrospective approach for the adoption.
The Company is in the process of evaluating the impact of the new standard on the Company’s financial statements.
W) Significant accounting judgements, estimates and assumptions
The preparation of the Company’s financial statements requires management to make judgements, estimates and assumptions that affect the reported amounts of revenues, expenses, assets and liabilities, and the accompanying disclosures. Uncertainty about these assumptions and estimates could result in outcomes that require a material adjustment to the carrying amount of the assets or liabilities affected in future periods.
Judgements, Estimates and assumptions The key assumptions concerning the future and other
key sources of estimation uncertainty at the reporting
Annual Report 2017-18Standalone Financial Statem
ents
85
date, that have a significant risk of causing a material adjustment to the carrying amounts of assets and liabilities within the next financial year, are described below. The Company based its assumptions and estimates on parameters available when the financial statements were prepared. Existing circumstances and assumptions about future developments, however, may change due to market changes or circumstances arising beyond the control of the Company. Such changes are reflected in the assumptions when they occur.
a) Defined benefit plan-Gratuity The cost of defined benefit plans (i.e. Gratuity
benefit) is determined using actuarial valuations. An actuarial valuation involves making various assumptions which may differ from actual developments in the future. These include the determination of the discount rate, future salary increases, mortality rates and future pension increases. Due to the complexity of the valuation, the underlying assumptions and its long-term nature, a defined benefit obligation is highly sensitive to changes in these assumptions. All assumptions are reviewed at each reporting date. In determining the appropriate discount rate, management considers the interest rates of long term government bonds with extrapolated maturity corresponding to the expected duration of the defined benefit obligation. The mortality rate is based on publicly available mortality tables for the specific countries. Future salary increases and pension increases are based on expected future inflation rates for the respective countries. Further details about the assumptions used, including a sensitivity analysis, are given in Note 38.
b) Impairment of Financial assets The impairment provisions of financial assets
are based on assumptions about risk of default and expected loss rates. The Company uses judgement in making these assumptions and selecting the inputs to the impairment calculation, based on Company’s past history, existing market conditions as well as forward looking estimates at the end of each reporting period.
c) Warranty provision Warranty Provisions are measured at discounted
present value using pre-tax discount rate that
reflects the current market assessments of the time value of money and the risks specific to the liability. Warranty provisions is determined based on the historical percentage of warranty expense to sales for the same types of goods for which the warranty is currently being determined. The same percentage to the sales is applied for the current accounting period to derive the warranty expense to be accrued. It is adjusted to account for unusual factors related to the goods that were sold, such as defective inventory lying at the depots. It is very unlikely that actual warranty claims will exactly match the historical warranty percentage, so such estimates are reviewed annually for any material changes in assumptions and likelihood of occurrence.
d) Depreciation/amortisation and useful lives of property plant and equipment/intangible assets
Property, plant and equipment / Intangible assets are depreciated /amortised over their estimated useful lives, after taking into account estimated residual values. Management reviews the estimated useful lives and residual values of the assets annually in order to determine the amount of depreciation / amortisation to be recorded during any reporting period. The useful lives and residual values are based on the Company’s historical experience with similar assets and take into account anticipated technological changes. The depreciation/amortisation for future period is revised if there are significant changes from previous estimates.
e) Provisions Provisions and liabilities are recognised in the
period when it becomes probable that there will be a future outflow of funds resulting from past operations or events and the amount of cash outflow can be reliably estimated. The timing of recognition and quantification of the liability requires the application of judgment to existing facts and circumstances, which can be subject to change. The carrying amounts of provisions and liabilities are reviewed regularly and revised to take account of changing facts and circumstances.
HPL Electric & Power Limited
86
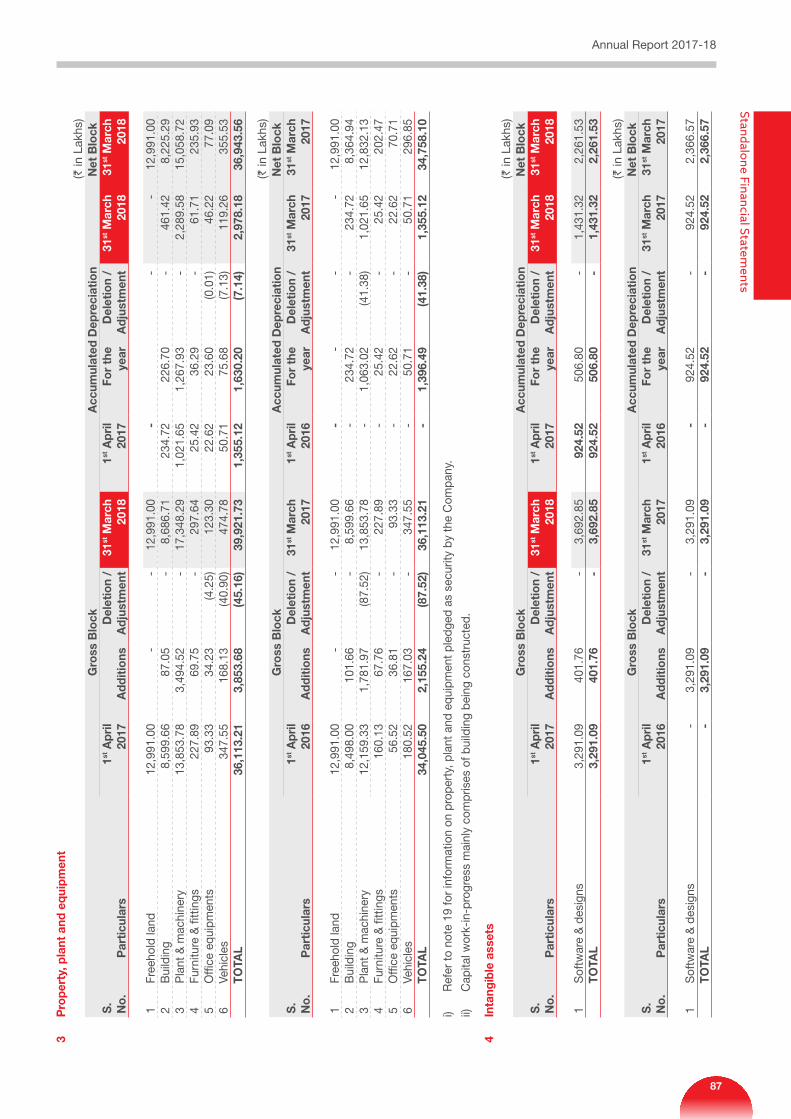
3 P
rope
rty,
pla
nt a
nd e
quip
men
t (`
in L
akhs
) G
ross
Blo
ck
Acc
umul
ated
Dep
reci
atio
n N
et B
lock
S
.N
o.
Par
ticul
ars
1st A
pril
2017
Add
ition
sD
elet
ion
/ A
djus
tmen
t31
st M
arch
20
181st
Apr
il 20
17Fo
r th
e ye
arD
elet
ion
/ A
djus
tmen
t31
st M
arch
20
1831
st M
arch
20
18
1 Fr
eeho
ld la
nd 1
2,99
1.00
-
-
1
2,99
1.00
-
-
-
1
2,99
1.00
2
Bui
ldin
g 8
,599
.66
87.
05
-
8,6
86.7
1 2
34.7
2 2
26.7
0 -
4
61.4
2 8
,225
.29
3 P
lant
& m
achi
nery
1
3,85
3.78
3
,494
.52
-
17,
348.
29
1,0
21.6
5 1
,267
.93
-
2,2
89.5
8 1
5,05
8.72
4
Furn
iture
& fi
ttin
gs 2
27.8
9 6
9.75
-
2
97.6
4 2
5.42
3
6.29
-
6
1.71
2
35.9
3 5
Offi
ce e
quip
men
ts 9
3.33
3
4.23
(4
.25)
123
.30
22.
62
23.
60
(0.0
1) 4
6.22
7
7.09
6
Vehi
cles
347
.55
168
.13
(40.
90)
474
.78
50.
71
75.
68
(7.1
3) 1
19.2
6 3
55.5
3 TO
TAL
36,
113.
21
3,8
53.6
8 (4
5.16
) 3
9,92
1.73
1
,355
.12
1,6
30.2
0 (7
.14)
2,9
78.1
8 3
6,94
3.56
(` in
Lak
hs)
Gro
ss B
lock
A
ccum
ulat
ed D
epre
ciat
ion
Net
Blo
ck
S.
No.
P
artic
ular
s1st
Apr
il 20
16A
dditi
ons
Del
etio
n /
Adj
ustm
ent
31st M
arch
20
171st
Apr
il 20
16Fo
r th
e ye
arD
elet
ion
/ A
djus
tmen
t31
st M
arch
20
1731
st M
arch
20
17
1 Fr
eeho
ld la
nd 1
2,99
1.00
-
-
1
2,99
1.00
-
-
-
-
1
2,99
1.00
2
Bui
ldin
g 8
,498
.00
101
.66
-
8,5
99.6
6 -
2
34.7
2 -
2
34.7
2 8
,364
.94
3 P
lant
& m
achi
nery
1
2,15
9.33
1
,781
.97
(87.
52)
13,
853.
78
-
1,0
63.0
2 (4
1.38
) 1
,021
.65
12,
832.
13
4 Fu
rnitu
re &
fitt
ings
160
.13
67.
76
-
227
.89
-
25.
42
-
25.
42
202
.47
5 O
ffice
equ
ipm
ents
56.
52
36.
81
-
93.
33
-
22.
62
-
22.
62
70.
71
6 Ve
hicl
es 1
80.5
2 1
67.0
3 -
3
47.5
5 -
5
0.71
-
5
0.71
2
96.8
5 TO
TAL
34,
045.
50
2,1
55.2
4 (8
7.52
) 3
6,11
3.21
-
1
,396
.49
(41.
38)
1,3
55.1
2 3
4,75
8.10
i)
Ref
er to
not
e 19
for
info
rmat
ion
on p
rope
rty,
pla
nt a
nd e
quip
men
t ple
dged
as
secu
rity
by th
e C
ompa
ny.
ii)
C
apita
l wor
k-in
-pro
gres
s m
ainl
y co
mpr
ises
of b
uild
ing
bein
g co
nstr
ucte
d.
4 In
tang
ible
ass
ets
(` in
Lak
hs)
Gro
ss B
lock
A
ccum
ulat
ed D
epre
ciat
ion
Net
Blo
ck
S.
No.
P
artic
ular
s1st
Apr
il 20
17A
dditi
ons
Del
etio
n /
Adj
ustm
ent
31st M
arch
20
181st
Apr
il 20
17Fo
r th
e ye
arD
elet
ion
/ A
djus
tmen
t31
st M
arch
20
1831
st M
arch
20
18
1 S
oftw
are
& d
esig
ns 3
,291
.09
401
.76
-
3,6
92.8
5 9
24.5
2 5
06.8
0 -
1
,431
.32
2,2
61.5
3 TO
TAL
3,2
91.0
9 4
01.7
6 -
3
,692
.85
924
.52
506
.80
-
1,4
31.3
2 2
,261
.53
(` in
Lak
hs)
Gro
ss B
lock
A
ccum
ulat
ed D
epre
ciat
ion
Net
Blo
ck
S.
No.
P
artic
ular
s1st
Apr
il 20
16A
dditi
ons
Del
etio
n /
Adj
ustm
ent
31st M
arch
20
171st
Apr
il 20
16Fo
r th
e ye
arD
elet
ion
/ A
djus
tmen
t31
st M
arch
20
1731
st M
arch
20
17
1 S
oftw
are
& d
esig
ns -
3
,291
.09
-
3,2
91.0
9 -
9
24.5
2 -
9
24.5
2 2
,366
.57
TOTA
L -
3
,291
.09
-
3,2
91.0
9 -
9
24.5
2 -
9
24.5
2 2
,366
.57
Annual Report 2017-18Standalone Financial Statem
ents
87
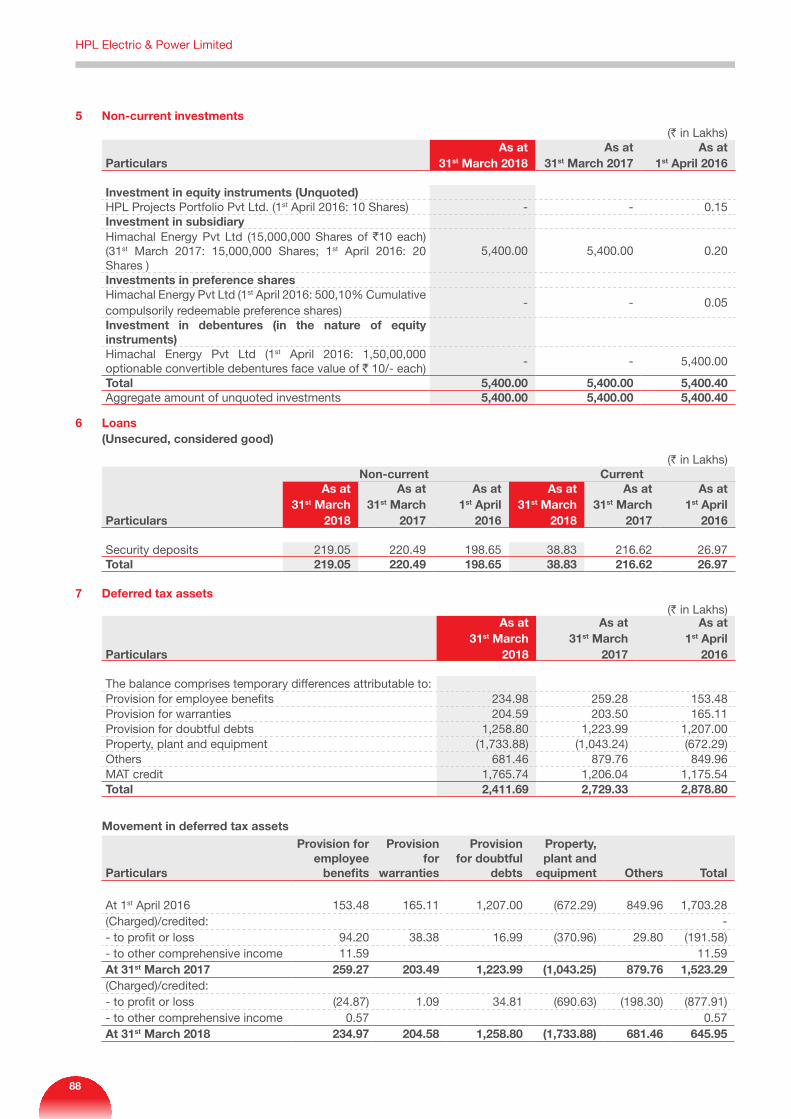
5 Non-current investments(` in Lakhs)
ParticularsAs at
31st March 2018As at
31st March 2017As at
1st April 2016
Investment in equity instruments (Unquoted)HPL Projects Portfolio Pvt Ltd. (1st April 2016: 10 Shares) - - 0.15 Investment in subsidiaryHimachal Energy Pvt Ltd (15,000,000 Shares of `10 each)(31st March 2017: 15,000,000 Shares; 1st April 2016: 20 Shares )
5,400.00 5,400.00 0.20
Investments in preference sharesHimachal Energy Pvt Ltd (1st April 2016: 500,10% Cumulative compulsorily redeemable preference shares)
- - 0.05
Investment in debentures (in the nature of equity instruments)Himachal Energy Pvt Ltd (1st April 2016: 1,50,00,000 optionable convertible debentures face value of ` 10/- each)
- - 5,400.00
Total 5,400.00 5,400.00 5,400.40 Aggregate amount of unquoted investments 5,400.00 5,400.00 5,400.40
6 Loans (Unsecured, considered good)
(` in Lakhs)
Particulars
Non-current CurrentAs at
31st March 2018
As at 31st March
2017
As at 1st April
2016
As at 31st March
2018
As at 31st March
2017
As at 1st April
2016
Security deposits 219.05 220.49 198.65 38.83 216.62 26.97 Total 219.05 220.49 198.65 38.83 216.62 26.97
7 Deferred tax assets(` in Lakhs)
Particulars
As at 31st March
2018
As at 31st March
2017
As at 1st April
2016
The balance comprises temporary differences attributable to:Provision for employee benefits 234.98 259.28 153.48 Provision for warranties 204.59 203.50 165.11 Provision for doubtful debts 1,258.80 1,223.99 1,207.00 Property, plant and equipment (1,733.88) (1,043.24) (672.29)Others 681.46 879.76 849.96 MAT credit 1,765.74 1,206.04 1,175.54 Total 2,411.69 2,729.33 2,878.80
Movement in deferred tax assets
Particulars
Provision for employee
benefits
Provision for
warranties
Provision for doubtful
debts
Property, plant and
equipment Others Total
At 1st April 2016 153.48 165.11 1,207.00 (672.29) 849.96 1,703.28 (Charged)/credited: - - to profit or loss 94.20 38.38 16.99 (370.96) 29.80 (191.58)- to other comprehensive income 11.59 11.59 At 31st March 2017 259.27 203.49 1,223.99 (1,043.25) 879.76 1,523.29 (Charged)/credited:- to profit or loss (24.87) 1.09 34.81 (690.63) (198.30) (877.91)- to other comprehensive income 0.57 0.57 At 31st March 2018 234.97 204.58 1,258.80 (1,733.88) 681.46 645.95
HPL Electric & Power Limited
88
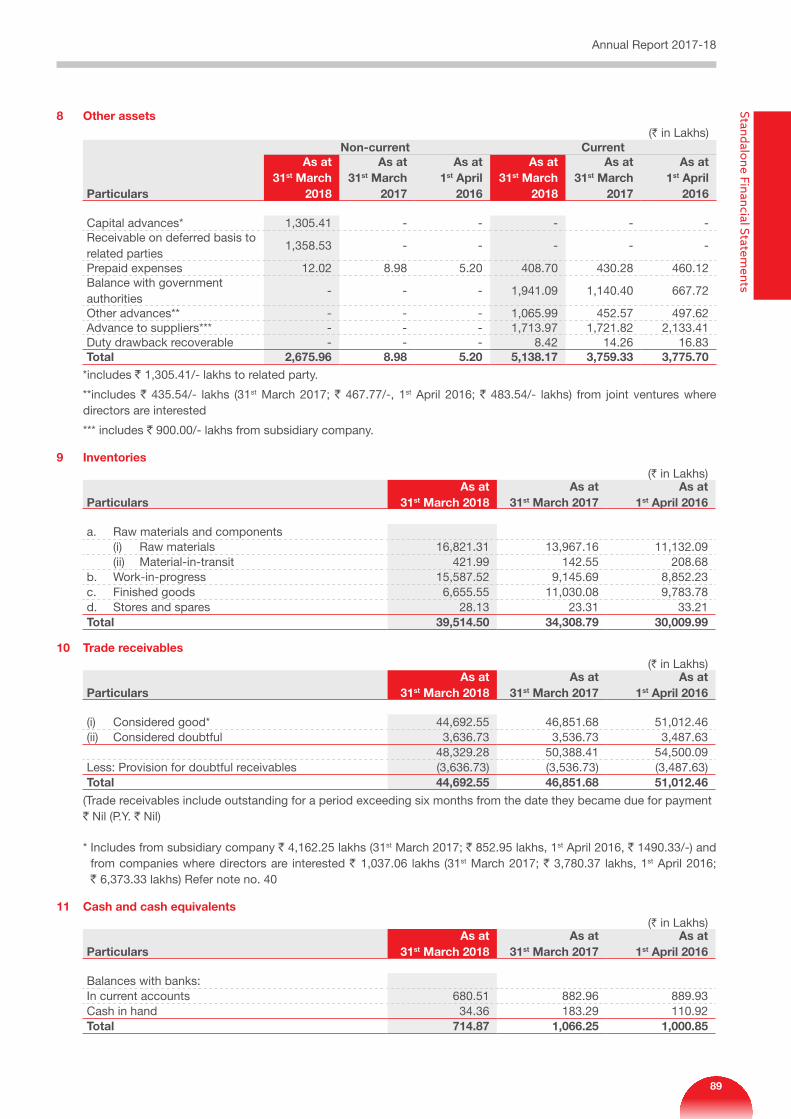
8 Other assets(` in Lakhs)
Particulars
Non-current CurrentAs at
31st March 2018
As at 31st March
2017
As at 1st April
2016
As at 31st March
2018
As at 31st March
2017
As at 1st April
2016
Capital advances* 1,305.41 - - - - - Receivable on deferred basis to related parties
1,358.53 - - - - -
Prepaid expenses 12.02 8.98 5.20 408.70 430.28 460.12 Balance with government authorities
- - - 1,941.09 1,140.40 667.72
Other advances** - - - 1,065.99 452.57 497.62 Advance to suppliers*** - - - 1,713.97 1,721.82 2,133.41 Duty drawback recoverable - - - 8.42 14.26 16.83 Total 2,675.96 8.98 5.20 5,138.17 3,759.33 3,775.70
*includes ` 1,305.41/- lakhs to related party.
**includes ` 435.54/- lakhs (31st March 2017; ` 467.77/-, 1st April 2016; ` 483.54/- lakhs) from joint ventures where directors are interested
*** includes ` 900.00/- lakhs from subsidiary company.
9 Inventories(` in Lakhs)
ParticularsAs at
31st March 2018As at
31st March 2017As at
1st April 2016
a. Raw materials and components (i) Raw materials 16,821.31 13,967.16 11,132.09 (ii) Material-in-transit 421.99 142.55 208.68 b. Work-in-progress 15,587.52 9,145.69 8,852.23 c. Finished goods 6,655.55 11,030.08 9,783.78 d. Stores and spares 28.13 23.31 33.21 Total 39,514.50 34,308.79 30,009.99
10 Trade receivables(` in Lakhs)
ParticularsAs at
31st March 2018As at
31st March 2017As at
1st April 2016
(i) Considered good* 44,692.55 46,851.68 51,012.46 (ii) Considered doubtful 3,636.73 3,536.73 3,487.63
48,329.28 50,388.41 54,500.09 Less: Provision for doubtful receivables (3,636.73) (3,536.73) (3,487.63)Total 44,692.55 46,851.68 51,012.46
(Trade receivables include outstanding for a period exceeding six months from the date they became due for payment ` Nil (P.Y. ` Nil)
* Includes from subsidiary company ` 4,162.25 lakhs (31st March 2017; ` 852.95 lakhs, 1st April 2016, ` 1490.33/-) and from companies where directors are interested ` 1,037.06 lakhs (31st March 2017; ` 3,780.37 lakhs, 1st April 2016; ` 6,373.33 lakhs) Refer note no. 40
11 Cash and cash equivalents(` in Lakhs)
ParticularsAs at
31st March 2018As at
31st March 2017As at
1st April 2016
Balances with banks:In current accounts 680.51 882.96 889.93 Cash in hand 34.36 183.29 110.92 Total 714.87 1,066.25 1,000.85
Annual Report 2017-18Standalone Financial Statem
ents
89
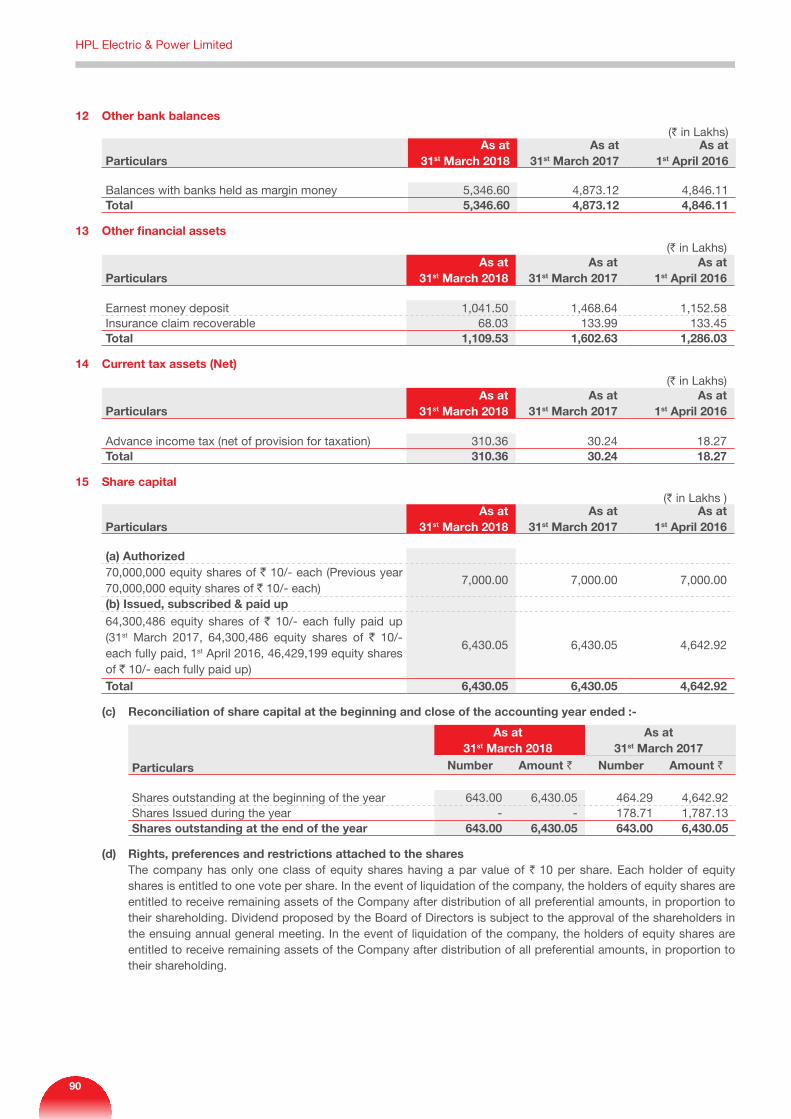
12 Other bank balances(` in Lakhs)
ParticularsAs at
31st March 2018As at
31st March 2017As at
1st April 2016
Balances with banks held as margin money 5,346.60 4,873.12 4,846.11 Total 5,346.60 4,873.12 4,846.11
13 Other financial assets(` in Lakhs)
ParticularsAs at
31st March 2018As at
31st March 2017As at
1st April 2016
Earnest money deposit 1,041.50 1,468.64 1,152.58 Insurance claim recoverable 68.03 133.99 133.45 Total 1,109.53 1,602.63 1,286.03
14 Current tax assets (Net)(` in Lakhs)
ParticularsAs at
31st March 2018As at
31st March 2017As at
1st April 2016
Advance income tax (net of provision for taxation) 310.36 30.24 18.27 Total 310.36 30.24 18.27
15 Share capital(` in Lakhs )
ParticularsAs at
31st March 2018As at
31st March 2017As at
1st April 2016
(a) Authorized70,000,000 equity shares of ` 10/- each (Previous year 70,000,000 equity shares of ` 10/- each)
7,000.00 7,000.00 7,000.00
(b) Issued, subscribed & paid up64,300,486 equity shares of ` 10/- each fully paid up (31st March 2017, 64,300,486 equity shares of ` 10/- each fully paid, 1st April 2016, 46,429,199 equity shares of ` 10/- each fully paid up)
6,430.05 6,430.05 4,642.92
Total 6,430.05 6,430.05 4,642.92
(c) Reconciliation of share capital at the beginning and close of the accounting year ended :-
Particulars
As at 31st March 2018
As at 31st March 2017
Number Amount ` Number Amount `
Shares outstanding at the beginning of the year 643.00 6,430.05 464.29 4,642.92 Shares Issued during the year - - 178.71 1,787.13 Shares outstanding at the end of the year 643.00 6,430.05 643.00 6,430.05
(d) Rights, preferences and restrictions attached to the shares The company has only one class of equity shares having a par value of ` 10 per share. Each holder of equity
shares is entitled to one vote per share. In the event of liquidation of the company, the holders of equity shares are entitled to receive remaining assets of the Company after distribution of all preferential amounts, in proportion to their shareholding. Dividend proposed by the Board of Directors is subject to the approval of the shareholders in the ensuing annual general meeting. In the event of liquidation of the company, the holders of equity shares are entitled to receive remaining assets of the Company after distribution of all preferential amounts, in proportion to their shareholding.
HPL Electric & Power Limited
90
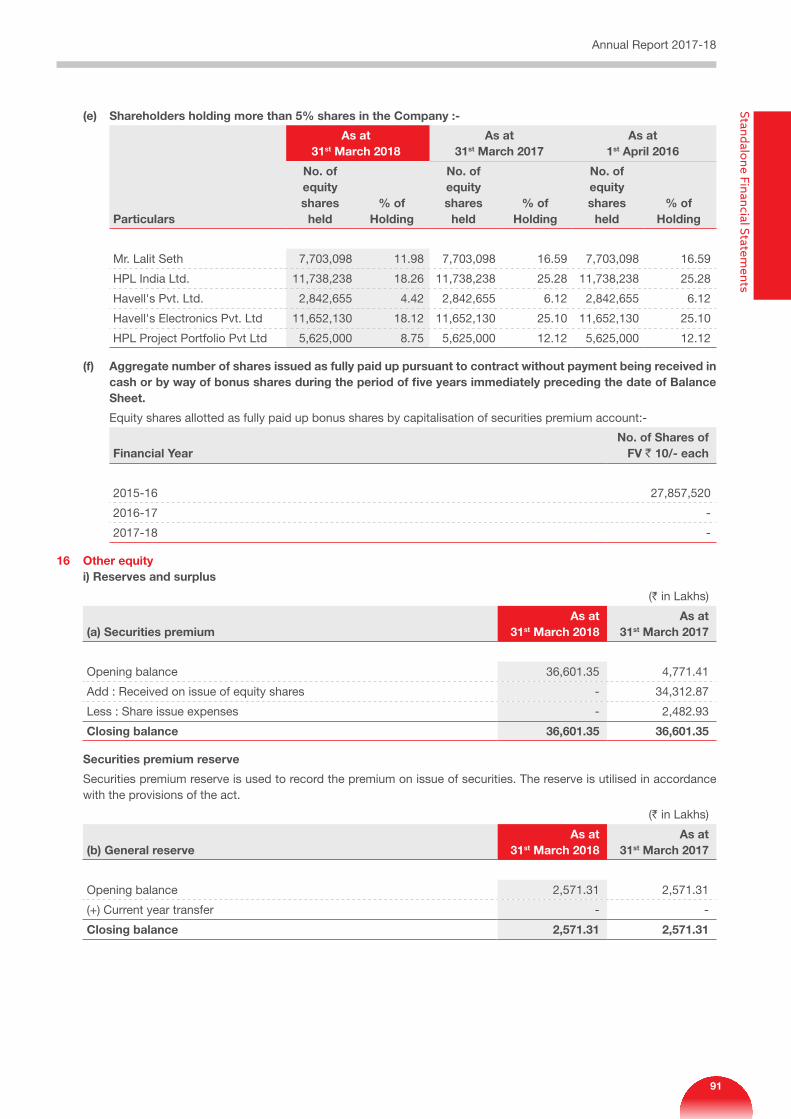
(e) Shareholders holding more than 5% shares in the Company :-
Particulars
As at 31st March 2018
As at 31st March 2017
As at 1st April 2016
No. of equity shares
held% of
Holding
No. of equity shares
held% of
Holding
No. of equity shares
held% of
Holding
Mr. Lalit Seth 7,703,098 11.98 7,703,098 16.59 7,703,098 16.59
HPL India Ltd. 11,738,238 18.26 11,738,238 25.28 11,738,238 25.28
Havell's Pvt. Ltd. 2,842,655 4.42 2,842,655 6.12 2,842,655 6.12
Havell's Electronics Pvt. Ltd 11,652,130 18.12 11,652,130 25.10 11,652,130 25.10
HPL Project Portfolio Pvt Ltd 5,625,000 8.75 5,625,000 12.12 5,625,000 12.12
(f) Aggregate number of shares issued as fully paid up pursuant to contract without payment being received in cash or by way of bonus shares during the period of five years immediately preceding the date of Balance Sheet.
Equity shares allotted as fully paid up bonus shares by capitalisation of securities premium account:-
Financial Year No. of Shares of
FV ` 10/- each
2015-16 27,857,520
2016-17 -
2017-18 -
16 Other equityi) Reserves and surplus
(` in Lakhs)
(a) Securities premiumAs at
31st March 2018As at
31st March 2017
Opening balance 36,601.35 4,771.41
Add : Received on issue of equity shares - 34,312.87
Less : Share issue expenses - 2,482.93
Closing balance 36,601.35 36,601.35
Securities premium reserve
Securities premium reserve is used to record the premium on issue of securities. The reserve is utilised in accordance with the provisions of the act.
(` in Lakhs)
(b) General reserveAs at
31st March 2018As at
31st March 2017
Opening balance 2,571.31 2,571.31
(+) Current year transfer - -
Closing balance 2,571.31 2,571.31
Annual Report 2017-18Standalone Financial Statem
ents
91
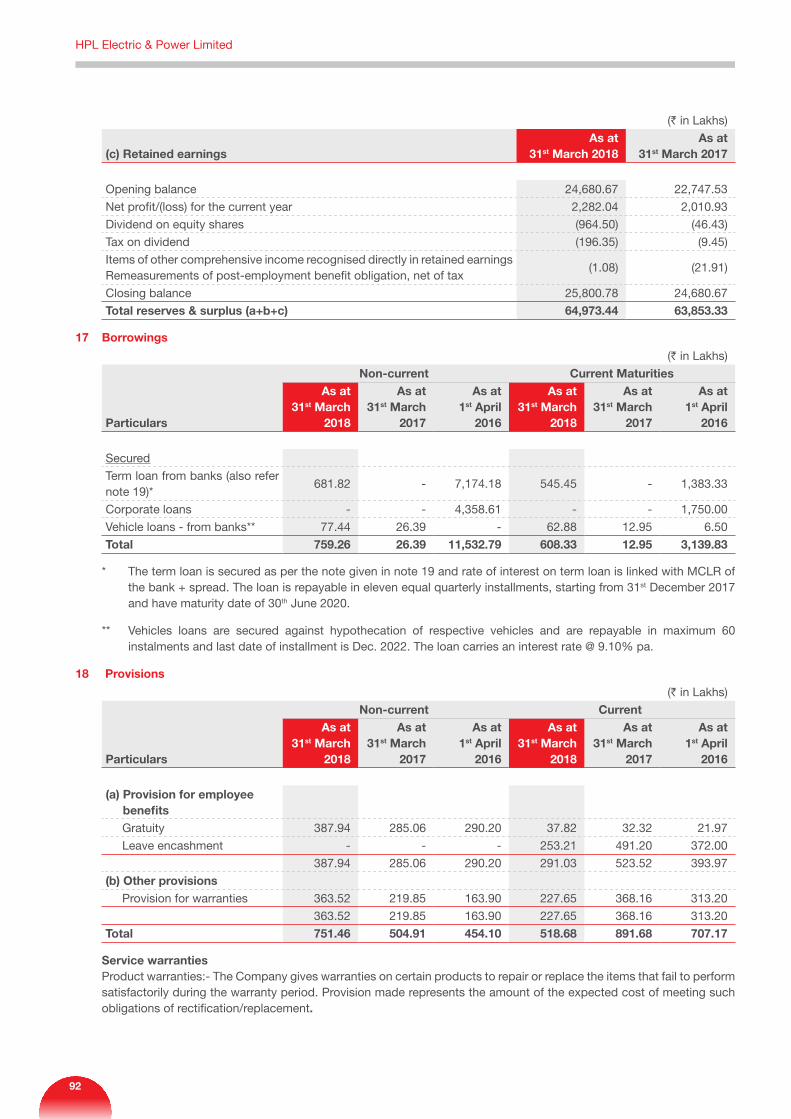
(` in Lakhs)
(c) Retained earningsAs at
31st March 2018As at
31st March 2017
Opening balance 24,680.67 22,747.53
Net profit/(loss) for the current year 2,282.04 2,010.93
Dividend on equity shares (964.50) (46.43)
Tax on dividend (196.35) (9.45)
Items of other comprehensive income recognised directly in retained earnings Remeasurements of post-employment benefit obligation, net of tax
(1.08) (21.91)
Closing balance 25,800.78 24,680.67
Total reserves & surplus (a+b+c) 64,973.44 63,853.33
17 Borrowings
(` in Lakhs)
Particulars
Non-current Current MaturitiesAs at
31st March 2018
As at 31st March
2017
As at 1st April
2016
As at 31st March
2018
As at 31st March
2017
As at 1st April
2016
Secured
Term loan from banks (also refer note 19)*
681.82 - 7,174.18 545.45 - 1,383.33
Corporate loans - - 4,358.61 - - 1,750.00
Vehicle loans - from banks** 77.44 26.39 - 62.88 12.95 6.50
Total 759.26 26.39 11,532.79 608.33 12.95 3,139.83
* The term loan is secured as per the note given in note 19 and rate of interest on term loan is linked with MCLR of the bank + spread. The loan is repayable in eleven equal quarterly installments, starting from 31st December 2017 and have maturity date of 30th June 2020.
** Vehicles loans are secured against hypothecation of respective vehicles and are repayable in maximum 60 instalments and last date of installment is Dec. 2022. The loan carries an interest rate @ 9.10% pa.
18 Provisions
(` in Lakhs)
Particulars
Non-current CurrentAs at
31st March 2018
As at 31st March
2017
As at 1st April
2016
As at 31st March
2018
As at 31st March
2017
As at 1st April
2016
(a) Provision for employee benefits
Gratuity 387.94 285.06 290.20 37.82 32.32 21.97
Leave encashment - - - 253.21 491.20 372.00
387.94 285.06 290.20 291.03 523.52 393.97
(b) Other provisions Provision for warranties 363.52 219.85 163.90 227.65 368.16 313.20
363.52 219.85 163.90 227.65 368.16 313.20
Total 751.46 504.91 454.10 518.68 891.68 707.17
Service warranties Product warranties:- The Company gives warranties on certain products to repair or replace the items that fail to perform satisfactorily during the warranty period. Provision made represents the amount of the expected cost of meeting such obligations of rectification/replacement.
HPL Electric & Power Limited
92
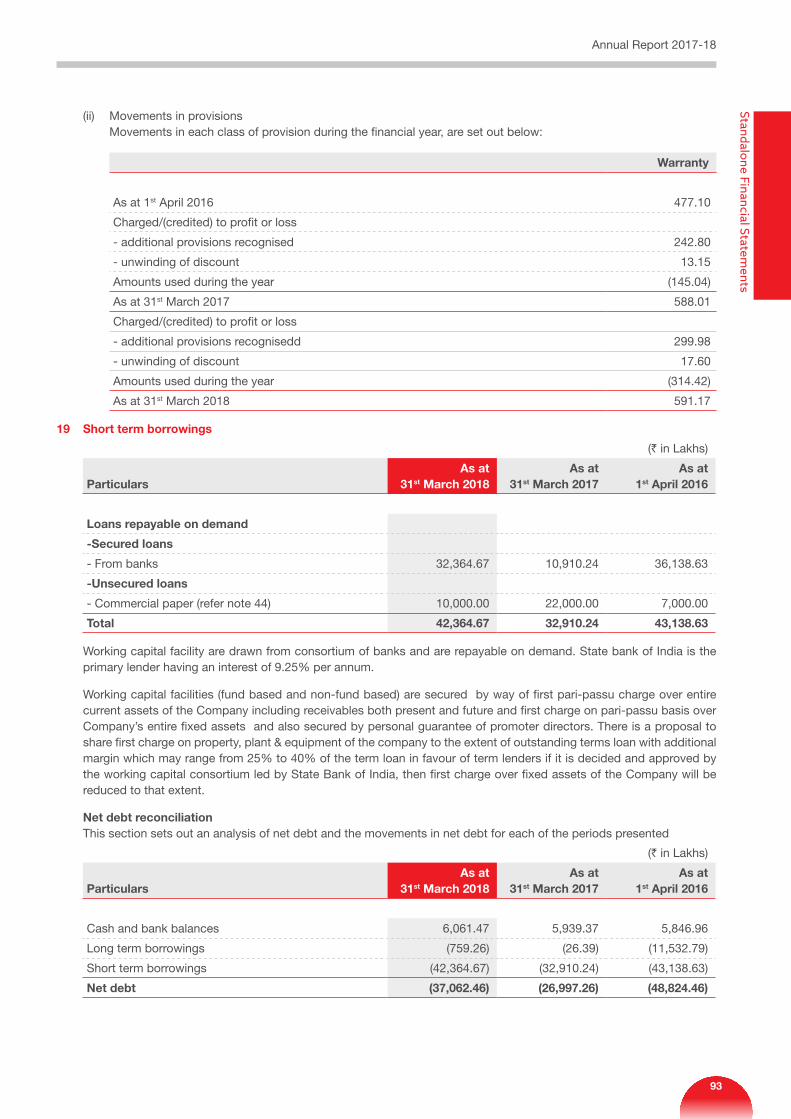
(ii) Movements in provisions Movements in each class of provision during the financial year, are set out below:
Warranty
As at 1st April 2016 477.10
Charged/(credited) to profit or loss
- additional provisions recognised 242.80
- unwinding of discount 13.15
Amounts used during the year (145.04)
As at 31st March 2017 588.01
Charged/(credited) to profit or loss
- additional provisions recognisedd 299.98
- unwinding of discount 17.60
Amounts used during the year (314.42)
As at 31st March 2018 591.17
19 Short term borrowings
(` in Lakhs)
ParticularsAs at
31st March 2018As at
31st March 2017As at
1st April 2016
Loans repayable on demand
-Secured loans
- From banks 32,364.67 10,910.24 36,138.63
-Unsecured loans
- Commercial paper (refer note 44) 10,000.00 22,000.00 7,000.00
Total 42,364.67 32,910.24 43,138.63
Working capital facility are drawn from consortium of banks and are repayable on demand. State bank of India is the primary lender having an interest of 9.25% per annum.
Working capital facilities (fund based and non-fund based) are secured by way of first pari-passu charge over entire current assets of the Company including receivables both present and future and first charge on pari-passu basis over Company’s entire fixed assets and also secured by personal guarantee of promoter directors. There is a proposal to share first charge on property, plant & equipment of the company to the extent of outstanding terms loan with additional margin which may range from 25% to 40% of the term loan in favour of term lenders if it is decided and approved by the working capital consortium led by State Bank of India, then first charge over fixed assets of the Company will be reduced to that extent.
Net debt reconciliationThis section sets out an analysis of net debt and the movements in net debt for each of the periods presented
(` in Lakhs)
ParticularsAs at
31st March 2018As at
31st March 2017As at
1st April 2016
Cash and bank balances 6,061.47 5,939.37 5,846.96
Long term borrowings (759.26) (26.39) (11,532.79)
Short term borrowings (42,364.67) (32,910.24) (43,138.63)
Net debt (37,062.46) (26,997.26) (48,824.46)
Annual Report 2017-18Standalone Financial Statem
ents
93
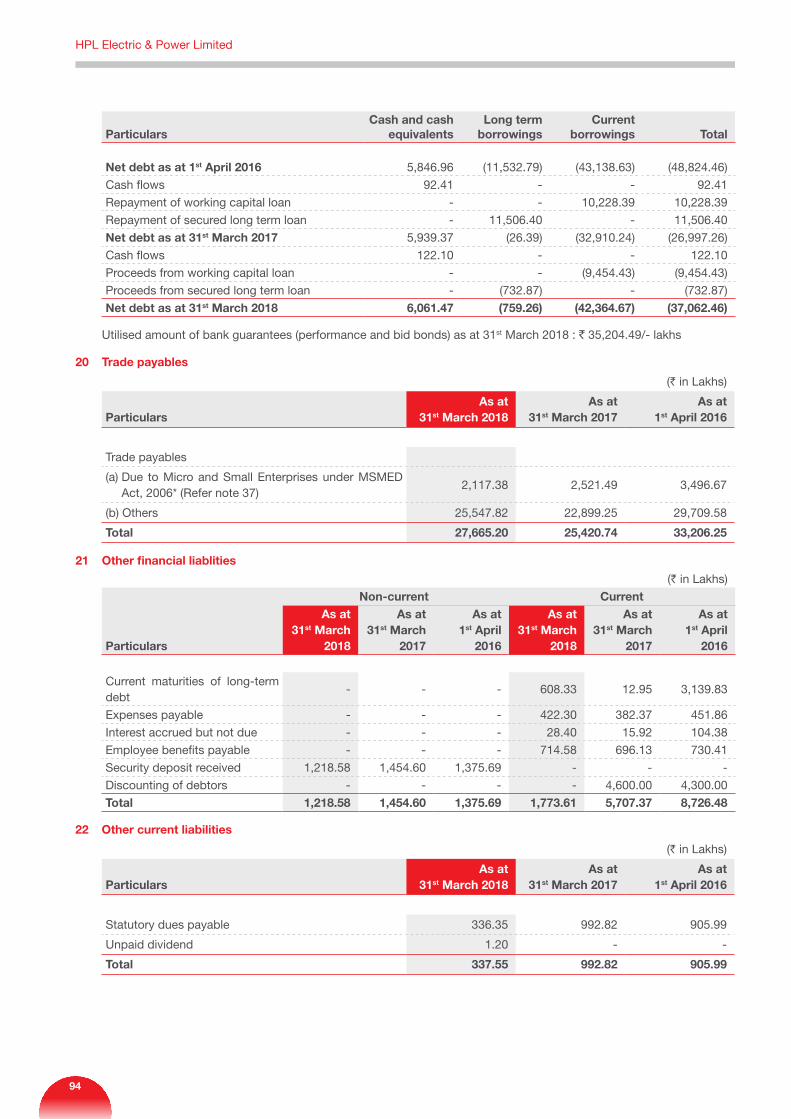
Particulars Cash and cash
equivalentsLong term
borrowingsCurrent
borrowings Total
Net debt as at 1st April 2016 5,846.96 (11,532.79) (43,138.63) (48,824.46)
Cash flows 92.41 - - 92.41
Repayment of working capital loan - - 10,228.39 10,228.39
Repayment of secured long term loan - 11,506.40 - 11,506.40
Net debt as at 31st March 2017 5,939.37 (26.39) (32,910.24) (26,997.26)
Cash flows 122.10 - - 122.10
Proceeds from working capital loan - - (9,454.43) (9,454.43)
Proceeds from secured long term loan - (732.87) - (732.87)
Net debt as at 31st March 2018 6,061.47 (759.26) (42,364.67) (37,062.46)
Utilised amount of bank guarantees (performance and bid bonds) as at 31st March 2018 : ` 35,204.49/- lakhs
20 Trade payables
(` in Lakhs)
ParticularsAs at
31st March 2018As at
31st March 2017As at
1st April 2016
Trade payables
(a) Due to Micro and Small Enterprises under MSMED Act, 2006* (Refer note 37)
2,117.38 2,521.49 3,496.67
(b) Others 25,547.82 22,899.25 29,709.58
Total 27,665.20 25,420.74 33,206.25
21 Other financial liablities
(` in Lakhs)
Particulars
Non-current CurrentAs at
31st March 2018
As at 31st March
2017
As at 1st April
2016
As at 31st March
2018
As at 31st March
2017
As at 1st April
2016
Current maturities of long-term debt
- - - 608.33 12.95 3,139.83
Expenses payable - - - 422.30 382.37 451.86
Interest accrued but not due - - - 28.40 15.92 104.38
Employee benefits payable - - - 714.58 696.13 730.41
Security deposit received 1,218.58 1,454.60 1,375.69 - - -
Discounting of debtors - - - - 4,600.00 4,300.00
Total 1,218.58 1,454.60 1,375.69 1,773.61 5,707.37 8,726.48
22 Other current liabilities
(` in Lakhs)
ParticularsAs at
31st March 2018As at
31st March 2017As at
1st April 2016
Statutory dues payable 336.35 992.82 905.99
Unpaid dividend 1.20 - -
Total 337.55 992.82 905.99
HPL Electric & Power Limited
94

23 Revenue from operation
(` in Lakhs)
ParticularsYear ended
31st March 2018Year ended
31st March 2017
Sale of products
Finished goods 102,336.43 97,588.06
Traded goods - 6,105.35
Total 102,336.43 103,693.41
Particulars of sale of products (gross)
(` in Lakhs)
ParticularsYear ended
31st March 2018Year ended
31st March 2017
Finished goods
Metering 49,970.80 44,875.06
Switch gears 19,963.81 19,830.94
Lighting & electronics 18,649.21 18,230.54
Cables 13,752.61 14,651.52
102,336.43 97,588.06
Traded goods
Metering - 817.89
Lighting & electronics - 5,287.46
- 6,105.35
Total 102,336.43 103,693.41
According to the requirement of Ind AS and SEBI (Listing Obligations and Disclosure Requirements) Regulations, 2015, revenue for the period ended June 30, 2017, and year ended March 31, 2017 were reported inclusive of Excise Duty. The Government of india has implemented Goods and Service Tax (“GST”) from July 1, 2017 replacing Excise Duty, Service Tax and various other indirect taxes. As per Ind AS 18, the revenue for the year ended March 31, 2018 and March 31, 2017, is reported net of GST. Had the previously reported revenue shown net of excise duty, comparative revenue of the Company would have been as follows:-
(` in Lakhs)
ParticularsYear ended
31st March 2018Year ended
31st March 2017
Net sales/Revenue from operations (Net of excise duty) 100,011.81 92,666.83
24 Other income
(` in Lakhs)
ParticularsYear ended
31st March 2018Year ended
31st March 2017
Interest income from financial assets at amortised cost 364.59 429.66
Other non-operating income 16.98 22.62
Total 381.57 452.28
Annual Report 2017-18Standalone Financial Statem
ents
95
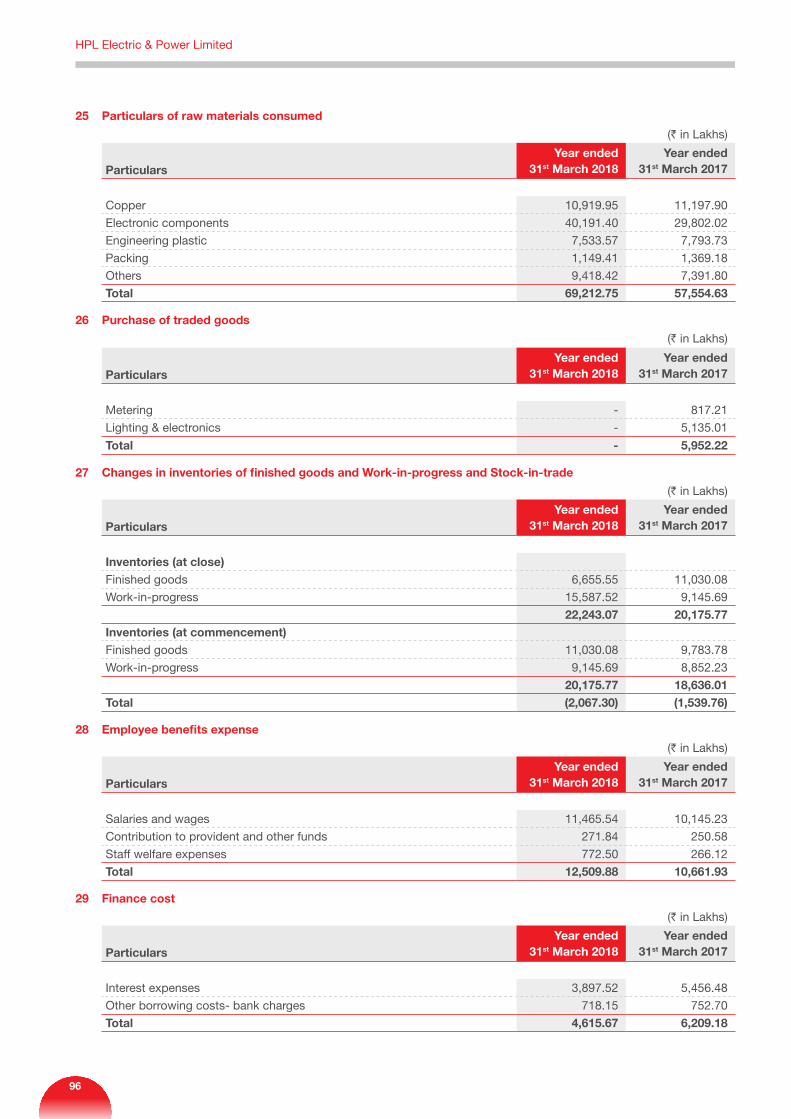
25 Particulars of raw materials consumed
(` in Lakhs)
ParticularsYear ended
31st March 2018Year ended
31st March 2017
Copper 10,919.95 11,197.90
Electronic components 40,191.40 29,802.02
Engineering plastic 7,533.57 7,793.73
Packing 1,149.41 1,369.18
Others 9,418.42 7,391.80
Total 69,212.75 57,554.63
26 Purchase of traded goods
(` in Lakhs)
ParticularsYear ended
31st March 2018Year ended
31st March 2017
Metering - 817.21
Lighting & electronics - 5,135.01
Total - 5,952.22
27 Changes in inventories of finished goods and Work-in-progress and Stock-in-trade
(` in Lakhs)
ParticularsYear ended
31st March 2018Year ended
31st March 2017
Inventories (at close)Finished goods 6,655.55 11,030.08
Work-in-progress 15,587.52 9,145.69
22,243.07 20,175.77 Inventories (at commencement)Finished goods 11,030.08 9,783.78
Work-in-progress 9,145.69 8,852.23
20,175.77 18,636.01 Total (2,067.30) (1,539.76)
28 Employee benefits expense
(` in Lakhs)
ParticularsYear ended
31st March 2018Year ended
31st March 2017
Salaries and wages 11,465.54 10,145.23
Contribution to provident and other funds 271.84 250.58
Staff welfare expenses 772.50 266.12
Total 12,509.88 10,661.93
29 Finance cost
(` in Lakhs)
ParticularsYear ended
31st March 2018Year ended
31st March 2017
Interest expenses 3,897.52 5,456.48
Other borrowing costs- bank charges 718.15 752.70
Total 4,615.67 6,209.18
HPL Electric & Power Limited
96
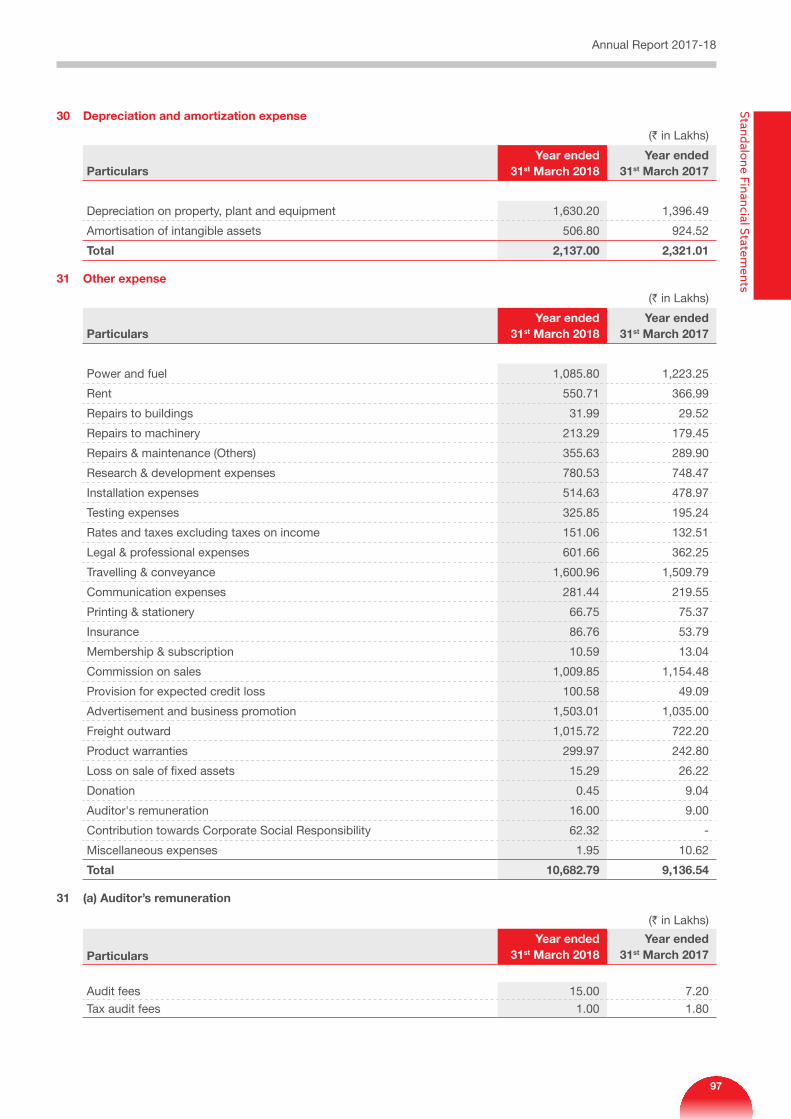
30 Depreciation and amortization expense
(` in Lakhs)
ParticularsYear ended
31st March 2018Year ended
31st March 2017
Depreciation on property, plant and equipment 1,630.20 1,396.49
Amortisation of intangible assets 506.80 924.52
Total 2,137.00 2,321.01
31 Other expense
(` in Lakhs)
ParticularsYear ended
31st March 2018Year ended
31st March 2017
Power and fuel 1,085.80 1,223.25
Rent 550.71 366.99
Repairs to buildings 31.99 29.52
Repairs to machinery 213.29 179.45
Repairs & maintenance (Others) 355.63 289.90
Research & development expenses 780.53 748.47
Installation expenses 514.63 478.97
Testing expenses 325.85 195.24
Rates and taxes excluding taxes on income 151.06 132.51
Legal & professional expenses 601.66 362.25
Travelling & conveyance 1,600.96 1,509.79
Communication expenses 281.44 219.55
Printing & stationery 66.75 75.37
Insurance 86.76 53.79
Membership & subscription 10.59 13.04
Commission on sales 1,009.85 1,154.48
Provision for expected credit loss 100.58 49.09
Advertisement and business promotion 1,503.01 1,035.00
Freight outward 1,015.72 722.20
Product warranties 299.97 242.80
Loss on sale of fixed assets 15.29 26.22
Donation 0.45 9.04
Auditor's remuneration 16.00 9.00
Contribution towards Corporate Social Responsibility 62.32 -
Miscellaneous expenses 1.95 10.62
Total 10,682.79 9,136.54
31 (a) Auditor’s remuneration
(` in Lakhs)
ParticularsYear ended
31st March 2018Year ended
31st March 2017
Audit fees 15.00 7.20
Tax audit fees 1.00 1.80
Annual Report 2017-18Standalone Financial Statem
ents
97
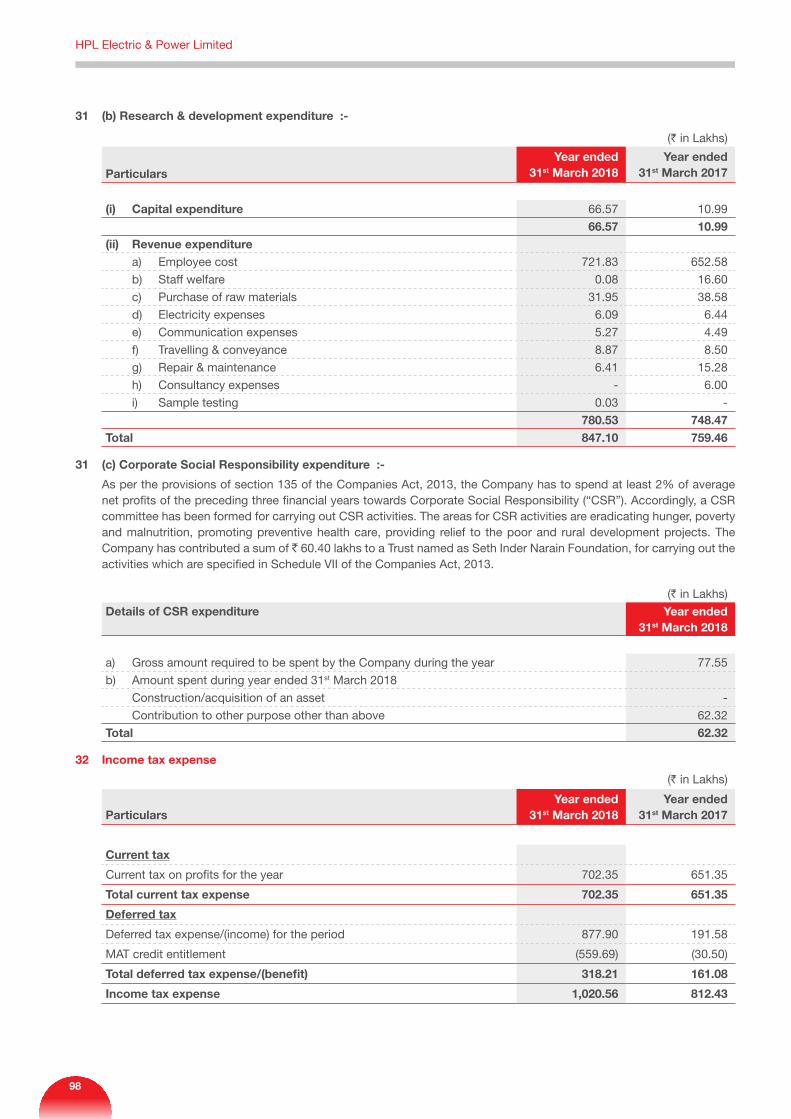
31 (b) Research & development expenditure :-
(` in Lakhs)
ParticularsYear ended
31st March 2018Year ended
31st March 2017
(i) Capital expenditure 66.57 10.99
66.57 10.99 (ii) Revenue expenditure a) Employee cost 721.83 652.58
b) Staff welfare 0.08 16.60
c) Purchase of raw materials 31.95 38.58
d) Electricity expenses 6.09 6.44
e) Communication expenses 5.27 4.49
f) Travelling & conveyance 8.87 8.50
g) Repair & maintenance 6.41 15.28
h) Consultancy expenses - 6.00
i) Sample testing 0.03 -
780.53 748.47 Total 847.10 759.46
31 (c) Corporate Social Responsibility expenditure :-
As per the provisions of section 135 of the Companies Act, 2013, the Company has to spend at least 2% of average net profits of the preceding three financial years towards Corporate Social Responsibility (“CSR”). Accordingly, a CSR committee has been formed for carrying out CSR activities. The areas for CSR activities are eradicating hunger, poverty and malnutrition, promoting preventive health care, providing relief to the poor and rural development projects. The Company has contributed a sum of ` 60.40 lakhs to a Trust named as Seth Inder Narain Foundation, for carrying out the activities which are specified in Schedule VII of the Companies Act, 2013.
(` in Lakhs)
Details of CSR expenditure Year ended 31st March 2018
a) Gross amount required to be spent by the Company during the year 77.55
b) Amount spent during year ended 31st March 2018
Construction/acquisition of an asset -
Contribution to other purpose other than above 62.32
Total 62.32
32 Income tax expense
(` in Lakhs)
ParticularsYear ended
31st March 2018Year ended
31st March 2017
Current tax
Current tax on profits for the year 702.35 651.35
Total current tax expense 702.35 651.35
Deferred tax
Deferred tax expense/(income) for the period 877.90 191.58
MAT credit entitlement (559.69) (30.50)
Total deferred tax expense/(benefit) 318.21 161.08
Income tax expense 1,020.56 812.43
HPL Electric & Power Limited
98

(` in Lakhs)
(a) Reconciliation of tax expense and the accounting profit Year ended
31st March 2018Year ended
31st March 2017
Profit before income tax expense 3,302.60 2,823.36
Tax at the Indian tax rate of 34.608% (31st March 2017 – 34.608%) 1,142.96 977.11
Tax effect of amounts which are not deductible (taxable) in calculating taxable income:
Corporate social responsibility expenditure 21.57 -
Research & development expenses (146.58) (166.62)
Interest on late payment - 0.38
Other items 2.61 1.56
- -
Income tax expense 1,020.56 812.43
33 Earnings per share
(Amount in lakhs except EPS)
ParticularsYear ended
31st March 2018Year ended
31st March 2017
(i) Profit after tax 2,282.04 2,010.93
(ii) Weighted average number of equity shares for basic EPS 643.00 553.65
(iii) Weighted average number of equity shares for dilutive EPS 643.00 553.65
(iv) Nominal value per Equity Shares 10.00 10.00
(v) Earning Per Share (Basic) 3.55 3.63
(vi) Earning Per Share (Dilutive) 3.55 3.63
34 Fair value measurements Financial instruments by category
(` in Lakhs)
Particulars
As at 31st March 2018
As at 31st March 2017
As at 1st April 2016
FVTPLAmortised
cost FVTPLAmortised
cost FVTPLAmortised
cost
Financial assets Investments - - - - 0.20 - Trade receivables - 44,692.55 - 46,851.68 - 51,012.46 Loans - 257.89 - 437.11 - 225.61 Cash and bank balances - 6,061.47 - 5,939.37 - 5,846.96 Other financial assets - 1,109.53 - 1,602.63 - 1,286.03 Total financial assets - 52,121.44 - 54,830.79 0.20 58,371.06 Financial liabilities Borrowings - 43,123.93 - 32,936.63 - 54,671.42 Trade payables - 27,665.20 - 25,420.74 - 33,206.25 Other financial liabilities - 2,992.19 - 7,161.98 - 10,102.17 Total financial liabilities - 73,781.32 - 65,519.35 - 97,979.84
(i) Fair value hierarchy This section explains the judgments and estimates made in determining the fair values of the financial instruments
that are measured at amortized cost and for which fair values are disclosed in the financial statements. To provide an indication about the reliability of the inputs used in determining fair value, the Company has classified its financial instruments into the three levels prescribed under the accounting standard. An explanation of each level follows underneath.
Annual Report 2017-18Standalone Financial Statem
ents
99
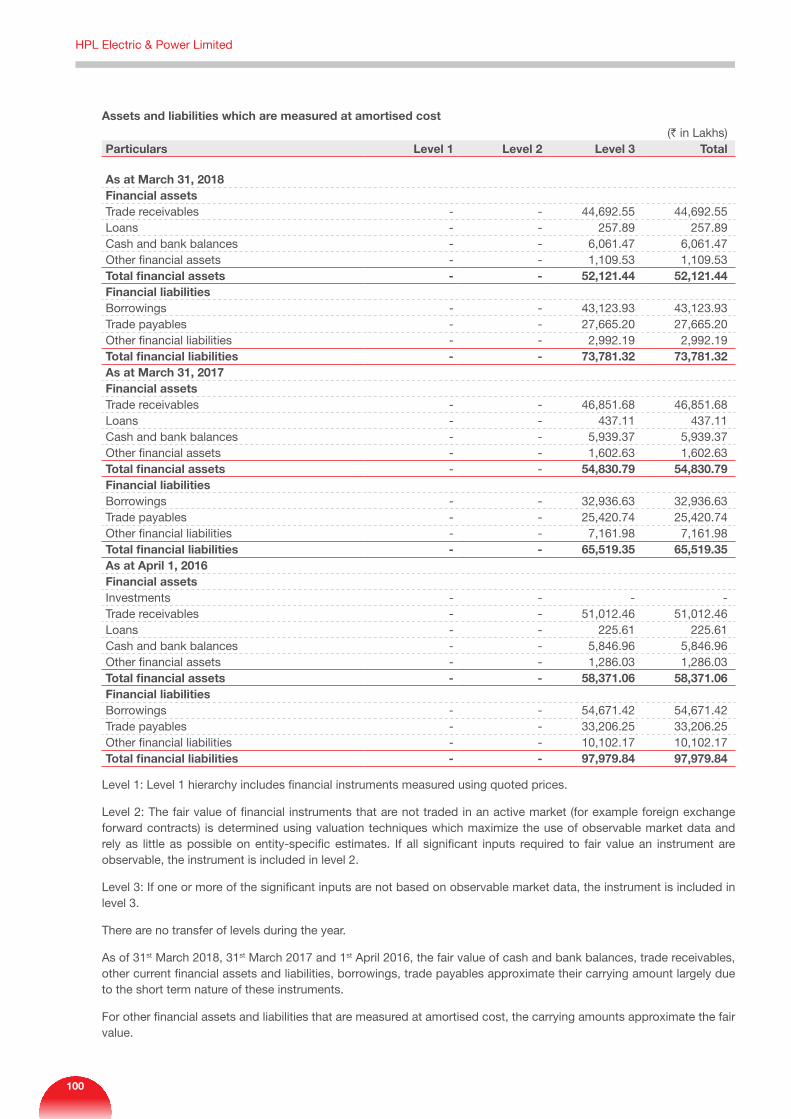
Assets and liabilities which are measured at amortised cost(` in Lakhs)
Particulars Level 1 Level 2 Level 3 Total
As at March 31, 2018Financial assets Trade receivables - - 44,692.55 44,692.55 Loans - - 257.89 257.89 Cash and bank balances - - 6,061.47 6,061.47 Other financial assets - - 1,109.53 1,109.53 Total financial assets - - 52,121.44 52,121.44 Financial liabilities Borrowings - - 43,123.93 43,123.93 Trade payables - - 27,665.20 27,665.20 Other financial liabilities - - 2,992.19 2,992.19 Total financial liabilities - - 73,781.32 73,781.32 As at March 31, 2017Financial assets Trade receivables - - 46,851.68 46,851.68 Loans - - 437.11 437.11 Cash and bank balances - - 5,939.37 5,939.37 Other financial assets - - 1,602.63 1,602.63 Total financial assets - - 54,830.79 54,830.79 Financial liabilities Borrowings - - 32,936.63 32,936.63 Trade payables - - 25,420.74 25,420.74 Other financial liabilities - - 7,161.98 7,161.98 Total financial liabilities - - 65,519.35 65,519.35 As at April 1, 2016Financial assets Investments - - - - Trade receivables - - 51,012.46 51,012.46 Loans - - 225.61 225.61 Cash and bank balances - - 5,846.96 5,846.96 Other financial assets - - 1,286.03 1,286.03 Total financial assets - - 58,371.06 58,371.06 Financial liabilities Borrowings - - 54,671.42 54,671.42 Trade payables - - 33,206.25 33,206.25 Other financial liabilities - - 10,102.17 10,102.17 Total financial liabilities - - 97,979.84 97,979.84
Level 1: Level 1 hierarchy includes financial instruments measured using quoted prices.
Level 2: The fair value of financial instruments that are not traded in an active market (for example foreign exchange forward contracts) is determined using valuation techniques which maximize the use of observable market data and rely as little as possible on entity-specific estimates. If all significant inputs required to fair value an instrument are observable, the instrument is included in level 2.
Level 3: If one or more of the significant inputs are not based on observable market data, the instrument is included in level 3.
There are no transfer of levels during the year.
As of 31st March 2018, 31st March 2017 and 1st April 2016, the fair value of cash and bank balances, trade receivables, other current financial assets and liabilities, borrowings, trade payables approximate their carrying amount largely due to the short term nature of these instruments.
For other financial assets and liabilities that are measured at amortised cost, the carrying amounts approximate the fair value.
HPL Electric & Power Limited
100
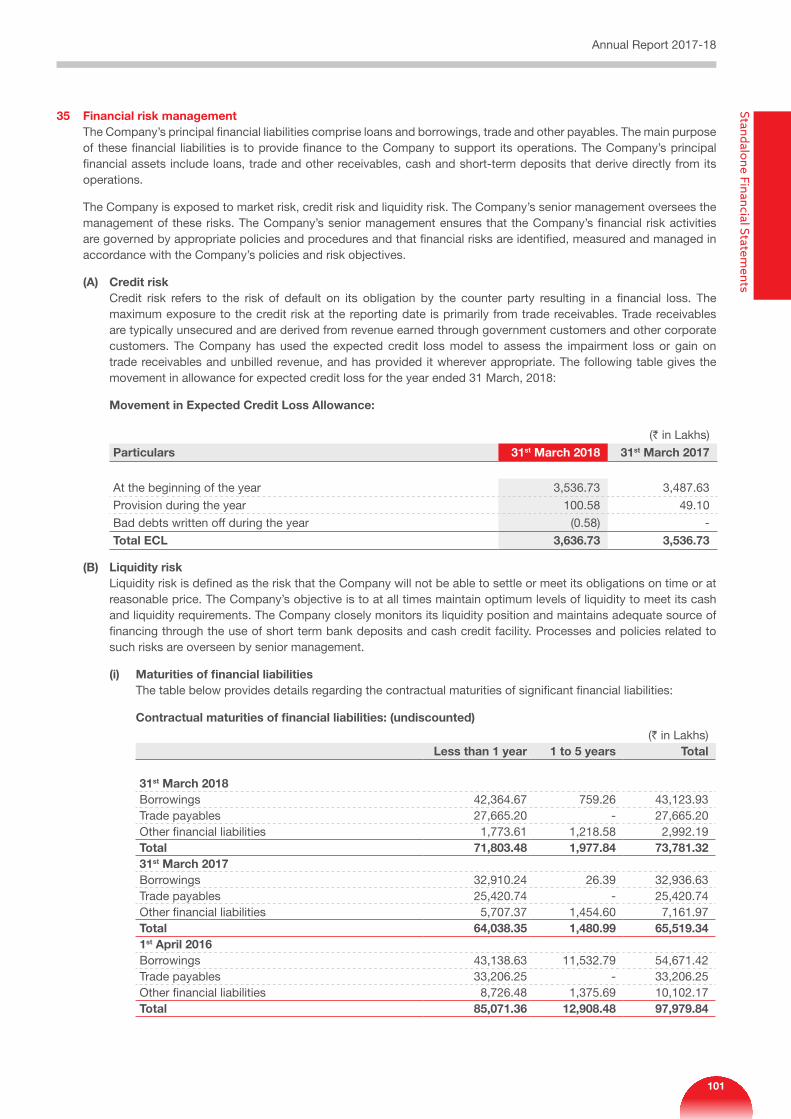
35 Financial risk managementThe Company’s principal financial liabilities comprise loans and borrowings, trade and other payables. The main purpose of these financial liabilities is to provide finance to the Company to support its operations. The Company’s principal financial assets include loans, trade and other receivables, cash and short-term deposits that derive directly from its operations.
The Company is exposed to market risk, credit risk and liquidity risk. The Company’s senior management oversees the management of these risks. The Company’s senior management ensures that the Company’s financial risk activities are governed by appropriate policies and procedures and that financial risks are identified, measured and managed in accordance with the Company’s policies and risk objectives.
(A) Credit risk Credit risk refers to the risk of default on its obligation by the counter party resulting in a financial loss. The
maximum exposure to the credit risk at the reporting date is primarily from trade receivables. Trade receivables are typically unsecured and are derived from revenue earned through government customers and other corporate customers. The Company has used the expected credit loss model to assess the impairment loss or gain on trade receivables and unbilled revenue, and has provided it wherever appropriate. The following table gives the movement in allowance for expected credit loss for the year ended 31 March, 2018:
Movement in Expected Credit Loss Allowance:
(` in Lakhs)
Particulars 31st March 2018 31st March 2017
At the beginning of the year 3,536.73 3,487.63
Provision during the year 100.58 49.10
Bad debts written off during the year (0.58) -
Total ECL 3,636.73 3,536.73
(B) Liquidity risk Liquidity risk is defined as the risk that the Company will not be able to settle or meet its obligations on time or at
reasonable price. The Company’s objective is to at all times maintain optimum levels of liquidity to meet its cash and liquidity requirements. The Company closely monitors its liquidity position and maintains adequate source of financing through the use of short term bank deposits and cash credit facility. Processes and policies related to such risks are overseen by senior management.
(i) Maturities of financial liabilities The table below provides details regarding the contractual maturities of significant financial liabilities:
Contractual maturities of financial liabilities: (undiscounted)(` in Lakhs)
Less than 1 year 1 to 5 years Total
31st March 2018Borrowings 42,364.67 759.26 43,123.93 Trade payables 27,665.20 - 27,665.20 Other financial liabilities 1,773.61 1,218.58 2,992.19 Total 71,803.48 1,977.84 73,781.32 31st March 2017Borrowings 32,910.24 26.39 32,936.63 Trade payables 25,420.74 - 25,420.74 Other financial liabilities 5,707.37 1,454.60 7,161.97 Total 64,038.35 1,480.99 65,519.34 1st April 2016Borrowings 43,138.63 11,532.79 54,671.42 Trade payables 33,206.25 - 33,206.25 Other financial liabilities 8,726.48 1,375.69 10,102.17 Total 85,071.36 12,908.48 97,979.84
Annual Report 2017-18Standalone Financial Statem
ents
101
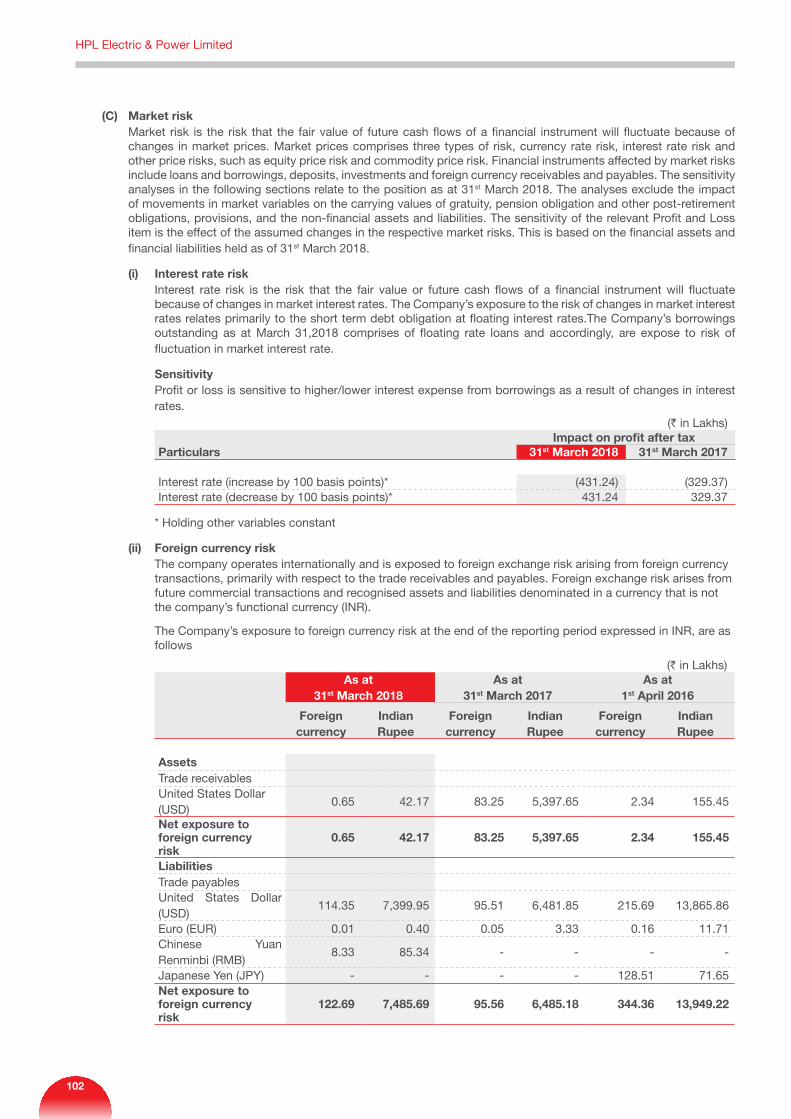
(C) Market risk Market risk is the risk that the fair value of future cash flows of a financial instrument will fluctuate because of
changes in market prices. Market prices comprises three types of risk, currency rate risk, interest rate risk and other price risks, such as equity price risk and commodity price risk. Financial instruments affected by market risks include loans and borrowings, deposits, investments and foreign currency receivables and payables. The sensitivity analyses in the following sections relate to the position as at 31st March 2018. The analyses exclude the impact of movements in market variables on the carrying values of gratuity, pension obligation and other post-retirement obligations, provisions, and the non-financial assets and liabilities. The sensitivity of the relevant Profit and Loss item is the effect of the assumed changes in the respective market risks. This is based on the financial assets and financial liabilities held as of 31st March 2018.
(i) Interest rate risk Interest rate risk is the risk that the fair value or future cash flows of a financial instrument will fluctuate
because of changes in market interest rates. The Company’s exposure to the risk of changes in market interest rates relates primarily to the short term debt obligation at floating interest rates.The Company’s borrowings outstanding as at March 31,2018 comprises of floating rate loans and accordingly, are expose to risk of fluctuation in market interest rate.
Sensitivity Profit or loss is sensitive to higher/lower interest expense from borrowings as a result of changes in interest
rates.(` in Lakhs)
Impact on profit after taxParticulars 31st March 2018 31st March 2017
Interest rate (increase by 100 basis points)* (431.24) (329.37)Interest rate (decrease by 100 basis points)* 431.24 329.37
* Holding other variables constant
(ii) Foreign currency riskThe company operates internationally and is exposed to foreign exchange risk arising from foreign currency transactions, primarily with respect to the trade receivables and payables. Foreign exchange risk arises from future commercial transactions and recognised assets and liabilities denominated in a currency that is not the company’s functional currency (INR).
The Company’s exposure to foreign currency risk at the end of the reporting period expressed in INR, are as follows
(` in Lakhs)As at
31st March 2018As at
31st March 2017As at
1st April 2016
Foreign currency
Indian Rupee
Foreign currency
Indian Rupee
Foreign currency
Indian Rupee
AssetsTrade receivablesUnited States Dollar (USD)
0.65 42.17 83.25 5,397.65 2.34 155.45
Net exposure to foreign currency risk
0.65 42.17 83.25 5,397.65 2.34 155.45
LiabilitiesTrade payablesUnited States Dollar (USD)
114.35 7,399.95 95.51 6,481.85 215.69 13,865.86
Euro (EUR) 0.01 0.40 0.05 3.33 0.16 11.71 Chinese Yuan Renminbi (RMB)
8.33 85.34 - - - -
Japanese Yen (JPY) - - - - 128.51 71.65 Net exposure to foreign currency risk
122.69 7,485.69 95.56 6,485.18 344.36 13,949.22
HPL Electric & Power Limited
102
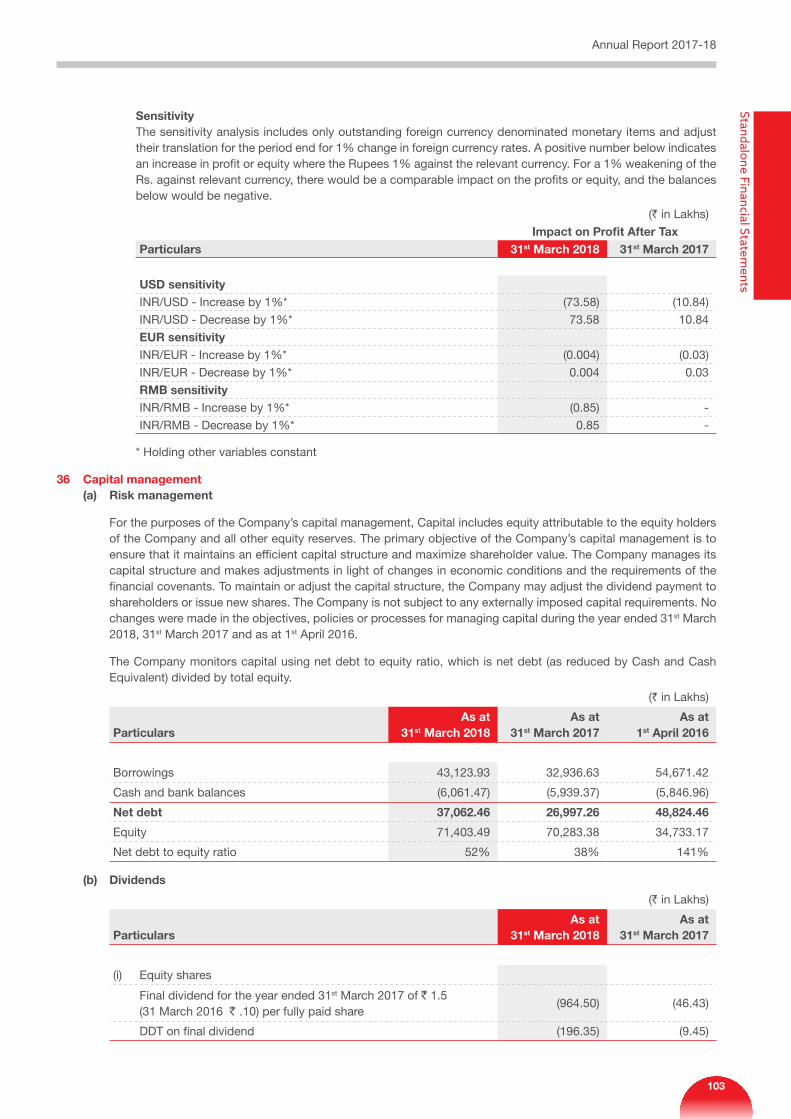
SensitivityThe sensitivity analysis includes only outstanding foreign currency denominated monetary items and adjust their translation for the period end for 1% change in foreign currency rates. A positive number below indicates an increase in profit or equity where the Rupees 1% against the relevant currency. For a 1% weakening of the Rs. against relevant currency, there would be a comparable impact on the profits or equity, and the balances below would be negative.
(` in Lakhs)
Impact on Profit After Tax Particulars 31st March 2018 31st March 2017
USD sensitivityINR/USD - Increase by 1%* (73.58) (10.84)
INR/USD - Decrease by 1%* 73.58 10.84
EUR sensitivityINR/EUR - Increase by 1%* (0.004) (0.03)
INR/EUR - Decrease by 1%* 0.004 0.03
RMB sensitivityINR/RMB - Increase by 1%* (0.85) -
INR/RMB - Decrease by 1%* 0.85 -
* Holding other variables constant
36 Capital management(a) Risk management
For the purposes of the Company’s capital management, Capital includes equity attributable to the equity holders of the Company and all other equity reserves. The primary objective of the Company’s capital management is to ensure that it maintains an efficient capital structure and maximize shareholder value. The Company manages its capital structure and makes adjustments in light of changes in economic conditions and the requirements of the financial covenants. To maintain or adjust the capital structure, the Company may adjust the dividend payment to shareholders or issue new shares. The Company is not subject to any externally imposed capital requirements. No changes were made in the objectives, policies or processes for managing capital during the year ended 31st March 2018, 31st March 2017 and as at 1st April 2016.
The Company monitors capital using net debt to equity ratio, which is net debt (as reduced by Cash and Cash Equivalent) divided by total equity.
(` in Lakhs)
ParticularsAs at
31st March 2018As at
31st March 2017As at
1st April 2016
Borrowings 43,123.93 32,936.63 54,671.42
Cash and bank balances (6,061.47) (5,939.37) (5,846.96)
Net debt 37,062.46 26,997.26 48,824.46
Equity 71,403.49 70,283.38 34,733.17
Net debt to equity ratio 52% 38% 141%
(b) Dividends
(` in Lakhs)
ParticularsAs at
31st March 2018As at
31st March 2017
(i) Equity shares
Final dividend for the year ended 31st March 2017 of ` 1.5 (31 March 2016 ` .10) per fully paid share
(964.50) (46.43)
DDT on final dividend (196.35) (9.45)
Annual Report 2017-18Standalone Financial Statem
ents
103
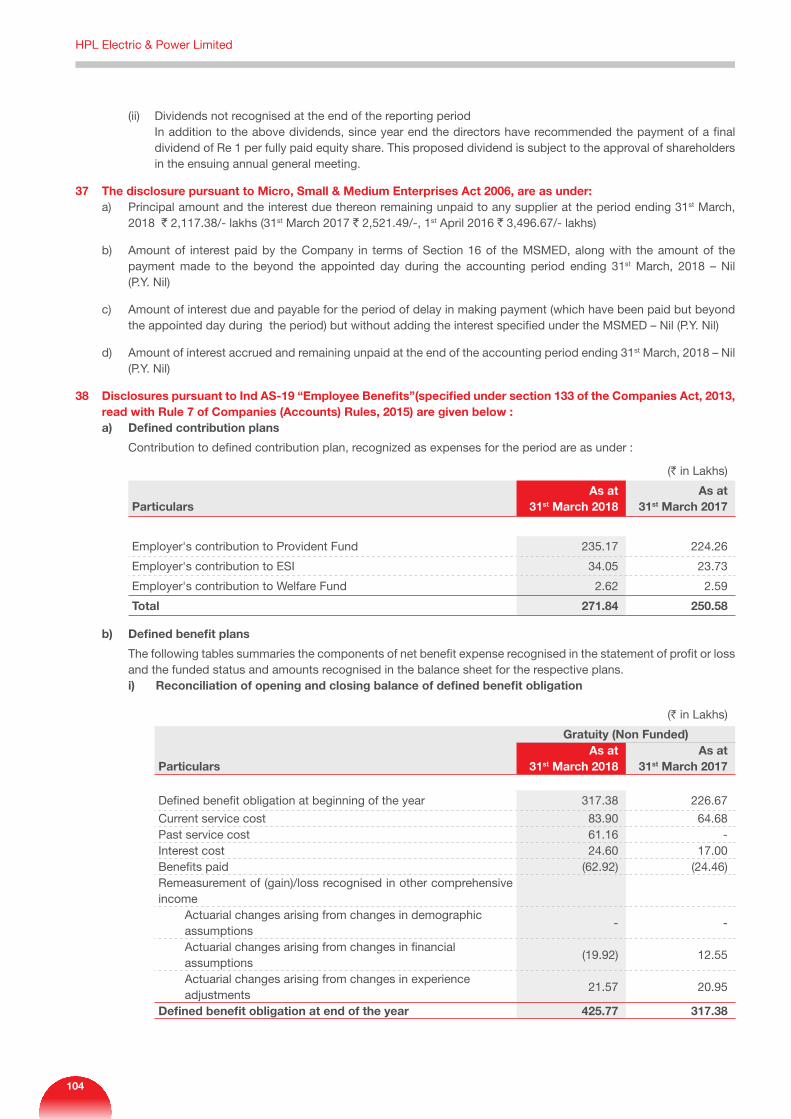
(ii) Dividends not recognised at the end of the reporting period In addition to the above dividends, since year end the directors have recommended the payment of a final
dividend of Re 1 per fully paid equity share. This proposed dividend is subject to the approval of shareholders in the ensuing annual general meeting.
37 The disclosure pursuant to Micro, Small & Medium Enterprises Act 2006, are as under:a) Principal amount and the interest due thereon remaining unpaid to any supplier at the period ending 31st March,
2018 ` 2,117.38/- lakhs (31st March 2017 ` 2,521.49/-, 1st April 2016 ` 3,496.67/- lakhs)
b) Amount of interest paid by the Company in terms of Section 16 of the MSMED, along with the amount of the payment made to the beyond the appointed day during the accounting period ending 31st March, 2018 – Nil (P.Y. Nil)
c) Amount of interest due and payable for the period of delay in making payment (which have been paid but beyond the appointed day during the period) but without adding the interest specified under the MSMED – Nil (P.Y. Nil)
d) Amount of interest accrued and remaining unpaid at the end of the accounting period ending 31st March, 2018 – Nil (P.Y. Nil)
38 Disclosures pursuant to Ind AS-19 “Employee Benefits”(specified under section 133 of the Companies Act, 2013, read with Rule 7 of Companies (Accounts) Rules, 2015) are given below :
a) Defined contribution plans
Contribution to defined contribution plan, recognized as expenses for the period are as under :
(` in Lakhs)
ParticularsAs at
31st March 2018As at
31st March 2017
Employer's contribution to Provident Fund 235.17 224.26
Employer's contribution to ESI 34.05 23.73
Employer's contribution to Welfare Fund 2.62 2.59
Total 271.84 250.58
b) Defined benefit plans
The following tables summaries the components of net benefit expense recognised in the statement of profit or loss and the funded status and amounts recognised in the balance sheet for the respective plans.
i) Reconciliation of opening and closing balance of defined benefit obligation
(` in Lakhs)
Particulars
Gratuity (Non Funded)As at
31st March 2018As at
31st March 2017
Defined benefit obligation at beginning of the year 317.38 226.67
Current service cost 83.90 64.68 Past service cost 61.16 - Interest cost 24.60 17.00 Benefits paid (62.92) (24.46)Remeasurement of (gain)/loss recognised in other comprehensive income Actuarial changes arising from changes in demographic
assumptions - -
Actuarial changes arising from changes in financial assumptions
(19.92) 12.55
Actuarial changes arising from changes in experience adjustments
21.57 20.95
Defined benefit obligation at end of the year 425.77 317.38
HPL Electric & Power Limited
104
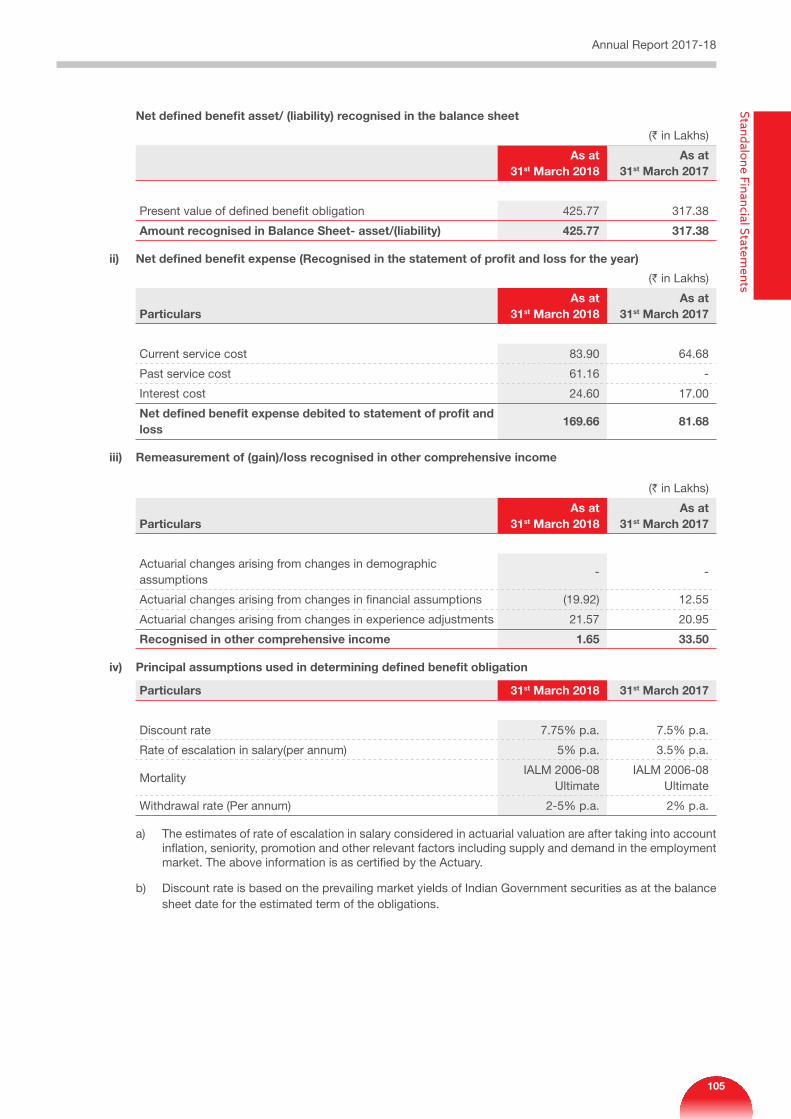
Net defined benefit asset/ (liability) recognised in the balance sheet
(` in Lakhs)
As at 31st March 2018
As at 31st March 2017
Present value of defined benefit obligation 425.77 317.38
Amount recognised in Balance Sheet- asset/(liability) 425.77 317.38
ii) Net defined benefit expense (Recognised in the statement of profit and loss for the year)
(` in Lakhs)
ParticularsAs at
31st March 2018As at
31st March 2017
Current service cost 83.90 64.68
Past service cost 61.16 -
Interest cost 24.60 17.00
Net defined benefit expense debited to statement of profit and loss
169.66 81.68
iii) Remeasurement of (gain)/loss recognised in other comprehensive income
(` in Lakhs)
ParticularsAs at
31st March 2018As at
31st March 2017
Actuarial changes arising from changes in demographic assumptions
- -
Actuarial changes arising from changes in financial assumptions (19.92) 12.55
Actuarial changes arising from changes in experience adjustments 21.57 20.95
Recognised in other comprehensive income 1.65 33.50
iv) Principal assumptions used in determining defined benefit obligation
Particulars 31st March 2018 31st March 2017
Discount rate 7.75% p.a. 7.5% p.a.
Rate of escalation in salary(per annum) 5% p.a. 3.5% p.a.
MortalityIALM 2006-08
UltimateIALM 2006-08
Ultimate
Withdrawal rate (Per annum) 2-5% p.a. 2% p.a.
a) The estimates of rate of escalation in salary considered in actuarial valuation are after taking into account inflation, seniority, promotion and other relevant factors including supply and demand in the employment market. The above information is as certified by the Actuary.
b) Discount rate is based on the prevailing market yields of Indian Government securities as at the balance sheet date for the estimated term of the obligations.
Annual Report 2017-18Standalone Financial Statem
ents
105
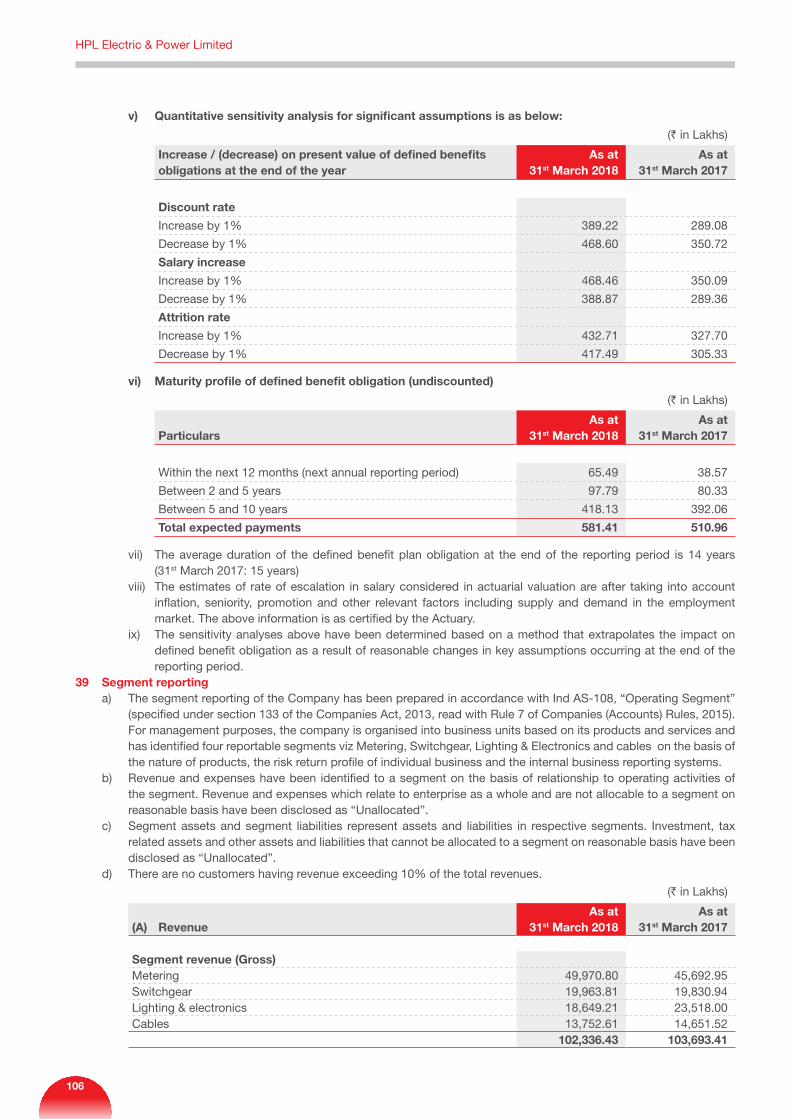
v) Quantitative sensitivity analysis for significant assumptions is as below:
(` in Lakhs)
Increase / (decrease) on present value of defined benefits obligations at the end of the year
As at 31st March 2018
As at 31st March 2017
Discount rate
Increase by 1% 389.22 289.08
Decrease by 1% 468.60 350.72
Salary increase
Increase by 1% 468.46 350.09
Decrease by 1% 388.87 289.36
Attrition rate
Increase by 1% 432.71 327.70
Decrease by 1% 417.49 305.33
vi) Maturity profile of defined benefit obligation (undiscounted)
(` in Lakhs)
ParticularsAs at
31st March 2018As at
31st March 2017
Within the next 12 months (next annual reporting period) 65.49 38.57
Between 2 and 5 years 97.79 80.33
Between 5 and 10 years 418.13 392.06
Total expected payments 581.41 510.96
vii) The average duration of the defined benefit plan obligation at the end of the reporting period is 14 years (31st March 2017: 15 years)
viii) The estimates of rate of escalation in salary considered in actuarial valuation are after taking into account inflation, seniority, promotion and other relevant factors including supply and demand in the employment market. The above information is as certified by the Actuary.
ix) The sensitivity analyses above have been determined based on a method that extrapolates the impact on defined benefit obligation as a result of reasonable changes in key assumptions occurring at the end of the reporting period.
39 Segment reporting a) The segment reporting of the Company has been prepared in accordance with Ind AS-108, “Operating Segment”
(specified under section 133 of the Companies Act, 2013, read with Rule 7 of Companies (Accounts) Rules, 2015). For management purposes, the company is organised into business units based on its products and services and has identified four reportable segments viz Metering, Switchgear, Lighting & Electronics and cables on the basis of the nature of products, the risk return profile of individual business and the internal business reporting systems.
b) Revenue and expenses have been identified to a segment on the basis of relationship to operating activities of the segment. Revenue and expenses which relate to enterprise as a whole and are not allocable to a segment on reasonable basis have been disclosed as “Unallocated”.
c) Segment assets and segment liabilities represent assets and liabilities in respective segments. Investment, tax related assets and other assets and liabilities that cannot be allocated to a segment on reasonable basis have been disclosed as “Unallocated”.
d) There are no customers having revenue exceeding 10% of the total revenues.
(` in Lakhs)
(A) RevenueAs at
31st March 2018As at
31st March 2017
Segment revenue (Gross)Metering 49,970.80 45,692.95 Switchgear 19,963.81 19,830.94 Lighting & electronics 18,649.21 23,518.00 Cables 13,752.61 14,651.52
102,336.43 103,693.41
HPL Electric & Power Limited
106
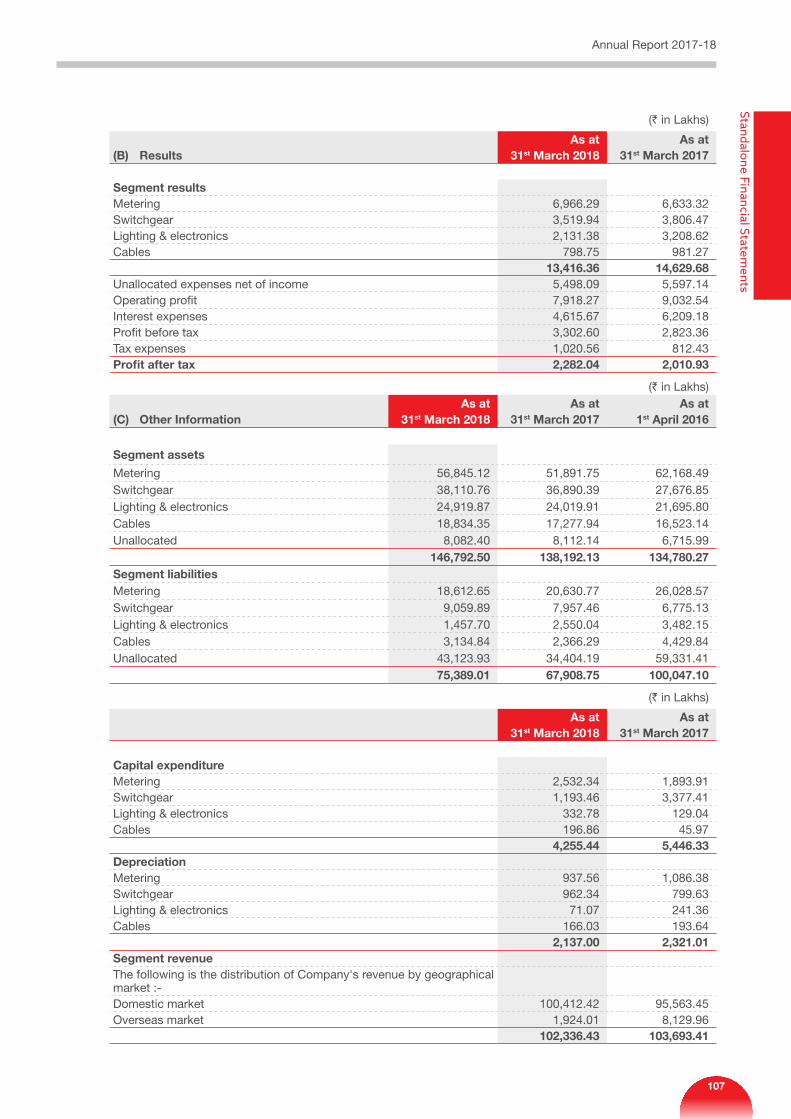
(` in Lakhs)
(B) ResultsAs at
31st March 2018As at
31st March 2017
Segment results Metering 6,966.29 6,633.32 Switchgear 3,519.94 3,806.47 Lighting & electronics 2,131.38 3,208.62 Cables 798.75 981.27
13,416.36 14,629.68 Unallocated expenses net of income 5,498.09 5,597.14 Operating profit 7,918.27 9,032.54 Interest expenses 4,615.67 6,209.18 Profit before tax 3,302.60 2,823.36 Tax expenses 1,020.56 812.43 Profit after tax 2,282.04 2,010.93
(` in Lakhs)
(C) Other InformationAs at
31st March 2018As at
31st March 2017As at
1st April 2016
Segment assets
Metering 56,845.12 51,891.75 62,168.49 Switchgear 38,110.76 36,890.39 27,676.85 Lighting & electronics 24,919.87 24,019.91 21,695.80 Cables 18,834.35 17,277.94 16,523.14 Unallocated 8,082.40 8,112.14 6,715.99
146,792.50 138,192.13 134,780.27 Segment liabilitiesMetering 18,612.65 20,630.77 26,028.57 Switchgear 9,059.89 7,957.46 6,775.13 Lighting & electronics 1,457.70 2,550.04 3,482.15 Cables 3,134.84 2,366.29 4,429.84 Unallocated 43,123.93 34,404.19 59,331.41
75,389.01 67,908.75 100,047.10
(` in Lakhs)
As at 31st March 2018
As at 31st March 2017
Capital expenditure Metering 2,532.34 1,893.91 Switchgear 1,193.46 3,377.41 Lighting & electronics 332.78 129.04 Cables 196.86 45.97
4,255.44 5,446.33 DepreciationMetering 937.56 1,086.38 Switchgear 962.34 799.63 Lighting & electronics 71.07 241.36 Cables 166.03 193.64
2,137.00 2,321.01 Segment revenueThe following is the distribution of Company's revenue by geographical market :-Domestic market 100,412.42 95,563.45 Overseas market 1,924.01 8,129.96
102,336.43 103,693.41
Annual Report 2017-18Standalone Financial Statem
ents
107
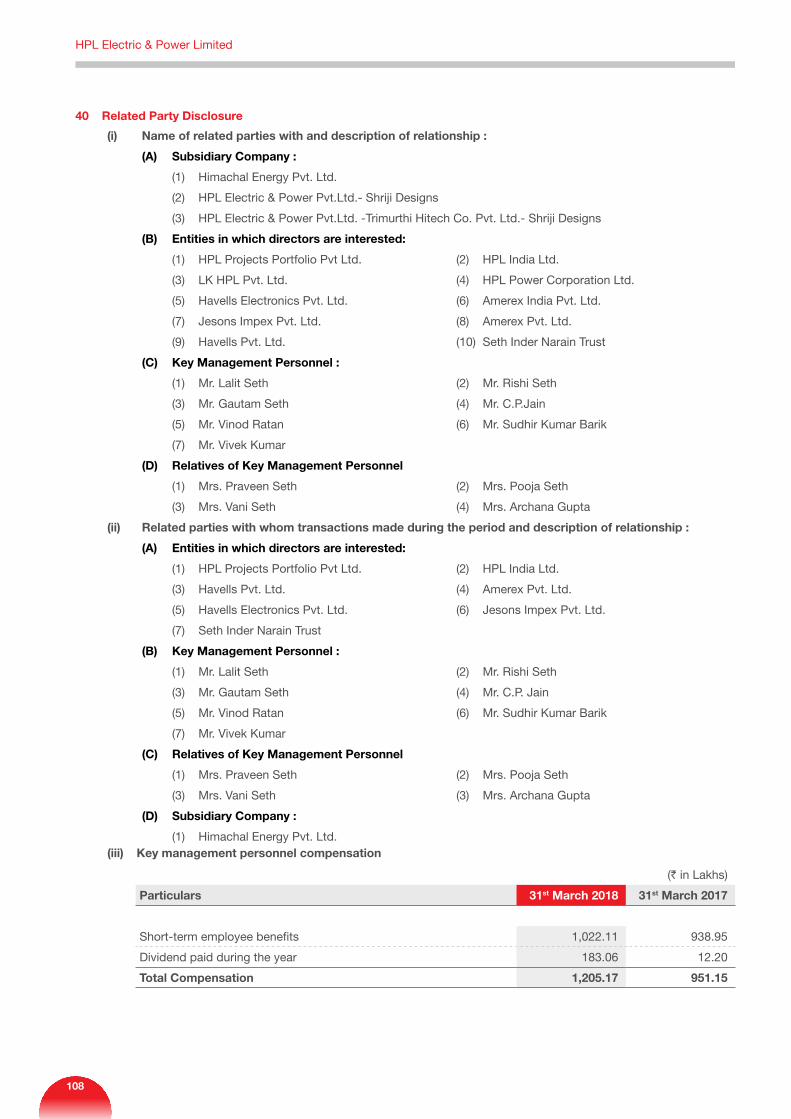
40 Related Party Disclosure
(i) Name of related parties with and description of relationship :
(A) Subsidiary Company :
(1) Himachal Energy Pvt. Ltd.
(2) HPL Electric & Power Pvt.Ltd.- Shriji Designs
(3) HPL Electric & Power Pvt.Ltd. -Trimurthi Hitech Co. Pvt. Ltd.- Shriji Designs
(B) Entities in which directors are interested:
(1) HPL Projects Portfolio Pvt Ltd. (2) HPL India Ltd.
(3) LK HPL Pvt. Ltd. (4) HPL Power Corporation Ltd.
(5) Havells Electronics Pvt. Ltd. (6) Amerex India Pvt. Ltd.
(7) Jesons Impex Pvt. Ltd. (8) Amerex Pvt. Ltd.
(9) Havells Pvt. Ltd. (10) Seth Inder Narain Trust
(C) Key Management Personnel :
(1) Mr. Lalit Seth (2) Mr. Rishi Seth
(3) Mr. Gautam Seth (4) Mr. C.P.Jain
(5) Mr. Vinod Ratan (6) Mr. Sudhir Kumar Barik
(7) Mr. Vivek Kumar
(D) Relatives of Key Management Personnel
(1) Mrs. Praveen Seth (2) Mrs. Pooja Seth
(3) Mrs. Vani Seth (4) Mrs. Archana Gupta
(ii) Related parties with whom transactions made during the period and description of relationship :
(A) Entities in which directors are interested:
(1) HPL Projects Portfolio Pvt Ltd. (2) HPL India Ltd.
(3) Havells Pvt. Ltd. (4) Amerex Pvt. Ltd.
(5) Havells Electronics Pvt. Ltd. (6) Jesons Impex Pvt. Ltd.
(7) Seth Inder Narain Trust
(B) Key Management Personnel :
(1) Mr. Lalit Seth (2) Mr. Rishi Seth
(3) Mr. Gautam Seth (4) Mr. C.P. Jain
(5) Mr. Vinod Ratan (6) Mr. Sudhir Kumar Barik
(7) Mr. Vivek Kumar
(C) Relatives of Key Management Personnel
(1) Mrs. Praveen Seth (2) Mrs. Pooja Seth
(3) Mrs. Vani Seth (3) Mrs. Archana Gupta
(D) Subsidiary Company :
(1) Himachal Energy Pvt. Ltd.(iii) Key management personnel compensation
(` in Lakhs)
Particulars 31st March 2018 31st March 2017
Short-term employee benefits 1,022.11 938.95
Dividend paid during the year 183.06 12.20
Total Compensation 1,205.17 951.15
HPL Electric & Power Limited
108
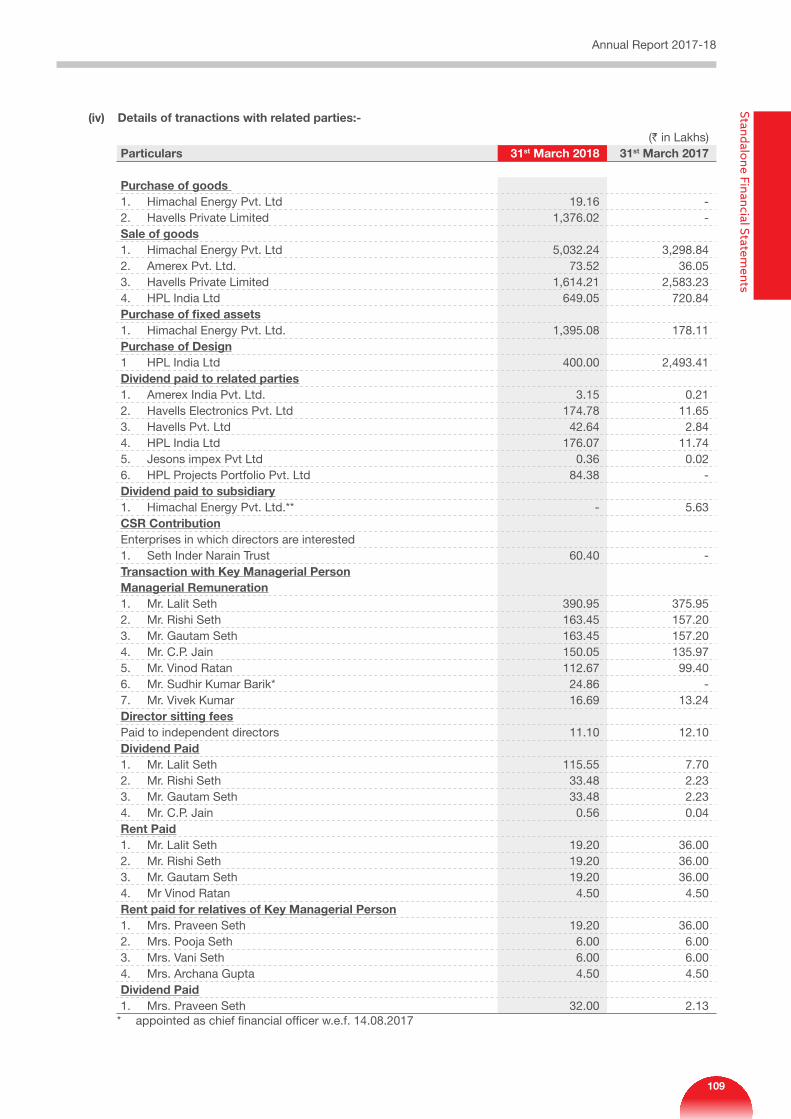
(iv) Details of tranactions with related parties:-
(` in Lakhs)Particulars 31st March 2018 31st March 2017
Purchase of goods 1. Himachal Energy Pvt. Ltd 19.16 - 2. Havells Private Limited 1,376.02 - Sale of goods1. Himachal Energy Pvt. Ltd 5,032.24 3,298.84 2. Amerex Pvt. Ltd. 73.52 36.05 3. Havells Private Limited 1,614.21 2,583.23 4. HPL India Ltd 649.05 720.84 Purchase of fixed assets1. Himachal Energy Pvt. Ltd. 1,395.08 178.11 Purchase of Design1 HPL India Ltd 400.00 2,493.41 Dividend paid to related parties1. Amerex India Pvt. Ltd. 3.15 0.21 2. Havells Electronics Pvt. Ltd 174.78 11.65 3. Havells Pvt. Ltd 42.64 2.84 4. HPL India Ltd 176.07 11.74 5. Jesons impex Pvt Ltd 0.36 0.02 6. HPL Projects Portfolio Pvt. Ltd 84.38 - Dividend paid to subsidiary1. Himachal Energy Pvt. Ltd.** - 5.63 CSR ContributionEnterprises in which directors are interested1. Seth Inder Narain Trust 60.40 - Transaction with Key Managerial PersonManagerial Remuneration1. Mr. Lalit Seth 390.95 375.95 2. Mr. Rishi Seth 163.45 157.20 3. Mr. Gautam Seth 163.45 157.20 4. Mr. C.P. Jain 150.05 135.97 5. Mr. Vinod Ratan 112.67 99.40 6. Mr. Sudhir Kumar Barik* 24.86 - 7. Mr. Vivek Kumar 16.69 13.24 Director sitting feesPaid to independent directors 11.10 12.10 Dividend Paid1. Mr. Lalit Seth 115.55 7.70 2. Mr. Rishi Seth 33.48 2.23 3. Mr. Gautam Seth 33.48 2.23 4. Mr. C.P. Jain 0.56 0.04 Rent Paid1. Mr. Lalit Seth 19.20 36.00 2. Mr. Rishi Seth 19.20 36.00 3. Mr. Gautam Seth 19.20 36.00 4. Mr Vinod Ratan 4.50 4.50 Rent paid for relatives of Key Managerial Person1. Mrs. Praveen Seth 19.20 36.00 2. Mrs. Pooja Seth 6.00 6.00 3. Mrs. Vani Seth 6.00 6.00 4. Mrs. Archana Gupta 4.50 4.50 Dividend Paid1. Mrs. Praveen Seth 32.00 2.13
* appointed as chief financial officer w.e.f. 14.08.2017
Annual Report 2017-18Standalone Financial Statem
ents
109
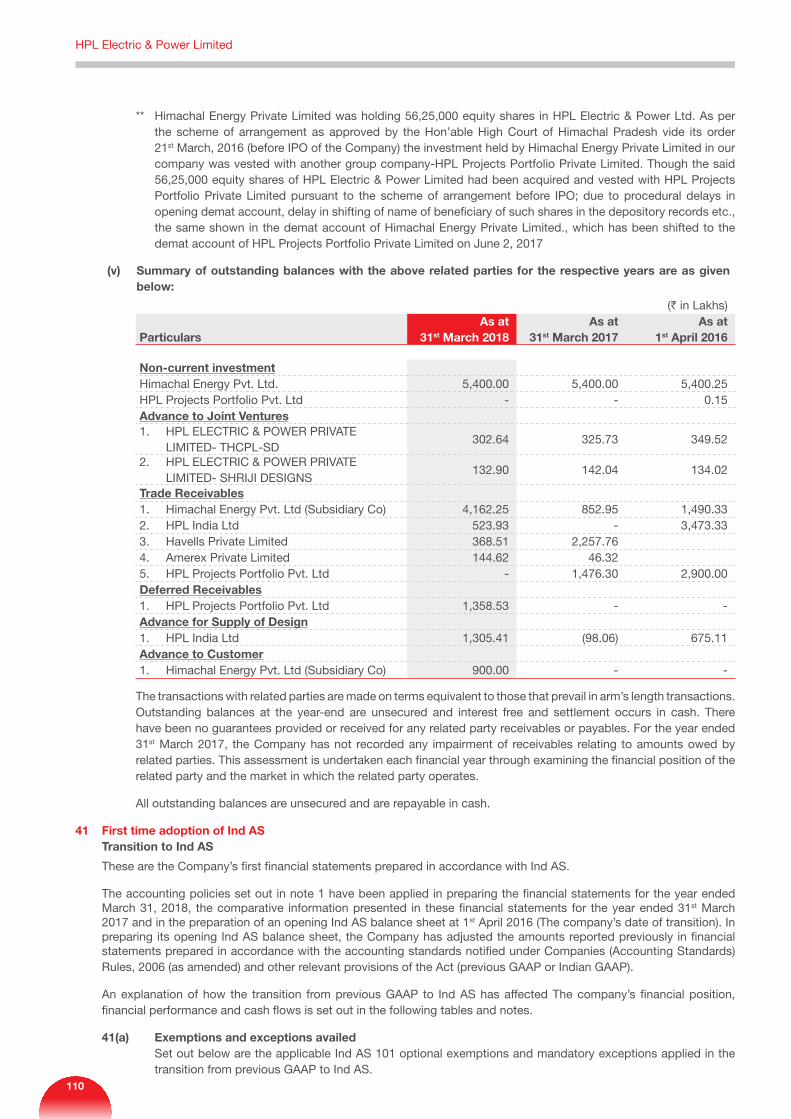
** Himachal Energy Private Limited was holding 56,25,000 equity shares in HPL Electric & Power Ltd. As per the scheme of arrangement as approved by the Hon’able High Court of Himachal Pradesh vide its order 21st March, 2016 (before IPO of the Company) the investment held by Himachal Energy Private Limited in our company was vested with another group company-HPL Projects Portfolio Private Limited. Though the said 56,25,000 equity shares of HPL Electric & Power Limited had been acquired and vested with HPL Projects Portfolio Private Limited pursuant to the scheme of arrangement before IPO; due to procedural delays in opening demat account, delay in shifting of name of beneficiary of such shares in the depository records etc., the same shown in the demat account of Himachal Energy Private Limited., which has been shifted to the demat account of HPL Projects Portfolio Private Limited on June 2, 2017
(v) Summary of outstanding balances with the above related parties for the respective years are as given below:
(` in Lakhs)
ParticularsAs at
31st March 2018As at
31st March 2017As at
1st April 2016
Non-current investmentHimachal Energy Pvt. Ltd. 5,400.00 5,400.00 5,400.25 HPL Projects Portfolio Pvt. Ltd - - 0.15 Advance to Joint Ventures1. HPL ELECTRIC & POWER PRIVATE
LIMITED- THCPL-SD 302.64 325.73 349.52
2. HPL ELECTRIC & POWER PRIVATE LIMITED- SHRIJI DESIGNS
132.90 142.04 134.02
Trade Receivables1. Himachal Energy Pvt. Ltd (Subsidiary Co) 4,162.25 852.95 1,490.33 2. HPL India Ltd 523.93 - 3,473.33 3. Havells Private Limited 368.51 2,257.76 4. Amerex Private Limited 144.62 46.32 5. HPL Projects Portfolio Pvt. Ltd - 1,476.30 2,900.00 Deferred Receivables1. HPL Projects Portfolio Pvt. Ltd 1,358.53 - - Advance for Supply of Design1. HPL India Ltd 1,305.41 (98.06) 675.11 Advance to Customer1. Himachal Energy Pvt. Ltd (Subsidiary Co) 900.00 - -
The transactions with related parties are made on terms equivalent to those that prevail in arm’s length transactions. Outstanding balances at the year-end are unsecured and interest free and settlement occurs in cash. There have been no guarantees provided or received for any related party receivables or payables. For the year ended 31st March 2017, the Company has not recorded any impairment of receivables relating to amounts owed by related parties. This assessment is undertaken each financial year through examining the financial position of the related party and the market in which the related party operates.
All outstanding balances are unsecured and are repayable in cash.
41 First time adoption of Ind AS Transition to Ind AS
These are the Company’s first financial statements prepared in accordance with Ind AS.
The accounting policies set out in note 1 have been applied in preparing the financial statements for the year ended March 31, 2018, the comparative information presented in these financial statements for the year ended 31st March 2017 and in the preparation of an opening Ind AS balance sheet at 1st April 2016 (The company’s date of transition). In preparing its opening Ind AS balance sheet, the Company has adjusted the amounts reported previously in financial statements prepared in accordance with the accounting standards notified under Companies (Accounting Standards) Rules, 2006 (as amended) and other relevant provisions of the Act (previous GAAP or Indian GAAP).
An explanation of how the transition from previous GAAP to Ind AS has affected The company’s financial position, financial performance and cash flows is set out in the following tables and notes.
41(a) Exemptions and exceptions availed Set out below are the applicable Ind AS 101 optional exemptions and mandatory exceptions applied in the
transition from previous GAAP to Ind AS.
HPL Electric & Power Limited
110
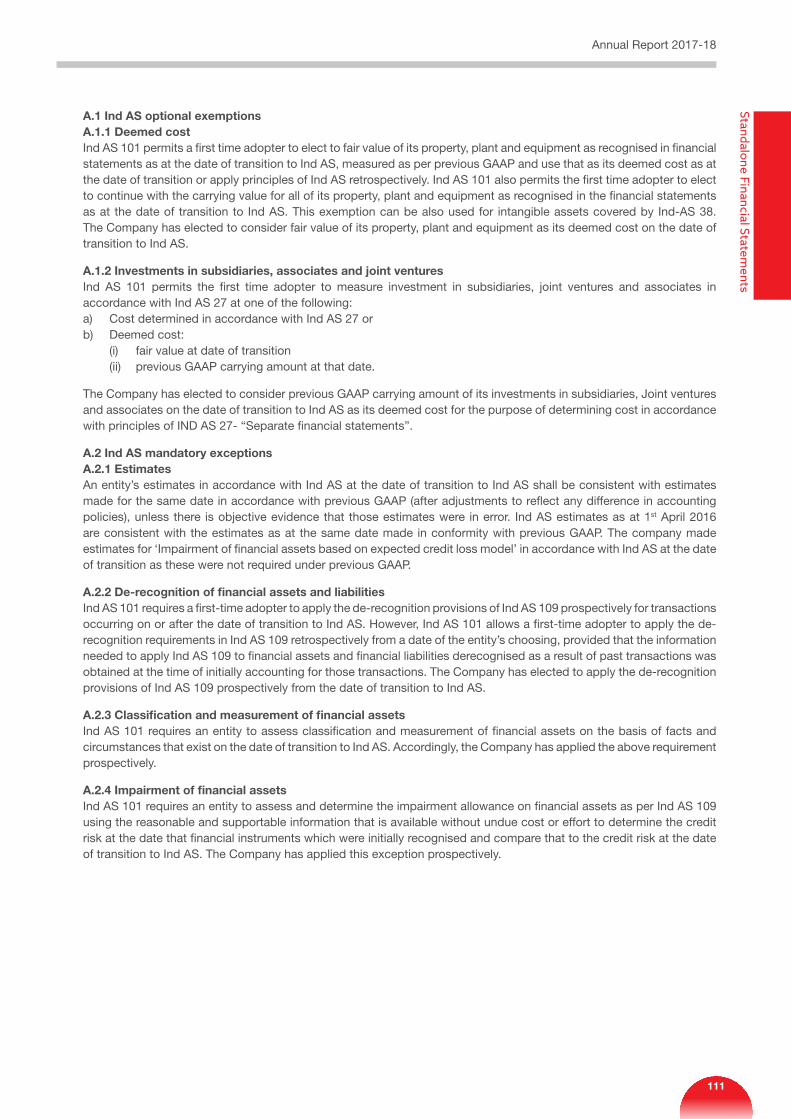
A.1 Ind AS optional exemptionsA.1.1 Deemed cost Ind AS 101 permits a first time adopter to elect to fair value of its property, plant and equipment as recognised in financial statements as at the date of transition to Ind AS, measured as per previous GAAP and use that as its deemed cost as at the date of transition or apply principles of Ind AS retrospectively. Ind AS 101 also permits the first time adopter to elect to continue with the carrying value for all of its property, plant and equipment as recognised in the financial statements as at the date of transition to Ind AS. This exemption can be also used for intangible assets covered by Ind-AS 38. The Company has elected to consider fair value of its property, plant and equipment as its deemed cost on the date of transition to Ind AS.
A.1.2 Investments in subsidiaries, associates and joint ventures Ind AS 101 permits the first time adopter to measure investment in subsidiaries, joint ventures and associates in accordance with Ind AS 27 at one of the following:a) Cost determined in accordance with Ind AS 27 orb) Deemed cost: (i) fair value at date of transition (ii) previous GAAP carrying amount at that date.
The Company has elected to consider previous GAAP carrying amount of its investments in subsidiaries, Joint ventures and associates on the date of transition to Ind AS as its deemed cost for the purpose of determining cost in accordance with principles of IND AS 27- “Separate financial statements”.
A.2 Ind AS mandatory exceptionsA.2.1 Estimates An entity’s estimates in accordance with Ind AS at the date of transition to Ind AS shall be consistent with estimates made for the same date in accordance with previous GAAP (after adjustments to reflect any difference in accounting policies), unless there is objective evidence that those estimates were in error. Ind AS estimates as at 1st April 2016 are consistent with the estimates as at the same date made in conformity with previous GAAP. The company made estimates for ‘Impairment of financial assets based on expected credit loss model’ in accordance with Ind AS at the date of transition as these were not required under previous GAAP.
A.2.2 De-recognition of financial assets and liabilities Ind AS 101 requires a first-time adopter to apply the de-recognition provisions of Ind AS 109 prospectively for transactions occurring on or after the date of transition to Ind AS. However, Ind AS 101 allows a first-time adopter to apply the de-recognition requirements in Ind AS 109 retrospectively from a date of the entity’s choosing, provided that the information needed to apply Ind AS 109 to financial assets and financial liabilities derecognised as a result of past transactions was obtained at the time of initially accounting for those transactions. The Company has elected to apply the de-recognition provisions of Ind AS 109 prospectively from the date of transition to Ind AS.
A.2.3 Classification and measurement of financial assets Ind AS 101 requires an entity to assess classification and measurement of financial assets on the basis of facts and circumstances that exist on the date of transition to Ind AS. Accordingly, the Company has applied the above requirement prospectively.
A.2.4 Impairment of financial assets Ind AS 101 requires an entity to assess and determine the impairment allowance on financial assets as per Ind AS 109 using the reasonable and supportable information that is available without undue cost or effort to determine the credit risk at the date that financial instruments which were initially recognised and compare that to the credit risk at the date of transition to Ind AS. The Company has applied this exception prospectively.
Annual Report 2017-18Standalone Financial Statem
ents
111
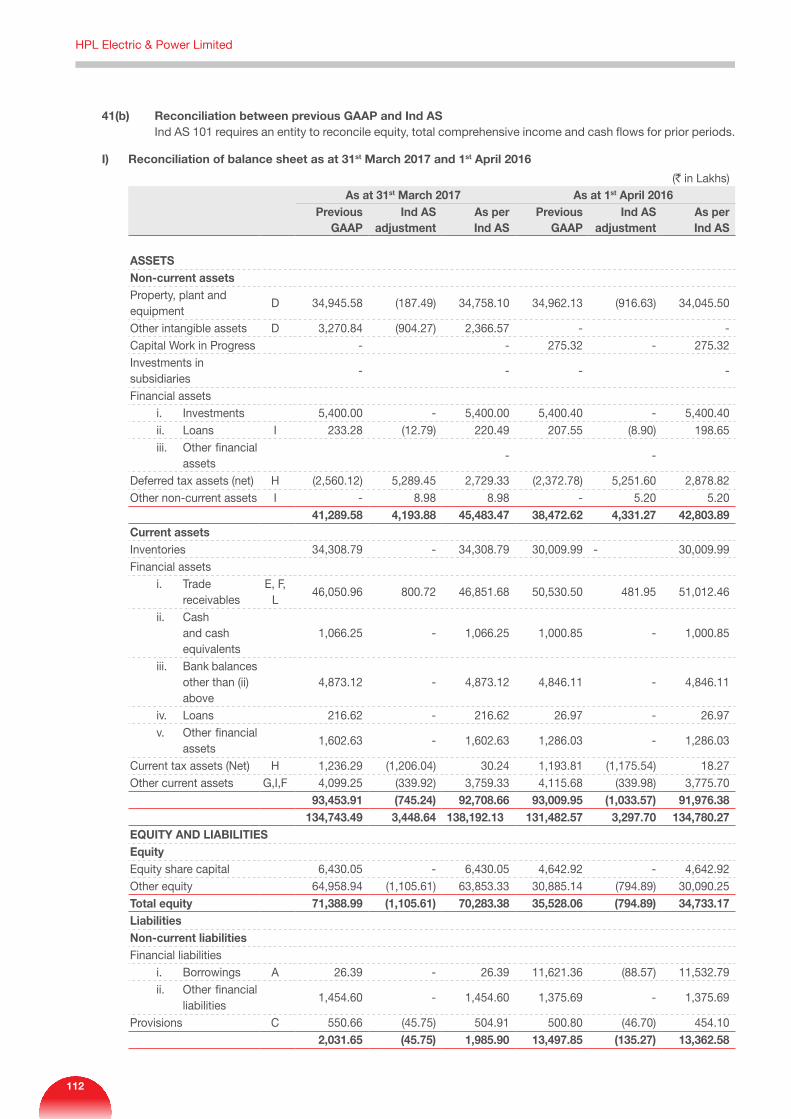
41(b) Reconciliation between previous GAAP and Ind AS Ind AS 101 requires an entity to reconcile equity, total comprehensive income and cash flows for prior periods.
I) Reconciliation of balance sheet as at 31st March 2017 and 1st April 2016
(` in Lakhs)As at 31st March 2017 As at 1st April 2016
Previous GAAP
Ind AS adjustment
As per Ind AS
Previous GAAP
Ind AS adjustment
As per Ind AS
ASSETS Non-current assets Property, plant and equipment
D 34,945.58 (187.49) 34,758.10 34,962.13 (916.63) 34,045.50
Other intangible assets D 3,270.84 (904.27) 2,366.57 - - Capital Work in Progress - - 275.32 - 275.32 Investments in subsidiaries
- - - -
Financial assets i. Investments 5,400.00 - 5,400.00 5,400.40 - 5,400.40 ii. Loans I 233.28 (12.79) 220.49 207.55 (8.90) 198.65 iii. Other financial
assets - -
Deferred tax assets (net) H (2,560.12) 5,289.45 2,729.33 (2,372.78) 5,251.60 2,878.82 Other non-current assets I - 8.98 8.98 - 5.20 5.20
41,289.58 4,193.88 45,483.47 38,472.62 4,331.27 42,803.89 Current assets Inventories 34,308.79 - 34,308.79 30,009.99 - 30,009.99 Financial assets i. Trade
receivables E, F,
L 46,050.96 800.72 46,851.68 50,530.50 481.95 51,012.46
ii. Cash and cash equivalents
1,066.25 - 1,066.25 1,000.85 - 1,000.85
iii. Bank balances other than (ii) above
4,873.12 - 4,873.12 4,846.11 - 4,846.11
iv. Loans 216.62 - 216.62 26.97 - 26.97 v. Other financial
assets 1,602.63 - 1,602.63 1,286.03 - 1,286.03
Current tax assets (Net) H 1,236.29 (1,206.04) 30.24 1,193.81 (1,175.54) 18.27 Other current assets G,I,F 4,099.25 (339.92) 3,759.33 4,115.68 (339.98) 3,775.70
93,453.91 (745.24) 92,708.66 93,009.95 (1,033.57) 91,976.38 134,743.49 3,448.64 138,192.13 131,482.57 3,297.70 134,780.27
EQUITY AND LIABILITIES Equity Equity share capital 6,430.05 - 6,430.05 4,642.92 - 4,642.92 Other equity 64,958.94 (1,105.61) 63,853.33 30,885.14 (794.89) 30,090.25 Total equity 71,388.99 (1,105.61) 70,283.38 35,528.06 (794.89) 34,733.17 Liabilities Non-current liabilities Financial liabilities i. Borrowings A 26.39 - 26.39 11,621.36 (88.57) 11,532.79 ii. Other financial
liabilities 1,454.60 - 1,454.60 1,375.69 - 1,375.69
Provisions C 550.66 (45.75) 504.91 500.80 (46.70) 454.10 2,031.65 (45.75) 1,985.90 13,497.85 (135.27) 13,362.58
HPL Electric & Power Limited
112
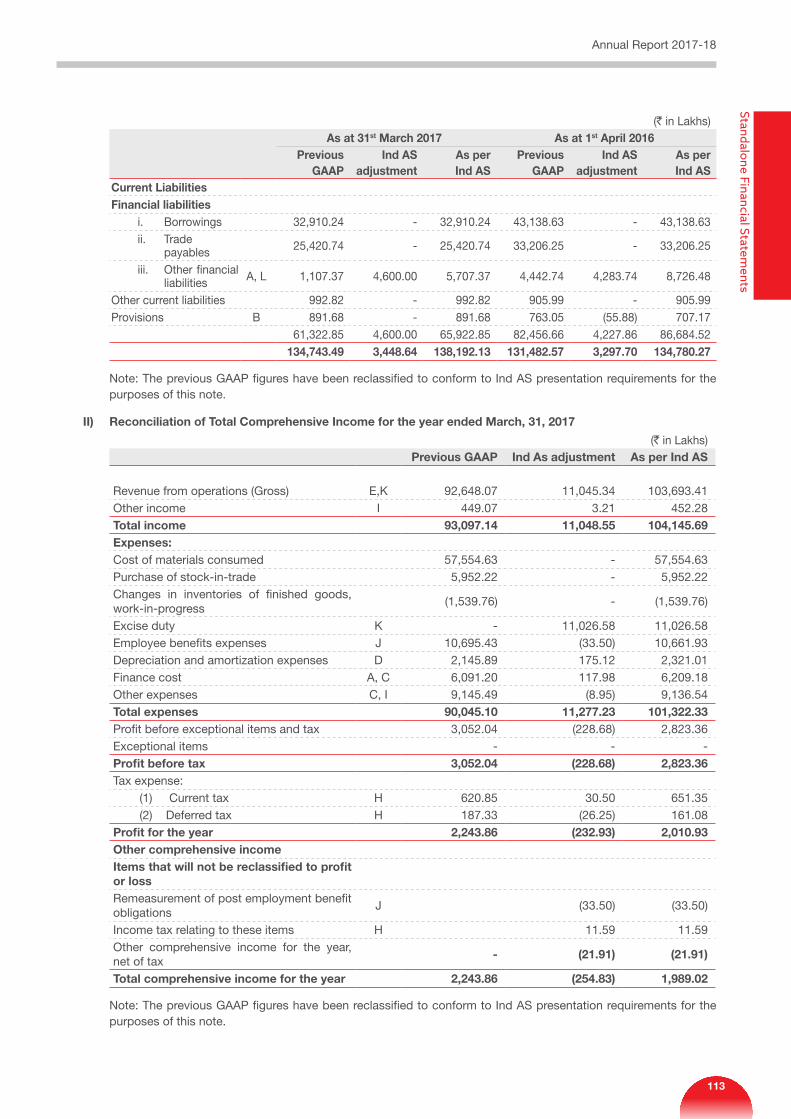
(` in Lakhs)As at 31st March 2017 As at 1st April 2016
Previous GAAP
Ind AS adjustment
As per Ind AS
Previous GAAP
Ind AS adjustment
As per Ind AS
Current Liabilities Financial liabilities i. Borrowings 32,910.24 - 32,910.24 43,138.63 - 43,138.63 ii. Trade
payables 25,420.74 - 25,420.74 33,206.25 - 33,206.25
iii. Other financial liabilities A, L 1,107.37 4,600.00 5,707.37 4,442.74 4,283.74 8,726.48
Other current liabilities 992.82 - 992.82 905.99 - 905.99 Provisions B 891.68 - 891.68 763.05 (55.88) 707.17
61,322.85 4,600.00 65,922.85 82,456.66 4,227.86 86,684.52 134,743.49 3,448.64 138,192.13 131,482.57 3,297.70 134,780.27
Note: The previous GAAP figures have been reclassified to conform to Ind AS presentation requirements for the purposes of this note.
II) Reconciliation of Total Comprehensive Income for the year ended March, 31, 2017
(` in Lakhs) Previous GAAP Ind As adjustment As per Ind AS
Revenue from operations (Gross) E,K 92,648.07 11,045.34 103,693.41 Other income I 449.07 3.21 452.28 Total income 93,097.14 11,048.55 104,145.69 Expenses:Cost of materials consumed 57,554.63 - 57,554.63 Purchase of stock-in-trade 5,952.22 - 5,952.22 Changes in inventories of finished goods, work-in-progress
(1,539.76) - (1,539.76)
Excise duty K - 11,026.58 11,026.58 Employee benefits expenses J 10,695.43 (33.50) 10,661.93 Depreciation and amortization expenses D 2,145.89 175.12 2,321.01 Finance cost A, C 6,091.20 117.98 6,209.18 Other expenses C, I 9,145.49 (8.95) 9,136.54 Total expenses 90,045.10 11,277.23 101,322.33 Profit before exceptional items and tax 3,052.04 (228.68) 2,823.36 Exceptional items - - - Profit before tax 3,052.04 (228.68) 2,823.36 Tax expense: (1) Current tax H 620.85 30.50 651.35 (2) Deferred tax H 187.33 (26.25) 161.08 Profit for the year 2,243.86 (232.93) 2,010.93 Other comprehensive incomeItems that will not be reclassified to profit or lossRemeasurement of post employment benefit obligations
J (33.50) (33.50)
Income tax relating to these items H 11.59 11.59 Other comprehensive income for the year, net of tax
- (21.91) (21.91)
Total comprehensive income for the year 2,243.86 (254.83) 1,989.02
Note: The previous GAAP figures have been reclassified to conform to Ind AS presentation requirements for the purposes of this note.
Annual Report 2017-18Standalone Financial Statem
ents
113
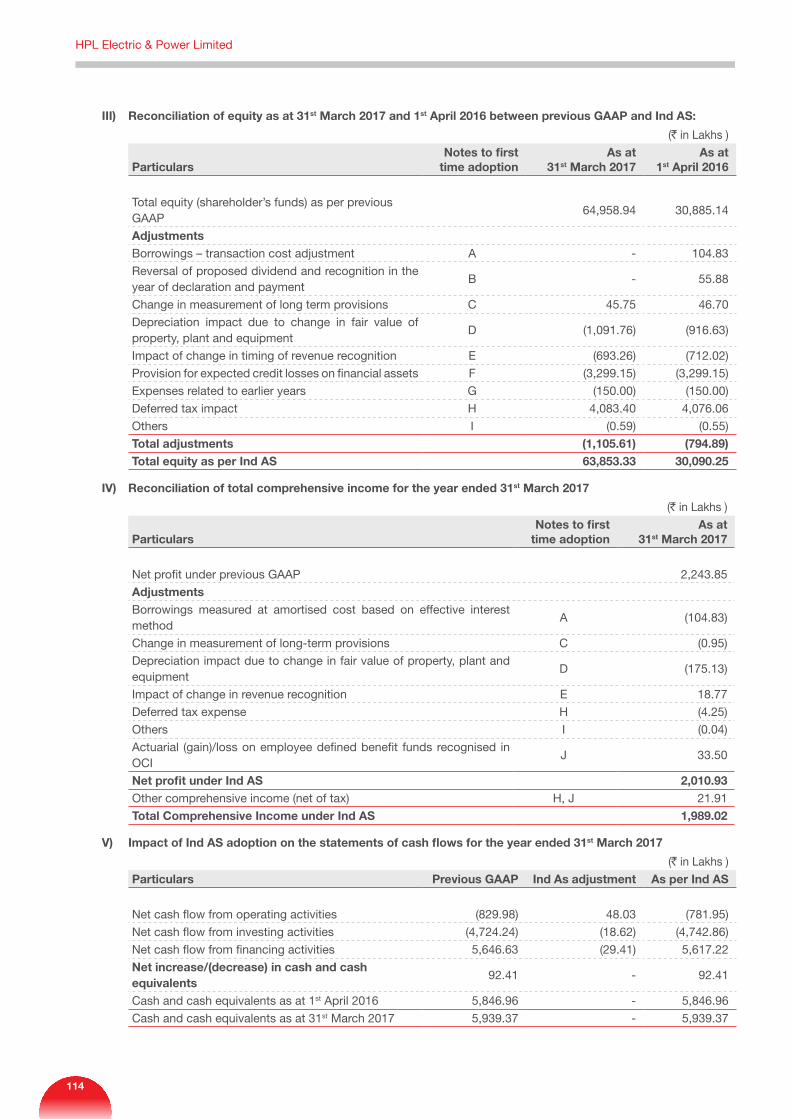
III) Reconciliation of equity as at 31st March 2017 and 1st April 2016 between previous GAAP and Ind AS:
(` in Lakhs )
ParticularsNotes to first
time adoptionAs at
31st March 2017As at
1st April 2016
Total equity (shareholder’s funds) as per previous GAAP
64,958.94 30,885.14
Adjustments
Borrowings – transaction cost adjustment A - 104.83
Reversal of proposed dividend and recognition in the year of declaration and payment
B - 55.88
Change in measurement of long term provisions C 45.75 46.70
Depreciation impact due to change in fair value of property, plant and equipment
D (1,091.76) (916.63)
Impact of change in timing of revenue recognition E (693.26) (712.02)
Provision for expected credit losses on financial assets F (3,299.15) (3,299.15)
Expenses related to earlier years G (150.00) (150.00)
Deferred tax impact H 4,083.40 4,076.06
Others I (0.59) (0.55)
Total adjustments (1,105.61) (794.89)Total equity as per Ind AS 63,853.33 30,090.25
IV) Reconciliation of total comprehensive income for the year ended 31st March 2017
(` in Lakhs )
ParticularsNotes to first
time adoptionAs at
31st March 2017
Net profit under previous GAAP 2,243.85
AdjustmentsBorrowings measured at amortised cost based on effective interest method
A (104.83)
Change in measurement of long-term provisions C (0.95)
Depreciation impact due to change in fair value of property, plant and equipment
D (175.13)
Impact of change in revenue recognition E 18.77
Deferred tax expense H (4.25)
Others I (0.04)
Actuarial (gain)/loss on employee defined benefit funds recognised in OCI
J 33.50
Net profit under Ind AS 2,010.93 Other comprehensive income (net of tax) H, J 21.91
Total Comprehensive Income under Ind AS 1,989.02
V) Impact of Ind AS adoption on the statements of cash flows for the year ended 31st March 2017
(` in Lakhs )
Particulars Previous GAAP Ind As adjustment As per Ind AS
Net cash flow from operating activities (829.98) 48.03 (781.95)
Net cash flow from investing activities (4,724.24) (18.62) (4,742.86)
Net cash flow from financing activities 5,646.63 (29.41) 5,617.22
Net increase/(decrease) in cash and cash equivalents
92.41 - 92.41
Cash and cash equivalents as at 1st April 2016 5,846.96 - 5,846.96
Cash and cash equivalents as at 31st March 2017 5,939.37 - 5,939.37
HPL Electric & Power Limited
114
41(c) Notes to first-time adoption: A Borrowings Under the previous GAAP, transaction costs incurred in connection with borrowings were amortized
upfront and charged to profit or loss for the period. Under Ind AS, transaction costs are included in the initial recognition amount of financial liability and charged to profit or loss using the effective interest method over the period of borrowing.
B Proposed Dividend Under the previous GAAP, proposed dividend including corporate dividend tax (CDT), are recognised as
liability in the period to which they relate, irrespective of when they are declared. Under Ind AS, proposed dividend is recognised as liability in the period in which it is declared by the Company, usually when approved by the shareholders in a general meeting, or paid.
C Change in measurement of long term provisions Under previous GAAP, the Company has accounted for long-term provision, at the undiscounted amount.
In contrast, Ind AS 37 requires that where the effect of time value of money is material, the amount of provision should be the present value of the expenditures expected to be required to settle the obligation. Ind AS 37 also provides that where discounting is used, the carrying amount of a provision increases in each period to reflect the passage of time. This increase is recognised as finance cost.
D Property, plant and equipment (PPE) The Company has elected the option to consider fair value as deemed cost of property, plant & equipment
on the date of transition to Ind AS.
E Revenue recognition During transition to Ind AS, the Company has reassessed its revenue recognition policies. Consequent to
change in policies relating to timing of revenue recognition under Ind AS, retained earnings and profit for the year ended March 31, 2017 has been adjusted.
F Expected credit loss- financial assets As per Ind AS 109, the Company is required to apply expected credit loss model for recognising the
allowance for doubtful debts. Accordingly, the Company has made the provision for expected credit loss as required under Ind AS on the financial assets and trade receivables.
G Expense relating to earlier period Expense relating to earlier period has been adjusted in retained earnings on transition as these pertain to
prior period.
H Deferred tax Under the previous GAAP, deferred tax is calculated using the income statement approach, which
focuses on difference between taxable profits and accounting profits for the period. Ind AS 12-“ Income tax” requires entities to account for deferred taxes using the balance sheet approach, which focuses on temporary differences between the carrying amount of an asset or liability in the balance sheet and its tax base. Application of Ind AS has resulted in recognition of deferred tax on new temporary differences and on the adjustments arising due to adjustments made on transition.
I Others Under the previous GAAP, interest free lease security deposits (that are refundable in cash on completion
of the lease term) are recorded at their transaction value. Under Ind AS, all financial assets are required to be recognised at fair value. Accordingly, the Company has fair valued these security deposits under Ind AS. Difference between the fair value and transaction value of the security deposit has been recognised as prepaid rent.
J Remeasurements of post-employment benefit obligations Under Ind AS, remeasurements i.e. actuarial gains and losses and the return on plan assets, excluding
amounts included in the net interest expense on the net defined benefit liability are recognised in other comprehensive income instead of profit or loss. Under the previous GAAP, these remeasurements were forming part of the profit or loss for the year.
K Excise duty Under the previous GAAP, revenue from sale of products was presented exclusive of excise duty.
Under Ind AS, revenue from sale of goods is presented inclusive of excise duty. The excise duty paid is presented on the face of the statement of profit and loss as part of expenses. This change has resulted in an increase in total revenue and Excide duty expenses for the year ended 31st March 2017. However, there is no impact on the total equity and profit.
Annual Report 2017-18Standalone Financial Statem
ents
115
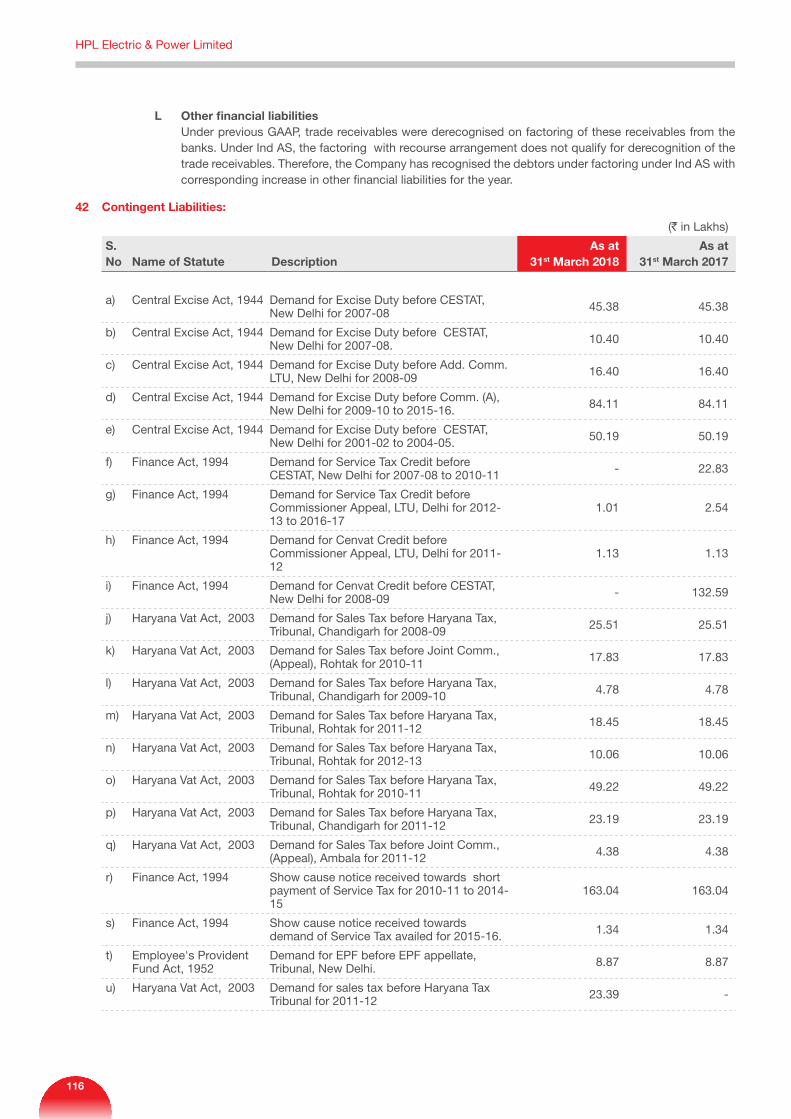
L Other financial liabilities Under previous GAAP, trade receivables were derecognised on factoring of these receivables from the
banks. Under Ind AS, the factoring with recourse arrangement does not qualify for derecognition of the trade receivables. Therefore, the Company has recognised the debtors under factoring under Ind AS with corresponding increase in other financial liabilities for the year.
42 Contingent Liabilities:
(` in Lakhs)
S. No Name of Statute Description
As at 31st March 2018
As at 31st March 2017
a) Central Excise Act, 1944 Demand for Excise Duty before CESTAT, New Delhi for 2007-08 45.38 45.38
b) Central Excise Act, 1944 Demand for Excise Duty before CESTAT, New Delhi for 2007-08. 10.40 10.40
c) Central Excise Act, 1944 Demand for Excise Duty before Add. Comm. LTU, New Delhi for 2008-09 16.40 16.40
d) Central Excise Act, 1944 Demand for Excise Duty before Comm. (A), New Delhi for 2009-10 to 2015-16. 84.11 84.11
e) Central Excise Act, 1944 Demand for Excise Duty before CESTAT, New Delhi for 2001-02 to 2004-05. 50.19 50.19
f) Finance Act, 1994 Demand for Service Tax Credit before CESTAT, New Delhi for 2007-08 to 2010-11 - 22.83
g) Finance Act, 1994 Demand for Service Tax Credit before Commissioner Appeal, LTU, Delhi for 2012-13 to 2016-17
1.01 2.54
h) Finance Act, 1994 Demand for Cenvat Credit before Commissioner Appeal, LTU, Delhi for 2011-12
1.13 1.13
i) Finance Act, 1994 Demand for Cenvat Credit before CESTAT, New Delhi for 2008-09 - 132.59
j) Haryana Vat Act, 2003 Demand for Sales Tax before Haryana Tax, Tribunal, Chandigarh for 2008-09 25.51 25.51
k) Haryana Vat Act, 2003 Demand for Sales Tax before Joint Comm., (Appeal), Rohtak for 2010-11 17.83 17.83
l) Haryana Vat Act, 2003 Demand for Sales Tax before Haryana Tax, Tribunal, Chandigarh for 2009-10 4.78 4.78
m) Haryana Vat Act, 2003 Demand for Sales Tax before Haryana Tax, Tribunal, Rohtak for 2011-12 18.45 18.45
n) Haryana Vat Act, 2003 Demand for Sales Tax before Haryana Tax, Tribunal, Rohtak for 2012-13 10.06 10.06
o) Haryana Vat Act, 2003 Demand for Sales Tax before Haryana Tax, Tribunal, Rohtak for 2010-11 49.22 49.22
p) Haryana Vat Act, 2003 Demand for Sales Tax before Haryana Tax, Tribunal, Chandigarh for 2011-12 23.19 23.19
q) Haryana Vat Act, 2003 Demand for Sales Tax before Joint Comm., (Appeal), Ambala for 2011-12 4.38 4.38
r) Finance Act, 1994 Show cause notice received towards short payment of Service Tax for 2010-11 to 2014-15
163.04 163.04
s) Finance Act, 1994 Show cause notice received towards demand of Service Tax availed for 2015-16. 1.34 1.34
t) Employee's Provident Fund Act, 1952
Demand for EPF before EPF appellate, Tribunal, New Delhi. 8.87 8.87
u) Haryana Vat Act, 2003 Demand for sales tax before Haryana Tax Tribunal for 2011-12 23.39 -
HPL Electric & Power Limited
116
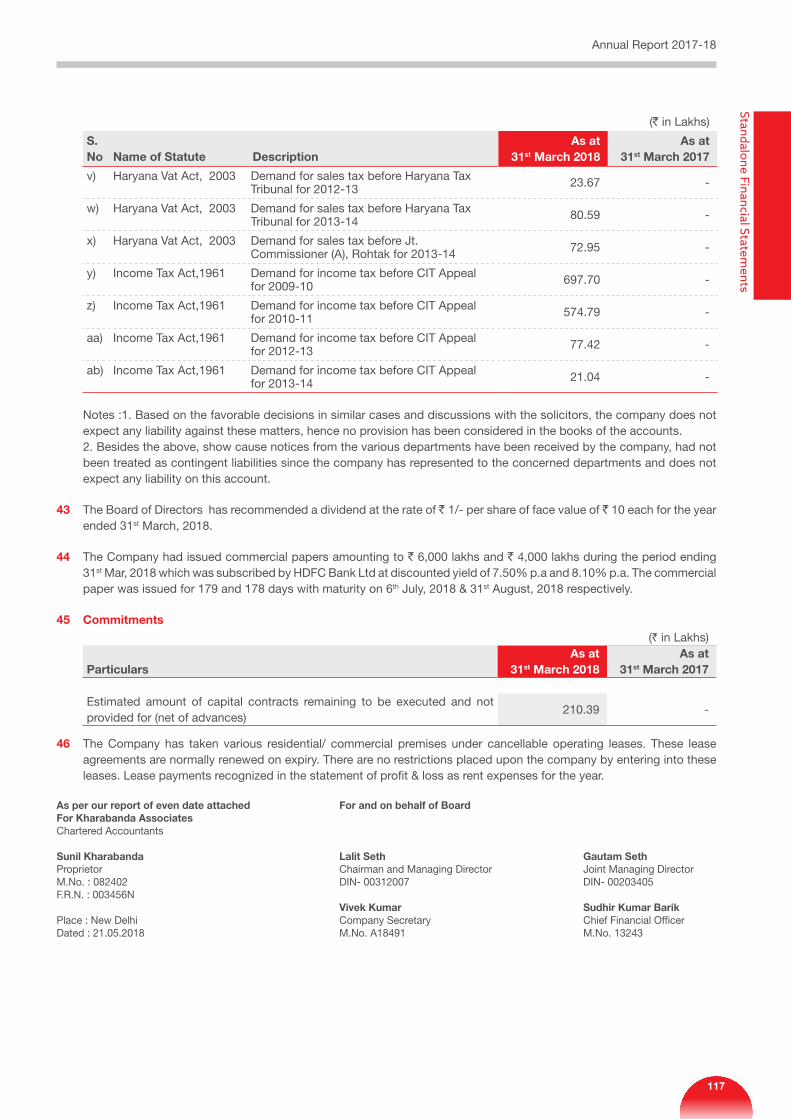
(` in Lakhs)
S. No Name of Statute Description
As at 31st March 2018
As at 31st March 2017
v) Haryana Vat Act, 2003 Demand for sales tax before Haryana Tax Tribunal for 2012-13 23.67 -
w) Haryana Vat Act, 2003 Demand for sales tax before Haryana Tax Tribunal for 2013-14 80.59 -
x) Haryana Vat Act, 2003 Demand for sales tax before Jt. Commissioner (A), Rohtak for 2013-14 72.95 -
y) Income Tax Act,1961 Demand for income tax before CIT Appeal for 2009-10 697.70 -
z) Income Tax Act,1961 Demand for income tax before CIT Appeal for 2010-11 574.79 -
aa) Income Tax Act,1961 Demand for income tax before CIT Appeal for 2012-13 77.42 -
ab) Income Tax Act,1961 Demand for income tax before CIT Appeal for 2013-14 21.04 -
Notes :1. Based on the favorable decisions in similar cases and discussions with the solicitors, the company does not expect any liability against these matters, hence no provision has been considered in the books of the accounts. 2. Besides the above, show cause notices from the various departments have been received by the company, had not been treated as contingent liabilities since the company has represented to the concerned departments and does not expect any liability on this account.
43 The Board of Directors has recommended a dividend at the rate of ` 1/- per share of face value of ` 10 each for the year ended 31st March, 2018.
44 The Company had issued commercial papers amounting to ` 6,000 lakhs and ` 4,000 lakhs during the period ending 31st Mar, 2018 which was subscribed by HDFC Bank Ltd at discounted yield of 7.50% p.a and 8.10% p.a. The commercial paper was issued for 179 and 178 days with maturity on 6th July, 2018 & 31st August, 2018 respectively.
45 Commitments (` in Lakhs)
ParticularsAs at
31st March 2018As at
31st March 2017
Estimated amount of capital contracts remaining to be executed and not provided for (net of advances)
210.39 -
46 The Company has taken various residential/ commercial premises under cancellable operating leases. These lease agreements are normally renewed on expiry. There are no restrictions placed upon the company by entering into these leases. Lease payments recognized in the statement of profit & loss as rent expenses for the year.
As per our report of even date attached For and on behalf of Board For Kharabanda Associates Chartered Accountants
Sunil Kharabanda Lalit Seth Gautam Seth Proprietor Chairman and Managing Director Joint Managing Director M.No. : 082402 DIN- 00312007 DIN- 00203405F.R.N. : 003456N Vivek Kumar Sudhir Kumar Barik Place : New Delhi Company Secretary Chief Financial OfficerDated : 21.05.2018 M.No. A18491 M.No. 13243
Annual Report 2017-18Standalone Financial Statem
ents
117
To the Members of HPL ELECTRIC & POWER LTD.
Report on the Consolidated Ind AS Financial StatementsWe have audited the accompanying consolidated Ind AS financial statement of HPL ELECTRIC & POWER LTD. (‘the Holding Company’) and its subsidiary companies listed in Annexure I (collectively referred to as “the Group) which comprising the Consolidated Balance Sheet as at March 31, 2018, Consolidated statement of Profit and loss (including other comprehensive income) the consolidated statement of changes in equity and the consolidated Cash Flow Statement for the year then ended, and a summary of significant accounting policies and other explanatory information.
Management’s Responsibility for the Consolidated Ind AS Financial StatementsThe Holding Company’s Board of Directors is responsible for the matters stated in Section 134(5) of the Companies Act, 2013 (‘the Act’) with respect to the preparation of these Consolidated Ind AS financial statements that give a true and fair view of the consolidated financial position, consolidated financial performance including other comprehensive income, consolidated cash flows and consolidated statement of changes in equity of the Group in accordance with the Indian Accounting Standard (Ind AS ) prescribed under Section 133 of the Act,read with the companies (Indian Accounting Standard) Rules 2015, as amended, and other accounting principles generally accepted in India.
The respective Board of Directors of the companies in the Group are responsible for maintenance of adequate accounting records in accordance with the provisions of the Act for safeguarding the assets of the group and for preventing and detecting frauds and other irregularities, selection and application of appropriate accounting policies, making judgments and estimates that are reasonable and prudent; and design, implementation and maintenance of adequate internal financial controls, that were operating effectively for ensuring the accuracy and completeness of the accounting records, relevant to the preparation and presentation of the consolidated Ind AS financial statements that give a true and fair view and are free from material misstatement, whether due to fraud or error, which have been used for the purpose of preparation of the consolidated financial Ind AS statements by the Directors of the Company as aforesaid.
Auditor’s Responsibility
Our responsibility is to express an opinion on these consolidated Ind AS financial statements based on our audit.
In conducting our audit we have taken into account the provisions of the Act, the accounting and auditing standards and matters which are required to be included in the audit report under the provisions of the Act and the rules made there under.
We conducted our audit of the consolidated Ind AS financial statements in accordance with the Standards on Auditing specified under section 143(10) of the Act. Those Standards require that we comply with ethical requirements and plan and perform the audit to obtain reasonable assurance about whether the consolidated financial statements are free from material misstatement.
An audit involves performing procedures to obtain audit evidence about the amounts and the disclosures in the consolidated Ind AS financial statements. The procedures selected depend on the auditor’s judgment, including the assessment of the risks of material misstatement of the consolidated Ind AS financial statements, whether due to fraud or error. In making those risk assessments, the auditor considers internal financial control relevant to the Company’s preparation of the consolidated Ind AS financial statements that give a true and fair view in order to design audit procedures that are appropriate in the circumstances. An audit also includes evaluating the appropriateness of accounting policies used and the reasonableness of the accounting estimates made by the Company’s Directors, as well as evaluating the overall presentation of the consolidated Ind AS financial statements.
We believe that the audit evidence we have obtained is sufficient and appropriate to provide a basis for our audit opinion on the consolidated Ind AS financial statements.
OpinionIn our opinion and to the best of our information and according to the explanations given to us and based on the consideration of reports of other auditors on separate financial statements and on the other financial information of the subsidiaries, the aforesaid consolidated Ind AS financial statements give the information required by the Act in the manner so required and give a true and fair view in conformity with the accounting principles generally accepted in India of the consolidated state of affairs of the Group as at March 31,2018 their consolidated profit including other comprehensive income, their consolidated cash flows and consolidated statement of changes in equity for the year ended on that date.
Report on Other Legal and Regulatory Requirements1. As required by section 143(3) of the Act, based on our
audit, we report that:
a) We have sought and obtained all the information and explanations which to the best of our
Independent Auditor’s Report
HPL Electric & Power Limited
118
knowledge and belief were necessary for the purposes of our audit of the aforesaid consolidated Ind AS financial statement.
b) in our opinion, proper books of account as required by law relating to preparation of the aforesaid consolidated Ind AS financial statement have been kept so far as it appears from our examination of those books.
c) the consolidated Balance Sheet, the consolidated Statement of Profit and Loss including other comprehensive income, consolidated statement of changes in equity and the consolidated Cash Flow Statement dealt with by this Report are in agreement with the books of account.
d) In our opinion, the aforesaid consolidated Ind AS financial statements comply with the Indian Accounting Standards specified under section 133 of the Act.
e) on the basis of written representations received from the directors of company as on 31stMarch, 2018 and taken on record by the Board of Directors of the company and its subsidiary incorporated in India and the report of the statutory auditors of its subsidiaries company incorporated in India, none of the directors of the Group companies incorporated in India is disqualified as on 31st March, 2018 from being appointed as a director in terms of section 164(2) of the Act; and
f) With respect to the adequacy of the internal financial controls over financial reporting and the operating effectiveness of such controls, refer to our separate report in “Annexure A” which is based on the auditors reports of the company and its subsidiary company incorporated in India. Our report expresses an unmodified opinion on the adequacy and operating effectiveness of the Company’s internal financial controls over financial reporting.
g) with respect to the other matters to be included in the Auditors’ Report in accordance with Rule 11 of the Companies (Audit and Auditors) Rules, 2014, as amended, in our opinion and to the best of our information and according to the explanations given to us:
i. The Group has disclosed the impact of pending litigation on its financial position in its consolidated financial statements.
ii. The Group did not have any long term contract including derivative contract for which there were any material foreseeable losses.
iii. There was no amount which was required to be transferred to the Investor Education and Protection Fund by the Group.
For Kharabanda AssociatesChartered Accountants
FRN:003456N
Sunil KharabandaPlace: New Delhi ProprietorDate: 21.05.2018 M. No: 082402
Annexure I: List of entities consolidated as at 31st March, 2018
1. Himachal Energy Private Limited
2. HPL Electric & Power Pvt. Ltd. -Shriji Designs
3. HPL Electric & Power Pvt. Ltd. Trimurthi Hitech Co. Pvt. Ltd.-Shriji Designs
Annual Report 2017-18C
onsolidated Financial Statements
119
Referred to in paragraph 1(f) under ‘Report on Other Legal and Regulatory Requirements’ section of our report to the members of HPL Electric & Power Limited of even date)
Report on the Internal Financial Controls Over Financial Reporting under Clause (i) of Sub-section 3 of Section 143 of the Companies Act, 2013 (‘the Act’)In conjunction with our audit of the consolidated Ind AS financial statement of the company as of and for the year then ended March 31, 2018, we have audited the internal financial controls over financial reporting of HPL ELECTRIC & POWER LTD. (‘the Company’) and its subsidiary company which is company incorporated in India as of that date.
Management’s Responsibility for the Internal Financial ControlsThe Board of Directors of the company and its subsidiary company which is company incorporated in India are responsible for establishing and maintaining internal financial controls based on the internal control over financial reporting criteria established by the respective Companies considering the essential components of internal control stated in the Guidance Note on Audit of Internal Financial Controls Over financial Reporting issued by the Institute of Chartered Accountants of India (the ‘Guidance Note’). These responsibilities include the design, implementation and maintenance of adequate internal financial controls that were operating effectively for ensuring the orderly and efficient conduct of its business, including adherence to the respective company’s policies, the safeguarding of its assets, the prevention and detection of frauds and errors, the accuracy and completeness of the accounting records, and the timely preparation of reliable financial information, as required under the Companies Act 2013.
Auditor’s Responsibility Our responsibility is to express an opinion on the internal financial controls over financial reporting of the company and its subsidiary company which is company incorporated in India, based on our audit. We conducted our audit in accordance with the Guidance Note on Audit of Internal financial Controls Over Financial Reporting ( The Guidance Note) issued by the Institute of Chartered Accountants of India and the Standards on Auditing prescribed under Section 143(10) of the Companies Act 2013, to the extant applicable to an audit of internal financial controls. Those Standards and the Guidance Note required that we comply with the ethical requirements and plan and perform the audit to obtain reasonable assurance about internal financial controls over financial reporting was established and maintained and if such controls operated effectively in all material respects.
Our audit involves performing procedures to obtain audit evidence about the adequacy of the internal financial controls system over financial reporting and their operating effectiveness. Our audit of internal financial controls over financial reporting included obtaining an understanding of internal financial controls over financial reporting, assessing the risk that a material weakness exists, and testing and evaluating the design and operating effectiveness of internal control based on the assessed risk. The procedures selected depend of the auditors’ judgment, including the assessment of the risks of material misstatement of the financial statement, whether due to fraud or error.
We believe that the audit evidence we have obtained is sufficient and appropriate to provide a basis for our audit opinion on the internal financial controls system over financial reporting of the company and its subsidiary company which is company incorporated in India.
Meaning of Internal Financial Controls Over Financial ReportingA company’s internal financial controls over financial reporting is a process designed to provide reasonable assurance regarding the reliability of financial reporting and the preparation of financial statements for external purpose in accordance with generally accepted accounting principles. A company’s internal financial controls over financial reporting includes those policies and procedures that (1) pertain to the maintenance of records that, in reasonable detail, accurately and fairly reflect the transactions and dispositions of the assets of the company, (2) provide reasonable assurance that transactions are recorded as necessary to permit preparation of financial statement in accordance with generally accepted accounting principles and that receipts and expenditures of the company are being made only in accordance with authorization of the management and directors of the company, and (3) provide reasonable assurance regarding prevention or timely detection of unauthorized acquisition, use, or disposition of the company’s assets that could have a material effect on the financial statements.
Inherent Limitations of Internal Financial Controls Over Financial ReportingBecause of the inherent limitation of internal financial controls over financial reporting, including the possibility of collusion or improper management override of controls, material misstatements due to error or fraud may occur and not be detected. Also, projections of any evaluation of the internal financial controls over financial reporting to future periods are subject to the risk that the internal financial controls over financial reporting may become inadequate because of
AnnexuRe ‘A’ To The Independent Auditors’ Report
HPL Electric & Power Limited
120
change in conditions, or that the degree of compliance with the policies or procedures may deteriorate.
OpinionIn our opinion, to the best of our information and according to the explanations given to us, the and its subsidiary company which is company incorporated in India has, in all material respects, an adequate internal financial controls system over financial reporting and such internal financial controls over financial reporting were operating effectively as at March 31, 2018, based on the internal financial controls over financial reporting criteria established by the Company considering the essential components of internal control stated in the
Guidance Note on Audit of Internal Financial Control Over Financial Reporting issued by the Institute of Chartered Accountant of India.
For Kharabanda AssociatesChartered Accountants
FRN:003456N
Sunil KharabandaPlace: New Delhi ProprietorDate: 21.05.2018 M. No: 082402
Annual Report 2017-18C
onsolidated Financial Statements
121
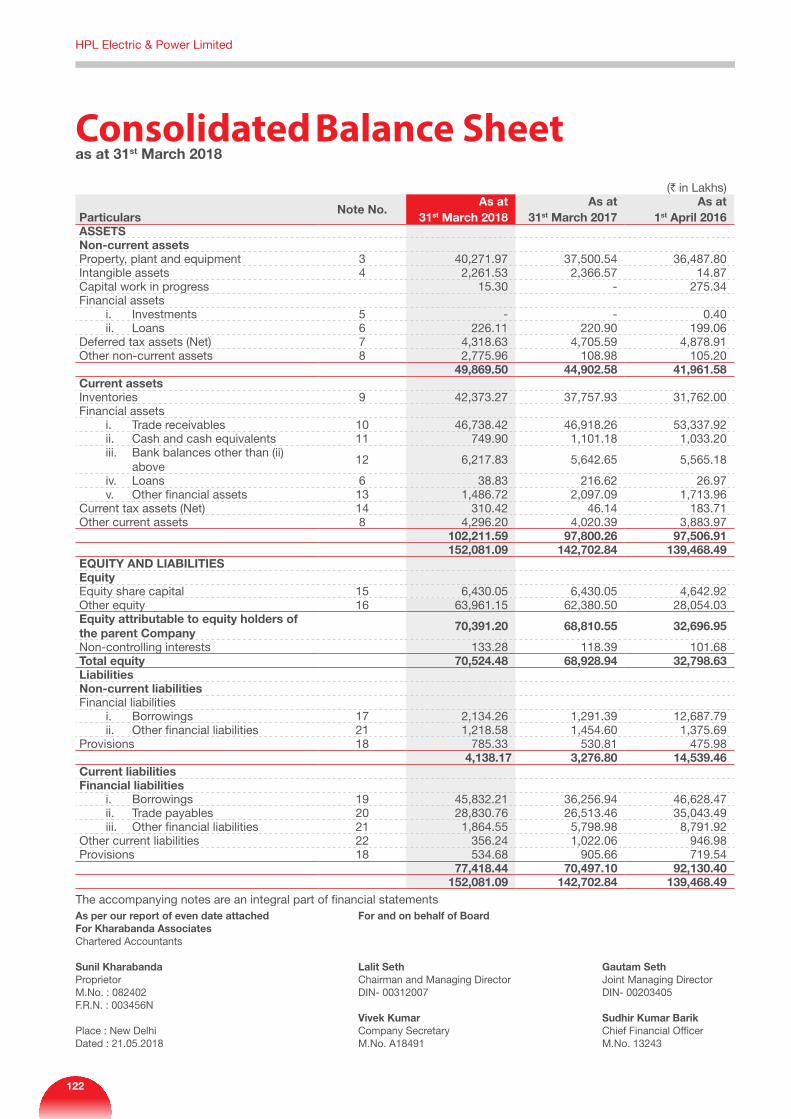
Consolidated Balance Sheetas at 31st March 2018
(` in Lakhs)
ParticularsNote No.
As at 31st March 2018
As at 31st March 2017
As at 1st April 2016
ASSETSNon-current assetsProperty, plant and equipment 3 40,271.97 37,500.54 36,487.80Intangible assets 4 2,261.53 2,366.57 14.87Capital work in progress 15.30 - 275.34Financial assets i. Investments 5 - - 0.40 ii. Loans 6 226.11 220.90 199.06Deferred tax assets (Net) 7 4,318.63 4,705.59 4,878.91Other non-current assets 8 2,775.96 108.98 105.20
49,869.50 44,902.58 41,961.58Current assetsInventories 9 42,373.27 37,757.93 31,762.00Financial assets i. Trade receivables 10 46,738.42 46,918.26 53,337.92 ii. Cash and cash equivalents 11 749.90 1,101.18 1,033.20 iii. Bank balances other than (ii)
above12 6,217.83 5,642.65 5,565.18
iv. Loans 6 38.83 216.62 26.97 v. Other financial assets 13 1,486.72 2,097.09 1,713.96Current tax assets (Net) 14 310.42 46.14 183.71Other current assets 8 4,296.20 4,020.39 3,883.97
102,211.59 97,800.26 97,506.91 152,081.09 142,702.84 139,468.49
EQUITY AND LIABILITIESEquityEquity share capital 15 6,430.05 6,430.05 4,642.92Other equity 16 63,961.15 62,380.50 28,054.03Equity attributable to equity holders of the parent Company
70,391.20 68,810.55 32,696.95
Non-controlling interests 133.28 118.39 101.68Total equity 70,524.48 68,928.94 32,798.63LiabilitiesNon-current liabilitiesFinancial liabilities i. Borrowings 17 2,134.26 1,291.39 12,687.79 ii. Other financial liabilities 21 1,218.58 1,454.60 1,375.69Provisions 18 785.33 530.81 475.98
4,138.17 3,276.80 14,539.46Current liabilitiesFinancial liabilities i. Borrowings 19 45,832.21 36,256.94 46,628.47 ii. Trade payables 20 28,830.76 26,513.46 35,043.49 iii. Other financial liabilities 21 1,864.55 5,798.98 8,791.92Other current liabilities 22 356.24 1,022.06 946.98Provisions 18 534.68 905.66 719.54
77,418.44 70,497.10 92,130.40 152,081.09 142,702.84 139,468.49
The accompanying notes are an integral part of financial statementsAs per our report of even date attached For and on behalf of Board For Kharabanda Associates Chartered Accountants
Sunil Kharabanda Lalit Seth Gautam Seth Proprietor Chairman and Managing Director Joint Managing Director M.No. : 082402 DIN- 00312007 DIN- 00203405F.R.N. : 003456N Vivek Kumar Sudhir Kumar Barik Place : New Delhi Company Secretary Chief Financial OfficerDated : 21.05.2018 M.No. A18491 M.No. 13243
HPL Electric & Power Limited
122
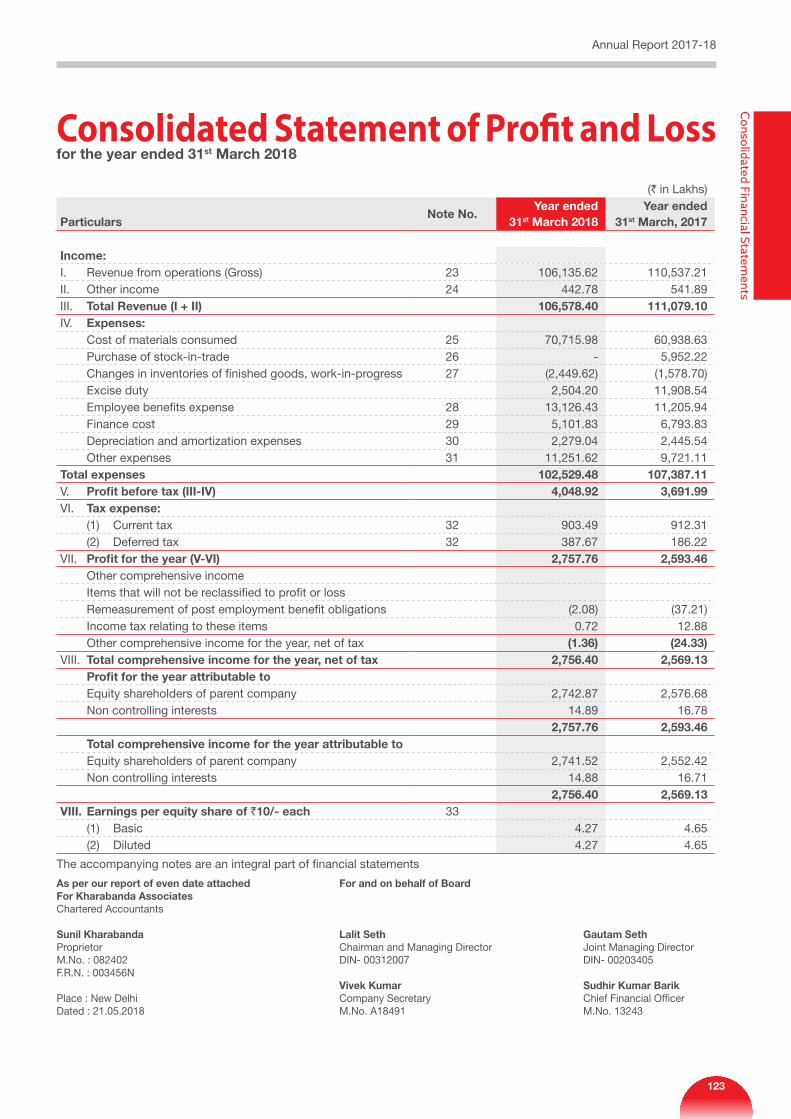
(` in Lakhs)
ParticularsNote No.
Year ended 31st March 2018
Year ended 31st March, 2017
Income:I. Revenue from operations (Gross) 23 106,135.62 110,537.21II. Other income 24 442.78 541.89 III. Total Revenue (I + II) 106,578.40 111,079.10 IV. Expenses: Cost of materials consumed 25 70,715.98 60,938.63 Purchase of stock-in-trade 26 - 5,952.22 Changes in inventories of finished goods, work-in-progress 27 (2,449.62) (1,578.70) Excise duty 2,504.20 11,908.54 Employee benefits expense 28 13,126.43 11,205.94 Finance cost 29 5,101.83 6,793.83 Depreciation and amortization expenses 30 2,279.04 2,445.54 Other expenses 31 11,251.62 9,721.11 Total expenses 102,529.48 107,387.11 V. Profit before tax (III-IV) 4,048.92 3,691.99 VI. Tax expense: (1) Current tax 32 903.49 912.31 (2) Deferred tax 32 387.67 186.22 VII. Profit for the year (V-VI) 2,757.76 2,593.46 Other comprehensive income Items that will not be reclassified to profit or loss Remeasurement of post employment benefit obligations (2.08) (37.21) Income tax relating to these items 0.72 12.88 Other comprehensive income for the year, net of tax (1.36) (24.33)VIII. Total comprehensive income for the year, net of tax 2,756.40 2,569.13 Profit for the year attributable to Equity shareholders of parent company 2,742.87 2,576.68 Non controlling interests 14.89 16.78
2,757.76 2,593.46 Total comprehensive income for the year attributable to Equity shareholders of parent company 2,741.52 2,552.42 Non controlling interests 14.88 16.71
2,756.40 2,569.13 VIII. Earnings per equity share of `10/- each 33 (1) Basic 4.27 4.65 (2) Diluted 4.27 4.65
The accompanying notes are an integral part of financial statements
Consolidated Statement of Profit and Lossfor the year ended 31st March 2018
As per our report of even date attached For and on behalf of Board For Kharabanda Associates Chartered Accountants
Sunil Kharabanda Lalit Seth Gautam Seth Proprietor Chairman and Managing Director Joint Managing Director M.No. : 082402 DIN- 00312007 DIN- 00203405F.R.N. : 003456N Vivek Kumar Sudhir Kumar Barik Place : New Delhi Company Secretary Chief Financial OfficerDated : 21.05.2018 M.No. A18491 M.No. 13243
Annual Report 2017-18C
onsolidated Financial Statements
123
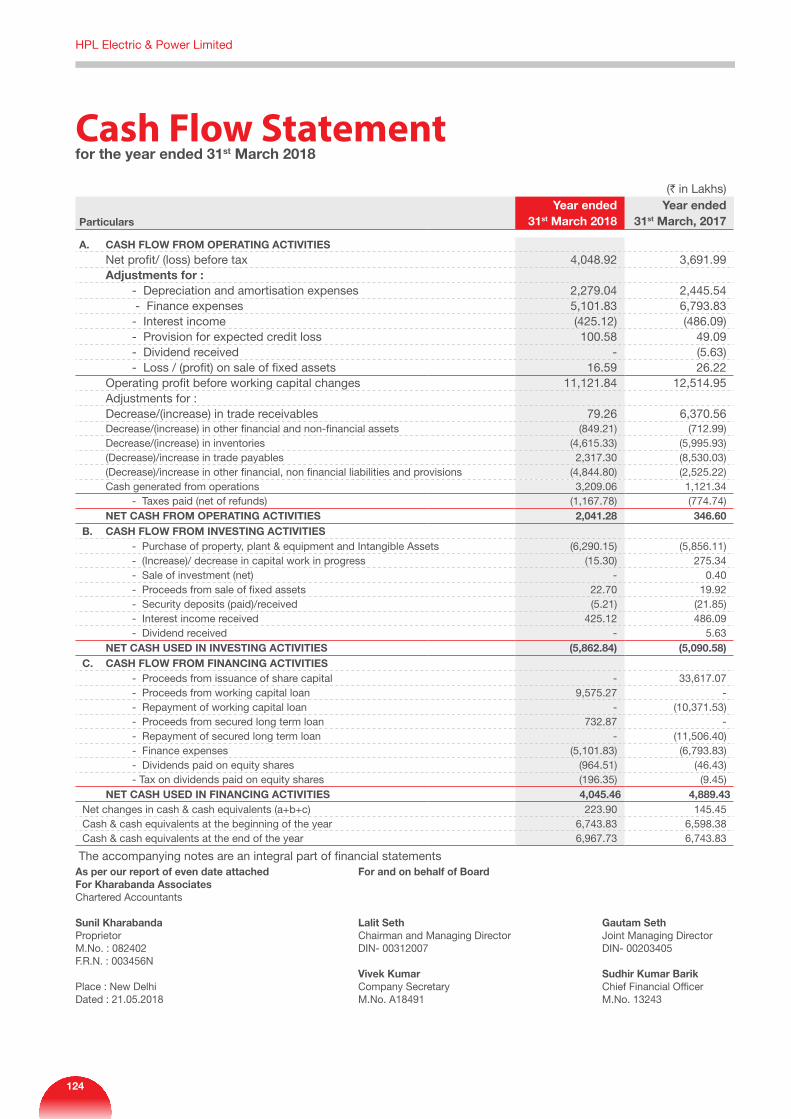
Cash Flow Statementfor the year ended 31st March 2018
(` in Lakhs)
Particulars
Year ended 31st March 2018
Year ended 31st March, 2017
A. CASH FLOW FROM OPERATING ACTIVITIES Net profit/ (loss) before tax 4,048.92 3,691.99 Adjustments for : - Depreciation and amortisation expenses 2,279.04 2,445.54 - Finance expenses 5,101.83 6,793.83 - Interest income (425.12) (486.09) - Provision for expected credit loss 100.58 49.09 - Dividend received - (5.63) - Loss / (profit) on sale of fixed assets 16.59 26.22 Operating profit before working capital changes 11,121.84 12,514.95 Adjustments for : Decrease/(increase) in trade receivables 79.26 6,370.56 Decrease/(increase) in other financial and non-financial assets (849.21) (712.99) Decrease/(increase) in inventories (4,615.33) (5,995.93) (Decrease)/increase in trade payables 2,317.30 (8,530.03) (Decrease)/increase in other financial, non financial liabilities and provisions (4,844.80) (2,525.22) Cash generated from operations 3,209.06 1,121.34 - Taxes paid (net of refunds) (1,167.78) (774.74) NET CASH FROM OPERATING ACTIVITIES 2,041.28 346.60 B. CASH FLOW FROM INVESTING ACTIVITIES - Purchase of property, plant & equipment and Intangible Assets (6,290.15) (5,856.11) - (Increase)/ decrease in capital work in progress (15.30) 275.34 - Sale of investment (net) - 0.40 - Proceeds from sale of fixed assets 22.70 19.92 - Security deposits (paid)/received (5.21) (21.85) - Interest income received 425.12 486.09 - Dividend received - 5.63 NET CASH USED IN INVESTING ACTIVITIES (5,862.84) (5,090.58) C. CASH FLOW FROM FINANCING ACTIVITIES - Proceeds from issuance of share capital - 33,617.07 - Proceeds from working capital loan 9,575.27 - - Repayment of working capital loan - (10,371.53) - Proceeds from secured long term loan 732.87 - - Repayment of secured long term loan - (11,506.40) - Finance expenses (5,101.83) (6,793.83) - Dividends paid on equity shares (964.51) (46.43) - Tax on dividends paid on equity shares (196.35) (9.45) NET CASH USED IN FINANCING ACTIVITIES 4,045.46 4,889.43 Net changes in cash & cash equivalents (a+b+c) 223.90 145.45 Cash & cash equivalents at the beginning of the year 6,743.83 6,598.38 Cash & cash equivalents at the end of the year 6,967.73 6,743.83
The accompanying notes are an integral part of financial statementsAs per our report of even date attached For and on behalf of Board For Kharabanda Associates Chartered Accountants
Sunil Kharabanda Lalit Seth Gautam Seth Proprietor Chairman and Managing Director Joint Managing Director M.No. : 082402 DIN- 00312007 DIN- 00203405F.R.N. : 003456N Vivek Kumar Sudhir Kumar Barik Place : New Delhi Company Secretary Chief Financial OfficerDated : 21.05.2018 M.No. A18491 M.No. 13243
HPL Electric & Power Limited
124
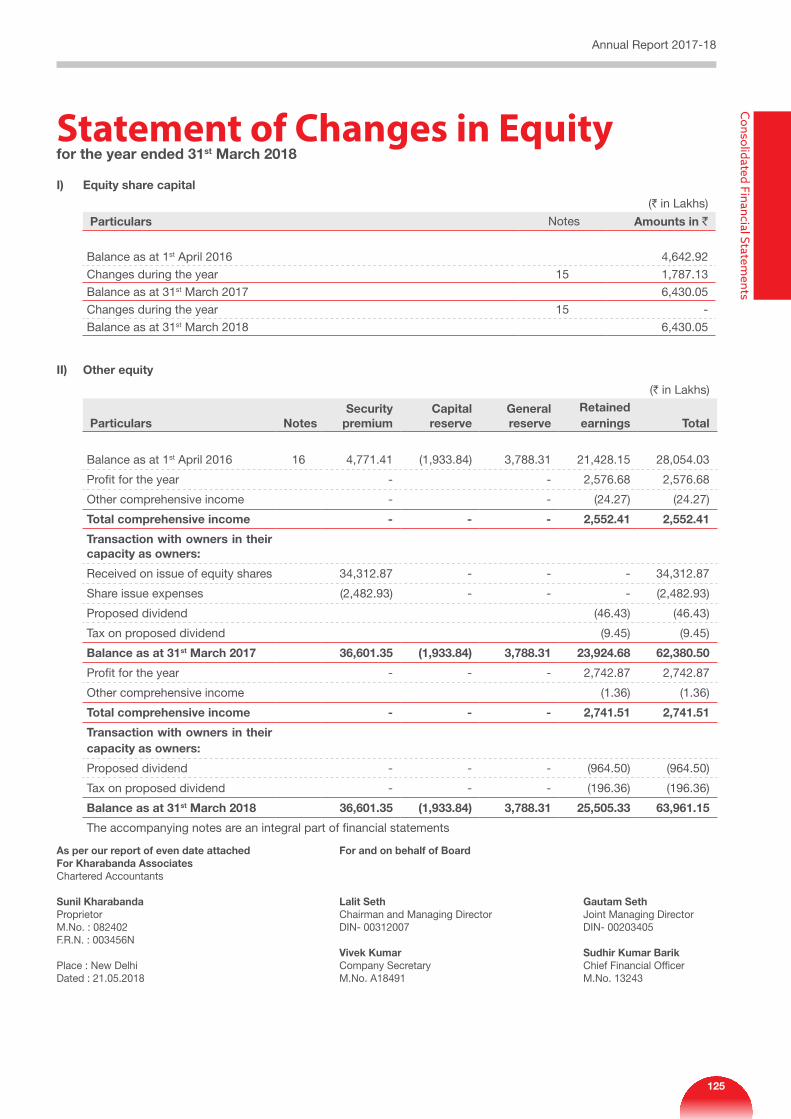
Statement of Changes in equityfor the year ended 31st March 2018
I) Equity share capital
(` in Lakhs)
Particulars Notes Amounts in `
Balance as at 1st April 2016 4,642.92
Changes during the year 15 1,787.13
Balance as at 31st March 2017 6,430.05
Changes during the year 15 -
Balance as at 31st March 2018 6,430.05
II) Other equity
(` in Lakhs)
Particulars Notes Security premium
Capital reserve
General reserve
Retained earnings Total
Balance as at 1st April 2016 16 4,771.41 (1,933.84) 3,788.31 21,428.15 28,054.03
Profit for the year - - 2,576.68 2,576.68
Other comprehensive income - - (24.27) (24.27)
Total comprehensive income - - - 2,552.41 2,552.41
Transaction with owners in their capacity as owners:
Received on issue of equity shares 34,312.87 - - - 34,312.87
Share issue expenses (2,482.93) - - - (2,482.93)
Proposed dividend (46.43) (46.43)
Tax on proposed dividend (9.45) (9.45)
Balance as at 31st March 2017 36,601.35 (1,933.84) 3,788.31 23,924.68 62,380.50
Profit for the year - - - 2,742.87 2,742.87
Other comprehensive income (1.36) (1.36)
Total comprehensive income - - - 2,741.51 2,741.51
Transaction with owners in their capacity as owners:
Proposed dividend - - - (964.50) (964.50)
Tax on proposed dividend - - - (196.36) (196.36)
Balance as at 31st March 2018 36,601.35 (1,933.84) 3,788.31 25,505.33 63,961.15
The accompanying notes are an integral part of financial statements
As per our report of even date attached For and on behalf of Board For Kharabanda Associates Chartered Accountants
Sunil Kharabanda Lalit Seth Gautam Seth Proprietor Chairman and Managing Director Joint Managing Director M.No. : 082402 DIN- 00312007 DIN- 00203405F.R.N. : 003456N Vivek Kumar Sudhir Kumar Barik Place : New Delhi Company Secretary Chief Financial OfficerDated : 21.05.2018 M.No. A18491 M.No. 13243
Annual Report 2017-18C
onsolidated Financial Statements
125
Note-1
COMPANY OVERVIEW
HPL Electric & Power Limited (Formerly HPL Electric & Power Private Limited) (‘the Company’) and its subsidiaries (collectively referred to as “Group”) is a limited company domiciled in India and incorporated under the provisions of the Companies Act, 1956 having its registered office at 1/20, Asaf Ali Road, New Delhi. The Group is one of the leading players and India’s fastest growing electrical and power distribution equipment manufacturer with products ranging from Industrial and Domestic Circuit Protection Switchgears, Cables, Energy Saving Meters, CFL & LED Lamps and Luminaries for Domestic, Commercial and Industrial applications, Modular Switches covering the entire range of household, commercial and industrial electrical needs.
The Group has R&D facilities located at Gurgaon and Kundli in Haryana, approved by Department of Scientific & Industrial Research (DSIR), Ministry of Science & Technology.
The Financial statements were approved by the Board of Directors for issue in accordance with resolution passed on May 21, 2018.
Note-2
SIGNIFICANT ACCOUNTING POLICIES
This note provides a list of the significant accounting policies adopted in the preparation of these financial statements. These policies have been consistently applied to all the years presented, unless otherwise stated.
A) Basis of Preparation i) Compliance with Ind AS The financial statements comply in all material
aspects with Indian Accounting Standards (Ind AS) notified under Section 133 of the Companies Act, 2013 (the Act)[Companies(Indian Accounting Standards) Rules, 2015] and other relevant provisions of the Act.
The financial statements up to year ended 31 March 2017 were prepared in accordance with the accounting standards notified under Companies (Accounting Standard) Rules, 2006 (as amended) (previous GAAP) and other relevant provisions of the Act.
These financial statements are the first financial statements of the Group under Ind AS. Refer note 42 for an explanation of how the transition from previous GAAP to Ind AS has affected the Group’s financial position, financial performance and cash flows.
ii) Historical cost convention The financial statements have been prepared on
a historical cost basis, except for certain financial assets and liabilities that are measured at fair value.
B) Principles of consolidation and equity accounting (i) Subsidiaries Subsidiaries are all entities (including structured
entities) over which the group has control. The group controls an entity when the group is exposed to, or has rights to, variable returns from its involvement with the entity and has the ability to affect those returns through its power to direct the relevant activities of the entity. Subsidiaries are fully consolidated from the date on which control is transferred to the group. They are deconsolidated from the date that control ceases.
The group combines the financial statements of the parent and its subsidiaries line by line adding together like items of assets, liabilities, equity, income and expenses. Inter-company transactions, balances and unrealized gains on transactions between group companies are eliminated. Unrealised losses are also eliminated unless the transaction provides evidence of an impairment of the transferred assets. Accounting policies of the subsidiaries have been changed where necessary to ensure consistency with the policies adopted by the group.
Non-controlling interest in the results and equity of subsidiaries are shown separately in the consolidated statement of profit and loss, consolidated statement of changes in equity and balance sheet respectively.
C) Property plant and equipment Freehold land is carried at cost. All other items of
property, plant and equipment are stated at cost less accumulated depreciation and accumulated impairment, if any. The cost comprises of purchase price, taxes, duties, freight and other incidental expenses directly attributable and related to acquisition and installation of the concerned assets and are further adjusted by the amount of CENVAT /GST/VAT credit availed wherever applicable. The present value of the expected cost for the decommissioning of an asset after its use is included in the cost of the respective asset if the recognition criteria for a provision are met.
Subsequent costs are included in the asset’s carrying amount or recognised as a separate asset, as appropriate, only when it is probable that future
notes to Accountsforming part of the Financial Statements as on March 31, 2018
HPL Electric & Power Limited
126
economic benefits associated with the item will flow to the Group and the cost of the item can be measured reliably. The carrying amount of any component accounted for as a separate asset is derecognised when replaced. All other repairs and maintenance are charged to profit or loss during the reporting period in which they are incurred.
Transition to Ind AS Under the previous GAAP (Indian GAAP), all assets were
carried in the Balance Sheet at cost, less accumulated depreciation and accumulated impairment losses, if any. On the date of transition to IND AS, all property, plant and equipment have been measured at fair value and same has been considered as deemed cost as at April 01, 2016 (date of transition) in accordance with Ind AS 101 First Time adoption.
Depreciation methods, estimated useful lives and residual value
Depreciation on buildings, machinery and equipments has been provided on straight-line basis over the estimated useful lives of the respective assets. Intangibale assets are amortised over their estimated useful economic lives on straight line basis. Freehold land and work in progress are not depreciated. The estimated useful lives considered for providing depreciation on other substantial assets are as follows:
Building- 35-45 years Plant & Machinery-15-25 years Computers-3-5 years Furniture & Fixtures-10-15 years Office Equipments-5-10 years Vehicles-8-10 years
The residual values, useful lives and methods of depreciation of property, plant and equipment are reviewed at each financial year end and adjusted prospectively, if appropriate.
D) Intangible assets Intangible assets acquired separately are measured on
initial recognition at cost. Following initial recognition, intangible assets are carried at costless accumulated amortization and accumulated impairment losses, if any. Internally generated intangibles, excluding capitalized development cost, are not capitalized and the related expenditure is reflected in Statement of Profit and Loss in the period in which the expenditure is incurred. Cost comprises the purchase price and any attributable cost of bringing the asset to its working condition for its intended use.
Research and development cost Research expenditure and development expenditure
that do not meet the criteria as given in Ind AS-38 “Intangible Assets” are recognised as an expense as incurred. Development costs previously recognised as an expense are not recognised as an asset in a subsequent period.
Amortisation methods and periods The Group amortises intangible assets with a finite
useful life using the straight-line method over their estimated useful life of 3-6 years.
The amortization period and the amortization method for an intangible asset with a finite useful life is reviewed at least at the end of each reporting period. Changes in the expected useful life or the expected pattern of consumption of future economic benefits embodied in the asset is accounted for by changing the amortization period or method, as appropriate and are treated as changes in accounting estimates. The amortization expense on intangible assets with finite lives is recognised in the Statement of Profit and Loss.
Gains or losses arising from disposal of the intangible assets are measured as the difference between the net disposal proceeds and the carrying amount of the asset and are recognised in the Statement of Profit and Loss when the assets are disposed off.
Transition to Ind AS On transition to Ind AS, the Group has elected to
continue with the carrying value of all of intangible assets recognized as at 1 April 2016 measured as per the previous GAAP and use that carrying value as the deemed cost of intangible assets.
E) Impairment of non-financial assets The carrying amounts of the assets are reviewed
at each Balance sheet date for any indication of impairment based on internal/external factors. If any such indication exists, or when annual impairment testing for an asset is required, the Group estimates the asset’s recoverable amount. An asset’s recoverable amount is the higher of an asset’s or cash-generating unit’s (CGU) fair value less costs of disposal and its value in use. Recoverable amount is determined for an individual asset, unless the asset does not generate cash inflows that are largely independent of those from other assets. Where the carrying amount of an asset or CGU exceeds its recoverable amount, the asset is considered impaired and is written down to its recoverable amount.
In assessing value in use, the estimated future cash flows are discounted to their present value using a pre-tax discount rate that reflects current market assessments of the time value of money and the risks specific to the asset. In determining fair value less costs of disposal, recent market transactions are taken into account, if available. If no such transactions can be identified, an appropriate valuation model is used. After impairment, depreciation is provided on the revised carrying amount of the asset over its remaining useful life.
Impairment losses including impairment on inventories are recognised in the Statement of Profit and Loss.
Annual Report 2017-18C
onsolidated Financial Statements
127
F) Financial Instruments i) Financial Assets A) Initial recognition and measurement All financial assets and liabilities are initially
recognised at fair value. Transaction costs that are directly attributable to the acquisition or issue of financial assets and financial liabilities, which are not at fair value through profit or loss, are adjusted to the fair value on initial recognition.
B) Subsequent measurement a) Financial assets carried at amortised
cost A financial asset is measured at
amortised cost if it is held within a business model whose objective is to hold the asset in order to collect contractual cash flows and the contractual terms of the financial asset give rise on specified dates to cash flows that are solely payments of principal and interest on the principal amount outstanding.
b) Financial assets carried at fair value through other comprehensive income (FVTOCI)
A financial asset is measured at FVTOCI if it is held within a business model whose objective is achieved by both collecting contractual cash flows and selling financial assets and the contractual terms of the financial asset give rise on specified dates to cash flows that are solely payments of principal and interest on the principal amount outstanding.
c) Financial assets carried at fair value through profit or loss (FVTPL)
A financial asset which is not classified in any of the above categories are measured at FVTPL.
C) Investment in subsidiaries The Group has accounted for its investments
in subsidiary at cost.
D) Other Equity Investments All other equity investments are measured
at fair value with changes in fair value recognised in statement of profit and loss except for those equity investments for which the Group has elected to present the value changes in ‘Other Comprehensive Income’.
E) Impairment of financial assets In accordance with Ind AS 109, the Group
uses ‘Expected Credit Loss’ (ECL) model, for evaluating impairment of financial assets other than those measured at fair value through profit and loss (FVTPL).
Expected credit losses are measured through a loss allowance at an amount equal to:
• The 12 months expected credit losses(expected credit losses that result from those default events on the financial instrument that are possible within 12 months after the reporting date, or
• Fulllifetimeexpectedcreditlosses(expectedcredit losses that result from all possible default events over the life of the financial instrument).
For trade receivables Group applies ‘simplified approach’ which requires expected lifetime losses to be recognised from initial recognition of the receivables. The Group uses historical default rates to determine impairment loss on the portfolio of trade receivables. At every reporting date these historical default rates are reviewed and changes in the forward looking estimates are analysed.
For other assets, the Group uses 12 month ECL to provide for impairment loss where there is no significant increase in credit risk. If there is significant increase in credit risk full lifetime ECL is used.
ii) Financial Liabilities A) Initial recognition and measurement All financial liabilities are recognised at fair
value and in case of loans net of directly attributable cost. Fees of recurring nature are directly recognised in the Statement of Profit and Loss as finance cost.
B) Subsequent measurement
Financial liabilities are carried at amortised cost using the effective interest rate method (EIR). Amortised cost is calculated by taking into account any discount or premium on acquisition and fees or costs that are an integral part of EIR. The EIR amortisation is included as finance costs in the Statement of Profit and Loss. For trade and other payables maturing within one year from the balance sheet date, the carrying amounts approximate fair value due to the short maturity of these instruments.
F) Income recognition Interest income Interest income from debt instruments is recognised
using the effective interest rate method. The effective interest rate is the rate that exactly discounts estimated future cash receipts through the expected life of the financial asset to the gross carrying amount of a financial asset. When calculating the effective interest rate, the Group estimates the expected cash flows by considering all the contractual terms of the financial
HPL Electric & Power Limited
128
instrument (for example, prepayment, extension, call and similar options) but does not consider the expected credit losses.
Dividends Dividends are recognised in profit or loss only when the
right to receive payment is established, it is probable that the economic benefits associated with the dividend will flow to the Group, and the amount of the dividend can be measured reliably.
G) Inventories Raw materials and stores, work in progress, traded and
finished goods are stated at the lower of cost and net realisable value. Cost of raw materials and traded goods comprises cost of purchases. Cost of work-in-progress and finished goods comprises direct materials, direct labour and an appropriate proportion of variable and fixed overhead expenditure, the latter being allocated on the basis of normal operating capacity. Cost of inventories also include all other costs incurred in bringing the inventories to their present location and condition. Costs are assigned to individual items of inventory on the basis of weighted average cost basis. Costs of purchased inventory are determined after deducting rebates and discounts. Net realisable value is the estimated selling price in the ordinary course of business less the estimated costs of completion and the estimated costs necessary to make the sale.
H) Revenue Recognition Revenue from the sales of goods is recognised when
the significant risks and rewards of ownership of the goods have passed to the buyer, which is usually at the time of delivery of goods to the customer. Revenue from sale of goods is measured at fair value of consideration received /receivable, net of returns, trade allowances, rebates, value added taxes, Goods and Service Tax (GST) and amounts collected on behalf of third parties. Revenue is recognised when it is probable that economic benefits associated with the transaction will flow to the entity, amount of revenue can be measured reliably and entity retains neither continuing managerial involvement to the degree usually associated with ownership nor effective control over the goods sold.
I) Employee Benefits (i) Short-term obligations Liabilities for wages and salaries, including non-
monetary benefits that are expected to be settled wholly within 12 months after the end of the period in which the employees render the related service are recognised in respect of employees’ services up to the end of the reporting period and are measured at the amounts expected to be paid when the liabilities are settled.
(ii) Post-Employment Benefits Defined Contribution Plan: A defined contribution
plan is a post-employment benefit plan under which the Groul pays specified contributions
to a separately entity. The Group has defined contribution plans for the post-employment benefits namely provident fund scheme. The Group’s contribution in the above plans is recognised as an expense in the Statement of Profit and Loss during the year in which the employee renders the related service.
Defined Benefit Plans: The Group has defined benefit plan namely Gratuity for employees. The liability in respect of gratuity plans is calculated annually by independent actuary using the projected unit credit method. The Group recognises the following changes in the net defined benefit obligation under Employee benefits expense in statement of profit or loss:
• Service costs comprising current servicecosts, past service costs , gains and losses on curtailment and non-routine-settlements
• NetInterestexpense
Remeasurement gains and losses arising from experience adjustments and changes in actuarial assumptions are recognised in the period in which they occur, directly in other comprehensive income. They are included in retained earnings in the Statement of Changes in Equity and in the Balance Sheet. Remeasurements are not reclassified to profit or loss in subsequent periods.
Termination benefits are recognized as an expense immediately.
J) Borrowing Cost General and specific borrowing costs that are directly
attributable to the acquisition, construction or production of a qualifying asset are capitalised during the period of time that is required to complete and prepare the asset for its intended use or sale. Qualifying assets are assets that necessarily take a substantial period of time to get ready for their intended use or sale.
Investment income earned on the temporary investment of specific borrowings pending their expenditure on qualifying assets is deducted from the borrowing costs eligible for capitalisation.
Other borrowing costs are expensed in the period in which they are incurred.
K) Income Tax
The income tax expense or credit for the period is the tax payable on the current period’s taxable income based on the applicable income tax rate adjusted by changes in deferred tax assets and liabilities attributable to temporary differences and to unused tax losses.
The current income tax charge is calculated on the basis
Annual Report 2017-18C
onsolidated Financial Statements
129
of the tax laws enacted or substantively enacted at the end of the reporting period. Management periodically evaluates positions taken in tax returns with respect to situations in which applicable tax regulation is subject to interpretation. It establishes provisions where appropriate on the basis of amounts expected to be paid to the tax authorities.
Deferred income tax is provided in full, using the liability method, on temporary differences arising between the tax bases of assets and liabilities and their carrying amounts in the financial statements. Deferred income tax is also not accounted for if it arises from initial recognition of an asset or liability in a transaction other than a business combination that at the time of the transaction affects neither accounting profit nor taxable profit (tax loss). Deferred income tax is determined using tax rates (and laws) that have been enacted or substantially enacted by the end of the reporting period and are expected to apply when the related deferred income tax asset is realised or the deferred income tax liability is settled.
Deferred tax assets are recognised for all deductible temporary differences and unused tax losses only if it is probable that future taxable amounts will be available to utilise those temporary differences and losses.
Deferred tax assets and liabilities are offset when there is a legally enforceable right to offset current tax assets and liabilities and when the deferred tax balances relate to the same taxation authority. Current tax assets and tax liabilities are offset where the entity has a legally enforceable right to offset and intends either to settle on a net basis, or to realise the asset and settle the liability simultaneously.
Current and deferred tax is recognised in profit or loss, except to the extent that it relates to items recognised in other comprehensive income or directly in equity. In this case, the tax is also recognised in other comprehensive income or directly in equity, respectively.
L) Lease Leases of property, plant and equipment where the
Group, as lessee, has substantially all the risks and rewards of ownership are classified as finance leases. Finance leases are capitalised at the lease’s inception at the fair value of the leased property or, if lower, the present value of the minimum lease payments. The corresponding rental obligations, net of finance charges, are included in borrowings or other financial liabilities as appropriate. Each lease payment is allocated between the liability and finance cost. The finance cost is charged to the profit or loss over the lease period so as to produce a constant periodic rate of interest on the remaining balance of the liability for each period.
Leases in which a significant portion of the risks and rewards of ownership are not transferred to the Group
as lessee are classified as operating leases. Payments made under operating leases (net of any incentives received from the lessor) are charged to profit or loss on a straight-line basis over the period of the lease unless the payments are structured to increase in line with expected general inflation to compensate for the lessor’s expected inflationary cost increases.
M) Foreign Currency Transactions Items included in the financial statements of the
Group are measured using the currency of the primary economic environment in which the entity operates (‘the functional currency’). The financial statements are presented in Indian rupee (INR), which is the Group’s functional and presentation currency.
Foreign currency transactions are translated into the functional currency using the exchange rates at the dates of the transactions. Foreign exchange gains and losses resulting from the settlement of such transactions and from the translation of monetary assets and liabilities denominated in foreign currencies at year end exchange rates are generally recognised in profit or loss.
N) Earnings Per Share (i) Basic earnings per share Basic earnings per share is calculated by dividing:
• theprofitattributabletoownersoftheGroup
• by the weighted average number of equityshares outstanding during the financial year.
(ii) Diluted earnings per share Diluted earnings per share adjusts the figures
used in the determination of basic earnings per share to take into account:
• the after income tax effect of interest andother financing costs associated with dilutive potential equity shares, wherever applicable, and
• the weighted average number of additionalequity shares that would have been outstanding assuming the conversion of all dilutive potential equity shares.
O) Provisions and Contingent liabilities Provisions for legal claims, service warranties, volume
discounts and returns are recognised when the Group has a present legal or constructive obligation as a result of past events, it is probable that an outflow of resources will be required to settle the obligation and the amount can be reliably estimated. Provisions are not recognised for future operating losses.
Provisions are measured at the present value of management’s best estimate of the expenditure required to settle the present obligation at the end of the reporting period. The discount rate used to determine
HPL Electric & Power Limited
130
the present value is a pre-tax rate that reflects current market assessments of the time value of money and the risks specific to the liability. The increase in the provision due to the passage of time is recognised as interest expense.
A contingent liability is possible obligation that arises from past events whose existence will be confirmed by the occurrence or non-occurrence of one or more uncertain future events beyond the control of the Group or a present obligation that is not recognised because it is not probable that an outflow of resources will be required to settle the obligation. A contingent liability also arises in extremely rare cases, where there is a liability that cannot be recognised because it cannot be measured reliably. The Group does not recognise a contingent liability but disclose its existence in the financial statements unless the probability of outflow of resource is remote.
P) Government Grant Grants from the government are recognised at their fair
value where there is a reasonable assurance that the grant will be received and the Group will comply with all attached conditions.
Government grants relating to income are deferred and recognised in the profit or loss over the period necessary to match them with the costs that they are intended to compensate and presented within other income.
Government grants relating to the purchase of property, plant and equipment are included in non-current liabilities as deferred income and are credited to profit or loss on a straight-line basis over the expected lives of the related assets and presented within other income.
Q) Segment Reporting Operating segments are reported in a manner consistent
with the internal reporting provided to the Chief operating decision maker (CODM). CODM monitors the operating results of all strategic business units separately for the purpose of making decisions about resource allocation and performance assessment. Segment performance is evaluated based on profit and loss and is measured consistently with profit and loss in the financial statements.
R) Contributed equity Equity shares are classified as equity.
Incremental costs directly attributable to the issue of new shares or options are shown in equity as a deduction, net of tax, from the proceeds.
S) Dividends Provision is made for the amount of any dividend
declared, being appropriately authorised and no longer at the discretion of the entity, on or before the end of the reporting period but not distributed at the end of the reporting period.
T) Cash and Cash Equivalents For the purpose of presentation in the Statement of
Cash flows, Cash and Cash equivalents includes cash on hand, deposits held at call, other short-term, highly liquid investments with original maturities of three months or less that are readily convertible to known amounts of cash and which are subject to an insignificant risk of changes in value, and bank overdrafts. Bank overdrafts are shown within borrowings in current liabilities in the Balance Sheet.
U) Offsetting financial instruments Financial assets and financial liabilities are offset
and the net amount is reported in the Balance Sheet where there is a legally enforceable right to offset the recognised amounts and there is an intention to settle on a net basis or realise the asset and settle the liability simultaneously. The legally enforceable right must not be contingent on future events and must be enforceable in the normal course of business and in the event of default, insolvency or bankruptcy of the Group or the counterparty.
V) Rounding of amounts All amounts disclosed in the financial statements and
notes have been rounded off to the nearest lakhs as per the requirement of Schedule III, unless otherwise stated.
W) Recent accounting pronouncements Ind AS 115 – Revenue from Contracts with Customers
The Ministry of Corporate Affairs (MCA) has notified the Companies (Indian Accounting Standards) Amendment Rules, 2018 on 28 March 2018 which includes Ind AS 115 ‘Revenue from Contracts with Customers’. This will replace IAS 18 which covers contracts for goods and services and IAS 11 which covers construction contracts.
Ind AS 115 – Revenue from contracts with Customers outlines a single comprehensive model for entities to use in accounting for revenue arising from contracts with customers. The standard replaces most current revenue recognition guidance. The core principle of the new standard is for companies to recognize revenue to depict the transfer of goods or services to customers in amounts that reflect the consideration to which the Group expects to be entitled in exchange for those goods or services. The new standard also will result in enhanced disclosures about revenue, provide guidance for transactions that were not previously addressed comprehensively including service revenues and contract modifications and improve guidance for multiple-element arrangements.
The new standard will come into effect for the annual reporting periods beginning on or after 1 April 2018. The standard permits either a full retrospective or a modified retrospective approach for the adoption.
Annual Report 2017-18C
onsolidated Financial Statements
131
The Group is in the process of evaluating the impact of the new standard on the Group’s financial statements.
X) Significant accounting judgements, estimates and assumptions
The preparation of the Group’s financial statements requires management to make judgements, estimates and assumptions that affect the reported amounts of revenues, expenses, assets and liabilities, and the accompanying disclosures. Uncertainty about these assumptions and estimates could result in outcomes that require a material adjustment to the carrying amount of the assets or liabilities affected in future periods.
Judgements, Estimates and assumptions The key assumptions concerning the future and other
key sources of estimation uncertainty at the reporting date, that have a significant risk of causing a material adjustment to the carrying amounts of assets and liabilities within the next financial year, are described below. The Group based its assumptions and estimates on parameters available when the financial statements were prepared. Existing circumstances and assumptions about future developments, however, may change due to market changes or circumstances arising beyond the control of the Group. Such changes are reflected in the assumptions when they occur.
a) Defined benefit plan-Gratuity The cost of defined benefit plans (i.e. Gratuity
benefit) is determined using actuarial valuations. An actuarial valuation involves making various assumptions which may differ from actual developments in the future. These include the determination of the discount rate, future salary increases, mortality rates and future pension increases. Due to the complexity of the valuation, the underlying assumptions and its long-term nature, a defined benefit obligation is highly sensitive to changes in these assumptions. All assumptions are reviewed at each reporting date. In determining the appropriate discount rate, management considers the interest rates of long term government bonds with extrapolated maturity corresponding to the expected duration of the defined benefit obligation. The mortality rate is based on publicly available mortality tables for the specific countries. Future salary increases and pension increases are based on expected future inflation rates for the respective countries. Further details about the assumptions used, including a sensitivity analysis, are given in Note 37.
b) Impairment of Financial assets The impairment provisions of financial assets are
based on assumptions about risk of default and expected loss rates. The Group uses judgment in making these assumptions and selecting the inputs to the impairment calculation, based on
Group’s past history, existing market conditions as well as forward looking estimates at the end of each reporting period.
c) Warranty provision Warranty Provisions are measured at discounted
present value using pre-tax discount rate that reflects the current market assessments of the time value of money and the risks specific to the liability. A warranty provision is determined based on the historical percentage of warranty expense to sales for the same types of goods for which the warranty is currently being determined. The same percentage to the sales is applied for the current accounting period to derive the warranty expense to be accrued. It is adjusted to account for unusual factors related to the goods that were sold, such as defective inventory lying at the depots. It is very unlikely that actual warranty claims will exactly match the historical warranty percentage, so such estimates are reviewed annually for any material changes in assumptions and likelihood of occurrence.
d) Depreciation/amortisation and useful lives of property plant and equipment/intangible assets
Property, plant and equipment / Intangible assets are depreciated /amortised over their estimated useful lives, after taking into account estimated residual values. Management reviews the estimated useful lives and residual values of the assets annually in order to determine the amount of depreciation / amortisation to be recorded during any reporting period. The useful lives and residual values are based on the Group’s historical experience with similar assets and take into account anticipated technological changes. The depreciation/amortisation for future period is revised if there are significant changes from previous estimates.
e) Provisions Provisions and liabilities are recognised in the
period when it becomes probable that there will be a future outflow of funds resulting from past operations or events and the amount of cash outflow can be reliably estimated. The timing of recognition and quantification of the liability requires the application of judgment to existing facts and circumstances, which can be subject to change. The carrying amounts of provisions and liabilities are reviewed regularly and revised to take account of changing facts and circumstances.
HPL Electric & Power Limited
132
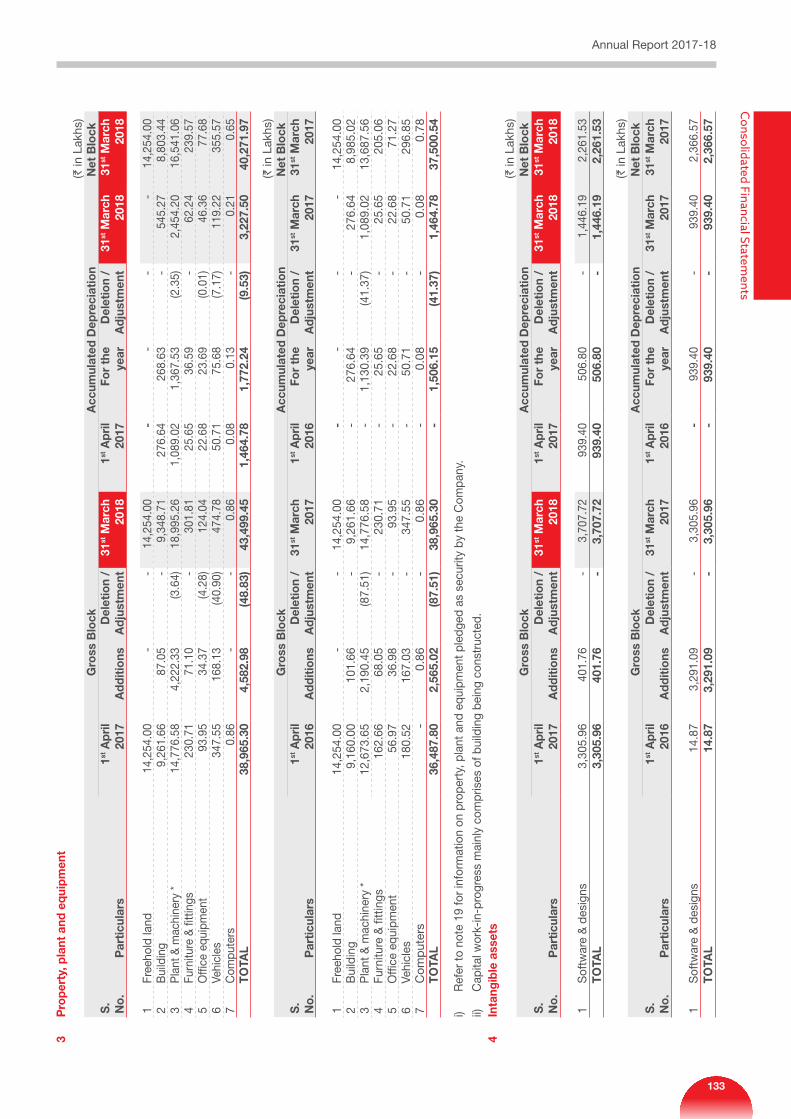
3 P
rope
rty,
pla
nt a
nd e
quip
men
t (`
in L
akhs
) G
ross
Blo
ck
Acc
umul
ated
Dep
reci
atio
n N
et B
lock
S
.N
o.
Par
ticul
ars
1st A
pril
2017
Add
ition
sD
elet
ion
/ A
djus
tmen
t31
st M
arch
20
181st
Apr
il 20
17Fo
r th
e ye
arD
elet
ion
/ A
djus
tmen
t31
st M
arch
20
1831
st M
arch
20
18
1 Fr
eeho
ld la
nd 1
4,25
4.00
-
-
1
4,25
4.00
-
-
-
-
1
4,25
4.00
2
Bui
ldin
g 9
,261
.66
87.
05
-
9,3
48.7
1 2
76.6
4 2
68.6
3 -
5
45.2
7 8
,803
.44
3 P
lant
& m
achi
nery
* 1
4,77
6.58
4
,222
.33
(3.6
4) 1
8,99
5.26
1
,089
.02
1,3
67.5
3 (2
.35)
2,4
54.2
0 1
6,54
1.06
4
Furn
iture
& fi
ttin
gs 2
30.7
1 7
1.10
-
3
01.8
1 2
5.65
3
6.59
-
6
2.24
2
39.5
7 5
Offi
ce e
quip
men
t 9
3.95
3
4.37
(4
.28)
124
.04
22.
68
23.
69
(0.0
1) 4
6.36
7
7.68
6
Vehi
cles
347
.55
168
.13
(40.
90)
474
.78
50.
71
75.
68
(7.1
7) 1
19.2
2 3
55.5
7 7
Com
pute
rs 0
.86
-
-
0.8
6 0
.08
0.1
3 -
0
.21
0.6
5 TO
TAL
38,
965.
30
4,5
82.9
8 (4
8.83
) 4
3,49
9.45
1
,464
.78
1,7
72.2
4 (9
.53)
3,2
27.5
0 4
0,27
1.97
(` in
Lak
hs)
Gro
ss B
lock
A
ccum
ulat
ed D
epre
ciat
ion
Net
Blo
ck
S.
No.
P
artic
ular
s1st
Apr
il 20
16A
dditi
ons
Del
etio
n /
Adj
ustm
ent
31st M
arch
20
171st
Apr
il 20
16Fo
r th
e ye
arD
elet
ion
/ A
djus
tmen
t31
st M
arch
20
1731
st M
arch
20
17
1 Fr
eeho
ld la
nd 1
4,25
4.00
-
-
1
4,25
4.00
-
-
-
-
1
4,25
4.00
2
Bui
ldin
g 9
,160
.00
101
.66
-
9,2
61.6
6 -
2
76.6
4 -
2
76.6
4 8
,985
.02
3 P
lant
& m
achi
nery
* 1
2,67
3.65
2
,190
.45
(87.
51)
14,
776.
58
-
1,1
30.3
9 (4
1.37
) 1
,089
.02
13,
687.
56
4 Fu
rnitu
re &
fitt
ings
162
.66
68.
05
-
230
.71
-
25.
65
-
25.
65
205
.06
5 O
ffice
equ
ipm
ent
56.
97
36.
98
-
93.
95
-
22.
68
-
22.
68
71.
27
6 Ve
hicl
es 1
80.5
2 1
67.0
3 -
3
47.5
5 -
5
0.71
-
5
0.71
2
96.8
5 7
Com
put
ers
-
0.8
6 -
0
.86
-
0.0
8 -
0
.08
0.7
8 TO
TAL
36,
487.
80
2,5
65.0
2 (8
7.51
) 3
8,96
5.30
-
1
,506
.15
(41.
37)
1,4
64.7
8 3
7,50
0.54
i)
Ref
er to
not
e 19
for
info
rmat
ion
on p
rope
rty,
pla
nt a
nd e
quip
men
t ple
dged
as
secu
rity
by th
e C
ompa
ny.
ii)
C
apita
l wor
k-in
-pro
gres
s m
ainl
y co
mpr
ises
of b
uild
ing
bein
g co
nstr
ucte
d.
4 In
tang
ible
ass
ets
(` in
Lak
hs)
Gro
ss B
lock
A
ccum
ulat
ed D
epre
ciat
ion
Net
Blo
ck
S.
No.
P
artic
ular
s1st
Apr
il 20
17A
dditi
ons
Del
etio
n /
Adj
ustm
ent
31st M
arch
20
181st
Apr
il 20
17Fo
r th
e ye
arD
elet
ion
/ A
djus
tmen
t31
st M
arch
20
1831
st M
arch
20
18
1 S
oftw
are
& d
esig
ns 3
,305
.96
401
.76
-
3,7
07.7
2 9
39.4
0 5
06.8
0 -
1
,446
.19
2,2
61.5
3 TO
TAL
3,3
05.9
6 4
01.7
6 -
3
,707
.72
939
.40
506
.80
-
1,4
46.1
9 2
,261
.53
(` in
Lak
hs)
Gro
ss B
lock
A
ccum
ulat
ed D
epre
ciat
ion
Net
Blo
ck
S.
No.
P
artic
ular
s1st
Apr
il 20
16A
dditi
ons
Del
etio
n /
Adj
ustm
ent
31st M
arch
20
171st
Apr
il 20
16Fo
r th
e ye
arD
elet
ion
/ A
djus
tmen
t31
st M
arch
20
1731
st M
arch
20
17
1 S
oftw
are
& d
esig
ns 1
4.87
3
,291
.09
-
3,3
05.9
6 -
9
39.4
0 -
9
39.4
0 2
,366
.57
TOTA
L 1
4.87
3
,291
.09
-
3,3
05.9
6 -
9
39.4
0 -
9
39.4
0 2
,366
.57
Annual Report 2017-18C
onsolidated Financial Statements
133
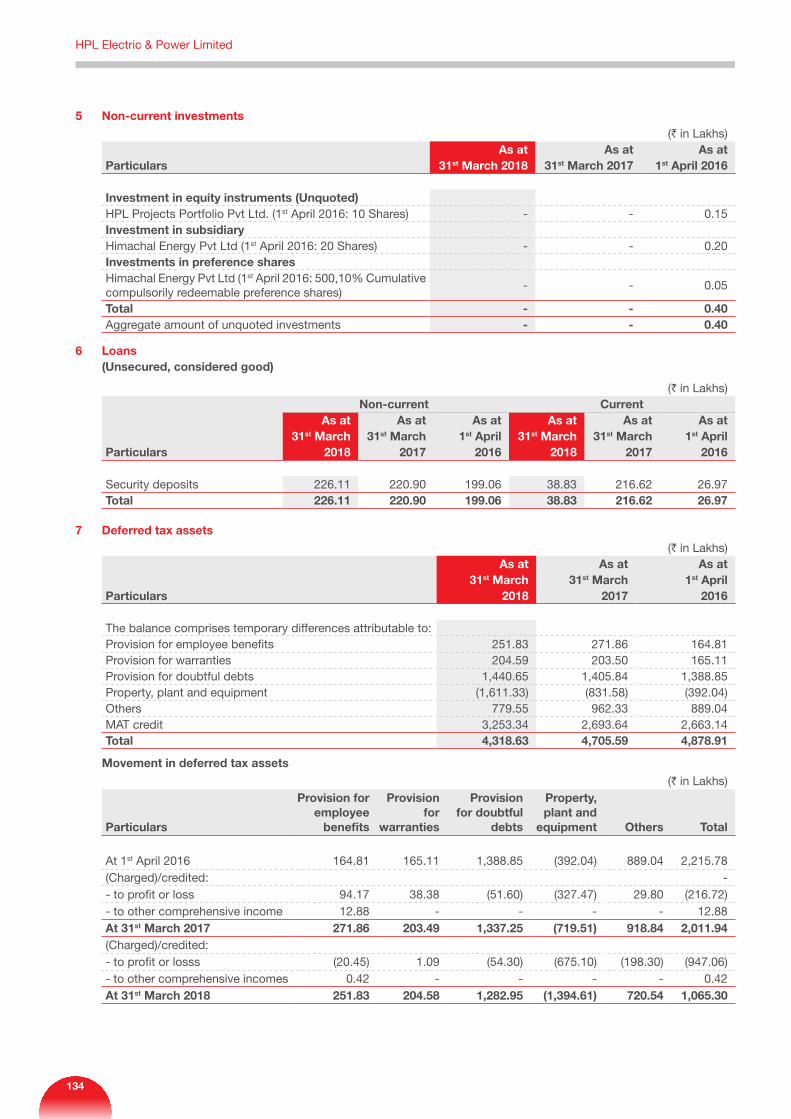
5 Non-current investments(` in Lakhs)
ParticularsAs at
31st March 2018As at
31st March 2017As at
1st April 2016
Investment in equity instruments (Unquoted)HPL Projects Portfolio Pvt Ltd. (1st April 2016: 10 Shares) - - 0.15 Investment in subsidiaryHimachal Energy Pvt Ltd (1st April 2016: 20 Shares) - - 0.20 Investments in preference sharesHimachal Energy Pvt Ltd (1st April 2016: 500,10% Cumulative compulsorily redeemable preference shares)
- - 0.05
Total - - 0.40 Aggregate amount of unquoted investments - - 0.40
6 Loans (Unsecured, considered good)
(` in Lakhs)
Particulars
Non-current CurrentAs at
31st March 2018
As at 31st March
2017
As at 1st April
2016
As at 31st March
2018
As at 31st March
2017
As at 1st April
2016
Security deposits 226.11 220.90 199.06 38.83 216.62 26.97 Total 226.11 220.90 199.06 38.83 216.62 26.97
7 Deferred tax assets(` in Lakhs)
Particulars
As at 31st March
2018
As at 31st March
2017
As at 1st April
2016
The balance comprises temporary differences attributable to:Provision for employee benefits 251.83 271.86 164.81 Provision for warranties 204.59 203.50 165.11 Provision for doubtful debts 1,440.65 1,405.84 1,388.85 Property, plant and equipment (1,611.33) (831.58) (392.04)Others 779.55 962.33 889.04 MAT credit 3,253.34 2,693.64 2,663.14 Total 4,318.63 4,705.59 4,878.91
Movement in deferred tax assets
(` in Lakhs)
Particulars
Provision for employee
benefits
Provision for
warranties
Provision for doubtful
debts
Property, plant and
equipment Others Total
At 1st April 2016 164.81 165.11 1,388.85 (392.04) 889.04 2,215.78 (Charged)/credited: - - to profit or loss 94.17 38.38 (51.60) (327.47) 29.80 (216.72)- to other comprehensive income 12.88 - - - - 12.88 At 31st March 2017 271.86 203.49 1,337.25 (719.51) 918.84 2,011.94 (Charged)/credited:- to profit or losss (20.45) 1.09 (54.30) (675.10) (198.30) (947.06)- to other comprehensive incomes 0.42 - - - - 0.42 At 31st March 2018 251.83 204.58 1,282.95 (1,394.61) 720.54 1,065.30
HPL Electric & Power Limited
134
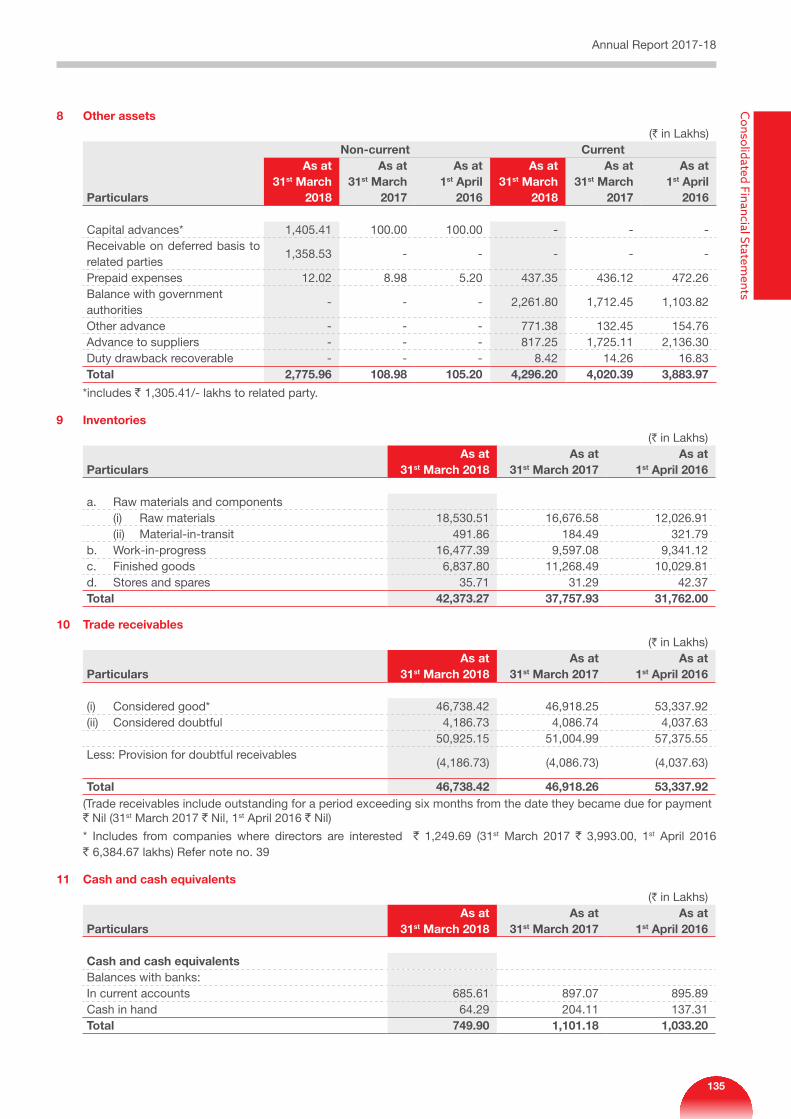
8 Other assets(` in Lakhs)
Particulars
Non-current CurrentAs at
31st March 2018
As at 31st March
2017
As at 1st April
2016
As at 31st March
2018
As at 31st March
2017
As at 1st April
2016
Capital advances* 1,405.41 100.00 100.00 - - - Receivable on deferred basis to related parties
1,358.53 - - - - -
Prepaid expenses 12.02 8.98 5.20 437.35 436.12 472.26 Balance with government authorities
- - - 2,261.80 1,712.45 1,103.82
Other advance - - - 771.38 132.45 154.76 Advance to suppliers - - - 817.25 1,725.11 2,136.30 Duty drawback recoverable - - - 8.42 14.26 16.83 Total 2,775.96 108.98 105.20 4,296.20 4,020.39 3,883.97
*includes ` 1,305.41/- lakhs to related party.
9 Inventories(` in Lakhs)
ParticularsAs at
31st March 2018As at
31st March 2017As at
1st April 2016
a. Raw materials and components (i) Raw materials 18,530.51 16,676.58 12,026.91 (ii) Material-in-transit 491.86 184.49 321.79 b. Work-in-progress 16,477.39 9,597.08 9,341.12 c. Finished goods 6,837.80 11,268.49 10,029.81 d. Stores and spares 35.71 31.29 42.37 Total 42,373.27 37,757.93 31,762.00
10 Trade receivables(` in Lakhs)
ParticularsAs at
31st March 2018As at
31st March 2017As at
1st April 2016
(i) Considered good* 46,738.42 46,918.25 53,337.92 (ii) Considered doubtful 4,186.73 4,086.74 4,037.63
50,925.15 51,004.99 57,375.55 Less: Provision for doubtful receivables
(4,186.73) (4,086.73) (4,037.63)
Total 46,738.42 46,918.26 53,337.92 (Trade receivables include outstanding for a period exceeding six months from the date they became due for payment ` Nil (31st March 2017 ` Nil, 1st April 2016 ` Nil)
* Includes from companies where directors are interested ` 1,249.69 (31st March 2017 ` 3,993.00, 1st April 2016 ` 6,384.67 lakhs) Refer note no. 39
11 Cash and cash equivalents(` in Lakhs)
ParticularsAs at
31st March 2018As at
31st March 2017As at
1st April 2016
Cash and cash equivalentsBalances with banks:In current accounts 685.61 897.07 895.89 Cash in hand 64.29 204.11 137.31 Total 749.90 1,101.18 1,033.20
Annual Report 2017-18C
onsolidated Financial Statements
135
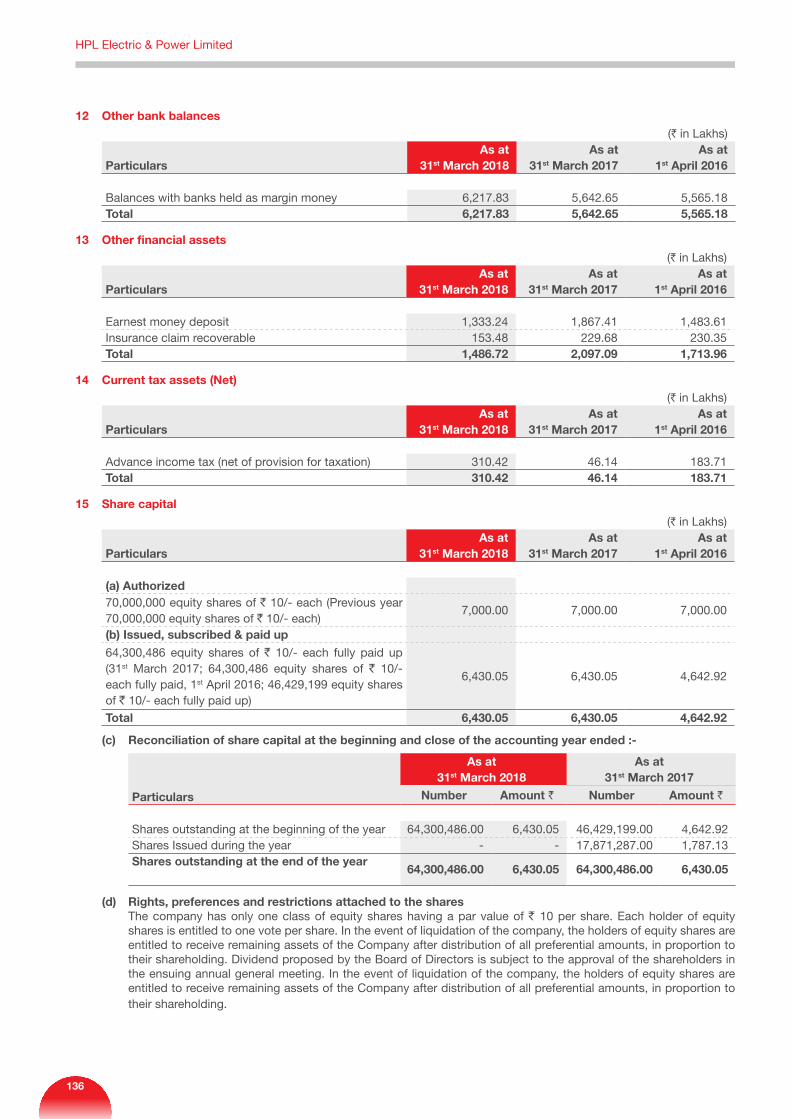
12 Other bank balances(` in Lakhs)
ParticularsAs at
31st March 2018As at
31st March 2017As at
1st April 2016
Balances with banks held as margin money 6,217.83 5,642.65 5,565.18 Total 6,217.83 5,642.65 5,565.18
13 Other financial assets(` in Lakhs)
ParticularsAs at
31st March 2018As at
31st March 2017As at
1st April 2016
Earnest money deposit 1,333.24 1,867.41 1,483.61 Insurance claim recoverable 153.48 229.68 230.35 Total 1,486.72 2,097.09 1,713.96
14 Current tax assets (Net)(` in Lakhs)
ParticularsAs at
31st March 2018As at
31st March 2017As at
1st April 2016
Advance income tax (net of provision for taxation) 310.42 46.14 183.71 Total 310.42 46.14 183.71
15 Share capital(` in Lakhs)
ParticularsAs at
31st March 2018As at
31st March 2017As at
1st April 2016
(a) Authorized70,000,000 equity shares of ` 10/- each (Previous year 70,000,000 equity shares of ` 10/- each)
7,000.00 7,000.00 7,000.00
(b) Issued, subscribed & paid up
64,300,486 equity shares of ` 10/- each fully paid up (31st March 2017; 64,300,486 equity shares of ` 10/- each fully paid, 1st April 2016; 46,429,199 equity shares of ` 10/- each fully paid up)
6,430.05 6,430.05 4,642.92
Total 6,430.05 6,430.05 4,642.92
(c) Reconciliation of share capital at the beginning and close of the accounting year ended :-
Particulars
As at 31st March 2018
As at 31st March 2017
Number Amount ` Number Amount `
Shares outstanding at the beginning of the year 64,300,486.00 6,430.05 46,429,199.00 4,642.92 Shares Issued during the year - - 17,871,287.00 1,787.13 Shares outstanding at the end of the year
64,300,486.00 6,430.05 64,300,486.00 6,430.05
(d) Rights, preferences and restrictions attached to the shares The company has only one class of equity shares having a par value of ` 10 per share. Each holder of equity
shares is entitled to one vote per share. In the event of liquidation of the company, the holders of equity shares are entitled to receive remaining assets of the Company after distribution of all preferential amounts, in proportion to their shareholding. Dividend proposed by the Board of Directors is subject to the approval of the shareholders in the ensuing annual general meeting. In the event of liquidation of the company, the holders of equity shares are entitled to receive remaining assets of the Company after distribution of all preferential amounts, in proportion to their shareholding.
HPL Electric & Power Limited
136
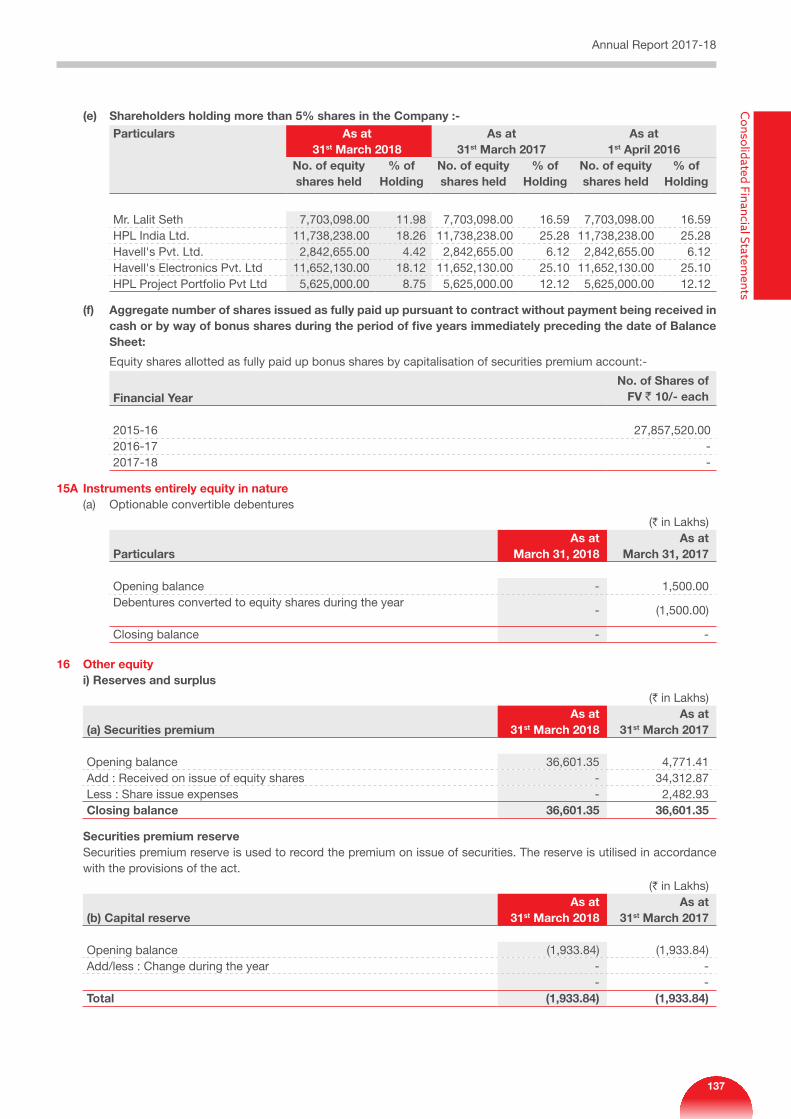
(e) Shareholders holding more than 5% shares in the Company :-Particulars As at
31st March 2018As at
31st March 2017As at
1st April 2016No. of equity shares held
% of Holding
No. of equity shares held
% of Holding
No. of equity shares held
% of Holding
Mr. Lalit Seth 7,703,098.00 11.98 7,703,098.00 16.59 7,703,098.00 16.59 HPL India Ltd. 11,738,238.00 18.26 11,738,238.00 25.28 11,738,238.00 25.28 Havell's Pvt. Ltd. 2,842,655.00 4.42 2,842,655.00 6.12 2,842,655.00 6.12 Havell's Electronics Pvt. Ltd 11,652,130.00 18.12 11,652,130.00 25.10 11,652,130.00 25.10 HPL Project Portfolio Pvt Ltd 5,625,000.00 8.75 5,625,000.00 12.12 5,625,000.00 12.12
(f) Aggregate number of shares issued as fully paid up pursuant to contract without payment being received in cash or by way of bonus shares during the period of five years immediately preceding the date of Balance Sheet:
Equity shares allotted as fully paid up bonus shares by capitalisation of securities premium account:-
Financial Year No. of Shares of
FV ` 10/- each
2015-16 27,857,520.00 2016-17 - 2017-18 -
15A Instruments entirely equity in nature (a) Optionable convertible debentures
(` in Lakhs)
ParticularsAs at
March 31, 2018As at
March 31, 2017
Opening balance - 1,500.00 Debentures converted to equity shares during the year
- (1,500.00)
Closing balance - -
16 Other equityi) Reserves and surplus
(` in Lakhs)
(a) Securities premiumAs at
31st March 2018As at
31st March 2017
Opening balance 36,601.35 4,771.41 Add : Received on issue of equity shares - 34,312.87 Less : Share issue expenses - 2,482.93 Closing balance 36,601.35 36,601.35
Securities premium reserveSecurities premium reserve is used to record the premium on issue of securities. The reserve is utilised in accordance with the provisions of the act.
(` in Lakhs)
(b) Capital reserveAs at
31st March 2018As at
31st March 2017
Opening balance (1,933.84) (1,933.84)Add/less : Change during the year - -
- - Total (1,933.84) (1,933.84)
Annual Report 2017-18C
onsolidated Financial Statements
137
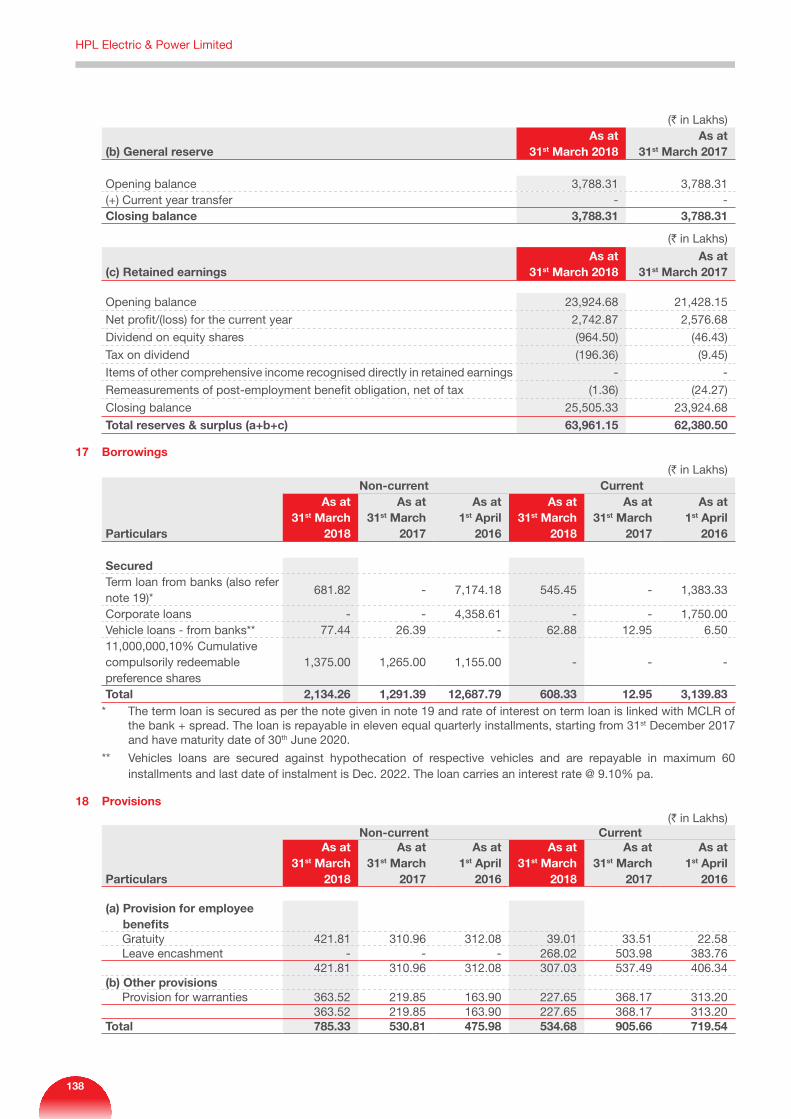
(` in Lakhs)
(b) General reserveAs at
31st March 2018As at
31st March 2017
Opening balance 3,788.31 3,788.31 (+) Current year transfer - - Closing balance 3,788.31 3,788.31
(` in Lakhs)
(c) Retained earningsAs at
31st March 2018As at
31st March 2017
Opening balance 23,924.68 21,428.15
Net profit/(loss) for the current year 2,742.87 2,576.68
Dividend on equity shares (964.50) (46.43)
Tax on dividend (196.36) (9.45)
Items of other comprehensive income recognised directly in retained earnings - -
Remeasurements of post-employment benefit obligation, net of tax (1.36) (24.27)
Closing balance 25,505.33 23,924.68
Total reserves & surplus (a+b+c) 63,961.15 62,380.50
17 Borrowings(` in Lakhs)
Particulars
Non-current CurrentAs at
31st March 2018
As at 31st March
2017
As at 1st April
2016
As at 31st March
2018
As at 31st March
2017
As at 1st April
2016
SecuredTerm loan from banks (also refer note 19)*
681.82 - 7,174.18 545.45 - 1,383.33
Corporate loans - - 4,358.61 - - 1,750.00 Vehicle loans - from banks** 77.44 26.39 - 62.88 12.95 6.50 11,000,000,10% Cumulative compulsorily redeemable preference shares
1,375.00 1,265.00 1,155.00 - - -
Total 2,134.26 1,291.39 12,687.79 608.33 12.95 3,139.83 * The term loan is secured as per the note given in note 19 and rate of interest on term loan is linked with MCLR of
the bank + spread. The loan is repayable in eleven equal quarterly installments, starting from 31st December 2017 and have maturity date of 30th June 2020.
** Vehicles loans are secured against hypothecation of respective vehicles and are repayable in maximum 60 installments and last date of instalment is Dec. 2022. The loan carries an interest rate @ 9.10% pa.
18 Provisions(` in Lakhs)
Particulars
Non-current CurrentAs at
31st March 2018
As at 31st March
2017
As at 1st April
2016
As at 31st March
2018
As at 31st March
2017
As at 1st April
2016
(a) Provision for employee benefits
Gratuity 421.81 310.96 312.08 39.01 33.51 22.58 Leave encashment - - - 268.02 503.98 383.76
421.81 310.96 312.08 307.03 537.49 406.34 (b) Other provisions Provision for warranties 363.52 219.85 163.90 227.65 368.17 313.20
363.52 219.85 163.90 227.65 368.17 313.20 Total 785.33 530.81 475.98 534.68 905.66 719.54
HPL Electric & Power Limited
138
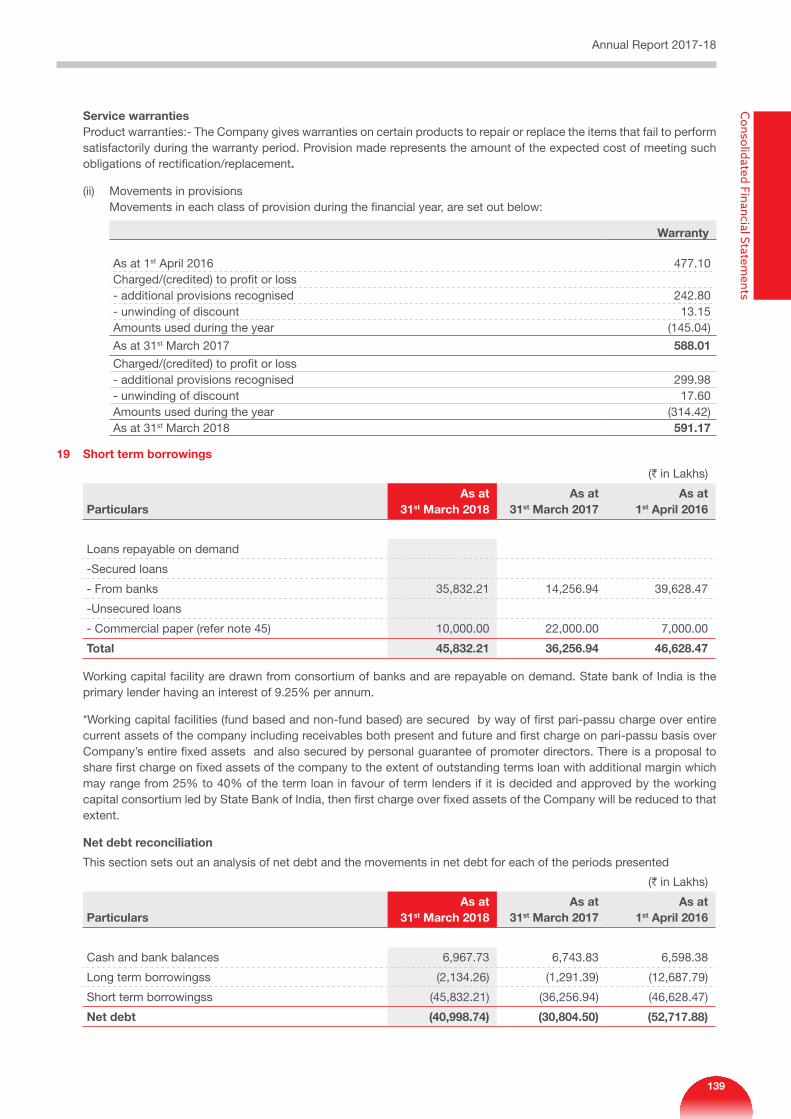
Service warranties Product warranties:- The Company gives warranties on certain products to repair or replace the items that fail to perform satisfactorily during the warranty period. Provision made represents the amount of the expected cost of meeting such obligations of rectification/replacement.
(ii) Movements in provisions Movements in each class of provision during the financial year, are set out below:
Warranty
As at 1st April 2016 477.10 Charged/(credited) to profit or loss- additional provisions recognised 242.80 - unwinding of discount 13.15 Amounts used during the year (145.04)
As at 31st March 2017 588.01
Charged/(credited) to profit or loss- additional provisions recognised 299.98 - unwinding of discount 17.60 Amounts used during the year (314.42)As at 31st March 2018 591.17
19 Short term borrowings
(` in Lakhs)
ParticularsAs at
31st March 2018As at
31st March 2017As at
1st April 2016
Loans repayable on demand
-Secured loans
- From banks 35,832.21 14,256.94 39,628.47
-Unsecured loans
- Commercial paper (refer note 45) 10,000.00 22,000.00 7,000.00
Total 45,832.21 36,256.94 46,628.47
Working capital facility are drawn from consortium of banks and are repayable on demand. State bank of India is the primary lender having an interest of 9.25% per annum.
*Working capital facilities (fund based and non-fund based) are secured by way of first pari-passu charge over entire current assets of the company including receivables both present and future and first charge on pari-passu basis over Company’s entire fixed assets and also secured by personal guarantee of promoter directors. There is a proposal to share first charge on fixed assets of the company to the extent of outstanding terms loan with additional margin which may range from 25% to 40% of the term loan in favour of term lenders if it is decided and approved by the working capital consortium led by State Bank of India, then first charge over fixed assets of the Company will be reduced to that extent.
Net debt reconciliation
This section sets out an analysis of net debt and the movements in net debt for each of the periods presented
(` in Lakhs)
ParticularsAs at
31st March 2018As at
31st March 2017As at
1st April 2016
Cash and bank balances 6,967.73 6,743.83 6,598.38
Long term borrowingss (2,134.26) (1,291.39) (12,687.79)
Short term borrowingss (45,832.21) (36,256.94) (46,628.47)
Net debt (40,998.74) (30,804.50) (52,717.88)
Annual Report 2017-18C
onsolidated Financial Statements
139
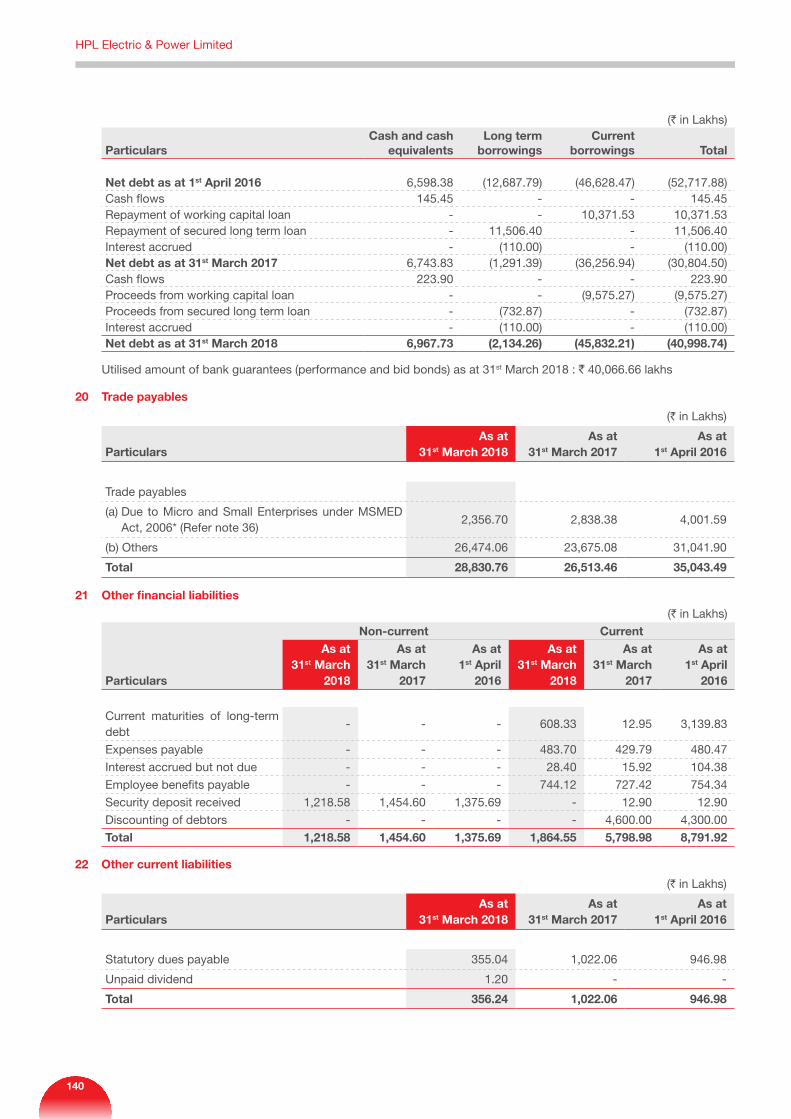
(` in Lakhs)
Particulars Cash and cash
equivalentsLong term
borrowingsCurrent
borrowings Total
Net debt as at 1st April 2016 6,598.38 (12,687.79) (46,628.47) (52,717.88)Cash flows 145.45 - - 145.45 Repayment of working capital loan - - 10,371.53 10,371.53 Repayment of secured long term loan - 11,506.40 - 11,506.40 Interest accrued - (110.00) - (110.00)Net debt as at 31st March 2017 6,743.83 (1,291.39) (36,256.94) (30,804.50)Cash flows 223.90 - - 223.90 Proceeds from working capital loan - - (9,575.27) (9,575.27)Proceeds from secured long term loan - (732.87) - (732.87)Interest accrued - (110.00) - (110.00)Net debt as at 31st March 2018 6,967.73 (2,134.26) (45,832.21) (40,998.74)
Utilised amount of bank guarantees (performance and bid bonds) as at 31st March 2018 : ` 40,066.66 lakhs
20 Trade payables
(` in Lakhs)
ParticularsAs at
31st March 2018As at
31st March 2017As at
1st April 2016
Trade payables
(a) Due to Micro and Small Enterprises under MSMED Act, 2006* (Refer note 36)
2,356.70 2,838.38 4,001.59
(b) Others 26,474.06 23,675.08 31,041.90
Total 28,830.76 26,513.46 35,043.49
21 Other financial liabilities
(` in Lakhs)
Particulars
Non-current CurrentAs at
31st March 2018
As at 31st March
2017
As at 1st April
2016
As at 31st March
2018
As at 31st March
2017
As at 1st April
2016
Current maturities of long-term debt
- - - 608.33 12.95 3,139.83
Expenses payable - - - 483.70 429.79 480.47
Interest accrued but not due - - - 28.40 15.92 104.38
Employee benefits payable - - - 744.12 727.42 754.34
Security deposit received 1,218.58 1,454.60 1,375.69 - 12.90 12.90
Discounting of debtors - - - - 4,600.00 4,300.00
Total 1,218.58 1,454.60 1,375.69 1,864.55 5,798.98 8,791.92
22 Other current liabilities
(` in Lakhs)
ParticularsAs at
31st March 2018As at
31st March 2017As at
1st April 2016
Statutory dues payable 355.04 1,022.06 946.98
Unpaid dividend 1.20 - -
Total 356.24 1,022.06 946.98
HPL Electric & Power Limited
140
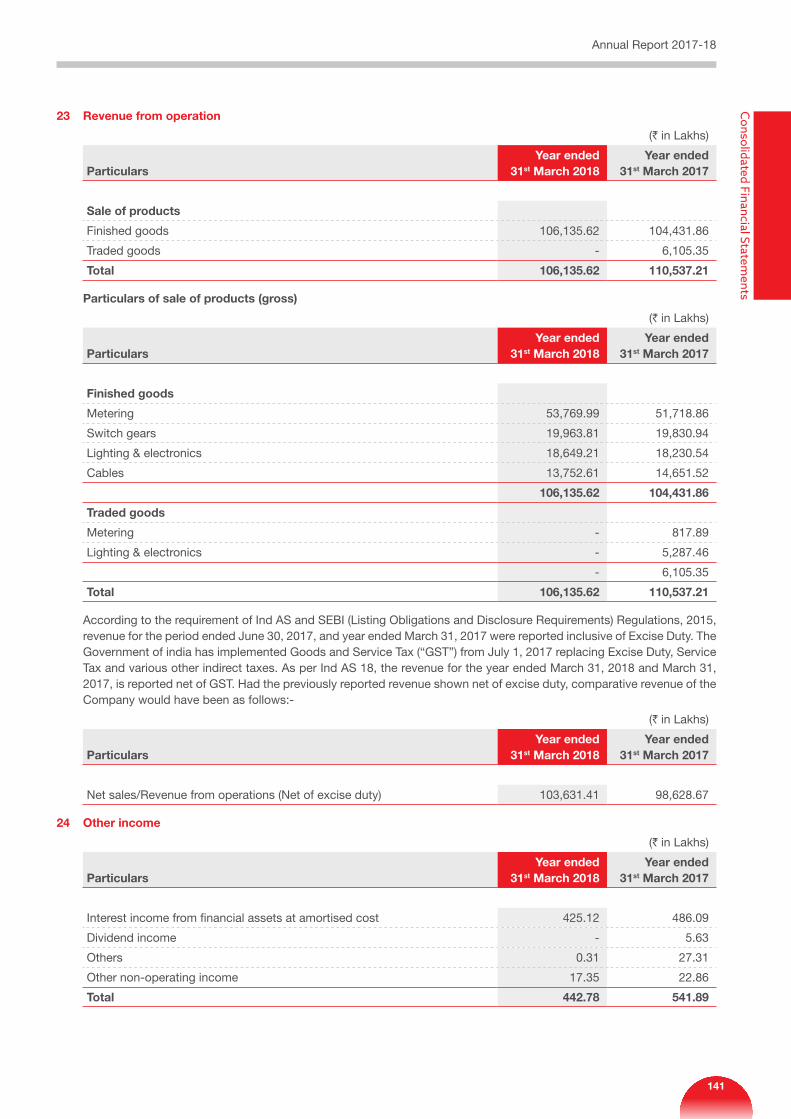
23 Revenue from operation
(` in Lakhs)
Particulars Year ended
31st March 2018Year ended
31st March 2017
Sale of products
Finished goods 106,135.62 104,431.86
Traded goods - 6,105.35
Total 106,135.62 110,537.21
Particulars of sale of products (gross)
(` in Lakhs)
Particulars Year ended
31st March 2018Year ended
31st March 2017
Finished goods
Metering 53,769.99 51,718.86
Switch gears 19,963.81 19,830.94
Lighting & electronics 18,649.21 18,230.54
Cables 13,752.61 14,651.52
106,135.62 104,431.86
Traded goods
Metering - 817.89
Lighting & electronics - 5,287.46
- 6,105.35
Total 106,135.62 110,537.21
According to the requirement of Ind AS and SEBI (Listing Obligations and Disclosure Requirements) Regulations, 2015, revenue for the period ended June 30, 2017, and year ended March 31, 2017 were reported inclusive of Excise Duty. The Government of india has implemented Goods and Service Tax (“GST”) from July 1, 2017 replacing Excise Duty, Service Tax and various other indirect taxes. As per Ind AS 18, the revenue for the year ended March 31, 2018 and March 31, 2017, is reported net of GST. Had the previously reported revenue shown net of excise duty, comparative revenue of the Company would have been as follows:-
(` in Lakhs)
Particulars Year ended
31st March 2018Year ended
31st March 2017
Net sales/Revenue from operations (Net of excise duty) 103,631.41 98,628.67
24 Other income
(` in Lakhs)
Particulars Year ended
31st March 2018Year ended
31st March 2017
Interest income from financial assets at amortised cost 425.12 486.09
Dividend income - 5.63
Others 0.31 27.31
Other non-operating income 17.35 22.86
Total 442.78 541.89
Annual Report 2017-18C
onsolidated Financial Statements
141
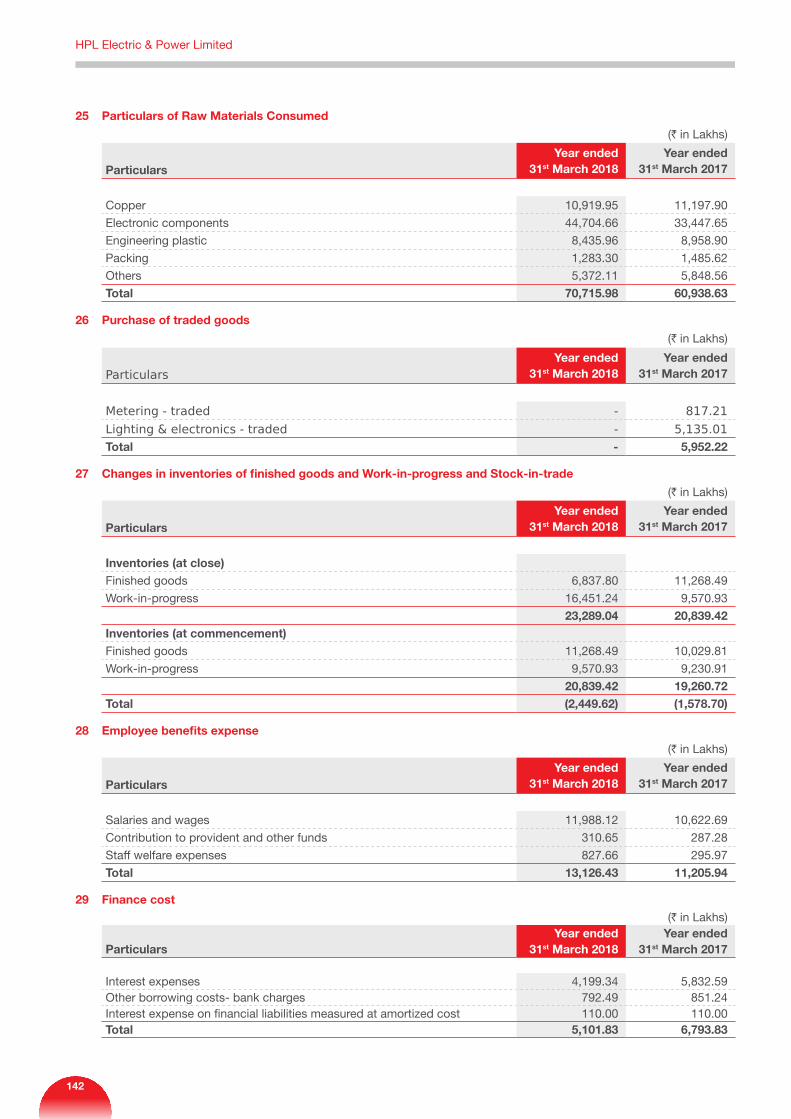
25 Particulars of Raw Materials Consumed
(` in Lakhs)
Particulars Year ended
31st March 2018Year ended
31st March 2017
Copper 10,919.95 11,197.90
Electronic components 44,704.66 33,447.65
Engineering plastic 8,435.96 8,958.90
Packing 1,283.30 1,485.62
Others 5,372.11 5,848.56
Total 70,715.98 60,938.63
26 Purchase of traded goods
(` in Lakhs)
Particulars Year ended
31st March 2018Year ended
31st March 2017
Metering - traded - 817.21
Lighting & electronics - traded - 5,135.01
Total - 5,952.22
27 Changes in inventories of finished goods and Work-in-progress and Stock-in-trade
(` in Lakhs)
Particulars Year ended
31st March 2018Year ended
31st March 2017
Inventories (at close)Finished goods 6,837.80 11,268.49
Work-in-progress 16,451.24 9,570.93
23,289.04 20,839.42 Inventories (at commencement)Finished goods 11,268.49 10,029.81
Work-in-progress 9,570.93 9,230.91
20,839.42 19,260.72 Total (2,449.62) (1,578.70)
28 Employee benefits expense
(` in Lakhs)
Particulars Year ended
31st March 2018Year ended
31st March 2017
Salaries and wages 11,988.12 10,622.69
Contribution to provident and other funds 310.65 287.28
Staff welfare expenses 827.66 295.97
Total 13,126.43 11,205.94
29 Finance cost(` in Lakhs)
Particulars Year ended
31st March 2018Year ended
31st March 2017
Interest expenses 4,199.34 5,832.59 Other borrowing costs- bank charges 792.49 851.24 Interest expense on financial liabilities measured at amortized cost 110.00 110.00 Total 5,101.83 6,793.83
HPL Electric & Power Limited
142
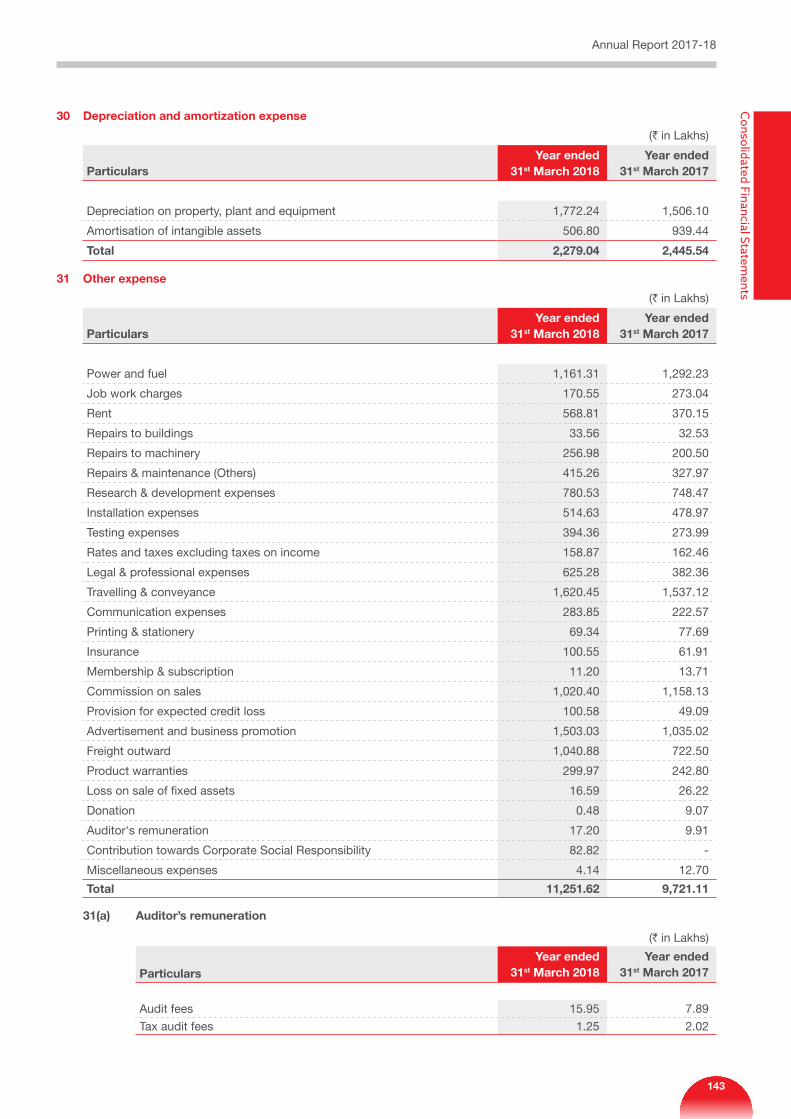
30 Depreciation and amortization expense
(` in Lakhs)
Particulars Year ended
31st March 2018Year ended
31st March 2017
Depreciation on property, plant and equipment 1,772.24 1,506.10
Amortisation of intangible assets 506.80 939.44
Total 2,279.04 2,445.54
31 Other expense
(` in Lakhs)
Particulars Year ended
31st March 2018Year ended
31st March 2017
Power and fuel 1,161.31 1,292.23
Job work charges 170.55 273.04
Rent 568.81 370.15
Repairs to buildings 33.56 32.53
Repairs to machinery 256.98 200.50
Repairs & maintenance (Others) 415.26 327.97
Research & development expenses 780.53 748.47
Installation expenses 514.63 478.97
Testing expenses 394.36 273.99
Rates and taxes excluding taxes on income 158.87 162.46
Legal & professional expenses 625.28 382.36
Travelling & conveyance 1,620.45 1,537.12
Communication expenses 283.85 222.57
Printing & stationery 69.34 77.69
Insurance 100.55 61.91
Membership & subscription 11.20 13.71
Commission on sales 1,020.40 1,158.13
Provision for expected credit loss 100.58 49.09
Advertisement and business promotion 1,503.03 1,035.02
Freight outward 1,040.88 722.50
Product warranties 299.97 242.80
Loss on sale of fixed assets 16.59 26.22
Donation 0.48 9.07
Auditor's remuneration 17.20 9.91
Contribution towards Corporate Social Responsibility 82.82 -
Miscellaneous expenses 4.14 12.70
Total 11,251.62 9,721.11
31(a) Auditor’s remuneration
(` in Lakhs)
Particulars Year ended
31st March 2018Year ended
31st March 2017
Audit fees 15.95 7.89
Tax audit fees 1.25 2.02
Annual Report 2017-18C
onsolidated Financial Statements
143
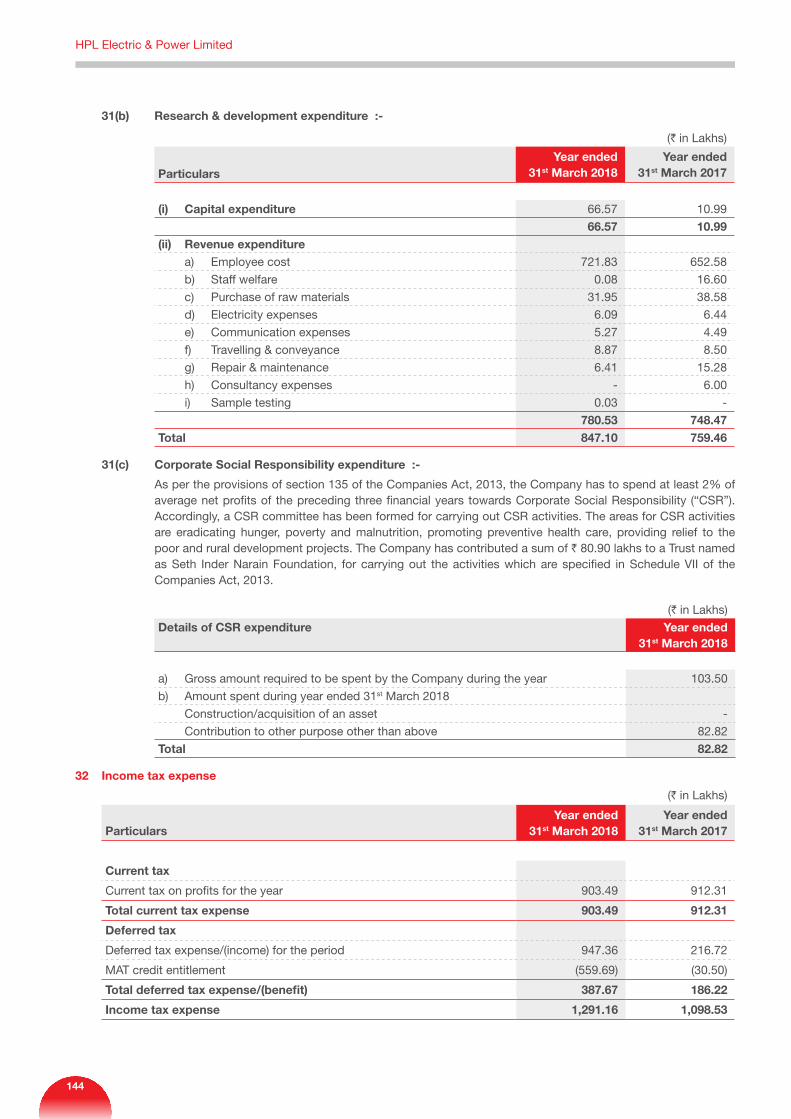
31(b) Research & development expenditure :-
(` in Lakhs)
Particulars Year ended
31st March 2018Year ended
31st March 2017
(i) Capital expenditure 66.57 10.99
66.57 10.99 (ii) Revenue expenditure a) Employee cost 721.83 652.58
b) Staff welfare 0.08 16.60
c) Purchase of raw materials 31.95 38.58
d) Electricity expenses 6.09 6.44
e) Communication expenses 5.27 4.49
f) Travelling & conveyance 8.87 8.50
g) Repair & maintenance 6.41 15.28
h) Consultancy expenses - 6.00
i) Sample testing 0.03 -
780.53 748.47 Total 847.10 759.46
31(c) Corporate Social Responsibility expenditure :-
As per the provisions of section 135 of the Companies Act, 2013, the Company has to spend at least 2% of average net profits of the preceding three financial years towards Corporate Social Responsibility (“CSR”). Accordingly, a CSR committee has been formed for carrying out CSR activities. The areas for CSR activities are eradicating hunger, poverty and malnutrition, promoting preventive health care, providing relief to the poor and rural development projects. The Company has contributed a sum of ` 80.90 lakhs to a Trust named as Seth Inder Narain Foundation, for carrying out the activities which are specified in Schedule VII of the Companies Act, 2013.
(` in Lakhs)
Details of CSR expenditure Year ended31st March 2018
a) Gross amount required to be spent by the Company during the year 103.50
b) Amount spent during year ended 31st March 2018
Construction/acquisition of an asset -
Contribution to other purpose other than above 82.82
Total 82.82
32 Income tax expense
(` in Lakhs)
Particulars Year ended
31st March 2018Year ended
31st March 2017
Current tax
Current tax on profits for the year 903.49 912.31
Total current tax expense 903.49 912.31
Deferred tax
Deferred tax expense/(income) for the period 947.36 216.72
MAT credit entitlement (559.69) (30.50)
Total deferred tax expense/(benefit) 387.67 186.22
Income tax expense 1,291.16 1,098.53
HPL Electric & Power Limited
144
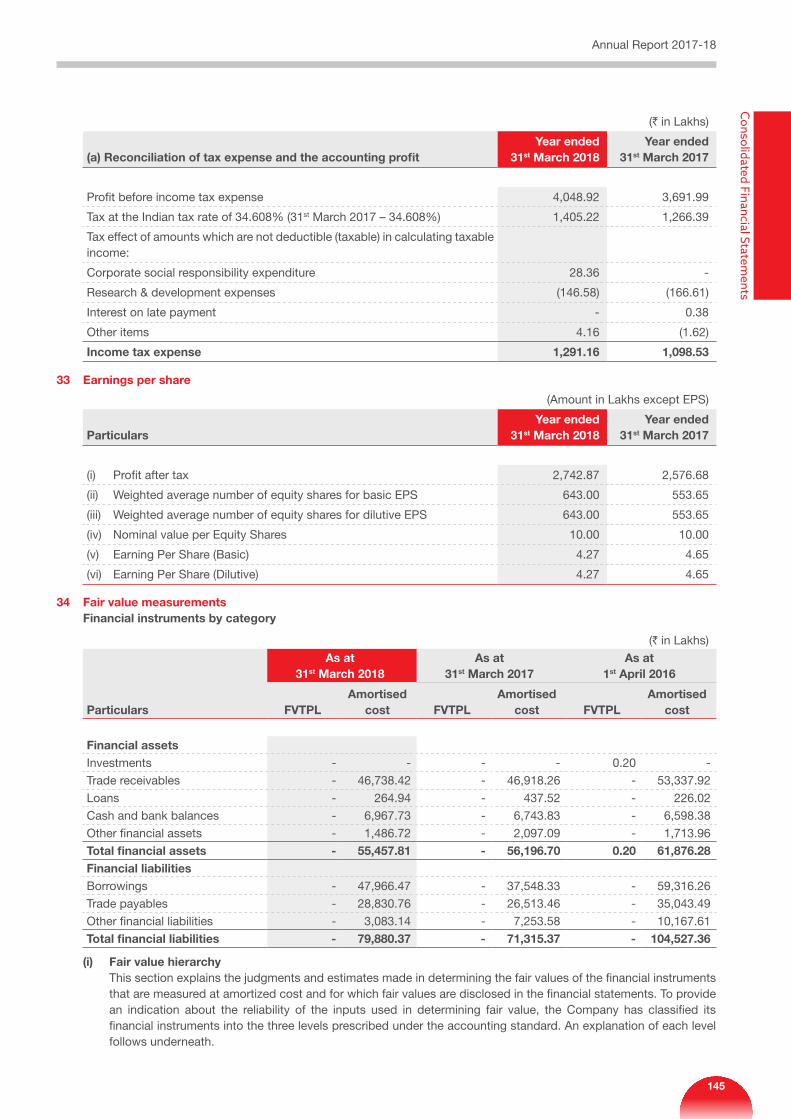
(` in Lakhs)
(a) Reconciliation of tax expense and the accounting profit Year ended
31st March 2018Year ended
31st March 2017
Profit before income tax expense 4,048.92 3,691.99
Tax at the Indian tax rate of 34.608% (31st March 2017 – 34.608%) 1,405.22 1,266.39
Tax effect of amounts which are not deductible (taxable) in calculating taxable income:
Corporate social responsibility expenditure 28.36 -
Research & development expenses (146.58) (166.61)
Interest on late payment - 0.38
Other items 4.16 (1.62)
Income tax expense 1,291.16 1,098.53
33 Earnings per share
(Amount in Lakhs except EPS)
Particulars Year ended
31st March 2018Year ended
31st March 2017
(i) Profit after tax 2,742.87 2,576.68
(ii) Weighted average number of equity shares for basic EPS 643.00 553.65
(iii) Weighted average number of equity shares for dilutive EPS 643.00 553.65
(iv) Nominal value per Equity Shares 10.00 10.00
(v) Earning Per Share (Basic) 4.27 4.65
(vi) Earning Per Share (Dilutive) 4.27 4.65
34 Fair value measurements Financial instruments by category
(` in Lakhs)
Particulars
As at 31st March 2018
As at 31st March 2017
As at 1st April 2016
FVTPLAmortised
cost FVTPLAmortised
cost FVTPLAmortised
cost
Financial assets Investments - - - - 0.20 -
Trade receivables - 46,738.42 - 46,918.26 - 53,337.92
Loans - 264.94 - 437.52 - 226.02
Cash and bank balances - 6,967.73 - 6,743.83 - 6,598.38
Other financial assets - 1,486.72 - 2,097.09 - 1,713.96
Total financial assets - 55,457.81 - 56,196.70 0.20 61,876.28 Financial liabilities Borrowings - 47,966.47 - 37,548.33 - 59,316.26
Trade payables - 28,830.76 - 26,513.46 - 35,043.49
Other financial liabilities - 3,083.14 - 7,253.58 - 10,167.61
Total financial liabilities - 79,880.37 - 71,315.37 - 104,527.36
(i) Fair value hierarchy This section explains the judgments and estimates made in determining the fair values of the financial instruments
that are measured at amortized cost and for which fair values are disclosed in the financial statements. To provide an indication about the reliability of the inputs used in determining fair value, the Company has classified its financial instruments into the three levels prescribed under the accounting standard. An explanation of each level follows underneath.
Annual Report 2017-18C
onsolidated Financial Statements
145
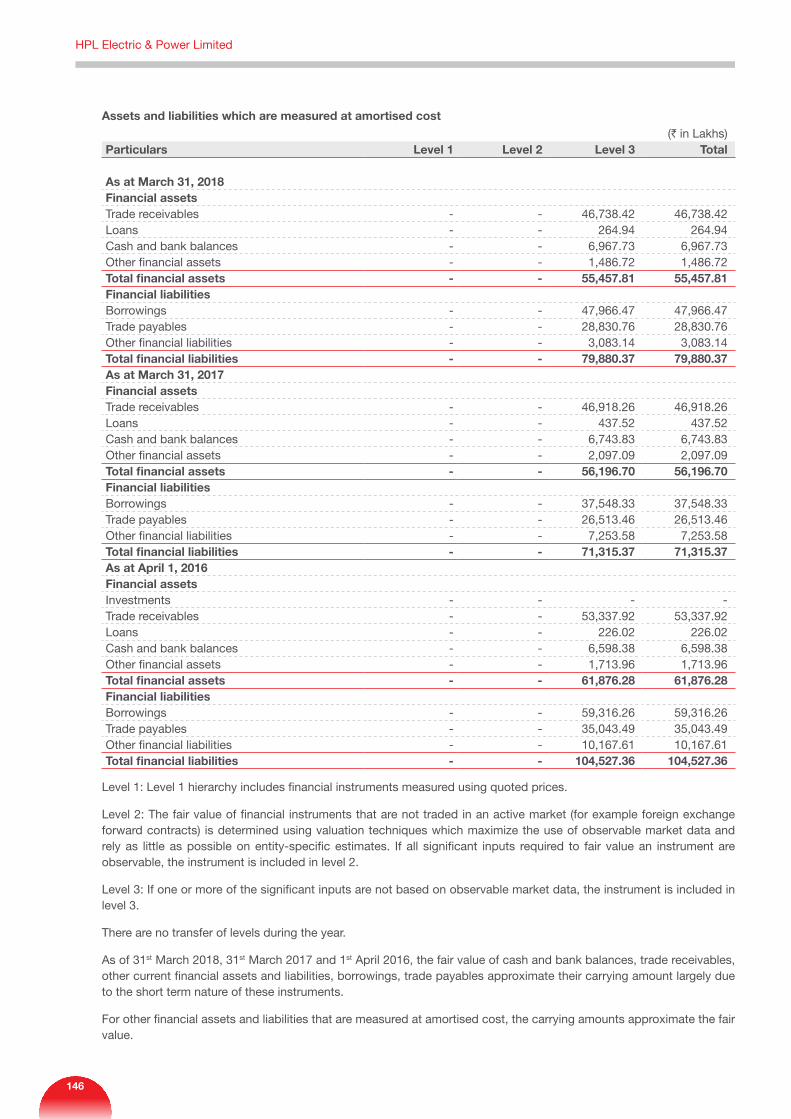
Assets and liabilities which are measured at amortised cost(` in Lakhs)
Particulars Level 1 Level 2 Level 3 Total
As at March 31, 2018Financial assets Trade receivables - - 46,738.42 46,738.42 Loans - - 264.94 264.94 Cash and bank balances - - 6,967.73 6,967.73 Other financial assets - - 1,486.72 1,486.72 Total financial assets - - 55,457.81 55,457.81 Financial liabilities Borrowings - - 47,966.47 47,966.47 Trade payables - - 28,830.76 28,830.76 Other financial liabilities - - 3,083.14 3,083.14 Total financial liabilities - - 79,880.37 79,880.37 As at March 31, 2017Financial assets Trade receivables - - 46,918.26 46,918.26 Loans - - 437.52 437.52 Cash and bank balances - - 6,743.83 6,743.83 Other financial assets - - 2,097.09 2,097.09 Total financial assets - - 56,196.70 56,196.70 Financial liabilities Borrowings - - 37,548.33 37,548.33 Trade payables - - 26,513.46 26,513.46 Other financial liabilities - - 7,253.58 7,253.58 Total financial liabilities - - 71,315.37 71,315.37 As at April 1, 2016Financial assets Investments - - - - Trade receivables - - 53,337.92 53,337.92 Loans - - 226.02 226.02 Cash and bank balances - - 6,598.38 6,598.38 Other financial assets - - 1,713.96 1,713.96 Total financial assets - - 61,876.28 61,876.28 Financial liabilities Borrowings - - 59,316.26 59,316.26 Trade payables - - 35,043.49 35,043.49 Other financial liabilities - - 10,167.61 10,167.61 Total financial liabilities - - 104,527.36 104,527.36
Level 1: Level 1 hierarchy includes financial instruments measured using quoted prices.
Level 2: The fair value of financial instruments that are not traded in an active market (for example foreign exchange forward contracts) is determined using valuation techniques which maximize the use of observable market data and rely as little as possible on entity-specific estimates. If all significant inputs required to fair value an instrument are observable, the instrument is included in level 2.
Level 3: If one or more of the significant inputs are not based on observable market data, the instrument is included in level 3.
There are no transfer of levels during the year.
As of 31st March 2018, 31st March 2017 and 1st April 2016, the fair value of cash and bank balances, trade receivables, other current financial assets and liabilities, borrowings, trade payables approximate their carrying amount largely due to the short term nature of these instruments.
For other financial assets and liabilities that are measured at amortised cost, the carrying amounts approximate the fair value.
HPL Electric & Power Limited
146
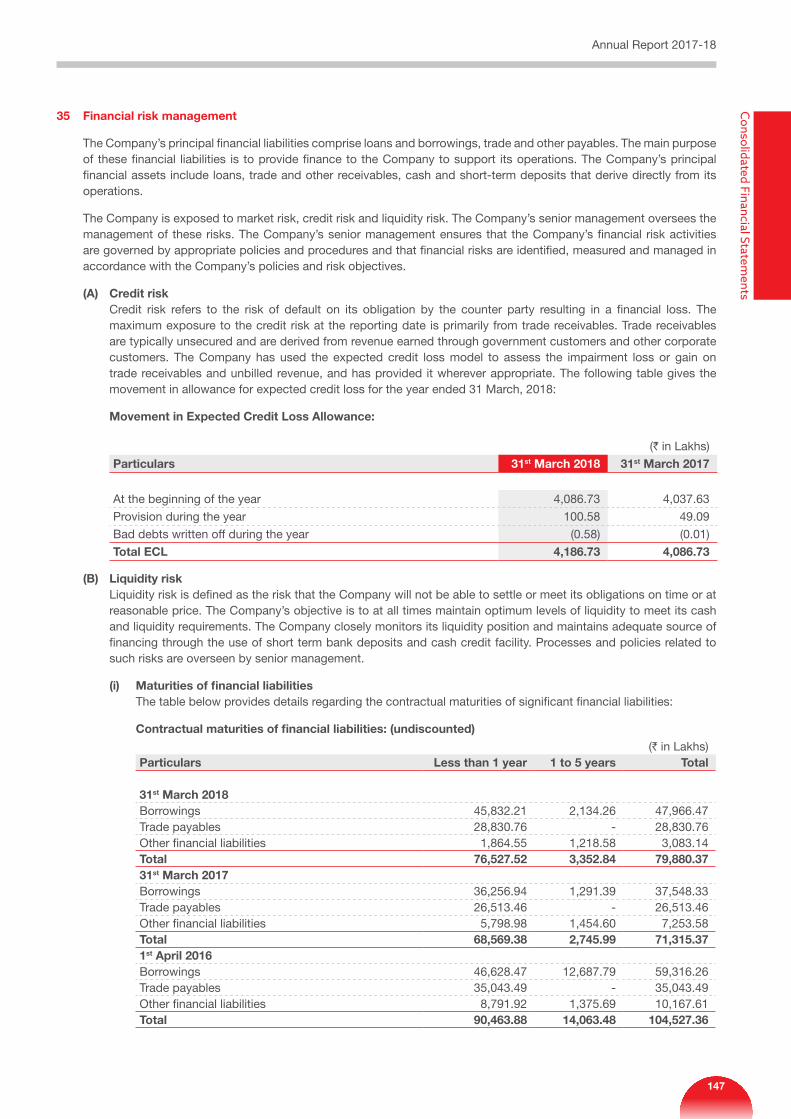
35 Financial risk management
The Company’s principal financial liabilities comprise loans and borrowings, trade and other payables. The main purpose of these financial liabilities is to provide finance to the Company to support its operations. The Company’s principal financial assets include loans, trade and other receivables, cash and short-term deposits that derive directly from its operations.
The Company is exposed to market risk, credit risk and liquidity risk. The Company’s senior management oversees the management of these risks. The Company’s senior management ensures that the Company’s financial risk activities are governed by appropriate policies and procedures and that financial risks are identified, measured and managed in accordance with the Company’s policies and risk objectives.
(A) Credit risk Credit risk refers to the risk of default on its obligation by the counter party resulting in a financial loss. The
maximum exposure to the credit risk at the reporting date is primarily from trade receivables. Trade receivables are typically unsecured and are derived from revenue earned through government customers and other corporate customers. The Company has used the expected credit loss model to assess the impairment loss or gain on trade receivables and unbilled revenue, and has provided it wherever appropriate. The following table gives the movement in allowance for expected credit loss for the year ended 31 March, 2018:
Movement in Expected Credit Loss Allowance:
(` in Lakhs)
Particulars 31st March 2018 31st March 2017
At the beginning of the year 4,086.73 4,037.63
Provision during the year 100.58 49.09
Bad debts written off during the year (0.58) (0.01)
Total ECL 4,186.73 4,086.73
(B) Liquidity risk Liquidity risk is defined as the risk that the Company will not be able to settle or meet its obligations on time or at
reasonable price. The Company’s objective is to at all times maintain optimum levels of liquidity to meet its cash and liquidity requirements. The Company closely monitors its liquidity position and maintains adequate source of financing through the use of short term bank deposits and cash credit facility. Processes and policies related to such risks are overseen by senior management.
(i) Maturities of financial liabilities The table below provides details regarding the contractual maturities of significant financial liabilities:
Contractual maturities of financial liabilities: (undiscounted)(` in Lakhs)
Particulars Less than 1 year 1 to 5 years Total
31st March 2018Borrowings 45,832.21 2,134.26 47,966.47 Trade payables 28,830.76 - 28,830.76 Other financial liabilities 1,864.55 1,218.58 3,083.14 Total 76,527.52 3,352.84 79,880.37 31st March 2017Borrowings 36,256.94 1,291.39 37,548.33 Trade payables 26,513.46 - 26,513.46 Other financial liabilities 5,798.98 1,454.60 7,253.58 Total 68,569.38 2,745.99 71,315.37 1st April 2016Borrowings 46,628.47 12,687.79 59,316.26 Trade payables 35,043.49 - 35,043.49 Other financial liabilities 8,791.92 1,375.69 10,167.61 Total 90,463.88 14,063.48 104,527.36
Annual Report 2017-18C
onsolidated Financial Statements
147
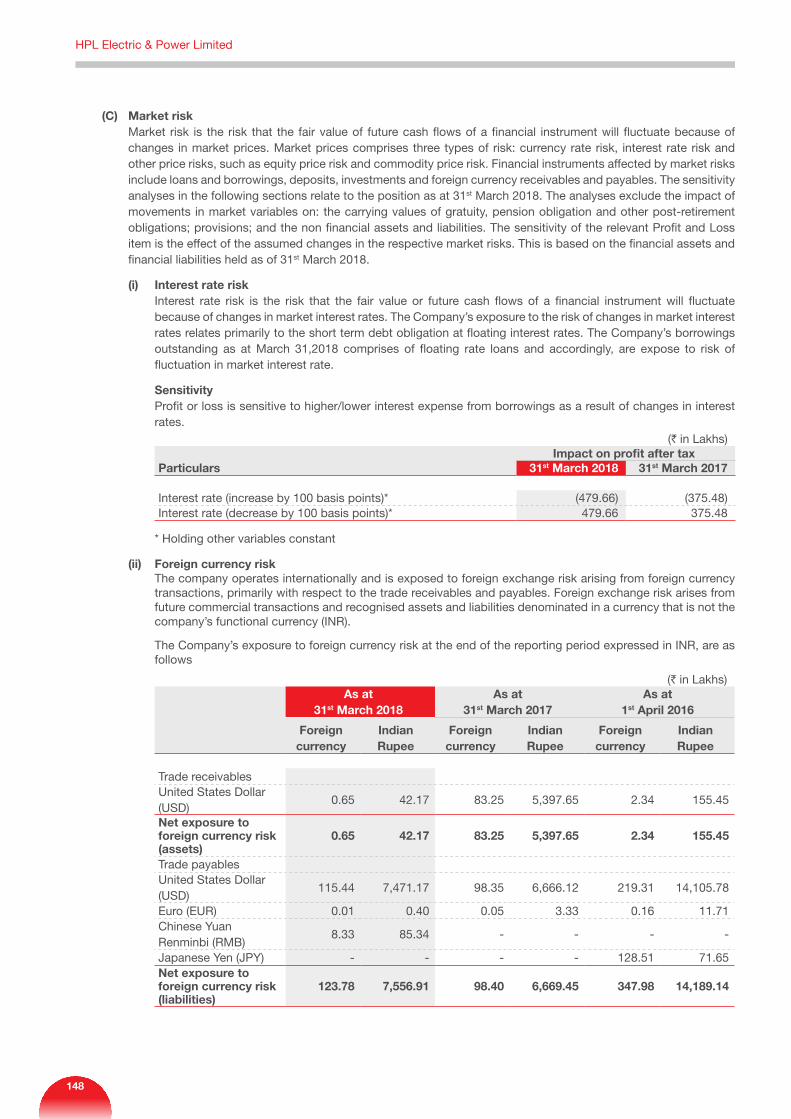
(C) Market risk Market risk is the risk that the fair value of future cash flows of a financial instrument will fluctuate because of
changes in market prices. Market prices comprises three types of risk: currency rate risk, interest rate risk and other price risks, such as equity price risk and commodity price risk. Financial instruments affected by market risks include loans and borrowings, deposits, investments and foreign currency receivables and payables. The sensitivity analyses in the following sections relate to the position as at 31st March 2018. The analyses exclude the impact of movements in market variables on: the carrying values of gratuity, pension obligation and other post-retirement obligations; provisions; and the non financial assets and liabilities. The sensitivity of the relevant Profit and Loss item is the effect of the assumed changes in the respective market risks. This is based on the financial assets and financial liabilities held as of 31st March 2018.
(i) Interest rate risk Interest rate risk is the risk that the fair value or future cash flows of a financial instrument will fluctuate
because of changes in market interest rates. The Company’s exposure to the risk of changes in market interest rates relates primarily to the short term debt obligation at floating interest rates. The Company’s borrowings outstanding as at March 31,2018 comprises of floating rate loans and accordingly, are expose to risk of fluctuation in market interest rate.
Sensitivity Profit or loss is sensitive to higher/lower interest expense from borrowings as a result of changes in interest
rates.(` in Lakhs)
Impact on profit after taxParticulars 31st March 2018 31st March 2017
Interest rate (increase by 100 basis points)* (479.66) (375.48)Interest rate (decrease by 100 basis points)* 479.66 375.48
* Holding other variables constant
(ii) Foreign currency riskThe company operates internationally and is exposed to foreign exchange risk arising from foreign currency transactions, primarily with respect to the trade receivables and payables. Foreign exchange risk arises from future commercial transactions and recognised assets and liabilities denominated in a currency that is not the company’s functional currency (INR).
The Company’s exposure to foreign currency risk at the end of the reporting period expressed in INR, are as follows
(` in Lakhs)As at
31st March 2018As at
31st March 2017As at
1st April 2016
Foreign currency
Indian Rupee
Foreign currency
Indian Rupee
Foreign currency
Indian Rupee
Trade receivablesUnited States Dollar (USD)
0.65 42.17 83.25 5,397.65 2.34 155.45
Net exposure to foreign currency risk (assets)
0.65 42.17 83.25 5,397.65 2.34 155.45
Trade payablesUnited States Dollar (USD)
115.44 7,471.17 98.35 6,666.12 219.31 14,105.78
Euro (EUR) 0.01 0.40 0.05 3.33 0.16 11.71 Chinese Yuan Renminbi (RMB)
8.33 85.34 - - - -
Japanese Yen (JPY) - - - - 128.51 71.65 Net exposure to foreign currency risk (liabilities)
123.78 7,556.91 98.40 6,669.45 347.98 14,189.14
HPL Electric & Power Limited
148
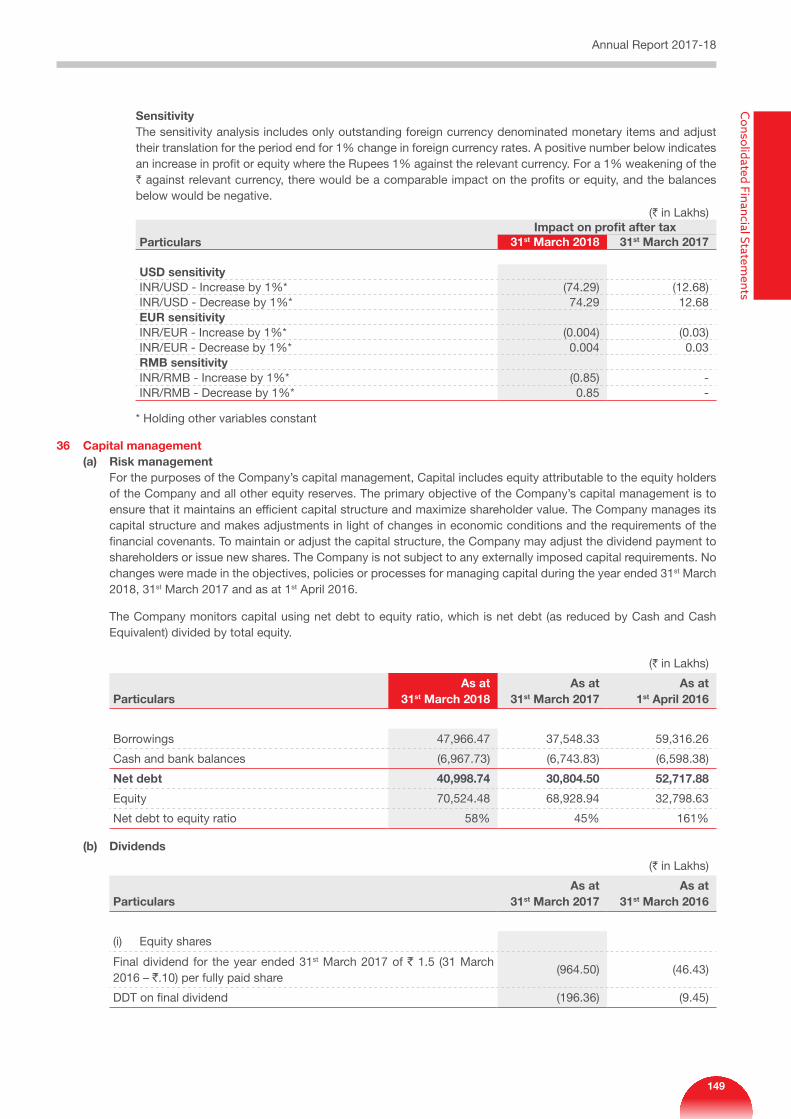
SensitivityThe sensitivity analysis includes only outstanding foreign currency denominated monetary items and adjust their translation for the period end for 1% change in foreign currency rates. A positive number below indicates an increase in profit or equity where the Rupees 1% against the relevant currency. For a 1% weakening of the ` against relevant currency, there would be a comparable impact on the profits or equity, and the balances below would be negative.
(` in Lakhs)Impact on profit after tax
Particulars 31st March 2018 31st March 2017
USD sensitivityINR/USD - Increase by 1%* (74.29) (12.68)INR/USD - Decrease by 1%* 74.29 12.68 EUR sensitivityINR/EUR - Increase by 1%* (0.004) (0.03)INR/EUR - Decrease by 1%* 0.004 0.03 RMB sensitivityINR/RMB - Increase by 1%* (0.85) - INR/RMB - Decrease by 1%* 0.85 -
* Holding other variables constant
36 Capital management(a) Risk management For the purposes of the Company’s capital management, Capital includes equity attributable to the equity holders
of the Company and all other equity reserves. The primary objective of the Company’s capital management is to ensure that it maintains an efficient capital structure and maximize shareholder value. The Company manages its capital structure and makes adjustments in light of changes in economic conditions and the requirements of the financial covenants. To maintain or adjust the capital structure, the Company may adjust the dividend payment to shareholders or issue new shares. The Company is not subject to any externally imposed capital requirements. No changes were made in the objectives, policies or processes for managing capital during the year ended 31st March 2018, 31st March 2017 and as at 1st April 2016.
The Company monitors capital using net debt to equity ratio, which is net debt (as reduced by Cash and Cash Equivalent) divided by total equity.
(` in Lakhs)
ParticularsAs at
31st March 2018As at
31st March 2017As at
1st April 2016
Borrowings 47,966.47 37,548.33 59,316.26
Cash and bank balances (6,967.73) (6,743.83) (6,598.38)
Net debt 40,998.74 30,804.50 52,717.88
Equity 70,524.48 68,928.94 32,798.63
Net debt to equity ratio 58% 45% 161%
(b) Dividends
(` in Lakhs)
ParticularsAs at
31st March 2017As at
31st March 2016
(i) Equity shares
Final dividend for the year ended 31st March 2017 of ` 1.5 (31 March 2016 – `.10) per fully paid share
(964.50) (46.43)
DDT on final dividend (196.36) (9.45)
Annual Report 2017-18C
onsolidated Financial Statements
149
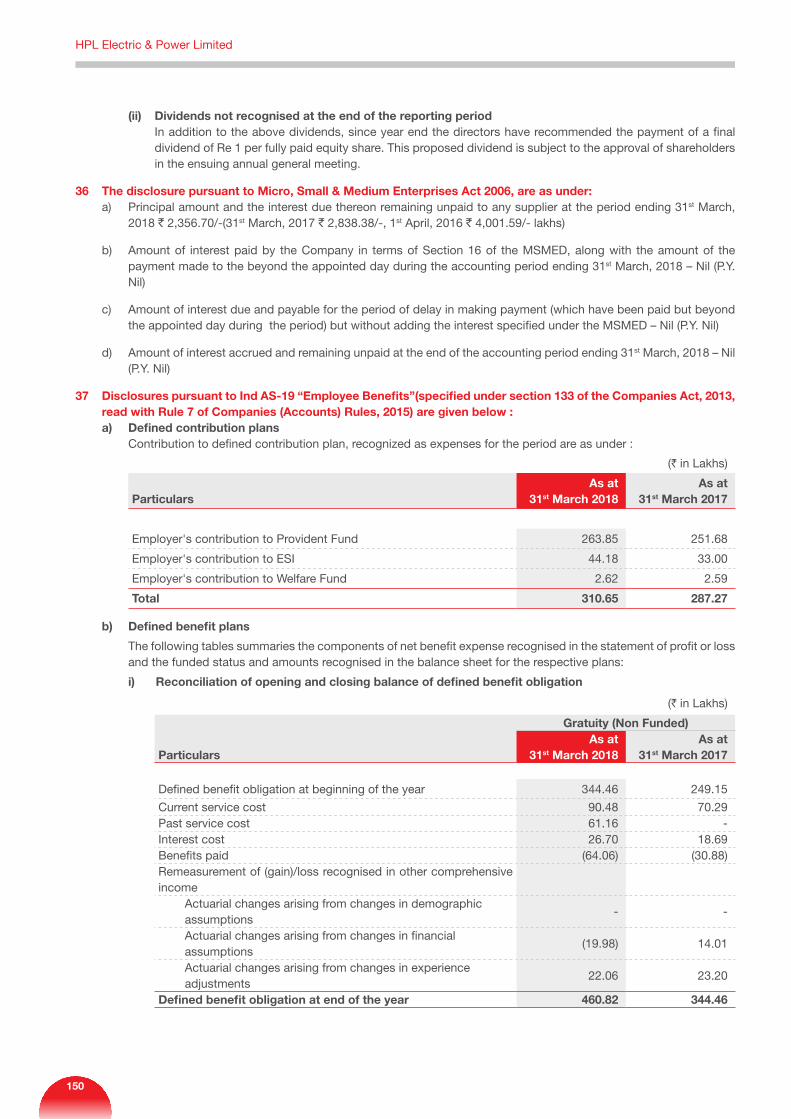
(ii) Dividends not recognised at the end of the reporting period In addition to the above dividends, since year end the directors have recommended the payment of a final
dividend of Re 1 per fully paid equity share. This proposed dividend is subject to the approval of shareholders in the ensuing annual general meeting.
36 The disclosure pursuant to Micro, Small & Medium Enterprises Act 2006, are as under:a) Principal amount and the interest due thereon remaining unpaid to any supplier at the period ending 31st March,
2018 ` 2,356.70/-(31st March, 2017 ` 2,838.38/-, 1st April, 2016 ` 4,001.59/- lakhs)
b) Amount of interest paid by the Company in terms of Section 16 of the MSMED, along with the amount of the payment made to the beyond the appointed day during the accounting period ending 31st March, 2018 – Nil (P.Y. Nil)
c) Amount of interest due and payable for the period of delay in making payment (which have been paid but beyond the appointed day during the period) but without adding the interest specified under the MSMED – Nil (P.Y. Nil)
d) Amount of interest accrued and remaining unpaid at the end of the accounting period ending 31st March, 2018 – Nil (P.Y. Nil)
37 Disclosures pursuant to Ind AS-19 “Employee Benefits”(specified under section 133 of the Companies Act, 2013, read with Rule 7 of Companies (Accounts) Rules, 2015) are given below :
a) Defined contribution plans Contribution to defined contribution plan, recognized as expenses for the period are as under :
(` in Lakhs)
ParticularsAs at
31st March 2018As at
31st March 2017
Employer's contribution to Provident Fund 263.85 251.68
Employer's contribution to ESI 44.18 33.00
Employer's contribution to Welfare Fund 2.62 2.59
Total 310.65 287.27
b) Defined benefit plans
The following tables summaries the components of net benefit expense recognised in the statement of profit or loss and the funded status and amounts recognised in the balance sheet for the respective plans:
i) Reconciliation of opening and closing balance of defined benefit obligation
(` in Lakhs)
Particulars
Gratuity (Non Funded)As at
31st March 2018As at
31st March 2017
Defined benefit obligation at beginning of the year 344.46 249.15
Current service cost 90.48 70.29 Past service cost 61.16 - Interest cost 26.70 18.69 Benefits paid (64.06) (30.88)Remeasurement of (gain)/loss recognised in other comprehensive income Actuarial changes arising from changes in demographic
assumptions - -
Actuarial changes arising from changes in financial assumptions
(19.98) 14.01
Actuarial changes arising from changes in experience adjustments
22.06 23.20
Defined benefit obligation at end of the year 460.82 344.46
HPL Electric & Power Limited
150
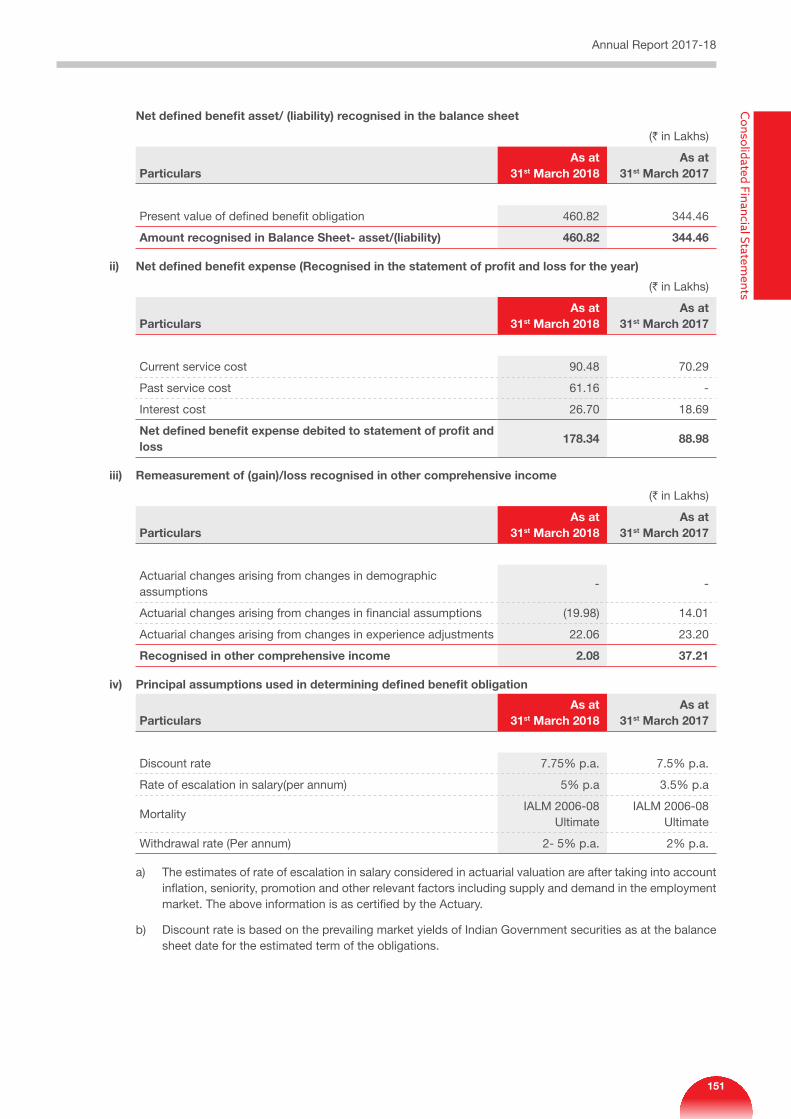
Net defined benefit asset/ (liability) recognised in the balance sheet
(` in Lakhs)
ParticularsAs at
31st March 2018As at
31st March 2017
Present value of defined benefit obligation 460.82 344.46
Amount recognised in Balance Sheet- asset/(liability) 460.82 344.46
ii) Net defined benefit expense (Recognised in the statement of profit and loss for the year)
(` in Lakhs)
ParticularsAs at
31st March 2018As at
31st March 2017
Current service cost 90.48 70.29
Past service cost 61.16 -
Interest cost 26.70 18.69
Net defined benefit expense debited to statement of profit and loss
178.34 88.98
iii) Remeasurement of (gain)/loss recognised in other comprehensive income
(` in Lakhs)
ParticularsAs at
31st March 2018As at
31st March 2017
Actuarial changes arising from changes in demographic assumptions
- -
Actuarial changes arising from changes in financial assumptions (19.98) 14.01
Actuarial changes arising from changes in experience adjustments 22.06 23.20
Recognised in other comprehensive income 2.08 37.21
iv) Principal assumptions used in determining defined benefit obligation
ParticularsAs at
31st March 2018As at
31st March 2017
Discount rate 7.75% p.a. 7.5% p.a.
Rate of escalation in salary(per annum) 5% p.a 3.5% p.a
MortalityIALM 2006-08
UltimateIALM 2006-08
Ultimate
Withdrawal rate (Per annum) 2- 5% p.a. 2% p.a.
a) The estimates of rate of escalation in salary considered in actuarial valuation are after taking into account inflation, seniority, promotion and other relevant factors including supply and demand in the employment market. The above information is as certified by the Actuary.
b) Discount rate is based on the prevailing market yields of Indian Government securities as at the balance sheet date for the estimated term of the obligations.
Annual Report 2017-18C
onsolidated Financial Statements
151
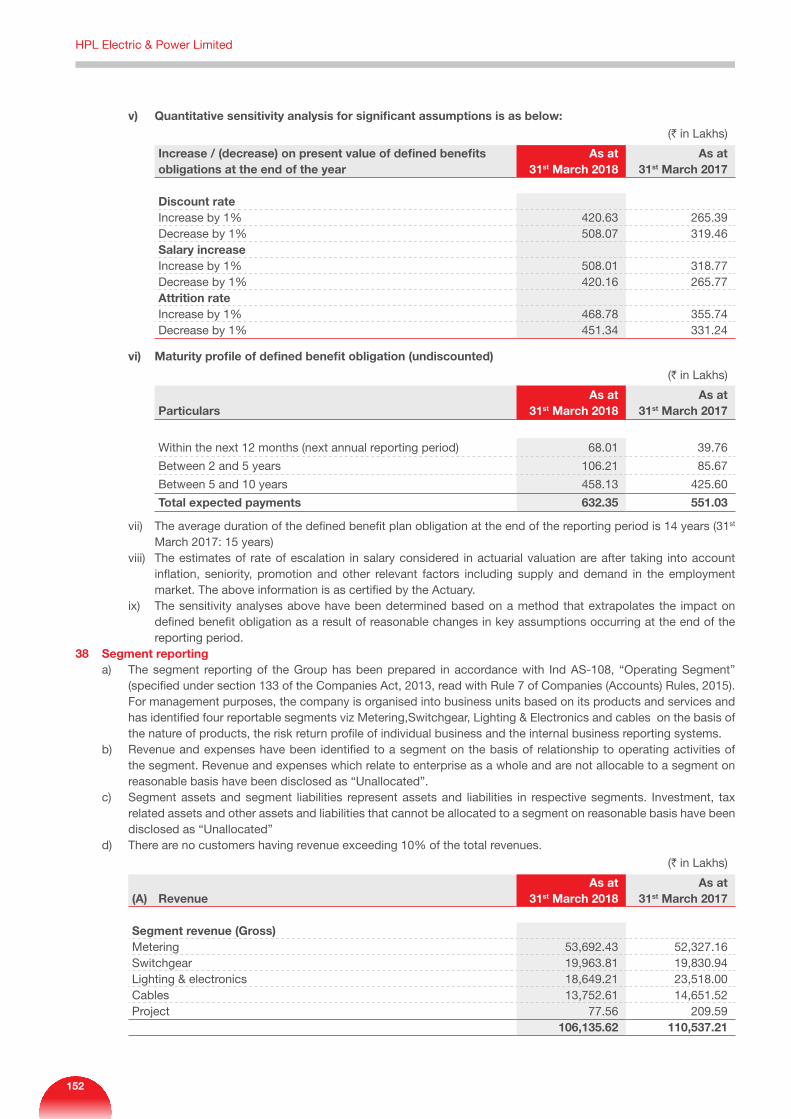
v) Quantitative sensitivity analysis for significant assumptions is as below:(` in Lakhs)
Increase / (decrease) on present value of defined benefits obligations at the end of the year
As at 31st March 2018
As at 31st March 2017
Discount rateIncrease by 1% 420.63 265.39 Decrease by 1% 508.07 319.46 Salary increaseIncrease by 1% 508.01 318.77 Decrease by 1% 420.16 265.77 Attrition rateIncrease by 1% 468.78 355.74 Decrease by 1% 451.34 331.24
vi) Maturity profile of defined benefit obligation (undiscounted)
(` in Lakhs)
ParticularsAs at
31st March 2018As at
31st March 2017
Within the next 12 months (next annual reporting period) 68.01 39.76
Between 2 and 5 years 106.21 85.67
Between 5 and 10 years 458.13 425.60
Total expected payments 632.35 551.03
vii) The average duration of the defined benefit plan obligation at the end of the reporting period is 14 years (31st March 2017: 15 years)
viii) The estimates of rate of escalation in salary considered in actuarial valuation are after taking into account inflation, seniority, promotion and other relevant factors including supply and demand in the employment market. The above information is as certified by the Actuary.
ix) The sensitivity analyses above have been determined based on a method that extrapolates the impact on defined benefit obligation as a result of reasonable changes in key assumptions occurring at the end of the reporting period.
38 Segment reporting a) The segment reporting of the Group has been prepared in accordance with Ind AS-108, “Operating Segment”
(specified under section 133 of the Companies Act, 2013, read with Rule 7 of Companies (Accounts) Rules, 2015). For management purposes, the company is organised into business units based on its products and services and has identified four reportable segments viz Metering,Switchgear, Lighting & Electronics and cables on the basis of the nature of products, the risk return profile of individual business and the internal business reporting systems.
b) Revenue and expenses have been identified to a segment on the basis of relationship to operating activities of the segment. Revenue and expenses which relate to enterprise as a whole and are not allocable to a segment on reasonable basis have been disclosed as “Unallocated”.
c) Segment assets and segment liabilities represent assets and liabilities in respective segments. Investment, tax related assets and other assets and liabilities that cannot be allocated to a segment on reasonable basis have been disclosed as “Unallocated”
d) There are no customers having revenue exceeding 10% of the total revenues.
(` in Lakhs)
(A) RevenueAs at
31st March 2018As at
31st March 2017
Segment revenue (Gross)Metering 53,692.43 52,327.16 Switchgear 19,963.81 19,830.94 Lighting & electronics 18,649.21 23,518.00 Cables 13,752.61 14,651.52 Project 77.56 209.59
106,135.62 110,537.21
HPL Electric & Power Limited
152
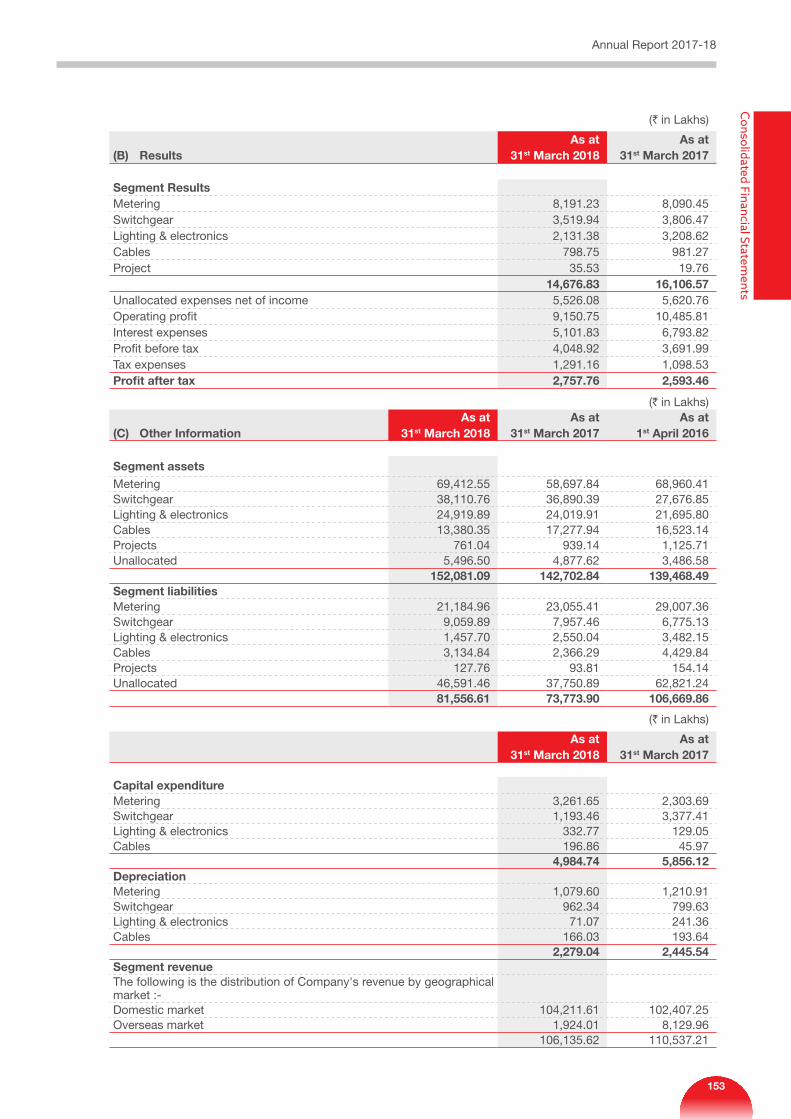
(` in Lakhs)
(B) ResultsAs at
31st March 2018As at
31st March 2017
Segment ResultsMetering 8,191.23 8,090.45 Switchgear 3,519.94 3,806.47 Lighting & electronics 2,131.38 3,208.62 Cables 798.75 981.27 Project 35.53 19.76
14,676.83 16,106.57 Unallocated expenses net of income 5,526.08 5,620.76 Operating profit 9,150.75 10,485.81 Interest expenses 5,101.83 6,793.82 Profit before tax 4,048.92 3,691.99 Tax expenses 1,291.16 1,098.53 Profit after tax 2,757.76 2,593.46
(` in Lakhs)
(C) Other InformationAs at
31st March 2018As at
31st March 2017As at
1st April 2016
Segment assets
Metering 69,412.55 58,697.84 68,960.41 Switchgear 38,110.76 36,890.39 27,676.85 Lighting & electronics 24,919.89 24,019.91 21,695.80 Cables 13,380.35 17,277.94 16,523.14 Projects 761.04 939.14 1,125.71 Unallocated 5,496.50 4,877.62 3,486.58
152,081.09 142,702.84 139,468.49 Segment liabilitiesMetering 21,184.96 23,055.41 29,007.36 Switchgear 9,059.89 7,957.46 6,775.13 Lighting & electronics 1,457.70 2,550.04 3,482.15 Cables 3,134.84 2,366.29 4,429.84 Projects 127.76 93.81 154.14 Unallocated 46,591.46 37,750.89 62,821.24
81,556.61 73,773.90 106,669.86
(` in Lakhs)
As at 31st March 2018
As at 31st March 2017
Capital expenditure Metering 3,261.65 2,303.69 Switchgear 1,193.46 3,377.41 Lighting & electronics 332.77 129.05 Cables 196.86 45.97
4,984.74 5,856.12 DepreciationMetering 1,079.60 1,210.91 Switchgear 962.34 799.63 Lighting & electronics 71.07 241.36 Cables 166.03 193.64
2,279.04 2,445.54 Segment revenueThe following is the distribution of Company's revenue by geographical market :-Domestic market 104,211.61 102,407.25 Overseas market 1,924.01 8,129.96
106,135.62 110,537.21
Annual Report 2017-18C
onsolidated Financial Statements
153
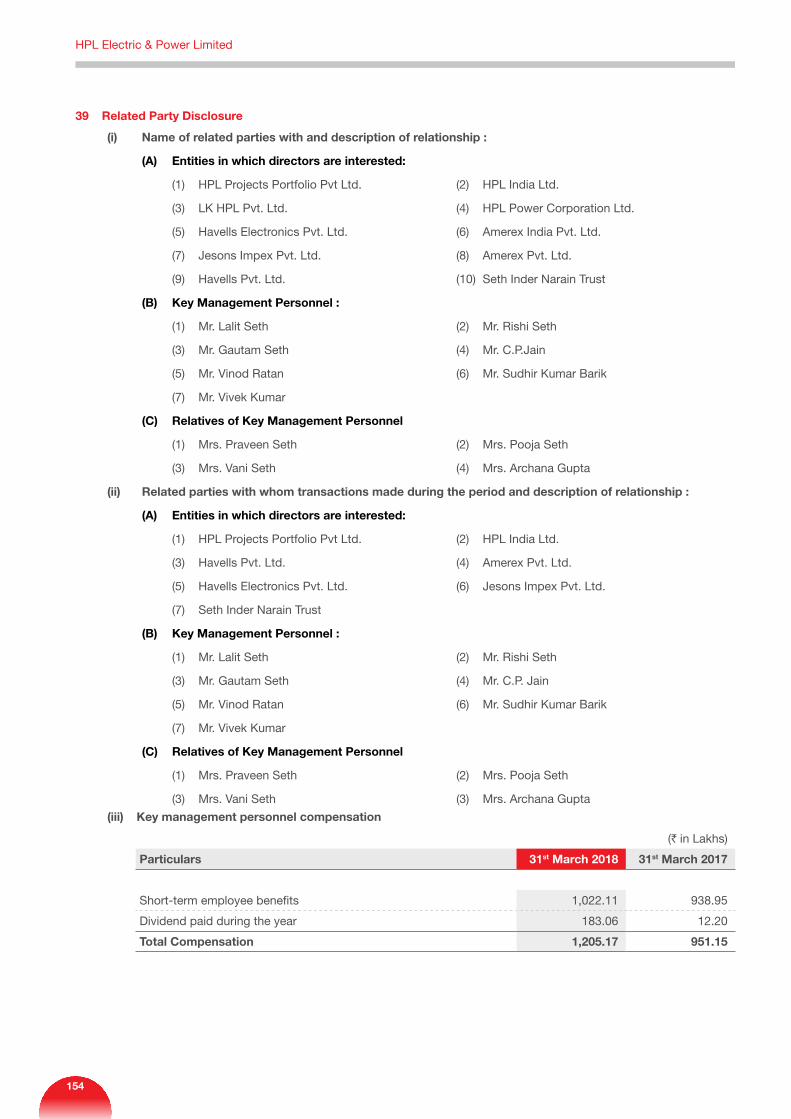
39 Related Party Disclosure
(i) Name of related parties with and description of relationship :
(A) Entities in which directors are interested:
(1) HPL Projects Portfolio Pvt Ltd. (2) HPL India Ltd.
(3) LK HPL Pvt. Ltd. (4) HPL Power Corporation Ltd.
(5) Havells Electronics Pvt. Ltd. (6) Amerex India Pvt. Ltd.
(7) Jesons Impex Pvt. Ltd. (8) Amerex Pvt. Ltd.
(9) Havells Pvt. Ltd. (10) Seth Inder Narain Trust
(B) Key Management Personnel :
(1) Mr. Lalit Seth (2) Mr. Rishi Seth
(3) Mr. Gautam Seth (4) Mr. C.P.Jain
(5) Mr. Vinod Ratan (6) Mr. Sudhir Kumar Barik
(7) Mr. Vivek Kumar
(C) Relatives of Key Management Personnel
(1) Mrs. Praveen Seth (2) Mrs. Pooja Seth
(3) Mrs. Vani Seth (4) Mrs. Archana Gupta
(ii) Related parties with whom transactions made during the period and description of relationship :
(A) Entities in which directors are interested:
(1) HPL Projects Portfolio Pvt Ltd. (2) HPL India Ltd.
(3) Havells Pvt. Ltd. (4) Amerex Pvt. Ltd.
(5) Havells Electronics Pvt. Ltd. (6) Jesons Impex Pvt. Ltd.
(7) Seth Inder Narain Trust
(B) Key Management Personnel :
(1) Mr. Lalit Seth (2) Mr. Rishi Seth
(3) Mr. Gautam Seth (4) Mr. C.P. Jain
(5) Mr. Vinod Ratan (6) Mr. Sudhir Kumar Barik
(7) Mr. Vivek Kumar
(C) Relatives of Key Management Personnel
(1) Mrs. Praveen Seth (2) Mrs. Pooja Seth
(3) Mrs. Vani Seth (3) Mrs. Archana Gupta
(iii) Key management personnel compensation
(` in Lakhs)
Particulars 31st March 2018 31st March 2017
Short-term employee benefits 1,022.11 938.95
Dividend paid during the year 183.06 12.20
Total Compensation 1,205.17 951.15
HPL Electric & Power Limited
154
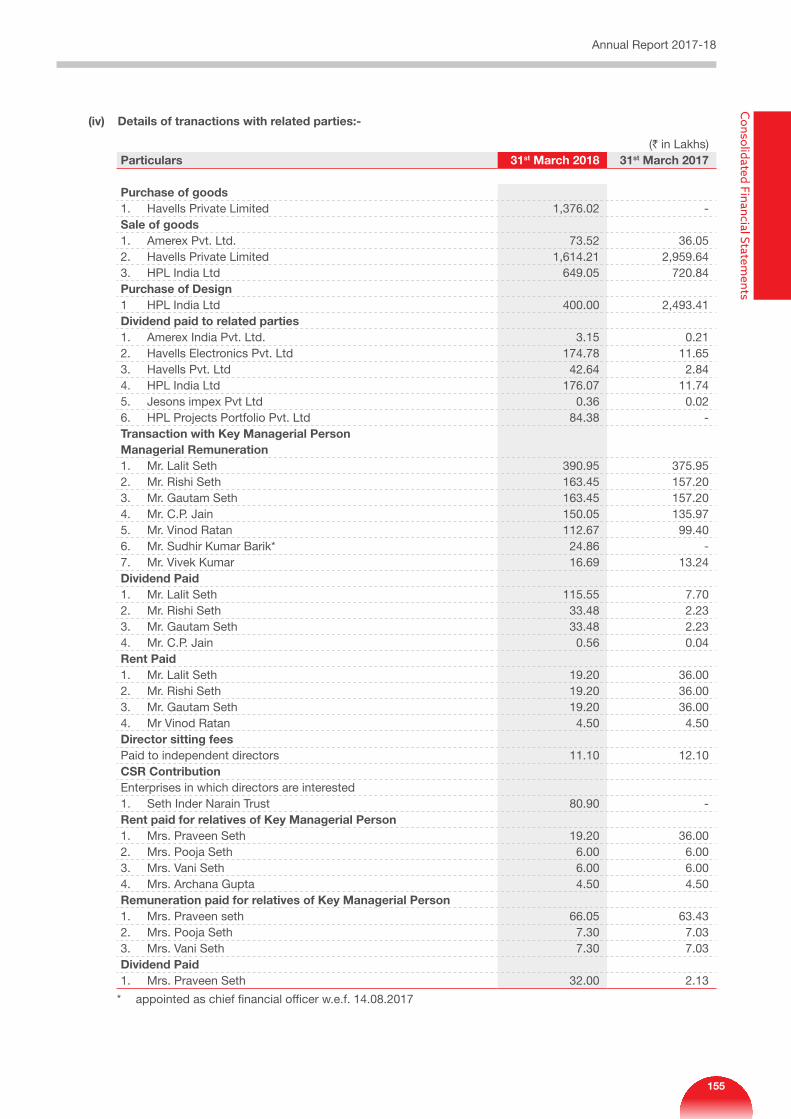
(iv) Details of tranactions with related parties:-
(` in Lakhs)Particulars 31st March 2018 31st March 2017
Purchase of goods 1. Havells Private Limited 1,376.02 - Sale of goods1. Amerex Pvt. Ltd. 73.52 36.05 2. Havells Private Limited 1,614.21 2,959.64 3. HPL India Ltd 649.05 720.84 Purchase of Design1 HPL India Ltd 400.00 2,493.41 Dividend paid to related parties1. Amerex India Pvt. Ltd. 3.15 0.21 2. Havells Electronics Pvt. Ltd 174.78 11.65 3. Havells Pvt. Ltd 42.64 2.84 4. HPL India Ltd 176.07 11.74 5. Jesons impex Pvt Ltd 0.36 0.02 6. HPL Projects Portfolio Pvt. Ltd 84.38 - Transaction with Key Managerial PersonManagerial Remuneration1. Mr. Lalit Seth 390.95 375.95 2. Mr. Rishi Seth 163.45 157.20 3. Mr. Gautam Seth 163.45 157.20 4. Mr. C.P. Jain 150.05 135.97 5. Mr. Vinod Ratan 112.67 99.40 6. Mr. Sudhir Kumar Barik* 24.86 - 7. Mr. Vivek Kumar 16.69 13.24 Dividend Paid1. Mr. Lalit Seth 115.55 7.70 2. Mr. Rishi Seth 33.48 2.23 3. Mr. Gautam Seth 33.48 2.23 4. Mr. C.P. Jain 0.56 0.04 Rent Paid1. Mr. Lalit Seth 19.20 36.00 2. Mr. Rishi Seth 19.20 36.00 3. Mr. Gautam Seth 19.20 36.00 4. Mr Vinod Ratan 4.50 4.50 Director sitting feesPaid to independent directors 11.10 12.10 CSR ContributionEnterprises in which directors are interested1. Seth Inder Narain Trust 80.90 - Rent paid for relatives of Key Managerial Person1. Mrs. Praveen Seth 19.20 36.00 2. Mrs. Pooja Seth 6.00 6.00 3. Mrs. Vani Seth 6.00 6.00 4. Mrs. Archana Gupta 4.50 4.50 Remuneration paid for relatives of Key Managerial Person1. Mrs. Praveen seth 66.05 63.43 2. Mrs. Pooja Seth 7.30 7.03 3. Mrs. Vani Seth 7.30 7.03 Dividend Paid1. Mrs. Praveen Seth 32.00 2.13
* appointed as chief financial officer w.e.f. 14.08.2017
Annual Report 2017-18C
onsolidated Financial Statements
155
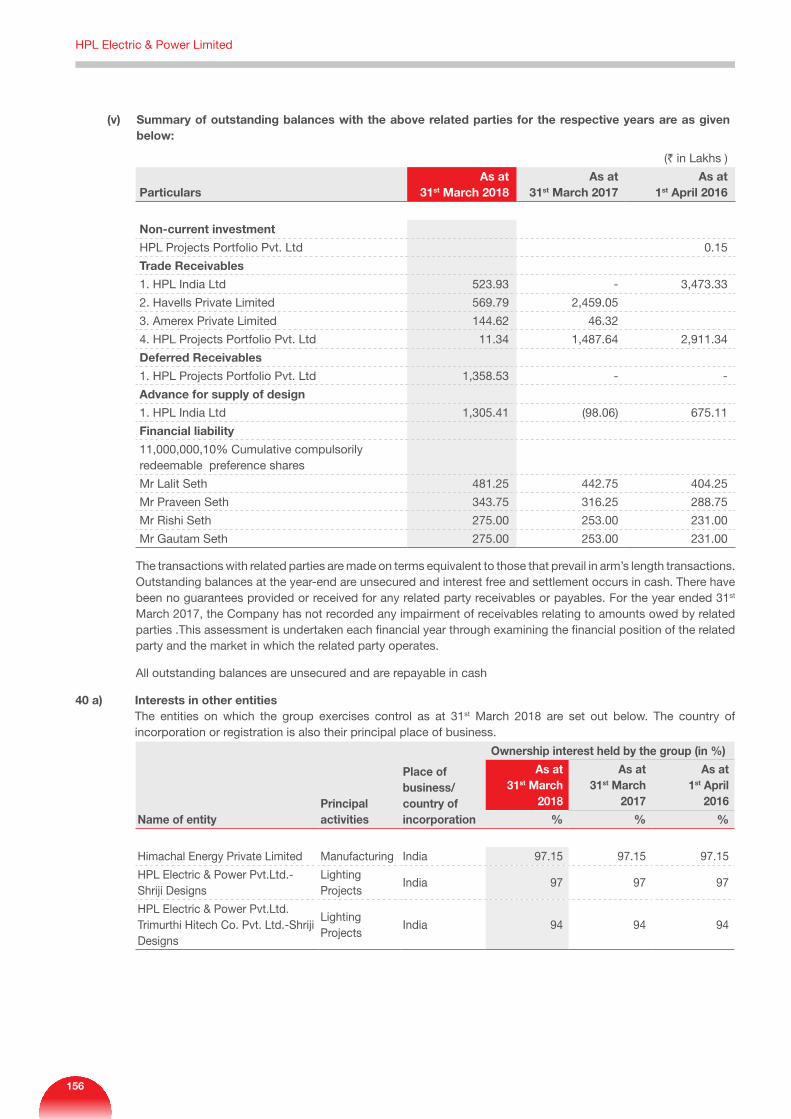
(v) Summary of outstanding balances with the above related parties for the respective years are as given below:
(` in Lakhs )
ParticularsAs at
31st March 2018As at
31st March 2017As at
1st April 2016
Non-current investment
HPL Projects Portfolio Pvt. Ltd 0.15
Trade Receivables
1. HPL India Ltd 523.93 - 3,473.33
2. Havells Private Limited 569.79 2,459.05
3. Amerex Private Limited 144.62 46.32
4. HPL Projects Portfolio Pvt. Ltd 11.34 1,487.64 2,911.34
Deferred Receivables
1. HPL Projects Portfolio Pvt. Ltd 1,358.53 - -
Advance for supply of design
1. HPL India Ltd 1,305.41 (98.06) 675.11
Financial liability
11,000,000,10% Cumulative compulsorily redeemable preference shares
Mr Lalit Seth 481.25 442.75 404.25
Mr Praveen Seth 343.75 316.25 288.75
Mr Rishi Seth 275.00 253.00 231.00
Mr Gautam Seth 275.00 253.00 231.00
The transactions with related parties are made on terms equivalent to those that prevail in arm’s length transactions. Outstanding balances at the year-end are unsecured and interest free and settlement occurs in cash. There have been no guarantees provided or received for any related party receivables or payables. For the year ended 31st March 2017, the Company has not recorded any impairment of receivables relating to amounts owed by related parties .This assessment is undertaken each financial year through examining the financial position of the related party and the market in which the related party operates.
All outstanding balances are unsecured and are repayable in cash
40 a) Interests in other entities The entities on which the group exercises control as at 31st March 2018 are set out below. The country of
incorporation or registration is also their principal place of business.
Name of entityPrincipal activities
Place of business/ country of incorporation
Ownership interest held by the group (in %)
As at 31st March
2018
As at 31st March
2017
As at 1st April
2016
% % %
Himachal Energy Private Limited Manufacturing India 97.15 97.15 97.15
HPL Electric & Power Pvt.Ltd.-Shriji Designs
Lighting Projects
India 97 97 97
HPL Electric & Power Pvt.Ltd. Trimurthi Hitech Co. Pvt. Ltd.-Shriji Designs
Lighting Projects
India 94 94 94
HPL Electric & Power Limited
156
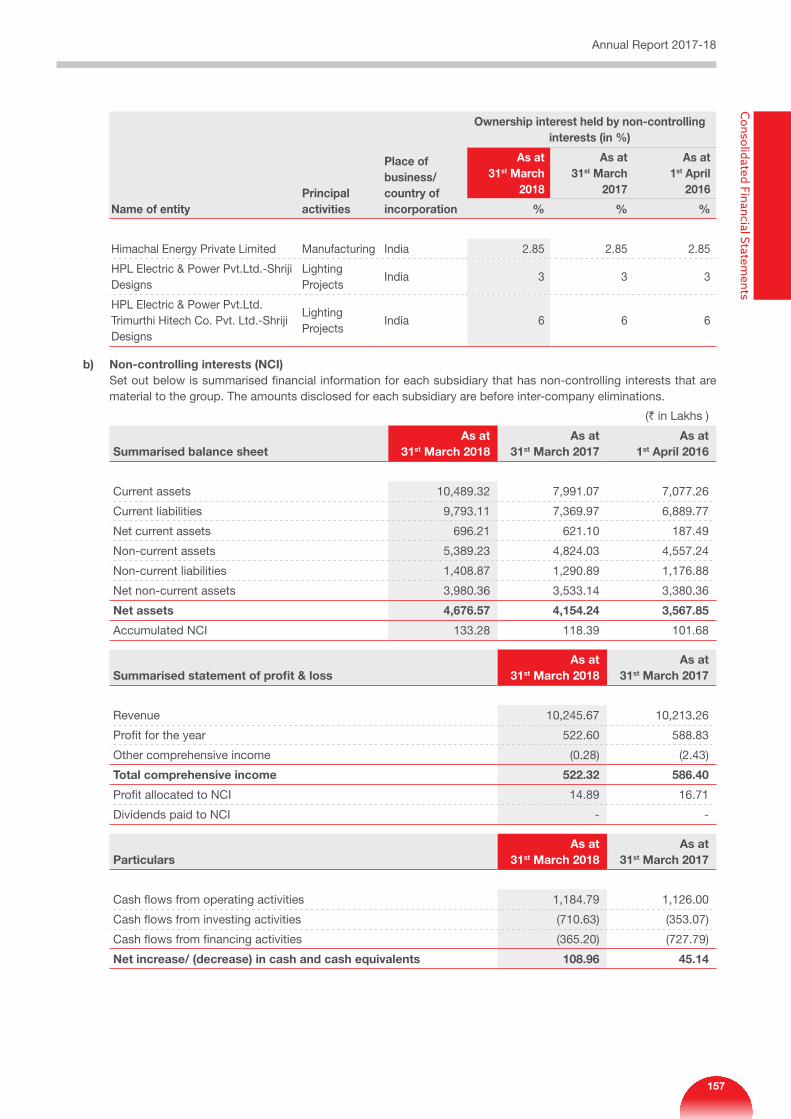
Name of entityPrincipal activities
Place of business/ country of incorporation
Ownership interest held by non-controlling interests (in %)
As at 31st March
2018
As at 31st March
2017
As at 1st April
2016
% % %
Himachal Energy Private Limited Manufacturing India 2.85 2.85 2.85
HPL Electric & Power Pvt.Ltd.-Shriji Designs
Lighting Projects
India 3 3 3
HPL Electric & Power Pvt.Ltd. Trimurthi Hitech Co. Pvt. Ltd.-Shriji Designs
Lighting Projects
India 6 6 6
b) Non-controlling interests (NCI) Set out below is summarised financial information for each subsidiary that has non-controlling interests that are
material to the group. The amounts disclosed for each subsidiary are before inter-company eliminations.
(` in Lakhs )
Summarised balance sheetAs at
31st March 2018As at
31st March 2017As at
1st April 2016
Current assets 10,489.32 7,991.07 7,077.26
Current liabilities 9,793.11 7,369.97 6,889.77
Net current assets 696.21 621.10 187.49
Non-current assets 5,389.23 4,824.03 4,557.24
Non-current liabilities 1,408.87 1,290.89 1,176.88
Net non-current assets 3,980.36 3,533.14 3,380.36
Net assets 4,676.57 4,154.24 3,567.85
Accumulated NCI 133.28 118.39 101.68
Summarised statement of profit & loss As at
31st March 2018As at
31st March 2017
Revenue 10,245.67 10,213.26
Profit for the year 522.60 588.83
Other comprehensive income (0.28) (2.43)
Total comprehensive income 522.32 586.40
Profit allocated to NCI 14.89 16.71
Dividends paid to NCI - -
ParticularsAs at
31st March 2018As at
31st March 2017
Cash flows from operating activities 1,184.79 1,126.00
Cash flows from investing activities (710.63) (353.07)
Cash flows from financing activities (365.20) (727.79)
Net increase/ (decrease) in cash and cash equivalents 108.96 45.14
Annual Report 2017-18C
onsolidated Financial Statements
157
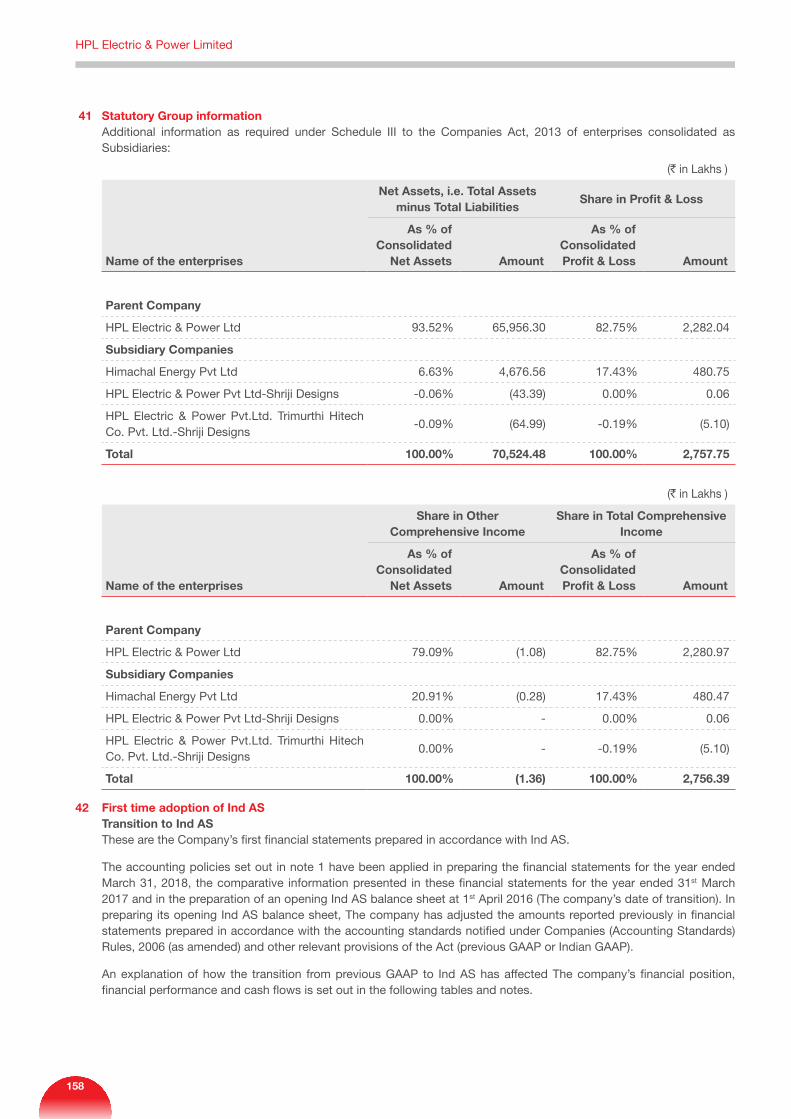
41 Statutory Group information Additional information as required under Schedule III to the Companies Act, 2013 of enterprises consolidated as
Subsidiaries:
(` in Lakhs )
Name of the enterprises
Net Assets, i.e. Total Assets minus Total Liabilities
Share in Profit & Loss
As % of Consolidated
Net Assets Amount
As % of Consolidated Profit & Loss Amount
Parent Company
HPL Electric & Power Ltd 93.52% 65,956.30 82.75% 2,282.04
Subsidiary Companies
Himachal Energy Pvt Ltd 6.63% 4,676.56 17.43% 480.75
HPL Electric & Power Pvt Ltd-Shriji Designs -0.06% (43.39) 0.00% 0.06
HPL Electric & Power Pvt.Ltd. Trimurthi Hitech Co. Pvt. Ltd.-Shriji Designs
-0.09% (64.99) -0.19% (5.10)
Total 100.00% 70,524.48 100.00% 2,757.75
(` in Lakhs )
Name of the enterprises
Share in Other Comprehensive Income
Share in Total Comprehensive Income
As % of Consolidated
Net Assets Amount
As % of Consolidated Profit & Loss Amount
Parent Company
HPL Electric & Power Ltd 79.09% (1.08) 82.75% 2,280.97
Subsidiary Companies
Himachal Energy Pvt Ltd 20.91% (0.28) 17.43% 480.47
HPL Electric & Power Pvt Ltd-Shriji Designs 0.00% - 0.00% 0.06
HPL Electric & Power Pvt.Ltd. Trimurthi Hitech Co. Pvt. Ltd.-Shriji Designs
0.00% - -0.19% (5.10)
Total 100.00% (1.36) 100.00% 2,756.39
42 First time adoption of Ind ASTransition to Ind ASThese are the Company’s first financial statements prepared in accordance with Ind AS.
The accounting policies set out in note 1 have been applied in preparing the financial statements for the year ended March 31, 2018, the comparative information presented in these financial statements for the year ended 31st March 2017 and in the preparation of an opening Ind AS balance sheet at 1st April 2016 (The company’s date of transition). In preparing its opening Ind AS balance sheet, The company has adjusted the amounts reported previously in financial statements prepared in accordance with the accounting standards notified under Companies (Accounting Standards) Rules, 2006 (as amended) and other relevant provisions of the Act (previous GAAP or Indian GAAP).
An explanation of how the transition from previous GAAP to Ind AS has affected The company’s financial position, financial performance and cash flows is set out in the following tables and notes.
HPL Electric & Power Limited
158
42(a) Exemptions and exceptions availed Set out below are the applicable Ind AS 101 optional exemptions and mandatory exceptions applied in the
transition from previous GAAP to Ind AS.
A.1 Ind AS optional exemptions A.1.1 Deemed cost Ind AS 101 permits a first time adopter to elect to fair value of its property, plant and equipment as recognised in financial
statements as at the date of transition to Ind AS, measured as per previous GAAP and use that as its deemed cost as at the date of transition or apply principles of Ind AS retrospectively. Ind AS 101 also permits the first time adopter to elect to continue with the carrying value for all of its property, plant and equipment as recognised in the financial statements as at the date of transition to Ind AS. This exemption can be also used for intangible assets covered by Ind-AS 38.
The Company has elected to consider fair value of its property, plant and equipment as its deemed cost on the date of transition to Ind AS.
A.1.2 Investments in subsidiaries, associates and joint ventures Ind AS 101 permits the first time adopter to measure investment in subsidiaries, joint ventures and associates in
accordance with Ind AS 27 at one of the following:
a) Cost determined in accordance with Ind AS 27 or b) Deemed cost: (i) fair value at date of transition (ii) previous GAAP carrying amount at that date.
The Company has elected to consider previous GAAP carrying amount of its investments in subsidiaries, Joint ventures and associates on the date of transition to Ind AS as its deemed cost for the purpose of determining cost in accordance with principles of IND AS 27- “Separate financial statements.
A.2 Ind AS mandatory exceptions A.2.1 Estimates An entity’s estimates in accordance with Ind AS at the date of transition to Ind AS shall be consistent with estimates
made for the same date in accordance with previous GAAP (after adjustments to reflect any difference in accounting policies), unless there is objective evidence that those estimates were in error. Ind AS estimates as at 1st April 2016 are consistent with the estimates as at the same date made in conformity with previous GAAP. The company made estimates for ‘Impairment of financial assets based on expected credit loss model’ in accordance with Ind AS at the date of transition as these were not required under previous GAAP.
A.2.2 De-recognition of financial assets and liabilities Ind AS 101 requires a first-time adopter to apply the de-recognition provisions of Ind AS 109 prospectively for transactions
occurring on or after the date of transition to Ind AS. However, Ind AS 101 allows a first-time adopter to apply the de-recognition requirements in Ind AS 109 retrospectively from a date of the entity’s choosing, provided that the information needed to apply Ind AS 109 to financial assets and financial liabilities derecognised as a result of past transactions was obtained at the time of initially accounting for those transactions. The Company has elected to apply the de-recognition provisions of Ind AS 109 prospectively from the date of transition to Ind AS.
A.2.3 Classification and measurement of financial assets Ind AS 101 requires an entity to assess classification and measurement of financial assets on the basis of facts and
circumstances that exist on the date of transition to Ind AS. Accordingly, the Company has applied the above requirement prospectively.
A.2.4 Impairment of financial assets Ind AS 101 requires an entity to assess and determine the impairment allowance on financial assets as per Ind AS 109 using
the reasonable and supportable information that is available without undue cost or effort to determine the credit risk at the date that financial instruments which were initially recognised and compare that to the credit risk at the date of transition to Ind AS. The Company has applied this exception prospectively.
42(b) Reconciliation between previous GAAP and Ind AS Ind AS 101 requires an entity to reconcile equity, total comprehensive income and cash flows for prior periods.
Annual Report 2017-18C
onsolidated Financial Statements
159
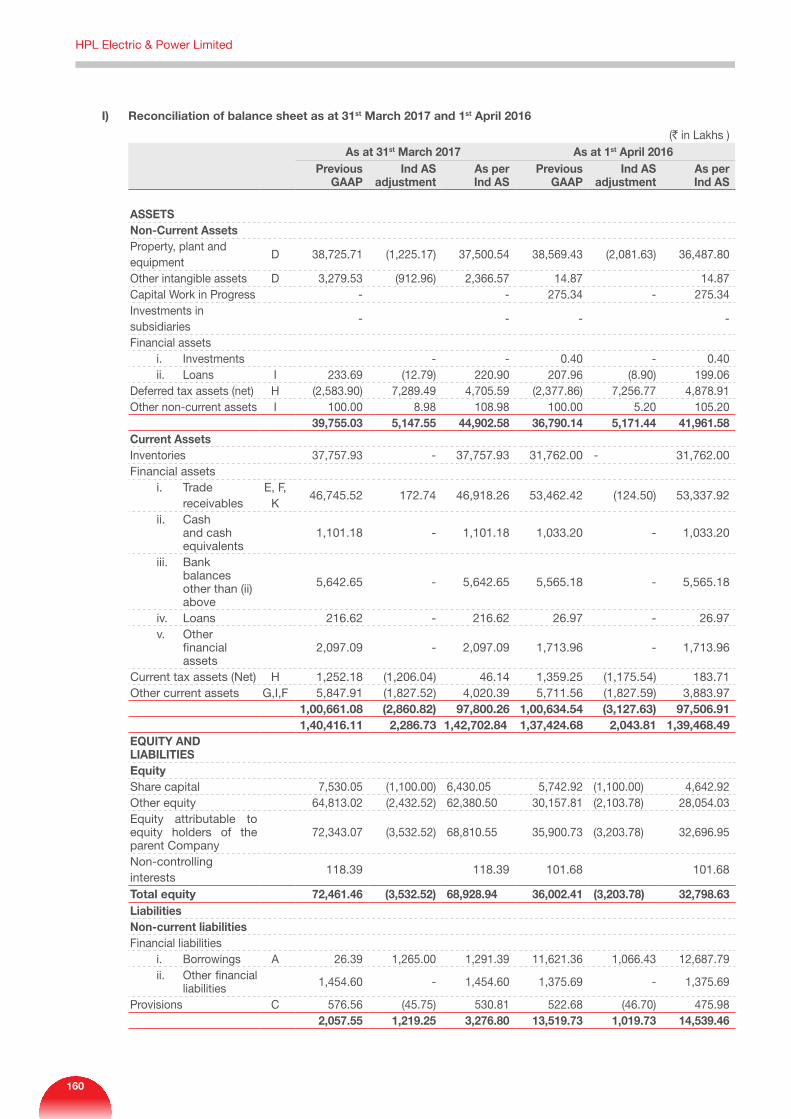
I) Reconciliation of balance sheet as at 31st March 2017 and 1st April 2016
(` in Lakhs )As at 31st March 2017 As at 1st April 2016
Previous GAAP
Ind AS adjustment
As per Ind AS
Previous GAAP
Ind AS adjustment
As per Ind AS
ASSETS Non-Current Assets Property, plant and equipment
D 38,725.71 (1,225.17) 37,500.54 38,569.43 (2,081.63) 36,487.80
Other intangible assets D 3,279.53 (912.96) 2,366.57 14.87 14.87 Capital Work in Progress - - 275.34 - 275.34 Investments in subsidiaries
- - - -
Financial assets i. Investments - - 0.40 - 0.40 ii. Loans I 233.69 (12.79) 220.90 207.96 (8.90) 199.06 Deferred tax assets (net) H (2,583.90) 7,289.49 4,705.59 (2,377.86) 7,256.77 4,878.91 Other non-current assets I 100.00 8.98 108.98 100.00 5.20 105.20
39,755.03 5,147.55 44,902.58 36,790.14 5,171.44 41,961.58 Current Assets Inventories 37,757.93 - 37,757.93 31,762.00 - 31,762.00 Financial assets i. Trade
receivables E, F,
K 46,745.52 172.74 46,918.26 53,462.42 (124.50) 53,337.92
ii. Cash and cash equivalents
1,101.18 - 1,101.18 1,033.20 - 1,033.20
iii. Bank balances other than (ii) above
5,642.65 - 5,642.65 5,565.18 - 5,565.18
iv. Loans 216.62 - 216.62 26.97 - 26.97 v. Other
financial assets
2,097.09 - 2,097.09 1,713.96 - 1,713.96
Current tax assets (Net) H 1,252.18 (1,206.04) 46.14 1,359.25 (1,175.54) 183.71 Other current assets G,I,F 5,847.91 (1,827.52) 4,020.39 5,711.56 (1,827.59) 3,883.97
1,00,661.08 (2,860.82) 97,800.26 1,00,634.54 (3,127.63) 97,506.91 1,40,416.11 2,286.73 1,42,702.84 1,37,424.68 2,043.81 1,39,468.49
EQUITY AND LIABILITIES Equity Share capital 7,530.05 (1,100.00) 6,430.05 5,742.92 (1,100.00) 4,642.92 Other equity 64,813.02 (2,432.52) 62,380.50 30,157.81 (2,103.78) 28,054.03 Equity attributable to equity holders of the parent Company
72,343.07 (3,532.52) 68,810.55 35,900.73 (3,203.78) 32,696.95
Non-controlling interests
118.39 118.39 101.68 101.68
Total equity 72,461.46 (3,532.52) 68,928.94 36,002.41 (3,203.78) 32,798.63 Liabilities Non-current liabilities Financial liabilities i. Borrowings A 26.39 1,265.00 1,291.39 11,621.36 1,066.43 12,687.79 ii. Other financial
liabilities 1,454.60 - 1,454.60 1,375.69 - 1,375.69
Provisions C 576.56 (45.75) 530.81 522.68 (46.70) 475.98 2,057.55 1,219.25 3,276.80 13,519.73 1,019.73 14,539.46
HPL Electric & Power Limited
160
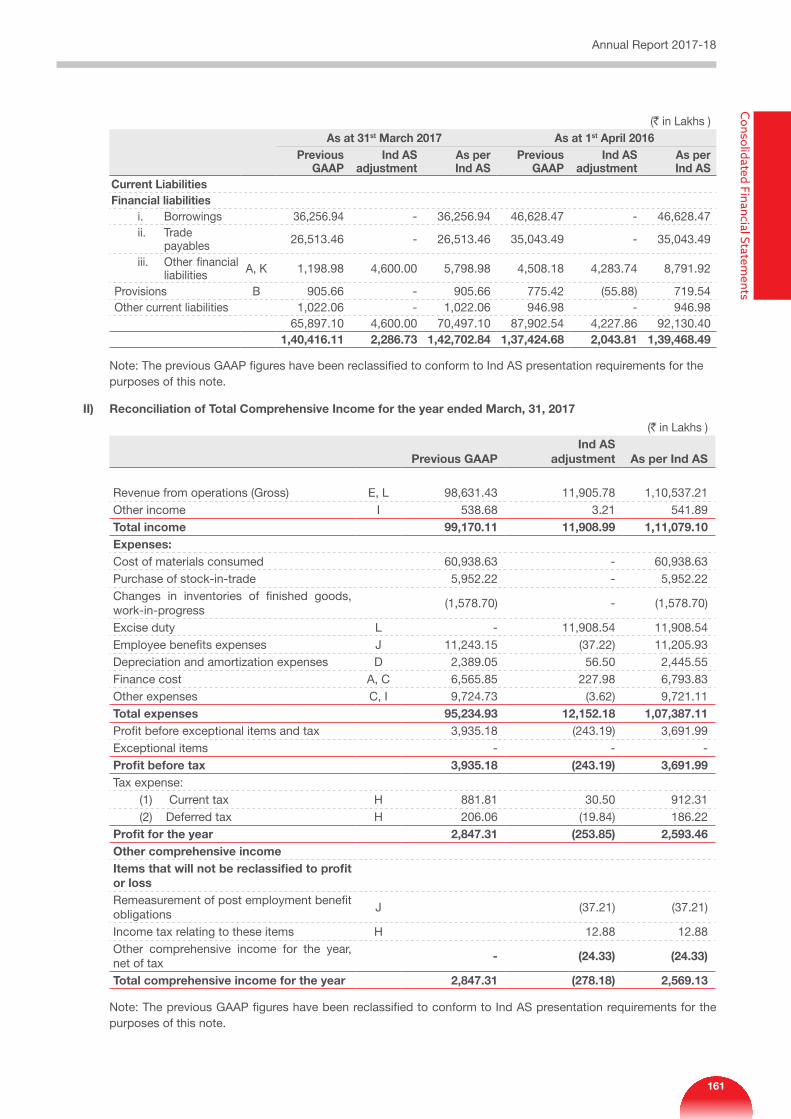
(` in Lakhs )As at 31st March 2017 As at 1st April 2016
Previous GAAP
Ind AS adjustment
As per Ind AS
Previous GAAP
Ind AS adjustment
As per Ind AS
Current Liabilities Financial liabilities i. Borrowings 36,256.94 - 36,256.94 46,628.47 - 46,628.47 ii. Trade
payables 26,513.46 - 26,513.46 35,043.49 - 35,043.49
iii. Other financial liabilities A, K 1,198.98 4,600.00 5,798.98 4,508.18 4,283.74 8,791.92
Provisions B 905.66 - 905.66 775.42 (55.88) 719.54 Other current liabilities 1,022.06 - 1,022.06 946.98 - 946.98
65,897.10 4,600.00 70,497.10 87,902.54 4,227.86 92,130.40 1,40,416.11 2,286.73 1,42,702.84 1,37,424.68 2,043.81 1,39,468.49
Note: The previous GAAP figures have been reclassified to conform to Ind AS presentation requirements for the purposes of this note.
II) Reconciliation of Total Comprehensive Income for the year ended March, 31, 2017
(` in Lakhs )
Previous GAAP Ind AS
adjustment As per Ind AS
Revenue from operations (Gross) E, L 98,631.43 11,905.78 1,10,537.21 Other income I 538.68 3.21 541.89 Total income 99,170.11 11,908.99 1,11,079.10 Expenses:Cost of materials consumed 60,938.63 - 60,938.63 Purchase of stock-in-trade 5,952.22 - 5,952.22 Changes in inventories of finished goods, work-in-progress
(1,578.70) - (1,578.70)
Excise duty L - 11,908.54 11,908.54 Employee benefits expenses J 11,243.15 (37.22) 11,205.93 Depreciation and amortization expenses D 2,389.05 56.50 2,445.55 Finance cost A, C 6,565.85 227.98 6,793.83 Other expenses C, I 9,724.73 (3.62) 9,721.11 Total expenses 95,234.93 12,152.18 1,07,387.11 Profit before exceptional items and tax 3,935.18 (243.19) 3,691.99 Exceptional items - - - Profit before tax 3,935.18 (243.19) 3,691.99 Tax expense: (1) Current tax H 881.81 30.50 912.31 (2) Deferred tax H 206.06 (19.84) 186.22 Profit for the year 2,847.31 (253.85) 2,593.46 Other comprehensive incomeItems that will not be reclassified to profit or lossRemeasurement of post employment benefit obligations
J (37.21) (37.21)
Income tax relating to these items H 12.88 12.88 Other comprehensive income for the year, net of tax
- (24.33) (24.33)
Total comprehensive income for the year 2,847.31 (278.18) 2,569.13
Note: The previous GAAP figures have been reclassified to conform to Ind AS presentation requirements for the purposes of this note.
Annual Report 2017-18C
onsolidated Financial Statements
161
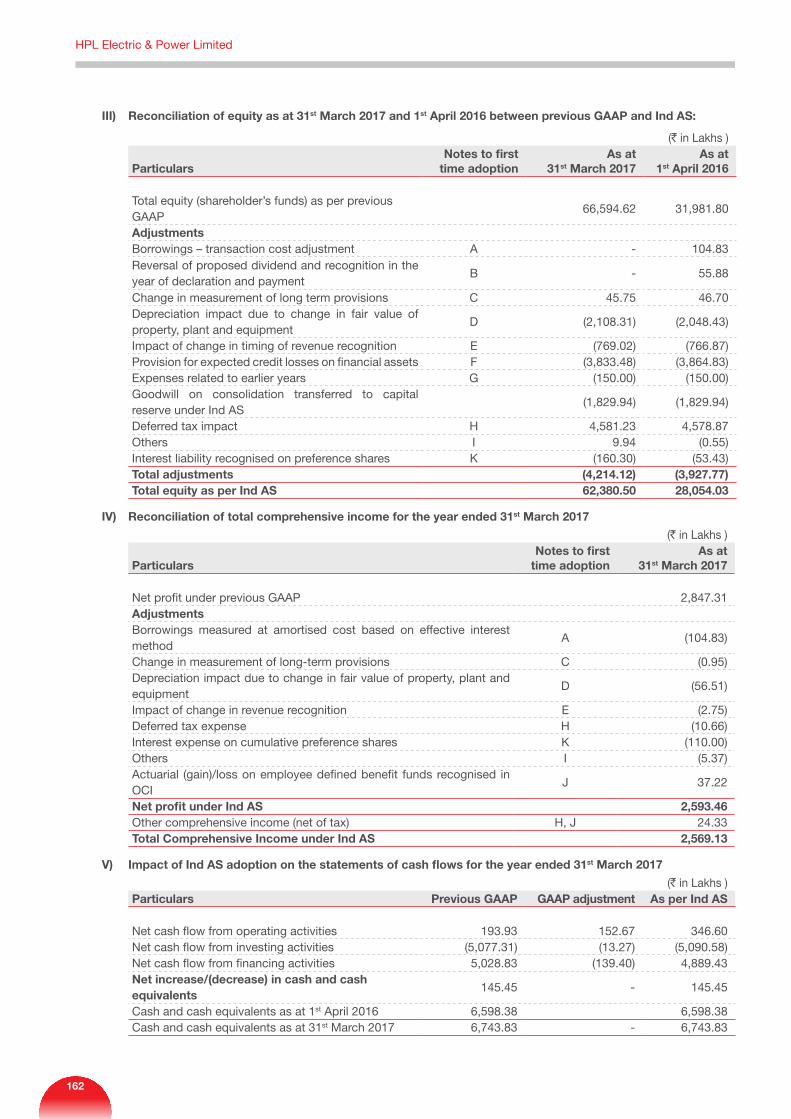
III) Reconciliation of equity as at 31st March 2017 and 1st April 2016 between previous GAAP and Ind AS:
(` in Lakhs )
ParticularsNotes to first
time adoptionAs at
31st March 2017As at
1st April 2016
Total equity (shareholder’s funds) as per previous GAAP
66,594.62 31,981.80
Adjustments Borrowings – transaction cost adjustment A - 104.83 Reversal of proposed dividend and recognition in the year of declaration and payment
B - 55.88
Change in measurement of long term provisions C 45.75 46.70 Depreciation impact due to change in fair value of property, plant and equipment
D (2,108.31) (2,048.43)
Impact of change in timing of revenue recognition E (769.02) (766.87)Provision for expected credit losses on financial assets F (3,833.48) (3,864.83)Expenses related to earlier years G (150.00) (150.00)Goodwill on consolidation transferred to capital reserve under Ind AS
(1,829.94) (1,829.94)
Deferred tax impact H 4,581.23 4,578.87 Others I 9.94 (0.55)Interest liability recognised on preference shares K (160.30) (53.43)Total adjustments (4,214.12) (3,927.77)Total equity as per Ind AS 62,380.50 28,054.03
IV) Reconciliation of total comprehensive income for the year ended 31st March 2017
(` in Lakhs )
ParticularsNotes to first
time adoptionAs at
31st March 2017
Net profit under previous GAAP 2,847.31 AdjustmentsBorrowings measured at amortised cost based on effective interest method
A (104.83)
Change in measurement of long-term provisions C (0.95)Depreciation impact due to change in fair value of property, plant and equipment
D (56.51)
Impact of change in revenue recognition E (2.75)Deferred tax expense H (10.66)Interest expense on cumulative preference shares K (110.00)Others I (5.37)Actuarial (gain)/loss on employee defined benefit funds recognised in OCI
J 37.22
Net profit under Ind AS 2,593.46 Other comprehensive income (net of tax) H, J 24.33 Total Comprehensive Income under Ind AS 2,569.13
V) Impact of Ind AS adoption on the statements of cash flows for the year ended 31st March 2017
(` in Lakhs )Particulars Previous GAAP GAAP adjustment As per Ind AS
Net cash flow from operating activities 193.93 152.67 346.60 Net cash flow from investing activities (5,077.31) (13.27) (5,090.58)Net cash flow from financing activities 5,028.83 (139.40) 4,889.43 Net increase/(decrease) in cash and cash equivalents
145.45 - 145.45
Cash and cash equivalents as at 1st April 2016 6,598.38 6,598.38 Cash and cash equivalents as at 31st March 2017 6,743.83 - 6,743.83
HPL Electric & Power Limited
162
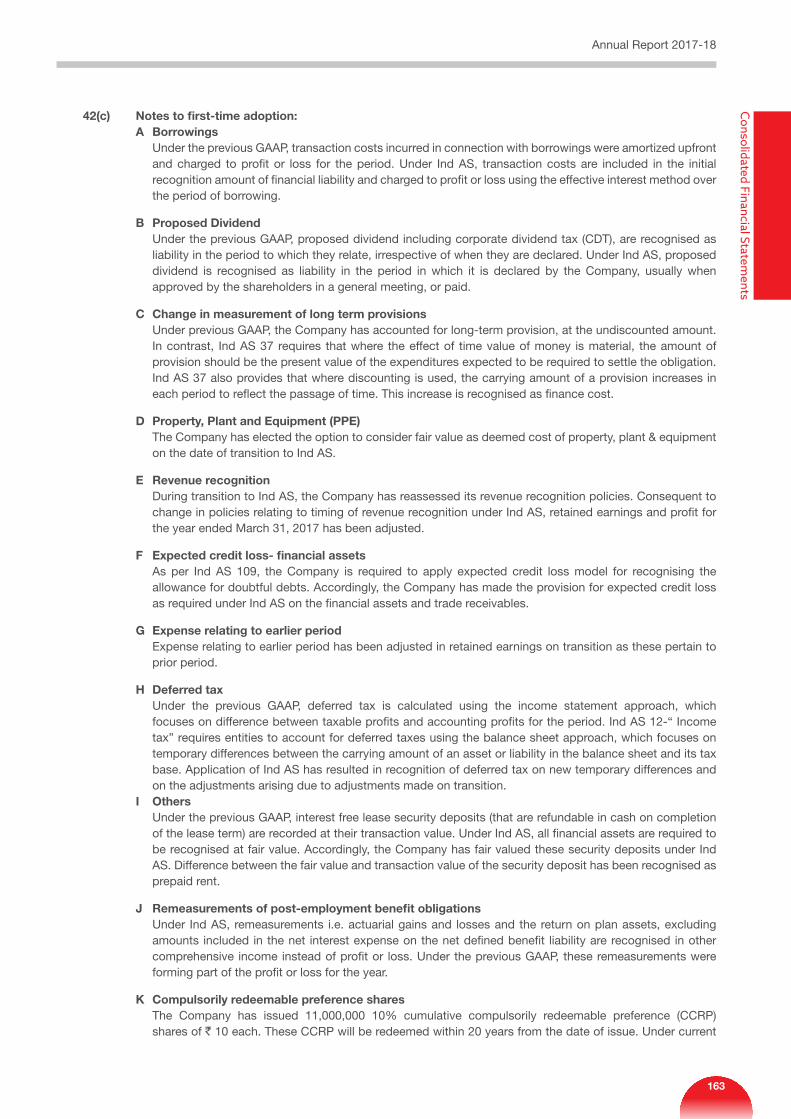
42(c) Notes to first-time adoption: A Borrowings Under the previous GAAP, transaction costs incurred in connection with borrowings were amortized upfront
and charged to profit or loss for the period. Under Ind AS, transaction costs are included in the initial recognition amount of financial liability and charged to profit or loss using the effective interest method over the period of borrowing.
B Proposed Dividend Under the previous GAAP, proposed dividend including corporate dividend tax (CDT), are recognised as
liability in the period to which they relate, irrespective of when they are declared. Under Ind AS, proposed dividend is recognised as liability in the period in which it is declared by the Company, usually when approved by the shareholders in a general meeting, or paid.
C Change in measurement of long term provisions Under previous GAAP, the Company has accounted for long-term provision, at the undiscounted amount.
In contrast, Ind AS 37 requires that where the effect of time value of money is material, the amount of provision should be the present value of the expenditures expected to be required to settle the obligation. Ind AS 37 also provides that where discounting is used, the carrying amount of a provision increases in each period to reflect the passage of time. This increase is recognised as finance cost.
D Property, Plant and Equipment (PPE) The Company has elected the option to consider fair value as deemed cost of property, plant & equipment
on the date of transition to Ind AS.
E Revenue recognition During transition to Ind AS, the Company has reassessed its revenue recognition policies. Consequent to
change in policies relating to timing of revenue recognition under Ind AS, retained earnings and profit for the year ended March 31, 2017 has been adjusted.
F Expected credit loss- financial assets As per Ind AS 109, the Company is required to apply expected credit loss model for recognising the
allowance for doubtful debts. Accordingly, the Company has made the provision for expected credit loss as required under Ind AS on the financial assets and trade receivables.
G Expense relating to earlier period Expense relating to earlier period has been adjusted in retained earnings on transition as these pertain to
prior period.
H Deferred tax Under the previous GAAP, deferred tax is calculated using the income statement approach, which
focuses on difference between taxable profits and accounting profits for the period. Ind AS 12-“ Income tax” requires entities to account for deferred taxes using the balance sheet approach, which focuses on temporary differences between the carrying amount of an asset or liability in the balance sheet and its tax base. Application of Ind AS has resulted in recognition of deferred tax on new temporary differences and on the adjustments arising due to adjustments made on transition.
I Others Under the previous GAAP, interest free lease security deposits (that are refundable in cash on completion
of the lease term) are recorded at their transaction value. Under Ind AS, all financial assets are required to be recognised at fair value. Accordingly, the Company has fair valued these security deposits under Ind AS. Difference between the fair value and transaction value of the security deposit has been recognised as prepaid rent.
J Remeasurements of post-employment benefit obligations Under Ind AS, remeasurements i.e. actuarial gains and losses and the return on plan assets, excluding
amounts included in the net interest expense on the net defined benefit liability are recognised in other comprehensive income instead of profit or loss. Under the previous GAAP, these remeasurements were forming part of the profit or loss for the year.
K Compulsorily redeemable preference shares The Company has issued 11,000,000 10% cumulative compulsorily redeemable preference (CCRP)
shares of ` 10 each. These CCRP will be redeemed within 20 years from the date of issue. Under current
Annual Report 2017-18C
onsolidated Financial Statements
163
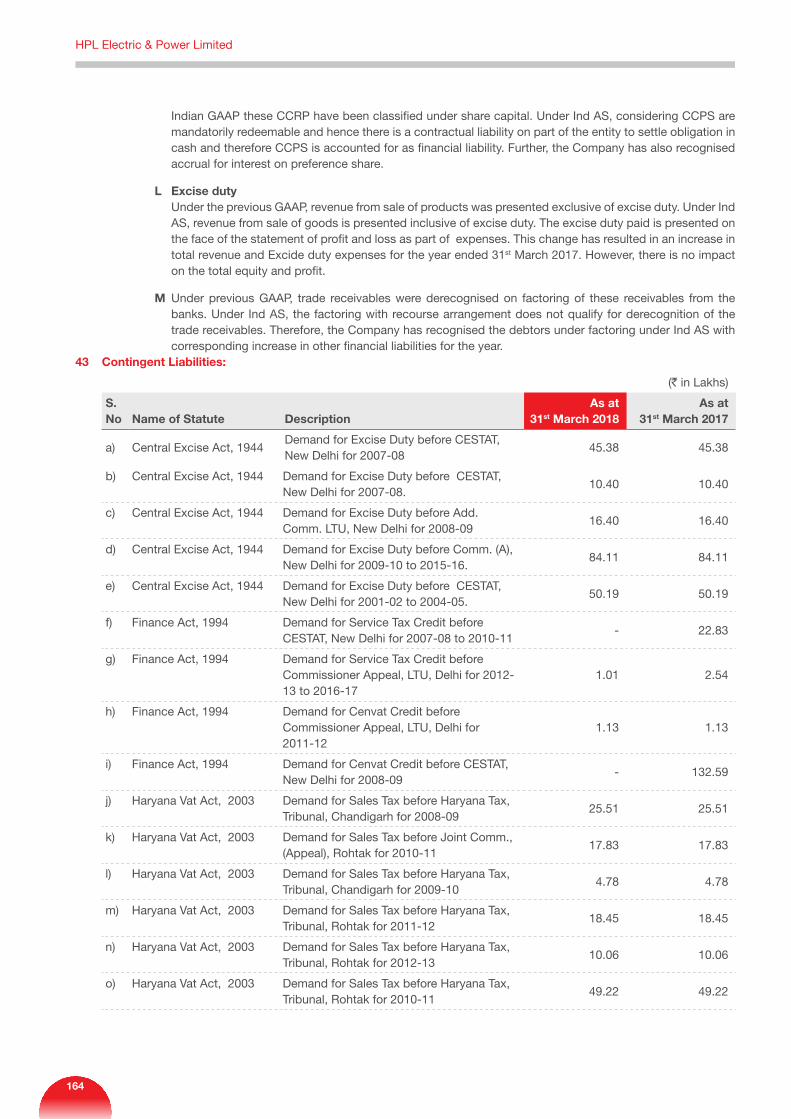
Indian GAAP these CCRP have been classified under share capital. Under Ind AS, considering CCPS are mandatorily redeemable and hence there is a contractual liability on part of the entity to settle obligation in cash and therefore CCPS is accounted for as financial liability. Further, the Company has also recognised accrual for interest on preference share.
L Excise duty Under the previous GAAP, revenue from sale of products was presented exclusive of excise duty. Under Ind
AS, revenue from sale of goods is presented inclusive of excise duty. The excise duty paid is presented on the face of the statement of profit and loss as part of expenses. This change has resulted in an increase in total revenue and Excide duty expenses for the year ended 31st March 2017. However, there is no impact on the total equity and profit.
M Under previous GAAP, trade receivables were derecognised on factoring of these receivables from the banks. Under Ind AS, the factoring with recourse arrangement does not qualify for derecognition of the trade receivables. Therefore, the Company has recognised the debtors under factoring under Ind AS with corresponding increase in other financial liabilities for the year.
43 Contingent Liabilities:
(` in Lakhs)
S. No Name of Statute Description
As at 31st March 2018
As at 31st March 2017
a) Central Excise Act, 1944Demand for Excise Duty before CESTAT, New Delhi for 2007-08
45.38 45.38
b) Central Excise Act, 1944 Demand for Excise Duty before CESTAT, New Delhi for 2007-08.
10.40 10.40
c) Central Excise Act, 1944 Demand for Excise Duty before Add. Comm. LTU, New Delhi for 2008-09
16.40 16.40
d) Central Excise Act, 1944 Demand for Excise Duty before Comm. (A), New Delhi for 2009-10 to 2015-16.
84.11 84.11
e) Central Excise Act, 1944 Demand for Excise Duty before CESTAT, New Delhi for 2001-02 to 2004-05.
50.19 50.19
f) Finance Act, 1994 Demand for Service Tax Credit before CESTAT, New Delhi for 2007-08 to 2010-11
- 22.83
g) Finance Act, 1994 Demand for Service Tax Credit before Commissioner Appeal, LTU, Delhi for 2012-13 to 2016-17
1.01 2.54
h) Finance Act, 1994 Demand for Cenvat Credit before Commissioner Appeal, LTU, Delhi for 2011-12
1.13 1.13
i) Finance Act, 1994 Demand for Cenvat Credit before CESTAT, New Delhi for 2008-09
- 132.59
j) Haryana Vat Act, 2003 Demand for Sales Tax before Haryana Tax, Tribunal, Chandigarh for 2008-09
25.51 25.51
k) Haryana Vat Act, 2003 Demand for Sales Tax before Joint Comm., (Appeal), Rohtak for 2010-11
17.83 17.83
l) Haryana Vat Act, 2003 Demand for Sales Tax before Haryana Tax, Tribunal, Chandigarh for 2009-10
4.78 4.78
m) Haryana Vat Act, 2003 Demand for Sales Tax before Haryana Tax, Tribunal, Rohtak for 2011-12
18.45 18.45
n) Haryana Vat Act, 2003 Demand for Sales Tax before Haryana Tax, Tribunal, Rohtak for 2012-13
10.06 10.06
o) Haryana Vat Act, 2003 Demand for Sales Tax before Haryana Tax, Tribunal, Rohtak for 2010-11
49.22 49.22
HPL Electric & Power Limited
164
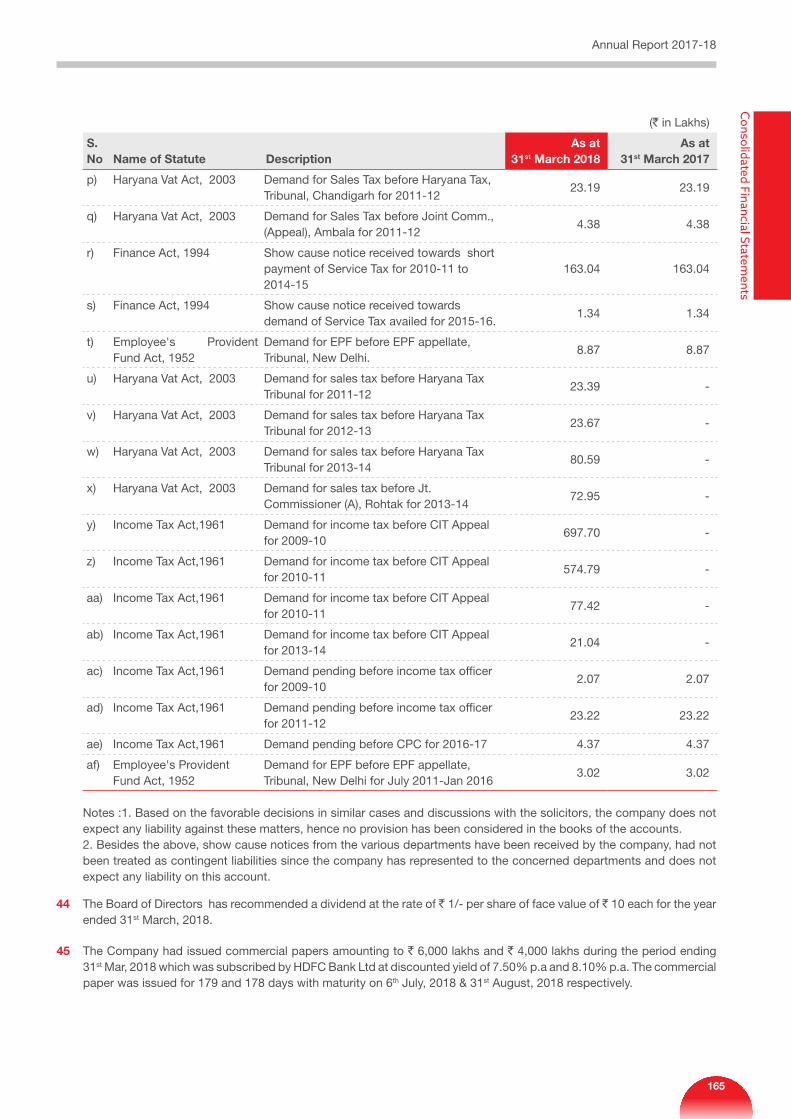
(` in Lakhs)
S. No Name of Statute Description
As at 31st March 2018
As at 31st March 2017
p) Haryana Vat Act, 2003 Demand for Sales Tax before Haryana Tax, Tribunal, Chandigarh for 2011-12
23.19 23.19
q) Haryana Vat Act, 2003 Demand for Sales Tax before Joint Comm., (Appeal), Ambala for 2011-12
4.38 4.38
r) Finance Act, 1994 Show cause notice received towards short payment of Service Tax for 2010-11 to 2014-15
163.04 163.04
s) Finance Act, 1994 Show cause notice received towards demand of Service Tax availed for 2015-16.
1.34 1.34
t) Employee's Provident Fund Act, 1952
Demand for EPF before EPF appellate, Tribunal, New Delhi.
8.87 8.87
u) Haryana Vat Act, 2003 Demand for sales tax before Haryana Tax Tribunal for 2011-12
23.39 -
v) Haryana Vat Act, 2003 Demand for sales tax before Haryana Tax Tribunal for 2012-13
23.67 -
w) Haryana Vat Act, 2003 Demand for sales tax before Haryana Tax Tribunal for 2013-14
80.59 -
x) Haryana Vat Act, 2003 Demand for sales tax before Jt. Commissioner (A), Rohtak for 2013-14
72.95 -
y) Income Tax Act,1961 Demand for income tax before CIT Appeal for 2009-10
697.70 -
z) Income Tax Act,1961 Demand for income tax before CIT Appeal for 2010-11
574.79 -
aa) Income Tax Act,1961 Demand for income tax before CIT Appeal for 2010-11
77.42 -
ab) Income Tax Act,1961 Demand for income tax before CIT Appeal for 2013-14
21.04 -
ac) Income Tax Act,1961 Demand pending before income tax officer for 2009-10
2.07 2.07
ad) Income Tax Act,1961 Demand pending before income tax officer for 2011-12
23.22 23.22
ae) Income Tax Act,1961 Demand pending before CPC for 2016-17 4.37 4.37
af) Employee's Provident Fund Act, 1952
Demand for EPF before EPF appellate, Tribunal, New Delhi for July 2011-Jan 2016
3.02 3.02
Notes :1. Based on the favorable decisions in similar cases and discussions with the solicitors, the company does not expect any liability against these matters, hence no provision has been considered in the books of the accounts.2. Besides the above, show cause notices from the various departments have been received by the company, had not been treated as contingent liabilities since the company has represented to the concerned departments and does not expect any liability on this account.
44 The Board of Directors has recommended a dividend at the rate of ` 1/- per share of face value of ` 10 each for the year ended 31st March, 2018.
45 The Company had issued commercial papers amounting to ` 6,000 lakhs and ` 4,000 lakhs during the period ending 31st Mar, 2018 which was subscribed by HDFC Bank Ltd at discounted yield of 7.50% p.a and 8.10% p.a. The commercial paper was issued for 179 and 178 days with maturity on 6th July, 2018 & 31st August, 2018 respectively.
Annual Report 2017-18C
onsolidated Financial Statements
165
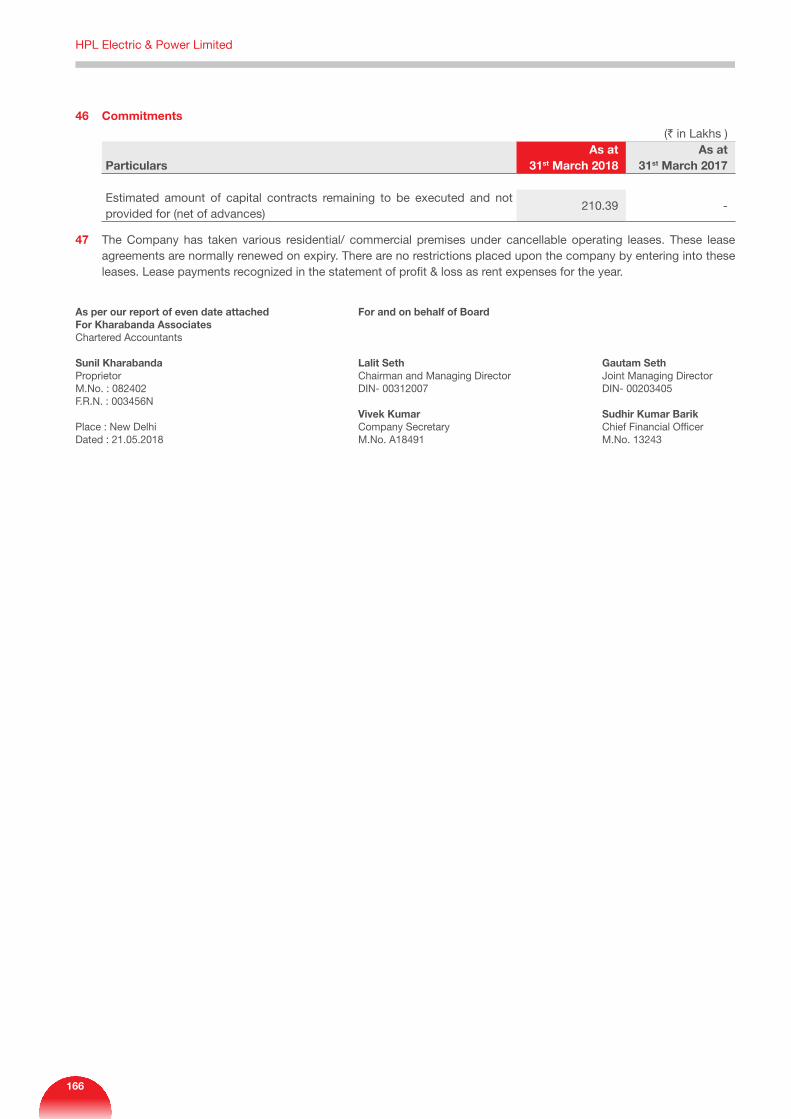
46 Commitments(` in Lakhs )
ParticularsAs at
31st March 2018As at
31st March 2017
Estimated amount of capital contracts remaining to be executed and not provided for (net of advances)
210.39 -
47 The Company has taken various residential/ commercial premises under cancellable operating leases. These lease agreements are normally renewed on expiry. There are no restrictions placed upon the company by entering into these leases. Lease payments recognized in the statement of profit & loss as rent expenses for the year.
As per our report of even date attached For and on behalf of Board For Kharabanda Associates Chartered Accountants
Sunil Kharabanda Lalit Seth Gautam Seth Proprietor Chairman and Managing Director Joint Managing Director M.No. : 082402 DIN- 00312007 DIN- 00203405F.R.N. : 003456N Vivek Kumar Sudhir Kumar Barik Place : New Delhi Company Secretary Chief Financial OfficerDated : 21.05.2018 M.No. A18491 M.No. 13243
HPL Electric & Power Limited
166
167
NOTICE is hereby given that the 26th Annual General Meeting of the Members of HPL Electric & Power Limited will be held on Thursday, 27th September, 2018 at 11:00 A.M. at Palm Green Resort, 21/30, Bakoli, GT Karnal Road, Alipur, New Delhi-110036 to transact the following business:
ORDINARY BUSINESS
1. To receive, consider and adopt the Audited Financial Statements (including the Consolidated Financial Statements) of the Company for the Financial Year ended 31st March, 2018 together with the Reports of the Board of Directors and Auditors thereon.
2. To declare final dividend of ` 1.00 per equity share for the Financial Year ended 31st March, 2018.
3. To appoint a director in place of Mr. Vinod Ratan Gupta (DIN: 07401017), who retires by rotation and being eligible, offers himself for re-appointment.
SPECIAL BUSINESS
4. Ratification of Remuneration of the Cost Auditors
To consider and if thought fit, to pass, with or without modification(s), the following resolution as an Ordinary Resolution:
“RESOLVED THAT pursuant to the provisions of Section 148 and all other applicable provisions of the Companies Act, 2013 and the Companies (Audit and Auditors) Rules, 2014 (including any statutory modification(s), enactment(s) or re-enactment(s) thereof, for the time being in force), the Cost Auditors appointed by the Board of Directors of the Company, to conduct the audit of the cost records of the Company for the financial year ending 31st March, 2019, be paid the remuneration as set out in the Statement annexed to this Notice convening the Meeting.”
5. Appointment of Mr. Hargovind Sachdev (DIN: 08105319) as an Independent Director
To consider and if thought fit, to pass, with or without modification(s), the following resolution as an Ordinary Resolution:
“RESOLVED THAT pursuant to the provisions of Section 149, 150, 152, Schedule IV read with the Rules made thereunder and other applicable provisions, if any, of the Companies Act, 2013 (Act) and in accordance with the SEBI (Listing Obligations and Disclosure Requirements) Regulations, 2015 (“Listing Regulations”), the Articles of Association of the Company, Mr. Hargovind Sachdev (DIN: 08105319), who was appointed as an Additional
NOTICE
Director (Independent) of the Company w.e.f 13th April, 2018 and whose term of office expires at the ensuing Annual General Meeting and who has submitted a declaration that he meets the criteria of independence, as provided in Section 149(6) of the Act and Regulation 16(1)(b) of the SEBI Listing Regulations, and who is eligible for appointment be and is hereby appointed as an Independent Director of the Company, not liable to retire by rotation, for a term of 2 consecutive years w.e.f. 13th April, 2018 to 12th April, 2020.
RESOLVED FURTHER THAT the Board of Directors of the Company be and is hereby authorised to do all acts and take all such steps as may be necessary, proper or expedient to give effect to this Resolution.”
6. Revision of Remuneration payable to Mr. Chandra Prakash Jain (DIN: 00311643), Whole- time Director of the Company
To consider and if thought fit, to pass, with or without modification(s), the following resolution as Special Resolution:
“RESOLVED THAT pursuant to the provisions of Section 197 and other applicable provisions, if any, of the Companies Act, 2013 (“Act”) read with Schedule V to the Act and the Rules made thereunder, including any statutory modification thereof, or any other law as applicable and with the recommendation of Nomination and Remuneration Committee and the Board, the consent of the members be and is hereby accorded for the revision in the remuneration of Mr. Chandra Prakash Jain (DIN: 00311643), Whole- time Director of the Company from ` 11,37,000/- (Rupees Eleven Lakhs Thirty Seven thousand only) per month plus perquisites which shall be restricted to a sum of ` 2,60,000 per annum to ` 12,12,000 (Rupees Twelve Lakhs twelve thousand only) per month plus perquisites which shall be restricted to a sum of ` 2,60,000 per annum with effect from 1st April, 2018.
RESOLVED FURTHER THAT in addition to the above the consent of the members be and is hereby accorded to provide a car with chauffer and telephone at the residence and the provision of the Car for the use in company’s business and telephone at residence will not be considered as perquisites and personal long distance calls and use of car for private purpose shall be billed by the company.
RESOLVED FURTHER THAT payment towards the following perquisites will not be included in the aforesaid remuneration:
Annual Report 2017-18
168
a. Contribution to provident fund, superannuation fund or annuity fund to the extent these either singly or put together are not taxable under the Income-tax Act, 1961;
b. Gratuity payable at a rate not exceeding half a month’s salary for each completed year of service; and
c. Encashment of leave as per the policy of the company.
RESOLVED FURTHER THAT the aforesaid remuneration payable to Mr. Chandra Prakash Jain as the Whole-time Director of the Company shall also be paid in the event of any loss or inadequacy of profits to the company in any financial year, subject to the tenure of Mr. Chandra Prakash Jain and the requirements of Schedule V to the Companies Act, 2013.
RESOLVED FURTHER THAT the Company Secretary of the Company be and is hereby authorized to take all necessary steps to give effect to the aforesaid resolution.”
7. Revision of remuneration payable to Mr. Vinod Ratan Gupta (DIN: 07401017) Whole- time Director of the Company
To consider and if thought fit, to pass, with or without modification(s), the following resolution as Special Resolution:
“RESOLVED THAT pursuant to the provisions of Section 197 and other applicable provisions, if any, of the Companies Act, 2013 (“Act”) read with Schedule V to the Act and the Rules made thereunder, including any statutory modification thereof, or any other law as applicable and with the recommendation of Nomination and Remuneration Committee and the Board, the consent of the members be and is hereby accorded for the revision in the remuneration of Mr. Vinod Ratan Gupta (DIN: 07401017), Whole- time Director of the Company from ` 9,00,000/- (Rupees Nine lakhs only) per month to ` 9,75,000 (Rupees Nine Lakhs Seventy Five Thousand only) per month with effect from 1st April, 2018 either paid as salary, allowances, perquisites or a combination thereof.
RESOLVED FURTHER THAT in addition to the above the consent of the members be and is hereby accorded to provide a car with chauffer and telephone at the residence and the provision of the Car for the use in company’s business and telephone at residence will not be considered at perquisites and personal long distance calls and use of car for private purpose shall be billed by the company.
RESOLVED FURTHER THAT payment towards the following perquisites will not be included in the aforesaid remuneration:
a. Contribution to provident fund, superannuation fund or annuity fund to the extent these either singly or put together are not taxable under the Income-tax Act, 1961;
b. Gratuity payable at a rate not exceeding half a month’s salary for each completed year of service; and
c. Encashment of leave as per the policy of the company.
RESOLVED FURTHER THAT the aforesaid remuneration payable to Mr. Vinod Ratan Gupta as the Whole-time Director of the Company shall also be paid in the event of any loss or inadequacy of profits to the company in any financial year, subject to the tenure of Mr. Vinod Ratan Gupta and the requirements of Schedule V to the Companies Act, 2013.
RESOLVED FURTHER THAT the Company Secretary of the Company be and is hereby authorized to take all necessary steps to give effect to the aforesaid resolution.”
By order of the board For HPL Electric & Power Limited
Vivek KumarDate: 2nd August, 2018 Company SecretaryPlace: Noida M. No. A18491
Regd. Office: 1/20, Asaf Ali Road New Delhi - 110002
NOTE(S):
1. A MEMBER ENTITLED TO ATTEND AND VOTE AT THE MEETING IS ENTITLED TO APPOINT A PROXY TO ATTEND AND VOTE ON A POLL ONLY INSTEAD OF HIMSELF/HERSELF AND SUCH A PROXY NEED NOT BE A MEMBER. PROXIES IN ORDER TO BE EFFECTIVE MUST BE RECEIVED BY THE COMPANY NOT LESS THAN FORTY-EIGHT HOURS BEFORE THE MEETING.
A PERSON CAN ACT AS PROXY FOR ONLY 50(FIFTY) MEMBERS AND HOLDING IN AGGREGATE NOT MORE THAN 10(TEN) PERCENT OF THE TOTAL SHARE CAPITAL OF THE COMPANY CARRYING VOTING RIGHTS. MEMBER HOLDING MORE THAN 10(TEN) PERCENT OF THE TOTAL SHARE CAPITAL OF THE COMPANY CARRYING VOTING RIGHTS MAY APPOINT A SINGLE PERSON AS PROXY AND SUCH PERSON SHALL NOT ACT AS PROXY FOR ANY OTHER MEMBER.
2. Corporate Members intending to send their authorized representative to attend the Annual General Meeting, pursuant to section 113 of the Companies Act, 2013
HPL Electric & Power Limited
169
are requested to send a duly certified copy of their board resolution together with the respective specimen signatures of the representative(s) authorized under the said resolution to attend and vote on their behalf at the meeting.
3. Members/proxies/authorized representatives should bring the duly filled attendance slip enclosed herewith to attend the meeting.
4. In case of joint holders, only such joint holder who is name first in the order of names will be entitled to vote.
5. An explanatory statement pursuant to Section 102 (1) of the Companies Act, 2013 in respect of all Special business specified above is annexed hereto.
6. The Register of Members and Share Transfer Books will remain closed from 21st September, 2018 to 27th September, 2018 (both days inclusive) in connection with Annual General Meeting and for the purpose of payment of dividend, if declared at the meeting.
7. The dividend on the equity shares, if declared at the Annual General Meeting, will be payable within 30 days from the date of the declaration, to those members:
a) Whose names appear as member in the register of member of the company on 20th September, 2018; and
b) Whose names appear as Beneficial Owners in the list of Beneficial Owners on 20th September, 2018 furnished by National Security Depository Limited (NSDL) and Central Depository Services (India) Limited (CDSL) for this purpose.
8. Only individual members/shareholders, holding shares in physical form who wish to nominate a person under section 72 of the Act, may furnish us required details in the prescribed Form SH-13, which is available on demand. In respect of shares held in electronic/demat form, the members may please contact their respective Depository Participants.
9. Pursuant to the requirements of SEBI (Listing Obligations and Disclosure Requirements) Regulations, 2015 on Corporate Governance, the information about the Directors proposed to be appointed or re-appointed at the Annual General Meeting is given as an Annexure attached to this Notice.
10. Members seeking any information with regard to accounts are requested to write to the company at least 7 working days before the meeting so that the information is made available by the management at the day of Annual General Meeting.
11. Members are requested to:
a) Intimate changes in their registered address, if any, to the company’s Registrar and Share Transfer Agents, Karvy Computershare Private Limited, Selenium Tower B, Plot 31-32, Gachibowli, Financial District, Nanakramguda, Hyderabad-500 032, in respect of their holdings in physical form.
b) Notify immediately any changes in their registered address, Bank Account Details and/or E-mail addresses to their depository participants in respect of their holdings in electronic form.
12. The Annual Report 2017-18, the Notice of 26th Annual General Meeting and instructions for remote e-voting, along with the attendance slip and proxy form are being sent by electronic mode to the members whose email addresses are registered with the company/Depository Participant(s), unless a member has requested for a physical copy of documents. For the members who have not registered their addresses, physical copies are being sent by permitted mode.
13. Members may also note that the Notice of 26th Annual General Meeting and Annual Report 2017-18 will be available on the company’s website, www.hplindia.com for download.
14. As per Section 118(10) of the Companies Act, 2013 read with Secretarial Standards for General Meeting issued by the Institute of Companies Secretaries of India “No gifts, gift coupons or cash in lieu of gifts shall be distributed to members at or in connection with the meeting.
15. All the documents referred to in the accompanying Notice dated 2nd August, 2018 and Explanatory Statement are open for inspection at the Company’s Registered Office at 1/20, Asaf Ali Road, New Delhi – 110002 during the normal business hours on all working days till the date of Annual General Meeting.
16. The Company has a dedicated E-mail address i.e. [email protected] for members to mail their queries or lodge complaints, if any. We will endeavor to reply to your queries at the earliest. The Company’s website www.hplindia.com has a dedicated section on Investors.
17. The Securities and Exchange Board of India (SEBI) has mandated the submission of Permanent Account Number (PAN) by every participant in securities market. Members holding shares can submit their PAN details to the Company/RTA.
18. The business set out in the Notice of the AGM may be transacted through electronic voting system from a place other than the venue of the meeting (remote e-voting) or through physical paper at the AGM.
Annual Report 2017-18
170
19. Pursuant to the provisions of Section 108 of the Act read with the rules thereunder and Regulation 44 of SEBI LODR Regulations, the Company is offering remote e-voting facility to its members in respect of the business to be transacted at the 26th Annual General Meeting scheduled to be held on 27th September, 2018 at 11:00 AM at Palm Green Resort, 21/30, Bakoli, GT Karnal Road, Alipur, New Delhi-110036.
The Company has engaged the services of Karvy Computershare Private Limited (“Karvy”) as the Authorized Agency to provide remote e-voting facility. The remote e-voting particulars are set out below:
EVENT (e-voting event number)
USER ID PASSWORD/ PIN
The remote e-voting facility will be available during the following voting period:
Commencement of e-voting: From 24th September, 2018 at 10:00 AM
End of e-voting: Up to 26th September, 2018 at 5:00 PM
The cut-off date (i.e. the record date) for the purpose of remote e-voting is 20th September, 2018.
Please read the procedure and instructions for remote e-voting given below before exercising the vote.
This communication forms an integral part of the Notice dated 2nd August, 2018 for the AGM scheduled to be held on 27th September, 2018 which is enclosed herewith and is also made available on the website of the Company www.hplindia.com. Attention is invited to the statement on the accompanying Notice that the Company is pleased to provide remote e-voting facility through Karvy for all shareholders of the Company to enable them to cast their votes electronically on the resolution mentioned in the Notice of the 26th Annual General Meeting of the Company dated 2nd August, 2018.
Procedure and instructions for Remote e-voting:
A. Members who received the Notice through e-mail from Karvy:
i. Open your web browser during the voting period and navigate to ‘https://evoting.karvy.com’
ii. Enter the login credentials (i.e., user-id & password). However, if you are already registered with Karvy for e-voting, you can
use your existing User ID and password for casting your vote:
User – ID For Members holding shares in Demat Form:-a) For NSDL :- 8 Character DP ID
followed by 8 digit Client IDb) For CDSL :- 16 digits Beneficiary ID
/ Client IDFor Members holding shares in Physical Form:-Event No. (EVENT) followed by Folio No. registered with the Company
Password Your unique password is printed above/ provided in the e-mail forwarding the electronic notice
iii. After entering these details appropriately, click on “LOGIN”.
iv. You will now reach Password Change Menu wherein they are required to mandatorily change their password. The new password shall comprise of minimum 8 characters with at least one upper case (A-Z), one lower case (a-z), one numeric value (0-9) and a special character (@, #, $, etc.). The system will prompt you to change your password and update your contact details like mobile number, email ID etc on first login. You may also enter a secret question of your choice to retrieve your password in case you forget it. It is strongly recommended that you do not share your password with any other person and that you take utmost care to keep your password confidential.
v. After changing password, you need to login again with the new credentials.
vi. On successful login, the system will prompt to select the “Event” i.e., HPL Electric & Power Limited.
vii. On the voting page, enter the number of shares (which represents number of votes) as on the cut-off date under “FOR/AGAINST/ABSTAIN” against the resolution or alternatively you may partially enter any number in “FOR”, partially in “AGAINST” and partially in “ABSTAIN” but the total number in “FOR/AGAINST/ABSTAIN” taken together should not exceed your total shareholding.
viii. You may then cast your vote by selecting an appropriate option and click on “Submit”. A confirmation box will be displayed. Click “OK” to confirm else “CANCEL” to modify
HPL Electric & Power Limited
171
your vote. During the voting period, Members can login any number of times till they have voted on the resolution.
ix. Corporate/Institutional Members (corporate /Fls /Flls/Trust/Mutual Funds/Companies, etc) are additionally required to send scanned certified true copy (PDF Format) of the Board Resolution / Authority Letter, etc. together with the attested specimen signature(s) of the duly authorized representative(s), to the Scrutinizer at e-mail ID: [email protected] with a copy marked to [email protected]. The scanned image of the above mentioned documents should be in the naming format “Corporate Name_Event No.”.
B. In case of Members receiving the Notice by post:
1. Please use the User ID and initial password as provided above.
2. Please follow all steps from Sr. No. (i) to (ix) as mentioned in (A) above, to cast your vote.
C. The remote e- voting period commences on 24th September, 2018 at 10.00 A.M and ends on 26th September, 2018 at 05.00 P.M. In case of any query pertaining to e-voting, please visit Help & FAQs section of Karvy e-voting website.
D. Once the vote on the resolution is cast by a shareholder, the shareholder shall not be allowed to change it subsequently. Further, the shareholders who have cast their vote electronically shall not be allowed to vote again at the AGM.
E. Mr. Deepak Kukreja, (FCS No. 4140) and Mrs. Monika Kohli, (FCS No. 5480), Partners DMK Associates, Practicing Company Secretaries have been appointed as Scrutinizer and alternate Scrutinizer respectively for scrutinizing the remote e-voting and the voting through physical paper in a fair and transparent manner. The Scrutinizer’s decision on the validity of remote e-voting shall be final.
F. The Scrutinizer shall, on the date of the AGM, unblock the votes in the presence of at least two witnesses not in the employment of the Company and make a Consolidated Scrutinizer’s report of the votes cast in favour or against, if any, and submit it to the Chairman.
G. The result of voting will be announced by the Chairman of the AGM after the AGM to be held on 27th September, 2018 and the resolution will be deemed to have been passed on the date of the AGM subject to receipt of the requisite number of votes in favour of the resolution.
H. The result of the voting along with the Consolidated Scrutinizer’s Report will be communicated to the stock exchanges and will also be hosted on the website of the Company (www.hplindia.com) and on Karvy’s website (https://evoting.karvy.com) within 48 hours of conclusion of the AGM.
I. The voting rights for the shares are one vote per equity share, registered in the name of the shareholders / beneficial owners as on 20th September, 2018. Shareholders holding shares either in physical form or dematerialized form may cast their vote electronically.
J. Shareholders / proxies may also vote at the venue of the meeting physically by using the physical papers that will be provided at the venue. Shareholders / proxies who have cast their votes through remote e-voting will not be allowed to cast their votes physically at the venue of the AGM.
K. In case of any grievances connected with the voting by electronic means, shareholders are requested to contact Mr. P. Nageswara Rao, Manager, Karvy Computershare Private Limited, Karvy Selenium, Tower B, Plot No. 31 & 32, Financial District, Gachibowli, Hyderabad - 500 032, E-mail : [email protected], Toll Free No. 1800-345-4001.
L. Members who have acquired shares after the despatch of the Notice and before the Cut off date may obtain the user ID by approaching Mr. P. Nageswara Rao, Manager, Karvy Computershare Private Limited, Karvy Selenium, Tower B, Plot No. 31 & 32, Financial District, Gachibowli, Hyderabad - 500 032, E-mail: [email protected], Toll Free No. 1800-345-4001, for issuance of the user ID and password for exercising their right to vote by electronic means.
20. The complete particulars of the venue of the Meeting including route map and prominent land mark for easy location are enclosed herewith. The route map of the Venue of the Meeting is also hosted along with the Notice on the website of the Company i.e. www.hplindia.com.
EXPLANATORY STATEMENT PURSUANT TO SECTION 102 OF THE COMPANIES ACT, 2013
ITEM NO. 4
M/s. Bikram Jain & Associates, Cost Accountants, (Firm Registration No. 101610) were re-appointed as Cost Auditors of the Company by the Board of Directors on the recommendation of the Audit Committee, to audit the cost records maintained by the Company in connection with manufacture of Switch Gears, Cable and Light & Lamps for the Financial Year ending 31st March, 2019 at a remuneration
Annual Report 2017-18
172
of ̀ 35,000/-(Rupees Thirty Five Thousand Only) plus Goods & Service Tax as applicable thereon.
In accordance with the provisions of Section 148 of the Companies Act, 2013 read with the Companies (Audit and Auditors) Rules, 2014 and the Companies (Cost Records and Audit) Rules, 2014, the remuneration payable to the Cost Auditors as approved by the Board of Directors on the recommendation of Audit Committee, is required to be ratified by the members of the Company. Accordingly, consent of the shareholders is sought for ratification of remuneration amounting to ` 35,000, payable to the Cost Auditors for conducting audit of the Cost Records of Company for the Financial Year ending 31st March, 2019.
None of the Directors/ Key Managerial Personnel of the Company /their relatives is, in any way, concerned or interested, financially or otherwise, in the resolution set out at Item No. 4 of the Notice.
The Board recommends the Resolution set forth at Item No. 4 of the Notice for approval of the members as an Ordinary Resolution.
ITEM NO. 5
Appointment of Mr. Hargovind Sachdev (DIN: 08105319) as an Independent Director
The Board of Directors, on the recommendation of the Nomination & Remuneration Committee and subject to the approval of the Shareholders, appointed Mr. Hargovind Sachdev as an Additional Director (Independent) on the Board of the Company for a consecutive period of 2 years w.e.f. 13th April, 2018 in terms of the provisions of Section 149, 150 and 152 of the Companies Act, 2013, read with Schedule IV of the Companies Act, 2013 and in accordance with the SEBI (Listing Obligations and Disclosure Requirements) Regulations, 2015 (“Listing Regulations”), by passing a resolution by circulation on 13th April, 2018. Pursuant to the provisions of Section 161 of the Companies Act, 2013, he shall hold office upto the date of ensuing Annual General Meeting.
The Company has received consent in writing to act as Director in Form DIR-2 and intimation in Form DIR-8 to the effect that he is not disqualified u/s 164(2) to act as Director. The Company has also received declaration from him that he meets the criteria of independence as prescribed u/s 149(6) of the Companies Act, 2013. Keeping in view that he is a person of integrity and possesses relevant expertise and experience, it will be in the interest of the Company to appoint Mr. Hargovind Sachdev as an Independent Director of the Company.
Mr. Hargovind Sachdev aged about 61 years is B.Sc Botany (Honours) and a postgraduate in English. He worked with State Bank of Travancore, State Bank of Patiala & State Bank of India where he was posted at Frankfurt Germany from 2006 to 2011 as Head of Credit. He had also worked
as Chief Vigilance Officer (CVO) in UCO Bank. He travelled across 15 countries in Europe for Credit Dispensation. He has been trained in Credit & Foreign Exchange at Asian Institute of Management, Manila, Philippines & Euro Money, London.
He does not hold directorship in any other listed Company. He is a member of the Audit Committee and Chairman of Stakeholder’s Relationship Committee of the HPL Electric & Power Limited.
He does not hold any Shares in the Company in his own name or in the name of any other person on a beneficial basis.
Copy of the Draft letter of appointment of Mr. Hargovind Sachdev as an Independent Director, setting out the terms and conditions of appointment is available for inspection by members at the Registered Office of the Company.
Save and except, Mr. Hargovind Sachdev and his relatives, to the extent of their shareholding interest, if any, in the Company, none of the other Directors, Key Managerial Personnel of the Company and their relatives is, in any way, concerned or interested, financially or otherwise, in this resolution. This Statement may also be regarded as a disclosure under Regulation 36(3) of the SEBI Listing Regulations.
Further details of Mr. Hargovind Sachdev has been given in the Annexure to this Notice.
The Board recommends the Resolution set forth at Item No. 5 of the Notice for approval of the members as an Ordinary Resolution.
ITEM NO. 6 & 7
The members of the company at the Extra-Ordinary General Meeting held on 21st January, 2016 appointed Mr. Chandra Prakash Jain and Mr. Vinod Ratan Gupta as the Whole-time Directors of the Company for a consecutive period of 3 Years w.e.f 21st January, 2016.
On the recommendation of the Nomination & Remuneration committee, the Board of directors in their meeting held on 21st May, 2018 proposed to revise the remuneration of Mr. Chandra Prakash Jain & Mr. Vinod Ratan Gupta subject to the approval of shareholders, with effect from 1st April, 2018 as per the following:
1. The Board of Directors, on the recommendation of Nomination & Remuneration Committee approved to revise the remuneration of Mr. Chandra Prakash Jain from ` 11,37,000/- (Rupees Eleven Lakhs Thirty Seven thousand only) per month plus perquisites which shall be restricted to a sum of ` 2,60,000 per annum to ` 12,12,000 (Rupees Twelve Lakhs twelve thousand only) per month plus perquisites which shall be
HPL Electric & Power Limited
173
restricted to a sum of ` 2,60,000 per annum with effect from 1st April, 2018.
2. The Board of Directors, on the recommendation of Nomination & Remuneration Committee approved to revise the remuneration of Mr. Vinod Ratan Gupta from ` 9,00,000/- (Rupees Nine lakhs only) per month to ` 9,75,000 (Rupees Nine Lakhs Seventy Five Thousand only) per month with effect from 1st April, 2018 either paid as salary, allowances, perquisites or a combination thereof.
All other terms and conditions relating to their appointment and Remuneration as approved earlier by the members remained unchanged. The above revision in the remuneration of Mr. Chandra Prakash Jain and Mr. Vinod Ratan Gupta is effective from 1st April, 2018 till 20th January, 2019.
Details of remuneration paid to Mr. Chandra Prakash Jain and Mr. Vinod Ratan Gupta during financial year 2017-18 have been disclosed in the Director’s Report and the Corporate Governance Report. This statement may also be regarded as disclosure under SEBI
(Listing Obligations and Disclosure Requirements) Regulations, 2015.
None of the Directors/ Key Managerial Personnel of the Company /their relatives is, in any way, concerned or interested, financially or otherwise, in the resolution except Mr. Chandra Prakash Jain and Mr. Vinod Ratan Gupta.
The Board recommends the Resolution set forth at Item No. 6 & 7 of the Notice for approval of the members as Special Resolution.
By order of the board For HPL Electric & Power Limited
Vivek KumarDate: 2nd August, 2018 Company SecretaryPlace: Noida M. No. A18491
Regd. Office: 1/20, Asaf Ali Road New Delhi - 110002
Annual Report 2017-18
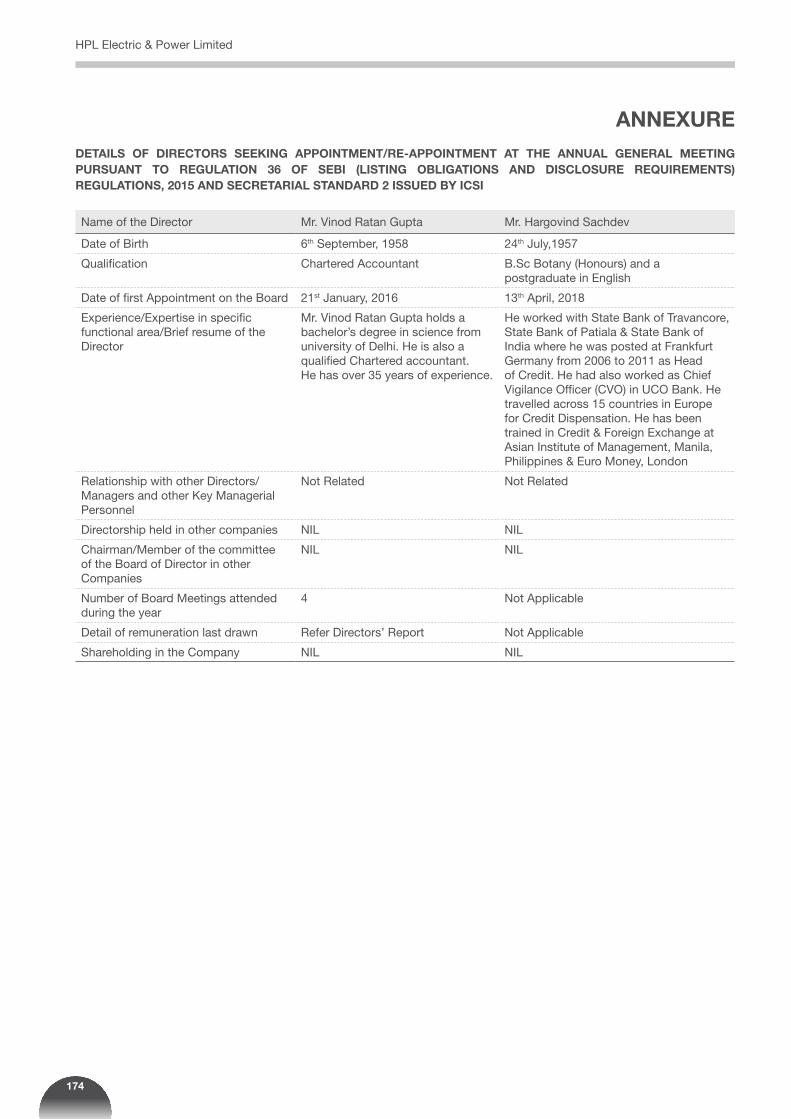
174
ANNEXURE
DETAILS OF DIRECTORS SEEKING APPOINTMENT/RE-APPOINTMENT AT THE ANNUAL GENERAL MEETING PURSUANT TO REGULATION 36 OF SEBI (LISTING OBLIGATIONS AND DISCLOSURE REQUIREMENTS) REGULATIONS, 2015 AND SECRETARIAL STANDARD 2 ISSUED BY ICSI
Name of the Director Mr. Vinod Ratan Gupta Mr. Hargovind Sachdev
Date of Birth 6th September, 1958 24th July,1957
Qualification Chartered Accountant B.Sc Botany (Honours) and a postgraduate in English
Date of first Appointment on the Board 21st January, 2016 13th April, 2018
Experience/Expertise in specific functional area/Brief resume of the Director
Mr. Vinod Ratan Gupta holds a bachelor’s degree in science from university of Delhi. He is also a qualified Chartered accountant. He has over 35 years of experience.
He worked with State Bank of Travancore, State Bank of Patiala & State Bank of India where he was posted at Frankfurt Germany from 2006 to 2011 as Head of Credit. He had also worked as Chief Vigilance Officer (CVO) in UCO Bank. He travelled across 15 countries in Europe for Credit Dispensation. He has been trained in Credit & Foreign Exchange at Asian Institute of Management, Manila, Philippines & Euro Money, London
Relationship with other Directors/Managers and other Key Managerial Personnel
Not Related Not Related
Directorship held in other companies NIL NIL
Chairman/Member of the committee of the Board of Director in other Companies
NIL NIL
Number of Board Meetings attended during the year
4 Not Applicable
Detail of remuneration last drawn Refer Directors’ Report Not Applicable
Shareholding in the Company NIL NIL
HPL Electric & Power Limited
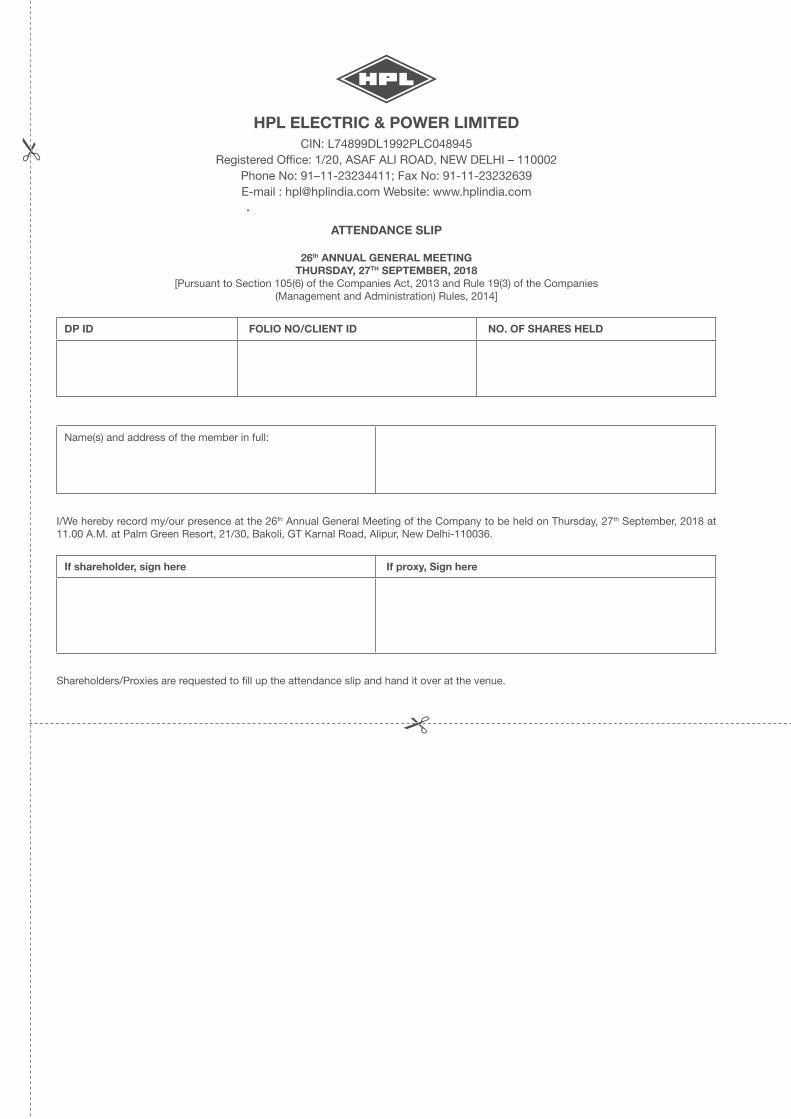
26th ANNUAL GENERAL MEETINGTHURSDAY, 27TH SEPTEMBER, 2018
[Pursuant to Section 105(6) of the Companies Act, 2013 and Rule 19(3) of the Companies(Management and Administration) Rules, 2014]
DP ID FOLIO NO/CLIENT ID NO. OF SHARES HELD
Name(s) and address of the member in full:
I/We hereby record my/our presence at the 26th Annual General Meeting of the Company to be held on Thursday, 27th September, 2018 at 11.00 A.M. at Palm Green Resort, 21/30, Bakoli, GT Karnal Road, Alipur, New Delhi-110036.
If shareholder, sign here If proxy, Sign here
Shareholders/Proxies are requested to fill up the attendance slip and hand it over at the venue.
ATTENDANCE SLIP
HPL ELECTRIC & POWER LIMITEDCIN: L74899DL1992PLC048945
Registered Office: 1/20, ASAF ALI ROAD, NEW DELHI – 110002 Phone No: 91–11-23234411; Fax No: 91-11-23232639E-mail : [email protected] Website: www.hplindia.com

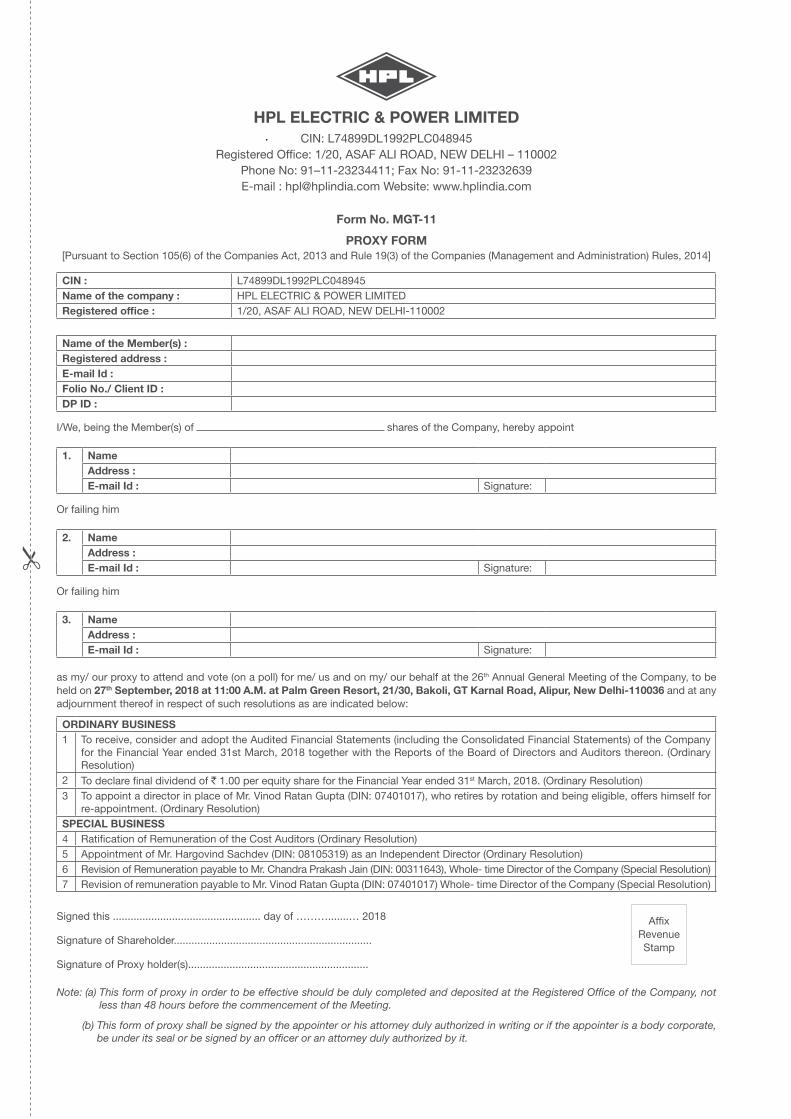
Form No. MGT-11
PROXY FORM[Pursuant to Section 105(6) of the Companies Act, 2013 and Rule 19(3) of the Companies (Management and Administration) Rules, 2014]
CIN : L74899DL1992PLC048945Name of the company : HPL ELECTRIC & POWER LIMITEDRegistered office : 1/20, ASAF ALI ROAD, NEW DELHI-110002
Name of the Member(s) : Registered address : E-mail Id : Folio No./ Client ID :DP ID :
I/We, being the Member(s) of shares of the Company, hereby appoint
1. Name Address : E-mail Id : Signature:
Or failing him
2. Name Address : E-mail Id : Signature:
Or failing him
3. Name Address : E-mail Id : Signature:
as my/ our proxy to attend and vote (on a poll) for me/ us and on my/ our behalf at the 26th Annual General Meeting of the Company, to be held on 27th September, 2018 at 11:00 A.M. at Palm Green Resort, 21/30, Bakoli, GT Karnal Road, Alipur, New Delhi-110036 and at any adjournment thereof in respect of such resolutions as are indicated below:
ORDINARY BUSINESS1 To receive, consider and adopt the Audited Financial Statements (including the Consolidated Financial Statements) of the Company
for the Financial Year ended 31st March, 2018 together with the Reports of the Board of Directors and Auditors thereon. (Ordinary Resolution)
2 To declare final dividend of ` 1.00 per equity share for the Financial Year ended 31st March, 2018. (Ordinary Resolution)3 To appoint a director in place of Mr. Vinod Ratan Gupta (DIN: 07401017), who retires by rotation and being eligible, offers himself for
re-appointment. (Ordinary Resolution)SPECIAL BUSINESS4 Ratification of Remuneration of the Cost Auditors (Ordinary Resolution)5 Appointment of Mr. Hargovind Sachdev (DIN: 08105319) as an Independent Director (Ordinary Resolution)6 Revision of Remuneration payable to Mr. Chandra Prakash Jain (DIN: 00311643), Whole- time Director of the Company (Special Resolution)7 Revision of remuneration payable to Mr. Vinod Ratan Gupta (DIN: 07401017) Whole- time Director of the Company (Special Resolution)
Signed this .................................................. day of ……….......… 2018
Signature of Shareholder...................................................................
Signature of Proxy holder(s).............................................................
Note: (a) This form of proxy in order to be effective should be duly completed and deposited at the Registered Office of the Company, not less than 48 hours before the commencement of the Meeting.
(b) This form of proxy shall be signed by the appointer or his attorney duly authorized in writing or if the appointer is a body corporate, be under its seal or be signed by an officer or an attorney duly authorized by it.
Affix Revenue Stamp
HPL ELECTRIC & POWER LIMITEDCIN: L74899DL1992PLC048945
Registered Office: 1/20, ASAF ALI ROAD, NEW DELHI – 110002 Phone No: 91–11-23234411; Fax No: 91-11-23232639E-mail : [email protected] Website: www.hplindia.com
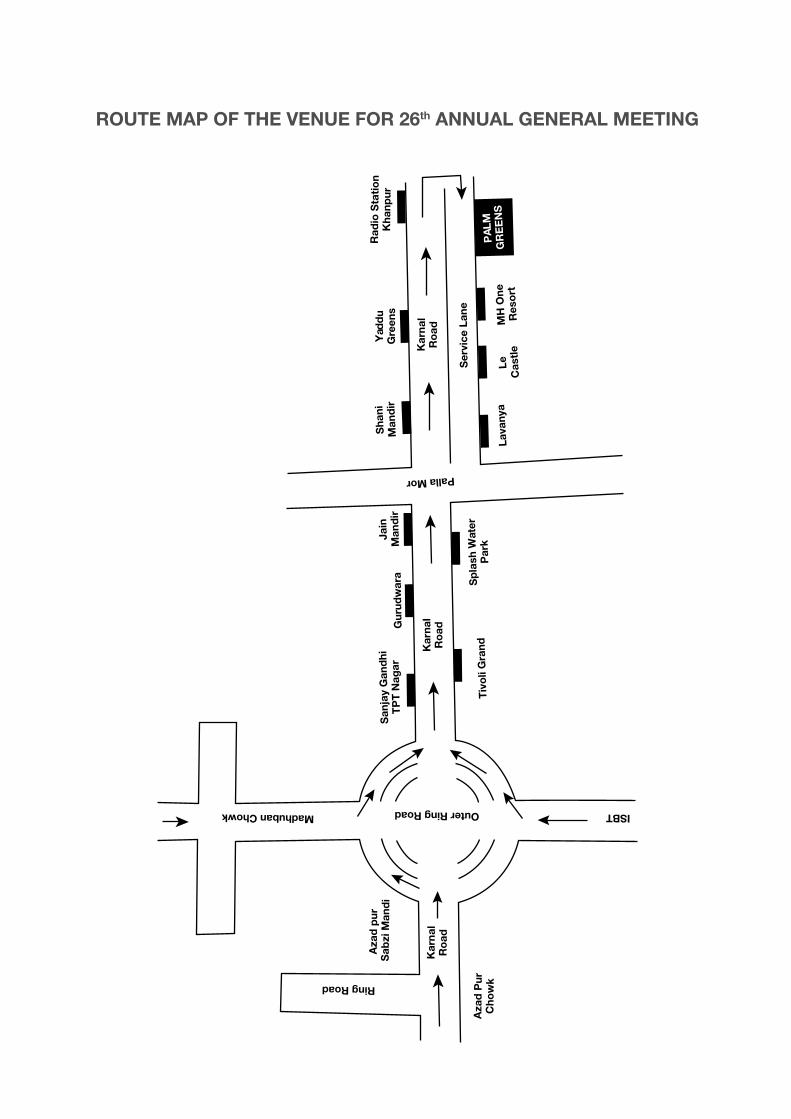
ROUTE MAP OF THE VENUE FOR 26th ANNUAL GENERAL MEETING
Aza
d P
urC
how
k
Kar
nal
Ro
ad
Aza
d p
ur
Sab
zi M
and
i
Madhuban Chowk
San
jay
Gan
dhi
TP
T N
agar
Gur
udw
ara
Jain
Man
dir
PA
LMG
RE
EN
SM
H O
neR
eso
rtLe
Cas
tle
Lava
nya
Sha
niM
and
ir
Rad
io S
tati
on
Kha
npur
Yad
du
Gre
ens
Kar
nal
Ro
ad
Ser
vice
Lan
eS
pla
sh W
ater
Par
kT
ivo
li G
randK
arna
lR
oad
Palla Mor
ISBTOuter Ring Road
Ring Road

NOTES

NOTES


www.hplindia.com
![[XLS] · Web viewP.B.N0.14 BHAGWAN NIVAS,RAILWAY R0AD,KAITHAL,PIN -132027 01746-222524 ASSANDH KARNAL R0AD ASSANDH,DIST KARNAL,HARYANA,PIN -132039 01749-278223 GHARAUNDA GHARAU_GHARAUNDA](https://img.pdfslide.us/doc/110x75/5b09b9d57f8b9af0438e3128/xls-viewpbn014-bhagwan-nivasrailway-r0adkaithalpin-132027-01746-222524.jpg)


![GOVERNMENT OF HARYANA ir twopt roan, tAVRT Directorate ...Sh. Uday Partap Singh [053674] DEED Karnal Distt. Karnal [4608] is hereby authorised to exercise the power of Drawing & Disbursing](https://img.pdfslide.us/doc/110x75/5e725b8c22d9c30bfb126ce0/government-of-haryana-ir-twopt-roan-tavrt-directorate-sh-uday-partap-singh.jpg)


![HARYANA GOVERNMENT EDUCATION …schooleducationharyana.gov.in/downloads_pdf/daily_orders/2012/T...HARYANA GOVERNMENT EDUCATION DEPARTMENT ... D.I.E.T. Shahpur (Karnal) [4613] (Rural)](https://img.pdfslide.us/doc/110x75/5ab2ed0c7f8b9a00728dab7e/haryana-government-education-sc-government-education-department-diet.jpg)