Embed Size (px)
DESCRIPTION
Brussels Airport statistics 2010
Citation preview
TITELTITEL
� BRUTRENDS 2010
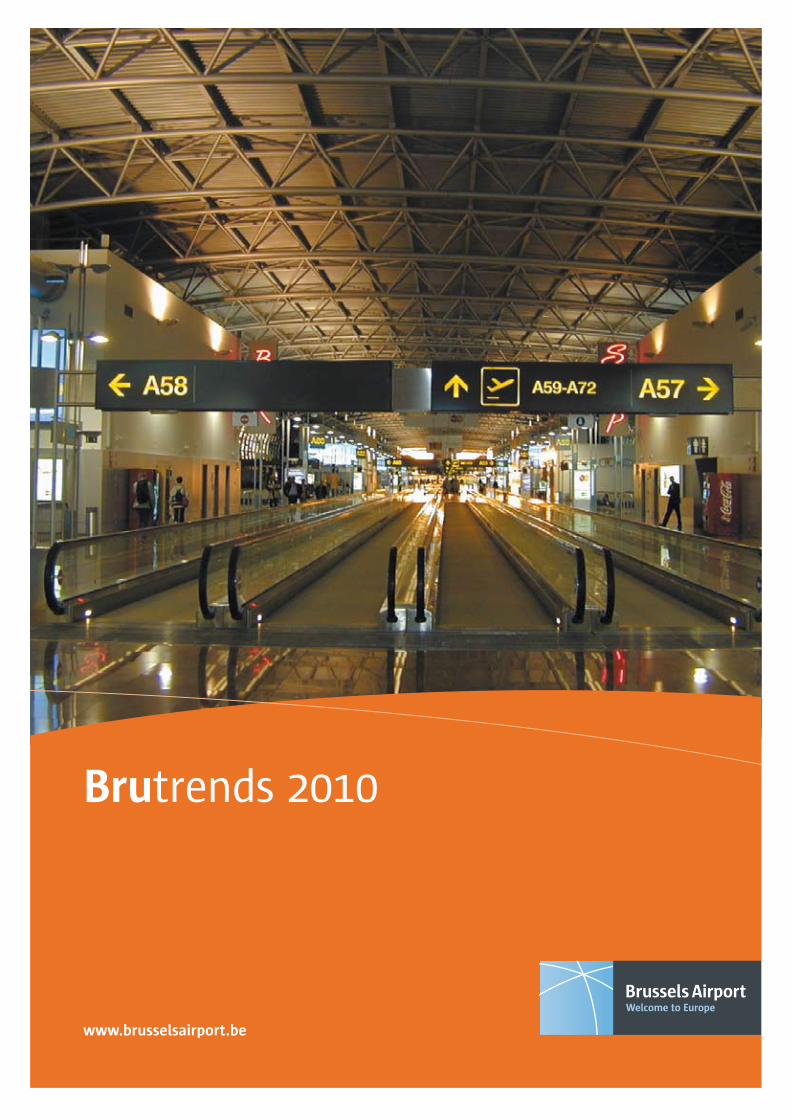
Brutrends 20�0
www.brusselsairport.be
BRUTRENDS 2010
02 Movements
02 Per month (2009-2010)02 Evolution (1996-2010)03 Per type of traffic04 Per area: Europe vs. overseas04 Per area: Europe05 Per area: overseas05 Per area: EU vs. non-EU06 Per area: EU vs. non-EU (evolution)06 Per area: Schengen vs. non-Schengen07 Top ten intra-European passenger destinations07 Top ten intra-European cargo destinations08 Top ten overseas passenger destinations08 Top ten overseas cargo destinations 09 Top ten peak days vs. lowest days09 Movements per hour09 Day vs. night10 Per aircraft size10 Per noise category
11 Passengers
11 Per month (2009-2010)11 Evolution (1994-2010)12 Per type of traffic12 Transfer and transit vs. O&D13 Transfer and transit vs. O&D (continued)13 Per area: Europe vs. overseas14 Per area: intra-European traffic14 Per area: overseas traffic15 Per area: EU vs. non-EU15 Per area: EU vs. non-EU (evolution)16 Per area: Schengen vs. non-Schengen16 Top ten intra-European destinations17 Top ten overseas destinations17 Top ten peak days vs. lowest days17 Passengers per hour18 Passenger destinations19 Passenger destinations (continued)19 Passenger airlines20 Passenger airlines (continued)20 Map of Brussels Airport
21 Cargo
21 Per month (2009-2010)21 Evolution (2000-2010)22 Per area: Europe vs. overseas22 Per area: Europe23 Per area: overseas23 Per area: EU vs. non-EU24 Top ten intra-European destinations24 Top ten overseas destinations24 Top ten peak days vs. lowest days25 Cargo destinations25 Cargo airlines
26 Other stats
26 City-Airport access by car26 Airport access by railway27 Airport access by bus28 Airport access by taxi28 In-flight catering29 Law enforcement30 Custom clearances30 Passenger profile31 Employment at Brussels Airport
CONTENTS
�
2 BRUTRENDS 2010
� 000
0
�0 000
�� 000
20 000
2� 000
200� 20�0
� 2 � � � � � � � �0 �� �2
�00
�0
0
��0
200
2�0
�00
��0
200�200����� ���� ���� ���� 2000 200� 2002 200� 200� 200� 200� 200� 20�0
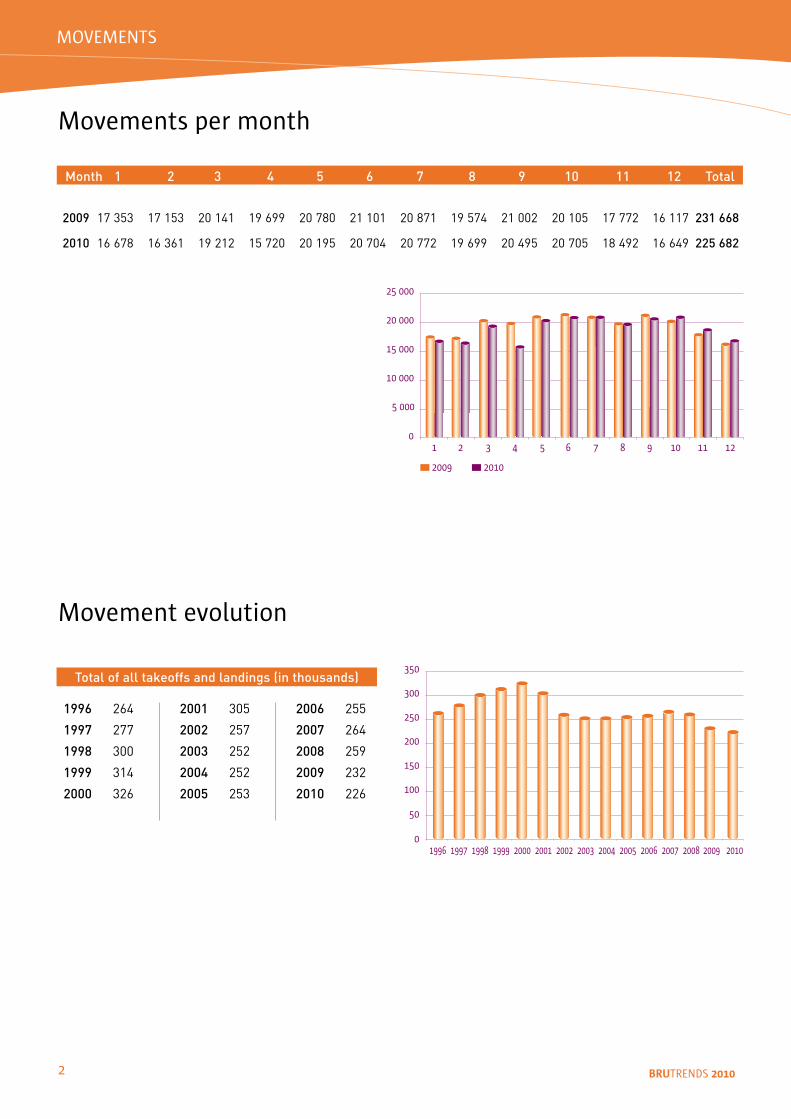
Movements per month
Month 1 2 3 4 5 6 7 8 9 10 11 12 Total
2009 17 353 17 153 20 141 19 699 20 780 21 101 20 871 19 574 21 002 20 105 17 772 16 117 231 668
2010 16 678 16 361 19 212 15 720 20 195 20 704 20 772 19 699 20 495 20 705 18 492 16 649 225 682
Movement evolution
1996 264
1997 277
1998 300
1999 314
2000 326
2001 305
2002 257
2003 252
2004 252
2005 253
2006 255
2007 264
2008 259
2009 232
2010 226
Total of all takeoffs and landings (in thousands)
MOVEMENTS
� BRUTRENDS 2010
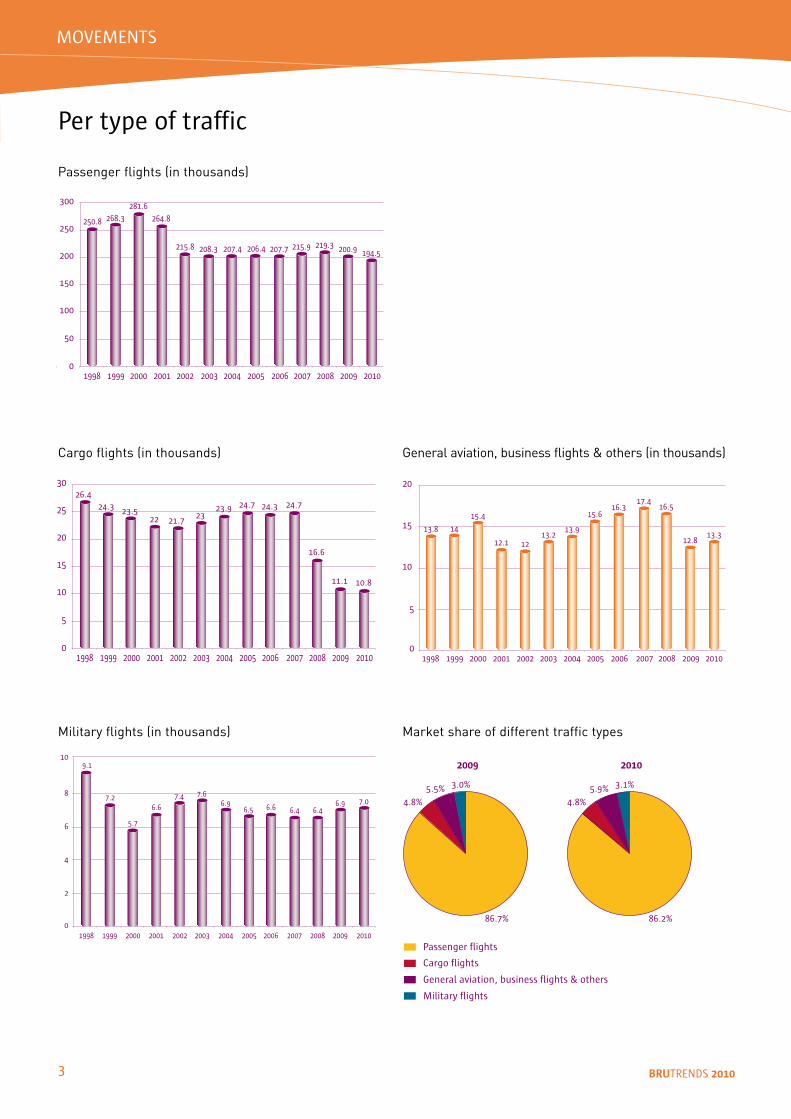
Per type of traffic
�00
�0
0
��0
200
2�0
�00
���� ���� 2000 200� 2002 200� 200�
2�0.� 2��.�
2��.�
2��.�
2��.� 20�.�
200�
20�.�20�.�
200�
20�.�
200�
2��.�
200�
2��.�
200�
200.�
20�0
���.�
Passenger flights (in thousands)
�0
�
0
��
20
2�
�0
���� ���� 2000 200� 2002
2�.�
2�.� 2�.�22 2�.�
200�
2�
200�
2�.�
200�
2�.�
200�
��.�
200�
��.�
20�0
�0.�
200�
2�.�
200�
2�.�
0
�
�0
��
20
���� ���� 2000 200� 2002
�2�2.�
��
��.�
��.���.2
200�
��.�
20�0
��.�
��.�
200� 200�
��.�
200�
��.�
200�
�2.�
200�
��.�
200�
Cargo flights (in thousands) General aviation, business flights & others (in thousands)
0
2
�
�
�
�0
���� ���� 2000 200� 2002
�.��.�
�.2
�.�
�.�
200�
�.�
200�
�.�
200�
�.�
200�
�.�
200�
�.�
200�
�.�
20�0
�.0
200�
�.�
Passenger flights
Cargo flights
General aviation, business flights & others
Military flights
2010
��.2%
�.�%
�.�% �.�%
2009
��.�%
�.�%
�.�% �.0%
Military flights (in thousands) Market share of different traffic types
MOVEMENTS

� BRUTRENDS 2010
Per area: Europe vs. overseas
Per area: Europe
��.�%
��.2%
Europe
Overseas
West & Central European countries
Mediterranean countries
Great Britain & Ireland
Scandinavia
Eastern European countries
�2.�%
��.�%
��.2%
�0.�%
�.�%
2009 2010 '10 vs '09
Intra-European commercial flights 179 110 172 042 -3.9%
West & Central European countries 60 165 55 185 -8.3%
Mediterranean countries 62 707 63 209 0.8%
Great Britain & Ireland 24 892 22 776 -8.5%
Scandinavia 17 582 17 820 1.4%
Eastern European countries 13 764 13 052 -5.2%
➜
Total number % of total of flights
Total commercial flights 205 370 100.0%
Europe 172 042 83.8%
of which EU 147 397 71.8%
Non-EU 24 645 12.0%
Overseas 33 328 16.2%
of which Africa 14 740 7.2%
North America 8 584 4.2%
Middle East 4 768 2.3%
Asia & Pacific 4 527 2.2%
Central & South America 709 0.3%
MOVEMENTS
➜
➜
➜
➜
➜
� BRUTRENDS 2010
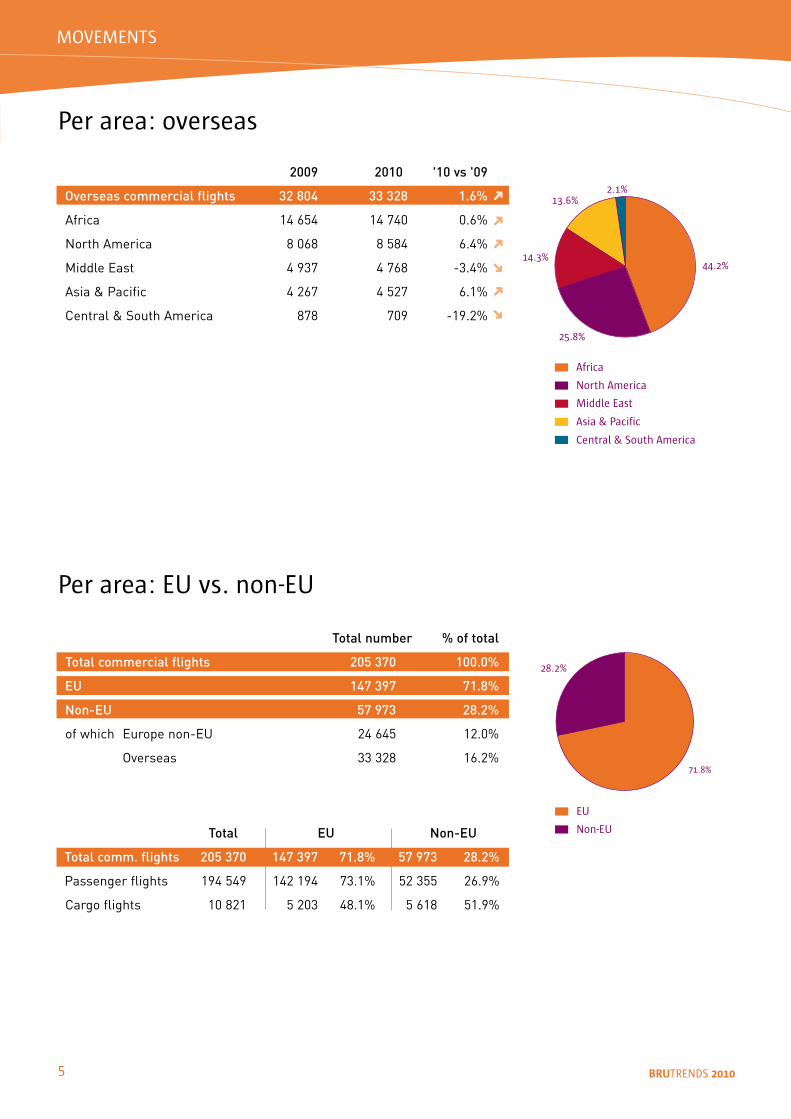
Per area: overseas
��.2%
2�.�%
��.�%
��.�%2.�%
Africa
North America
Middle East
Asia & Pacific
Central & South America
2�.2%
��.�%
EU
Non-EU
Per area: EU vs. non-EU
Total number % of total
Total commercial flights 205 370 100.0%
EU 147 397 71.8%
Non-EU 57 973 28.2%
of which Europe non-EU 24 645 12.0%
Overseas 33 328 16.2%
Total EU Non-EU
Total comm. flights 205 370 147 397 71.8% 57 973 28.2%
Passenger flights 194 549 142 194 73.1% 52 355 26.9%
Cargo flights 10 821 5 203 48.1% 5 618 51.9%
➜
2009 2010 '10 vs '09
Overseas commercial flights 32 804 33 328 1.6%
Africa 14 654 14 740 0.6%
North America 8 068 8 584 6.4%
Middle East 4 937 4 768 -3.4%
Asia & Pacific 4 267 4 527 6.1%
Central & South America 878 709 -19.2%
MOVEMENTS
➜
➜
➜
➜
➜
➜
� BRUTRENDS 2010
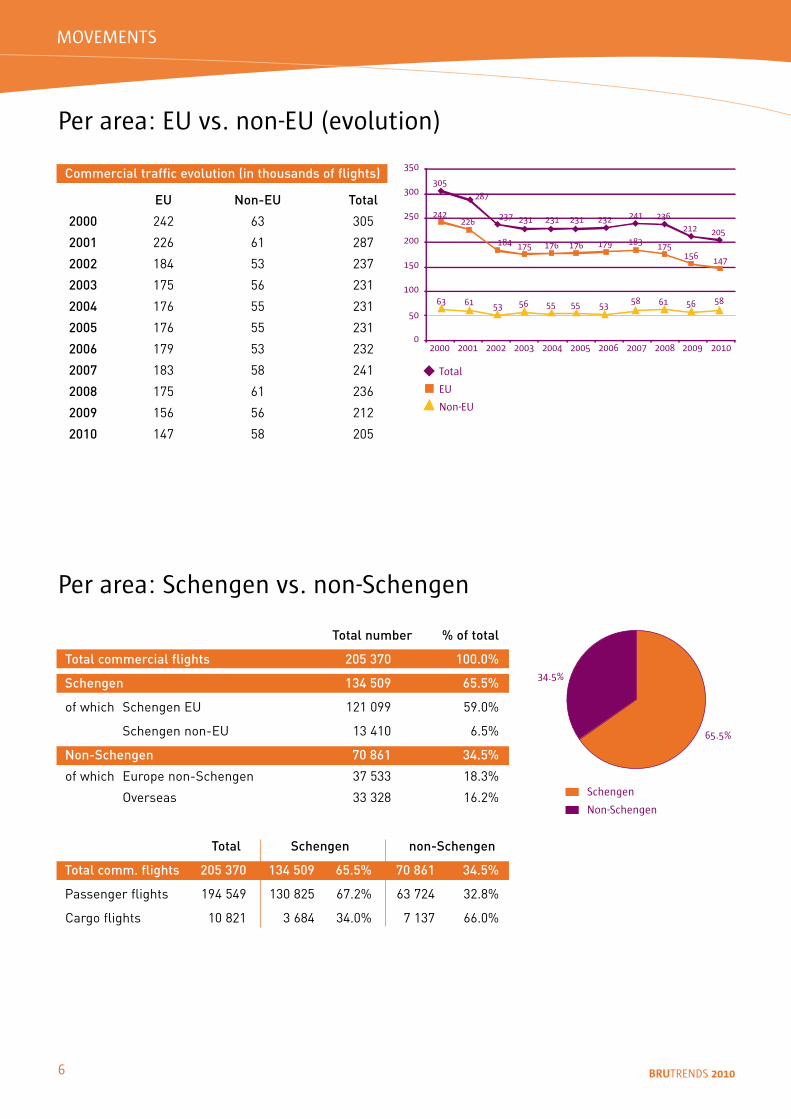
Per area: EU vs. non-EU (evolution)
�0�
2��
2�� 2��
���
��
2�222�
���
�� �� ��
�00
�0
0
��0
200
2�0
�00
��0
2000 200� 2002 200� 200� 200� 200� 200� 200� 200� 20�0
Total
EU
Non-EU
2��
������ ���
���
�� ����
2�� 2�2 2�� 2��2�2 20�
��� ��� ���
�� �� �� ��
Commercial traffic evolution (in thousands of flights)
EU Non-EU Total
2000 242 63 305
2001 226 61 287
2002 184 53 237
2003 175 56 231
2004 176 55 231
2005 176 55 231
2006 179 53 232
2007 183 58 241
2008 175 61 236
2009 156 56 212
2010 147 58 205
Per area: Schengen vs. non-Schengen
��.�%
��.�%
Schengen
Non-Schengen
Total number % of total
Total commercial flights 205 370 100.0%
Schengen 134 509 65.5%
of which Schengen EU 121 099 59.0%
Schengen non-EU 13 410 6.5%
Non-Schengen 70 861 34.5%
of which Europe non-Schengen 37 533 18.3%
Overseas 33 328 16.2%
Total Schengen non-Schengen
Total comm. flights 205 370 134 509 65.5% 70 861 34.5%
Passenger flights 194 549 130 825 67.2% 63 724 32.8%
Cargo flights 10 821 3 684 34.0% 7 137 66.0%
MOVEMENTS
� BRUTRENDS 2010
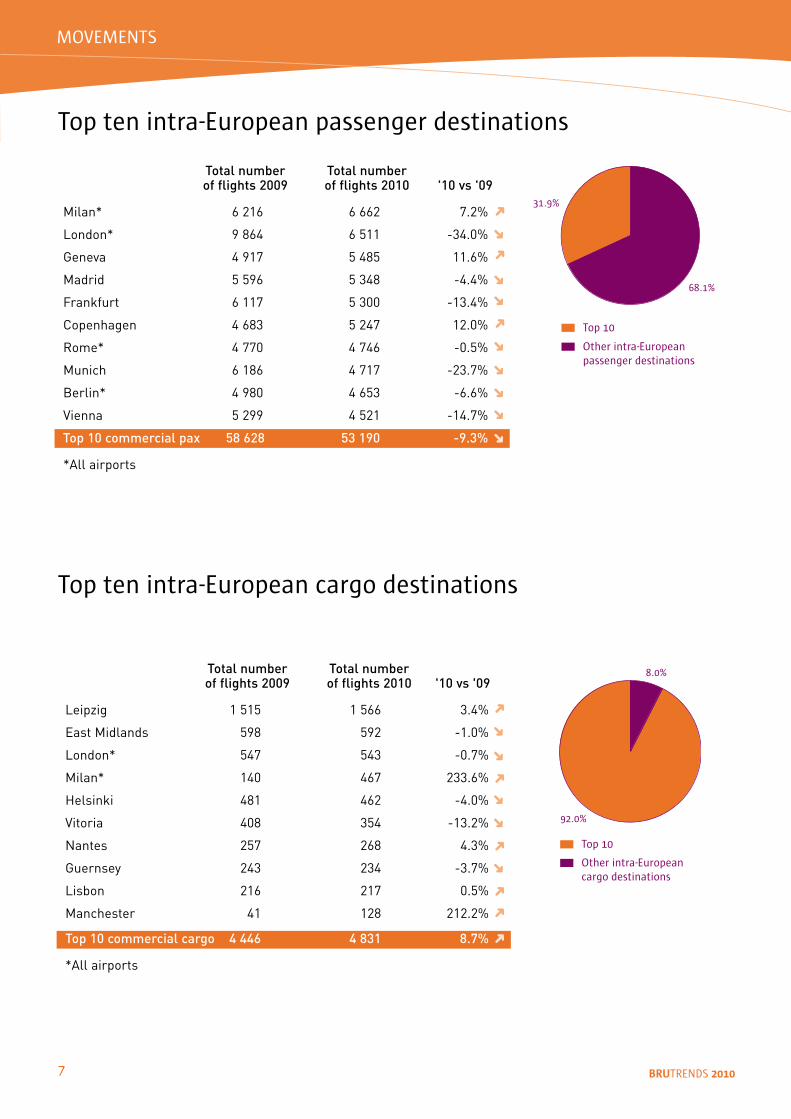
Top ten intra-European passenger destinations
��.�%
��.�%
Other intra-European passenger destinations
Top �0
Total number Total number of flights 2009 of flights 2010 '10 vs '09
Milan* 6 216 6 662 7.2%
London* 9 864 6 511 -34.0%
Geneva 4 917 5 485 11.6%
Madrid 5 596 5 348 -4.4%
Frankfurt 6 117 5 300 -13.4%
Copenhagen 4 683 5 247 12.0%
Rome* 4 770 4 746 -0.5%
Munich 6 186 4 717 -23.7%
Berlin* 4 980 4 653 -6.6%
Vienna 5 299 4 521 -14.7%
Top 10 commercial pax 58 628 53 190 -9.3%
*All airports
�.0%
�2.0%
Other intra-European cargo destinations
Top �0
Top ten intra-European cargo destinations
Total number Total number of flights 2009 of flights 2010 '10 vs '09
Leipzig 1 515 1 566 3.4%
East Midlands 598 592 -1.0%
London* 547 543 -0.7%
Milan* 140 467 233.6%
Helsinki 481 462 -4.0%
Vitoria 408 354 -13.2%
Nantes 257 268 4.3%
Guernsey 243 234 -3.7%
Lisbon 216 217 0.5%
Manchester 41 128 212.2%
Top 10 commercial cargo 4 446 4 831 8.7%
*All airports
➜
➜
➜
➜
➜
➜
➜
➜
➜
MOVEMENTS
➜
➜
➜
➜
➜
➜
➜
➜
➜
➜
➜
➜
➜
� BRUTRENDS 2010
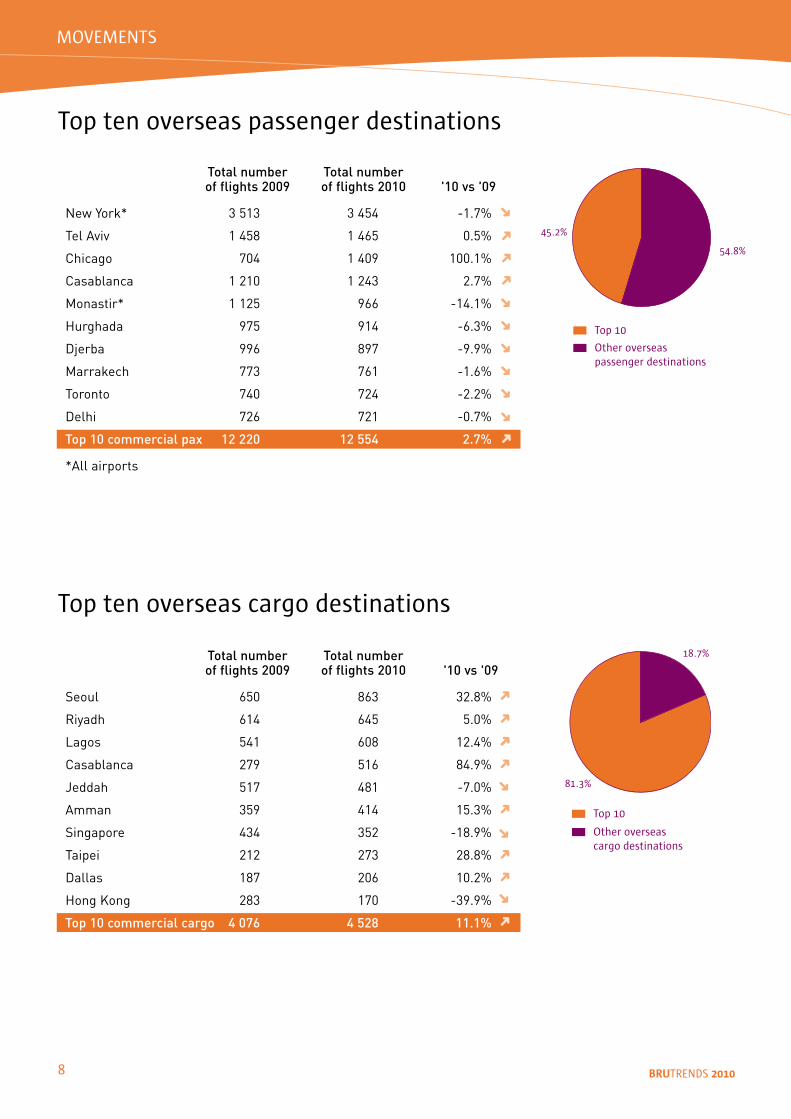
Top ten overseas passenger destinations
��.2%
��.�%
Other overseas passenger destinations
Top �0
Total number Total number of flights 2009 of flights 2010 '10 vs '09
New York* 3 513 3 454 -1.7%
Tel Aviv 1 458 1 465 0.5%
Chicago 704 1 409 100.1%
Casablanca 1 210 1 243 2.7%
Monastir* 1 125 966 -14.1%
Hurghada 975 914 -6.3%
Djerba 996 897 -9.9%
Marrakech 773 761 -1.6%
Toronto 740 724 -2.2%
Delhi 726 721 -0.7%
Top 10 commercial pax 12 220 12 554 2.7%
*All airports
Top ten overseas cargo destinations
��.�%
��.�%
Other overseascargo destinations
Top �0
Total number Total number of flights 2009 of flights 2010 '10 vs '09
Seoul 650 863 32.8%
Riyadh 614 645 5.0%
Lagos 541 608 12.4%
Casablanca 279 516 84.9%
Jeddah 517 481 -7.0%
Amman 359 414 15.3%
Singapore 434 352 -18.9%
Taipei 212 273 28.8%
Dallas 187 206 10.2%
Hong Kong 283 170 -39.9%
Top 10 commercial cargo 4 076 4 528 11.1%
MOVEMENTS
➜
➜
➜
➜
➜
➜
➜
➜
➜
➜
➜
➜
➜
➜
➜
➜
➜
➜
➜
➜
➜
➜
➜
� BRUTRENDS 2010
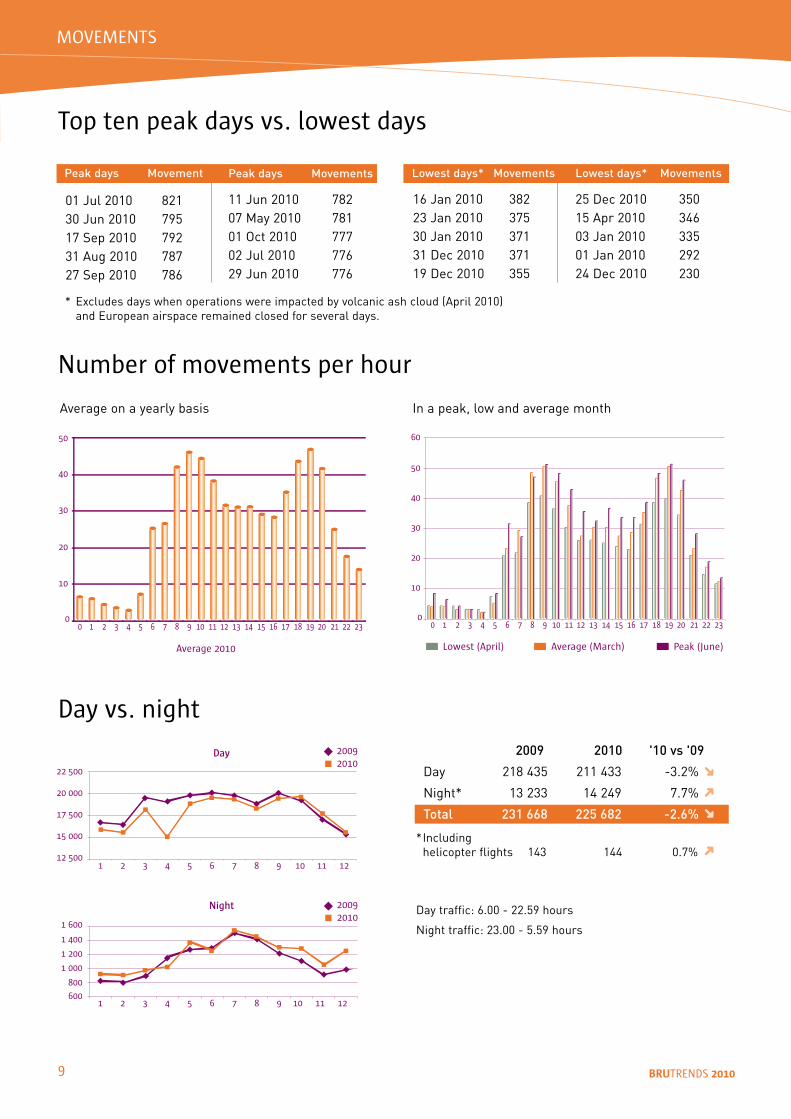
2009 2010 '10 vs '09
Day 218 435 211 433 -3.2%
Night* 13 233 14 249 7.7%
Total 231 668 225 682 -2.6%
Peak days Movement
01 Jul 2010 821 30 Jun 2010 795 17 Sep 2010 792 31 Aug 2010 787 27 Sep 2010 786
Peak days Movements
11 Jun 2010 78207 May 2010 78101 Oct 2010 77702 Jul 2010 77629 Jun 2010 776
Top ten peak days vs. lowest days
Lowest days* Movements
16 Jan 2010 382 23 Jan 2010 375 30 Jan 2010 371 31 Dec 2010 371 19 Dec 2010 355
Lowest days* Movements
25 Dec 2010 35015 Apr 2010 34603 Jan 2010 33501 Jan 2010 29224 Dec 2010 230
Number of movements per hour
0
�0
20
�0
�0
�0
0 � 2 � � � � � � � �0 �� �2 �� �� �� �� �� �� �� 20 2� 22 2�
Average 20�0
Lowest - Average - Peak month
0
10
20
30
40
50
60
70
0 1 2 3 4 5 6 7 8 9 10 11 12 13 14 15 16 17 18 19 20 21 22 23
Lowest
Average Month
Peak
0
�0
20
�0
�0
�0
�0
0 � 2 � � � � � � � �0 �� �2 �� �� �� �� �� �� �� 20 2� 22 2�
Lowest (April) Average (March) Peak (June)
Average on a yearly basis In a peak, low and average month
22 �00
20 000
�� �00
�� 000
�2 �00� 2 � � � � � � � �0 �� �2
Day 200�20�0
� 200
� 000
�00
�00
� �00
� �00
� 2 � � � � � � � �0 �� �2
Night 200�20�0
Day vs. night
* Including helicopter flights 143 144 0.7%
MOVEMENTS
Day traffic: 6.00 - 22.59 hours
Night traffic: 23.00 - 5.59 hours
➜
➜
➜
* Excludes days when operations were impacted by volcanic ash cloud (April 2010) and European airspace remained closed for several days.
➜
�0 BRUTRENDS 2010
Per aircraft size 2009 2010 '10 vs '09
Wide body 24 530 25 522 4.0%
Narrow body 169 530 169 129 -0.2%
Small body 17 854 10 719 -40.0%
General aviation & other 12 836 13 301 3.6%
Military 6 918 7 011 1.3%
Total 231 668 225 682 -2.6%
Wide body aircraft:
Commercial aircraft occupying
2 parking stands.
Narrow body aircraft:
Commercial aircraft occupying
1 parking stand.
Small body aircraft:
Commercial aircraft unable to dock in
at a contact gate.
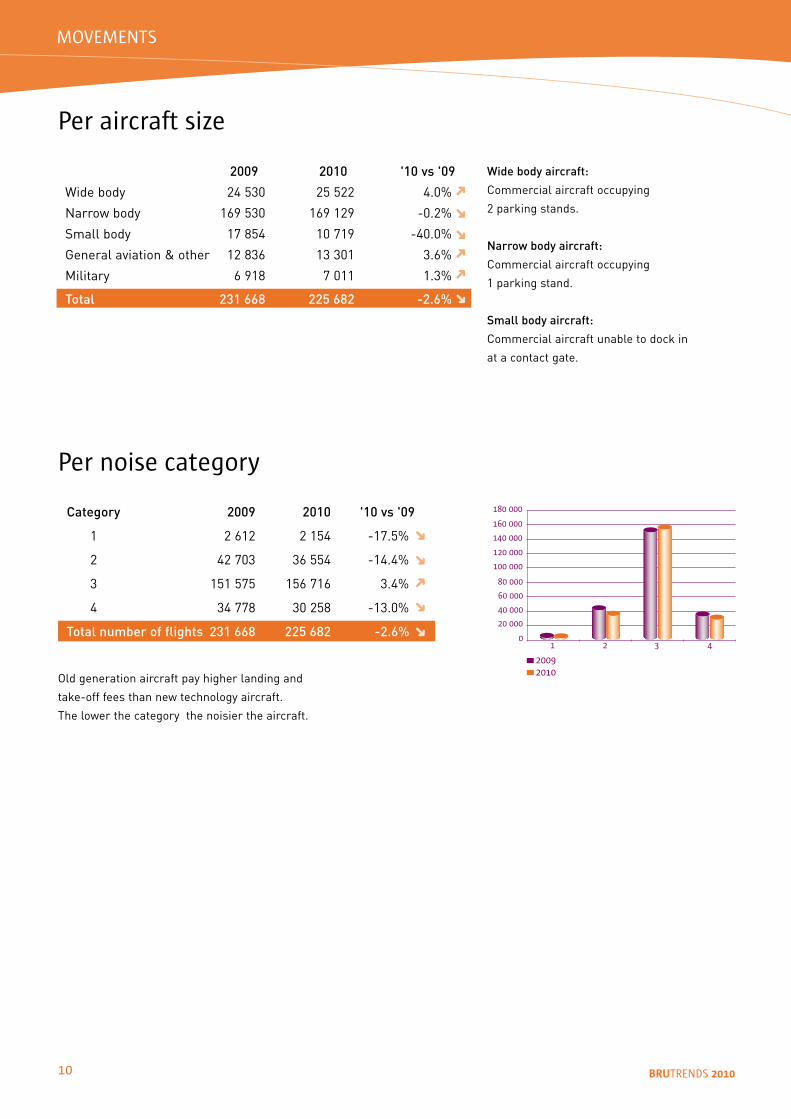
Per noise category
0
�0 000
�0 000
20 000
�0 000
�20 000
�00 000
��0 000
��0 000
��0 000
� 2 � �
200�20�0Old generation aircraft pay higher landing and
take-off fees than new technology aircraft.
The lower the category the noisier the aircraft.
MOVEMENTS
Category 2009 2010 '10 vs '09
1 2 612 2 154 -17.5%
2 42 703 36 554 -14.4%
3 151 575 156 716 3.4%
4 34 778 30 258 -13.0%
Total number of flights 231 668 225 682 -2.6%
➜
➜
➜
➜
➜
➜
➜
➜
➜
➜
➜
TITEL
�� BRUTRENDS 2010
0.�
0.2
�.0
�.�
�.�
�.2
0.�
0.�
2.0
�.�
0
In millions
200� 20�0
� 2 � � � � � � � �0 �� �2
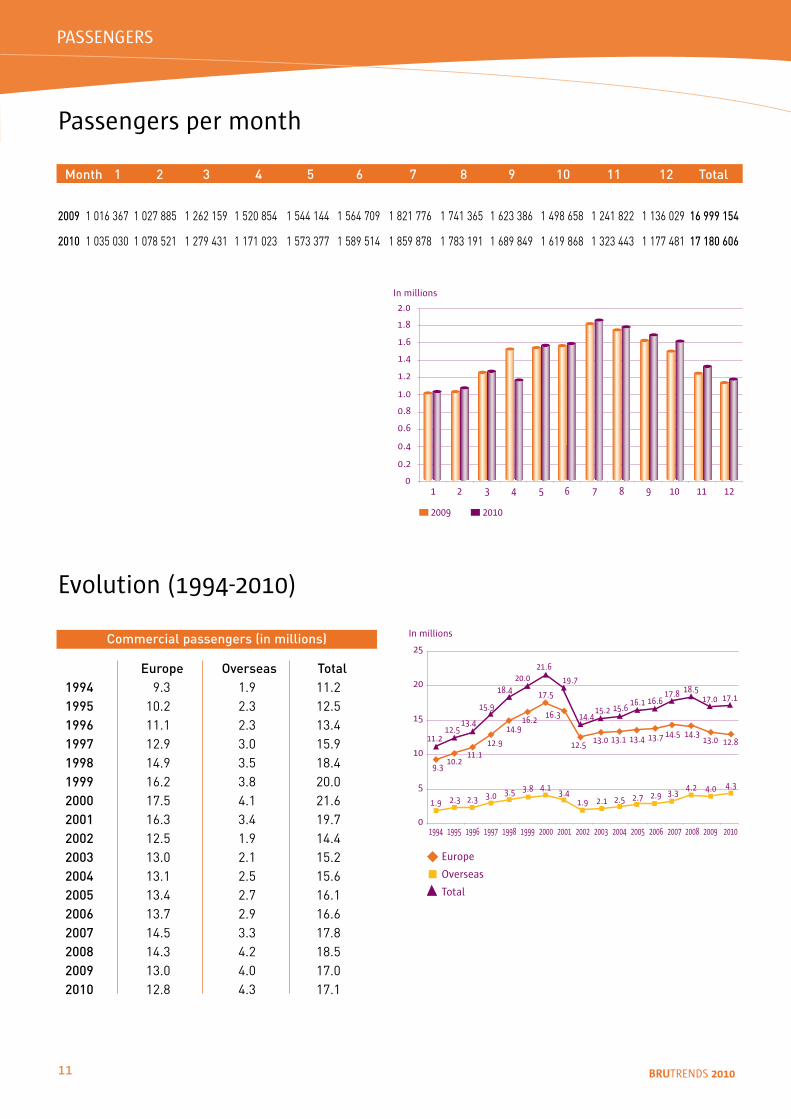
Passengers per month
Month 1 2 3 4 5 6 7 8 9 10 11 12 Total
2009 1 016 367 1 027 885 1 262 159 1 520 854 1 544 144 1 564 709 1 821 776 1 741 365 1 623 386 1 498 658 1 241 822 1 136 029 16 999 154
2010 1 035 030 1 078 521 1 279 431 1 171 023 1 573 377 1 589 514 1 859 878 1 783 191 1 689 849 1 619 868 1 323 443 1 177 481 17 180 606
Evolution (����-20�0)
�.��0.2
��.��2.�
��.���.2
��.�
��.�
�2.� ��.0
�.� 2.� 2.� �.0 �.� �.� �.��.�
�.� 2.� 2.� 2.�
��.2�2.�
��.�
��.�
��.�20.0
2�.�
��.�
��.���.2
0
�
�0
��
20
2�
���� ���� ���� ���� ���� ���� 2000 200� 2002 200� 200� 200� 200� 200� 200� 200�
Europe
Overseas
Total
��.0��.� ��.� ��.� ��.� ��.�
�.2 �.02.� �.�
��.���.0
20�0
�2.�
�.�
��.���.�
��.� ��.���.�
In millions
Europe Overseas Total 1994 9.3 1.9 11.2 1995 10.2 2.3 12.5 1996 11.1 2.3 13.4 1997 12.9 3.0 15.9 1998 14.9 3.5 18.4 1999 16.2 3.8 20.0 2000 17.5 4.1 21.6 2001 16.3 3.4 19.7 2002 12.5 1.9 14.4 2003 13.0 2.1 15.2 2004 13.1 2.5 15.6 2005 13.4 2.7 16.1 2006 13.7 2.9 16.6 2007 14.5 3.3 17.8 2008 14.3 4.2 18.5 2009 13.0 4.0 17.0 2010 12.8 4.3 17.1
Commercial passengers (in millions)
PASSENGERS
�2 BRUTRENDS 2010
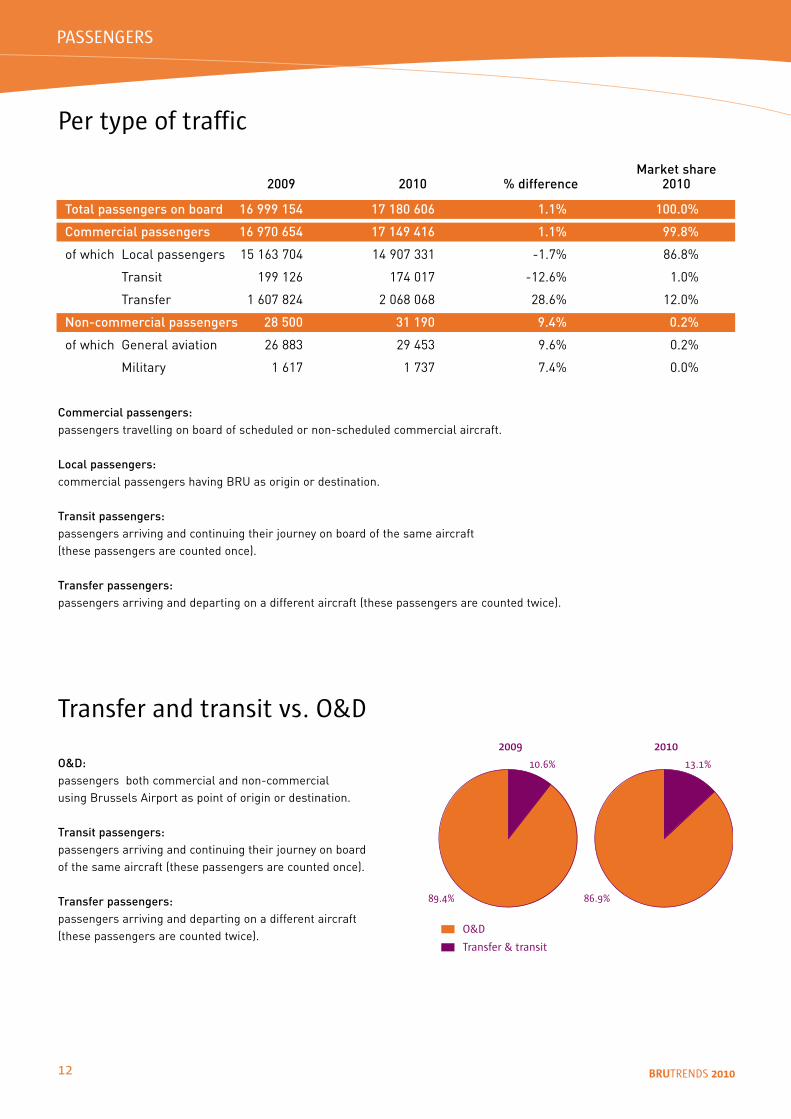
Per type of traffic
Transfer and transit vs. O&D
Market share 2009 2010 % difference 2010
Total passengers on board 16 999 154 17 180 606 1.1% 100.0%
Commercial passengers 16 970 654 17 149 416 1.1% 99.8%
of which Local passengers 15 163 704 14 907 331 -1.7% 86.8%
Transit 199 126 174 017 -12.6% 1.0%
Transfer 1 607 824 2 068 068 28.6% 12.0%
Non-commercial passengers 28 500 31 190 9.4% 0.2%
of which General aviation 26 883 29 453 9.6% 0.2%
Military 1 617 1 737 7.4% 0.0%
Commercial passengers: passengers travelling on board of scheduled or non-scheduled commercial aircraft.
Local passengers: commercial passengers having BRU as origin or destination.
Transit passengers: passengers arriving and continuing their journey on board of the same aircraft (these passengers are counted once).
Transfer passengers: passengers arriving and departing on a different aircraft (these passengers are counted twice).
O&D: passengers both commercial and non-commercial using Brussels Airport as point of origin or destination.
Transit passengers: passengers arriving and continuing their journey on board of the same aircraft (these passengers are counted once).
Transfer passengers: passengers arriving and departing on a different aircraft (these passengers are counted twice).
O&D
Transfer & transit
2010
��.�%
��.�%
2009
�0.�%
��.�%
PASSENGERS
TITEL
�� BRUTRENDS 2010
O&D
Transfer & transit
2010
��.�%
��.�%
2009
�0.�%
��.�%
Transfer and transit vs. O&D (continued)
0.�
0.2
�.0
�.�
�.�
�.�
�.2
0.�
0.�
0
Transfer & transitO&D
� 2 � � � � � � � �0 �� �2
In millions 2009
0.�
0.2
�.0
�.�
�.�
�.�
�.2
0.�
0.�
0
Transfer & transitO&D
� 2 � � � � � � � �0 �� �2
In millions 2010
2�.�%
��.�%
Europe
Overseas
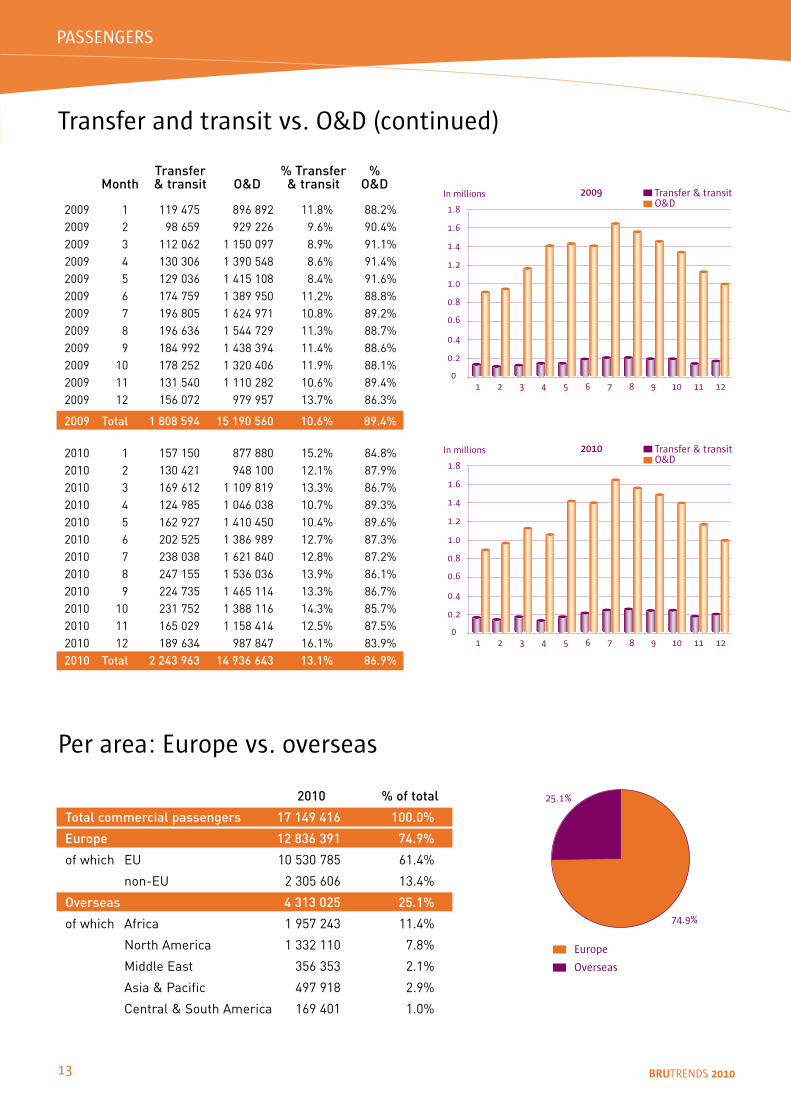
Per area: Europe vs. overseas
2010 % of total
Total commercial passengers 17 149 416 100.0%
Europe 12 836 391 74.9%
of which EU 10 530 785 61.4%
non-EU 2 305 606 13.4%
Overseas 4 313 025 25.1%
of which Africa 1 957 243 11.4%
North America 1 332 110 7.8%
Middle East 356 353 2.1%
Asia & Pacific 497 918 2.9%
Central & South America 169 401 1.0%
Transfer % Transfer % Month & transit O&D & transit O&D
2009 1 119 475 896 892 11.8% 88.2% 2009 2 98 659 929 226 9.6% 90.4% 2009 3 112 062 1 150 097 8.9% 91.1% 2009 4 130 306 1 390 548 8.6% 91.4% 2009 5 129 036 1 415 108 8.4% 91.6% 2009 6 174 759 1 389 950 11.2% 88.8% 2009 7 196 805 1 624 971 10.8% 89.2% 2009 8 196 636 1 544 729 11.3% 88.7% 2009 9 184 992 1 438 394 11.4% 88.6% 2009 10 178 252 1 320 406 11.9% 88.1% 2009 11 131 540 1 110 282 10.6% 89.4% 2009 12 156 072 979 957 13.7% 86.3%
2009 Total 1 808 594 15 190 560 10.6% 89.4%
2010 1 157 150 877 880 15.2% 84.8% 2010 2 130 421 948 100 12.1% 87.9% 2010 3 169 612 1 109 819 13.3% 86.7% 2010 4 124 985 1 046 038 10.7% 89.3% 2010 5 162 927 1 410 450 10.4% 89.6% 2010 6 202 525 1 386 989 12.7% 87.3% 2010 7 238 038 1 621 840 12.8% 87.2% 2010 8 247 155 1 536 036 13.9% 86.1% 2010 9 224 735 1 465 114 13.3% 86.7% 2010 10 231 752 1 388 116 14.3% 85.7% 2010 11 165 029 1 158 414 12.5% 87.5% 2010 12 189 634 987 847 16.1% 83.9% 2010 Total 2 243 963 14 936 643 13.1% 86.9%
PASSENGERS
�� BRUTRENDS 2010
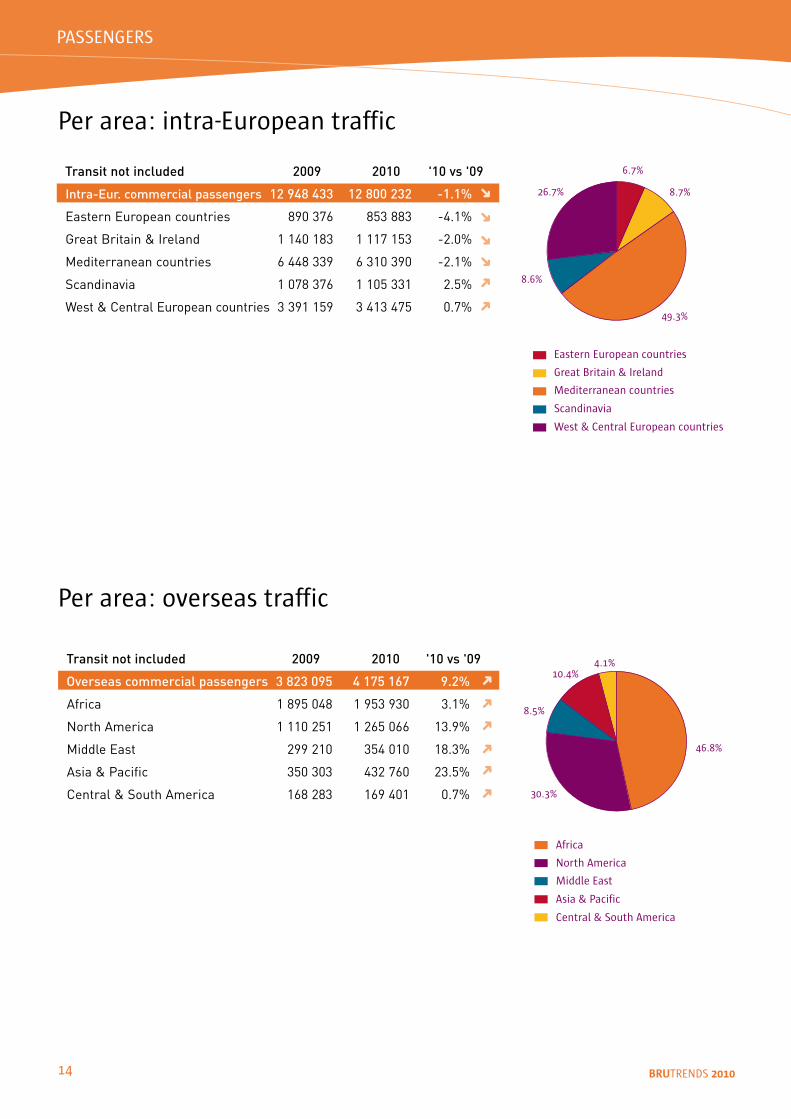
Per area: intra-European traffic
�.�%
�.�%
��.�%
�.�%
2�.�%
Eastern European countries
Great Britain & Ireland
Mediterranean countries
Scandinavia
West & Central European countries
Transit not included 2009 2010 '10 vs '09
Intra-Eur. commercial passengers 12 948 433 12 800 232 -1.1%
Eastern European countries 890 376 853 883 -4.1%
Great Britain & Ireland 1 140 183 1 117 153 -2.0%
Mediterranean countries 6 448 339 6 310 390 -2.1%
Scandinavia 1 078 376 1 105 331 2.5%
West & Central European countries 3 391 159 3 413 475 0.7%
Per area: overseas traffic
➜
Africa
North America
Middle East
Asia & Pacific
Central & South America
�.�%
��.�%
�0.�%
�.�%
�0.�%
Transit not included 2009 2010 '10 vs '09
Overseas commercial passengers 3 823 095 4 175 167 9.2%
Africa 1 895 048 1 953 930 3.1%
North America 1 110 251 1 265 066 13.9%
Middle East 299 210 354 010 18.3%
Asia & Pacific 350 303 432 760 23.5%
Central & South America 168 283 169 401 0.7%
➜
➜
➜
PASSENGERS
➜
➜
➜
➜
➜
➜
➜
➜
TITEL
�� BRUTRENDS 2010
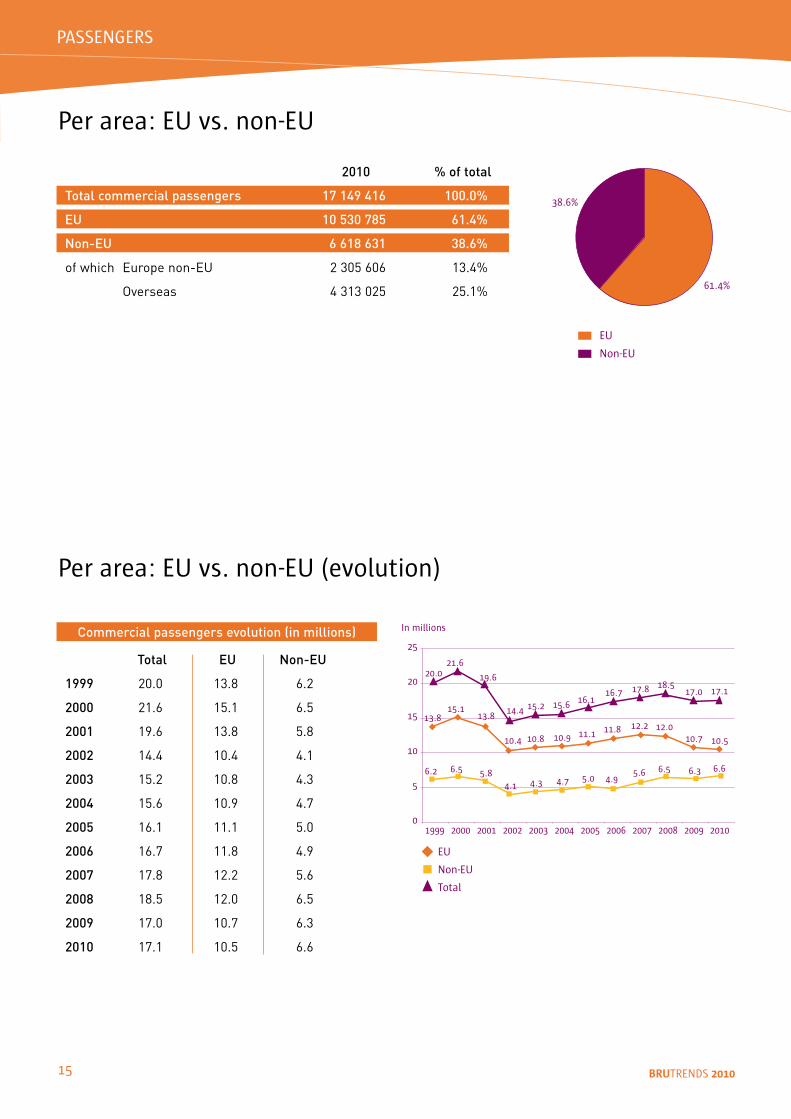
Per area: EU vs. non-EU
��.�%
��.�%
EU
Non-EU
2010 % of total
Total commercial passengers 17 149 416 100.0%
EU 10 530 785 61.4%
Non-EU 6 618 631 38.6%
of which Europe non-EU 2 305 606 13.4%
Overseas 4 313 025 25.1%
20.02�.�
��.�
��.���.�
��.���.�
�0.�
�.2 �.� �.��.�
���� 2000 200� 2002 200� 200� 200� 200� 200� 200� 200�0
�
�0
��
20
2�
EU
Non-EU
Total
In millions
�.� �.��.�
��.�
��.2 ��.� ��.���.� ��.0��.�
�0.� �0.�
20�0
��.�
�0.��0.� ��.� ��.� �2.2 �2.0
�.� �.� �.0 �.��.�
Per area: EU vs. non-EU (evolution)
Total EU Non-EU
1999 20.0 13.8 6.2
2000 21.6 15.1 6.5
2001 19.6 13.8 5.8
2002 14.4 10.4 4.1
2003 15.2 10.8 4.3
2004 15.6 10.9 4.7
2005 16.1 11.1 5.0
2006 16.7 11.8 4.9
2007 17.8 12.2 5.6
2008 18.5 12.0 6.5
2009 17.0 10.7 6.3
2010 17.1 10.5 6.6
Commercial passengers evolution (in millions)
PASSENGERS
�� BRUTRENDS 2010
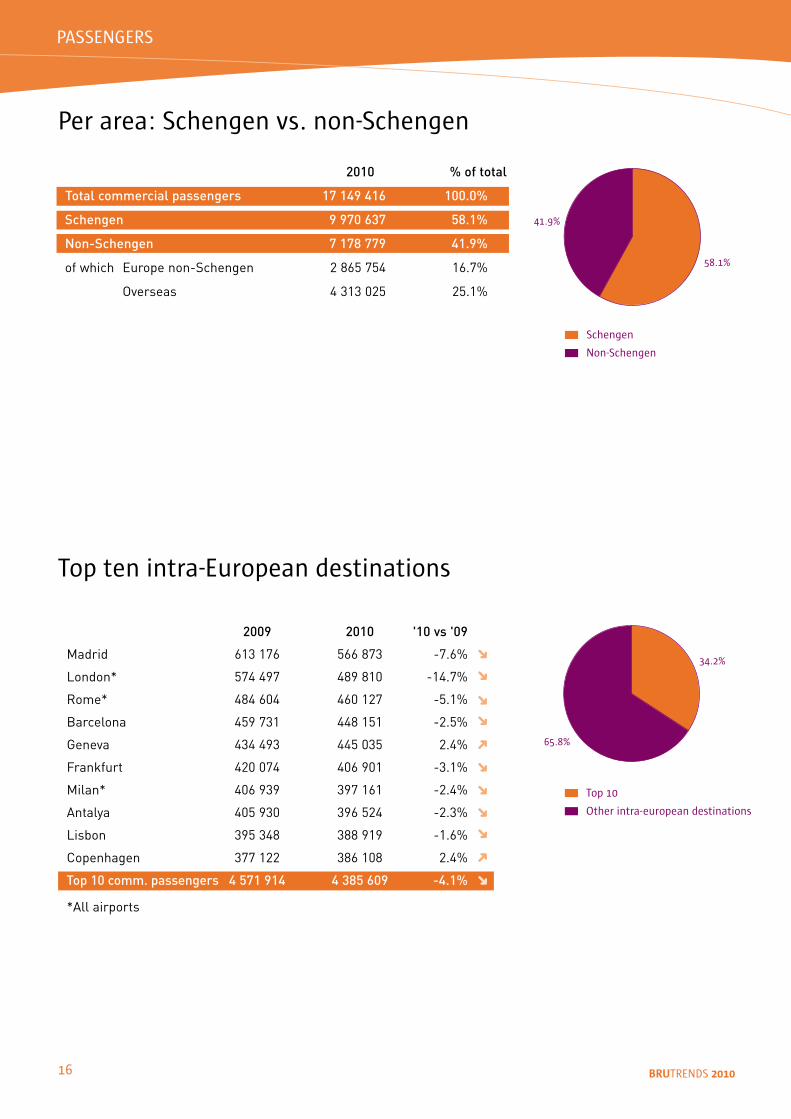
Per area: Schengen vs. non-Schengen
��.2%
��.�%
Top �0
Other intra-european destinations
Top ten intra-European destinations
��.�%
��.�%
Schengen
Non-Schengen
2010 % of total
Total commercial passengers 17 149 416 100.0%
Schengen 9 970 637 58.1%
Non-Schengen 7 178 779 41.9%
of which Europe non-Schengen 2 865 754 16.7%
Overseas 4 313 025 25.1%
2009 2010 '10 vs '09
Madrid 613 176 566 873 -7.6%
London* 574 497 489 810 -14.7%
Rome* 484 604 460 127 -5.1%
Barcelona 459 731 448 151 -2.5%
Geneva 434 493 445 035 2.4%
Frankfurt 420 074 406 901 -3.1%
Milan* 406 939 397 161 -2.4%
Antalya 405 930 396 524 -2.3%
Lisbon 395 348 388 919 -1.6%
Copenhagen 377 122 386 108 2.4%
Top 10 comm. passengers 4 571 914 4 385 609 -4.1%
*All airports
➜
➜
➜
➜
➜
PASSENGERS
➜
➜
➜
➜
➜
➜
TITEL
�� BRUTRENDS 2010
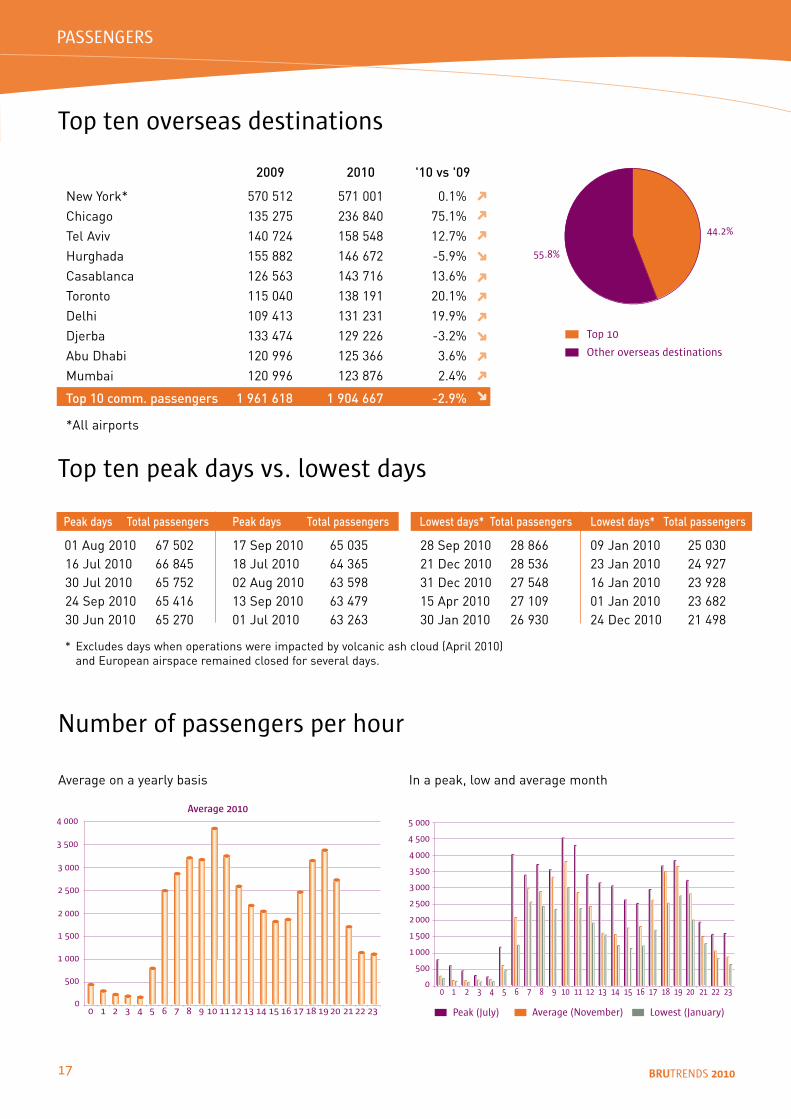
Top ten overseas destinations
��.2%
��.�%
Top �0
Other overseas destinations
2009 2010 '10 vs '09
New York* 570 512 571 001 0.1% Chicago 135 275 236 840 75.1% Tel Aviv 140 724 158 548 12.7% Hurghada 155 882 146 672 -5.9% Casablanca 126 563 143 716 13.6% Toronto 115 040 138 191 20.1% Delhi 109 413 131 231 19.9% Djerba 133 474 129 226 -3.2% Abu Dhabi 120 996 125 366 3.6% Mumbai 120 996 123 876 2.4%
Top 10 comm. passengers 1 961 618 1 904 667 -2.9%
*All airports
Top ten peak days vs. lowest days
Peak days Total passengers
01 Aug 2010 67 502 16 Jul 2010 66 845 30 Jul 2010 65 752 24 Sep 2010 65 416 30 Jun 2010 65 270
Peak days Total passengers
17 Sep 2010 65 03518 Jul 2010 64 36502 Aug 2010 63 59813 Sep 2010 63 47901 Jul 2010 63 263
Lowest days* Total passengers
28 Sep 2010 28 866 21 Dec 2010 28 536 31 Dec 2010 27 548 15 Apr 2010 27 109 30 Jan 2010 26 930
Lowest days* Total passengers
09 Jan 2010 25 03023 Jan 2010 24 92716 Jan 2010 23 92801 Jan 2010 23 68224 Dec 2010 21 498
Number of passengers per hour
0
� 000
�00
� �00
2 000
2 �00
� 000
� �00
� 000
0 � 2 � � � � � � � �0 �� �2 �� �� �� �� �� �� �� 20 2� 22 2�
Average 2010� 000
� �00
� 000
� �00
� 000
2 �00
2 000
� �00
� 000
�00
00 � 2 � � � � � � � �0 �� �2 �� �� �� �� �� �� �� 20 2� 22 2�
Average (November)Peak (July) Lowest (January)
Average on a yearly basis In a peak, low and average month
➜
➜
PASSENGERS
➜
➜
➜
➜
➜
➜
➜
➜
➜
* Excludes days when operations were impacted by volcanic ash cloud (April 2010) and European airspace remained closed for several days.
�� BRUTRENDS 2010
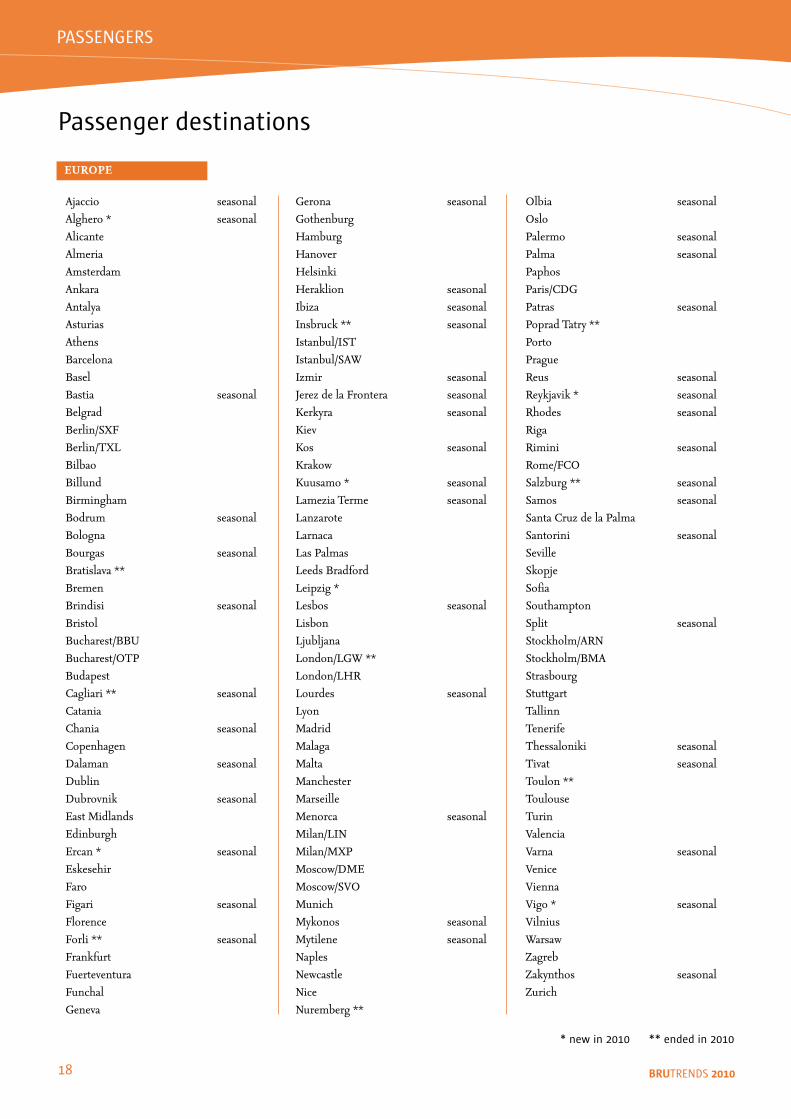
Passenger destinations
Ajaccio seasonalAlghero* seasonalAlicanteAlmeriaAmsterdamAnkaraAntalyaAsturiasAthensBarcelonaBaselBastia seasonalBelgradBerlin/SXFBerlin/TXLBilbaoBillundBirminghamBodrum seasonalBolognaBourgas seasonalBratislava**BremenBrindisi seasonalBristolBucharest/BBUBucharest/OTPBudapestCagliari** seasonalCataniaChania seasonalCopenhagenDalaman seasonalDublinDubrovnik seasonalEastMidlandsEdinburghErcan* seasonalEskesehir FaroFigari seasonalFlorenceForli** seasonalFrankfurtFuerteventuraFunchalGeneva
Gerona seasonalGothenburgHamburgHanoverHelsinkiHeraklion seasonalIbiza seasonalInsbruck** seasonalIstanbul/ISTIstanbul/SAWIzmir seasonalJerezdelaFrontera seasonalKerkyra seasonalKievKos seasonalKrakowKuusamo* seasonalLameziaTerme seasonalLanzaroteLarnacaLasPalmasLeedsBradfordLeipzig*Lesbos seasonalLisbonLjubljanaLondon/LGW**London/LHRLourdes seasonalLyonMadridMalagaMaltaManchesterMarseilleMenorca seasonalMilan/LINMilan/MXPMoscow/DMEMoscow/SVOMunichMykonos seasonalMytilene seasonalNaplesNewcastleNiceNuremberg**
Olbia seasonalOsloPalermo seasonalPalma seasonalPaphosParis/CDGPatras seasonalPopradTatry**PortoPragueReus seasonalReykjavik* seasonalRhodes seasonalRigaRimini seasonalRome/FCOSalzburg** seasonalSamos seasonalSantaCruzdelaPalmaSantorini seasonalSevilleSkopjeSofiaSouthamptonSplit seasonalStockholm/ARNStockholm/BMAStrasbourgStuttgartTallinnTenerifeThessaloniki seasonalTivat seasonalToulon**ToulouseTurinValenciaVarna seasonalVeniceViennaVigo* seasonalVilniusWarsawZagrebZakynthos seasonalZurich
EUROPE
* new in 20�0 ** ended in 20�0
PASSENGERS
TITEL
�� BRUTRENDS 2010
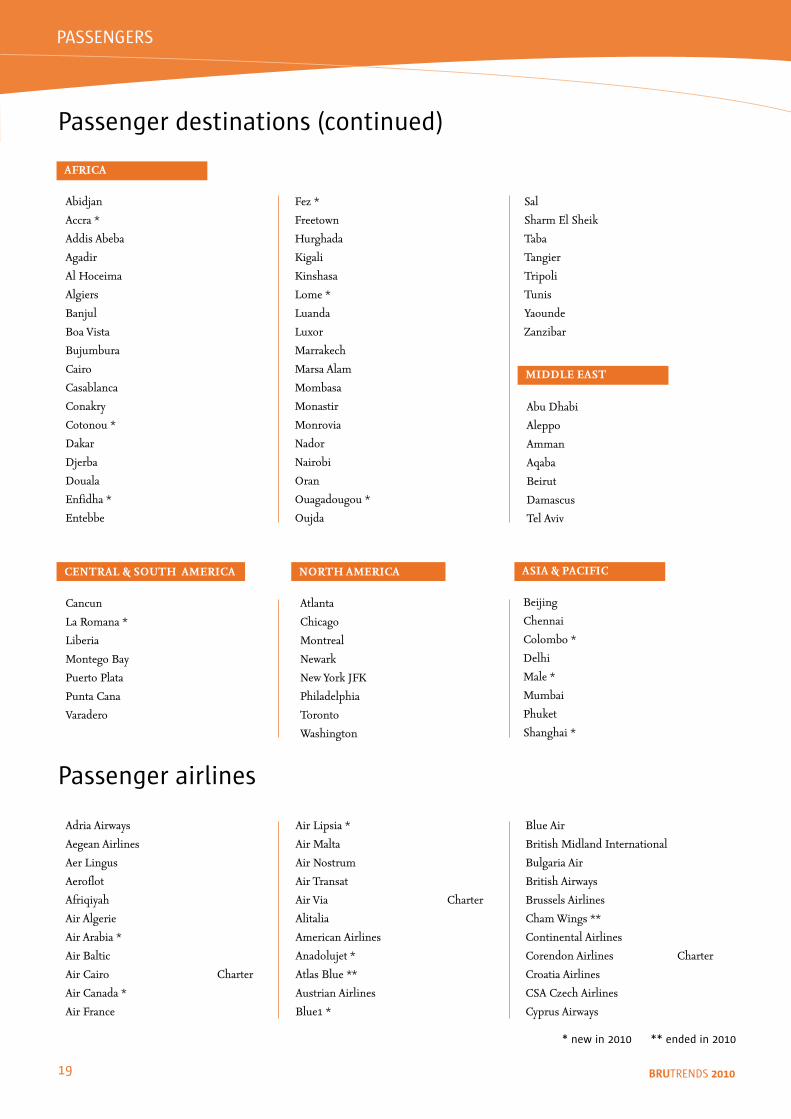
Passenger destinations (continued)
Abidjan
Accra*
AddisAbeba
Agadir
AlHoceima
Algiers
Banjul
BoaVista
Bujumbura
Cairo
Casablanca
Conakry
Cotonou*
Dakar
Djerba
Douala
Enfidha*
Entebbe
Fez*
Freetown
Hurghada
Kigali
Kinshasa
Lome*
Luanda
Luxor
Marrakech
MarsaAlam
Mombasa
Monastir
Monrovia
Nador
Nairobi
Oran
Ouagadougou*
Oujda
Sal
SharmElSheik
Taba
Tangier
Tripoli
Tunis
Yaounde
Zanzibar
AFRICA
Beijing
Chennai
Colombo*
Delhi
Male*
Mumbai
Phuket
Shanghai*
ASIA & PACIFIC
AbuDhabi
Aleppo
Amman
Aqaba
Beirut
Damascus
TelAviv
MIDDLE EAST
Cancun
LaRomana*
Liberia
MontegoBay
PuertoPlata
PuntaCana
Varadero
CENTRAL & SOUTH AMERICA
Atlanta
Chicago
Montreal
Newark
NewYorkJFK
Philadelphia
Toronto
Washington
NORTH AMERICA
Passenger airlines
AdriaAirways
AegeanAirlines
AerLingus
Aeroflot
Afriqiyah
AirAlgerie
AirArabia*
AirBaltic
AirCairo Charter
AirCanada*
AirFrance
AirLipsia*
AirMalta
AirNostrum
AirTransat
AirVia Charter
Alitalia
AmericanAirlines
Anadolujet*
AtlasBlue**
AustrianAirlines
Blue�*
BlueAir
BritishMidlandInternational
BulgariaAir
BritishAirways
BrusselsAirlines
ChamWings**
ContinentalAirlines
CorendonAirlines Charter
CroatiaAirlines
CSACzechAirlines
CyprusAirways
* new in 20�0 ** ended in 20�0
PASSENGERS
20 BRUTRENDS 2010
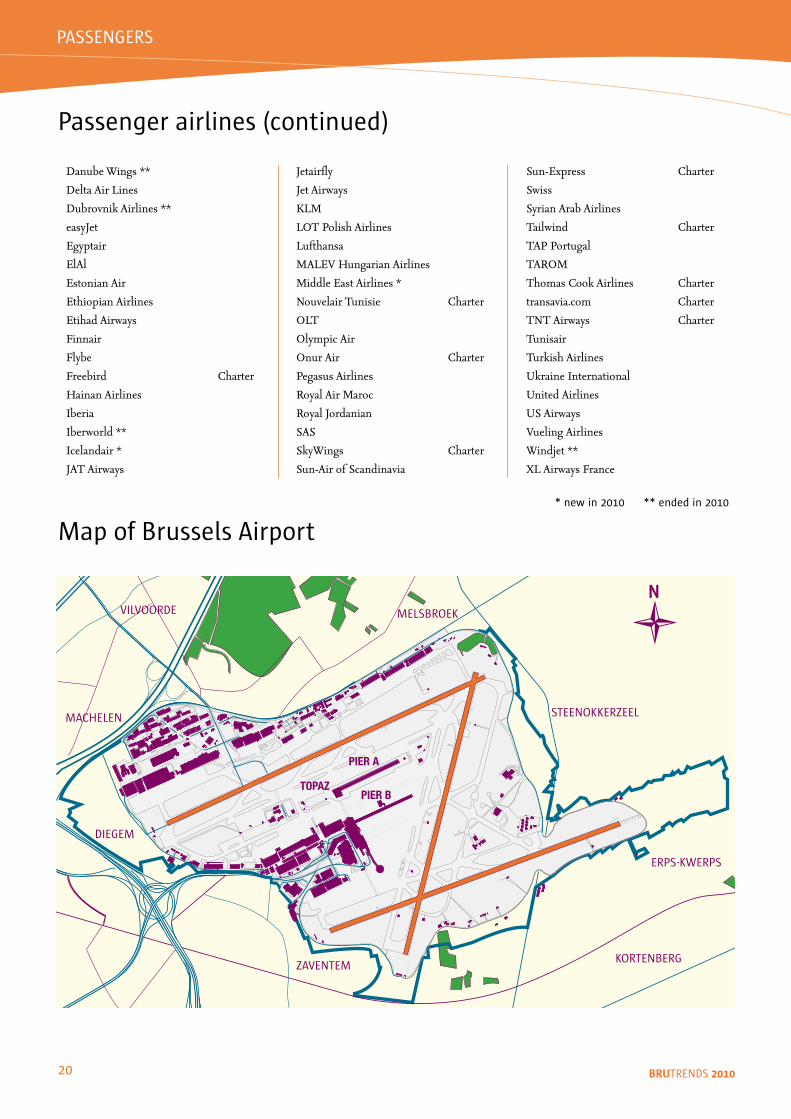
Map of Brussels Airport
MACHELEN
ERPS-KWERPS
STEENOKKERZEEL
MELSBROEK
KORTENBERGZAVENTEM
DIEGEM
VILVOORDEN
Passenger airlines (continued)
DanubeWings**
DeltaAirLines
DubrovnikAirlines**
easyJet
Egyptair
ElAl
EstonianAir
EthiopianAirlines
EtihadAirways
Finnair
Flybe
Freebird Charter
HainanAirlines
Iberia
Iberworld**
Icelandair*
JATAirways
Jetairfly
JetAirways
KLM
LOTPolishAirlines
Lufthansa
MALEVHungarianAirlines
MiddleEastAirlines*
NouvelairTunisie Charter
OLT
OlympicAir
OnurAir Charter
PegasusAirlines
RoyalAirMaroc
RoyalJordanian
SAS
SkyWings Charter
Sun-AirofScandinavia
Sun-Express Charter
Swiss
SyrianArabAirlines
Tailwind Charter
TAPPortugal
TAROM
ThomasCookAirlines Charter
transavia.com Charter
TNTAirways Charter
Tunisair
TurkishAirlines
UkraineInternational
UnitedAirlines
USAirways
VuelingAirlines
Windjet**
XLAirwaysFrance
* new in 20�0 ** ended in 20�0
PASSENGERS
TITEL
2� BRUTRENDS 2010
�0 000
�0 000
20 000
�0 000
0
�0 000
�0 000
In tons
200� 20�0
� 2 � � � � � � � �0 �� �2
�00 000
200 000
�00 000
0
�00 000
�00 000
�00 000
�00 000
�00 000
In tons
2000 200� 2002 200� 200� 200� 200� 200� 20�0200�200�
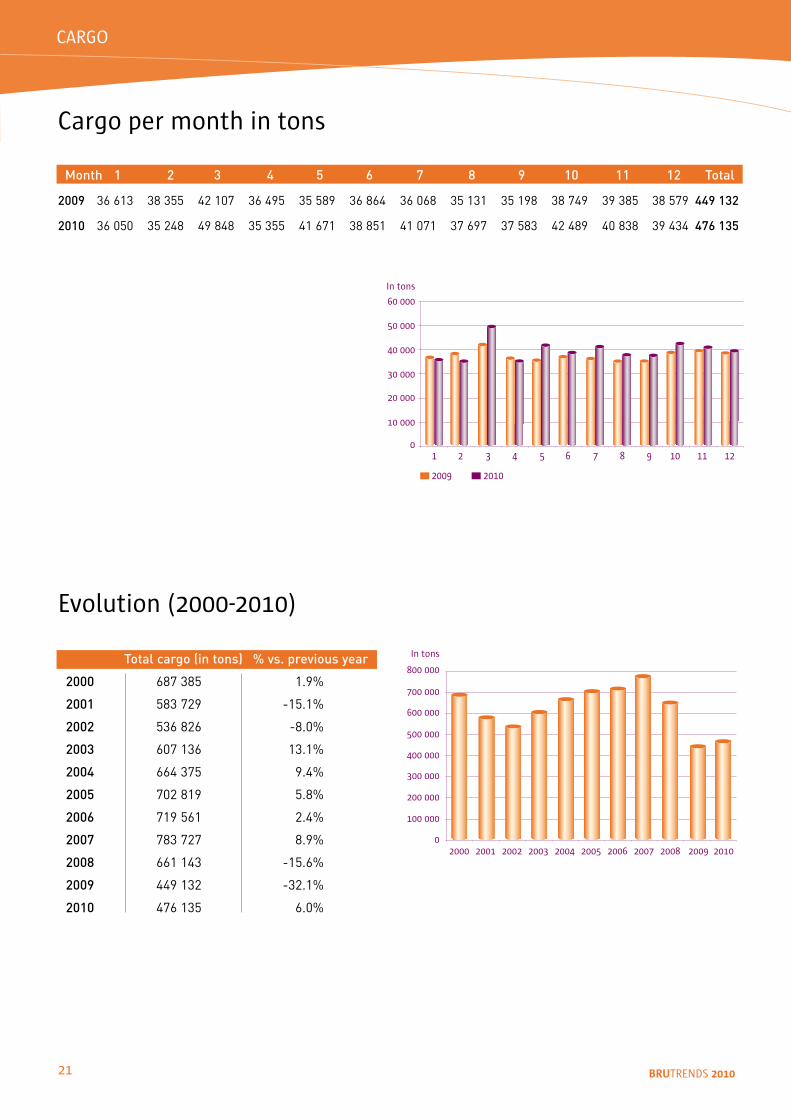
Cargo per month in tons
Month 1 2 3 4 5 6 7 8 9 10 11 12 Total
2009 36 613 38 355 42 107 36 495 35 589 36 864 36 068 35 131 35 198 38 749 39 385 38 579 449 132
2010 36 050 35 248 49 848 35 355 41 671 38 851 41 071 37 697 37 583 42 489 40 838 39 434 476 135
Evolution (2000-20�0)
Total cargo (in tons) % vs. previous year
2000 687 385 1.9%
2001 583 729 -15.1%
2002 536 826 -8.0%
2003 607 136 13.1%
2004 664 375 9.4%
2005 702 819 5.8%
2006 719 561 2.4%
2007 783 727 8.9%
2008 661 143 -15.6%
2009 449 132 -32.1%
2010 476 135 6.0%
CARGO
22 BRUTRENDS 2010
��.�%
22.�%
2�.�%
��.�%
0.�%
Africa
North America
Middle East
Asia & Pacific
Central & South America
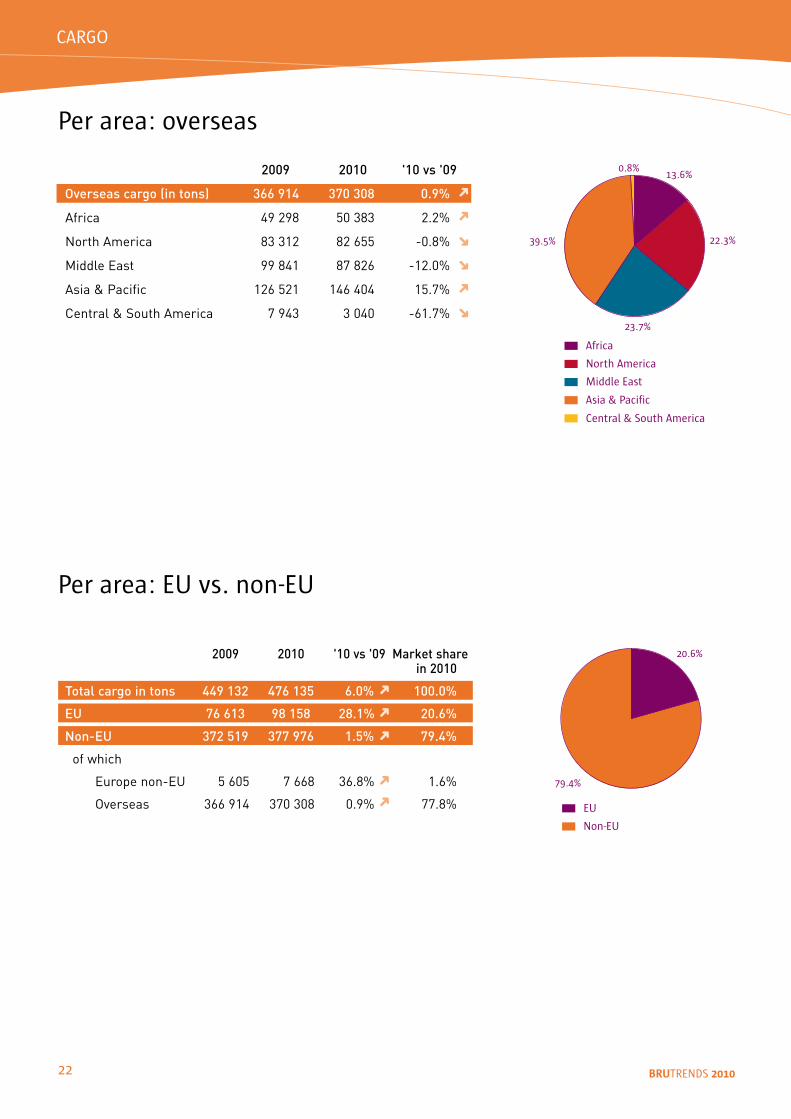
Per area: overseas
2009 2010 '10 vs '09
Overseas cargo (in tons) 366 914 370 308 0.9%
Africa 49 298 50 383 2.2%
North America 83 312 82 655 -0.8%
Middle East 99 841 87 826 -12.0%
Asia & Pacific 126 521 146 404 15.7%
Central & South America 7 943 3 040 -61.7%
��.�%
20.�%
EU
Non-EU
Per area: EU vs. non-EU
2009 2010 '10 vs '09 Market share in 2010
Total cargo in tons 449 132 476 135 6.0% 100.0%
EU 76 613 98 158 28.1% 20.6%
Non-EU 372 519 377 976 1.5% 79.4%
of which
Europe non-EU 5 605 7 668 36.8% 1.6%
Overseas 366 914 370 308 0.9% 77.8%
➜
➜
➜
CARGO
➜
➜
➜
➜
➜
➜
➜
➜
2� BRUTRENDS 2010
22.2%
��.�%
Europe
Overseas
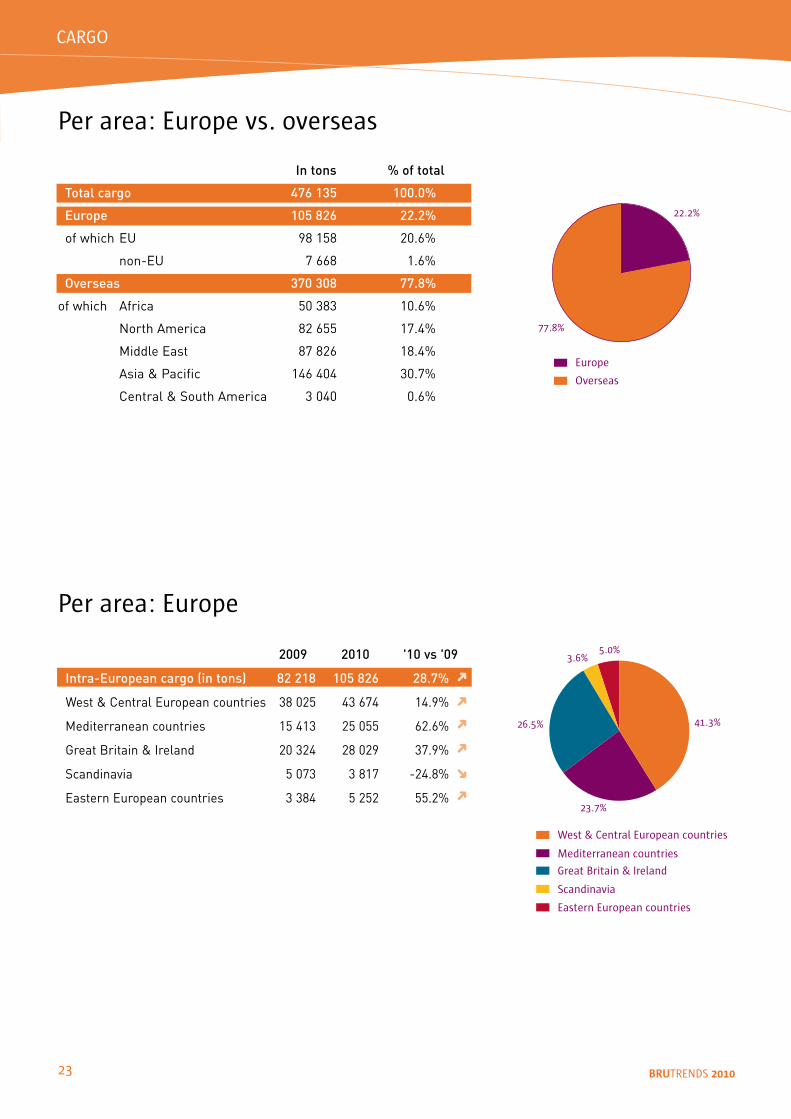
Per area: Europe vs. overseas
Eastern European countries
Great Britain & Ireland
Mediterranean countries
Scandinavia
West & Central European countries
��.�%
2�.�%
2�.�%
�.�%�.0%
Per area: Europe
In tons % of total
Total cargo 476 135 100.0%
Europe 105 826 22.2%
of which EU 98 158 20.6%
non-EU 7 668 1.6%
Overseas 370 308 77.8%
of which Africa 50 383 10.6%
North America 82 655 17.4%
Middle East 87 826 18.4%
Asia & Pacific 146 404 30.7%
Central & South America 3 040 0.6%
2009 2010 '10 vs '09
Intra-European cargo (in tons) 82 218 105 826 28.7%
West & Central European countries 38 025 43 674 14.9%
Mediterranean countries 15 413 25 055 62.6%
Great Britain & Ireland 20 324 28 029 37.9%
Scandinavia 5 073 3 817 -24.8%
Eastern European countries 3 384 5 252 55.2%
➜
➜
➜
CARGO
➜
➜
➜
2� BRUTRENDS 2010
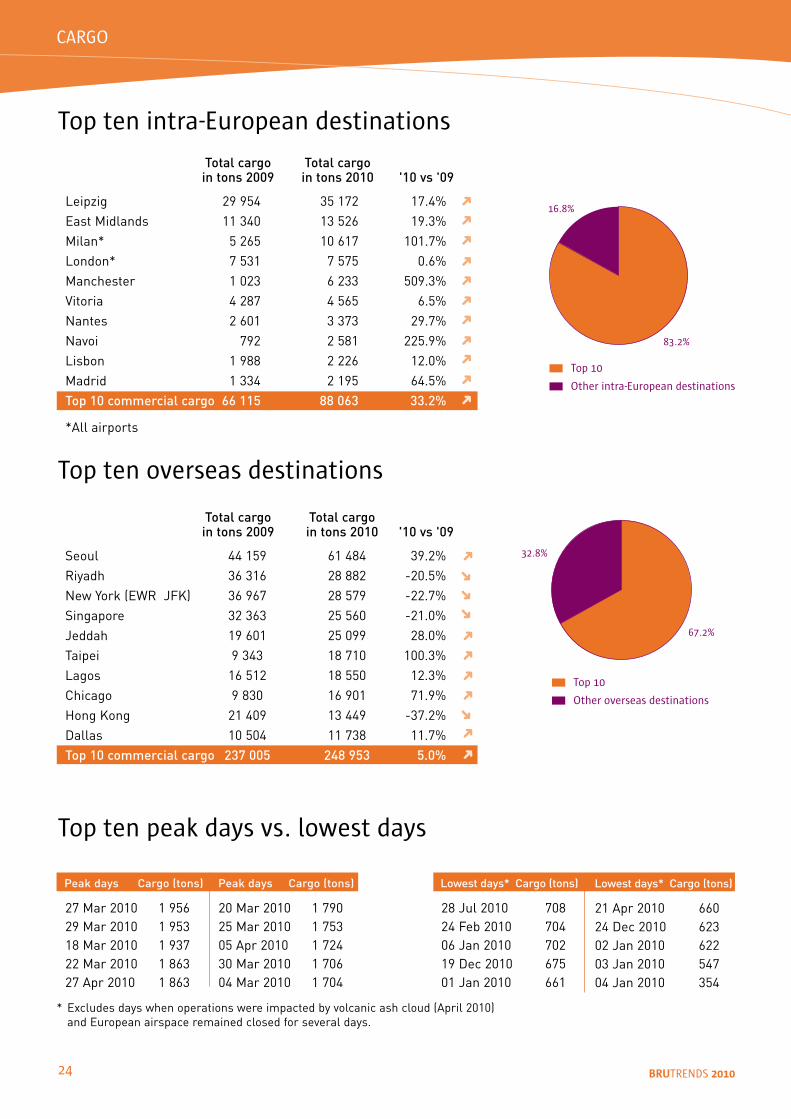
Total cargo Total cargo in tons 2009 in tons 2010 '10 vs '09
Seoul 44 159 61 484 39.2% Riyadh 36 316 28 882 -20.5% New York (EWR JFK) 36 967 28 579 -22.7% Singapore 32 363 25 560 -21.0% Jeddah 19 601 25 099 28.0% Taipei 9 343 18 710 100.3% Lagos 16 512 18 550 12.3% Chicago 9 830 16 901 71.9% Hong Kong 21 409 13 449 -37.2% Dallas 10 504 11 738 11.7% Top 10 commercial cargo 237 005 248 953 5.0%
Total cargo Total cargo in tons 2009 in tons 2010 '10 vs '09
Leipzig 29 954 35 172 17.4% East Midlands 11 340 13 526 19.3% Milan* 5 265 10 617 101.7% London* 7 531 7 575 0.6% Manchester 1 023 6 233 509.3% Vitoria 4 287 4 565 6.5% Nantes 2 601 3 373 29.7% Navoi 792 2 581 225.9% Lisbon 1 988 2 226 12.0% Madrid 1 334 2 195 64.5% Top 10 commercial cargo 66 115 88 063 33.2%
*All airports
��.2%
��.�%
Top �0
Other intra-European destinations
Top ten intra-European destinations
��.2%
�2.�%
Top �0
Other overseas destinations
Top ten overseas destinations
➜
Top ten peak days vs. lowest days
Peak days Cargo (tons)
27 Mar 2010 1 956 29 Mar 2010 1 953 18 Mar 2010 1 937 22 Mar 2010 1 863 27 Apr 2010 1 863
Peak days Cargo (tons)
20 Mar 2010 1 790 25 Mar 2010 1 753 05 Apr 2010 1 724 30 Mar 2010 1 706 04 Mar 2010 1 704
Lowest days* Cargo (tons)
28 Jul 2010 708 24 Feb 2010 704 06 Jan 2010 702 19 Dec 2010 675 01 Jan 2010 661
Lowest days* Cargo (tons)
21 Apr 2010 660 24 Dec 2010 623 02 Jan 2010 622 03 Jan 2010 547 04 Jan 2010 354
➜
➜
➜
➜
CARGO
➜
➜
➜
➜
➜
➜
➜
➜
➜
➜
➜
➜
➜
➜
➜
➜
➜
* Excludes days when operations were impacted by volcanic ash cloud (April 2010) and European airspace remained closed for several days.
TITEL
2� BRUTRENDS 2010
Cargo destinations
Barcelona
Copenhagen
EastMidlands
Guernsey
Helsinki
Jonkoping
Lisbon
London/LHR
London/LTN
Madrid
Manchester
Milan/Bergamo
Nantes
Vienna
Vitoria
Algiers
Casablanca
Lagos
Lome**
Mitiga*
Delhi
HongKong
Mumbai
Navoi
Seoul
Singapore
Taipei
Amman
Bahrain
Dammam
Dubai
Jeddah
Riyadh
Sharjah
Chicago
Dallas/FortWorth
Houston
LosAngeles
NewYorkJFK
EUROPE
ASIA
MIDDLE EAST
NORTH AMERICA
Cargo airlines
ABXAir
Aerologic*
AfricaWest**
AirAlgerieCargo
AtlanticAirlines
AsianaAirlinesCargo
CathayPacificCargo
Demavia**
EgyptairCargo*
EuropeanAirTransport
EVAAirways
KalittaAirways
KoreanAirCargo
RoyalAirMarocCargo
RoyalJordanianCargo
SaudiaArabianAirlinesCargo
SingaporeAirlinesCargo
TNTAirways
* new in 20�0 ** ended in 20�0
AFRICA
CARGO
2� BRUTRENDS 2010
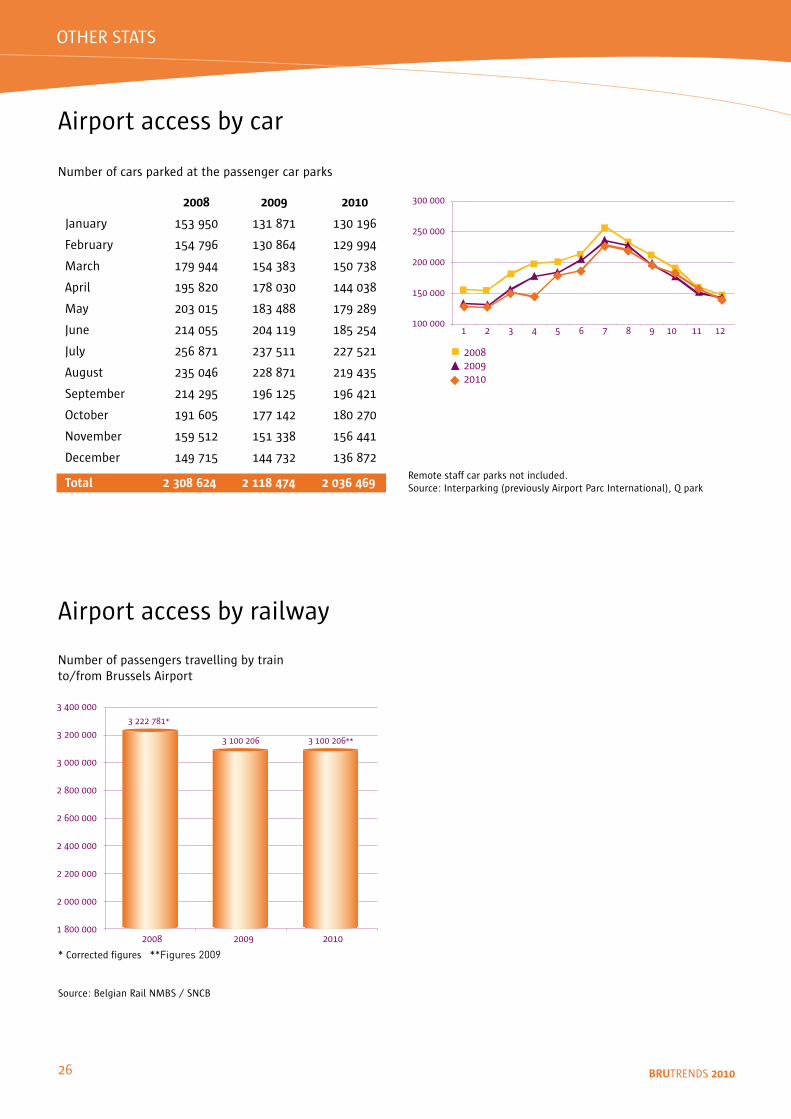
Airport access by car
��0 000
�00 000
200 000
2�0 000
�00 000
� 2 � � � � � � � �0 �� �2
200�200�20�0
Number of cars parked at the passenger car parks
Remote staff car parks not included.Source: Interparking (previously Airport Parc International), Q park
2008 2009 2010
January ��� ��0 ��� ��� ��0 ���
February ��� ��� ��0 ��� �2� ���
March ��� ��� ��� ��� ��0 ���
April ��� �20 ��� 0�0 ��� 0��
May 20� 0�� ��� ��� ��� 2��
June 2�� 0�� 20� ��� ��� 2��
July 2�� ��� 2�� ��� 22� �2�
August 2�� 0�� 22� ��� 2�� ���
September 2�� 2�� ��� �2� ��� �2�
October ��� �0� ��� ��2 ��0 2�0
November ��� ��2 ��� ��� ��� ���
December ��� ��� ��� ��2 ��� ��2
Total 2308624 2118474 2036469
* Corrected figures **Figures 2009
Source: Belgian Rail NMBS / SNCB
Airport access by railway
� �00 000
� 200 000
� 000 000
2 �00 000
2 �00 000
2 �00 000
2 200 000
2 000 000
� �00 000200� 200�
� �00 20� � �00 20�**
20�0
� 222 ���*
Number of passengers travelling by train to/from Brussels Airport
OTHER STATS
2� BRUTRENDS 2010
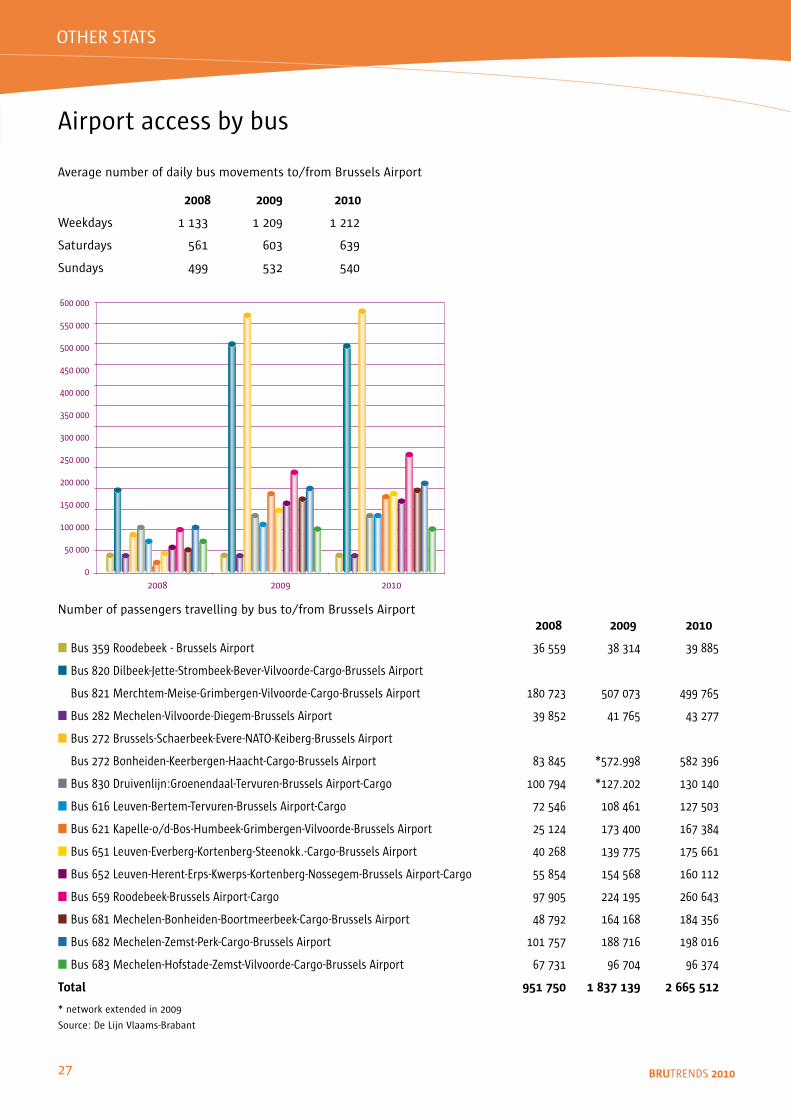
Airport access by bus
OTHER STATS
Average number of daily bus movements to/from Brussels Airport 2008 2009 2010
Weekdays � ��� � 20� � 2�2
Saturdays ��� �0� ���
Sundays ��� ��2 ��0
Number of passengers travelling by bus to/from Brussels Airport 2008 2009 2010
n Bus ��� Roodebeek - Brussels Airport �� ��� �� ��� �� ���
n Bus �20 Dilbeek-Jette-Strombeek-Bever-Vilvoorde-Cargo-Brussels Airport
n Bus �2� Merchtem-Meise-Grimbergen-Vilvoorde-Cargo-Brussels Airport ��0 �2� �0� 0�� ��� ���
n Bus 2�2 Mechelen-Vilvoorde-Diegem-Brussels Airport �� ��2 �� ��� �� 2��
n Bus 2�2 Brussels-Schaerbeek-Evere-NATO-Keiberg-Brussels Airport
n Bus 2�2 Bonheiden-Keerbergen-Haacht-Cargo-Brussels Airport �� ��� *��2.��� ��2 ���
n Bus ��0 Druivenlijn:Groenendaal-Tervuren-Brussels Airport-Cargo �00 ��� *�2�.202 ��0 ��0
n Bus ��� Leuven-Bertem-Tervuren-Brussels Airport-Cargo �2 ��� �0� ��� �2� �0�
n Bus �2� Kapelle-o/d-Bos-Humbeek-Grimbergen-Vilvoorde-Brussels Airport 2� �2� ��� �00 ��� ���
n Bus ��� Leuven-Everberg-Kortenberg-Steenokk.-Cargo-Brussels Airport �0 2�� ��� ��� ��� ���
n Bus ��2 Leuven-Herent-Erps-Kwerps-Kortenberg-Nossegem-Brussels Airport-Cargo �� ��� ��� ��� ��0 ��2
n Bus ��� Roodebeek-Brussels Airport-Cargo �� �0� 22� ��� 2�0 ���
n Bus ��� Mechelen-Bonheiden-Boortmeerbeek-Cargo-Brussels Airport �� ��2 ��� ��� ��� ���
n Bus ��2 Mechelen-Zemst-Perk-Cargo-Brussels Airport �0� ��� ��� ��� ��� 0��
n Bus ��� Mechelen-Hofstade-Zemst-Vilvoorde-Cargo-Brussels Airport �� ��� �� �0� �� ���
Total 951750 1837139 2665512 * network extended in 200�
Source: De Lijn Vlaams-Brabant
�00 000
��0 000
�00 000
��0 000
�00 000
��0 000
�00 000
2�0 000
200 000
��0 000
�00 000
�0 000
0200� 200� 20�0
2� BRUTRENDS 2010
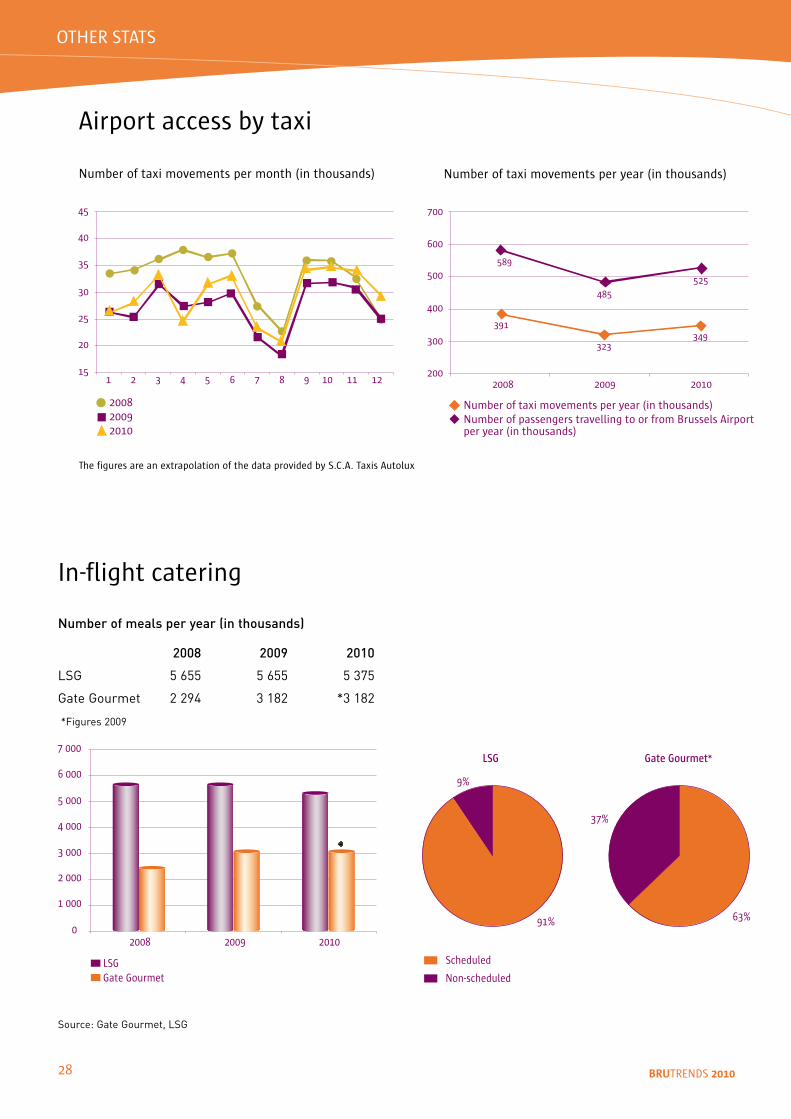
In-flight catering
2008 2009 2010
LSG 5 655 5 655 5 375
Gate Gourmet 2 294 3 182 *3 182
*Figures 2009
Source: Gate Gourmet, LSG
Number of meals per year (in thousands)
OTHER STATS
Airport access by taxi
�0
��
�0
2�
20
��
��
� 2 � � � � � � � �0 �� �2
200�200�20�0
200
�00
�00
�00
�00
�00
200� 200�
���
���
�2�
20�0
�2�
������
Number of taxi movements per year (in thousands)Number of passengers travelling to or from Brussels Airportper year (in thousands)
Number of taxi movements per year (in thousands)
Number of taxi movements per month (in thousands)
The figures are an extrapolation of the data provided by S.C.A. Taxis Autolux
� 000
� 000
� 000
� 000
� 000
2 000
� 000
0
LSGGate Gourmet
200� 200� 20�0
*
Gate Gourmet*
�%
��%
��%
��%
LSG
Scheduled
Non-scheduled
2� BRUTRENDS 2010
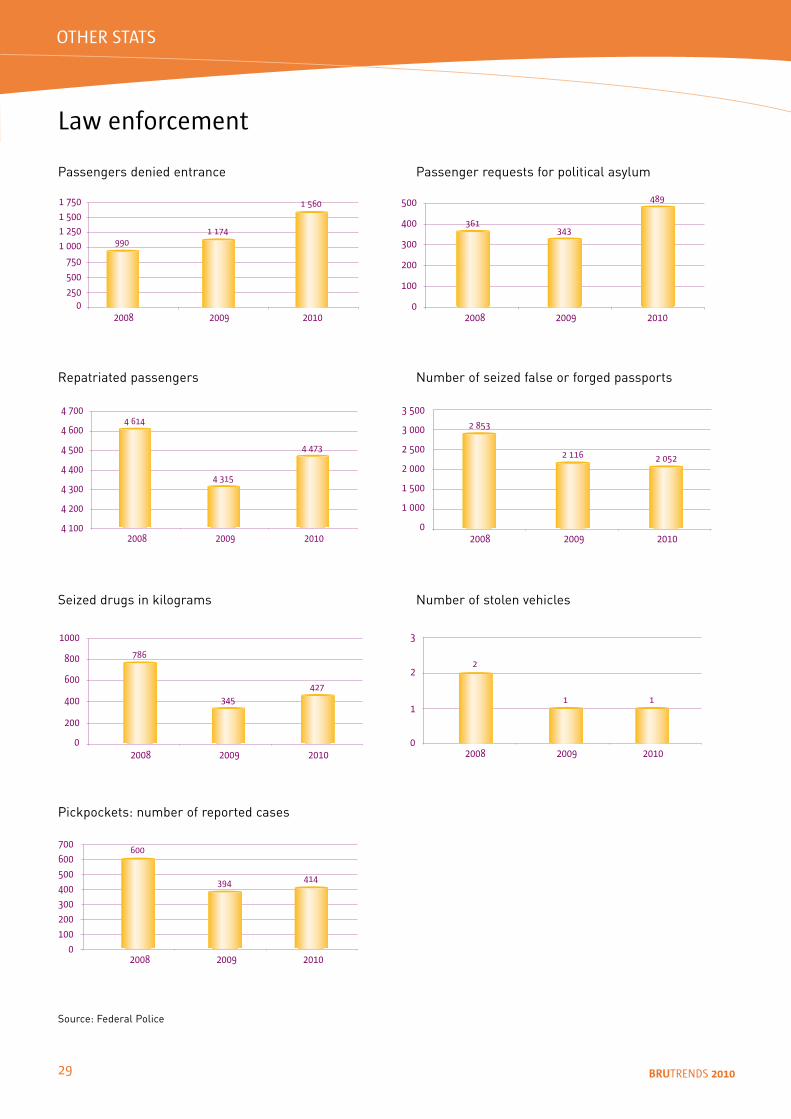
Law enforcement
Source: Federal Police
0
� 000
��0
�00
2�0
� 2�0� �00� ��0
200�
��0
200�
� ���
20�0
� ��0 �00
�00
200
�00
�00
0200�
���
200�
���
���
20�0
� �00
� �00
� �00
� �00
� �00
� 200
� �00200�
� ���
� ���
200�
� ���
20�0
�00
�00
200
�000
�00
0200�
���
�2�
20�0200�
���
Passengers denied entrance Passenger requests for political asylum
� �00
� 000
2 �00
2 000
� �00
� 000
0200�
2 ���
200�
2 ��� 2 0�2
20�0
Number of seized false or forged passports
�
2
�
0200� 200�
2
�
20�0
�
Number of stolen vehicles
Repatriated passengers
Seized drugs in kilograms
�00�00�00�00�00200�00
0200�
��� ���
200� 20�0
�00
Pickpockets: number of reported cases
OTHER STATS
200
�00
�00
�00
�00
�00
200� 200�
���
���
�2�
20�0
�2�
������
Number of taxi movements per year (in thousands)Number of passengers travelling to or from Brussels Airportper year (in thousands)
�0 BRUTRENDS 2010
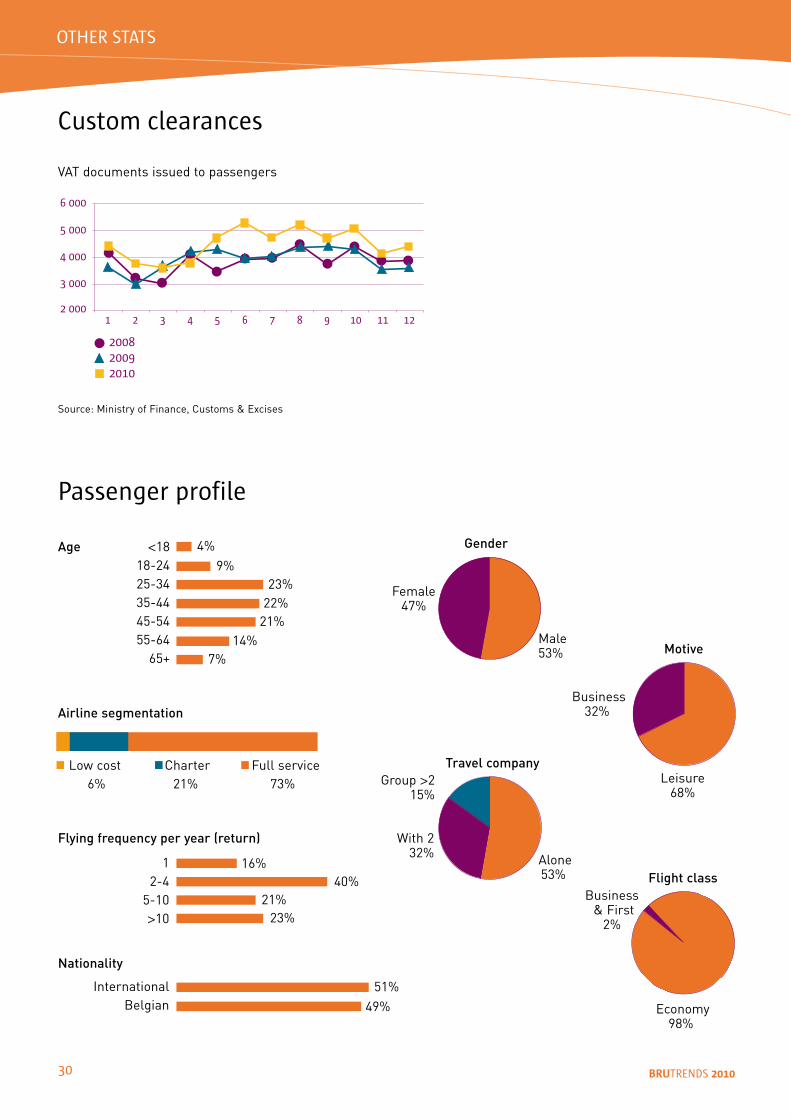
Custom clearances
� 000
� 000
� 000
� 000
2 000� 2 � � � � � � � �0 �� �2
200�200�20�0
VAT documents issued to passengers
Source: Ministry of Finance, Customs & Excises
Passenger profile
Age <1818-2425-3435-4445-5455-64
65+
1
2-45-10>10
InternationalBelgian
OTHER STATS
4%
23%22%
Gender
Female 47%
Male53% Motive
Business 32%
Leisure68%
Flight classBusiness & First
2%
Economy98%
Travel company
With 2 32% Alone
53%
Group >2 15%
Airline segmentation
Flying frequency per year (return)
Nationality
Low cost Charter Full service 6% 21% 73%
16%40%
21%23%
49%51%
9%
21%14%
7%
�� BRUTRENDS 2010
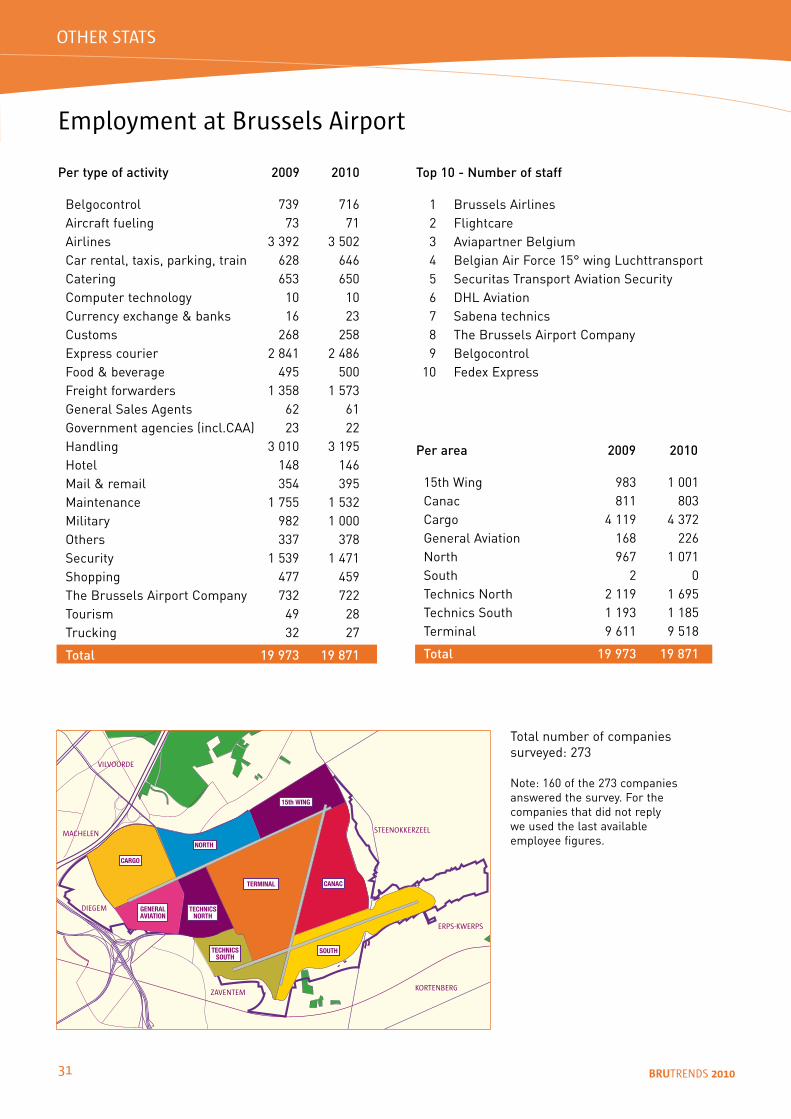
Employment at Brussels Airport
Top 10 - Number of staff 1 Brussels Airlines 2 Flightcare 3 Aviapartner Belgium 4 Belgian Air Force 15° wing Luchttransport 5 Securitas Transport Aviation Security 6 DHL Aviation 7 Sabena technics 8 The Brussels Airport Company 9 Belgocontrol 10 Fedex Express
MACHELEN
ERPS-KWERPS
STEENOKKERZEEL
KORTENBERGZAVENTEM
DIEGEM
PIER A
PIER B
PIER C
CARGO
TECHNICSNORTH
GENERALAVIATION
TECHNICSSOUTH
NORTH
15th WING
CANAC
SOUTH
VILVOORDE
TERMINAL
Total number of companies surveyed: 273
Note: 160 of the 273 companies answered the survey. For the companies that did not reply we used the last available employee figures.
Per area 2009 2010
15th Wing 983 1 001Canac 811 803Cargo 4 119 4 372General Aviation 168 226North 967 1 071South 2 0Technics North 2 119 1 695Technics South 1 193 1 185Terminal 9 611 9 518
Total 19 973 19 871
Per type of activity 2009 2010
Belgocontrol 739 716Aircraft fueling 73 71Airlines 3 392 3 502Car rental, taxis, parking, train 628 646Catering 653 650Computer technology 10 10Currency exchange & banks 16 23Customs 268 258Express courier 2 841 2 486Food & beverage 495 500Freight forwarders 1 358 1 573General Sales Agents 62 61Government agencies (incl.CAA) 23 22Handling 3 010 3 195Hotel 148 146Mail & remail 354 395Maintenance 1 755 1 532Military 982 1 000Others 337 378Security 1 539 1 471Shopping 477 459The Brussels Airport Company 732 722Tourism 49 28Trucking 32 27
Total 19 973 19 871
OTHER STATS

�2 BRUTRENDS 2010
TITELFor continuous updates
please consult our website
www.brusselsairport.be
This brochure was prepared by
The Brussels Airport Company - Corporate Communications
t +32(0)2 753 43 02
f +32(0)2 753 43 05
Design: BBC
Photography: Tom D'Haenens
Publisher: Corporate Communications
The Brussels Airport Company
Brussels Airport
BE-1930 Zaventem
All data may be copied provided Brussels Airport
is acknowledged as the source.