Embed Size (px)
Citation preview

Brutrends 2017 | 1
Brutrends 2017
www.brusselsairport.be

Brutrends 2017
2017 overview
In 2017, Brussels Airport welcomed 24.8 million passengers. That is 13.6% higher than in 2016 (21.8
million passengers) and 5.6% higher than the previous record year of 2015 (23.5 million passengers).
Both the number of originating passengers (+15.1 %) and the number of transfer passengers (+9.9%)
recorded strong growth compared to 2016, hereby confirming the further development of Brussels
Airport as a hub.
These positive figures are thanks to the growth in the network of destinations served from Brussels
Airport, the use of larger aircraft on various routes, improved passenger load factors and the strong
growth of Brussels Airlines.
The month of July was the most successful month for Brussels Airport in its history, with more than
2.5 million passengers in one month’s time. Never before has this figure been exceeded in one single
month. July was also responsible for other records for the airport, for in that month the 90,000
passengers-a-day mark was hit for the first time. A new day record was set on 28 July, with 94,305
passengers.
In 2017 Brussels Airport handled 535,634 tonnes of cargo, a growth of 8.3% compared to 2016 and
the highest volume in the last 10 years.
The number of flight movements in 2017 increased by 6.3% compared to 2016, a recovery of the
number of movements following the attacks in 2016. Compared to the record year of 2015, the
number of flight movements was 0.6% lower in 2017. Taking into account a stronger growth in
passengers (+13.6% compared to 2016 and +5.6% compared to 2015) than in flight movements, this
means a higher passenger load factor on the flights. On average, 120 passengers were on board,
compared to 113 passengers in 2016 and 2015 (+6.2%).

Brutrends 2017 | 1
Contents
2 Movements 2 Per month (2016-2017) Evolution (2005-2017) 3 Per type of traffic 4 Per area: Europe vs. overseas Per area: Europe 5 Per area: Overseas Per area: EU vs. non-EU 6 Per area: EU vs. non-EU (evolution) Per area: Schengen vs. non-Schengen 7 Top ten intra-European passenger destinations Top ten intra-European cargo destinations 8 Top ten overseas passenger destinations Top ten overseas cargo destinations 9 Top ten peak days vs. lowest days Movements per hour Day vs. night 10 Per aircraft size Per noise category
11 Passengers 11 Passenger profiles 12 Per month (2016-2017) Evolution (2005-2017) 13 Per type of traffic Transfer and transit vs. O&D 14 Transfer and transit vs. O&D (continued) 15 Per area: Europe vs. overseas Per area: intra-European traffic Per area: overseas traffic 16 Per area: EU vs. non-EU Per area: EU vs. non-EU (evolution) 17 Per area: Schengen vs. non-Schengen Top ten intra-European destinations 18 Top ten overseas destinations Top ten peak days vs. lowest days Passengers per hour 19 Passenger destinations 22 Passenger airlines 23 Map of Brussels Airport
24 Cargo 24 Per month (2016-2017) Evolution (2005-2017) 25 Per area: overseas Per area: EU vs. non-EU Per area: Europe vs. overseas 26 Per area: Europe Top ten intra-European destinations Top ten overseas destinations 27 Top ten peak days vs. lowest days Cargo destinations 28 Cargo airlines
Contents

Brutrends 2017 | 2
Movements
1 2 3 4 5 6 7 8 9 10 11 12 Total
2016 17 124 17 378 13 901 12 391 20 751 20 999 21 770 20 978 21 675 20 576 18 343 17 802 223 688
2017 17 329 16 623 19 536 19 567 21 679 21 506 22 258 21 451 21 591 21 062 18 387 16 899 237 888
2005 2006 2007 2008 2009 2010 2011 2012 2013 2014 2015 2016 2017
253 255 264 259 232 226 234 223 217 232 239 224 238
Movements per month
Movements evolution
Total movements (in thousands)
0
50
100
150
200
250
300
2017201620152014201320122011201020092008200720062005
0
5
10
15
20
252017
2016
DecNovOctSepAugJulJunMayAprMarFebJan
20172016

Brutrends 2017 | 3
Movements
Movements per type of traffic
Passenger flights (in thousands) Cargo flights (in thousands)
General aviation, business flights & others (in thousands) Military flights (in thousands)
Market share of different traffic types
86.7%
2.3%2.5%
3.4%5.1%
Passenger flights Cargo flights General aviation and business flights & othersMilitary flightsOther
2016 2017
0
5
10
15
20
25
2017201620152014201320122011201020092008200720062005
24.7 24.724.3
16.6
11.1 10.811.7 11.5 11.0
11.713.1
14.814.1
0
1
2
3
4
5
6
7
8
2017201620152014201320122011201020092008200720062005
6.5 6.66.4 6.4
6.9 7.0
5.9 5.95.5
5.0
5.5 5.4
6.0
0
50
100
150
200
250
2017201620152014201320122011201020092008200720062005
206.4 207.7215.9 219.3
200.9 194.5 202.7 194.4187.8
201.8207.9
192.4206.1
0
5
10
15
20
2017201620152014201320122011201020092008200720062005
15.616.3
17.416.5
12.813.3 13.4
12.4 12.411.7 11.912.1 12.0
86.1%
2.1%5.0%
6.2%
Passenger flights Cargo flights General aviation and business flightsMilitary flightsOther
86.1%
2.4%5.2%
6.3%
Passenger flights Cargo flights General aviation and business flightsMilitary flightsOther

Brutrends 2017 | 4
Movements
Per area: Europe vs. overseas
Per area: Europe
84.4%
15.6%
EuropeOverseas
33.2%
7.8%
10.0%
37.1%
12.0%
West & Central European countries Mediterranean countries Great Britain & IrelandNordic countriesEastern European countries
85.6%
14.4%
EuropeOverseas
31.1%
10.1%
9.8%
38.4%
10.6%
West & Central European countries Mediterranean countries Great Britain & IrelandNordic countriesEastern European countries
2017 % of total
Total commercial flights 220 914 100.0%
Europe 189 032 85.6%
of which EU 164 010 74.2%
Non-EU 25 022 11.3%
Overseas 31 882 14.4%
of which Africa 14 626 6.6%
North America 6 845 3.1%
Middle East 6 461 2.9%
Asia & Pacific 3 104 1.4%
Central & South America 846 0.4%
2016 2017 '17 vs. '16
Intra-European commercial flights 178 129 189 032 6.1%
West & Central European countries 56 084 58 728 4.7% Mediterranean countries 67 448 72 495 7.5% Great Britain & Ireland 19 337 20 097 3.9% Nordic countries 17 377 18 580 6.9% Eastern European countries 17 883 19 132 7.0%

Brutrends 2017 | 5
Movements
Per area: overseas
Per area: EU vs. non-EU
70.9%
29.1%
EUNon-EU
46.8%
1.8%
10.1%
26.9%
14.5%
AfricaNorth AmericaMiddle EastAsia & Paci�cCentral & South America
74.2%
25.8%
EUNon-EU
45.9%
2.7%
9.7%
21.5%
20.3%
AfricaNorth AmericaMiddle EastAsia & Paci�cCentral & South America
2017 % of total
Total commercial flights 220 914 100.0%
EU 164 010 74.2%
Non-EU 56 904 25.8%
of which Europe non-EU 25 022 11.3%
Overseas 31 882 14.4%
Total EU Non-EU
Total commercial flights 220 914 164 010 74.2% 56 904 25.8%
Passenger flights 206 091 155 100 75.3% 50 991 24.7%
Cargo flights 14 823 8 910 60.1% 5 913 39.9%
2016 2017 ‘17 vs. ‘16
Overseas commercial flights 28 373 31 882 12.4%
Africa 12 406 14 626 17.9%
North America 6 599 6 845 3.7%
Middle East 5 912 6 461 9.3%
Asia & Pacific 2 714 3 104 14.4%
Central & South America 742 846 14.0%

Brutrends 2017 | 6
Movements
Per area: EU vs. non-EU (evolution)
Per area: Schengen vs. non-Schengen
65.6%
34.4%
SchengenNon-Schengen
69.0%
31.0%
SchengenNon-Schengen2017 % of total
Total commercial flights 220 914 100.0%
Schengen 152 400 69.0%
of which Schengen EU 138 436 62.7%
Schengen non-EU 13 964 6.3%
Non-Schengen 68 514 31.0%
of which Europe non-Schengen 36 632 16.6%
Overseas 31 882 14.4%
Total Schengen Non-Schengen
Total commercial flights 220 914 152 400 69.0% 68 514 31.0%
Passenger flights 206 091 144 684 70.2% 61 407 29.8%
Cargo flights 14 823 7 716 52.1% 7 107 47.9%
Commercial traffic evolution (x 1 000 flights)
EU Non-EU Total
2005 176 55 231
2006 179 53 232
2007 183 58 241
2008 175 61 236
2009 156 56 212
2010 147 58 205
2011 154 60 214
2012 146 60 206
2013 141 58 199
2014 155 58 214
2015 162 59 221
2016 156 51 207
2017 164 57 221
50
100
0
150
200
250
300
2016 201720152014201320122011201020092008200720062005
EU TotalNon-EU

Brutrends 2017 | 7
Movements
Top ten intra-European passenger destinations
Total number of flights
Top ten intra-European cargo destinations
Total number of flights
81.9%
18.1%
Top 10Other intra-European cargo destinations
67.2%
32.8%
Top 10Other intra-European passenger destinations
77.2%
22.8%
Top 10Other intra-European cargo destinations
68.0%
32.0%
Top 10Other intra-European passenger destinations2016 2017 '17 vs. '16
Intra-European commercial flights 55 932 57 451 2.7%
Madrid 5 982 7 194 20.3%
Milan (MXP-LIN-BGY) 5 963 6 549 9.8%
London (LHR-LGW-LCY-LTN-STN) 5 678 6 075 7.0%
Barcelona 5 975 6 015 0.7%
Frankfurt 5 342 5 873 9.9%
Geneva 5 259 5 471 4.0%
Rome (CIA, FCO) 5 632 5 264 -6.5%
Lisbon 5 069 5 071 0.0%
Berlin (SXF-TXL) 6 269 5 061 -19.3%
Copenhagen 4 763 4 878 2.4%
2016 2017 '17 vs. '16
Intra-European commercial flights 6 975 7 406 6.2%
Leipzig 2 115 2 249 6.3%
East Midlands 967 1 104 14.2%
Helsinki 638 724 13.5%
Milan (MXP-LIN-BGY) 604 677 12.1%
London (LHR-LGW-LCY-LTN-STN) 595 562 -5.5%
Basel 428 442 3.3%
Copenhagen 415 434 4.6%
Madrid 415 411 -1.0%
Vitoria 395 403 2.0%
Barcelona 403 400 -0.7%
Brutrends 2017 | 8
Movements
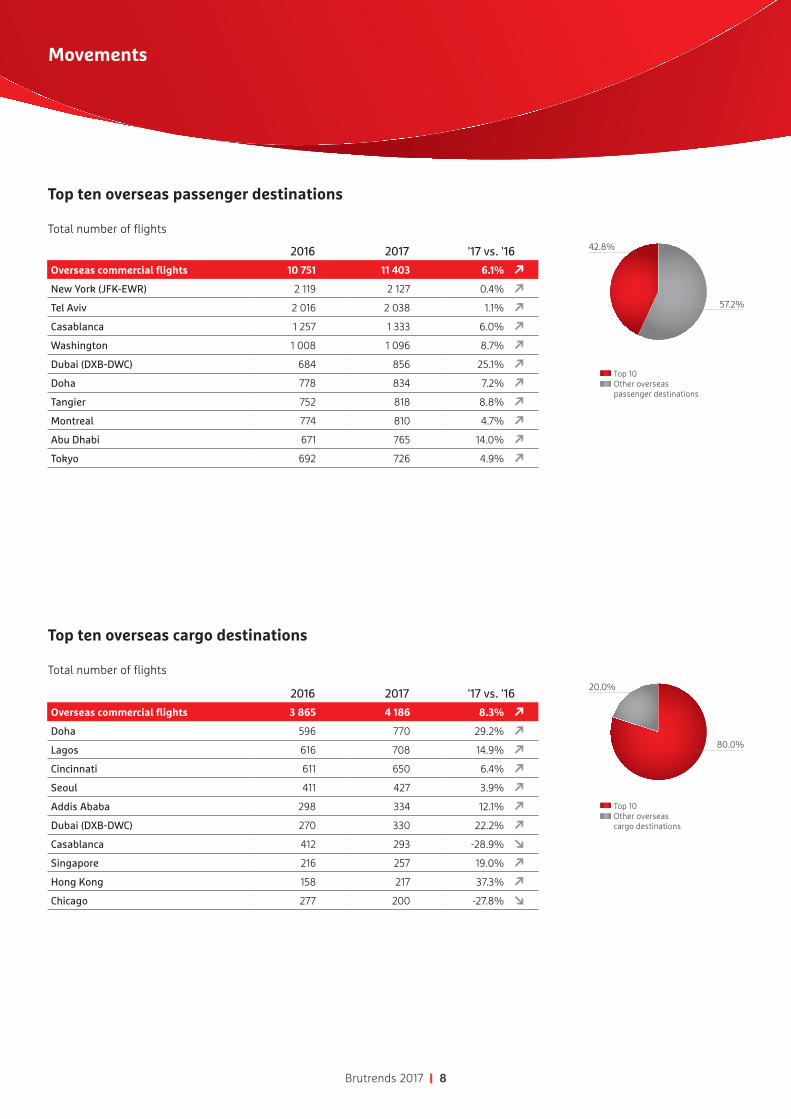
Top ten overseas passenger destinations
Total number of flights
Top ten overseas cargo destinations
Total number of flights
87.6%
12.4%
Top 10Other overseas cargo destinations
57.3%
42.7%
Top 10Other overseas passenger destinations
80.0%
20.0%
Top 10Other overseas cargo destinations
57.2%
42.8%
Top 10Other overseas passenger destinations2016 2017 '17 vs. '16
Overseas commercial flights 10 751 11 403 6.1%
New York (JFK-EWR) 2 119 2 127 0.4%
Tel Aviv 2 016 2 038 1.1%
Casablanca 1 257 1 333 6.0%
Washington 1 008 1 096 8.7%
Dubai (DXB-DWC) 684 856 25.1%
Doha 778 834 7.2%
Tangier 752 818 8.8%
Montreal 774 810 4.7%
Abu Dhabi 671 765 14.0%
Tokyo 692 726 4.9%
2016 2017 '17 vs. '16
Overseas commercial flights 3 865 4 186 8.3%
Doha 596 770 29.2%
Lagos 616 708 14.9%
Cincinnati 611 650 6.4%
Seoul 411 427 3.9%
Addis Ababa 298 334 12.1%
Dubai (DXB-DWC) 270 330 22.2%
Casablanca 412 293 -28.9%
Singapore 216 257 19.0%
Hong Kong 158 217 37.3%
Chicago 277 200 -27.8%

Brutrends 2017 | 9
Movements
Top ten peak days vs. lowest days
Number of movements per hour
Average 2017 In a low, average and peak month
Day vs. night
Day traffic: 6.00 - 22.59 hours Night traffic: 23.00 - 5.59 hours
0
10
20
30
40
50
60 Peak
Average
Lowest
23222120191817161514131211109876543210
Average (April) Peak (September)Lowest (December)
20172016
0
500
1 000
1 500
2 000
121110987654321
0
10
20
30
40
50
23222120191817161514131211109876543210
20172016
0
5 000
10 000
15 000
20 000
25 000
121110987654321
Movements peak days in 2017
29 June 820 22 June 794
30 June 813 28 July 793
23 June 813 04 September 789
08 September 803 07 September 788
21 June 795 07 July 786
Movements lowest days in 2017
09 December 402 07 January 381
25 November 402 24 December 373
28 January 399 31 December 349
01 January 396 25 December 325
14 January 391 11 December 270
2016 2017 '17 vs. '16
Total 223 688 237 888 6.3%
Day 207 937 221 061 6.3%
Night* 15 751 16 827 6.8%
* Including helicopter flights
157 166 5.7%

Brutrends 2017 | 10
Movements
Per aircraft size
Total number of flights
Per noise category
2016 2017 '17 vs. '16
Total 223 688 237 888 6.3%
Wide Body* 24 124 26 170 8.5%
Narrow body** 182 378 194 744 6.8%
General aviation & business flights 7 013 7 286 3.9%
Military 5 451 5 038 -7.6%
Other 4 722 4 650 -1.5%
* Wide body: a wide-body aircraft is larger and has two passenger aisles when used in a passenger configuration.** Narrow body: a narrow-body aircraft, when used in a passenger configuration, consists of a single aisle.
0
20 000
40 000
60 000
80 000
100 000
R8R7R6R5R4R3R2R1
20172016
Based on ACI Aircraft Noise Rating IndexR1: noisiest aircraftR8: quietest aircraft

Brutrends 2017 | 11
Passengers
Passenger profiles
Residence
Flight frequency past 12 months
Age
Gender
Flight frequency from BRU past 12 months
Reasons for traveling48.1%
51.9%
BelgiumForeign
49.6%
18.5%
31.9%
1-3 4-10>10
25.5%
6.1%
12.0%
20.8%
13.2%
21.7%
0.6%<18 18-2425-34 35-44
45-5455-6465+
55.0%
45.0%
MaleFemale
70.2%
9.3%
20.5%
1-3 4-10>10
29.5%
70.5%
BusinessLeisure + VFR (visiting friends & relatives)
48.1%
51.9%
BelgiumForeign
49.6%
18.5%
31.9%
1-3 4-10>10
55.0%
45.0%
MaleFemale
70.2%
9.3%
20.5%
1-3 4-10>10
29.5%
70.5%
BusinessLeisure + VFR (visiting friends & relatives)
25.5%
6.1%
12.0%
20.8%
13.2%
21.7%
0.6%<18 18-2425-34 35-44
45-5455-6465+

Brutrends 2017 | 12
Passengers
1 2 3 4 5 6 7 8 9 10 11 12 Total
2016 1 481 275 1 570 590 1 214 485 1 074 538 1 971 664 2 050 148 2 399 515 2 313 354 2 258 879 2 055 654 1 744 169 1 684 147 21 818 418
2017 1 533 489 1 564 778 1 879 510 2 145 790 2 203 443 2 223 932 2 565 044 2 490 201 2 396 571 2 230 714 1 832 584 1 717 855 24 783 911
2005 2006 2007 2008 2009 2010 2011 2012 2013 2014 2015 2016 2017
Europe 13.4 13.7 14.5 14.3 13.0 12.8 14.2 14.2 14.6 17.1 18.5 17.6 19.9
Overseas 2.7 2.9 3.3 4.2 4.0 4.3 4.5 4.8 4.5 4.8 4.9 4.2 4.9
Total 16.1 16.6 17.8 18.5 17.0 17.1 18.8 18.9 19.1 21.9 23.4 21.8 24.8
Passengers per month
Evolution (2005-2017)
Commercial passengers (in millions)
0
750 000
1 500 000
2 250 000
3 000 000
121110987654321
20172016
0
5 000 000
10 000 000
15 000 000
20 000 000
25 000 000
2017201620152014201320122011201020092008200720062005
Europe TotalOverseas

Brutrends 2017 | 13
Passengers
Per type of traffic
Transfer and transit vs. O&D
2016 2017 % difference Market share 2017
Total passengers on board 21 818 418 24 783 911 13.6% 100.0%
Commercial passengers 21 789 327 24 751 493 13.6% 99.9%
of which Local passengers 17 585 539 20 167 521 14.7% 81.4%
Transfer 4 151 798 4 564 696 9.9% 18.4%
Transit 51 990 19 276 -62.9% 0.1%
Non-commercial passengers 29 091 32 418 11.4% 0.1%
of which General aviation & business flights 27 887 30 350 8.8% 0.1%
Military 129 321 148.8% 0.0%
Other 1 075 1 747 62.5% 0.0%
Commercial passengers:passengers travelling on board of scheduled or non-scheduled commercial aircraft.
Local passengers:commercial passengers having BRU as origin or destination.
Transfer passengers:passengers arriving and departing on a different aircraft (these passengers are counted twice).
Transit passengers:passengers arriving and continuing their journey on board of the same aircraft (these passengers are counted once).
O&D:passengers both commercial and non-commercialusing Brussels Airport as point of origin or destination.
Transfer passengers:passengers arriving and departing on a different aircraft(these passengers are counted twice).
Transit passengers:passengers arriving and continuing their journey on boardof the same aircraft (these passengers are counted once).
83.5%
16.5%
O&DTransfer & transit
81.5%
18.5%
O&DTransfer & transit
80.7%
19.3%
O&DTransfer & transit 2016
2017

Brutrends 2017 | 14
Passengers
2016Transfer & Transit
O&D% Transfer & Transit
% O&D
1 322 991 1 158 284 21.8% 78.2%
2 314 770 1 255 820 20.0% 80.0%
3 250 023 964 462 20.6% 79.4%
4 207 994 866 544 19.4% 80.6%
5 373 020 1 598 644 18.9% 81.1%
6 408 785 1 641 363 19.9% 80.1%
7 400 808 1 998 707 16.7% 83.3%
8 423 592 1 889 762 18.3% 81.7%
9 458 245 1 800 634 20.3% 79.7%
10 418 660 1 636 994 20.4% 79.6%
11 299 968 1 444 201 17.2% 82.8%
12 324 932 1 359 215 19.3% 80.7%
Total 4 203 788 17 614 630 19.3% 80.7%
2017
1 296 696 1 236 793 19.3% 80.7%
2 294 393 1 270 385 18.8% 81.2%
3 347 818 1 531 692 18.5% 81.5%
4 389 688 1 756 102 18.2% 81.8%
5 397 616 1 805 827 18.0% 82.0%
6 434 538 1 789 394 19.5% 80.5%
7 393 659 2 171 385 15.3% 84.7%
8 441 658 2 048 543 17.7% 82.3%
9 459 516 1 937 055 19.2% 80.8%
10 454 986 1 775 728 20.4% 79.6%
11 342 983 1 489 601 18.7% 81.3%
12 331 630 1 386 225 19.3% 80.7%
Total 4 585 181 20 198 730 18.5% 81.5%
Transfer and transit vs. O&D (continued)
0
500 000
1 000 000
1 500 000
2 000 000
2 500 000
121110987654321
O&DTransfer & transit
0
500 000
1 000 000
1 500 000
2 000 000
121110987654321
O&DTransfer & transit

Brutrends 2017 | 15
Passengers
Per area: Europe vs. overseas
Per area: intra-European traffic
Per area: overseas traffic
76.3%
23.7%
EuropeOverseas
24.6%
8.9%
7.7%
49.4%
9.4%
West & Central European countriesMediterranean countries Great Britain & IrelandNordic countriesEastern European countries
44.8%
2.9%
9.2%
30.6%
12.5%
AfricaNorth AmericaMiddle EastAsia & Paci�cCentral & South America
80.3%
19.7%
EuropeOverseas
25.8%
9.6%
8.3%
47.8%
8.5%
Eastern European countries Great Britain & IrelandMediterranean countries Nordic countriesWest & Central European countries
42.0%
4.6%
9.3%
25.5%
18.6%
AfricaNorth AmericaMiddle EastAsia & Paci�cCentral & South America
2017 % of total
Total commercial passengers 24 751 493 100.0%
Europe 19 873 700 80.3%
of which EU 17 036 883 68.8%
non-EU 2 836 817 11.5%
Overseas 4 877 793 19.7%
of which Africa 2 051 319 8.3%
North America 1 241 647 5.0%
Middle East 907 782 3.7%
Asia & Pacific 450 845 1.8%
Central & South America 226 200 0.9%
2016 2017 '17 vs. '16
Overseas commercial flights 17 625 690 19 861 634 12.7%
West & Central European countries 4 558 551 5 117 141 12.3%
Mediterranean countries 8 478 995 9 495 311 12.0%
Great Britain & Ireland 1 533 223 1 687 008 10.0%
Nordic countries 1 417 754 1 655 319 16.8%
Eastern European countries 1 637 167 1 906 855 16.5%
Transit not included
2016 2017 '17 vs. '16
Overseas commercial flights 4 111 647 4 870 583 18.5%
Africa 1 678 438 2 044 109 21.8%
North America 1 110 077 1 241 647 11.9%
Middle East 791 807 907 782 14.6%
Asia & Pacific 335 461 450 845 34.4%
Central & South America 195 864 226 200 15.5%
Transit not included

Brutrends 2017 | 16
Passengers
2005 2006 2007 2008 2009 2010 2011 2012 2013 2014 2015 2016 2017
EU 11.1 11.8 12.2 12.0 10.7 10.5 11.7 11.4 11.7 14.1 15.5 15.2 17.0
Non-EU 5.0 4.9 5.6 6.5 6.3 6.6 7.1 7.5 7.4 7.8 7.9 6.6 7.7
Total 16.1 16.7 17.8 18.5 17.0 17.1 18.8 18.9 19.1 21.9 23.4 21.8 24.8
Per area: EU vs. non-EU (evolution)
Commercial passengers (in millions)
0
5 000 000
10 000 000
15 000 000
20 000 000
25 000 000
2017201620152014201320122011201020092008200720062005
EU TotalNon-EU
Per area: EU vs. non-EU
61.0%
39.0%
EUNon-EU
68.8%
31.2%
EUNon-EU2017 % of total
Total commercial passengers 24 751 493 100.0%
EU 17 036 883 68.8%
Non-EU 7 714 610 31.2%
of which Europe non-EU 2 836 817 11.5%
Overseas 4 877 793 19.7%

Brutrends 2017 | 17
Passengers
Top ten intra-European destinations
Total number of passengers
35.4%
64.6%
Top 10Other intra-European destinations
35.0%
65.0%
Top 10Other intra-European destinations2016 2017 '17 vs. '16
Top 10 Intra-European commercial passengers 6 358 242 6 948 828 9.3%
Madrid 763 016 966 146 26.6%
Barcelona 889 180 927 618 4.3%
Lisbon 698 131 738 243 5.7%
Rome (CIA-FCO) 713 392 719 436 0.8%
London (LHR-LGW-LCY-LTN-STN) 587 487 654 712 11.4%
Milan (MXP-LIN-BGY) 492 068 644 841 31.0%
Berlin (SXF-TXL) 703 272 622 816 -11.4%
Geneva 545 230 591 857 8.6%
Frankfurt 467 238 549 296 17.6%
Malaga 499 228 533 863 6.9%
Per area: Schengen vs. non-Schengen
58.3%
41.7%
SchengenNon-Schengen
65.3%
34.7%
SchengenNon-Schengen2017 % of total
Total commercial passengers 24 751 493 100.0%
Schengen 16 162 453 65.3%
Non-Schengen 8 589 040 34.7%
of which Europe non-Schengen 3 711 247 15.0%
Overseas 4 877 793 19.7%

Brutrends 2017 | 18
Passengers
Top ten overseas destinations
Total number of passengers
44.6%
55.4%
Top 10Other overseas destinations
44.3%
55.7%
Top 10Other overseas destinations2016 2017 '17 vs. '16
Top 10 overseas commercial passengers 1 930 420 2 161 345 12.0%
New York (JFK-EWR) 441 212 454 187 2.9%
Tel Aviv 267 366 295 464 10.5%
Washington 212 027 231 859 9.4%
Dubai (DXB-DWC) 187 049 228 001 21.9%
Montreal 174 843 197 550 13.0%
Abu Dhabi 144 239 170 549 18.2%
Doha 156 644 169 111 8.0%
Casablanca 142 294 153 025 7.5%
Chicago 96 282 131 388 36.5%
Beijing 108 464 130 211 20.0%
Top ten peak days vs. lowest days
Number of passengers per hour
Average 2017 In a low, average and peak month
0
1 000
2 000
3 000
4 000
5 000
6 000
7 000
8 000 Peak
Average
Lowest
23222120191817161514131211109876543210
Average (May) Peak (July)Lowest (January)
0
1 000
2 000
3 000
4 000
5 000
6 000
23222120191817161514131211109876543210
Total passengers on board - peak days in 2017
28 July 94 256 24 July 90 684
31 July 93 085 20 July 89 468
15 September 91 308 01 September 89 304
14 July 91 058 11 August 89 289
21 July 90 933 04 August 88 305
Total passengers on board - lowest days in 2017
04 February 42 962 28 January 39 317
09 December 42 651 21 January 36 676
24 December 42 260 14 January 36 532
17 January 41 694 25 December 35 496
31 December 40 406 11 December 29 724

Brutrends 2017 | 19
Passengers
Passenger destinations Europe
Albania Tirana
Armenia Yerevan seasonal
Austria Vienna
Salzburg *
Bulgaria Bourgas seasonal
Sofia
Varna seasonal
Croatia Brač * seasonal
Dubrovnik seasonal
Split seasonal
Zagreb
Czech Republic Prague
Cyprus Ercan seasonal
Larnaca
Paphos seasonal
Denmark Billund
Copenhagen
Estonia Tallinn
Finland Helsinki
Kittila seasonal
France Ajaccio seasonal
Bastia seasonal
Bordeaux
Calvi seasonal
Figari seasonal
Grenoble ** seasonal
Lourdes seasonal
Lyon
Marseille
Nantes
Nice
Paris/CDG
Strasbourg
Toulouse
Germany Berlin/SXF
Berlin/TXL
Bremen
Frankfurt
Hamburg
Germany (continued) Hanover
Munich
Nuremberg
Stuttgart
Greece Athens
Araxos/Patras * seasonal
Chania seasonal
Corfu seasonal
Heraklion seasonal
Kos seasonal
Mykonos seasonal
Rhodes seasonal
Samos seasonal
Santorini seasonal
Thessaloniki seasonal
Volos * seasonal
Zakynthos seasonal
Hungary Budapest
Iceland Reykjavik
Ireland Dublin
Italy Bologna
Brindisi seasonal
Catania seasonal
Comiso * seasonal
Florence seasonal
Lamezia Terme seasonal
Milan/LIN
Milan/MXP
Napels
Olbia seasonal
Palermo seasonal
Rimini ** seasonal
Rome/FCO
Turin
Venice/TSF
Venice/VCE
Kosovo Pristina
Latvia Riga
Lithuania Vilnius
* new in 2017 ** ended in 2017 (or not returning seasonal)

Brutrends 2017 | 20
Passengers
Passenger destinations Europe (continued)
Passenger destinations Africa
Macedonia Ohrid seasonal
Malta Malta
Moldovia Chisinau
Montenegro Tivat
Netherlands Amsterdam
Norway Oslo
Tromso * seasonal
Poland Krakow
Warsaw
Portugal Faro seasonal
Funchal
Lisbon
Oporto
Ponta Delgada seasonal
Romania Bacau
Bucharest
Constanta * seasonal
Iasi
Russia Moscow/DME
Moscow/SVO
St.Petersburg seasonal
Serbia Belgrade
Slovenia Ljubljana
Spain Alicante
Almeria
Barcelona
Bilbao
Fuerteventura
Gerona seasonal
Ibiza seasonal
Jerez de la Frontera seasonal
Lanzarote
Las Palmas
Algeria Algiers
Oran seasonal
Angola Luanda
Benin Cotonou
Burkina Faso Ouagadougou
Burundi Bujumbura
Spain (continued) Madrid
Malaga
Menorca seasonal
Palma seasonal
Reus seasonal
Santa Cruz de la Palma
Santiago de Compostela seasonal
Sevilla seasonal
Tenerife
Valencia
Sweden Gothenburg
Stockholm/ARN
Stockholm/BMA
Switzerland Basel
Geneva
Zurich
Turkey Antalya
Ankara * seasonal
Bodrum seasonal
Dalaman seasonal
Eskisehir
Istanbul/IST
Istanbul/SAW
Izmir seasonal
Ukraine Kiev
United Kingdom Belfast/BHD **
Birmingham
Bristol
Edinburgh
East Midlands
London/LHR
Manchester
Newcastle
* new in 2017 ** ended in 2017 (or not returning seasonal)

Brutrends 2017 | 21
Passengers
Passenger destinations Africa (continued)
Passenger destinations Asia
Passenger destinations Latin America
Passenger destinations Middle East
Cameroon Douala
Yaounde
Cape Verde Boa Vista
Ilha do Sal
Congo DRC Kinshasa
Ivoire Cote d' Abidjan
Egypt Cairo
Hurghada
Luxor *
Marsa Alam
Sharm El Sheikh
Ethiopia Addis Ababa
Gambia, The Banjul
Ghana Accra
Guinea Conakry
Liberia Monrovia
Morocco Agadir
Al Hoceima seasonal
China Beijing
Shanghai *
India Mumbai *
Cuba Varadero
Dominican Rep Punta Cana
Santo Domingo
Israel Tel Aviv
Iran Tehran *
Jordan Aqaba ** seasonal
Lebanon Beirut
Japan Tokyo
Thailand Bangkok
Jamaica Montego Bay
Mexico Cancun
Qatar Doha
UAE Abu Dhabi
Dubai
Morocco (continued) Casablanca
Fez
Marrakech
Nador
Oujda seasonal
Rabat
Tangier
Rwanda Kigali
Senegal Dakar
Sierra Leone Freetown
Togo Lomé
Tanzania Zanzibar seasonal
Tunisia Djerba
Enfidha
Monastir
Tunis
Uganda Entebbe
* new in 2017 ** ended in 2017 (or not returning seasonal)

Brutrends 2017 | 22
Passengers
Passenger destinations North America
Passenger airlines
Canada Montreal
Toronto
United States Atlanta
Chicago
Miami
Adria Airways
Aegean Airlines
Aer Lingus
Aeroflot
Air Algerie
Air Arabia Maroc
Air Baltic
Air Canada
Air Europa
Air Malta
Air Moldova
Air Serbia
Air Transat
Alitalia
All Nippon Airways
Austrian Airlines
Blue Air
BMI Regional
British Airways
Brussels Airlines
Bulgaria Air
Cobalt Air * **
Corendon Airlines
Croatia Airlines
CSA Czech Airlines
Delta Air Lines
easyJet
Egyptair
El Al
Emirates
Ethiopian Airlines
Etihad Airways
Eurowings
Finnair
FlyEgypt
Freebird Airlines
Hainan Airlines
HOP!
Iberia
Icelandair
KLM
LOT Polish Airlines
Lufthansa
Middle East Airlines
Nordica
Pegasus **
Qatar Airways
Qeshm Air *
Royal Air Maroc
Royal Wings **
Rwandair *
Ryanair
SAS
Sun Express
Swiss
Tailwind
TAP Portugal
TAROM
Thai Airways International
Thomas Cook **
Transavia **
TUI fly
Tunisair
Turkish Airlines
Ukraine International
United Airlines
VLM Airlines *
Vueling
WOW Air *
United States (continued) Newark
New York/JFK
Orlando/SFB **
Washington
* new in 2017 ** ended in 2017 (or not returning seasonal)

Brutrends 2017 | 23
Passengers
Map of Brussels Airport
VILVOORDEMELSBROEK
STEENOKKERZEEL
ERPS-KWERPS
KORTENBERG
ZAVENTEM
DIEGEM
MACHELEN
PIER A
PIER B

Brutrends 2017 | 24
Cargo
1 2 3 4 5 6 7 8 9 10 11 12 Total
2016 36 964 37 771 34 626 40 507 40 396 40 243 39 689 39 848 42 906 46 603 45 564 49 519 494 637
2017 44 952 40 696 50 474 45 983 43 836 42 375 41 191 40 558 42 446 45 018 49 825 48 280 535 634
2005 2006 2007 2008 2009 2010 2011 2012 2013 2014 2015 2016 2017
% vs. previous year 5.8% 2.4% 8.9% -15.6% -32.1% 6.0% -0.2% -3.3% -6.4% 5.6% 7.8% 1.1% 8.3%
Total cargo (ton) 702 819 719 561 783 727 661 143 449 132 476 135 475 124 459 265 429 938 453 954 489 303 494 637 535 634
Cargo per month (in tons)
Evolution (2005-2017)
0
10 000
20 000
30 000
40 000
50 000
60 000
DecNovOctSepAugJulJunMayAprMarFebJan
20172016
0
100 000
200 000
300 000
400 000
500 000
600 000
700 000
800 000
2017201620152014201320122011201020092008200720062005

Brutrends 2017 | 25
Cargo
Per area: overseas
23.2%
0.4%
27.1%
28.3%
21.0%
AfricaNorth AmericaMiddle EastAsia & Paci�cCentral & South America
26.0%
0.8%
22.0%
25.9%25.3%
AfricaNorth AmericaMiddle EastAsia & Paci�cCentral & South America
2016 2017 '17 vs. '16
Overseas cargo in tons 334 859 363 636 8.6%
Africa 84 497 94 617 12.0%
North America 90 934 94 051 3.4%
Middle East 84 558 92 154 9.0%
Asia & Pacific 73 087 79 899 9.3%
Central & South America 1 783 2 915 63.5%
Per area: EU vs. non-EU
25.4%
74.6%
EUNon-EU
29.9%
70.1%
EuropeOverseas2016 2017 '17 vs. '16 Market share in 2017
Total cargo in tons 494 637 535 634 8.3% 100.0%
EU 148 240 160 227 8.1% 29.9%
Non-EU 346 396 375 407 8.4% 70.1%
of which Europe non-EU 11 538 11 771 2.0% 2.2%
Overseas 334 859 363 636 8.6% 67.9%
Per area: Europe vs. overseas
31.8%
68.2%
EuropeOverseas
32.1%
67.9%
EuropeOverseas
2017 % of total
Total cargo in tons 535 634 100.0%
Europe 171 998 32.1%
of which EU 160 227 29.9%
non-EU 11 771 2.2%
Overseas 363 636 67.9%
of which Africa 94 617 17.7%
North America 94 051 17.6%
Middle East 92 154 17.2%
Asia & Pacific 79 899 14.9%
Central & South America 2 915 0.5%

Brutrends 2017 | 26
Cargo
Per area: Europe
40.2%
1.8%
13.6%
28.0%
16.4%
West & Central European countries Mediterranean countries Great Britain & IrelandNordic countriesEastern European countries
44.8%
3.0%
10.6%
24.9%
16.7%
West & Central European countries Mediterranean countries Great Britain & IrelandNordic countriesEastern European countries
2016 2017 '17 vs. '16
Intra-European cargo in tons 159 778 171 998 7.6%
West & Central European countries 72 940 76 981 5.5%
Mediterranean countries 38 632 42 886 11.0%
Great Britain & Ireland 24 859 28 667 15.3%
Nordic countries 18 554 18 272 -1.5%
Eastern European countries 4 793 5 193 8.3%
Top ten intra-European destinations
Top ten overseas destinations
84.2%
15.8%
Top 10Other intra-European destinations
63.3%
36.7%
Top 10Other overseas destinations
79.4%
20.6%
Top 10Other intra-European destinations
58.3%
41.7%
Top 10Other intra-European destinations
2016 2017 '17 vs. '16
Total commercial cargo 124 655 136 643 9.6%
Leipzig 51 554 55 116 6.9%
East Midlands 15 531 18 201 17.2%
Milan (MXP-LIN-BGY) 12 242 15 625 27.6%
London (LHR-LGW-LCY-LTN-STN) 8 459 10 084 19.2%
Helsinki 10 845 9 415 -13.2%
Copenhagen 7 014 7 419 5.8%
Vitoria 6 231 6 824 9.5%
Madrid 4 903 5 106 4.1%
Barcelona (BCN-GRO) 4 429 4 674 5.5%
Porto 3 445 4 179 21.3%
2016 2017 '17 vs. '16
Total commercial cargo 199 379 225 777 13.2%
Cincinnati 37 886 41 012 8.3%
Doha 26 282 33 841 28.8%
Seoul 25 777 26 126 1.4%
Lagos 22 232 24 949 12.2%
Dubai (DXB-DWC) 19 376 23 367 20.6%
Addis Ababa 19 855 22 889 15.3%
New York (JFK-EWR) 15 256 16 036 5.1%
Singapore 14 224 14 463 1.7%
Hong Kong 7 704 12 353 60.3%
Tokyo 10 787 10 742 -0.4%

Brutrends 2017 | 27
Cargo
Cargo Top 10 peak days vs. lowest days
Cargo destinations
Africa Algeria Algiers #
Burundi Bujumbura #
Cameroon Douala #
Congo Brazzaville
Kinshasa #
Congo DRC Lubumbashi
Ethiopia Addis Ababa #
Ghana Accra #
Kenya Nairobi
Morocco Casablanca #
Nigeria Lagos
Senegal Dakar #
South Africa Johannesburg
Uganda Entebbe #
Asia Bangladesh Dhaka
China Shanghai #
Tianjin
Xi'an
Zhengzhou
Hong Kong Hong Kong
India Bangalore
Chennai
Mumbai #
Korea Seoul
Singapore Singapore
Europe Austria Linz
Denmark Copenhagen #
Finland Helsinki #
France Bordeaux #
Lyon #
Marseille #
Paris/CDG #
Toulouse #
Germany Leipzig
Hungary Budapest #
Italy Milan/BGY
Portugal Lisbon #
Porto #
Spain Barcelona #
Madrid #
Vitoria
Sweden Jonkoping
Switzerland Basel #
United Kingdom East Midlands #
Guernsey
Jersey
London/LHR #
London/LTN
* new in 2017 ** ended in 2017# also as passenger flight
Cargo in tons – peak days in 2017
31 October 2 326 1 December 1 876
8 March 1 947 9 November 1 871
30 March 1 910 21 November 1 867
16 November 1 882 5 December 1 849
15 December 1 879 10 November 1 837
Cargo in tons – lowest days in 2017
6 February 742 17 April 689
10 July 741 23 October 682
26 June 718 9 January 615
17 July 713 11 December 588
8 May 693 2 January 471

Brutrends 2017 | 28
Cargo
Cargo airlines
Aerologic
Aerotrans Airlines *
Air Algerie
Air Cargo Global
Asiana Airlines
Atlantic Airlines
Atlas Air *
British Airways
Demavia **
DHL
Emirates Cargo
Ethiopian Airlines Cargo
Etihad Airways Cargo **
European Air Transport
Finnair Cargo
Kalitta Airways
Magma Aviation **
Qatar Airways Cargo
Royal Air Maroc Cargo
Saudi Airlines Cargo
Singapore Airlines Cargo
TNT Airwyas
Yangtze River Express **
* new in 2017 ** ended in 2017
Cargo destinations
* new in 2017 ** ended in 2017# also as passenger flight
Middle East Bahrain Bahrain
Kuwait Kuwait
Qatar Doha #
Saudi Arabia Damman
Jeddah
Riyadh
UAE Abu Dhabi # **
Dubai/DWC
Sjarjah
North America United States Anchorage
Chicago #
Cincinnati
Dallas/DFW
Los Angeles
New York/JFK #


![[XLS] · Web view5323 7 664000 7 30 535011 0 0 3 9270 7 401130 8/8/2017 3 19 211012 0 0 0 1 9271 8 401130 8/8/2017 3 19 211012 0 2 0 1 9272 9 401130 8/8/2017 3 19 211012 0 4 0 1 9273](https://img.pdfslide.us/doc/110x75/5aab344e7f8b9aa9488bb6f3/xls-view5323-7-664000-7-30-535011-0-0-3-9270-7-401130-882017-3-19-211012-0-0.jpg)