Embed Size (px)
Citation preview

Why Is International Trade and Investment so Important to California?
• International trade – both exports and imports – supports 4.4 million California jobs. These trade-‐related jobs are at large and small companies, on farms, in factories, and at the headquarters of California’s globally engaged firms. See California Jobs Depend On Two-‐Way Trade.
• California exports hundreds of billions of dollars in goods and services annually, including computer equipment, agricultural products, software, and movies. The vast majority of California exporters are small and medium-‐sized companies with less than 500 workers. See California Businesses Grow With Exports.
• Customers in 225 countries around the world buy California-‐grown and manufactured goods and services. Top markets like Mexico, Canada and China buy billions of dollars of California products and services annually. See California Companies Export Throughout The World.
• Imports lower prices and increase choices for California companies and families. Lower raw material and input costs help California companies stay competitive in global markets, while families can stretch paychecks further as trade agreements reduce the cost of products by eliminating costly barriers to trade. See California Companies And Workers Use Imports To Compete.
• Free trade agreements (FTAs) have led to rapid export growth to partner countries. America’s FTA partners purchased 10.9 times more goods per capita from California than non-‐FTA countries did in 2012. See California Needs Trade Agreements To Grow.
• Foreign-‐owned companies invest in California and employ 567,000 Californians. See Foreign Investment In California Creates Jobs.
HOW CALIFORNIA’S ECONOMY BENEFITS FROM INTERNATIONAL TRADE AND INVESTMENT
With more than 95 percent of the world’s population and 80 percent of the world’s purchasing power outside the United States, future economic growth and jobs for California and America increasingly depend on expanding U.S. trade and investment opportunities in the global marketplace. The following pages feature key facts and figures drawn from new Business Roundtable research and U.S. government data that help explain the benefits of international trade and investment and the importance of active trade and investment initiatives to U.S. economic growth and jobs, including in California.
Contact: David Thomas, Business Roundtable, 202.496.3262, [email protected]
www.brt.org/trade

CALIFORNIA JOBS DEPEND ON TWO-‐WAY TRADE
Trade creates and supports jobs in California. Export growth increases jobs by generating new business for California’s manufacturers, service providers and farmers. Imports support jobs and keep costs low, helping California businesses compete and saving California families real dollars at the cash register. Foreign investment in California creates good jobs across a range of sectors.
Today, 4.4 million jobs in California depend on trade.
10.6%
22.0%
1992 2011
Share of California Jobs Tied to Trade More than Doubled from
1992 to 2011
Top Sectors for California Jobs Tied to Trade, 2011
Consumer Services 932,900 Prof., Sci. & Tech. Services 908,800 Wholesale & Retail Trade 597,700 Construction 244,700 Finance & Insurance 196,300 Manufacturing 158,000
More than one in five California jobs depend on international trade.
• California’s trade-‐related employment grew 19 percent, while total jobs decreased, from 2004 to 2011.
• Jobs in U.S. exporting plants pay on average up to 18 percent more than similar jobs in non-‐exporting plants.
• U.S. exporting plants increase employment 2 to 4 percent faster annually than plants that do not export. Exporting plants also are less likely to go out of business.
Small and Large Employers Partner to Export
In addition to exporting directly themselves, more than 6,000 American small-‐ and medium-‐sized enterprises (SMEs) export indirectly when they sell goods and services to large U.S. companies that export. SMEs account for nearly a quarter of the value of purchases by large companies, which in turn often export finished goods and services to customers around the world.
Creating and preserving quality U.S. jobs is a goal shared by all Americans. With more than 95 percent of the world’s population and 80 percent of the world’s purchasing power outside of the United States, future American economic growth and job creation depend on open markets abroad.
Contact: David Thomas, Business Roundtable, 202.496.3262, [email protected]
www.brt.org/trade

CALIFORNIA BUSINESSES GROW WITH EXPORTS
California ranked second in the United States in goods exports in 2012, with an estimated value of $158.4 billion, and first in services exports, with an estimated value of $89.3 billion in 2011. Large companies account for 54 percent of the value of California’s merchandise exports, with the rest provided by small-‐ and medium-‐sized enterprises (SMEs).
Top Goods Exports, 2012 • Computer Equipment: $13.3 billion • Semiconductors & Components: $11.0 billion • Navigation & Control Instruments: $9.7 billion • Fruits & Tree Nuts: $8.3 billion • Communications Equipment: $8.2 billion Top Services Exports, 2011 • Travel: $14.9 billion • Computer Software: $10.7 billion • Film & Television Distribution: $10.1 billion
Leading Export Products Computers and electronics (including semiconductors and navigation equipment) was California’s leading export category in 2012, accounting for 28.2 percent of total merchandise exports.
• California is the top state exporter of 24 different industries, including computer equipment ($13.3 billion), navigation and control instruments ($9.7 billion), medical equipment ($5.9 billion), and scrap and recycled materials ($5.7 billion). California ranks among the top 10 exporters for 71 other industries.
• California is America’s largest exporter of agricultural products. It is the top exporter of tree nuts, vegetables and melons, grapes, strawberries, hay, and numerous other farm products.
• One of California’s fastest growing exports is dairy products, which have increased by 29 percent per year since 2002. In 2012, exports of these products reached $1.9 billion.
59,543
2,351
No. of SME Exporters
No. of Large Company Exporters
96 Percent of California Exporters Are Small-‐ or Medium-‐Sized
Companies
Contact: David Thomas, Business Roundtable, 202.496.3262, [email protected]
www.brt.org/trade
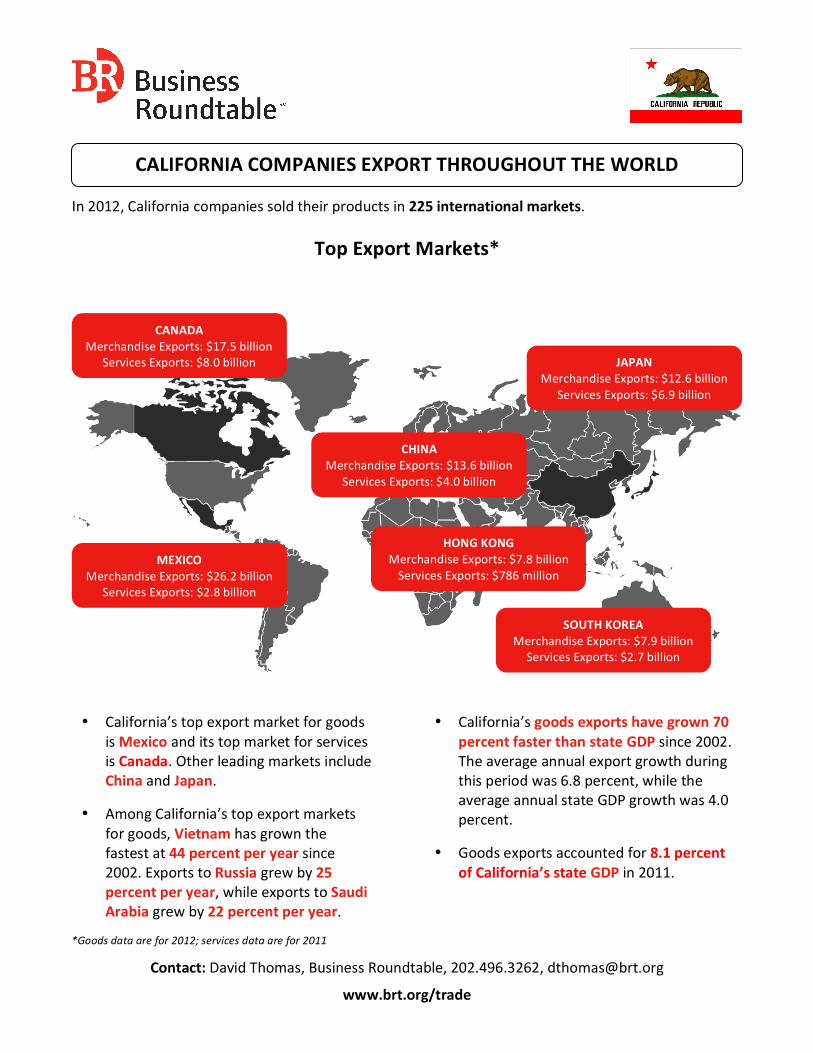
• California’s top export market for goods is Mexico and its top market for services is Canada. Other leading markets include China and Japan.
• Among California’s top export markets for goods, Vietnam has grown the fastest at 44 percent per year since 2002. Exports to Russia grew by 25 percent per year, while exports to Saudi Arabia grew by 22 percent per year.
• California’s goods exports have grown 70 percent faster than state GDP since 2002. The average annual export growth during this period was 6.8 percent, while the average annual state GDP growth was 4.0 percent.
• Goods exports accounted for 8.1 percent of California’s state GDP in 2011.
CALIFORNIA COMPANIES EXPORT THROUGHOUT THE WORLD
MEXICO Merchandise Exports: $26.2 billion
Services Exports: $2.8 billion
CANADA Merchandise Exports: $17.5 billion
Services Exports: $8.0 billion
CHINA Merchandise Exports: $13.6 billion
Services Exports: $4.0 billion
In 2012, California companies sold their products in 225 international markets.
Top Export Markets*
SOUTH KOREA Merchandise Exports: $7.9 billion
Services Exports: $2.7 billion
HONG KONG Merchandise Exports: $7.8 billion Services Exports: $786 million
JAPAN Merchandise Exports: $12.6 billion
Services Exports: $6.9 billion
Contact: David Thomas, Business Roundtable, 202.496.3262, [email protected]
www.brt.org/trade
*Goods data are for 2012; services data are for 2011
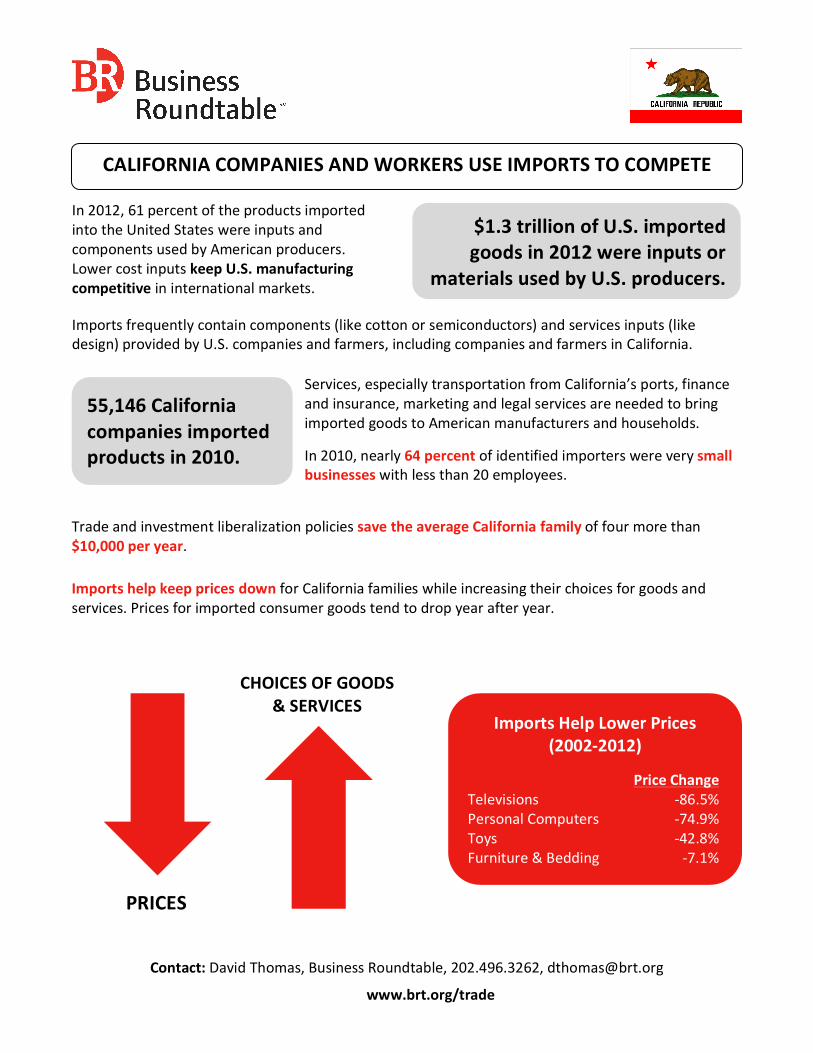
CALIFORNIA COMPANIES AND WORKERS USE IMPORTS TO COMPETE
Imports frequently contain components (like cotton or semiconductors) and services inputs (like design) provided by U.S. companies and farmers, including companies and farmers in California.
55,146 California companies imported products in 2010.
Services, especially transportation from California’s ports, finance and insurance, marketing and legal services are needed to bring imported goods to American manufacturers and households.
In 2010, nearly 64 percent of identified importers were very small businesses with less than 20 employees.
Imports Help Lower Prices (2002-‐2012)
Price Change Televisions -‐86.5% Personal Computers -‐74.9% Toys -‐42.8% Furniture & Bedding -‐7.1%
Trade and investment liberalization policies save the average California family of four more than $10,000 per year. Imports help keep prices down for California families while increasing their choices for goods and services. Prices for imported consumer goods tend to drop year after year.
PRICES
CHOICES OF GOODS & SERVICES
In 2012, 61 percent of the products imported into the United States were inputs and components used by American producers. Lower cost inputs keep U.S. manufacturing competitive in international markets.
$1.3 trillion of U.S. imported goods in 2012 were inputs or
materials used by U.S. producers.
Contact: David Thomas, Business Roundtable, 202.496.3262, [email protected]
www.brt.org/trade
CALIFORNIA NEEDS TRADE AGREEMENTS TO GROW
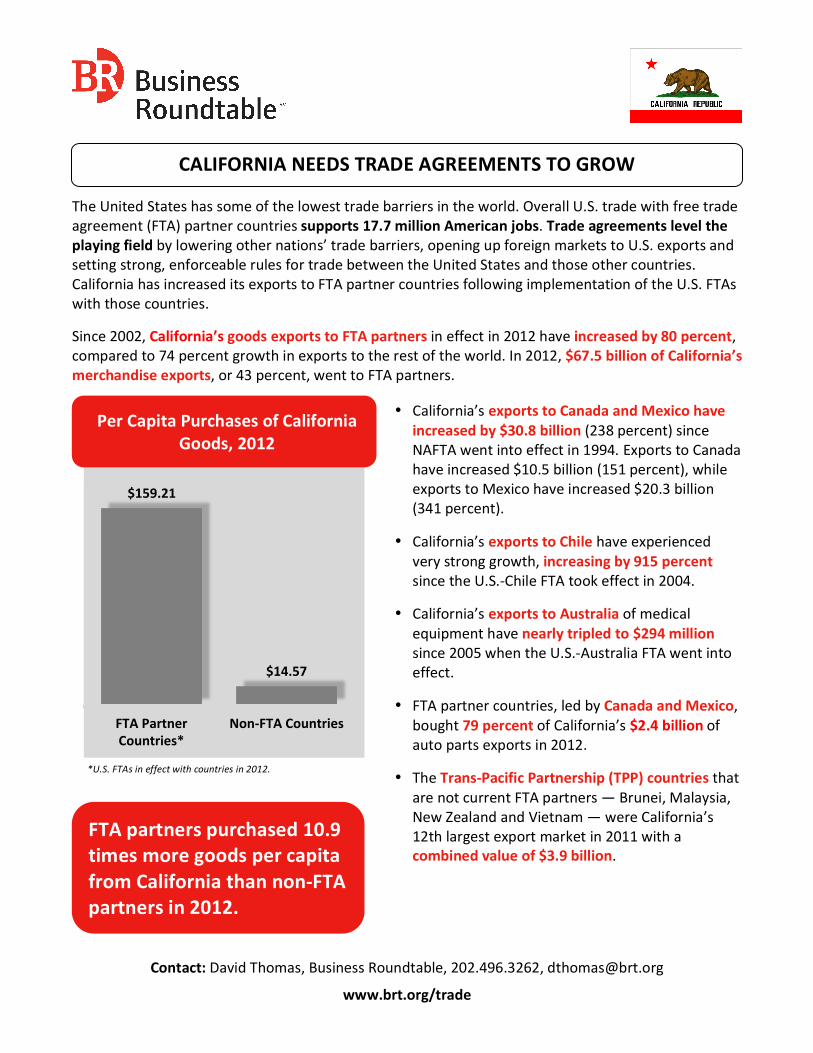
The United States has some of the lowest trade barriers in the world. Overall U.S. trade with free trade agreement (FTA) partner countries supports 17.7 million American jobs. Trade agreements level the playing field by lowering other nations’ trade barriers, opening up foreign markets to U.S. exports and setting strong, enforceable rules for trade between the United States and those other countries. California has increased its exports to FTA partner countries following implementation of the U.S. FTAs with those countries.
Since 2002, California’s goods exports to FTA partners in effect in 2012 have increased by 80 percent, compared to 74 percent growth in exports to the rest of the world. In 2012, $67.5 billion of California’s merchandise exports, or 43 percent, went to FTA partners.
• California’s exports to Canada and Mexico have increased by $30.8 billion (238 percent) since NAFTA went into effect in 1994. Exports to Canada have increased $10.5 billion (151 percent), while exports to Mexico have increased $20.3 billion (341 percent).
• California’s exports to Chile have experienced very strong growth, increasing by 915 percent since the U.S.-‐Chile FTA took effect in 2004.
• California’s exports to Australia of medical equipment have nearly tripled to $294 million since 2005 when the U.S.-‐Australia FTA went into effect.
• FTA partner countries, led by Canada and Mexico, bought 79 percent of California’s $2.4 billion of auto parts exports in 2012.
• The Trans-‐Pacific Partnership (TPP) countries that are not current FTA partners — Brunei, Malaysia, New Zealand and Vietnam — were California’s 12th largest export market in 2011 with a combined value of $3.9 billion.
FTA partners purchased 10.9 times more goods per capita from California than non-‐FTA partners in 2012.
$159.21
$14.57
FTA Partner Countries*
Non-‐FTA Countries
Per Capita Purchases of California Goods, 2012
*U.S. FTAs in effect with countries in 2012.
Contact: David Thomas, Business Roundtable, 202.496.3262, [email protected]
www.brt.org/trade
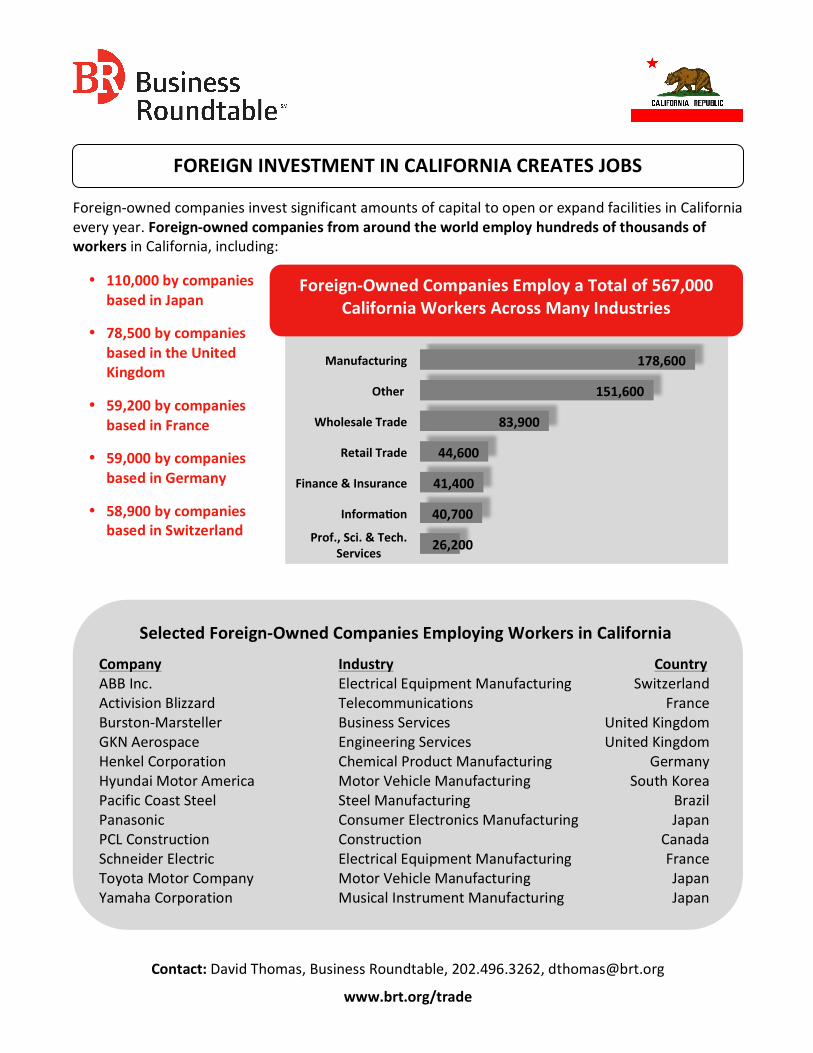
178,600
151,600
83,900
44,600
41,400
40,700
26,200
Manufacturing
Other
Wholesale Trade
Retail Trade
Finance & Insurance
Informajon
Prof., Sci. & Tech. Services
Foreign-‐Owned Companies Employ a Total of 567,000 California Workers Across Many Industries
FOREIGN INVESTMENT IN CALIFORNIA CREATES JOBS
Foreign-‐owned companies invest significant amounts of capital to open or expand facilities in California every year. Foreign-‐owned companies from around the world employ hundreds of thousands of workers in California, including:
• 110,000 by companies based in Japan
• 78,500 by companies based in the United Kingdom
• 59,200 by companies based in France
• 59,000 by companies based in Germany
• 58,900 by companies based in Switzerland
Selected Foreign-‐Owned Companies Employing Workers in California
Company Industry Country ABB Inc. Electrical Equipment Manufacturing Switzerland Activision Blizzard Telecommunications France Burston-‐Marsteller Business Services United Kingdom GKN Aerospace Engineering Services United Kingdom Henkel Corporation Chemical Product Manufacturing Germany Hyundai Motor America Motor Vehicle Manufacturing South Korea Pacific Coast Steel Steel Manufacturing Brazil Panasonic Consumer Electronics Manufacturing Japan PCL Construction Construction Canada Schneider Electric Electrical Equipment Manufacturing France Toyota Motor Company Motor Vehicle Manufacturing Japan Yamaha Corporation Musical Instrument Manufacturing Japan
Contact: David Thomas, Business Roundtable, 202.496.3262, [email protected]
www.brt.org/trade
DATA SOURCES
CALIFORNIA JOBS DEPEND ON TWO-‐WAY TRADE Jobs-‐Tied-‐to-‐Trade: Baughman and Francois, “Trade and American Jobs, The Impact of Trade on U.S. and State-‐Level
Employment: An Update” (2010) (http://businessroundtable.org/uploads/studies-‐reports/downloads/Trade_and_American_Jobs.pdf) as further updated by Business Roundtable, “How the U.S. Economy Benefits from International Trade and Investment”
Exporting Firm Wages: Riker, “Do Jobs in Export Industries Still Pay More? And Why?” (2010) (http://www.trade.gov/mas/ian/build/groups/public/.../tg_ian_003208.pdf)
Exporting Firm Growth: Bernard and Jensen, “Exporting and Productivity in the U.S.” (2004) (http://mba.tuck.dartmouth.edu/pages/faculty/andrew.bernard/exprod.pdf)
Small and Large Firms Partnering to Export: Slaughter, “American Companies and Global Supply Networks” (2013) (http://businessroundtable.org/uploads/studies-‐reports/downloads/BRT-‐SlaughterPaper-‐singles-‐Dec21.pdf)
CALIFORNIA BUSINESSES GROW WITH EXPORTS Exports, Rankings, and Trends: The Trade Partnership, derived from U.S. Census Bureau (“Census”) data
(http://www.tradepartnership.com/site/data.html) Exporting Company Information: Census, “A Profile of U.S. Importing and Exporting Companies, 2009 – 2010”
(http://www.census.gov/foreign-‐trade/Press-‐Release/edb/2010/index.html) CALIFORNIA COMPANIES EXPORT THROUGHOUT THE WORLD Exports, Rankings, and Trends: The Trade Partnership (http://www.tradepartnership.com/site/data.html) Export vs. GDP Growth: Derived from Census export data and U.S. Bureau of Economic Analysis (BEA) “GDP by State”
database (http://bea.gov/regional/index.htm) CALIFORNIA COMPANIES AND WORKERS USE IMPORTS TO COMPETE Importing Company Information: Census, “A Profile of U.S. Importing and Exporting Companies, 2009 – 2010”
(http://www.census.gov/foreign-‐trade/Press-‐Release/edb/2010/index.html) Imports as Components: Derived from Census end-‐use import data Savings from Liberalization: Bradford, Grieco, and Hufbauer, “The Payoff to America from Global Integration” (2005)
(http://www.piie.com/publications/papers/2iie3802.pdf) Price Changes: Derived from BLS Consumer Price Index database (http://www.bls.gov/cpi/) CALIFORNIA NEEDS TRADE AGREEMENTS TO GROW Exports and Trends: The Trade Partnership (http://www.tradepartnership.com/site/data.html) Per Capita Purchases of California Goods: Derived from The Trade Partnership
(http://www.tradepartnership.com/site/data.html) and World Bank population estimates Jobs-‐Tied-‐to-‐FTAs: U.S. Chamber of Commerce, “Opening Markets, Creating Jobs: Estimated U.S. Employment Effects of
Trade with FTA Partners” (2010) (http://tradepartnership.com/pdf_files/US%20Chamber%20-‐%20Opening%20Markets,%20Creating%20Jobs%20study.pdf)
FOREIGN INVESTMENT IN CALIFORNIA CREATES JOBS Employment Data: BEA “Direct Investment & Multinational Companies” database
(http://bea.gov/iTable/index_MNC.cfm) Foreign Investors: Uniworld BP database of “Foreign Firms Operating in the United States”
(http://www.uniworldbp.com)
Contact: David Thomas, Business Roundtable, 202.496.3262, [email protected]
www.brt.org/trade


![[A4] XIAOMEI_Guangzhou BRT and New BRT in China - Ed](https://img.pdfslide.us/doc/110x75/577ce47b1a28abf1038e73a0/a4-xiaomeiguangzhou-brt-and-new-brt-in-china-ed.jpg)