Embed Size (px)
Citation preview
8/7/2019 Broadcom Financial Analysis
http://slidepdf.com/reader/full/broadcom-financial-analysis 1/86
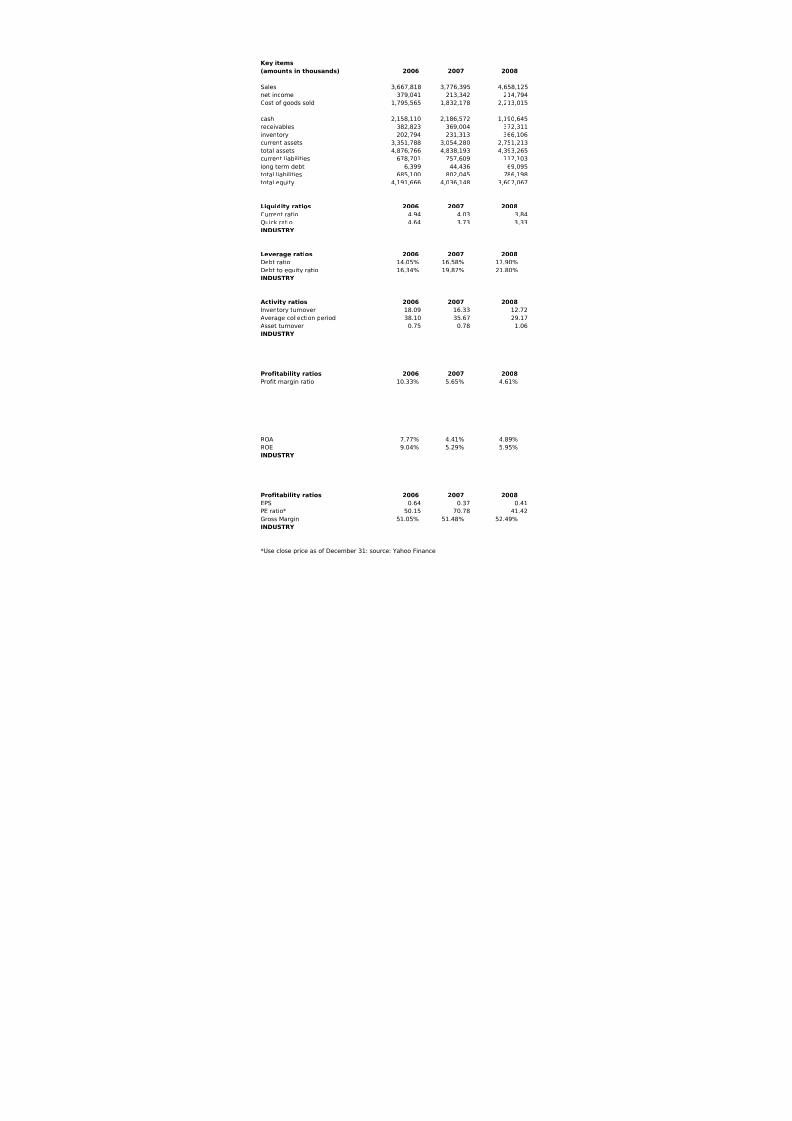
Key items
(amounts in thousands) 2006 2007 2008
Sales 3,667,818 3,776,395 4,658,125
net income 379,041 213,342 214,794
Cost of goods sold 1,795,565 1,832,178 2,213,015
cash 2,158,110 2,186,572 1,190,645
receivables 382,823 369,004 372,311
inventory 202,794 231,313 366,106
current assets 3,351,788 3,054,280 2,751,213
total assets 4,876,766 4,838,193 4,393,265
current liabilities 678,701 757,609 717,103
long term debt 6,399 44,436 69,095
total liabilities 685,100 802,045 786,198
total equity 4,191,666 4,036,148 3,607,067
Liquidity ratios 2006 2007 2008
Current ratio 4.94 4.03 3.84
Quick ratio 4.64 3.73 3.33
INDUSTRY
Leverage ratios 2006 2007 2008
Debt ratio 14.05% 16.58% 17.90%
Debt to equity ratio 16.34% 19.87% 21.80%
INDUSTRY
Activity ratios 2006 2007 2008
Inventory turnover 18.09 16.33 12.72
Average collection period 38.10 35.67 29.17
Asset turnover 0.75 0.78 1.06INDUSTRY
Profitability ratios 2006 2007 2008
Profit margin ratio 10.33% 5.65% 4.61%
8/7/2019 Broadcom Financial Analysis
http://slidepdf.com/reader/full/broadcom-financial-analysis 2/86
ROA 7.77% 4.41% 4.89%
ROE 9.04% 5.29% 5.95%
INDUSTRY
Profitability ratios 2006 2007 2008
EPS 0.64 0.37 0.41
PE ratio* 50.15 70.78 41.42
Gross Margin 51.05% 51.48% 52.49%
INDUSTRY
*Use close price as of December 31: source: Yahoo Finance

8/7/2019 Broadcom Financial Analysis
http://slidepdf.com/reader/full/broadcom-financial-analysis 3/86
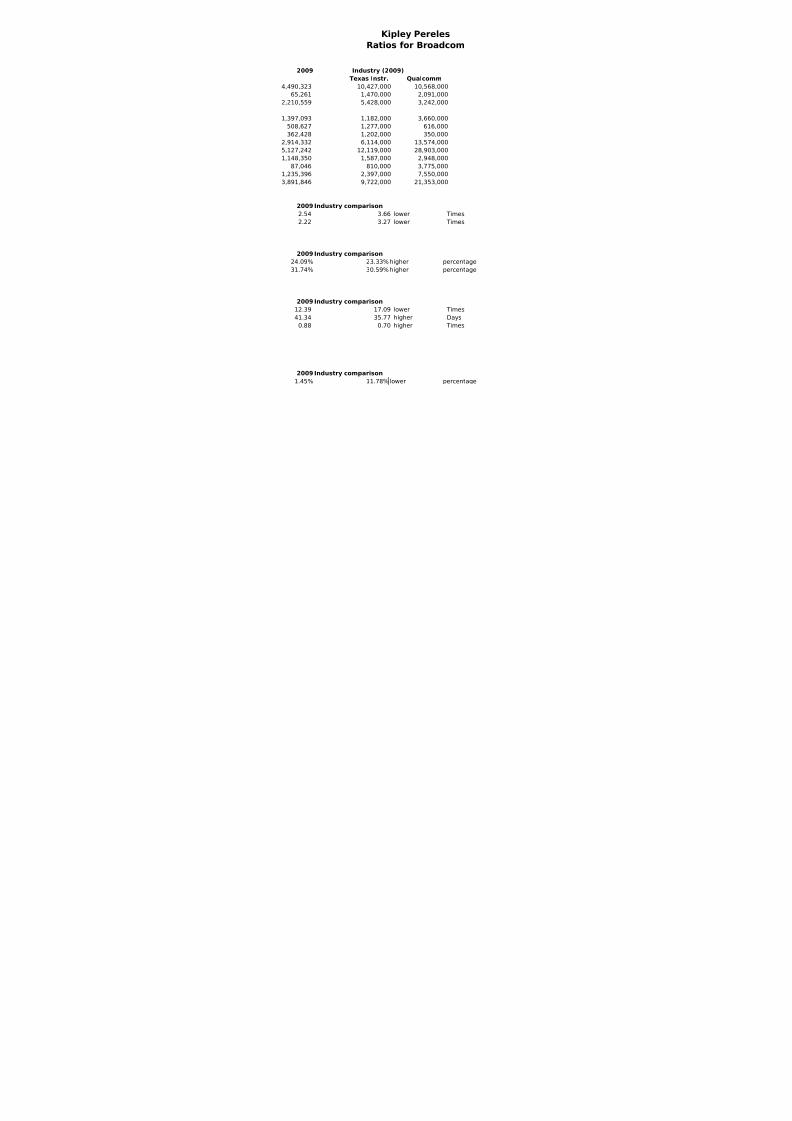
Kipley Pereles
Ratios for Broadcom
2009 Industry (2009)
Texas Instr. Qualcomm4,490,323 10,427,000 10,568,000
65,261 1,470,000 2,091,000
2,210,559 5,428,000 3,242,000
1,397,093 1,182,000 3,660,000
508,627 1,277,000 616,000
362,428 1,202,000 350,000
2,914,332 6,114,000 13,574,000
5,127,242 12,119,000 28,903,000
1,148,350 1,587,000 2,948,000
87,046 810,000 3,775,000
1,235,396 2,397,000 7,550,000
3,891,846 9,722,000 21,353,000
2009 Industry comparison
2.54 3.66 lower Times
2.22 3.27 lower Times
2009 Industry comparison
24.09% 23.33% higher percentage
31.74% 30.59% higher percentage
2009 Industry comparison
12.39 17.09 lower Times
41.34 35.77 higher Days
0.88 0.70 higher Times
2009 Industry comparison
1.45% 11.78% lower percentage
8/7/2019 Broadcom Financial Analysis
http://slidepdf.com/reader/full/broadcom-financial-analysis 4/86
1.27% 6.88% lower percentage
1.68% 8.86% lower percentage
2009 Industry comparison
0.13 0.84 lower Dollars
247.21 111.08 higher Times
50.77% 56.01% lower Percentage

8/7/2019 Broadcom Financial Analysis
http://slidepdf.com/reader/full/broadcom-financial-analysis 5/86
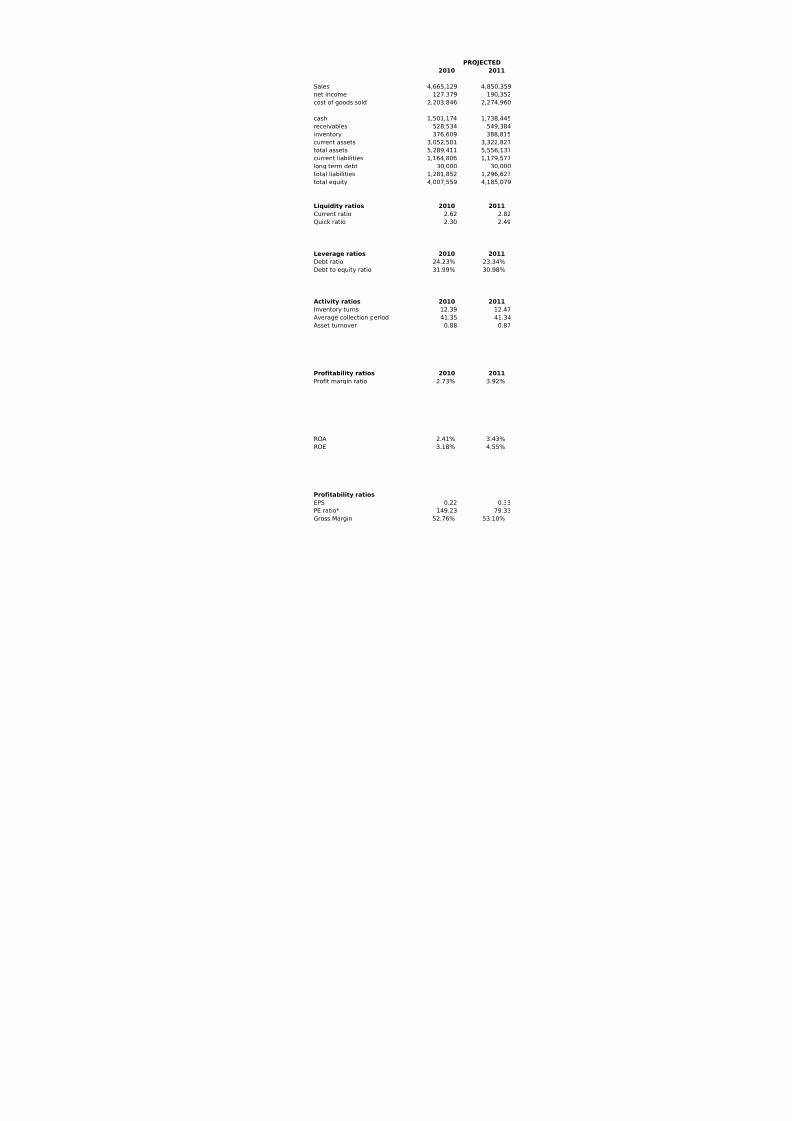
PROJECTED
2010 2011
Sales 4,665,129 4,850,359
net income 127,379 190,352
cost of goods sold 2,203,846 2,274,960
cash 1,501,174 1,738,445
receivables 528,534 549,384
inventory 376,609 388,815
current assets 3,052,501 3,322,827
total assets 5,289,411 5,556,137
current liabilities 1,164,806 1,179,577
long term debt 30,000 30,000
total liabilities 1,281,852 1,296,623
total equity 4,007,559 4,185,079
Liquidity ratios 2010 2011
Current ratio 2.62 2.82
Quick ratio 2.30 2.49
Leverage ratios 2010 2011
Debt ratio 24.23% 23.34%
Debt to equity ratio 31.99% 30.98%
Activity ratios 2010 2011
Inventory turns 12.39 12.47
Average collection period 41.35 41.34
Asset turnover 0.88 0.87
Profitability ratios 2010 2011
Profit margin ratio 2.73% 3.92%

8/7/2019 Broadcom Financial Analysis
http://slidepdf.com/reader/full/broadcom-financial-analysis 6/86
ROA 2.41% 3.43%
ROE 3.18% 4.55%
Profitability ratios
EPS 0.22 0.33
PE ratio* 149.23 79.33
Gross Margin 52.76% 53.10%

8/7/2019 Broadcom Financial Analysis
http://slidepdf.com/reader/full/broadcom-financial-analysis 7/86
2012
5,046,789
266,159
2,349,701
2,034,485
571,631
401,727
3,654,027
5,891,177
1,195,109
30,000
1,312,155
4,430,152
2012
3.06
2.72
2012
22.27%
29.62%
2012
12.56
41.34
0.86
2012
5.27%
8/7/2019 Broadcom Financial Analysis
http://slidepdf.com/reader/full/broadcom-financial-analysis 8/86
4.52%
6.01%
0.51
33.42
53.44%

8/7/2019 Broadcom Financial Analysis
http://slidepdf.com/reader/full/broadcom-financial-analysis 9/86
roadcom vs. Industry Liquidity Ratios: Current Rati Broadc
Broadcom vs. Industry Leverage Ratios: Debt Ratio com

8/7/2019 Broadcom Financial Analysis
http://slidepdf.com/reader/full/broadcom-financial-analysis 10/86
om vs. Industry Activity Ratios: Inventory Turnove m vs.
com vs. Industry Activity Ratios: Asset Turnover om

8/7/2019 Broadcom Financial Analysis
http://slidepdf.com/reader/full/broadcom-financial-analysis 11/86
m vs. Industry Profitability Ratios: Return on Asse mvs.
vs. Industry Profitability Ratios: Earnings per Sh m vs.
8/7/2019 Broadcom Financial Analysis
http://slidepdf.com/reader/full/broadcom-financial-analysis 12/86
com vs. Industry Profitability Ratios: Gross Margin
8/7/2019 Broadcom Financial Analysis
http://slidepdf.com/reader/full/broadcom-financial-analysis 13/86
om vs. Industry Liquidity Ratios: Quick Rati
s. Industry Leverage Ratios: Debt-to-Equity

8/7/2019 Broadcom Financial Analysis
http://slidepdf.com/reader/full/broadcom-financial-analysis 14/86
Industry Activity Ratios: Avg Collection Peri
s. Industry Profitability Ratios: Profit Margi
8/7/2019 Broadcom Financial Analysis
http://slidepdf.com/reader/full/broadcom-financial-analysis 15/86
Industry Profitability Ratios: Return on Equi
Industry Profitability Ratios: Price-to-Earnin
8/7/2019 Broadcom Financial Analysis
http://slidepdf.com/reader/full/broadcom-financial-analysis 16/86

8/7/2019 Broadcom Financial Analysis
http://slidepdf.com/reader/full/broadcom-financial-analysis 17/86
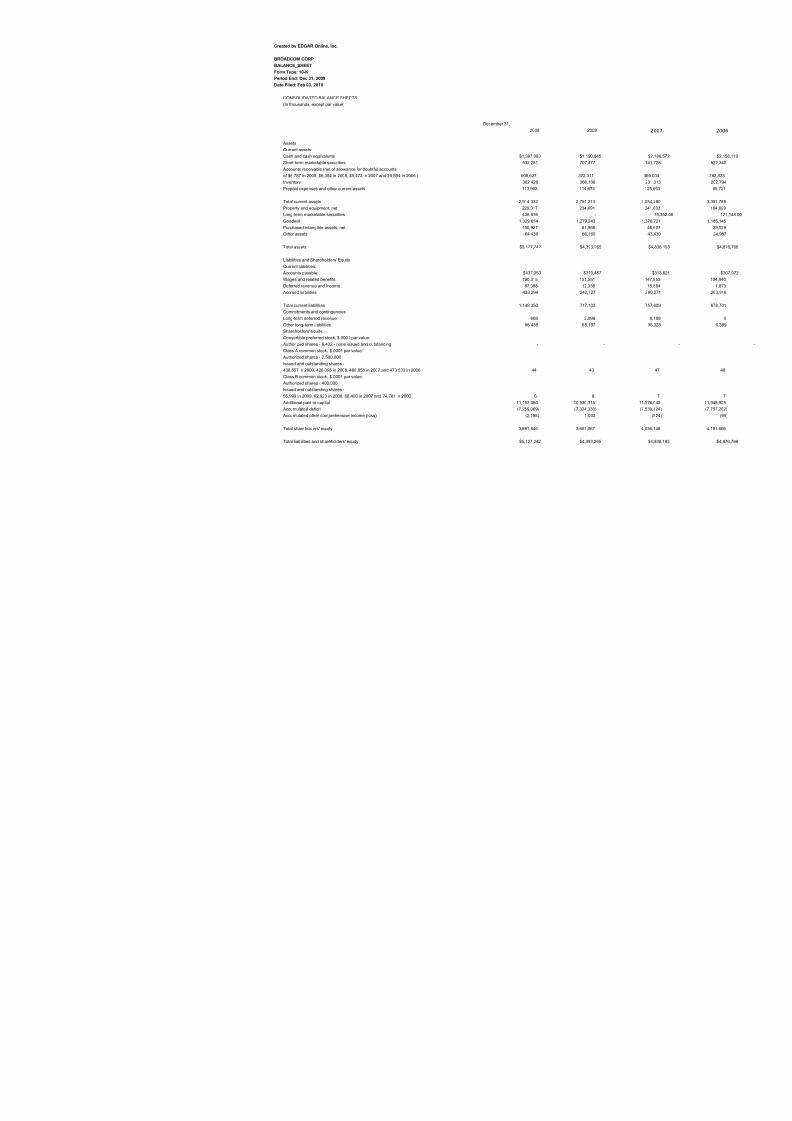
Created by EDGAR Online, Inc.
BROADCOM CORP
BALANCE_SHEET
Form Type: 10-K
Period End: Dec 31, 2009
Date Filed: Feb 03, 2010
CONSOLIDATED BALANCE SHEETS
(In thousands, except par value)
December 31,
2009
Assets
Current assets:
Cash and cash equivalents $1,397,09
Short-term marketable securities 532,281Accounts receivable (net of allowance for doubtful accounts
of $6,787 in 2009, $5,354 in 2008, $5,472 in 2007 and $6,894 in 2006 ) 508,627
Inventory 362,428
Prepaid expenses and other current assets 113,903
Total current assets 2,914,332
Property and equipment, net 229,317
Long-term marketable securities 438,616
Goodwill 1,329,614
Purchased intangible assets, net 150,927
Other assets 64,436
Total assets $5,127,24
Liabilities and Shareholders' Equity
Current liabilities:
Accounts payable $437,35
Wages and related benefits 190,315
Deferred revenue and income 87,388
Accrued liabilities 433,294
Total current liabilities 1,148,350
Commitments and contingencies
Long-term deferred revenue 608
Other long-term liabilities 86,438Shareholders' equity:
Convertible preferred stock, $.0001 par value:
Authorized shares - 6,432 - none issued and outstanding -
Class A common stock, $.0001 par value:
Authorized shares - 2,500,000
Issued and outstanding shares -
438,557 in 2009, 426,095 in 2008, 468,858 in 2007 and 473,533 in 2006 44
Class B common stock, $.0001 par value:
Authorized shares - 400,000
Issued and outstanding shares -
56,999 in 2009, 62,923 in 2008, 68,400 in 2007 and 74,781 in 2006 6
Additional paid-in capital 11,153,060
Accumulated deficit (7,259,069)
Accumulated other comprehensive income (loss) (2,195)

8/7/2019 Broadcom Financial Analysis
http://slidepdf.com/reader/full/broadcom-financial-analysis 18/86
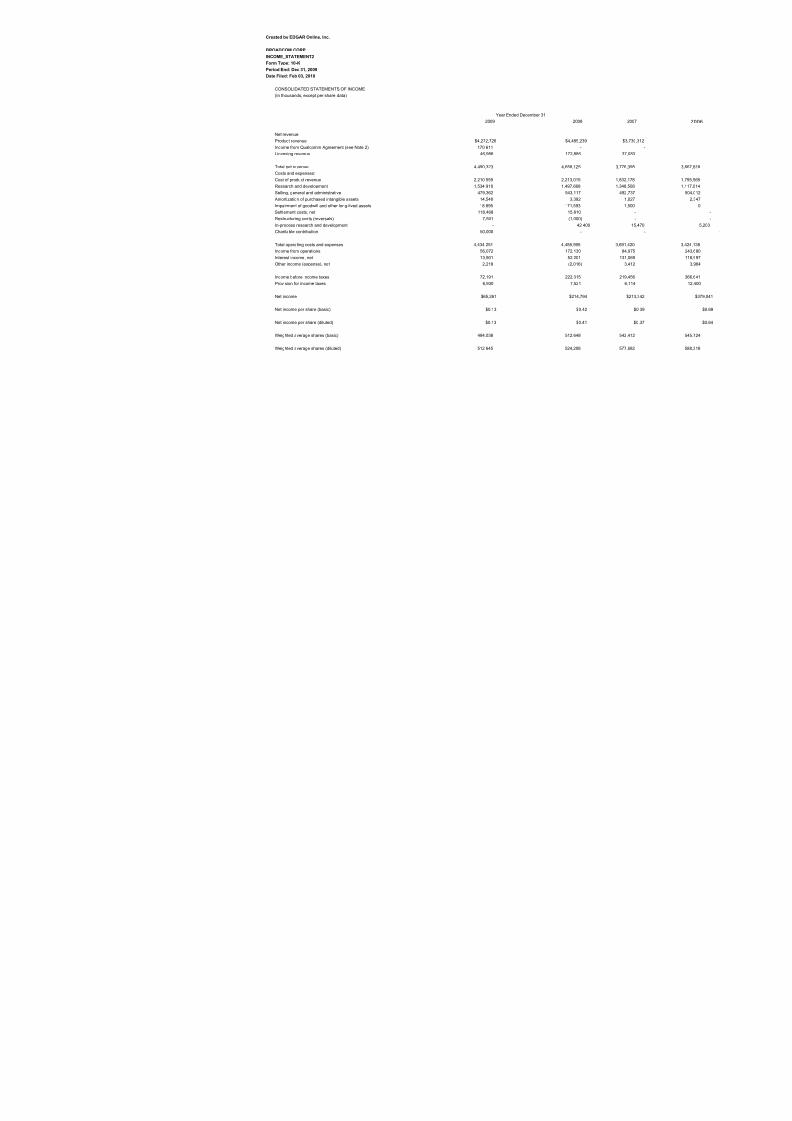
Created by EDGAR Online, Inc.
BROADCOM CORP
INCOME_STATEMENT2
Form Type: 10-K
Period End: Dec 31, 2009
Date Filed: Feb 03, 2010
CONSOLIDATED STATEMENTS OF INCOME
(In thousands, except per share data)
Year Ended Decembe
2009
Net revenue:
Product revenue $4,272,726
Income from Qualcomm Agreement (see Note 2) 170,611
Licensing revenue 46,986
Total net revenue 4,490,323
Costs and expenses:
Cost of product revenue 2,210,559
Research and development 1,534,918
Selling, general and administrative 479,362
Amortization of purchased intangible assets 14,548
Impairment of goodwill and other long-lived assets 18,895
Settlement costs, net 118,468
Restructuring costs (reversals) 7,501
In-process research and development -
Charitable contribution 50,000
Total operating costs and expenses 4,434,251
Income from operations 56,072
Interest income, net 13,901
Other income (expense), net 2,218
Income before income taxes 72,191
Provision for income taxes 6,930
Net income $65,261
Net income per share (basic) $0.13
Net income per share (diluted) $0.13
Weighted average shares (basic) 494,038
Weighted average shares (diluted) 512,645

8/7/2019 Broadcom Financial Analysis
http://slidepdf.com/reader/full/broadcom-financial-analysis 19/86
Created by EDGAR Online, Inc.
BROADCOM CORP
CASH_FLOW
Form Type: 10-K
Period End: Dec 31, 2009
Date Filed: Feb 03, 2010
CONSOLIDATED STATEMENTS OF CASH FLOWS
(In thousands)
Year End
2009
Operating activities
Net income $65,261
Adjustments to reconcile net income to net cashprovided by operating activities:
Depreciation and amortization 74,435
Stock-based compensation expense:
Stock options and other awards 159,790
Restricted stock units 336,557
Acquisition-related items:
Amortization of purchased intangible assets 30,744
Impairment of goodwill and long-lived assets 18,895
In-process research and development -
Loss on strategic investments, net
Non-cash restructuring reversals, net (1,944)
Loss (gain) on sale of marketable securities (1,046)
Changes in operating assets and liabilities:
Accounts receivable (131,656)
Inventory 12,013
Prepaid expenses and other assets 8,714
Accounts payable 122,985
Deferred revenue and income 71,760
Accrued settlement costs 170,500
Other accrued and long-term liabilities 49,885
Net cash provided by operating activities 986,893
Investing activities
Net purchases of property and equipment (66,570) Net cash paid for acquired companies (165,258)
Sales (purchases) of strategic investments (2,000)
Purchases of marketable securities (1,138,681)
Proceeds from sales and maturities of marketable
securities 871,152
Net cash provided by (used in) investing
activities (501,357)
Financing activities
Repurchases of Class A common stock (421,869)
Proceeds from issuance of common stock 227,209
Payments of assumed debt and other obligations 0
Repayment of notes receivable by employees 0
Minimum tax withholding paid on behalf of

8/7/2019 Broadcom Financial Analysis
http://slidepdf.com/reader/full/broadcom-financial-analysis 20/86
Created by EDGAR Online, Inc.
BROADCOM CORP
STOCKHOLDERS_EQUITY
Form Type: 10-K
Period End: Dec 31, 2009
Date Filed: Feb 03, 2010
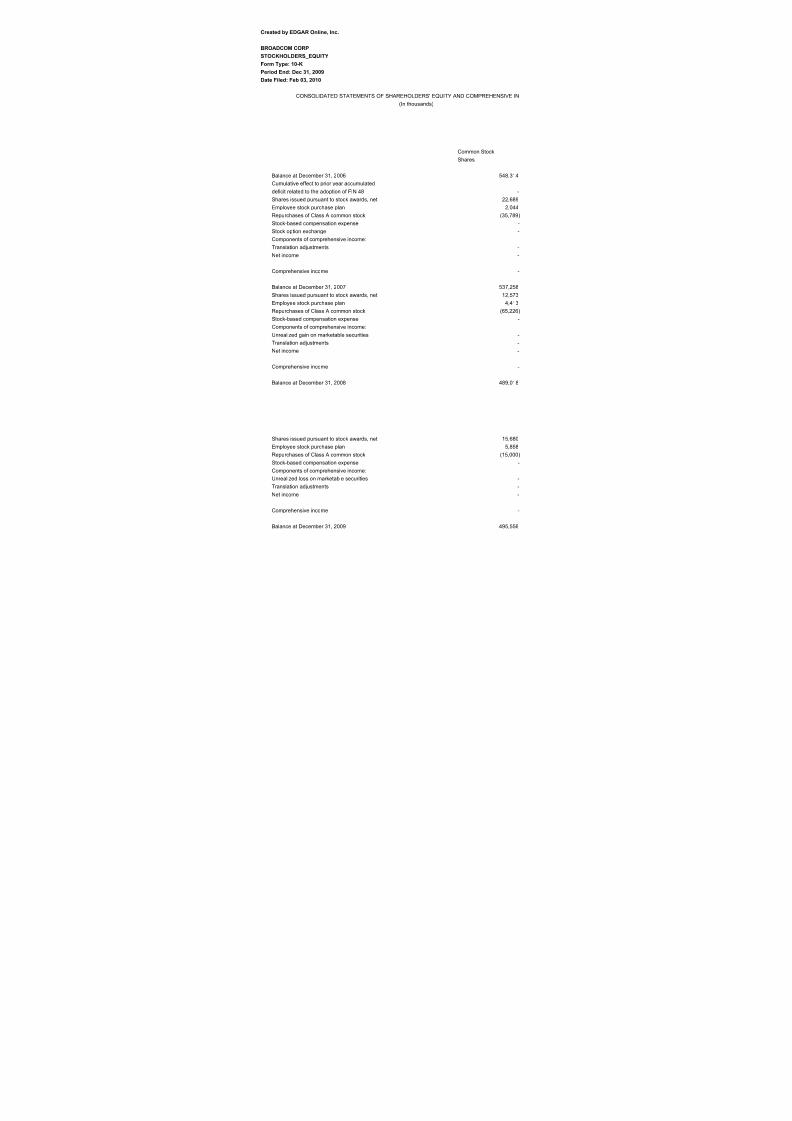
CONSOLIDATED STATEMENTS OF SHAREHOLDERS' EQUITY AND COMPREHENSIVE IN
(In thousands)
Common Stock
Shares
Balance at December 31, 2006 548,314
Cumulative effect to prior year accumulated
deficit related to the adoption of FIN 48 -
Shares issued pursuant to stock awards, net 22,689
Employee stock purchase plan 2,044
Repurchases of Class A common stock (35,789)
Stock-based compensation expense -
Stock option exchange -
Components of comprehensive income:
Translation adjustments -
Net income -
Comprehensive income -
Balance at December 31, 2007 537,258
Shares issued pursuant to stock awards, net 12,573
Employee stock purchase plan 4,413
Repurchases of Class A common stock (65,226)
Stock-based compensation expense -
Components of comprehensive income:
Unrealized gain on marketable securities -
Translation adjustments -
Net income -
Comprehensive income -
Balance at December 31, 2008 489,018

8/7/2019 Broadcom Financial Analysis
http://slidepdf.com/reader/full/broadcom-financial-analysis 21/86
Shares issued pursuant to stock awards, net 15,680
Employee stock purchase plan 5,858
Repurchases of Class A common stock (15,000)
Stock-based compensation expense -
Components of comprehensive income:
Unrealized loss on marketable securities -
Translation adjustments -Net income -
Comprehensive income -
Balance at December 31, 2009 495,556

8/7/2019 Broadcom Financial Analysis
http://slidepdf.com/reader/full/broadcom-financial-analysis 22/86
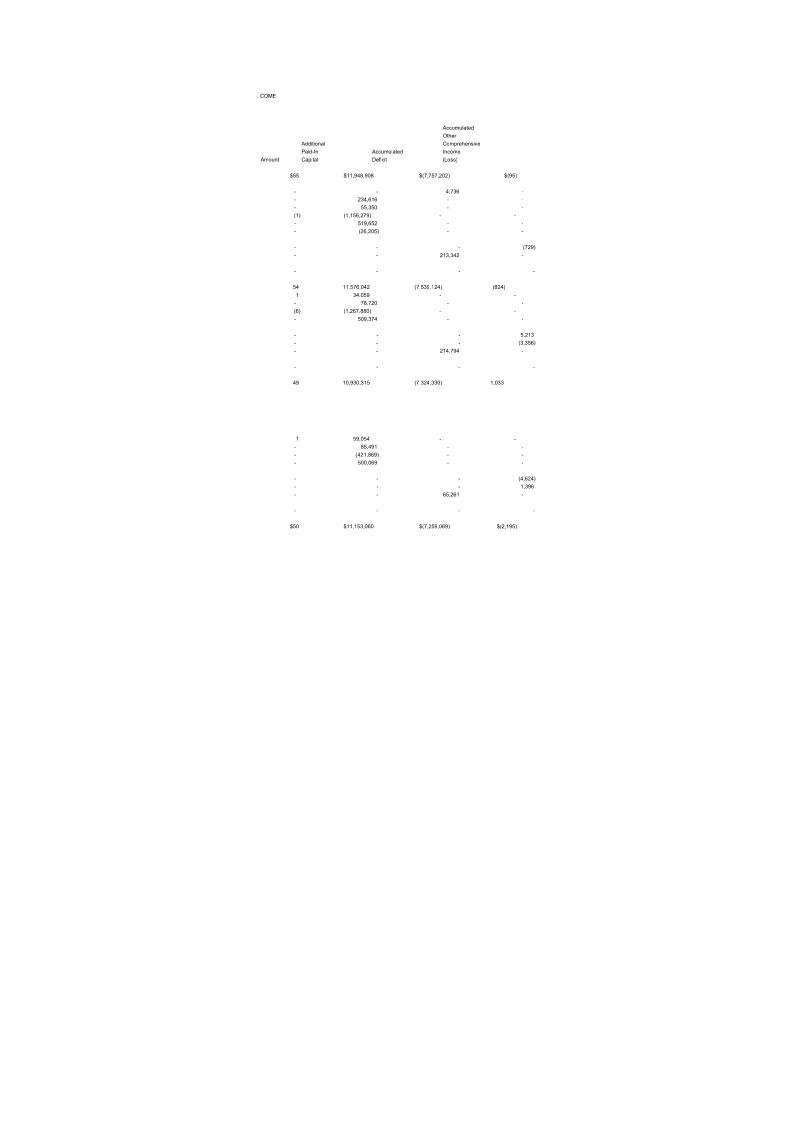
COME
Accumulated
Other
Additional Comprehensive
Paid-In Accumulated Income
Amount Capital Deficit (Loss)
$55 $11,948,908 $(7,757,202) $(95)
- - 4,736 -
- 234,616 - -
- 55,350 - -
(1) (1,156,279) - -
- 519,652 - -
- (26,205) - -
- - - (729)
- - 213,342 -
- - - -
54 11,576,042 (7,539,124) (824)
1 34,059 - -
- 78,720 - -
(6) (1,267,880) - -
- 509,374 - -
- - - 5,213
- - - (3,356)
- - 214,794 -
- - - -
49 10,930,315 (7,324,330) 1,033

8/7/2019 Broadcom Financial Analysis
http://slidepdf.com/reader/full/broadcom-financial-analysis 23/86
1 59,054 - -
- 85,491 - -
- (421,869) - -
- 500,069 - -
- - - (4,624)
- - - 1,396- - 65,261 -
- - - -
$50 $11,153,060 $(7,259,069) $(2,195)
8/7/2019 Broadcom Financial Analysis
http://slidepdf.com/reader/full/broadcom-financial-analysis 24/86
Total
Shareholders'
Equity
$4,191,666
4,736
234,616
55,350
(1,156,280)
519,652
(26,205)
(729)
213,342
212,613
4,036,148
34,060
78,720
(1,267,886)
509,374
5,213
(3,356)
214,794
216,651
3,607,067
8/7/2019 Broadcom Financial Analysis
http://slidepdf.com/reader/full/broadcom-financial-analysis 25/86
59,055
85,491
(421,869)
500,069
(4,624)
1,39665,261
62,033
$3,891,846
8/7/2019 Broadcom Financial Analysis
http://slidepdf.com/reader/full/broadcom-financial-analysis 26/86
R&D Expense Broadcom Texas Instruments Qualcomm
2006 1,117,014 2,195,000 1,538,000
2007 1,349,508 2,140,000 1,829,000
2008 1,497,668 1,940,000 2,281,000
2009 1,534,918 1,476,000 2,432,000
Percentage of Revenue Broadcom Texas Instruments Qualcomm
2006 30.45% 15.40% 20.44%
2007 35.74% 15.47% 20.62%
2008 32.15% 15.52% 20.47%
2009 34.18% 14.16% 22.82%
1 2 3
30.45%
35.74%32.15%
5.40% 15.47% 15.52%
0.44% 20.62% 20.47%
R&D Expenditure Ratios
Column B Column C Column D

8/7/2019 Broadcom Financial Analysis
http://slidepdf.com/reader/full/broadcom-financial-analysis 27/86
4
3
14.16
22.82
1 2 3
17,014
1,349,5081,497,668
95,000 2,140,0001,940,000
38,000
1,829,000
2,281,000
R&D Expenditure Ratios
Column B Column C Column D
8/7/2019 Broadcom Financial Analysis
http://slidepdf.com/reader/full/broadcom-financial-analysis 28/86
4
1,534,91,476,0
2,432,0

8/7/2019 Broadcom Financial Analysis
http://slidepdf.com/reader/full/broadcom-financial-analysis 29/86
Created by EDGAR Online, Inc.
BROADCOM CORP
INCOME_STATEMENT
Form Type: 10-K
Period End: Dec 31, 2009
Date Filed: Feb 03, 2010
Broadband
Communications
Year ended December 31, 2009
Net revenue $1,525,193
Operating income (loss) 172,702
Year ended December 31, 2008
Net revenue $1,722,671
Operating income (loss) 381,421
Year ended December 31, 2007
Net revenue $1,412,293
Operating income (loss) 312,672
8/7/2019 Broadcom Financial Analysis
http://slidepdf.com/reader/full/broadcom-financial-analysis 30/86
Reportable Segments
Mobile & Enterprise All
Wireless Networking Other
(In thousands)
$1,719,998 $1,055,553 $189,579
116,882 286,303 (519,815)
$1,528,178 $1,258,044 $149,232
33,974 390,293 (633,558)
$1,192,634 $1,139,668 $31,800
4,955 267,946 (500,598)

8/7/2019 Broadcom Financial Analysis
http://slidepdf.com/reader/full/broadcom-financial-analysis 31/86
Consolidated
$4,490,323
56,072
$4,658,125
172,130
$3,776,395
84,975
8/7/2019 Broadcom Financial Analysis
http://slidepdf.com/reader/full/broadcom-financial-analysis 32/86
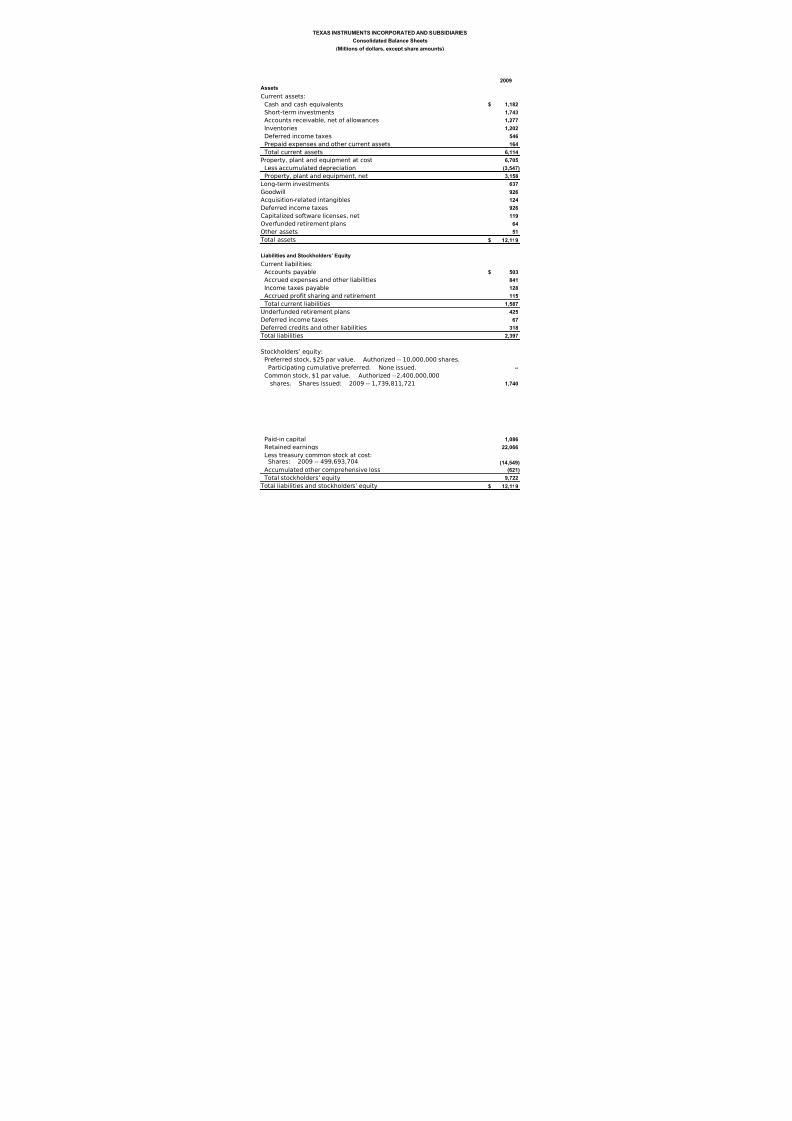
TEXAS INSTRUMENTS INCORPORATED AND SUBSIDIARIES
Consolidated Balance Sheets
(Millions of dollars, except share amounts)
2009Assets
Current assets:
Cash and cash equivalents $ 1,182
Short-term investments 1,743
Accounts receivable, net of allowances 1,277
Inventories 1,202
Deferred income taxes 546
Prepaid expenses and other current assets 164
Total current assets 6,114
Property, plant and equipment at cost 6,705Less accumulated depreciation (3,547)
Property, plant and equipment, net 3,158
Long-term investments 637
Goodwill 926
Acquisition-related intangibles 124
Deferred income taxes 926
Capitalized software licenses, net 119
Overfunded retirement plans 64
Other assets 51
Total assets $ 12,119
Liabilities and Stockholders’ Equity
Current liabilities:
Accounts payable $ 503
Accrued expenses and other liabilities 841
Income taxes payable 128
Accrued profit sharing and retirement 115
Total current liabilities 1,587
Underfunded retirement plans 425
Deferred income taxes 67
Deferred credits and other liabilities 318
Total liabilities 2,397
Stockholders’ equity:
Preferred stock, $25 par value. Authorized -- 10,000,000 shares.
Participating cumulative preferred. None issued. --
Common stock, $1 par value. Authorized --2,400,000,000
shares. Shares issued: 2009 -- 1,739,811,721 1,740
8/7/2019 Broadcom Financial Analysis
http://slidepdf.com/reader/full/broadcom-financial-analysis 33/86
8/7/2019 Broadcom Financial Analysis
http://slidepdf.com/reader/full/broadcom-financial-analysis 34/86
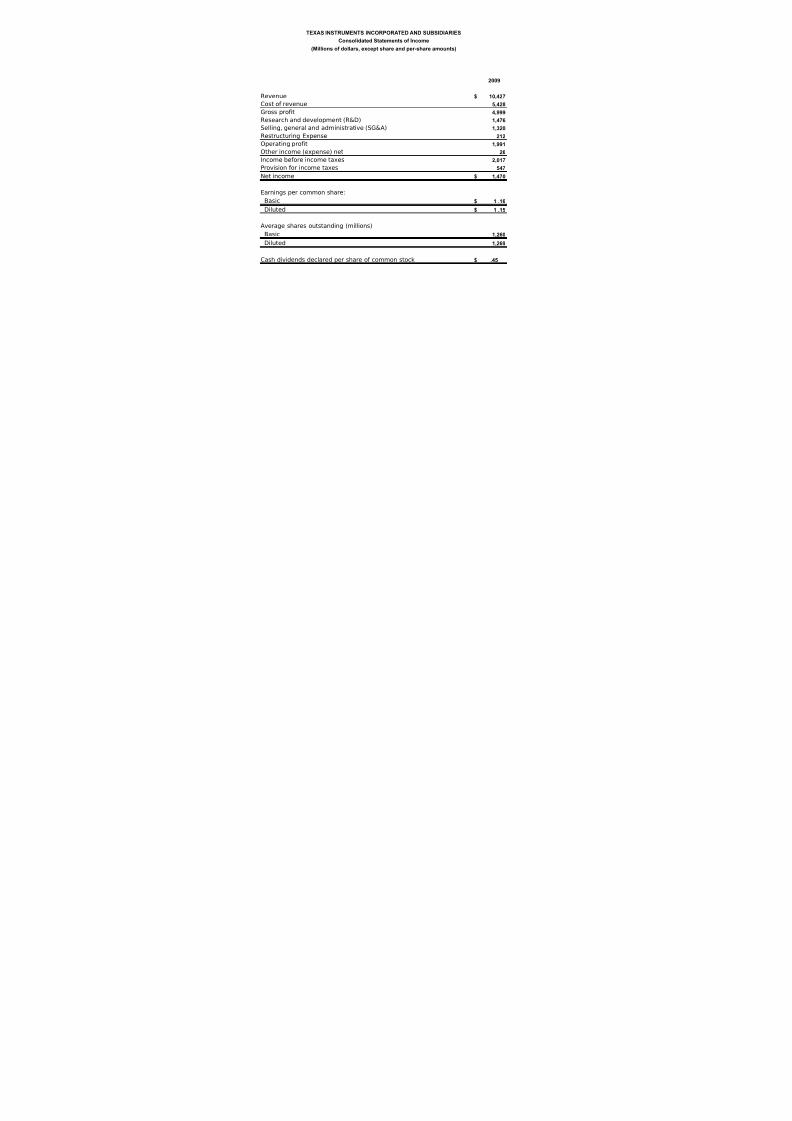
TEXAS INSTRUMENTS INCORPORATED AND SUBSIDIARIES
Consolidated Statements of Income
(Millions of dollars, except share and per-share amounts)
2009
Revenue $ 10,427
Cost of revenue 5,428
Gross profit 4,999
Research and development (R&D) 1,476
Selling, general and administrative (SG&A) 1,320
Restructuring Expense 212
Operating profit 1,991
Other income (expense) net 26
Income before income taxes 2,017Provision for income taxes 547
Net income $ 1,470
Earnings per common share:
Basic $ 1 .16
Diluted $ 1 .15
Average shares outstanding (millions):
Basic 1,260
Diluted 1,269
Cash dividends declared per share of common stock $ .45
8/7/2019 Broadcom Financial Analysis
http://slidepdf.com/reader/full/broadcom-financial-analysis 35/86
8/7/2019 Broadcom Financial Analysis
http://slidepdf.com/reader/full/broadcom-financial-analysis 36/86
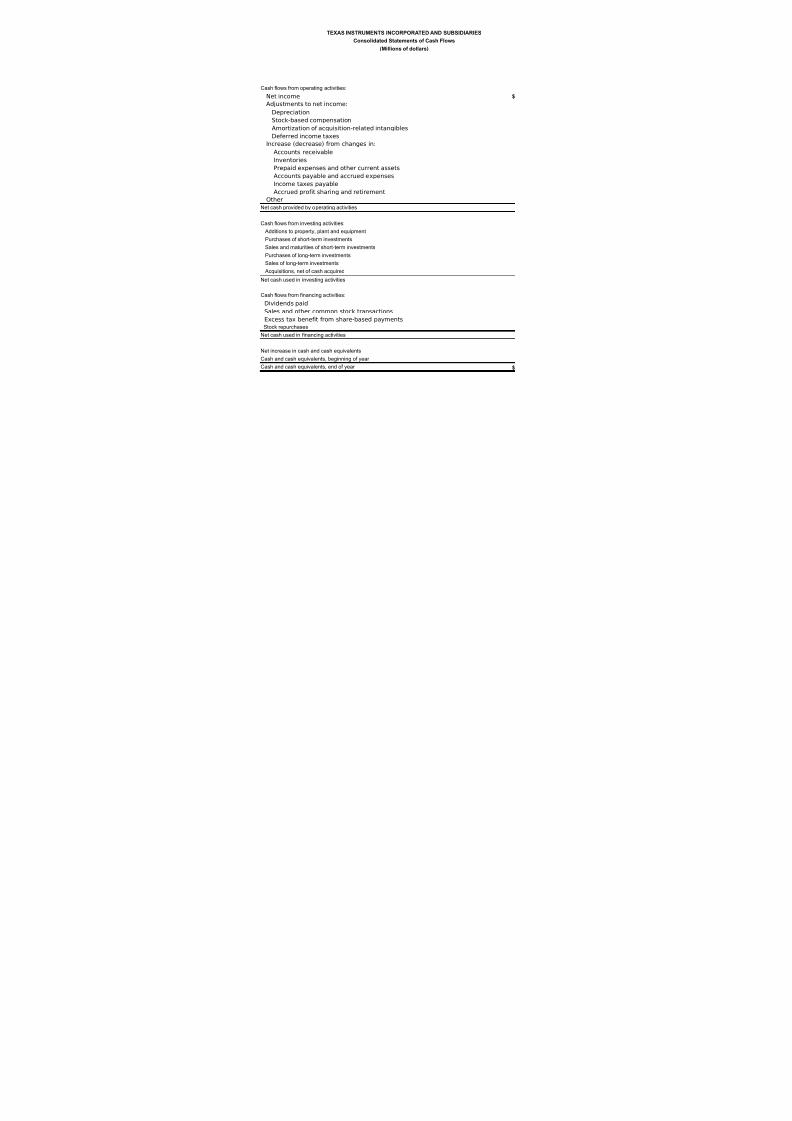
TEXAS INSTRUMENTS INCORPORATED AND SUBSIDIARIES
Consolidated Statements of Cash Flows
(Millions of dollars)
Cash flows from operating activities:
Net income $
Adjustments to net income:
Depreciation
Stock-based compensation
Amortization of acquisition-related intangibles
Deferred income taxes
Increase (decrease) from changes in:
Accounts receivable
InventoriesPrepaid expenses and other current assets
Accounts payable and accrued expenses
Income taxes payable
Accrued profit sharing and retirement
Other
Net cash provided by operating activities
Cash flows from investing activities:
Additions to property, plant and equipment
Purchases of short-term investments
Sales and maturities of short-term investments
Purchases of long-term investments
Sales of long-term investments
Acquisitions, net of cash acquired
Net cash used in investing activities
Cash flows from financing activities:
Dividends paid
Sales and other common stock transactions
Excess tax benefit from share-based payments
Stock repurchases
Net cash used in financing activities
Net increase in cash and cash equivalents
Cash and cash equivalents, beginning of year
Cash and cash equivalents, end of year $

8/7/2019 Broadcom Financial Analysis
http://slidepdf.com/reader/full/broadcom-financial-analysis 37/86
2009
1470
877
186
48
146
(364)
17735
(17)
73
(16)
28
2,643
(753)
(2,273)
2,030
(9)
64
(155)
(1096)
(567)
109
1
(954)
(1,411)
136
1,046
1,182
8/7/2019 Broadcom Financial Analysis
http://slidepdf.com/reader/full/broadcom-financial-analysis 38/86
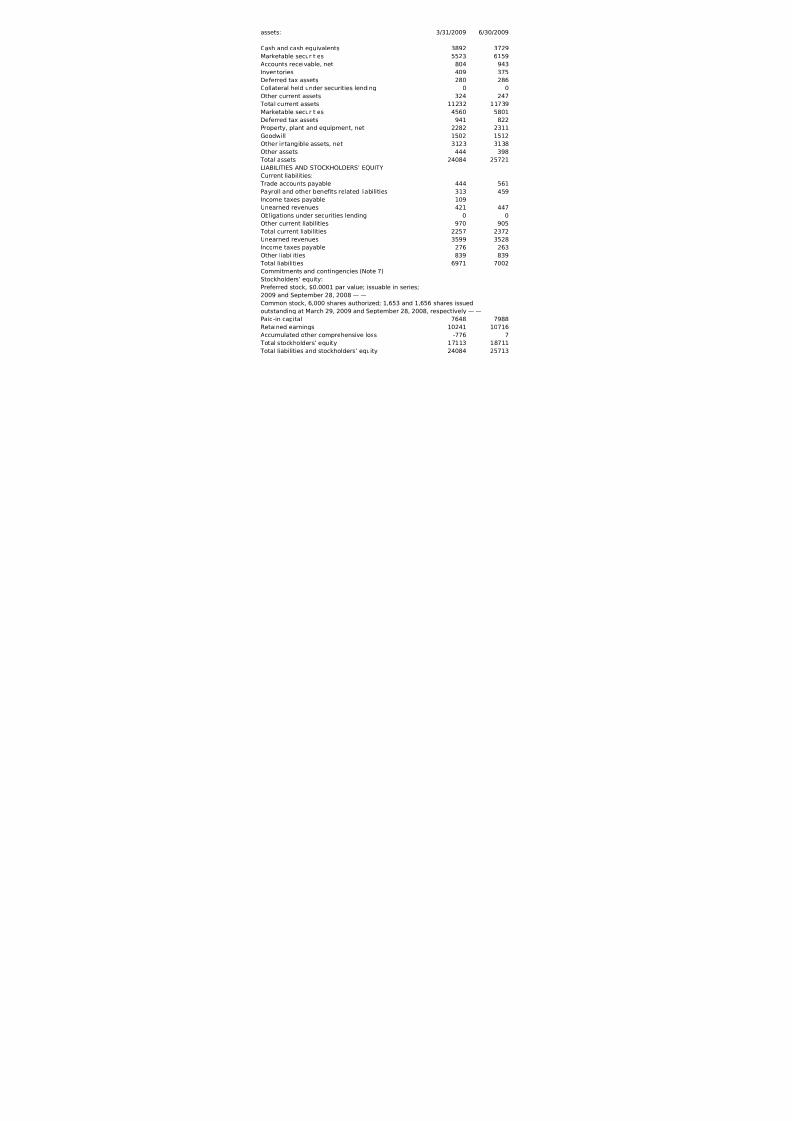
assets: 3/31/2009 6/30/2009
Cash and cash equivalents 3892 3729
Marketable securities 5523 6159
Accounts receivable, net 804 943
Inventories 409 375
Deferred tax assets 280 286Collateral held under securities lending 0 0
Other current assets 324 247
Total current assets 11232 11739
Marketable securities 4560 5801
Deferred tax assets 941 822
Property, plant and equipment, net 2282 2311
Goodwill 1502 1512
Other intangible assets, net 3123 3138
Other assets 444 398
Total assets 24084 25721LIABILITIES AND STOCKHOLDERS’ EQUITY
Current liabilities:
Trade accounts payable 444 561
Payroll and other benefits related liabilities 313 459
Income taxes payable 109
Unearned revenues 421 447
Obligations under securities lending 0 0
Other current liabilities 970 905
Total current liabilities 2257 2372
Unearned revenues 3599 3528
Income taxes payable 276 263
Other liabilities 839 839
Total liabilities 6971 7002
Commitments and contingencies (Note 7)
Stockholders’ equity:
Preferred stock, $0.0001 par value; issuable in series;
2009 and September 28, 2008
Common stock, 6,000 shares authorized; 1,653 and 1,656 shares issued
outstanding at March 29, 2009 and September 28, 2008, respectively
Paid-in capital 7648 7988
Retained earnings 10241 10716Accumulated other comprehensive loss -776 7
Total stockholders’ equity 17113 18711
Total liabilities and stockholders’ equity 24084 25713

8/7/2019 Broadcom Financial Analysis
http://slidepdf.com/reader/full/broadcom-financial-analysis 39/86
9/30/2009 12/27/2009
$2,717 $3,660
8,352 8,504
700 616
453 350
149 199
199 245
12570 13574
6,673 6,764
843 1,118
2,387 2,384
1,492 1,490
3,065 3,142
415 431
27445 28903
636 415
480 385
458
441 567
1256 1123
2813 2948
3464 3775
47
805 827
7129 7550
8493 8817
11235 11792588 744
20316 21353
27445 28903

8/7/2019 Broadcom Financial Analysis
http://slidepdf.com/reader/full/broadcom-financial-analysis 40/86

8/7/2019 Broadcom Financial Analysis
http://slidepdf.com/reader/full/broadcom-financial-analysis 41/86
8/7/2019 Broadcom Financial Analysis
http://slidepdf.com/reader/full/broadcom-financial-analysis 42/86
8/7/2019 Broadcom Financial Analysis
http://slidepdf.com/reader/full/broadcom-financial-analysis 43/86
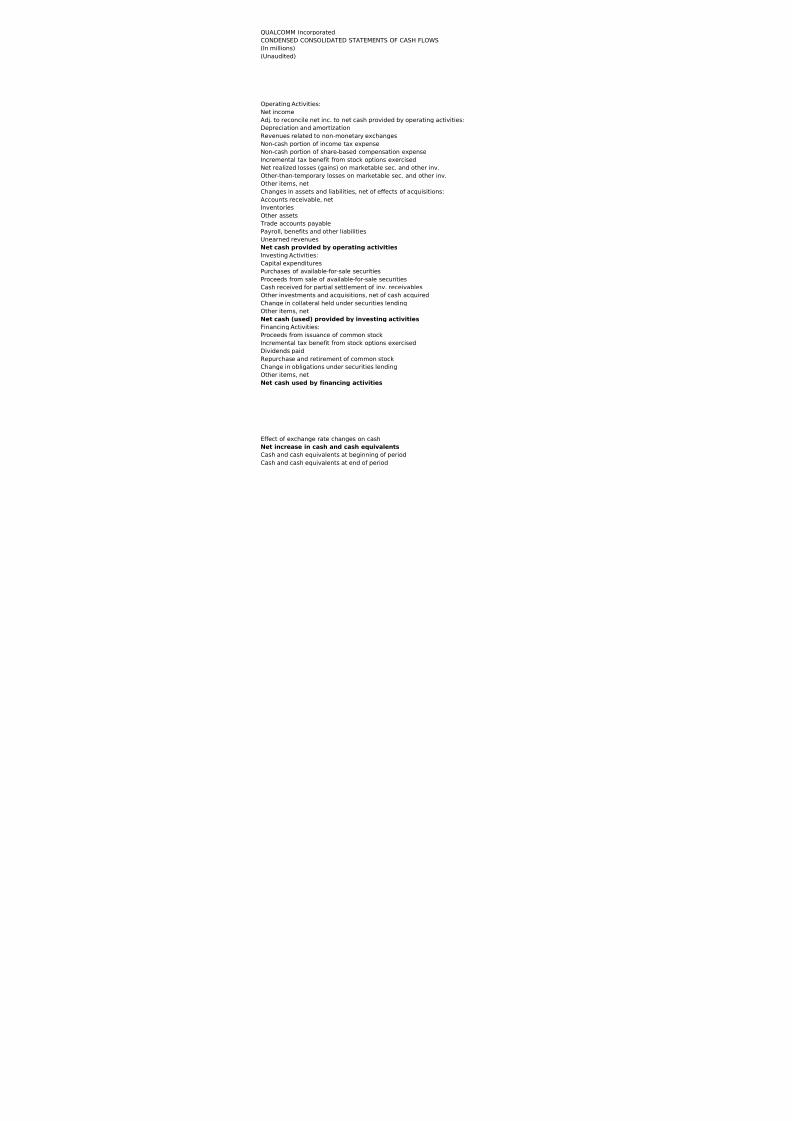
Effect of exchange rate changes on cash
Net increase in cash and cash equivalents
Cash and cash equivalents at beginning of period
Cash and cash equivalents at end of period
8/7/2019 Broadcom Financial Analysis
http://slidepdf.com/reader/full/broadcom-financial-analysis 44/86
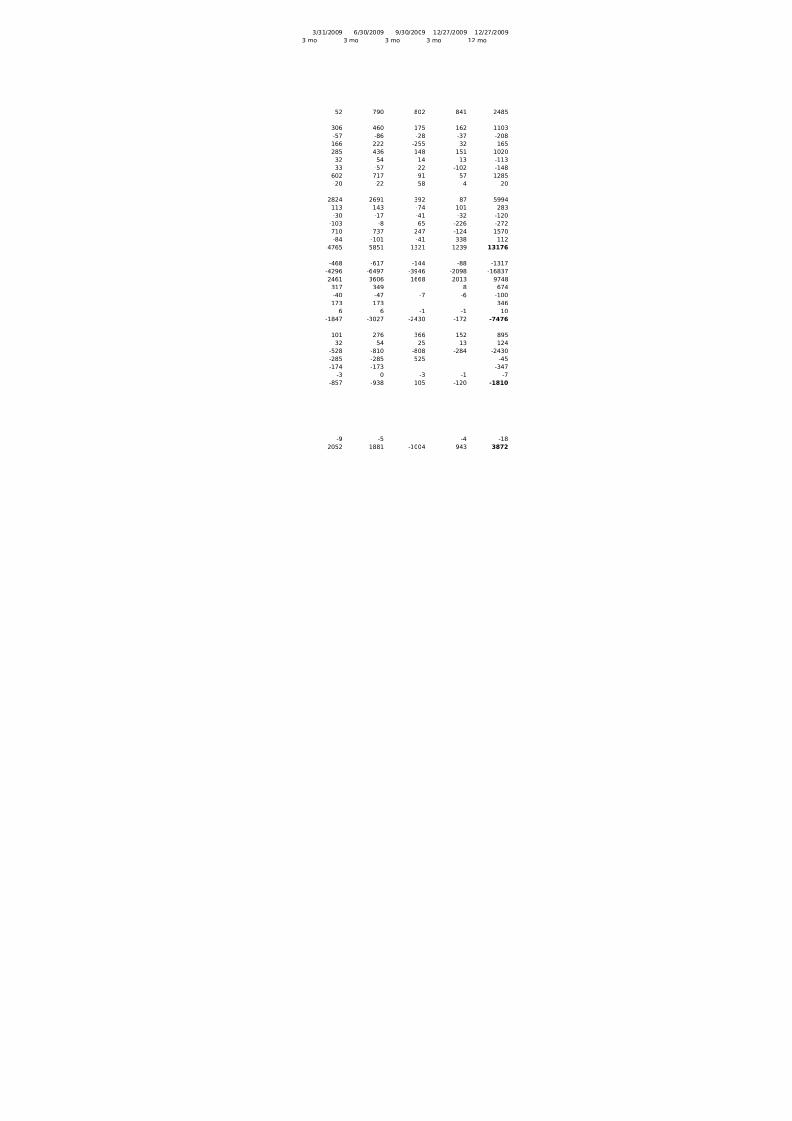
3/31/2009 6/30/2009 9/30/2009 12/27/2009 12/27/2009
3 mo 3 mo 3 mo 3 mo 12 mo
52 790 802 841 2485
306 460 175 162 1103
-57 -86 -28 -37 -208
166 222 -255 32 165
285 436 148 151 1020
-32 -54 -14 -13 -11333 -57 -22 -102 -148
602 717 -91 57 1285
-20 -22 58 4 20
2824 2691 392 87 5994
113 143 -74 101 283
-30 -17 -41 -32 -120
-103 -8 65 -226 -272
710 737 247 -124 1570
-84 -101 -41 338 112
4765 5851 1321 1239 13176
-468 -617 -144 -88 -1317
-4296 -6497 -3946 -2098 -16837
2461 3606 1668 2013 9748
317 349 8 674
-40 -47 -7 -6 -100
173 173 346
6 6 -1 -1 10
-1847 -3027 -2430 -172 -7476
101 276 366 152 895
32 54 25 13 124
-528 -810 -808 -284 -2430
-285 -285 525 -45
-174 -173 -347
-3 0 -3 -1 -7
-857 -938 105 -120 -1810
8/7/2019 Broadcom Financial Analysis
http://slidepdf.com/reader/full/broadcom-financial-analysis 45/86
-9 -5 -4 -18
2052 1881 -1004 943 3872
8/7/2019 Broadcom Financial Analysis
http://slidepdf.com/reader/full/broadcom-financial-analysis 46/86
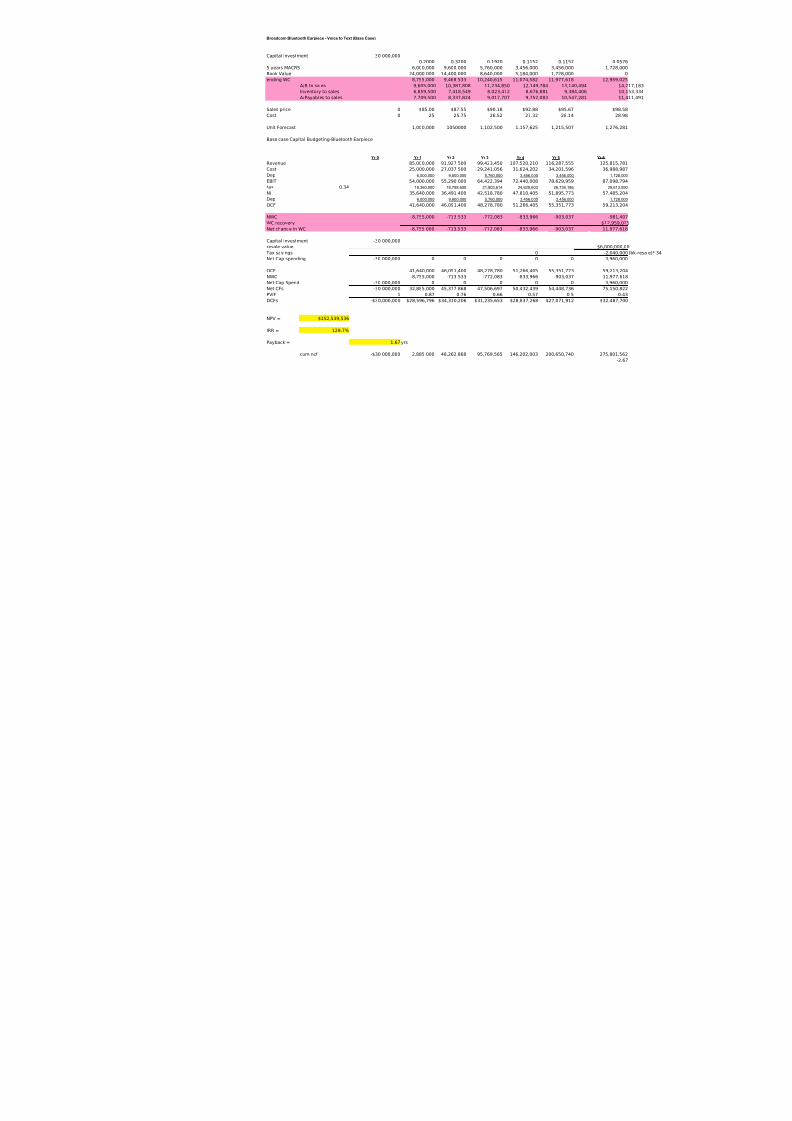
Broadcom Bluetooth Earpiece - Voice to Text (Base Case)
Capital investment 30,000,000
0.2000 0.3200 0.1920 0.1152
5 years MACRS 6,000,000 9,600,000 5,760,000 3,456,000
Book Value 24,000,000 14,400,000 8,640,000 5,184,000
ending WC 8,755,000 9,468,533 10,240,615 11,074,582A/R to sales 9,605,000 10,387,808 11,234,850 12,149
Inventory to sales 6,859,500 7,418,549 8,023,472 8,676
A/Payables to sales 7,709,500 8,337,824 9,017,707 9,752
Sales price 0 $85.00 $87.55 $90.18 $92.88
Cost 0 25 25.75 26.52 27.32
Unit Forecast 1,000,000 1050000 1,102,500 1,157,625
Base case Capital Budgeting-Bluetooth Earpiece
Yr 0 Yr 1 Yr 2 Yr 3 Yr 4
Revenue 85,000,000 91,927,500 99,423,450 107,520,210Cost 25,000,000 27,037,500 29,241,056 31,624,202
Dep 6,000,000 9,600,000 5,760,000 3,456,000
EBIT 54,000,000 55,290,000 64,422,394 72,440,008
tax 0.34 18,360,000 18,798,600 21,903,614 24,629,603
NI 35,640,000 36,491,400 42,518,780 47,810,405
Dep 6,000,000 9,600,000 5,760,000 3,456,000
OCF 41,640,000 46,091,400 48,278,780 51,266,405
NWC -8,755,000 -713,533 -772,083 -833,966
WC recovery
Net change in WC -8,755,000 -713,533 -772,083 -833,966
Capital investment -30,000,000
resale value
Tax savings 0
Net Cap spending -30,000,000 0 0 0 0
OCF 41,640,000 46,091,400 48,278,780 51,266,405
NWC -8,755,000 -713,533 -772,083 -833,966
Net Cap Spend -30,000,000 0 0 0 0
Net CFs -30,000,000 32,885,000 45,377,868 47,506,697 50,432,439
PVIF 1 0.87 0.76 0.66 0.57
DCFs -$30,000,000 $28,596,796 $34,310,206 $31,235,653 $28,837,268
NPV = $152,539,536
IRR = 129.7%
Payback = 1.67yrs
cum ncf -$30,000,000 2,885,000 48,262,868 95,769,565 146,202,003

8/7/2019 Broadcom Financial Analysis
http://slidepdf.com/reader/full/broadcom-financial-analysis 47/86
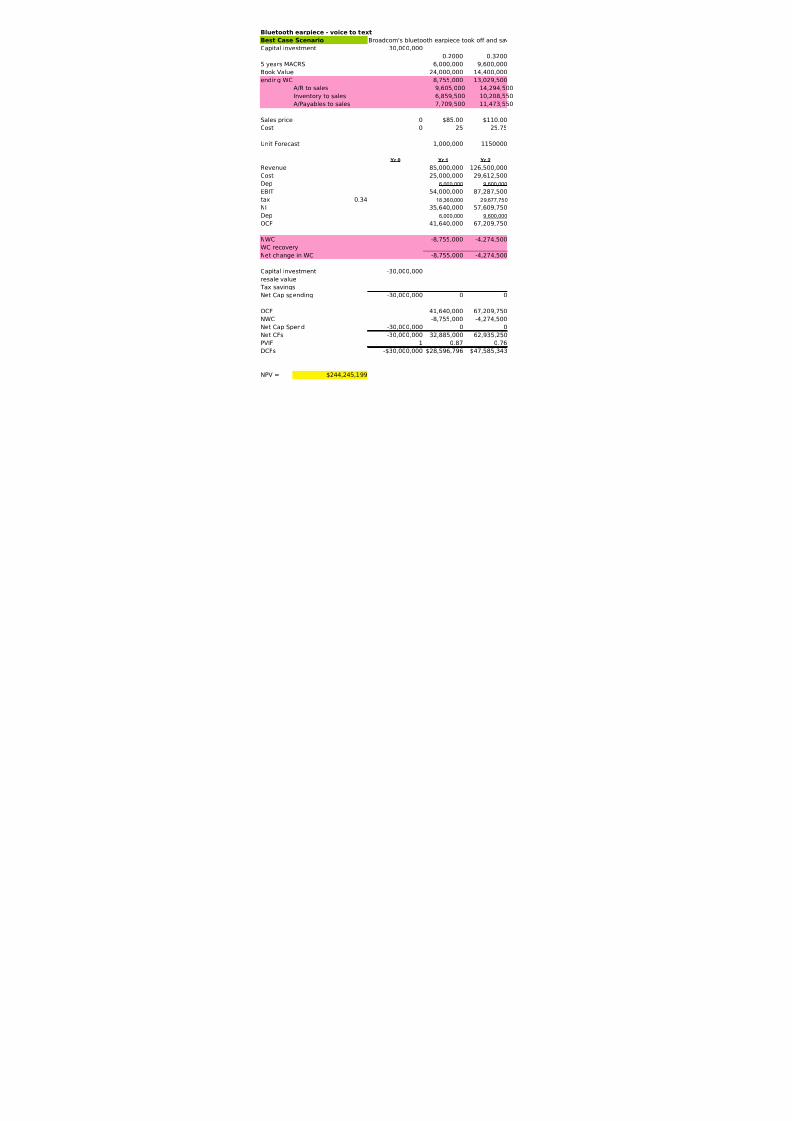
Bluetooth earpiece - voice to text
Best Case Scenario Broadcom's bluetooth earpiece took off and sa
Capital investment 30,000,000
0.2000 0.3200
5 years MACRS 6,000,000 9,600,000
Book Value 24,000,000 14,400,000
ending WC 8,755,000 13,029,500A/R to sales 9,605,000 14,294,500
Inventory to sales 6,859,500 10,208,550
A/Payables to sales 7,709,500 11,473,550
Sales price 0 $85.00 $110.00
Cost 0 25 25.75
Unit Forecast 1,000,000 1150000
Yr 0 Yr 1 Yr 2Revenue 85,000,000 126,500,000
Cost 25,000,000 29,612,500
Dep 6,000,000 9,600,000
EBIT 54,000,000 87,287,500
tax 0.34 18,360,000 29,677,750
NI 35,640,000 57,609,750
Dep 6,000,000 9,600,000
OCF 41,640,000 67,209,750
NWC -8,755,000 -4,274,500
WC recovery
Net change in WC -8,755,000 -4,274,500
Capital investment -30,000,000
resale value
Tax savings
Net Cap spending -30,000,000 0 0
OCF 41,640,000 67,209,750
NWC -8,755,000 -4,274,500
Net Cap Spend -30,000,000 0 0Net CFs -30,000,000 32,885,000 62,935,250
PVIF 1 0.87 0.76
DCFs -$30,000,000 $28,596,796 $47,585,343
NPV = $244,245,199
8/7/2019 Broadcom Financial Analysis
http://slidepdf.com/reader/full/broadcom-financial-analysis 48/86
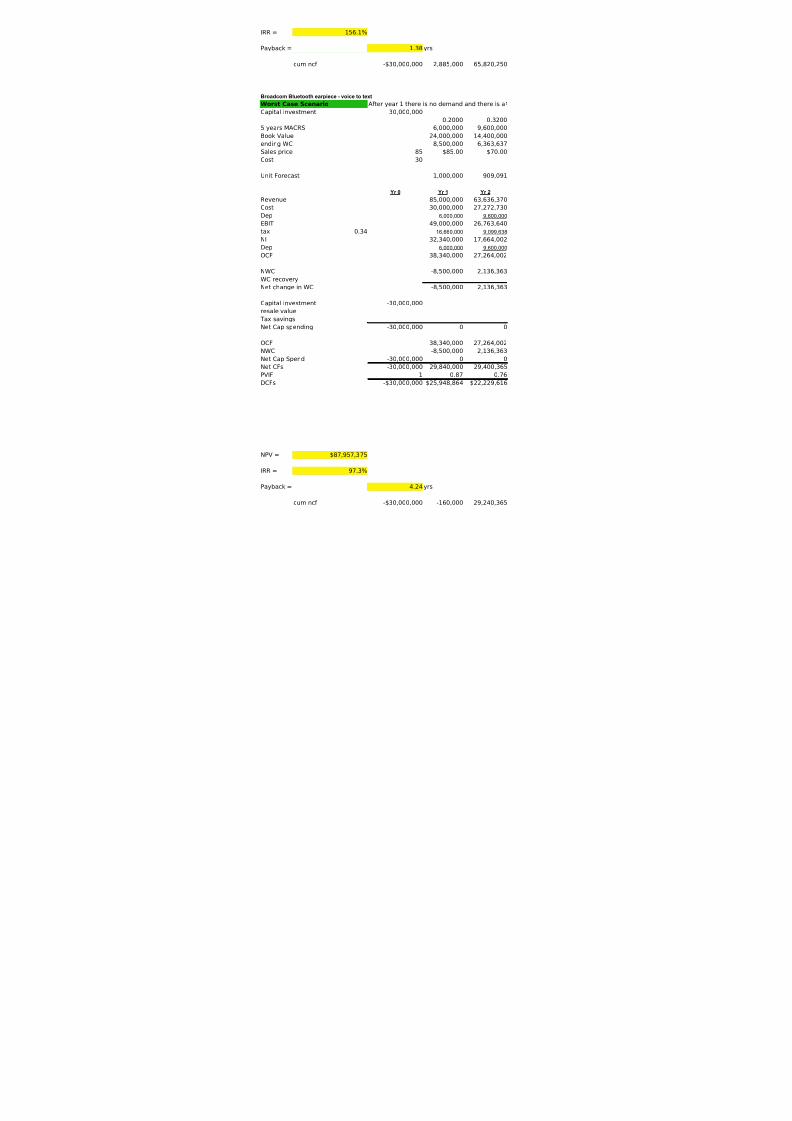
IRR = 156.1%
Payback = 1.38yrs
cum ncf -$30,000,000 2,885,000 65,820,250
Broadcom Bluetooth earpiece - voice to text
Worst Case Scenario After year 1 there is no demand and there is a
Capital investment 30,000,000
0.2000 0.3200
5 years MACRS 6,000,000 9,600,000
Book Value 24,000,000 14,400,000
ending WC 8,500,000 6,363,637
Sales price 85 $85.00 $70.00
Cost 30
Unit Forecast 1,000,000 909,091
Yr 0 Yr 1 Yr 2
Revenue 85,000,000 63,636,370
Cost 30,000,000 27,272,730
Dep 6,000,000 9,600,000
EBIT 49,000,000 26,763,640
tax 0.34 16,660,000 9,099,638
NI 32,340,000 17,664,002
Dep 6,000,000 9,600,000
OCF 38,340,000 27,264,002
NWC -8,500,000 2,136,363
WC recovery
Net change in WC -8,500,000 2,136,363
Capital investment -30,000,000
resale value
Tax savings
Net Cap spending -30,000,000 0 0
OCF 38,340,000 27,264,002
NWC -8,500,000 2,136,363
Net Cap Spend -30,000,000 0 0
Net CFs -30,000,000 29,840,000 29,400,365
PVIF 1 0.87 0.76
DCFs -$30,000,000 $25,948,864 $22,229,616

8/7/2019 Broadcom Financial Analysis
http://slidepdf.com/reader/full/broadcom-financial-analysis 49/86
NPV = $87,957,375
IRR = 97.3%
Payback = 4.24yrs
cum ncf -$30,000,000 -160,000 29,240,365
8/7/2019 Broadcom Financial Analysis
http://slidepdf.com/reader/full/broadcom-financial-analysis 50/86
15% growth in sales and a price increased to $110 after year 1.
0.1920 0.1152 0.1152 0.0576
5,760,000 3,456,000 3,456,000 1,728,000
8,640,000 5,184,000 1,728,000 0
14,983,925 17,231,514 19,816,249 22,788,68616,438,675 18,904,476 21,740,157 25,001,180
11,739,833 13,500,807 15,525,935 17,854,825
13,194,583 15,173,770 17,449,843 20,067,319
$110.00 $110.00 $110.00 $110.00
26.52 27.32 28.14 28.98
1,322,500 1,520,875 1,749,007 2,011,358
Yr 3 Yr 4 Yr 5 Yr 6145,475,000 167,296,250 192,390,770 221,249,380
35,076,006 41,547,529 49,213,070 58,292,880
5,760,000 3,456,000 3,456,000 1,728,000
104,638,994 122,292,721 139,721,700 161,228,500
35,577,258 41,579,525 47,505,378 54,817,690
69,061,736 80,713,196 92,216,322 106,410,810
5,760,000 3,456,000 3,456,000 1,728,000
74,821,736 84,169,196 95,672,322 108,138,810
-1,954,425 -2,247,589 -2,584,736 -2,972,437
$22,788,686
-1,954,425 -2,247,589 -2,584,736 19,816,249
$6,000,000.00
0 -2,040,000 (bk-resale)*.34
0 0 0 3,960,000
74,821,736 84,169,196 95,672,322 108,138,810
-1,954,425 -2,247,589 -2,584,736 19,816,249
0 0 0 3,960,00072,867,311 81,921,607 93,087,587 131,915,060
0.66 0.57 0.5 0.43
$47,910,257 $46,842,775 $46,283,148 $57,026,880

8/7/2019 Broadcom Financial Analysis
http://slidepdf.com/reader/full/broadcom-financial-analysis 51/86
138,687,561 220,609,168 313,696,754 445,611,814
-2.38
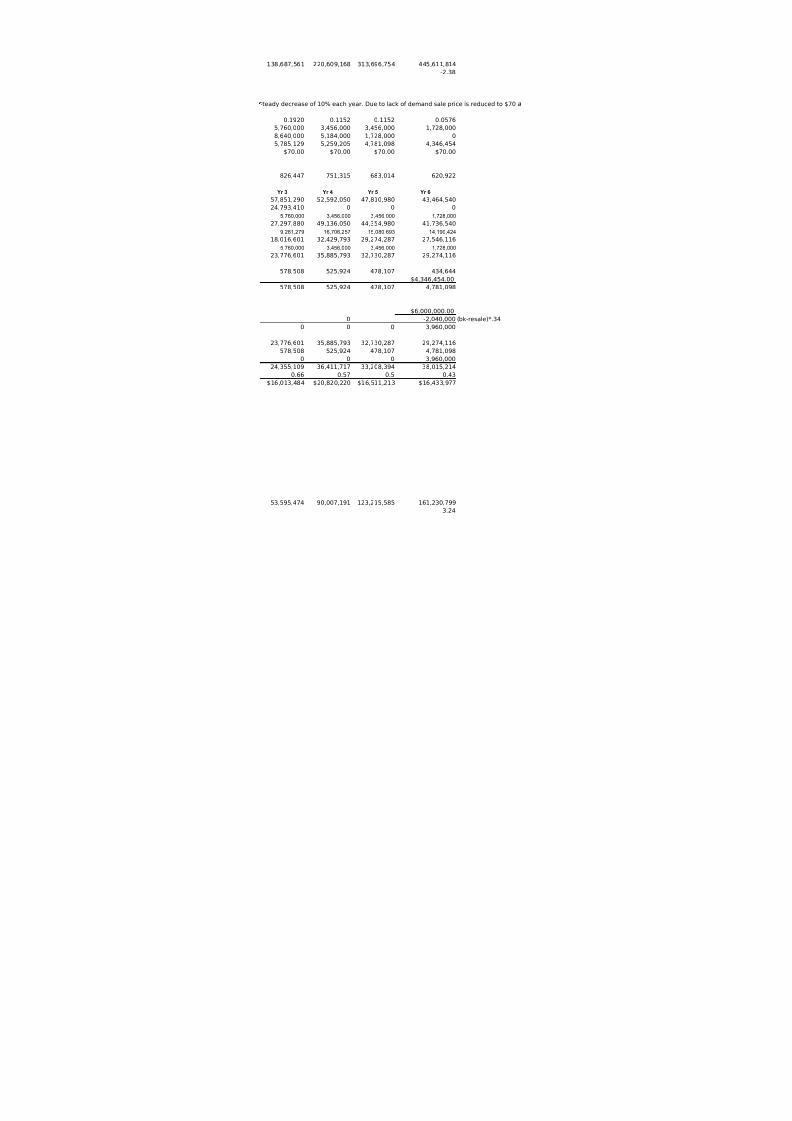
teady decrease of 10% each year. Due to lack of demand sale price is reduced to $70 a
0.1920 0.1152 0.1152 0.0576
5,760,000 3,456,000 3,456,000 1,728,000
8,640,000 5,184,000 1,728,000 0
5,785,129 5,259,205 4,781,098 4,346,454
$70.00 $70.00 $70.00 $70.00
826,447 751,315 683,014 620,922
Yr 3 Yr 4 Yr 5 Yr 6
57,851,290 52,592,050 47,810,980 43,464,540
24,793,410 0 0 0
5,760,000 3,456,000 3,456,000 1,728,000
27,297,880 49,136,050 44,354,980 41,736,540
9,281,279 16,706,257 15,080,693 14,190,424
18,016,601 32,429,793 29,274,287 27,546,116
5,760,000 3,456,000 3,456,000 1,728,000
23,776,601 35,885,793 32,730,287 29,274,116
578,508 525,924 478,107 434,644
$4,346,454.00
578,508 525,924 478,107 4,781,098
$6,000,000.00
0 -2,040,000 (bk-resale)*.34
0 0 0 3,960,000
23,776,601 35,885,793 32,730,287 29,274,116
578,508 525,924 478,107 4,781,098
0 0 0 3,960,000
24,355,109 36,411,717 33,208,394 38,015,214
0.66 0.57 0.5 0.43
$16,013,484 $20,820,220 $16,511,213 $16,433,977
8/7/2019 Broadcom Financial Analysis
http://slidepdf.com/reader/full/broadcom-financial-analysis 52/86
53,595,474 90,007,191 123,215,585 161,230,799
3.24
8/7/2019 Broadcom Financial Analysis
http://slidepdf.com/reader/full/broadcom-financial-analysis 53/86

8/7/2019 Broadcom Financial Analysis
http://slidepdf.com/reader/full/broadcom-financial-analysis 54/86
d costs increase to $30

8/7/2019 Broadcom Financial Analysis
http://slidepdf.com/reader/full/broadcom-financial-analysis 55/86

8/7/2019 Broadcom Financial Analysis
http://slidepdf.com/reader/full/broadcom-financial-analysis 56/86
Broadcom Bluetooth earpiece - voice to text
Increased tax rate of 38%
$10,000 Concept design cost is irrelevant
Capital investment 30,000,000
0.2000 0.3200
5 years MACRS 6,000,000 9,600,000Book Value 24,000,000 14,400,000
ending WC 8,755,000 9,468,533
A/R to sales 9,605,000 10,387,808
Inventory to sales 6,859,500 7,418,549
A/Payables to sales 7,709,500 8,337,824
Sales price 0 $85.00 $87.55
Cost 0 25 25.75
Unit Forecast 1,000,000 1050000
Yr 0 Yr 1 Yr 2
Revenue 85,000,000 91,927,500
Cost 25,000,000 27,037,500
Dep 6,000,000 9,600,000
EBIT 54,000,000 55,290,000
tax 0.38 20,520,000 21,010,200
NI 33,480,000 34,279,800
Dep 6,000,000 9,600,000
OCF 39,480,000 43,879,800
NWC -8,755,000 -713,533
WC recovery
Net change in WC -8,755,000 -713,533
Capital investment -30,000,000
resale value
Tax savings
Net Cap spending -30,000,000 0 0
OCF 39,480,000 43,879,800
NWC -8,755,000 -713,533
Net Cap Spend -30,000,000 0 0
Net CFs -30,000,000 30,725,000 43,166,268
PVIF 1 0.87 0.76
DCFs -$30,000,000 $26,718,460 $32,638,015

8/7/2019 Broadcom Financial Analysis
http://slidepdf.com/reader/full/broadcom-financial-analysis 57/86
NPV = $142,464,195
IRR = 122.8%
Payback = 3.63yrs
cum ncf -$30,000,000 725,000 43,891,268

8/7/2019 Broadcom Financial Analysis
http://slidepdf.com/reader/full/broadcom-financial-analysis 58/86
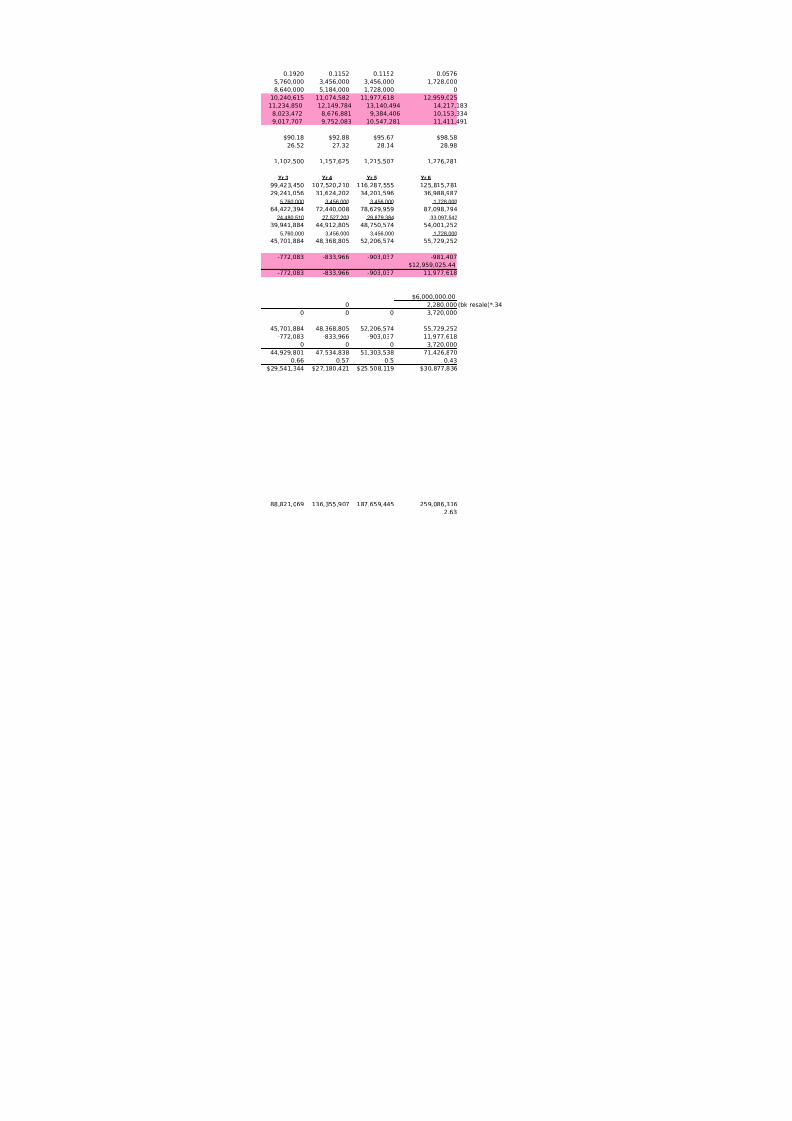
0.1920 0.1152 0.1152 0.0576
5,760,000 3,456,000 3,456,000 1,728,0008,640,000 5,184,000 1,728,000 0
10,240,615 11,074,582 11,977,618 12,959,025
11,234,850 12,149,784 13,140,494 14,217,183
8,023,472 8,676,881 9,384,406 10,153,334
9,017,707 9,752,083 10,547,281 11,411,491
$90.18 $92.88 $95.67 $98.58
26.52 27.32 28.14 28.98
1,102,500 1,157,625 1,215,507 1,276,281
Yr 3 Yr 4 Yr 5 Yr 6
99,423,450 107,520,210 116,287,555 125,815,781
29,241,056 31,624,202 34,201,596 36,988,987
5,760,000 3,456,000 3,456,000 1,728,000
64,422,394 72,440,008 78,629,959 87,098,794
24,480,510 27,527,203 29,879,384 33,097,542
39,941,884 44,912,805 48,750,574 54,001,252
5,760,000 3,456,000 3,456,000 1,728,000
45,701,884 48,368,805 52,206,574 55,729,252
-772,083 -833,966 -903,037 -981,407
$12,959,025.44
-772,083 -833,966 -903,037 11,977,618
$6,000,000.00
0 -2,280,000 (bk-resale)*.34
0 0 0 3,720,000
45,701,884 48,368,805 52,206,574 55,729,252
-772,083 -833,966 -903,037 11,977,618
0 0 0 3,720,000
44,929,801 47,534,838 51,303,538 71,426,870
0.66 0.57 0.5 0.43
$29,541,344 $27,180,421 $25,508,119 $30,877,836
8/7/2019 Broadcom Financial Analysis
http://slidepdf.com/reader/full/broadcom-financial-analysis 59/86

8/7/2019 Broadcom Financial Analysis
http://slidepdf.com/reader/full/broadcom-financial-analysis 60/86
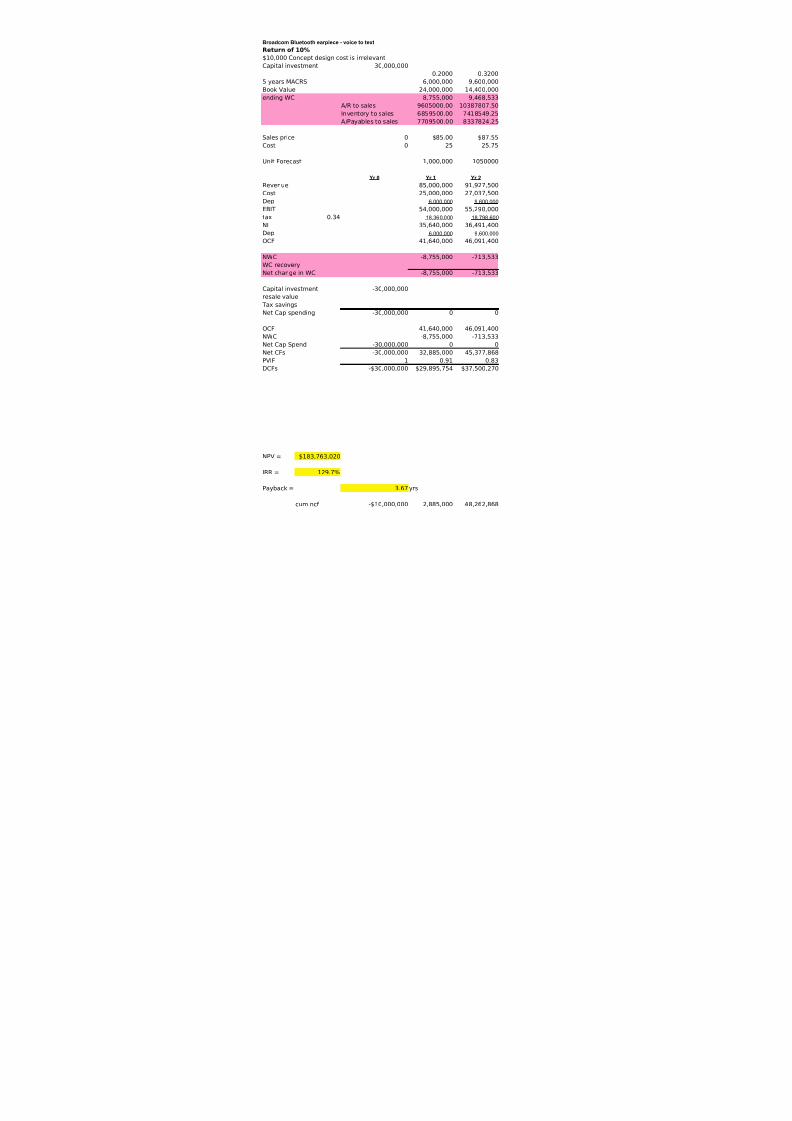
Broadcom Bluetooth earpiece - voice to text
Return of 10%
$10,000 Concept design cost is irrelevant
Capital investment 30,000,000
0.2000 0.3200
5 years MACRS 6,000,000 9,600,000Book Value 24,000,000 14,400,000
ending WC 8,755,000 9,468,533
A/R to sales 9605000.00 10387807.50
Inventory to sales 6859500.00 7418549.25
A/Payables to sales 7709500.00 8337824.25
Sales price 0 $85.00 $87.55
Cost 0 25 25.75
Unit Forecast 1,000,000 1050000
Yr 0 Yr 1 Yr 2
Revenue 85,000,000 91,927,500
Cost 25,000,000 27,037,500
Dep 6,000,000 9,600,000
EBIT 54,000,000 55,290,000
tax 0.34 18,360,000 18,798,600
NI 35,640,000 36,491,400
Dep 6,000,000 9,600,000
OCF 41,640,000 46,091,400
NWC -8,755,000 -713,533
WC recovery
Net change in WC -8,755,000 -713,533
Capital investment -30,000,000
resale value
Tax savings
Net Cap spending -30,000,000 0 0
OCF 41,640,000 46,091,400
NWC -8,755,000 -713,533
Net Cap Spend -30,000,000 0 0
Net CFs -30,000,000 32,885,000 45,377,868
PVIF 1 0.91 0.83
DCFs -$30,000,000 $29,895,754 $37,500,270
8/7/2019 Broadcom Financial Analysis
http://slidepdf.com/reader/full/broadcom-financial-analysis 61/86
NPV = $183,763,020
IRR = 129.7%
Payback = 3.67yrs
cum ncf -$30,000,000 2,885,000 48,262,868
8/7/2019 Broadcom Financial Analysis
http://slidepdf.com/reader/full/broadcom-financial-analysis 62/86
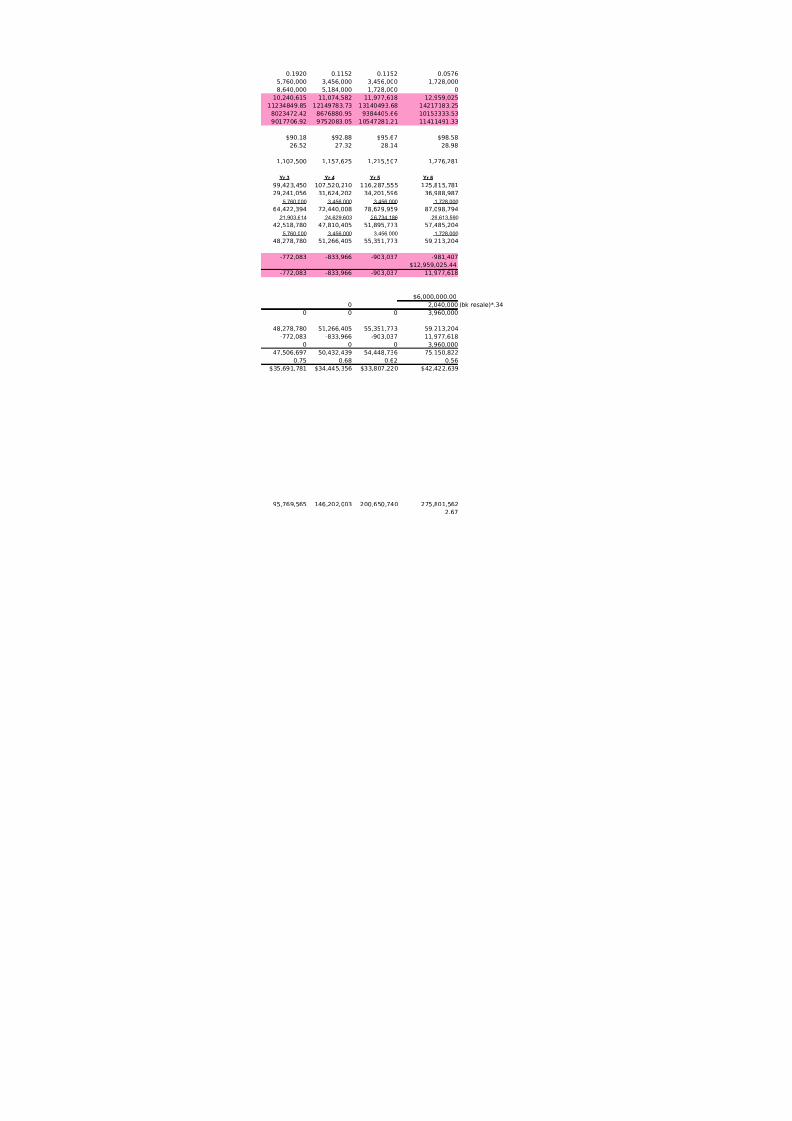
0.1920 0.1152 0.1152 0.0576
5,760,000 3,456,000 3,456,000 1,728,0008,640,000 5,184,000 1,728,000 0
10,240,615 11,074,582 11,977,618 12,959,025
11234849.85 12149783.73 13140493.68 14217183.25
8023472.42 8676880.95 9384405.66 10153333.53
9017706.92 9752083.05 10547281.21 11411491.33
$90.18 $92.88 $95.67 $98.58
26.52 27.32 28.14 28.98
1,102,500 1,157,625 1,215,507 1,276,281
Yr 3 Yr 4 Yr 5 Yr 6
99,423,450 107,520,210 116,287,555 125,815,781
29,241,056 31,624,202 34,201,596 36,988,987
5,760,000 3,456,000 3,456,000 1,728,000
64,422,394 72,440,008 78,629,959 87,098,794
21,903,614 24,629,603 26,734,186 29,613,590
42,518,780 47,810,405 51,895,773 57,485,204
5,760,000 3,456,000 3,456,000 1,728,000
48,278,780 51,266,405 55,351,773 59,213,204
-772,083 -833,966 -903,037 -981,407
$12,959,025.44
-772,083 -833,966 -903,037 11,977,618
$6,000,000.00
0 -2,040,000 (bk-resale)*.34
0 0 0 3,960,000
48,278,780 51,266,405 55,351,773 59,213,204
-772,083 -833,966 -903,037 11,977,618
0 0 0 3,960,000
47,506,697 50,432,439 54,448,736 75,150,822
0.75 0.68 0.62 0.56
$35,691,781 $34,445,356 $33,807,220 $42,422,639

8/7/2019 Broadcom Financial Analysis
http://slidepdf.com/reader/full/broadcom-financial-analysis 63/86
95,769,565 146,202,003 200,650,740 275,801,562
2.67

8/7/2019 Broadcom Financial Analysis
http://slidepdf.com/reader/full/broadcom-financial-analysis 64/86
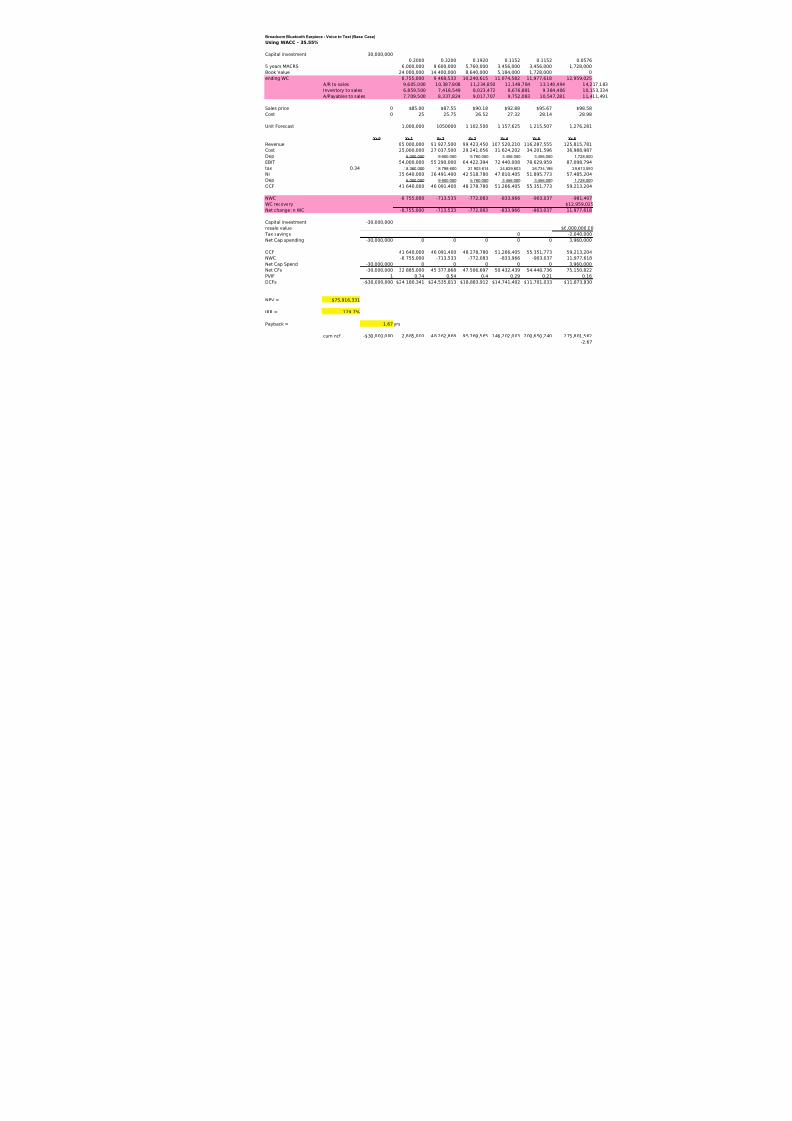
Broadcom Bluetooth Earpiece - Voice to Text (Base Case)
Using WACC - 35.55%
Capital investment 30,000,000
0.2000 0.3200 0.1920 0.1152 0
5 years MACRS 6,000,000 9,600,000 5,760,000 3,456,000 3,45
Book Value 24,000,000 14,400,000 8,640,000 5,184,000 1,72
ending WC 8,755,000 9,468,533 10,240,615 11,074,582 11,97
A/R to sales 9,605,000 10,387,808 11,234,850 12,149,784
Inventory to sales 6,859,500 7,418,549 8,023,472 8,676,881
A/Payables to sales 7,709,500 8,337,824 9,017,707 9,752,083
Sales price 0 $85.00 $87.55 $90.18 $92.88 $
Cost 0 25 25.75 26.52 27.32
Unit Forecast 1,000,000 1050000 1,102,500 1,157,625 1,21
Yr 0 Yr 1 Yr 2 Yr 3 Yr 4 Yr 5
Revenue 85,000,000 91,927,500 99,423,450 107,520,210 116,28
Cost 25,000,000 27,037,500 29,241,056 31,624,202 34,20
Dep 6,000,000 9,600,000 5,760,000 3,456,000 3,4
EBIT 54,000,000 55,290,000 64,422,394 72,440,008 78,62tax 0.34 18,360,000 18,798,600 21,903,614 24,629,603 26,7
NI 35,640,000 36,491,400 42,518,780 47,810,405 51,89
Dep 6,000,000 9,600,000 5,760,000 3,456,000 3,4
OCF 41,640,000 46,091,400 48,278,780 51,266,405 55,35
NWC -8,755,000 -713,533 -772,083 -833,966 -90
WC recovery
Net change in WC -8,755,000 -713,533 -772,083 -833,966 -90
Capital investment -30,000,000
resale value
Tax savings 0
Net Cap spending -30,000,000 0 0 0 0
OCF 41,640,000 46,091,400 48,278,780 51,266,405 55,35
NWC -8,755,000 -713,533 -772,083 -833,966 -90
Net Cap Spend -30,000,000 0 0 0 0
Net CFs -30,000,000 32,885,000 45,377,868 47,506,697 50,432,439 54,44
PVIF 1 0.74 0.54 0.4 0.29
DCFs -$30,000,000 $24,180,341 $24,535,813 $18,883,912 $14,741,402 $11,70
NPV = $75,916,331
IRR = 129.7%
Payback = 1.67 yrs
cum ncf -$30,000,000 2,885,000 48,262,868 95,769,565 146,202,003 200,65

8/7/2019 Broadcom Financial Analysis
http://slidepdf.com/reader/full/broadcom-financial-analysis 65/86
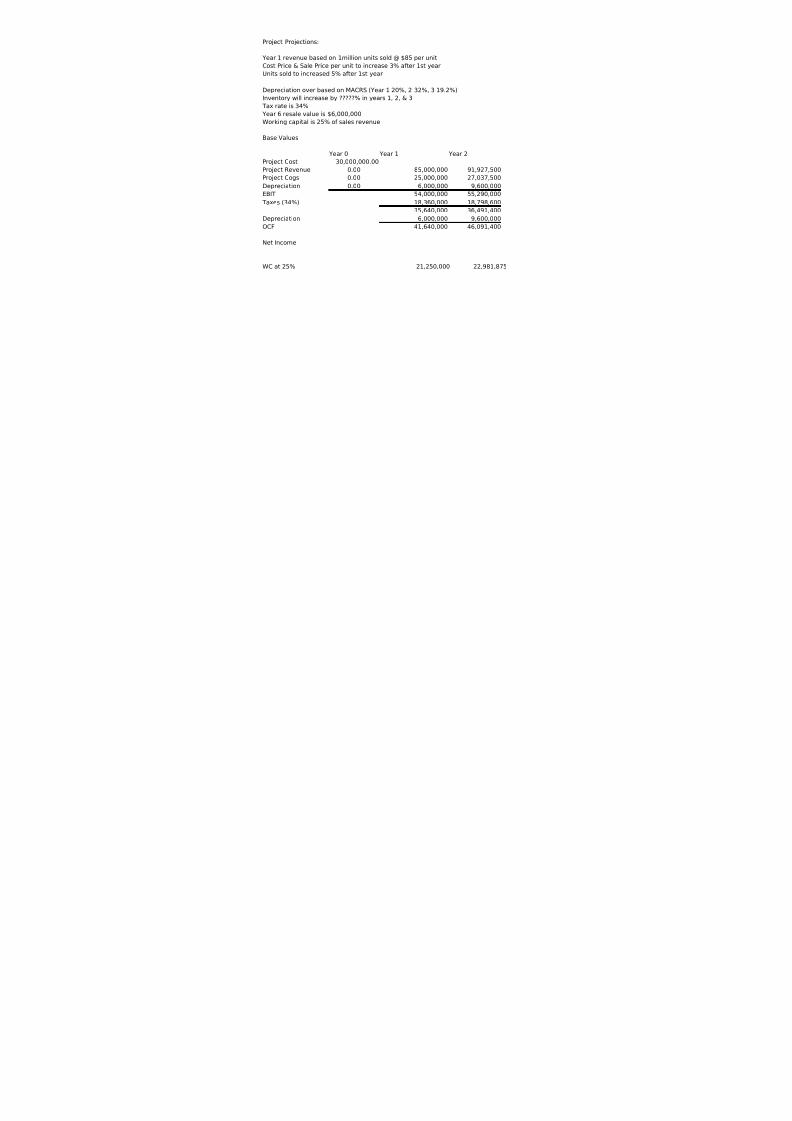
Project Projections:
Year 1 revenue based on 1million units sold @ $85 per unit
Cost Price & Sale Price per unit to increase 3% after 1st year
Units sold to increased 5% after 1st year
Depreciation over based on MACRS (Year 1 20%, 2 32%, 3 19.2%)
Inventory will increase by ?????% in years 1, 2, & 3
Tax rate is 34%
Year 6 resale value is $6,000,000
Working capital is 25% of sales revenue
Base Values
Year 0 Year 1 Year 2
Project Cost 30,000,000.00Project Revenue 0.00 85,000,000 91,927,500
Project Cogs 0.00 25,000,000 27,037,500
Depreciation 0.00 6,000,000 9,600,000
EBIT 54,000,000 55,290,000
Taxes (34%) 18,360,000 18,798,600
35,640,000 36,491,400
Depreciation 6,000,000 9,600,000
OCF 41,640,000 46,091,400
Net Income
WC at 25% 21,250,000 22,981,875

8/7/2019 Broadcom Financial Analysis
http://slidepdf.com/reader/full/broadcom-financial-analysis 66/86
Year 3
99,423,450
29,241,056
5,760,000
64,422,394
21,903,614
42,518,780
5,760,000
48,278,780
48,278,780
24,855,863

8/7/2019 Broadcom Financial Analysis
http://slidepdf.com/reader/full/broadcom-financial-analysis 67/86
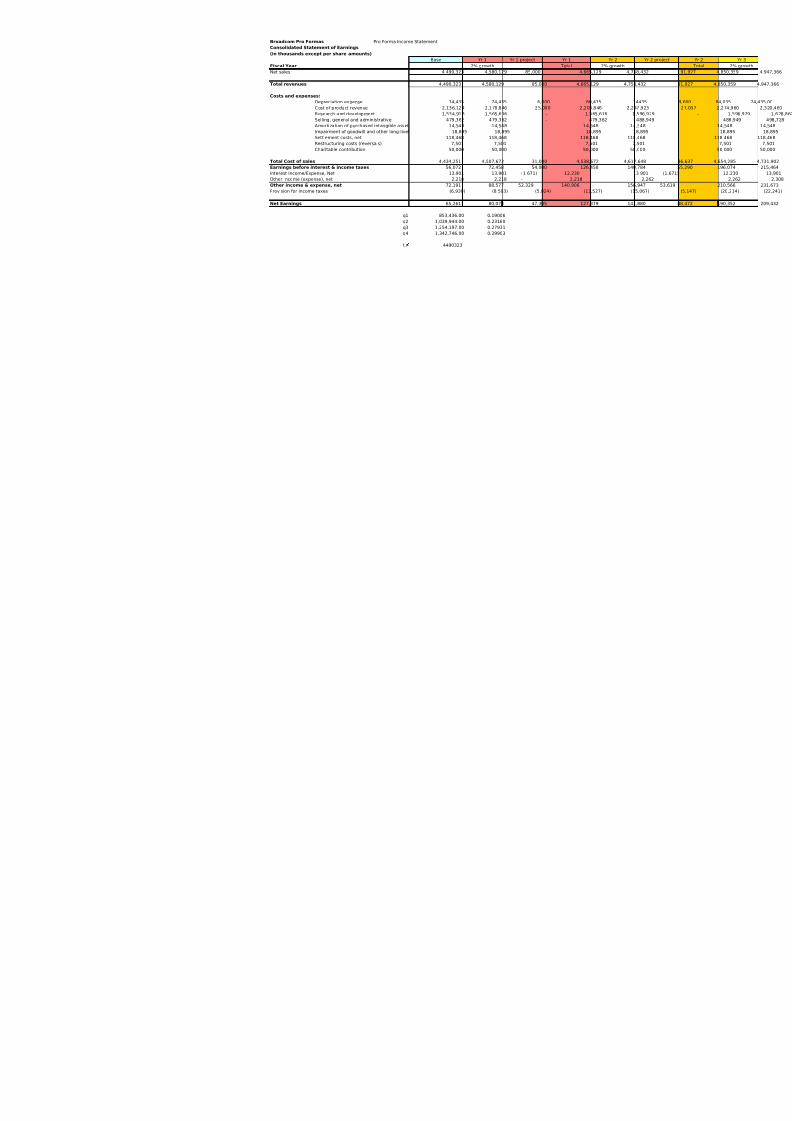
Broadcom Pro Formas Pro Forma Income Statement
Consolidated Statement of Earnings
(in thousands except per share amounts)
Base Yr 1 Yr 1 project
Fiscal Year 2% growth
Net sales 4,490,323 4,580,129 85,000
Total revenues 4,490,323 4,580,129 85,0
Costs and expenses:
Depreciation expense 74,435 74,435 6
Cost of product revenue 2,136,124 2,178,846 25
Research and development 1,534,918 1,565,616
Selling, general and administrative 479,362 479,362
Amortization of purchased intangible asset 14,548 14,548
Impairment of goodwill and other long-live 18,895 18,895
Settlement costs, net 118,468 118,468
Restructuring costs (reversals) 7,501 7,501
Charitable contribution 50,000 50,000
Total Cost of sales 4,434,251 4,507,672 31,0Earnings before interest & income taxes 56,072 72,458 54,0
Interest Income/Expense, Net 13,901 13,901 (1,671)
Other income (expense), net 2,218 2,218 -
Other income & expense, net 72,191 88,577 52,329
Provision for income taxes (6,930) (8,503) (5
Net Earnings 65,261 80,073 47,3
q1 853,436.00 0.19006
q2 1,039,944.00 0.23160
q3 1,254,197.00 0.27931
q4 1,342,746.00 0.29903
t r 4490323

8/7/2019 Broadcom Financial Analysis
http://slidepdf.com/reader/full/broadcom-financial-analysis 68/86
Yr 3 Project Yr 3
Total
99,423 5,046,789
99,423 5,046,789
5,760 80,195.00
29,241 2,349,701
- 1,628,867
- 498,728
14,548
18,895
118,468
7,501
50,000
35,001 4,766,90364,422 279,886
(1,671) 12,230
- 2,308
62,751 294,424
(6,024) (28,265)
56,727 266,159

8/7/2019 Broadcom Financial Analysis
http://slidepdf.com/reader/full/broadcom-financial-analysis 69/86
Pro Forma Balance Sheet A = B
Yr
Base
Assets
Current assets:
Cash and cash equivalents 1,
0.1133 Accounts receivable
0.1697 Inventory
Short-term marketable securities
Prepaid expenses and other current assets
Total current assets: 2,9
Gross PPE
Accumlated Depreciation (
Property and equipment, net
Other Assets 1,
Total Assets
Liabilities and Shareholders' Equity
Current liabilities:
0.20474 Accounts payable
Other Current Liabilities
Total current liabilities: 1,1
Long Term Debt (Bonds Payable)
Long-term deferred revenue
Shareholders' equity:
Convertible preferred stock, $.0001 par value:
Authorized shares - 6,432 - none issued and outstanding
Class A common stock, $.0001 par value:
Authorized shares - 2,500,000
Issued and outstanding shares -
438,557 in 2009, 426,095 in 2008, 468,858 in 2007 and 473,533 in 2006
Class B common stock, $.0001 par value:
Authorized shares - 400,000
Issued and outstanding shares -
56,999 in 2009, 62,923 in 2008, 68,400 in 2007 and 74,781 in 2006
Additional paid-in capital 11,Accumulated deficit (Retained Earnings) (7,
Accumulated other comprehensive income (loss)
Total shareholders' equity
Total liabilities and shareholders' equity

8/7/2019 Broadcom Financial Analysis
http://slidepdf.com/reader/full/broadcom-financial-analysis 70/86
Broadcom Annual Plan
Consolidated Statement of Earnings
(in thousands except per share amounts)
Base Yr
Fiscal Year 2% g
Net sales 4,490,323
Total revenues 4,490,323 4
Costs and expenses:
Depreciation expense 74,435
Cost of product revenue 2,136,124
Research and development 1,534,918
Selling, general and administrative 479,362
Amortization of purchased intangible assets 14,548
Impairment of goodwill and other long-lived assets 18,895
Settlement costs, net 118,468
Restructuring costs (reversals) 7,501
Charitable contribution 50,000
Total Cost of sales 4,434,251 4Income From Operations 56,072
Interest Income/Expense, Net 13,901
Other income (expense), net 2,218
Other Income Before Taxes 1.6 72,191
Provision for income taxes (6,930)
Net Earnings 1.5 65,261
Quarter Revenue Per Quarter Revenue % by Quarter
q1 853,436.00 0.19006
q2 1,039,944.00 0.23160
q3 1,254,197.00 0.27931
q4 1,342,746.00 0.29903
Total Revenue 2009 4,490,323

8/7/2019 Broadcom Financial Analysis
http://slidepdf.com/reader/full/broadcom-financial-analysis 71/86
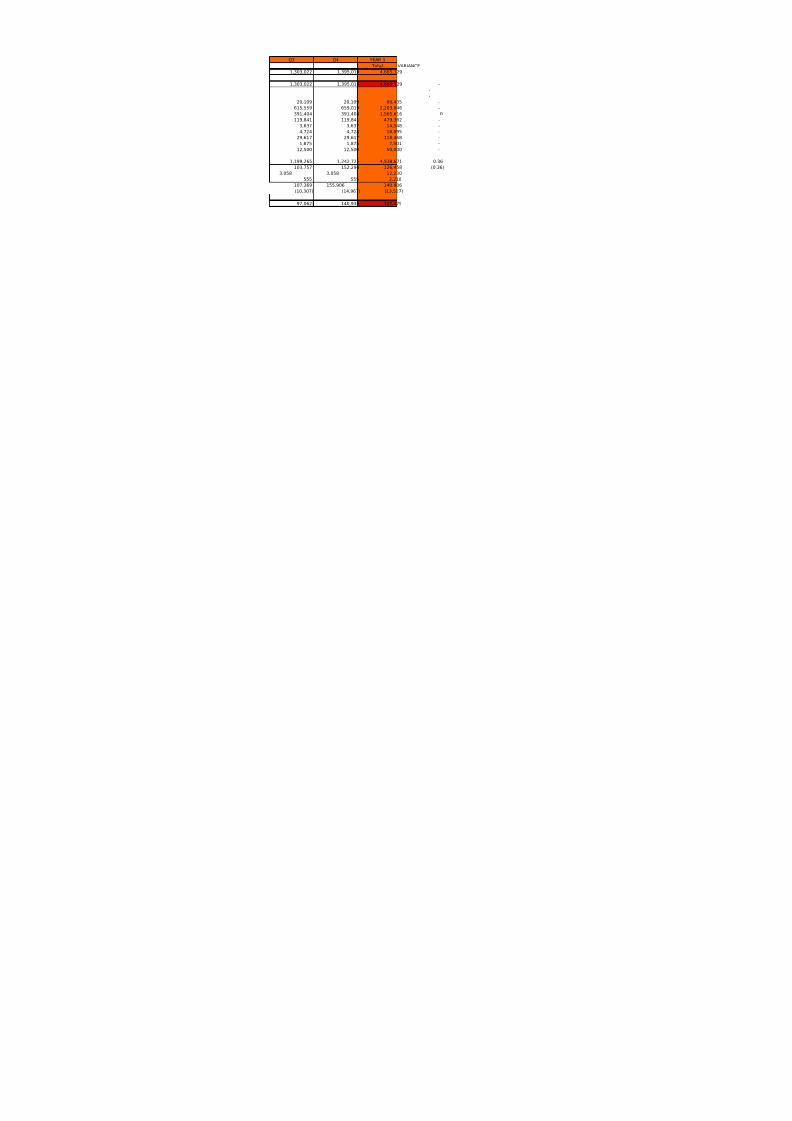
Q3 Q4 YEAR 1
Total VARIANCE
1,303,022 1,395,019 4,665,129
1,303,022 1,395,019 4,665,129 -
-
-
20,109 20,109 80,435 -
615,559 659,019 2,203,846 -
391,404 391,404 1,565,616 0
119,841 119,841 479,362 -
3,637 3,637 14,548 -
4,724 4,724 18,895 -
29,617 29,617 118,468 -
1,875 1,875 7,501 -
12,500 12,500 50,000 -
1,199,265 1,242,725 4,538,671 0.36103,757 152,294 126,458 (0.36)
3,058 3,058 12,230
555 555 2,218
107,369 155,906 140,906
(10,307) (14,967) (13,527)
97,062 140,939 127,379

8/7/2019 Broadcom Financial Analysis
http://slidepdf.com/reader/full/broadcom-financial-analysis 72/86
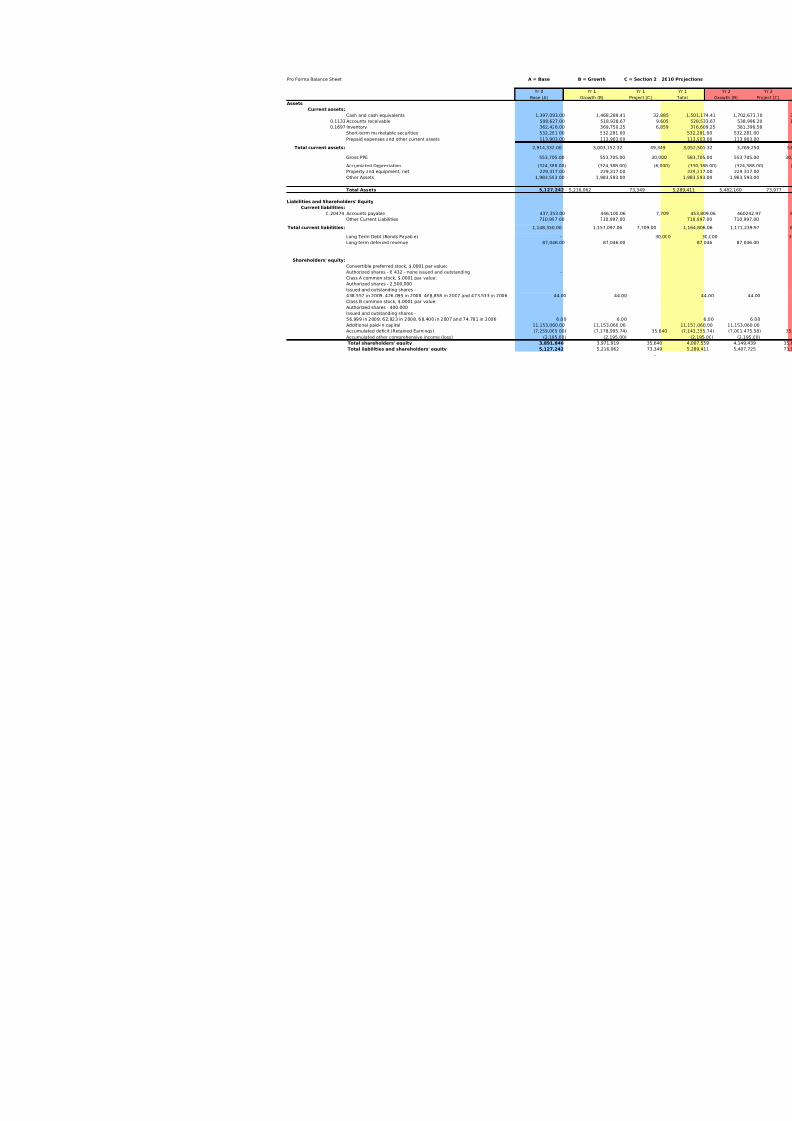
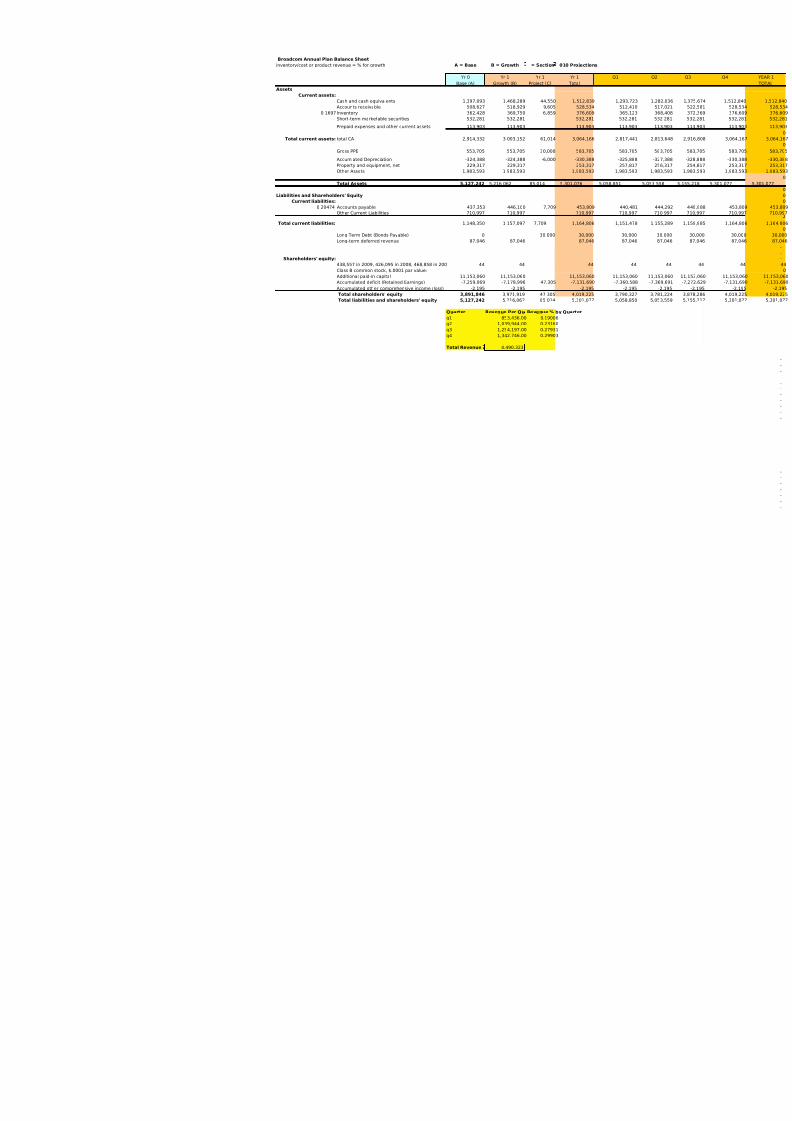
Broadcom Annual Plan Balance Sheet
inventory/cost or product revenue = % for growth A = Base B = Growth = S
Yr 0 Yr 1 Y
Base (A) Growth (B) Proje
Assets
Current assets:
Cash and cash equivalents 1,397,093 1,468,289
Accounts receivable 508,627 518,929
0.1697 Inventory 362,428 369,750
Short-term marketable securities 532,281 532,281
Prepaid expenses and other current assets 113,903 113,903
Total current assets: total CA 2,914,332 3,003,152
Gross PPE 553,705 553,705
Accumlated Depreciation -324,388 -324,388
Property and equipment, net 229,317 229,317
Other Assets 1,983,593 1,983,593
Total Assets 5,127,242 5,216,062 85,0
Liabilities and Shareholders' Equity
Current liabilities:
0.20474 Accounts payable 437,353 446,100
Other Current Liabilities 710,997 710,997
Total current liabilities: 1,148,350 1,157,097 7,7
Long Term Debt (Bonds Payable) 0
Long-term deferred revenue 87,046 87,046
Shareholders' equity:
438,557 in 2009, 426,095 in 2008, 468,858 in 200 44 44
Class B common stock, $.0001 par value:
Additional paid-in capital 11,153,060 11,153,060
Accumulated deficit (Retained Earnings) -7,259,069 -7,178,996
Accumulated other comprehensive income (loss) -2,195 -2,195
Total shareholders' equity 3,891,846 3,971,919
Total liabilities and shareholders' equity 5,127,242 5,216,062
Quarter Revenue Per Qu Reve
q1 853,436.00
q2 1,039,944.00 q3 1,254,197.00
q4 1,342,746.00
Total Revenue 4,490,323

8/7/2019 Broadcom Financial Analysis
http://slidepdf.com/reader/full/broadcom-financial-analysis 73/86

8/7/2019 Broadcom Financial Analysis
http://slidepdf.com/reader/full/broadcom-financial-analysis 74/86
VARIANCE
19,907
14,181
0
0
0
149,834
0
30,000
-6,000
24,000
0
0
173,834
0
0
0
16,456
0
16,456
0
30,000
0
-
-
-
0
0
0
127,379
0
127,379
173,835

8/7/2019 Broadcom Financial Analysis
http://slidepdf.com/reader/full/broadcom-financial-analysis 75/86

8/7/2019 Broadcom Financial Analysis
http://slidepdf.com/reader/full/broadcom-financial-analysis 76/86

8/7/2019 Broadcom Financial Analysis
http://slidepdf.com/reader/full/broadcom-financial-analysis 77/86

8/7/2019 Broadcom Financial Analysis
http://slidepdf.com/reader/full/broadcom-financial-analysis 78/86

8/7/2019 Broadcom Financial Analysis
http://slidepdf.com/reader/full/broadcom-financial-analysis 79/86

8/7/2019 Broadcom Financial Analysis
http://slidepdf.com/reader/full/broadcom-financial-analysis 80/86
Broadcom Corporation WACC Analysis
WACC= E/V * R(e) + D/V * R(D) * (1-Tc)
Cost of Equity:
Er=Rf + (Rm-Rf) x β
Risk-free Rate R(f) 3.6%
Market Return R(m): 23.50%
(S&P 500 2009)
Market Risk Premium 19.90%
(Rm-Rf)
Beta Coefficient: 1.31
(yahoo finance)
R(e)= 29.67%
Market Value of Equity
# of Outstanding Shares 512,645,000
Stock Price: $32.31
MVE (E): $16,563,559,950.00
Cost Of Debt (D): 0
V: $16,563,559,950.00
Market value of the firm (V)= Market value of debt + Market value of equity
E/V: 1.00
D/V: 0
Tax Rate (34%) 0.34
WACC 29.67%
According to the most recent 10-k (ending Dec-31-2009) Broadcom has no (0) interest bearing debt.

8/7/2019 Broadcom Financial Analysis
http://slidepdf.com/reader/full/broadcom-financial-analysis 81/86
Ideal Capital Structure
Current Capital Structure:
Values Current Scenario 1 Scenario 2 Scenario 3 Scenario 4 Scenario 5 Scenario 6
R(e): 29.67% 29.67% 29.67% 29.67% 29.67% 29.67% 29.67%
E/V: 1 0.75 0.50 0.3333 0.25 0.10 0.00
D: 0 0 0 0 0 0 0
D/V: 0 0.25 0.50 0.6667 0.75 0.90 1.00
1-Tc: 0.66 0.66 0.66 0.66 0.66 0.66 0.66
WACC: 29.67% 22.25% 14.84% 9.89% 7.42% 2.97% 0.00%
As we have illustrated the cost of capital for the overall firm is high at 33.55%.
This result is due to the firm not having any interest bearing debt where they are leveraging
the firms equity to raise capital.
All required returns come from the cost of equity where the WACC equals R(e).
Since we know too much debt for a fi rm may lead to bankruptcy, Broadcom has avoided that risk.
In turn, as mentioned in the 10-k, there may be the need for the company to raise debt in the future
due to both internal and external pressures. As of now Broadcom has opted for the use of cash
and equity to fund investments but may be required to barrow at some point.
Therefore, we believe Broadcom, when necessary, will have to find the ideal structure #3
which technically represents a better balance.
Option 2 use of debt:
Values Current Scenario 1 Scenario 2 Scenario 3 Scenario 4 Scenario 5 Scenario 6
R(e): 29.67% 29.67% 29.67% 29.67% 29.67% 29.67% 29.67%
E/V: 99.80 0.75 0.50 0.3333 0.25 0.10 0.00
D: 5.57% 5.57% 5.57% 5.57% 5.57% 5.57% 5.57%
D/V: 0.20 0.25 0.50 0.6667 0.75 0.90 1.00
1-Tc: 0.66 0.66 0.66 0.66 0.66 0.66 0.66
WACC: 2961.80% 23.17% 16.67% 12.34% 10.17% 6.28% 3.68%
V: Total market value= $16,563,559,950 + $30,000,000 = $16,593,559,950
E: $16,563,559,950
D: 5.57% per Valubond 20 yr AA

8/7/2019 Broadcom Financial Analysis
http://slidepdf.com/reader/full/broadcom-financial-analysis 82/86
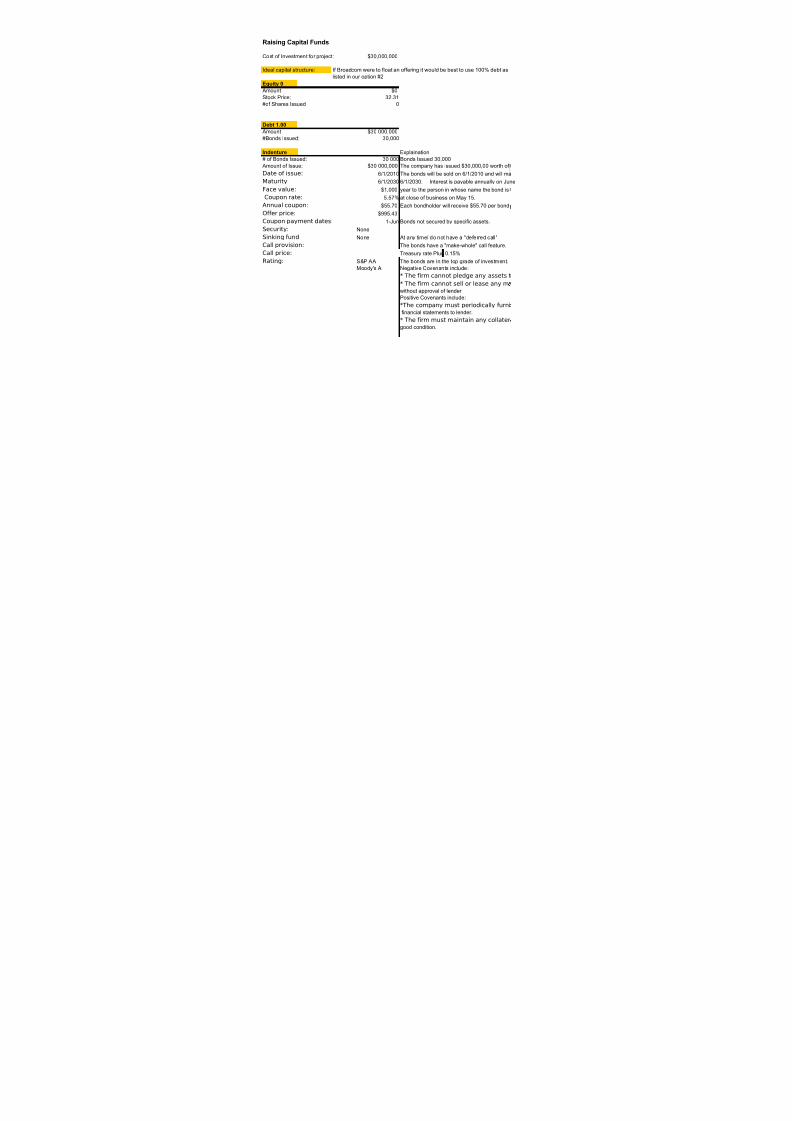
Raising Capital Funds
Cost of Investment for project: $30,000,000
Ideal capital structure: If Broadcom were to float an offering it would be best to use 100% debt as
listed in our option #2
Equity 0
Amount $0
Stock Price: 32.31
#of Shares Issued 0
Debt 1.00
Amount $30,000,000
#Bonds Issued: 30,000
Indenture Explaination
# of Bonds Issued: 30,000 Bonds Issued 30,000
Amount of Issue: $30,000,000 The company has issued $30,000,00 worth of
Date of issue: 6/1/2010 The bonds will be sold on 6/1/2010 and will ma
Maturity: 6/1/2030 6/1/2030. Interest is payable annually on June
Face value: $1,000 year to the person in whose name the bond is
Coupon rate: 5.57% at close of business on May 15.
Annual coupon: $55.70 Each bondholder will receive $55.70 per bond
Offer price: $995.43
Coupon payment dates: 1-Jun Bonds not secured by specific assets.
Security: None
Sinking fund: None At any time/ do not have a "deferred call"
Call provision: The bonds have a "make-whole" call feature.Call price: Treasury rate Plus 0.15%
Rating: S&P AA The bonds are in the top grade of investment.
Moody's A Negative Covenants include:
* The firm cannot pledge any assets t
* The firm cannot sell or lease any mwithout approval of lender
Positive Covenants include:
*The company must periodically furnifinancial statements to lender.
* The firm must maintain any collater
good condition.

8/7/2019 Broadcom Financial Analysis
http://slidepdf.com/reader/full/broadcom-financial-analysis 83/86

8/7/2019 Broadcom Financial Analysis
http://slidepdf.com/reader/full/broadcom-financial-analysis 84/86
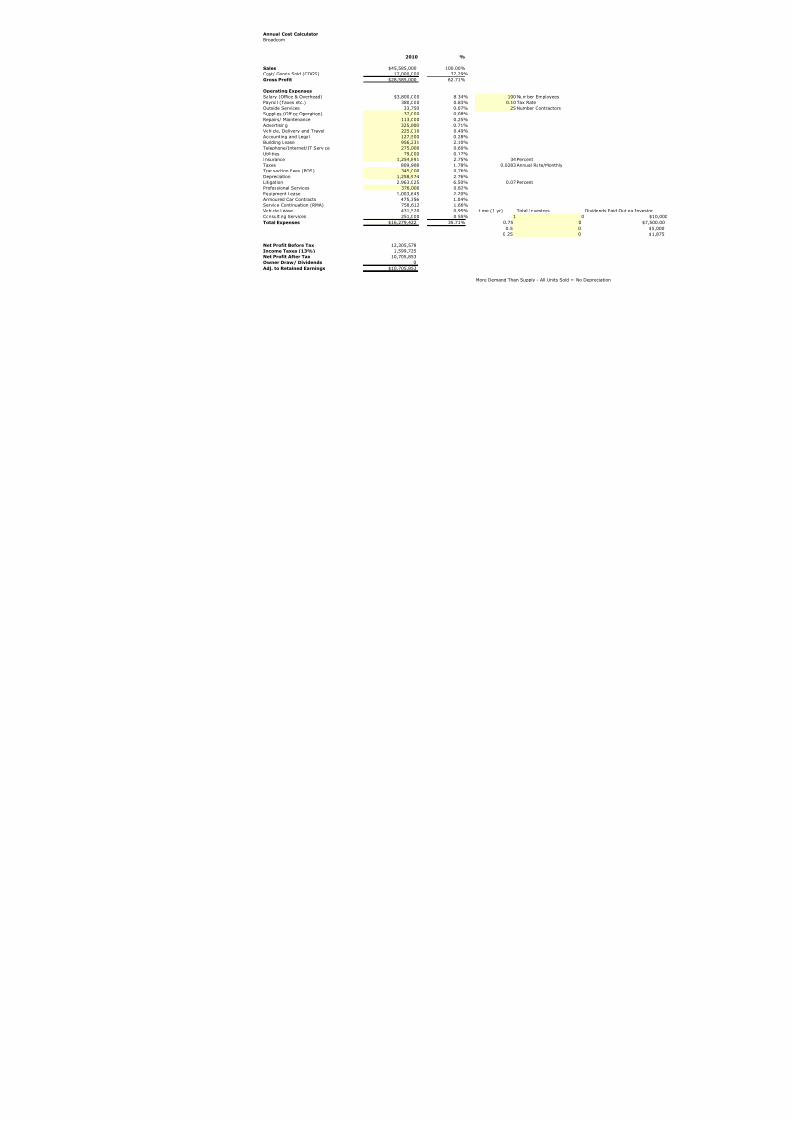
Annual Cost Calculator
Broadcom
2010 %
Sales $45,585,000 100.00%
Cost/ Goods Sold (COGS) 17,000,000 37.29%
Gross Profit $28,585,000 62.71%
Operating Expenses
Salary (Office & Overhead) $3,800,000 8.34% 100 Number Em
Payroll (Taxes etc.) 380,000 0.83% 0.10 Tax Rate
Outside Services 33,750 0.07% 25 Number Co
Supplies (Office Operation) 37,000 0.08%
Repairs/ Maintenance 113,000 0.25%
Advertising 325,000 0.71%
Vehicle, Delivery and Travel 225,010 0.49%
Accounting and Legal 127,500 0.28%
Building Lease 956,231 2.10%
Telephone/Internet/IT Service 275,000 0.60%
Utilities 79,000 0.17%
Insurance 1,254,891 2.75% 34 Percent
Taxes 809,908 1.78% 0.0283 Annual Rat
Transaction Fees (POS) 345,000 0.76%
Depreciation 1,258,974 2.76%
Litigation 2,963,025 6.50% 0.07 Percent
Professional Services 376,000 0.82%
Equipment Lease 1,003,645 2.20%
Armoured Car Contracts 475,356 1.04%
Service Continuation (RMA) 758,612 1.66%
Vehicle Lease 431,520 0.95% time (1 yr) Total Inves
Consulting Services 251,000 0.55% 1
Total Expenses $16,279,422 35.71% 0.75
0.5
0.25
Net Profit Before Tax 12,305,578
Income Taxes (13%) 1,599,725
Net Profit After Tax 10,705,853
Owner Draw/ Dividends 0
Adj. to Retained Earnings $10,705,853
More Demand Than Supply -

8/7/2019 Broadcom Financial Analysis
http://slidepdf.com/reader/full/broadcom-financial-analysis 85/86
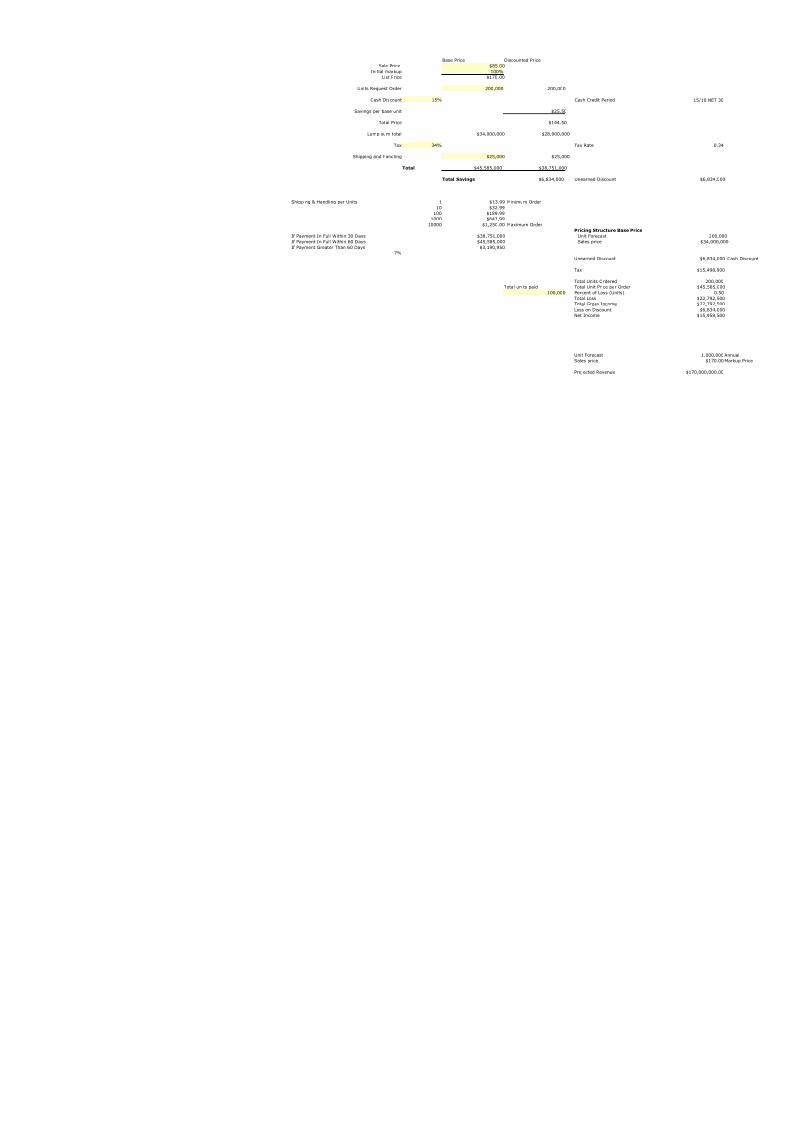
Base Price Discounted Price
Sale Price $85.00
Initial markup 100%
List Price $170.00
Units Request Order 200,000
Cash Discount 15%
Savings per base unit
Total Price
Lump sum total $34,000,000
Tax 34%
Shipping and handling $25,000
Total $45,585,000
Total Savings
Shipping & Handling per Units 1 $13.99 Minimum Orde
10 $32.99
100 $189.99
1000 $643.99
10000 $1,250.00 Maximum Orde
If Payment In Full Within 30 Days $38,751,000
If Payment In Full Within 60 Days $45,585,000
If Payment Greater Than 60 Days $3,190,950
7%
Total units paid

8/7/2019 Broadcom Financial Analysis
http://slidepdf.com/reader/full/broadcom-financial-analysis 86/86
Samsung-United States
Termination Costs
Cost Items: Percent From Operating Expenses
Salary (Office & Overhead) 316,770.87 0.0834
Payroll (Taxes etc.) 3,167.71 0.0083
Outside Services 24.99 0.0007Supplies (Office Operation) 30.03 0.0008
Repairs/ Maintenance 280.11 0.0025
Advertising 2,317.10 0.0071
Vehicle, Delivery and Travel 1,110.66 0.0049
Accounting and Legal 356.61 0.0028
Building Lease 20,058.74 0.0210
Telephone/Internet/IT Service 1,658.99 0.0060
Utilities 136.91 0.0017
Insurance 34,545.39 0.0275
Taxes 14,389.63 0.0178
Depreciation 34,770.55 0.0276Parts:
Depreciation 34,770.55 0.0276
Assests:
Unearned Discount 6,834,000.00 0.1500
Equipment Lease 22,097.25 0.0220
One-time Costs:
Transaction Fees (POS) 2,611.06 0.0076
Professional Services 3,101.37 0.0082
Third Party Contracts:
Vehicle Lease 4,084.89 0.0095
Armoured Car Contracts 4,956.97 0.0104Litigation 192,596.63 0.0650
Consulting Services 1,382.06 0.0055
Wind Down Services:
Service Continuation (RMA) 12,624.60 0.02
Professional Services 273,801.00
Consulting to New Supplier 102,549.00
Risk @ 20% $22,792,500