Embed Size (px)
DESCRIPTION
BCC's monthly economic review for 02/2014
Citation preview
05/02/2014 UK Economic Review PAGE 1 OF 4
UK Monthly Economic Review February 2014 (Based on January 2014 data releases)
Monthly headlines:
UK economic growth reaches six-year high, and the IMF raises its forecast for UK GDP
Although most sectors saw a rise in output in Q4, services remains the key driver of growth
UK employment reaches historic high, but an early interest rate rise is not expected
UK GDP grew by 0.7% in Q4 2013...
The first official estimate of GDP revealed that the
UK economy grew in real terms by 0.7% in Q4 2013
(see Chart 1), only slightly below the growth of 0.8%
recorded in Q3. This means that for 2013 as a whole,
the UK economy grew by 1.9%, the fastest growth
since 2007. UK economic output is now estimated to
be just 1.3% below its pre-recession peak in Q1 2008.
This is in line with the latest Quarterly Economic
Survey (QES) in which most of the key national
balances rose in Q4 and supports our view that the
UK economic recovery is gathering momentum.
-8.0
-6.0
-4.0
-2.0
0.0
2.0
4.0
6.0
-3.0
-2.5
-2.0
-1.5
-1.0
-0.5
0.0
0.5
1.0
1.5
20
07
Q4
20
08
Q2
20
08
Q4
20
09
Q2
20
09
Q4
20
10
Q2
20
10
Q4
20
11
Q2
20
11
Q4
20
12
Q2
20
12
Q4
20
13
Q2
20
13
Q4
% B
alan
ce
Qu
arte
rly
GD
P G
row
th %
Chart: 1 Real GDP Growth
Quarterly GDP growth Annual GDP growth
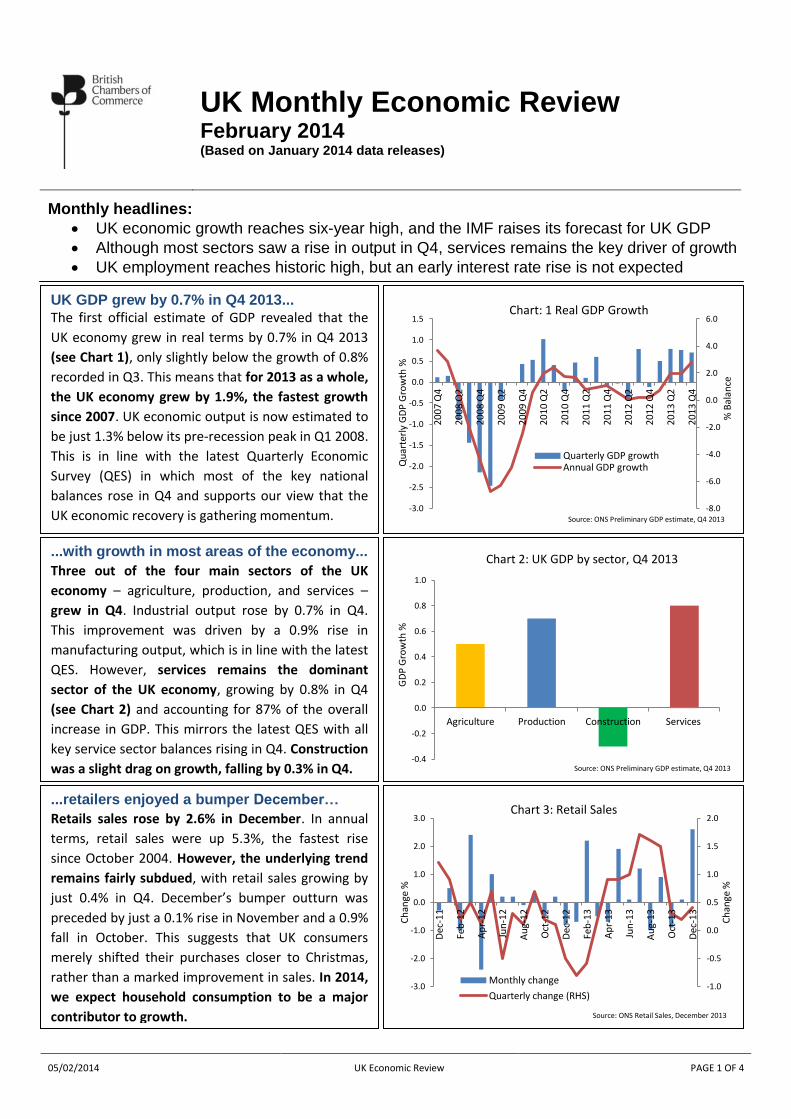
...with growth in most areas of the economy...
Three out of the four main sectors of the UK
economy – agriculture, production, and services –
grew in Q4. Industrial output rose by 0.7% in Q4.
This improvement was driven by a 0.9% rise in
manufacturing output, which is in line with the latest
QES. However, services remains the dominant
sector of the UK economy, growing by 0.8% in Q4
(see Chart 2) and accounting for 87% of the overall
increase in GDP. This mirrors the latest QES with all
key service sector balances rising in Q4. Construction
was a slight drag on growth, falling by 0.3% in Q4.
.
-0.4
-0.2
0.0
0.2
0.4
0.6
0.8
1.0
Agriculture Production Construction Services
GD
P G
row
th %
Chart 2: UK GDP by sector, Q4 2013
-1.0
-0.5
0.0
0.5
1.0
1.5
2.0
-3.0
-2.0
-1.0
0.0
1.0
2.0
3.0
Dec
-11
Feb
-12
Ap
r-1
2
Jun
-12
Au
g-1
2
Oct
-12
Dec
-12
Feb
-13
Ap
r-1
3
Jun
-13
Au
g-1
3
Oct
-13
Dec
-13
Ch
ange
%
Ch
ange
%
Chart 3: Retail Sales
Monthly change
Quarterly change (RHS)
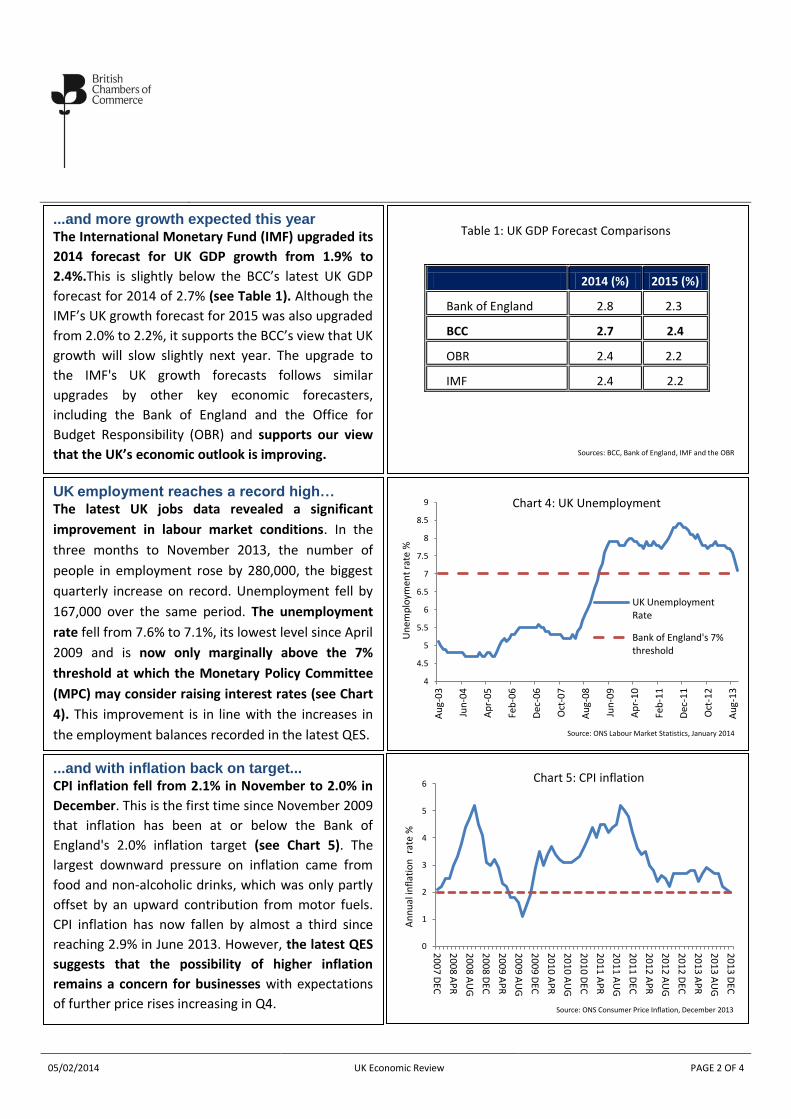
...retailers enjoyed a bumper December…
Retails sales rose by 2.6% in December. In annual
terms, retail sales were up 5.3%, the fastest rise
since October 2004. However, the underlying trend
remains fairly subdued, with retail sales growing by
just 0.4% in Q4. December’s bumper outturn was
preceded by just a 0.1% rise in November and a 0.9%
fall in October. This suggests that UK consumers
merely shifted their purchases closer to Christmas,
rather than a marked improvement in sales. In 2014,
we expect household consumption to be a major
contributor to growth.
Source: ONS Preliminary GDP estimate, Q4 2013
Source: ONS Preliminary GDP estimate, Q4 2013
Source: ONS Retail Sales, December 2013
05/02/2014 UK Economic Review PAGE 2 OF 4
+
some
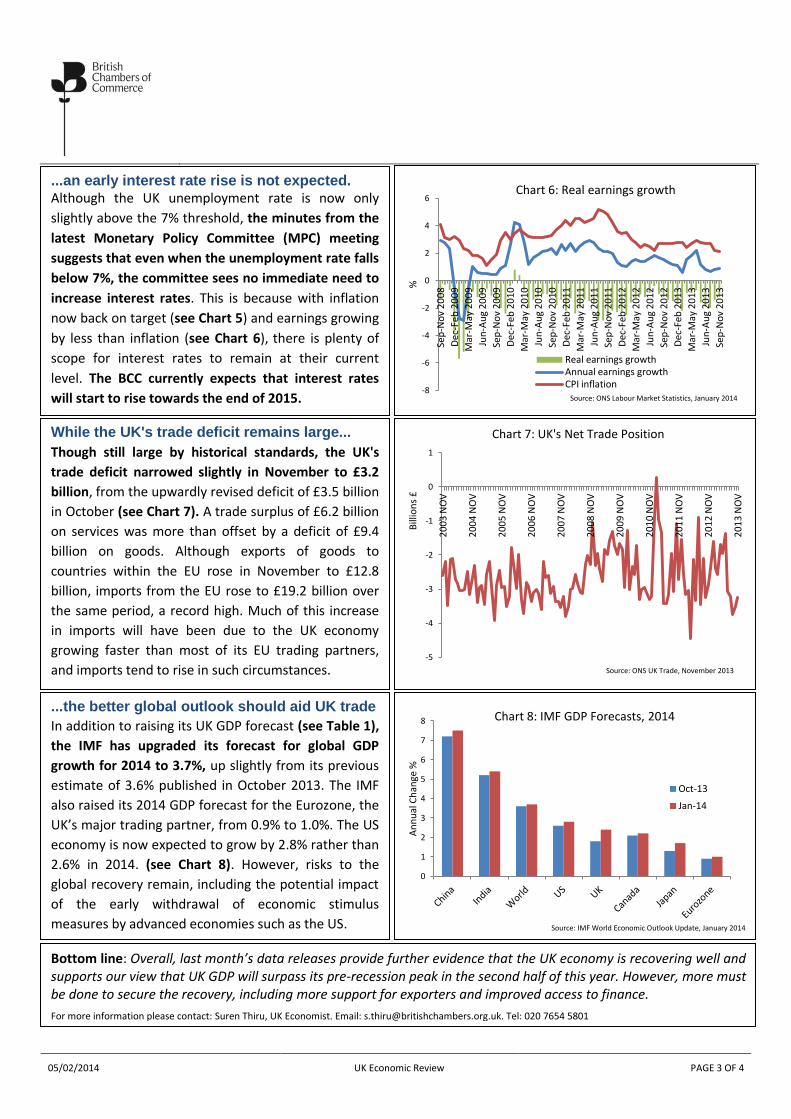
...and more growth expected this year
The International Monetary Fund (IMF) upgraded its
2014 forecast for UK GDP growth from 1.9% to
2.4%.This is slightly below the BCC’s latest UK GDP
forecast for 2014 of 2.7% (see Table 1). Although the
IMF’s UK growth forecast for 2015 was also upgraded
from 2.0% to 2.2%, it supports the BCC’s view that UK
growth will slow slightly next year. The upgrade to
the IMF's UK growth forecasts follows similar
upgrades by other key economic forecasters,
including the Bank of England and the Office for
Budget Responsibility (OBR) and supports our view
that the UK’s economic outlook is improving.
2014 (%) 2015 (%)
Bank of England 2.8 2.3
BCC 2.7 2.4
OBR 2.4 2.2
IMF 2.4 2.2
4
4.5
5
5.5
6
6.5
7
7.5
8
8.5
9
Au
g-0
3
Jun
-04
Ap
r-0
5
Feb
-06
Dec
-06
Oct
-07
Au
g-0
8
Jun
-09
Ap
r-1
0
Feb
-11
Dec
-11
Oct
-12
Au
g-1
3
Un
emp
loym
ent
rate
%
Chart 4: UK Unemployment
UK Unemployment Rate
Bank of England's 7% threshold
...and with inflation back on target...
CPI inflation fell from 2.1% in November to 2.0% in
December. This is the first time since November 2009
that inflation has been at or below the Bank of
England's 2.0% inflation target (see Chart 5). The
largest downward pressure on inflation came from
food and non-alcoholic drinks, which was only partly
offset by an upward contribution from motor fuels.
CPI inflation has now fallen by almost a third since
reaching 2.9% in June 2013. However, the latest QES
suggests that the possibility of higher inflation
remains a concern for businesses with expectations
of further price rises increasing in Q4.
0
1
2
3
4
5
6
20
07
DEC
20
08
AP
R
20
08
AU
G
20
08
DEC
20
09
AP
R
20
09
AU
G
20
09
DEC
20
10
AP
R
20
10
AU
G
20
10
DEC
20
11
AP
R
20
11
AU
G
20
11
DEC
20
12
AP
R
20
12
AU
G
20
12
DEC
20
13
AP
R
20
13
AU
G
20
13
DEC
An
nu
al in
flat
ion
rat
e %
Chart 5: CPI inflation
UK employment reaches a record high…
The latest UK jobs data revealed a significant
improvement in labour market conditions. In the
three months to November 2013, the number of
people in employment rose by 280,000, the biggest
quarterly increase on record. Unemployment fell by
167,000 over the same period. The unemployment
rate fell from 7.6% to 7.1%, its lowest level since April
2009 and is now only marginally above the 7%
threshold at which the Monetary Policy Committee
(MPC) may consider raising interest rates (see Chart
4). This improvement is in line with the increases in
the employment balances recorded in the latest QES.
Source: ONS Labour Market Statistics, January 2014
Source: ONS Consumer Price Inflation, December 2013
Table 1: UK GDP Forecast Comparisons
Sources: BCC, Bank of England, IMF and the OBR
05/02/2014 UK Economic Review PAGE 3 OF 4
Bottom line: Overall, last month’s data releases provide further evidence that the UK economy is recovering well and supports our view that UK GDP will surpass its pre-recession peak in the second half of this year. However, more must be done to secure the recovery, including more support for exporters and improved access to finance.
For more information please contact: Suren Thiru, UK Economist. Email: [email protected]. Tel: 020 7654 5801
For more information please contact: Suren Thiru, UK Economic Advisor. Email: [email protected]
...an early interest rate rise is not expected.
Although the UK unemployment rate is now only
slightly above the 7% threshold, the minutes from the
latest Monetary Policy Committee (MPC) meeting
suggests that even when the unemployment rate falls
below 7%, the committee sees no immediate need to
increase interest rates. This is because with inflation
now back on target (see Chart 5) and earnings growing
by less than inflation (see Chart 6), there is plenty of
scope for interest rates to remain at their current
level. The BCC currently expects that interest rates
will start to rise towards the end of 2015.
While the UK's trade deficit remains large...
Though still large by historical standards, the UK's
trade deficit narrowed slightly in November to £3.2
billion, from the upwardly revised deficit of £3.5 billion
in October (see Chart 7). A trade surplus of £6.2 billion
on services was more than offset by a deficit of £9.4
billion on goods. Although exports of goods to
countries within the EU rose in November to £12.8
billion, imports from the EU rose to £19.2 billion over
the same period, a record high. Much of this increase
in imports will have been due to the UK economy
growing faster than most of its EU trading partners,
and imports tend to rise in such circumstances.
...the better global outlook should aid UK trade
In addition to raising its UK GDP forecast (see Table 1),
the IMF has upgraded its forecast for global GDP
growth for 2014 to 3.7%, up slightly from its previous
estimate of 3.6% published in October 2013. The IMF
also raised its 2014 GDP forecast for the Eurozone, the
UK’s major trading partner, from 0.9% to 1.0%. The US
economy is now expected to grow by 2.8% rather than
2.6% in 2014. (see Chart 8). However, risks to the
global recovery remain, including the potential impact
of the early withdrawal of economic stimulus
measures by advanced economies such as the US.
-8
-6
-4
-2
0
2
4
6
Sep
-No
v 2
00
8
Dec
-Feb
20
09
Mar
-May
20
09
Jun
-Au
g 2
00
9
Sep
-No
v 2
00
9
Dec
-Feb
20
10
Mar
-May
20
10
Jun
-Au
g 2
01
0
Sep
-No
v 2
01
0
Dec
-Feb
20
11
Mar
-May
20
11
Jun
-Au
g 2
01
1
Sep
-No
v 2
01
1
Dec
-Feb
20
12
Mar
-May
20
12
Jun
-Au
g 2
01
2
Sep
-No
v 2
01
2
Dec
-Feb
20
13
Mar
-May
20
13
Jun
-Au
g 2
01
3
Sep
-No
v 2
01
3 %
Chart 6: Real earnings growth
Real earnings growth Annual earnings growth CPI inflation
-5
-4
-3
-2
-1
0
1 2
00
3 N
OV
20
04
NO
V
20
05
NO
V
20
06
NO
V
20
07
NO
V
20
08
NO
V
20
09
NO
V
20
10
NO
V
20
11
NO
V
20
12
NO
V
20
13
NO
V
Bill
ion
s £
Chart 7: UK's Net Trade Position
0
1
2
3
4
5
6
7
8
An
nu
al C
han
ge %
Chart 8: IMF GDP Forecasts, 2014
Oct-13
Jan-14
Source: ONS Labour Market Statistics, January 2014
Source: IMF World Economic Outlook Update, January 2014
Source: ONS UK Trade, November 2013
05/02/2014 UK Economic Review PAGE 4 OF 4
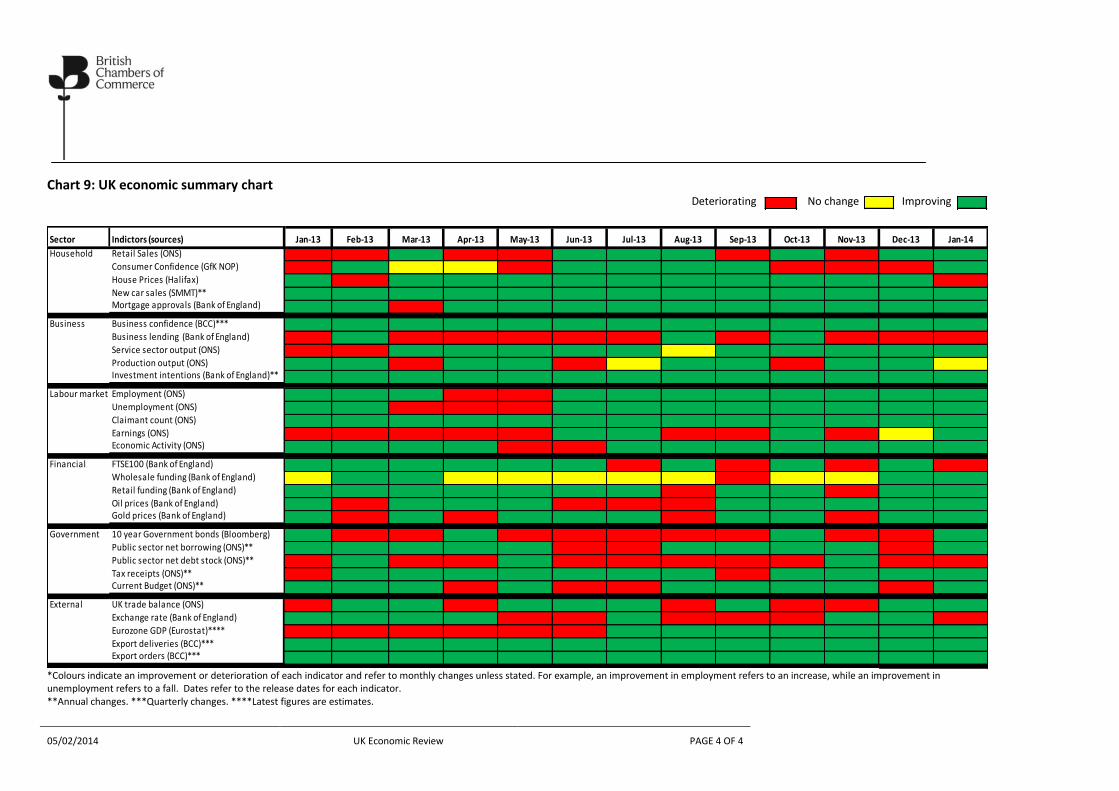
Chart 9: UK economic summary chart Deteriorating No change Improving
*Colours indicate an improvement or deterioration of each indicator and refer to monthly changes unless stated. For example, an improvement in employment refers to an increase, while an improvement in unemployment refers to a fall. Dates refer to the release dates for each indicator. **Annual changes. ***Quarterly changes. ****Latest figures are estimates.
Sector Indictors (sources) Jan-13 Feb-13 Mar-13 Apr-13 May-13 Jun-13 Jul-13 Aug-13 Sep-13 Oct-13 Nov-13 Dec-13 Jan-14
Household Retail Sales (ONS)
Consumer Confidence (GfK NOP)
House Prices (Halifax)
New car sales (SMMT)**Mortgage approvals (Bank of England)
Business Business confidence (BCC)***
Business lending (Bank of England)
Service sector output (ONS)
Production output (ONS)Investment intentions (Bank of England)**
Labour market Employment (ONS)
Unemployment (ONS)
Claimant count (ONS)
Earnings (ONS)Economic Activity (ONS)
Financial FTSE100 (Bank of England)
Wholesale funding (Bank of England)
Retail funding (Bank of England)
Oil prices (Bank of England)Gold prices (Bank of England)
Government 10 year Government bonds (Bloomberg)
Public sector net borrowing (ONS)**
Public sector net debt stock (ONS)**
Tax receipts (ONS)**Current Budget (ONS)**
External UK trade balance (ONS)
Exchange rate (Bank of England)
Eurozone GDP (Eurostat)****
Export deliveries (BCC)***Export orders (BCC)***