Embed Size (px)
Citation preview

Page 1
THIS REPORT CONTAINS ASSESSMENTS OF COMMODITY AND TRADE ISSUES MADE BY
USDA STAFF AND NOT NECESSARILY STATEMENTS OF OFFICIAL U.S. GOVERNMENT
POLICY
Date:
GAIN Report Number:
Approved By:
Prepared By:
Report Highlights:
Post forecasts milk production to decrease by 8 percent in CY 2016 caused by the severe drought faced
by the country in 2015/2016. In addition, the dairy industry decided to reduce investments because of
the risk due to the lack of the water supply. This scenario resulted in lower domestic milk production,
which affected retail prices and milk availability in the market. Lower domestic milk supply forced the
country to increase dairy imports. From January to September 2016, purchases of dairy products in
general including dairy ingredients from abroad, reached 201,507 MT, nearly 74 percent above from the
same period in 2015.
Priscila Ming, Agricultural Specialist and Nicolas Rubio, Agricultural Attaché
Clay Hamilton, Agricultural Minister Counselor
Annual Dairy Report
Dairy and Products Annual
Brazil
BR 1620
10/28/2016
Required Report - public distribution

Page 2
Commodities:
Production:
In 2015/2016, Brazil had one of the most severe droughts since 1930, causing serious impacts in large
areas of Brazil’s southeastern region, in particular the states of São Paulo, Rio de Janeiro, and Minas
Gerais. Minas Gerais is the main milk producing state in Brazil, accounting for 26 percent of total milk
production. The severe dryness had a negative impact on dairy production due to issues with pasture for
animals but also in the production operations, specifically cleaning of the silos and maintenance of
production lines. The dairy industry decided to reduce investments because of the risk due to the lack of
the water supply. This scenario resulted in lower domestic milk production, which affected retail prices
and milk availability in the market.
Post estimates milk production under inspection of governmental official to reach 24.8 million metric
tons (MMT) in CY 2015 and 22.7 MMT in CY2016. Post also forecasts that milk production will
recover and reach 24.2 MMT in CY 2017.
Trade:
Brazil imports and exports insignificant volumes of fluid milk. Typically packaged UHT milk imports
are sold by companies from Argentina and Uruguay with commercial interests in Brazil.
The average fluid milk prices in CY 2016 have increased almost 50 percent compared to the same
period in the previous year. There are several factors causing this situation: the weakening Brazilian
real, the correlation of domestic and international prices, increase of feed meal prices, and high
inflation.
Milk Prices ( Fluid Milk, "fresh") paid to the producer
Dairy, Milk, Fluid

Page 3
States Prices in
September 2015
(R$/liter)
Prices in
September 2016
(R$/liter)
Prices in
September 2015
(US$/liter)
Prices in
September 2015
(US$/liter)
Minas
Gerais 1.0820 1.6848 0.3381 0.5265
Rio Grande
do Sul 0.9644 1.5984 0.3014 0.4995
Parana 1.0536 1.6332 0.3293 0.5104
São Paulo 1.1129 1.6113 0.3478 0.5035
Goias 1.1471 1.7060 0.3585 0.5331
Santa
Catarina 1.0579 1.5607 0.3306 0.4877
Bahia 1.0269 1.3888 0.3209 0.4340 Source: Conab
Average Exchange rate for Sep 2016: US$ 1.00 = R$ 3.20
Fluid Milk Acquisition:
The Brazilian dairy sector experienced further consolations in the recent years. The fifteen largest dairy
companies were responsible for the acquisition of 9.857 billion liters of milk in 2015. As mentioned,
the milk shortage led those companies to rethink their investments and postpone plans for expansions.
Stocks:
Current milk and dairy product stocks held by major dairy companies are considered operating stocks to
meet short term demand. There are no government held stocks of milk or milk products in Brazil.
Production, Supply and Demand Data Statistics:
Page 4
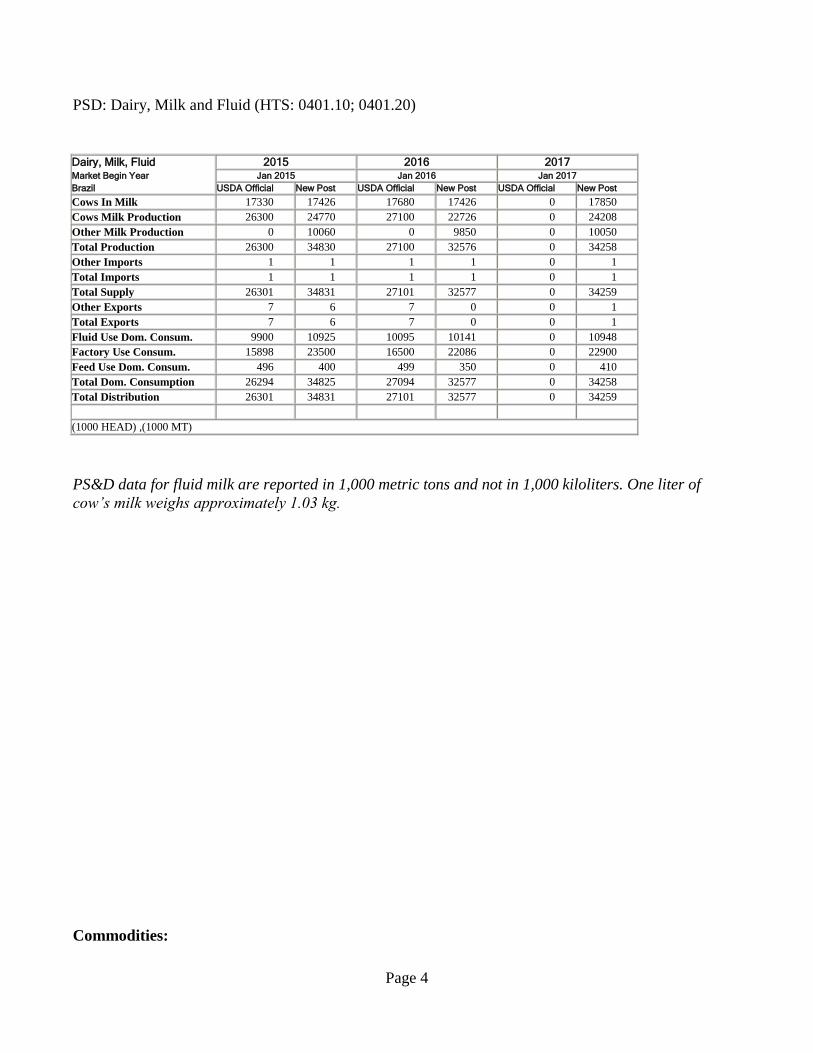
PSD: Dairy, Milk and Fluid (HTS: 0401.10; 0401.20)
Dairy, Milk, Fluid 2015 2016 2017 Market Begin Year Jan 2015 Jan 2016 Jan 2017
Brazil USDA Official New Post USDA Official New Post USDA Official New Post
Cows In Milk 17330 17426 17680 17426 0 17850
Cows Milk Production 26300 24770 27100 22726 0 24208
Other Milk Production 0 10060 0 9850 0 10050
Total Production 26300 34830 27100 32576 0 34258
Other Imports 1 1 1 1 0 1
Total Imports 1 1 1 1 0 1
Total Supply 26301 34831 27101 32577 0 34259
Other Exports 7 6 7 0 0 1
Total Exports 7 6 7 0 0 1
Fluid Use Dom. Consum. 9900 10925 10095 10141 0 10948
Factory Use Consum. 15898 23500 16500 22086 0 22900
Feed Use Dom. Consum. 496 400 499 350 0 410
Total Dom. Consumption 26294 34825 27094 32577 0 34258
Total Distribution 26301 34831 27101 32577 0 34259
(1000 HEAD) ,(1000 MT)
PS&D data for fluid milk are reported in 1,000 metric tons and not in 1,000 kiloliters. One liter of
cow’s milk weighs approximately 1.03 kg.
Commodities:

Page 5
Production: Note: There are no official statistics on production and consumption of cheese in Brazil. Post production estimates for
cheese are based on trade sources and also include “informal” cheese production.
Post forecasts cheese production in CY 2016 to decrease to 745 MT, the cause is mainly the milk
shortage in the market and an estimated small growth in the fast-food sector. The forecast for cheese
production in CY 2017 is to reach 772 MT. This slightly increase is boosted mostly for exports to
Russia.
Trade:
Imports:
Cheese imports in CY2016 are projected to increase by 92 percent, as a result of reduced fluid milk
suppliers. For CY 2017, Post forecasts a slight decrease in imports due to the higher value of the
Brazilian real and a continued drop in consumer income. Cheese manufacturers will try to recover the
production volume from previous years.
Imports from Uruguay and Argentina increased significant amounts compared to other countries. The
main reasons for this scenario, is that due the milk shortage, Brazil searched for low cost cheeses
produced in these two countries. Imported cheese from these countries included mainly parmesan and
"prato" cheese ( yellow cheese), used in the food service sector.
Brazil Import Statistics
Commodity: 0406, Cheese And Curd
Year To Date: January - September
Partner Country
Unit
2014 2015 2016 Change %2015/20
16 USD
Quantity
USD Quantit
y USD
Quantity
World T
87,501,5
39
15,435
73,406,4
71
15,909
103,920,5
65
30,492 92%
Argentina T
37,559,4
53
7,226
32,491,9
05
7,961
47,694,55
6
14,636 84%
Uruguay T
25,020,1
48
5,530
23,564,6
74
5,726
43,659,65
5
14,122 147%
France T
6,605,75
1
709
4,576,58
2
645
3,941,941
582 -10%
Netherlands T
10,613,1
43
1,119
6,236,98
5
772
3,787,996
515 -33%
Italy T -19%
Dairy, Cheese

Page 6
3,527,407
321 3,018,438
327 2,234,408 264
Germany T
1,184,70
0
156
1,019,48
0
159
805,147
129 -19%
Denmark T
360,653
34
692,314
71
471,400
52 -27%
Switzerland T
446,619
28
380,346
30
346,214
29 -3%
Portugal T
688,522
53
311,955
28
296,921
32 14%
United States T
995,059
201
628,193
134
212,260
51 -62%
Spain T
193,349
12
298,947
24
207,521
16 -33% United Kingdom T
306,735
43
145,192
26
184,109
42 62%
New Zealand T
-
-
-
-
52,414
20
Austria T
-
-
41,460
6
26,023
3 -50% Source of Data: SECEX – Foreign Trade Secretariat
Exports:
Cheese exports in CY 2016 reached 2.6 MT and Post forecasts that cheese exports will increase by 2
percent in CY 2017 to 2.7 MT. Brazil is not a strong cheese exporter, but companies are trying to
improve in terms of machineries and will target exports to Russia in CY 2017. Recently Russia opened
the cheese, milk powder and butter market to Brazil by registering some dairy plants to export to that
country. This will explain the increase in cheese production and in the exports in CY 2017.
Table - Tariff Rate Table
Tariff
Number
(HTS)
Product Description Rate
(%)
CXT *
Other Info
0406.10.10 Cheese, Mozzarella (1) 28 Mercosul:
27%
0406.10.90 Cheese, Other 16 Mercosul:
#(0)
0406.20.00 Cheese: Grated or Powdered 16 Mercosul:
#(0)
0406.90.10 Cheese, with a fat content less than 36 %, by weight (1)
28
Mercosul:
27%
0406.90.20 Cheese with a fat content superior or equal to 36 % and
less than 46%, by weight (1)

Page 7
28 Mercosul:
27%
* CXT: MERCOSUL Common External Tariff. The CXT tariff is applied to all imports other than from MERCOSUL. These tariffs are assessed on the CIF value of the product.
Note (1): Effective June 1, 2001, these types of cheeses were included on the "exception list" of the Common External Tax (CXT), of the MERCOSUL, per Resolution 16/01, of the Foreign Trade Chamber (CAMEX), which altered Annex Two of the Decree Number 3,704 of December 27, 2000. The 27% tax is
charged in addition to the Import Tariff of 16 percent for all imported cheeses, including MERCOSUL members.
Stocks:
There are no official government stocks of cheese in Brazil.
Production, Supply and Demand Data Statistics:
PSD: Dairy, Cheese (HTS: 0406)
Dairy, Cheese 2015 2016 2017 Market Begin Year Jan 2015 Jan 2016 Jan 2017
Brazil USDA Official New Post USDA Official New Post USDA Official New Post
Beginning Stocks 0 0 0 0 0 0
Production 751 754 766 745 0 772
Other Imports 21 22 20 33 0 30
Total Imports 21 22 20 33 0 30
Total Supply 772 776 786 778 0 802
Other Exports 3 3 3 3 0 3
Total Exports 3 3 3 3 0 3
Human Dom. Consumption 769 773 783 775 0 799
Other Use, Losses 0 0 0 0 0 0
Total Dom. Consumption 769 773 783 775 0 799
Total Use 772 776 786 778 0 802
Ending Stocks 0 0 0 0 0 0
Total Distribution 772 776 786 778 0 802
(1000 MT)

Page 8
Commodities:
Production:
Note: There are no official statistics on production and consumption of butter in Brazil. Post production estimates for
butter are based on trade sources, and includes “informal” butter production.
Butter production is projected to decrease by 1 percent in CY 2016, reflecting the milk shortage crisis.
Trade:
Export volumes for this product are insignificant in CY2016. Brazil mainly produces butter for its own
consumption and occasionally, depending on market conditions exports low volumes. Russia opened the
market for Brazil in September 2015 for dairy products: milk powder, cheese and butter. Post forecasts
a slight increase in butter exports in CY 2017, mainly to Russia, but the volumes are small compared to
other commodities
Due the milk shortage crisis, Brazil imported butter for industrial and retail purposes. Imports reached
5,016 MT, an increase of almost 200 percent in CY 2016.
Table - Tariff Rate Table
Tariff Number Product Description Rate (%)
CXT *
Other Info
0405.10.00 Butter 16 Mercosul: #(0)
0405.90.10 Butter Oil 16 Mercosul: #(0) CXT: MERCOSUL Common External Tariff (CXT). The CXT tariff is applied to all imports other than from MERCOSUL. These tariffs are assessed on the CIF value of the product.
Dairy, Butter

Page 9
Production, Supply and Demand Data Statistics:
PSD: Dairy, Butter (HTS: 0405)
Dairy, Butter 2015 2016 2017 Market Begin Year Jan 2015 Jan 2016 Jan 2017
Brazil USDA Official New Post USDA Official New Post USDA Official New Post
Beginning Stocks 0 0 0 0 0 0
Production 87 83 88 82 0 84
Other Imports 2 2 1 5 0 6
Total Imports 2 2 1 5 0 6
Total Supply 89 85 89 87 0 90
Other Exports 1 1 2 0 0 0
Total Exports 1 1 2 0 0 0
Domestic Consumption 88 84 87 87 0 90
Total Use 89 85 89 87 0 90
Ending Stocks 0 0 0 0 0 0
Total Distribution 89 85 89 87 0 90
(1000 MT)
Page 10
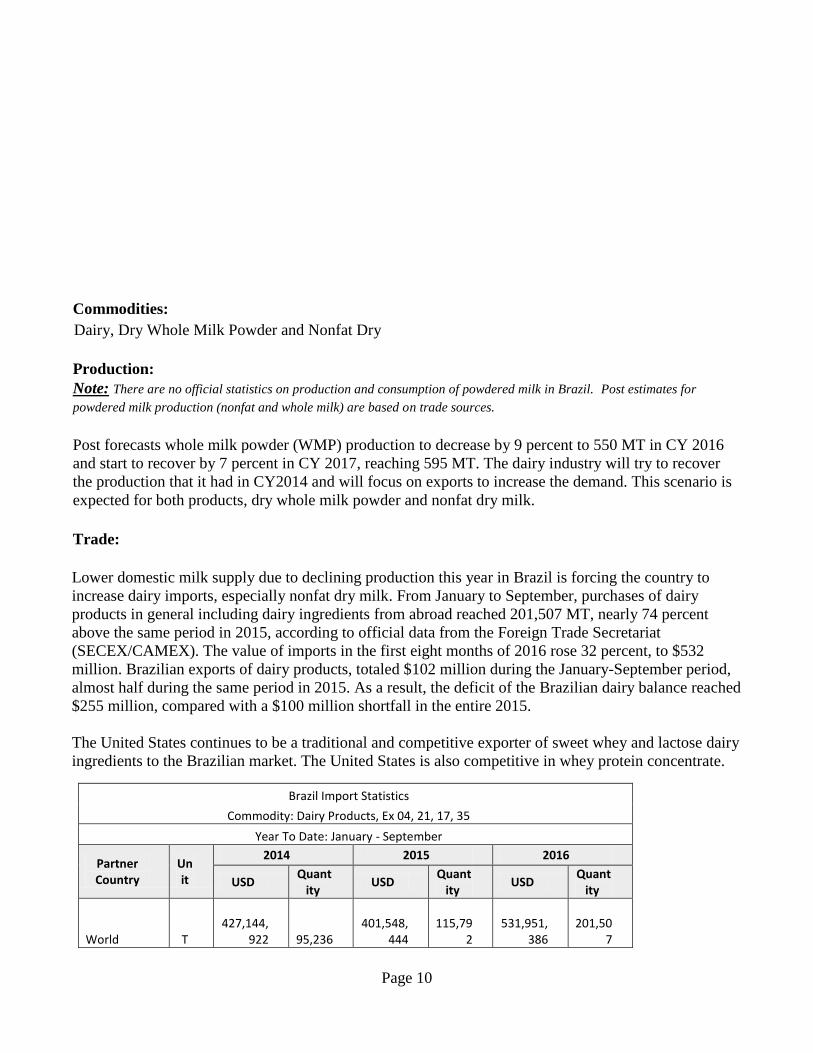
Commodities:
Production:
Note: There are no official statistics on production and consumption of powdered milk in Brazil. Post estimates for
powdered milk production (nonfat and whole milk) are based on trade sources.
Post forecasts whole milk powder (WMP) production to decrease by 9 percent to 550 MT in CY 2016
and start to recover by 7 percent in CY 2017, reaching 595 MT. The dairy industry will try to recover
the production that it had in CY2014 and will focus on exports to increase the demand. This scenario is
expected for both products, dry whole milk powder and nonfat dry milk.
Trade:
Lower domestic milk supply due to declining production this year in Brazil is forcing the country to
increase dairy imports, especially nonfat dry milk. From January to September, purchases of dairy
products in general including dairy ingredients from abroad reached 201,507 MT, nearly 74 percent
above the same period in 2015, according to official data from the Foreign Trade Secretariat
(SECEX/CAMEX). The value of imports in the first eight months of 2016 rose 32 percent, to $532
million. Brazilian exports of dairy products, totaled $102 million during the January-September period,
almost half during the same period in 2015. As a result, the deficit of the Brazilian dairy balance reached
$255 million, compared with a $100 million shortfall in the entire 2015.
The United States continues to be a traditional and competitive exporter of sweet whey and lactose dairy
ingredients to the Brazilian market. The United States is also competitive in whey protein concentrate.
Brazil Import Statistics
Commodity: Dairy Products, Ex 04, 21, 17, 35
Year To Date: January - September
Partner Country
Unit
2014 2015 2016
USD Quant
ity USD
Quantity
USD Quant
ity
World T
427,144,
922
95,236
401,548,
444
115,79
2
531,951,
386
201,50
7
Dairy, Dry Whole Milk Powder and Nonfat Dry

Page 11
Uruguay T
92,585,4
03
22,766
138,525,
769
44,772
251,989,
939
96,541
Argentina T
181,017,
202
46,887
138,781,
098
46,443
162,223,
860
71,424
United States T
55,450,5
47
10,419
58,889,3
46
12,110
39,781,5
66
13,115
New Zealand T
16,780,1
52
2,394
12,501,3
02
2,701
17,170,6
64
4,668
Chile T
12,723,4
37
2,748
1,863,42
8
625
13,239,7
64
5,465
France T
18,445,0
74
3,337
13,394,0
89
3,182
12,147,9
64
3,073
Netherlands T
17,226,3
73
2,619
13,971,6
14
2,503
9,886,59
7
2,181
Denmark T
11,529,3
24
739
10,015,4
93
829
7,804,98
1
747
Canada T
7,111,41
1
884
2,278,76
4
412
6,237,83
7
1,210
Others
14,275,9
99
2,443
11,327,2
14
2,216
11,468,2
14
3,081 Source of Data: SECEX – Foreign Trade Secretariat
Uruguay and Argentina are the traditional suppliers of milk powder to Brazil including nonfat dry milk.
Due to the shortage of milk in the market, Brazil has searched for other nontraditional milk powder
suppliers and has imported some from the United States even with an import tariff of 33 percent. Most
recently, some U.S exporters have taken advantage of this opportunity, with exports of US$ 7.7 million
dollars so far in 2016, an increase of 546 percent compared to the same timeframe last year.
Post forecasts that productions of dry whole milk powder and nonfat dry milk will recover to the same
numbers as it was in CY 2014.
Brazil Import Statistics
Commodity: _PSD NFDM, (040210)
Year To Date: January - September
Partner Country Unit 2014 2015 2016
USD Quantity USD Quantity USD Quantity
World T
73,144,692
15,338
73,343,926
24,092
65,519,863
26,617

Page 12
Uruguay T
39,035,073
8,112
42,596,109
14,007
28,603,710
10,114
Argentina T
34,109,619
7,226
29,605,219
9,646
25,718,596
11,417
United States T
- -
1,142,598
440
7,376,789
3,345
Chile T
- -
- -
3,815,354
1,740
Germany T
- -
- -
5,414
2
Source of Data: SECEX – Foreign Trade Secretariat
Production, Supply and Demand Data Statistics:
Dairy, Dry Whole Milk Powder 2015 2016 2017 Market Begin Year Jan 2015 Jan 2016 Jan 2017
Brazil USDA Official New Post USDA Official New Post USDA Official New Post
Beginning Stocks 0 0 0 0 0 0
Production 617 610 629 555 0 595
Other Imports 60 59 55 99 0 55
Total Imports 60 59 55 99 0 55
Total Supply 677 669 684 654 0 650
Other Exports 40 41 41 16 0 21
Total Exports 40 41 41 16 0 21
Human Dom. Consumption 637 628 643 638 0 629
Other Use, Losses 0 0 0 0 0 0
Total Dom. Consumption 637 628 643 638 0 629
Total Use 677 669 684 654 0 650
Ending Stocks 0 0 0 0 0 0
Total Distribution 677 669 684 654 0 650
(1000 MT)
Dairy, Milk, Nonfat Dry 2015 2016 2017 Market Begin Year Jan 2015 Jan 2016 Jan 2017
Brazil USDA Official New Post USDA Official New Post USDA Official New Post
Beginning Stocks 0 0 0 0 0 0
Production 157 155 160 153 0 157
Other Imports 35 35 35 28 0 35
Total Imports 35 35 35 28 0 35
Total Supply 192 190 195 181 0 192
Other Exports 0 0 0 0 0 0
Total Exports 0 0 0 0 0 0
Human Dom. Consumption 192 190 195 181 0 192
Other Use, Losses 0 0 0 0 0 0

Page 13
Total Dom. Consumption 192 190 195 181 0 192
Total Use 192 190 195 181 0 192
Ending Stocks 0 0 0 0 0 0
Total Distribution 192 190 195 181 0 192
(1000 MT)