Embed Size (px)
Citation preview
Page 1
THIS REPORT CONTAINS ASSESSMENTS OF COMMODITY AND TRADE ISSUES MADE BY
USDA STAFF AND NOT NECESSARILY STATEMENTS OF OFFICIAL U.S. GOVERNMENT
POLICY
Required Report - public distribution
Date: 10/9/2018
GAIN Report Number: BR1815
Brazil
DAIRY AND PRODUCTS ANNUAL
Annual Dairy Report
Approved By:
Oliver Flake, Agricultural Counselor
Prepared By:
Priscila Ming, Agricultural Specialist
Report Highlights:
Post revised all dairy tables for calendar year 2018 to reflect problems suffered by dairy producers.
Lower milk production and exports are expected due to the worsening of the economy following a
nationwide trucker strike. Weak domestic milk consumption and soft demand have resulted in limited
milk powder imports. The Brazilian dairy sector is expected to expand in 2019, due to growth of the
Brazilian economy in 2019, as well as declining inflation and unemployment rates. Major uncertainties
in the near future include the volatility of the exchange rate, end-of-year elections, and a new political
administration in 2019. Post forecasts dairy production in general to increase by 2 percent.
Page 2
Commodities:
Dairy, Milk, Fluid
Production:
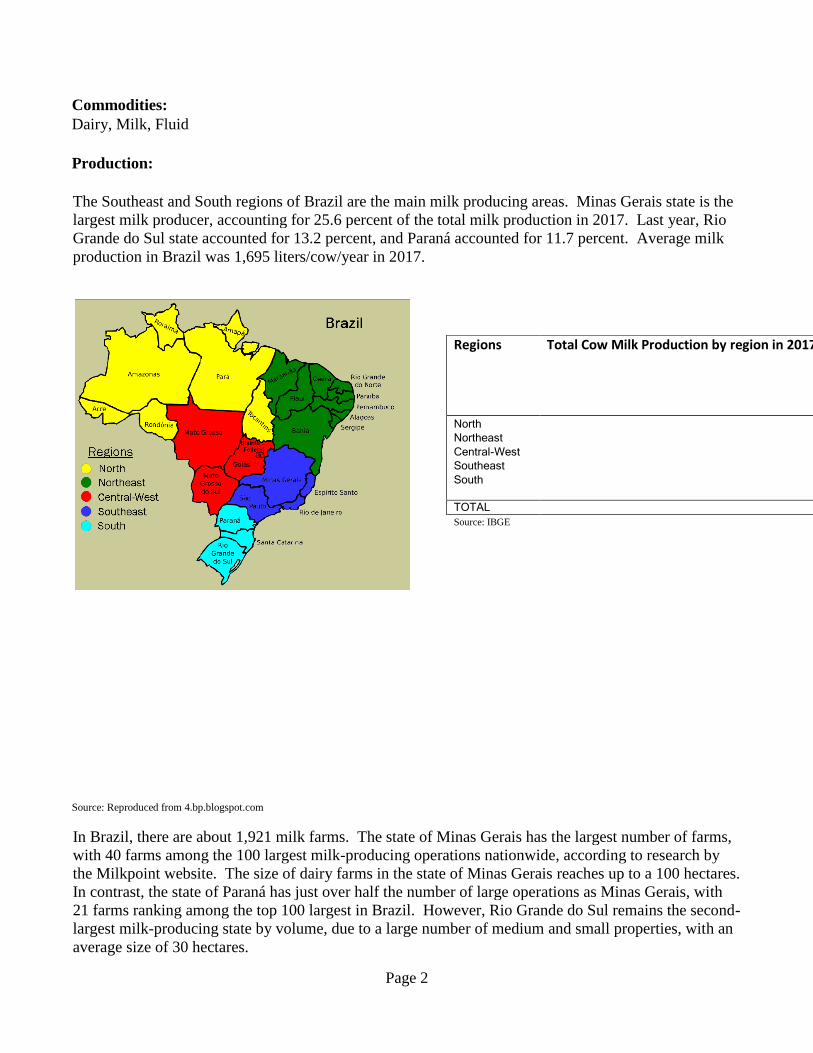
The Southeast and South regions of Brazil are the main milk producing areas. Minas Gerais state is the
largest milk producer, accounting for 25.6 percent of the total milk production in 2017. Last year, Rio
Grande do Sul state accounted for 13.2 percent, and Paraná accounted for 11.7 percent. Average milk
production in Brazil was 1,695 liters/cow/year in 2017.
Source: Reproduced from 4.bp.blogspot.com
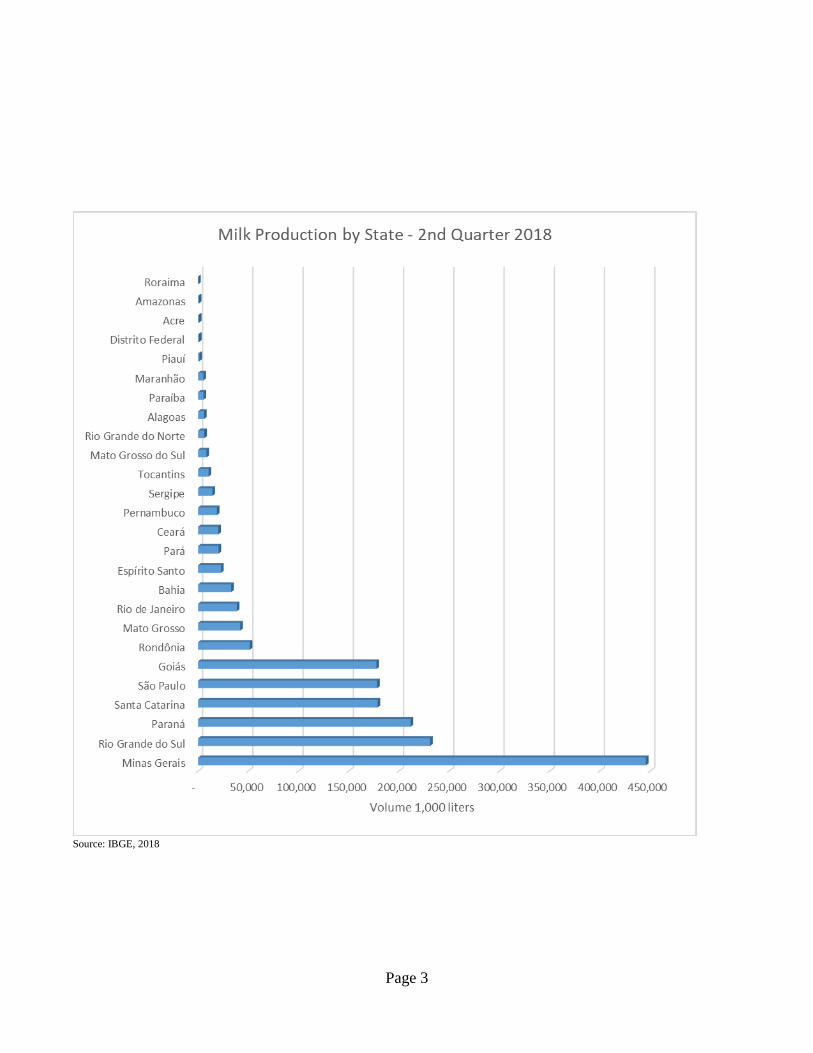
In Brazil, there are about 1,921 milk farms. The state of Minas Gerais has the largest number of farms,
with 40 farms among the 100 largest milk-producing operations nationwide, according to research by
the Milkpoint website. The size of dairy farms in the state of Minas Gerais reaches up to a 100 hectares.
In contrast, the state of Paraná has just over half the number of large operations as Minas Gerais, with
21 farms ranking among the top 100 largest in Brazil. However, Rio Grande do Sul remains the second-
largest milk-producing state by volume, due to a large number of medium and small properties, with an
average size of 30 hectares.
Regions Total Cow Milk Production by region in 2017/ MMT
North 1.094
Northeast 1.213
Central-West 3.029
Southeast 9.433
South 8.853
TOTAL 23.624 Source: IBGE
Page 3
Source: IBGE, 2018
Page 4
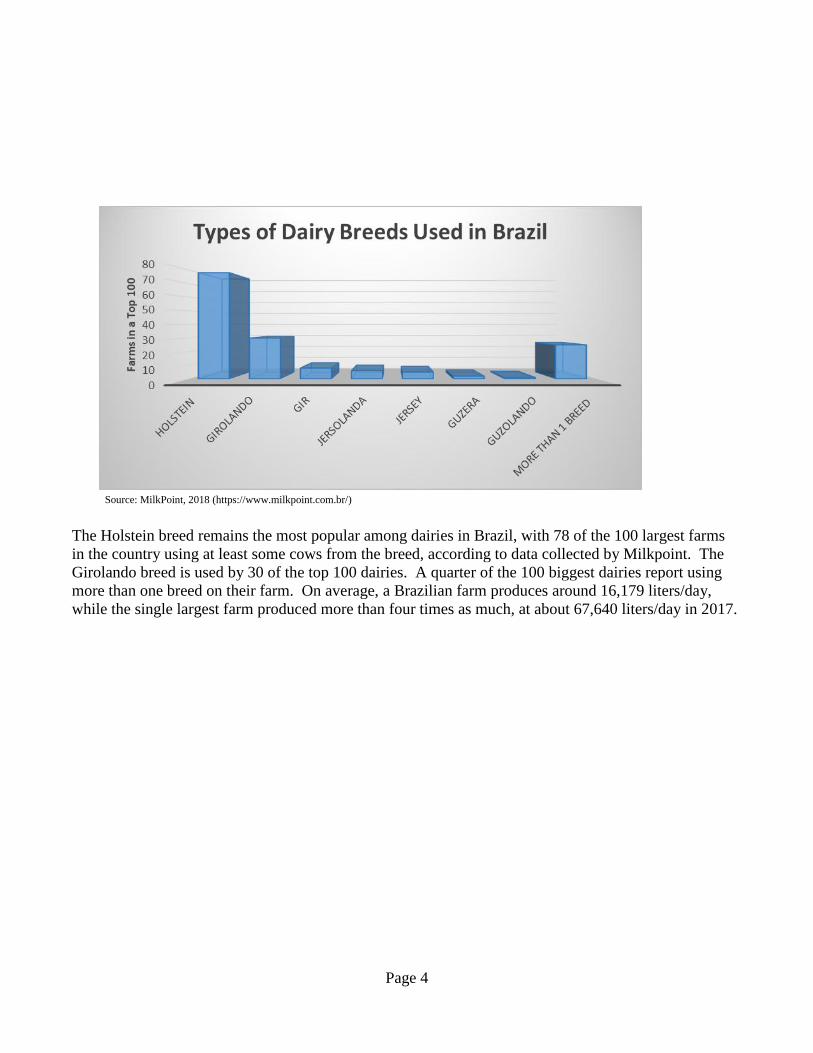
Source: MilkPoint, 2018 (https://www.milkpoint.com.br/)
The Holstein breed remains the most popular among dairies in Brazil, with 78 of the 100 largest farms
in the country using at least some cows from the breed, according to data collected by Milkpoint. The
Girolando breed is used by 30 of the top 100 dairies. A quarter of the 100 biggest dairies report using
more than one breed on their farm. On average, a Brazilian farm produces around 16,179 liters/day,
while the single largest farm produced more than four times as much, at about 67,640 liters/day in 2017.
Page 5
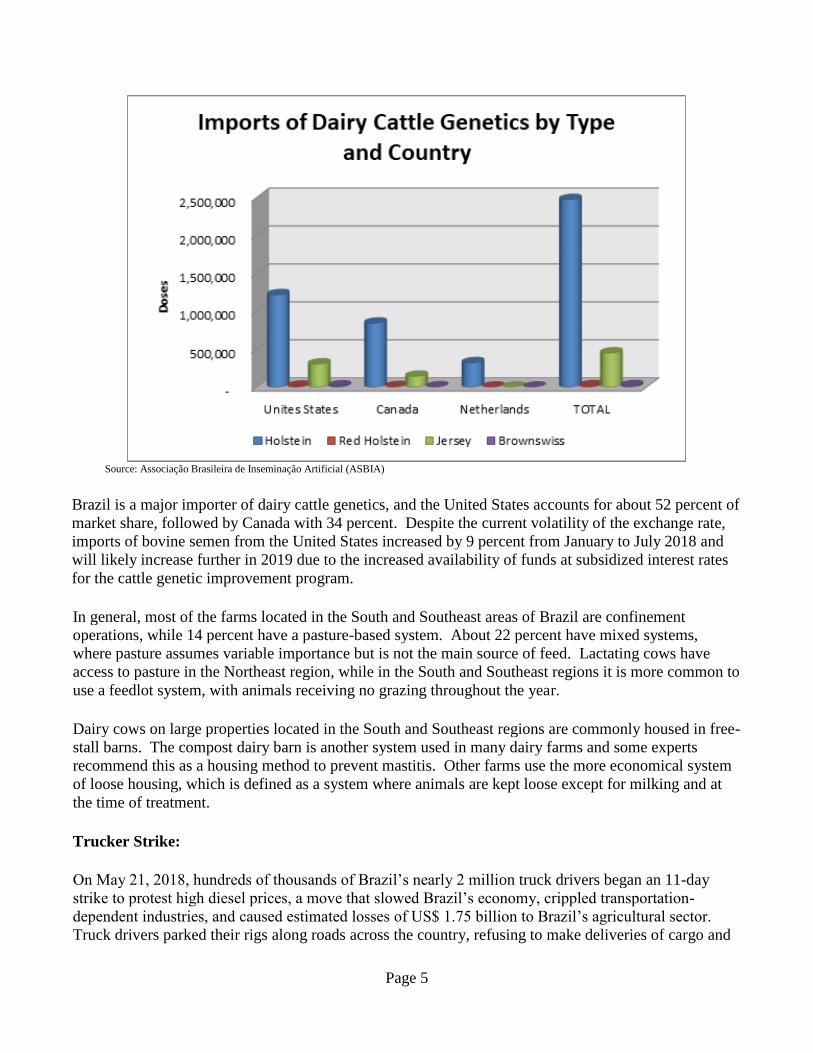
Source: Associação Brasileira de Inseminação Artificial (ASBIA)
Brazil is a major importer of dairy cattle genetics, and the United States accounts for about 52 percent of
market share, followed by Canada with 34 percent. Despite the current volatility of the exchange rate,
imports of bovine semen from the United States increased by 9 percent from January to July 2018 and
will likely increase further in 2019 due to the increased availability of funds at subsidized interest rates
for the cattle genetic improvement program.
In general, most of the farms located in the South and Southeast areas of Brazil are confinement
operations, while 14 percent have a pasture-based system. About 22 percent have mixed systems,
where pasture assumes variable importance but is not the main source of feed. Lactating cows have
access to pasture in the Northeast region, while in the South and Southeast regions it is more common to
use a feedlot system, with animals receiving no grazing throughout the year.
Dairy cows on large properties located in the South and Southeast regions are commonly housed in free-
stall barns. The compost dairy barn is another system used in many dairy farms and some experts
recommend this as a housing method to prevent mastitis. Other farms use the more economical system
of loose housing, which is defined as a system where animals are kept loose except for milking and at
the time of treatment.
Trucker Strike:
On May 21, 2018, hundreds of thousands of Brazil’s nearly 2 million truck drivers began an 11-day
strike to protest high diesel prices, a move that slowed Brazil’s economy, crippled transportation-
dependent industries, and caused estimated losses of US$ 1.75 billion to Brazil’s agricultural sector.
Truck drivers parked their rigs along roads across the country, refusing to make deliveries of cargo and
Page 6
creating roadblocks on more than half of Brazil’s 500 busiest highways. Within a few days, the effects
of the strike were widespread and painful, as gas stations ran out of fuel, drivers waited for hours in
lines for what small fuel supplies remained, supermarket shelves began to empty and some stores
rationed perishable products, and airports began cancelling flights as fuel supplies dwindled. Virtually
all segments of Brazil’s agricultural sector were affected in some way, but livestock and poultry
operations were particularly hard hit by feed delivery disruptions, idled slaughterhouses, export
stoppages, and ultimately the culling of tens of millions of animals.
Months after Brazil’s longest trucker strike (and one of the country’s most effective strikes in history),
transportation and logistical challenges still persist for exporters, as shipments of Brazilian commodities
are still delayed, supply chains continue to experience bottlenecks, and debate and uncertainty about
Brazil’s transportation policies and prices continue to plague the agricultural sector.
The truckers’ rebellion was particularly painful for Brazil because the country lacks extensive rail and
waterway infrastructure to transport goods, instead relying on trucks to carry more than 90 percent of all
freight (excluding crude oil and iron ore). Additionally, Brazil’s limited road infrastructure meant that it
was easy for striking truckers to create massive bottlenecks by setting up roadblocks along major roads,
many of which are only one lane in each direction.
Unlike the United States, where many agricultural goods are transported to export terminals by railways
or river barges, Brazilian farmers are dependent on trucks to move their goods within the domestic
market and to ports for sale to the international market.
Dairy producers across Brazil were severely affected by the transportation paralysis, with news media
depicting dire scenes of the disposal of hundreds of millions of liters of milk by farmers who could not
store their perishable product. The discarded milk alone was valued at more than R$ 1 billion (US$ 260
million). During this period, dairy farmers struggled to stay supplied with feed, which caused concerns
regarding cows’ conditions for the reminder of the lactation period. Farmers reported that they had to
slowly decrease feed intake, even after the strike was over. It will take time for producers to be able to
return to pre-strike feed levels, as they need to slow increase feed levels to avoid animal health issues.
The result will be the decrease in milk productivity and quality, which means less protein and fat
content for calendar year 2018 (CY 2018).
Post revised milk production down 4 percent in CY 2018 to 25.662 MMT (million metric tons) as a
consequence of the trucker strike. Moreover, production will take a while to recover to the same level
reported in 2016. Milk prices paid to producers peaked in the third quarter of 2018. Following 12
months of low profitability, farmers and processors were forced at a particularly difficult time to absorb
the losses caused by the strike.
Another factor influencing weaker volumes is the dry weather that has negatively affected pasture
growth. Seasonally, output should be expanding in the coming months, but a lack of precipitation and
economic uncertainty could slow the growth of dairy production for the current year.
Post forecasts that milk production will have some recovery and reach 26.200 MMT in CY 2019. This
forecast takes into consideration increased productivity, which has shown an upward trend for the last 5
years, as well as a slow economy recovery and investments from the private sector. Those investments
Page 7
are being made by traditional dairy companies in processing plants located in the South and Southeast
regions.
Despite the crisis and economic problems faced by dairy farmers in 2018, they reported that they would
continue to invest and expand production over the next 3 years.
Fluid Milk Acquisition:
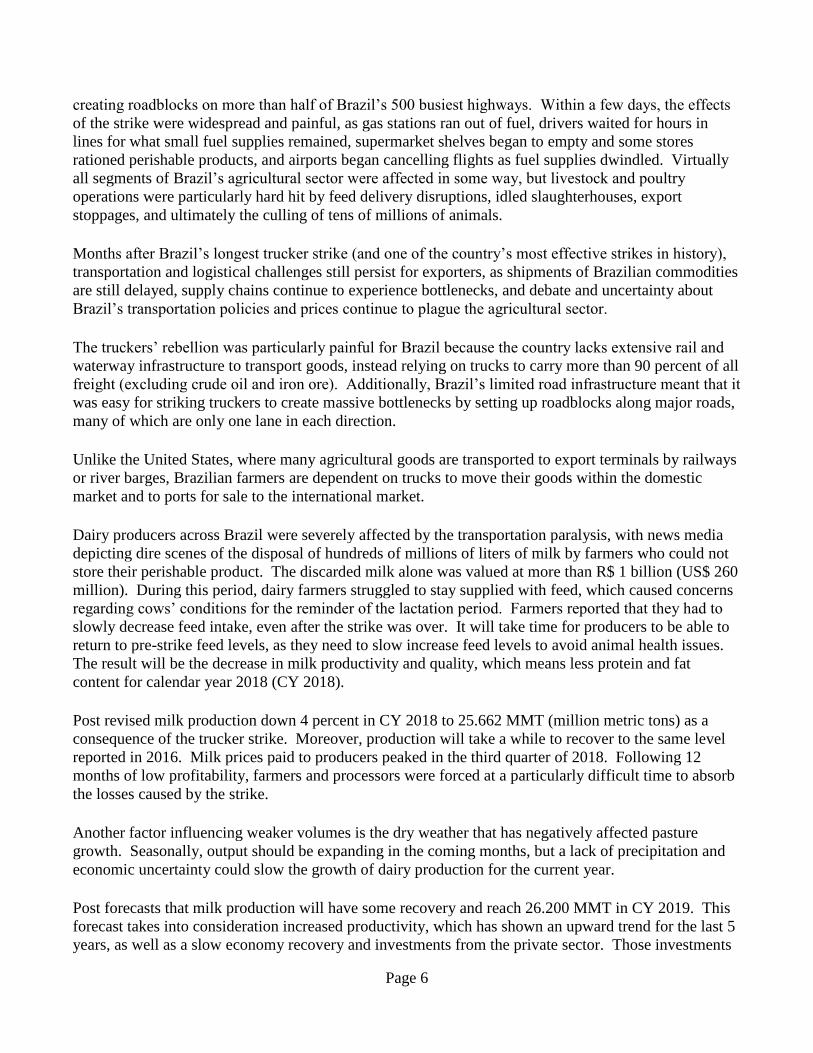
The Brazilian dairy sector has undergone consolidation in recent years. The 14 largest dairy companies
were responsible for the acquisition of 8.605 billion liters of milk in 2017, which is 35 percent of total
milk acquisition. Most of these companies are investing in new plants and new technologies such as
UHT milk without lactose, which is popular in supermarkets. In addition, some companies are
investing in organic milk to attend growing demand.
Source: Valor Economico, Dated: April 12, 2018 / Lactalis did not participate in this research.
According to Post’s trade contacts and milk producer associations, 2018 was a difficult year for farmers
and dairy companies, especially in regards to milk prices paid to producers. The milk acquisition
outlook for 2019 assumes the ending of milk procurement contracts for several dairy companies with a
modest increase in production, as producers struggle to be proactive and deliver quality, value, and
services to customers despite all the problems seen in 2018. Milk producers are working with producer
associations, which in 2019 will seek to find ways to offer resources for managing prices and contracts
between farmers and industry.
Consumption:
Page 8
Although the effects of the trucker strike decreased fluid milk consumption by 2.5 percent in CY 2018,
next year it is forecast to return to just above 2017 levels. Even though many indicators show that
Brazil’s economic situation is gradually improving, consumer purchases of fluid milk are still weak.
Dairy companies are using supplies in other dairy commodities such as sweetened condensed milk and
cheeses, mainly for export. Most market analysts project that economic growth, combined with lower
inflation and unemployment rates, will lead to an increase in income next year, which will boost
consumption of dairy products.
Trade:
Brazil imports and exports insignificant volumes of fluid milk. Typically packaged UHT milk, imports
are sold by companies from Argentina and Uruguay with commercial interests in Brazil, but the volume
is extremely small. Brazilian food processors import milk powder due to its shelf life, quality, and
versatility.
In the past 5 years, Brazil has exported a total volume of around 8,000 MT of milk cream (Harmonized
Tariff System: 0401.50), mainly to the Philippines and United Arab Emirates. This volume is
insignificant when compared to total Brazilian milk production.
Prices:
Average fluid milk prices in CY 2018 have increased almost 50 percent compared to last year. There
are several reasons for the increase, including the trucker strike that interfered severally with animal
feed rations and affected productivity as a result. Prices were also affected by the weakening Brazilian
real against the U.S. dollar, pressure from rising international prices, an increase of feed meal prices,
and dry pastures due to the lack of rain. Compared to last year, production costs are high and farmers
are facing particularly high costs for grains, which have increased further after the devaluation of the
Brazilian real in recent weeks.
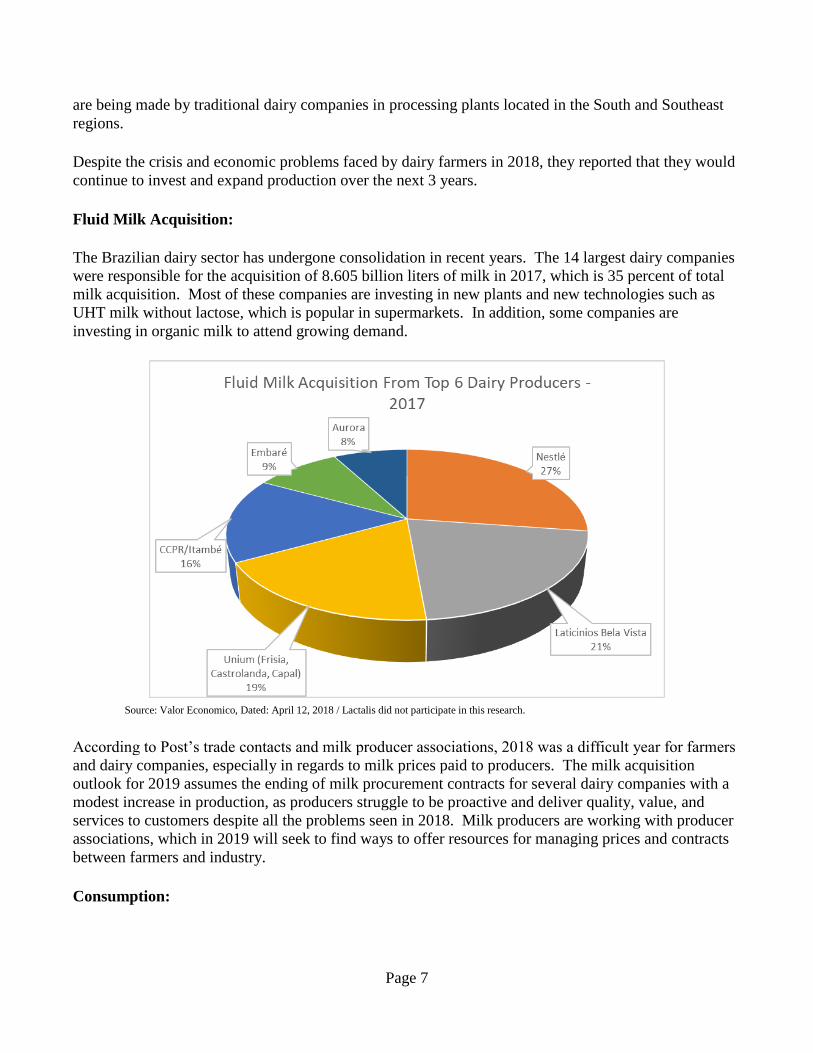
Historically, milk prices paid to producers follow a specific seasonality, related to rainfall and,
consequently, the availability of pastures. August is typically the month with the highest milk prices,
with prices falling in September in response to rising production levels.
Page 9
Source: CEPEA/ESALQ - USP
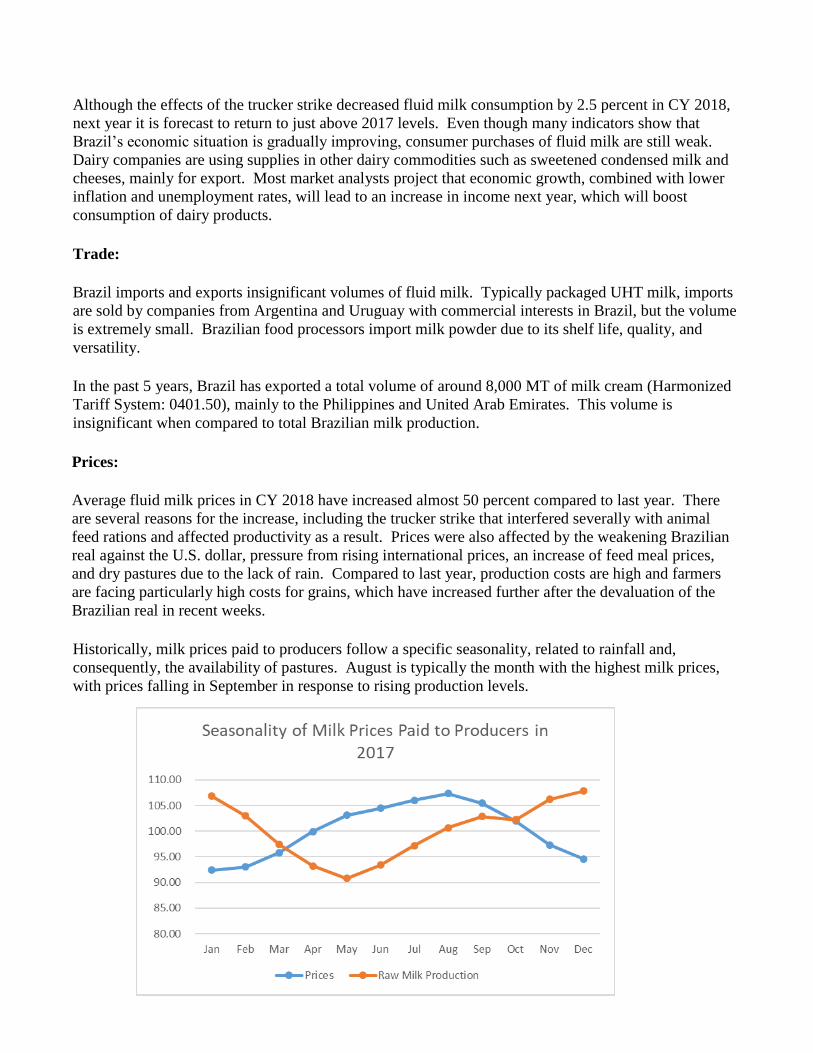
This year milk prices paid to farmers in September were 36 percent higher than 2017, while the market
is not experiencing any increase in terms of production. However, a decrease in the value of the real has
meant that prices in U.S dollars terms have risen by just 1.6 percent.
Source: CEPEA/ESALQ - USP
High fluid milk prices are pushing up retail prices for UHT milk, with prices in July up 1.5 percent
compared to the prior month.
Stocks:
Current milk and dairy product stocks held by major dairy companies are considered operating stocks to
meet short-term demand. There are no government-held stocks of milk or milk products in Brazil.
Policy:
The Ministry of Agriculture, Livestock, and Food Supply (MAPA), announced on October 10, 2017, the
suspension of import licenses for Uruguayan milk and other dairy products from Uruguay due to
concerns over potential transshipment of product in order to take advantage of duty-free trade among
MERCOSUL countries. Brazil requested that Uruguay provide traceability of their product to show that
100 percent of milk is produced in Uruguay. A technical mission was sent to Uruguay to discuss this
issue, and the temporary suspension was lifted in the beginning of 2018. Brazil is currently importing
2018
Page 10
milk powder from Uruguay. As reported previously, Brazil does not import or export fluid milk in any
significant quantities.
The Brazilian government did not publish any other normative regarding the dairy sector in CY 2018.
In May 2018, the dairy sector kicked off the creation of a Brazilian milk export policy. The first
versions were drafted by the Dairy Industry and Milk Products Union (SINDILAT), the National
Confederation of Agriculture (CNA), the National Bank for Social and Economic Development
(BNDES), the National Export Agency (APEX) the Brazilian Organization of Cooperatives (OCB), the
Brazilian Dairy Association (VIVA LACTEOS), and other unions.
The purpose of a unified export policy is to spur work on a regulatory agenda, market intelligence, trade
promotion, production finance, industrialization and export training, and research and development.
The policy will reportedly focus first on sanitary certification of production and productivity advances
to increase the competiveness of exports. The first meeting of the stakeholders was held in May of
2018.
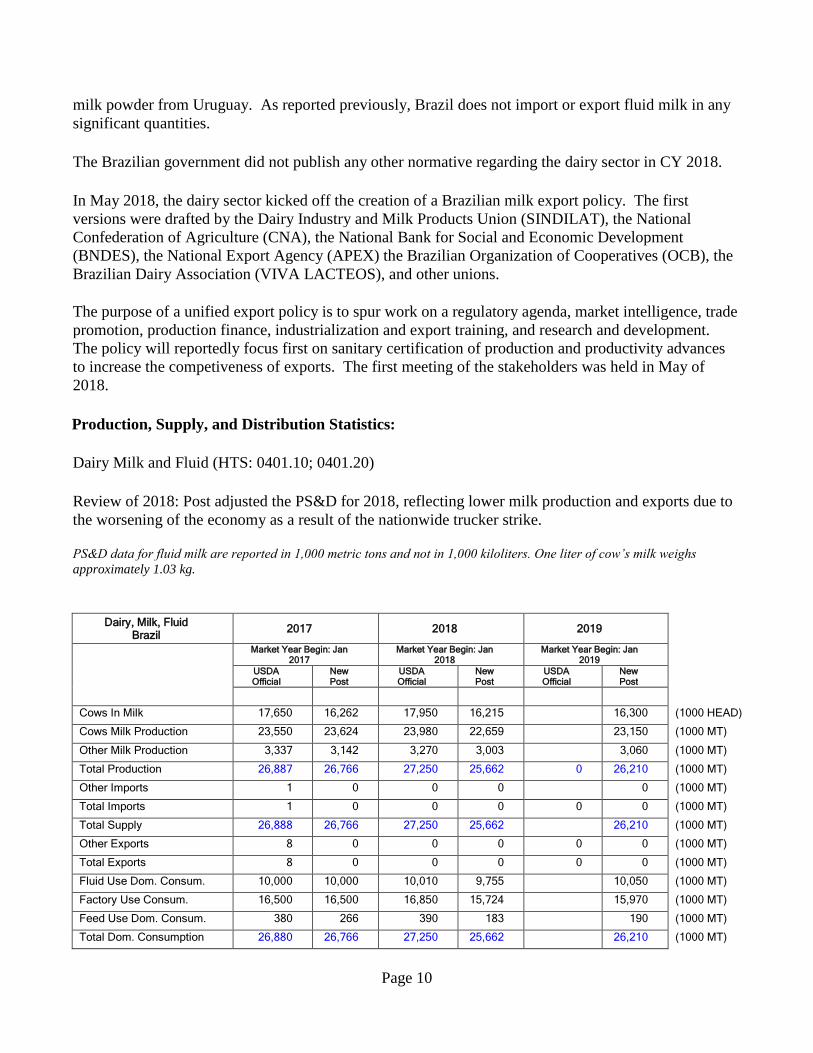
Production, Supply, and Distribution Statistics:
Dairy Milk and Fluid (HTS: 0401.10; 0401.20)
Review of 2018: Post adjusted the PS&D for 2018, reflecting lower milk production and exports due to
the worsening of the economy as a result of the nationwide trucker strike.
PS&D data for fluid milk are reported in 1,000 metric tons and not in 1,000 kiloliters. One liter of cow’s milk weighs
approximately 1.03 kg.
Dairy, Milk, Fluid
Brazil 2017 2018 2019
Market Year Begin: Jan 2017
Market Year Begin: Jan 2018
Market Year Begin: Jan 2019
USDA Official
New Post
USDA Official
New Post
USDA Official
New Post
Cows In Milk 17,650 16,262 17,950 16,215 16,300 (1000 HEAD)
Cows Milk Production 23,550 23,624 23,980 22,659 23,150 (1000 MT)
Other Milk Production 3,337 3,142 3,270 3,003 3,060 (1000 MT)
Total Production 26,887 26,766 27,250 25,662 0 26,210 (1000 MT)
Other Imports 1 0 0 0 0 (1000 MT)
Total Imports 1 0 0 0 0 0 (1000 MT)
Total Supply 26,888 26,766 27,250 25,662 26,210 (1000 MT)
Other Exports 8 0 0 0 0 0 (1000 MT)
Total Exports 8 0 0 0 0 0 (1000 MT)
Fluid Use Dom. Consum. 10,000 10,000 10,010 9,755 10,050 (1000 MT)
Factory Use Consum. 16,500 16,500 16,850 15,724 15,970 (1000 MT)
Feed Use Dom. Consum. 380 266 390 183 190 (1000 MT)
Total Dom. Consumption 26,880 26,766 27,250 25,662 26,210 (1000 MT)
Page 11
Total Distribution 26,888 26,766 27,250 25,662 26,210 (1000 MT)
Commodities:
Dairy, Cheese
Production:
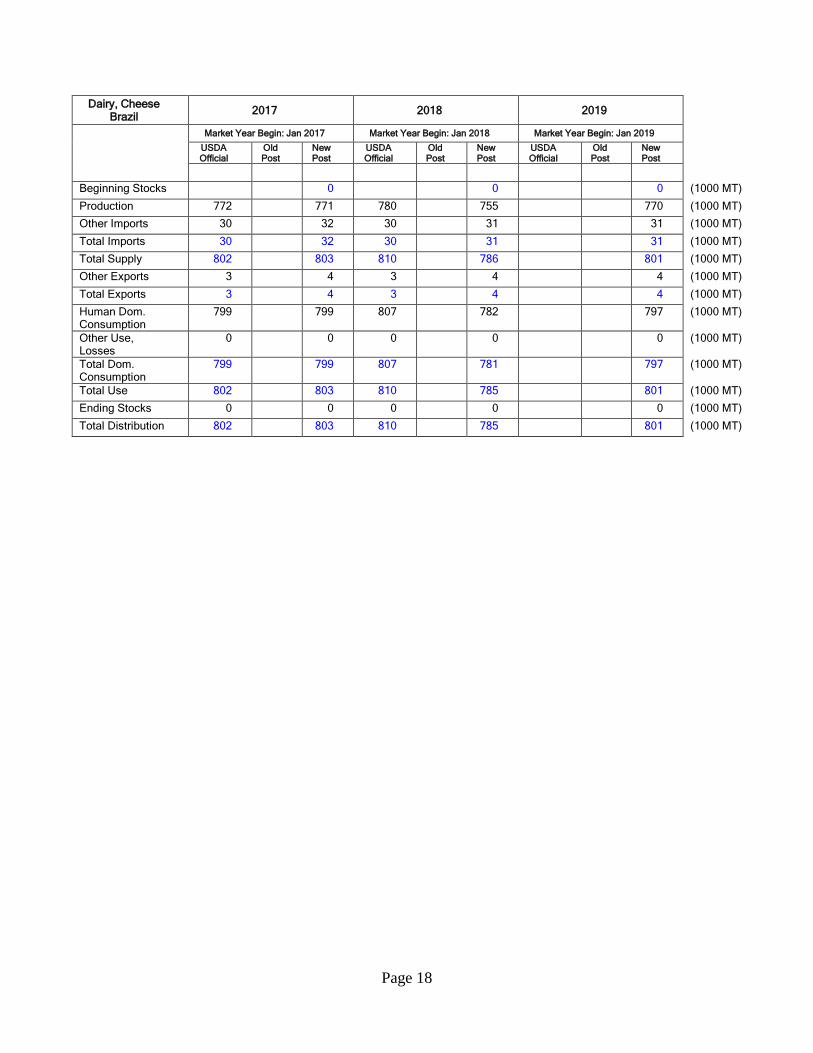
Note: There are no official statistics on production and consumption of cheese in Brazil. FAS/Brasilia production estimates
for cheese are based on trade sources and include “informal” cheese production.
The cheese sector suffered from the effects of the trucker strike, though less than the fluid milk sector.
Cheese production decreased 3 percent in CY 2018 to 755,000 MT (metric tons). Post forecasts cheese
production in CY 2019 to increase by approximately 2 percent to 770,000 MT. Cheese manufacturers
have a goal to rebound production to the high seen in 2016. They hope to see more export demand from
nontraditional markets such as Russia and Taiwan.
Manufacturers also expect higher domestic demand for cheese, principally from the fast food industry.
Production growth in 2018 was relatively small compared to the previous year. Growth potential was
hampered by high inflation that caused a rise in the cost of production and commercialization of cheese.
This lead to more growth of high-valued product categories rather than overall volume.
Some cheese manufacturers are strengthening their business through acquisitions or joint ventures. This
is likely to stimulate small and medium-sized companies to improve their operations by investing in
machinery, broadening distribution, reducing costs and diversifying their product portfolio. Some of
these medium-sized companies are investing in new types of artisanal cheeses, such as:
“Canastra,” a hard cheese with geographical indication recognized;
“Tulha,” hard cheese with red peel and aged 12 months; and
“Giramundo,” sweet artisanal cheese with a red peel colored with beet and aged 5 months.
Consumption:
Current Brazilian cheese consumption is estimated at 3.23 kilograms per person/year, below the
recommended value by the Food and Agriculture Organization of the United Nations (FAO) of 9
kilos/person/year. Consumption of fresh cheese is expected to continue to increase in 2018, but most of
the increase in demand will continue to come from the fast food industry and institutional and domestic
consumers of other “specialty” cheeses (gruyere, camembert, brie, gouda, and cheddar). Demand from
the Brazilian fast-food industry mainly comes from a large number of pizzerias, snack shops, and
bakery stores.
Page 12
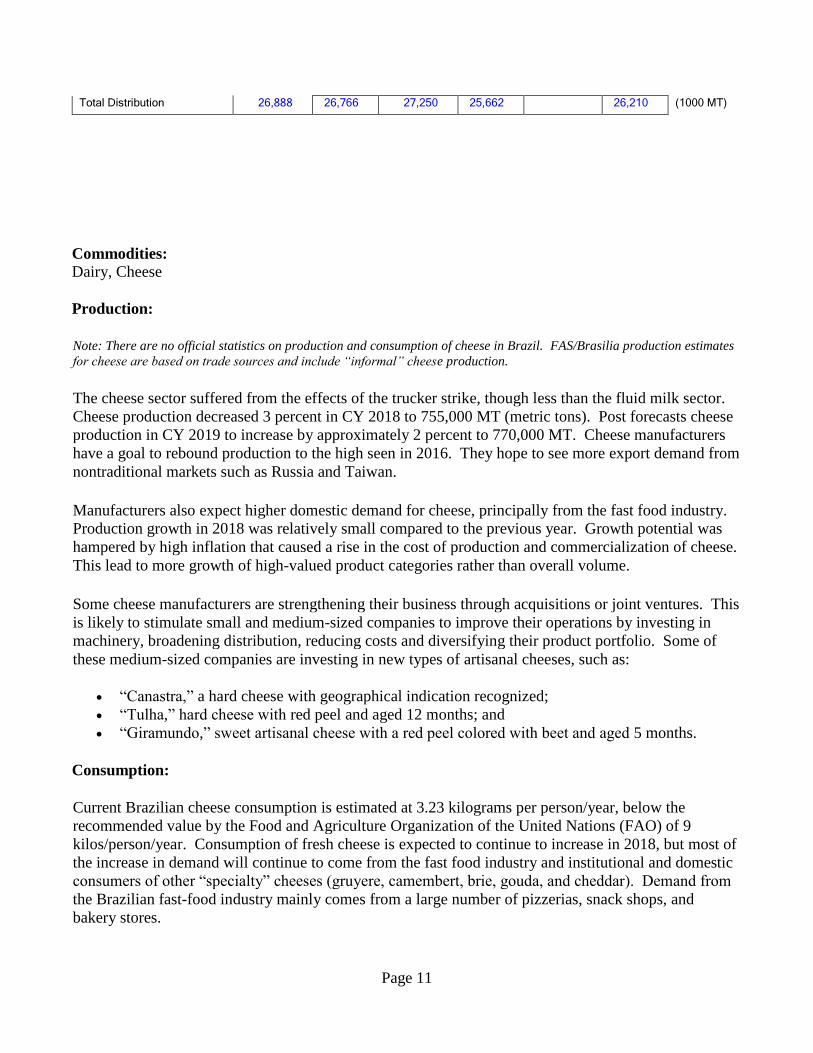
Processed cheese is preferred by Brazilians. A driver in processed cheeses demand is “requeijao,” a
type of spreadable, pasteurized processed cheese. This processed cheese has a variety of uses, including
for breakfast and dinner meals as well as snacks. Sales of “requeijao grew by 18 percent in 2017,
reaching sales of US$ 1.2 billion (R$ 4.2 billion).
“Requeijao” Photo: Wikipédia
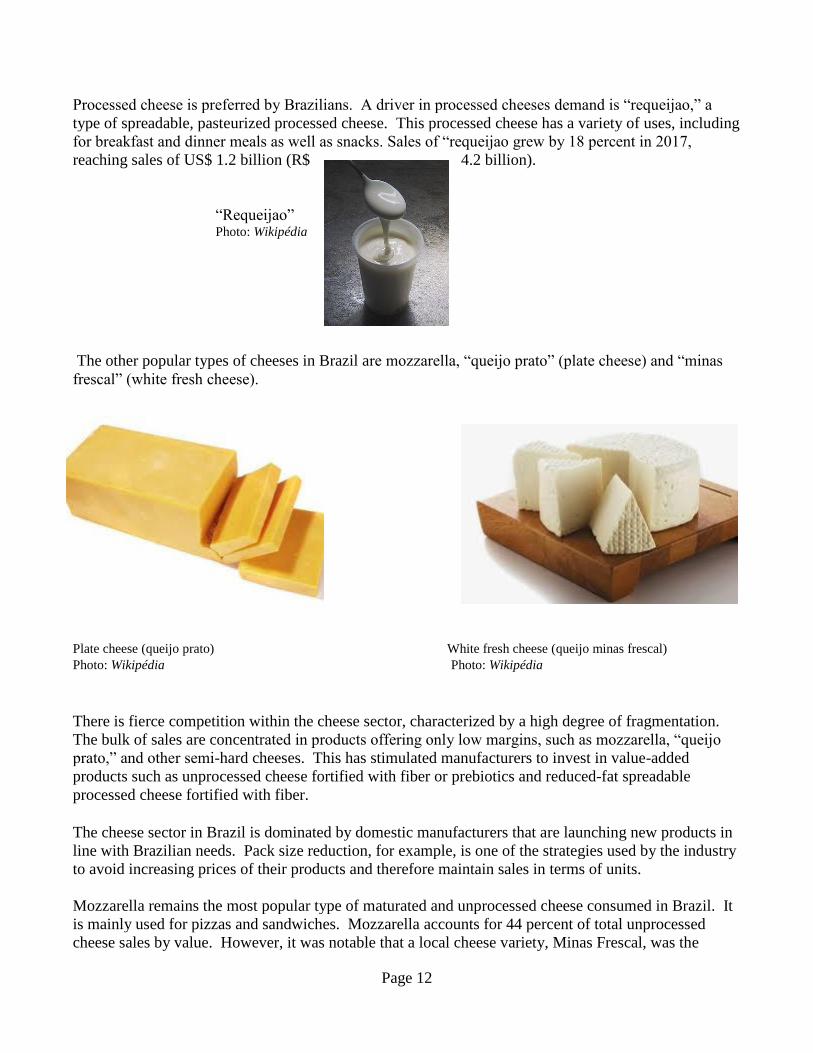
The other popular types of cheeses in Brazil are mozzarella, “queijo prato” (plate cheese) and “minas
frescal” (white fresh cheese).
Plate cheese (queijo prato) White fresh cheese (queijo minas frescal)
Photo: Wikipédia Photo: Wikipédia
There is fierce competition within the cheese sector, characterized by a high degree of fragmentation.
The bulk of sales are concentrated in products offering only low margins, such as mozzarella, “queijo
prato,” and other semi-hard cheeses. This has stimulated manufacturers to invest in value-added
products such as unprocessed cheese fortified with fiber or prebiotics and reduced-fat spreadable
processed cheese fortified with fiber.
The cheese sector in Brazil is dominated by domestic manufacturers that are launching new products in
line with Brazilian needs. Pack size reduction, for example, is one of the strategies used by the industry
to avoid increasing prices of their products and therefore maintain sales in terms of units.
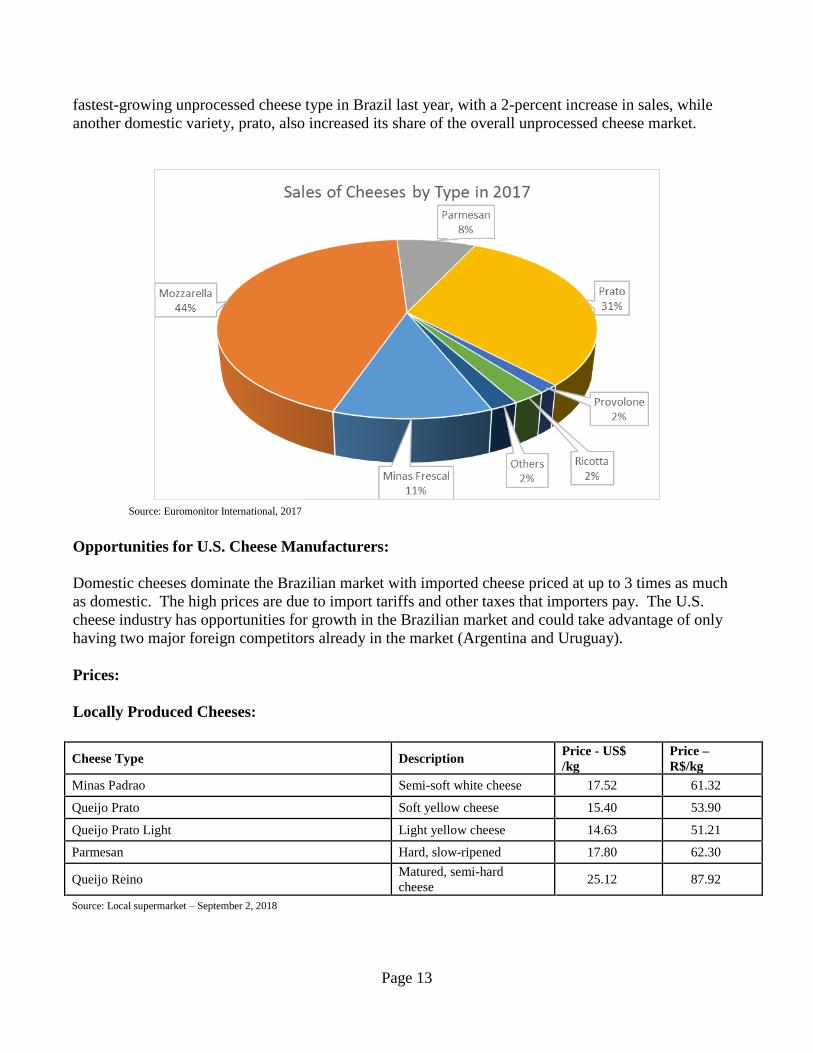
Mozzarella remains the most popular type of maturated and unprocessed cheese consumed in Brazil. It
is mainly used for pizzas and sandwiches. Mozzarella accounts for 44 percent of total unprocessed
cheese sales by value. However, it was notable that a local cheese variety, Minas Frescal, was the
Page 13
fastest-growing unprocessed cheese type in Brazil last year, with a 2-percent increase in sales, while
another domestic variety, prato, also increased its share of the overall unprocessed cheese market.
Source: Euromonitor International, 2017
Opportunities for U.S. Cheese Manufacturers:
Domestic cheeses dominate the Brazilian market with imported cheese priced at up to 3 times as much
as domestic. The high prices are due to import tariffs and other taxes that importers pay. The U.S.
cheese industry has opportunities for growth in the Brazilian market and could take advantage of only
having two major foreign competitors already in the market (Argentina and Uruguay).
Prices:
Locally Produced Cheeses:
Cheese Type Description
Price - US$
/kg
Price –
R$/kg
Minas Padrao Semi-soft white cheese 17.52 61.32
Queijo Prato Soft yellow cheese 15.40 53.90
Queijo Prato Light Light yellow cheese 14.63 51.21
Parmesan Hard, slow-ripened 17.80 62.30
Queijo Reino Matured, semi-hard
cheese 25.12 87.92
Source: Local supermarket – September 2, 2018
Page 14
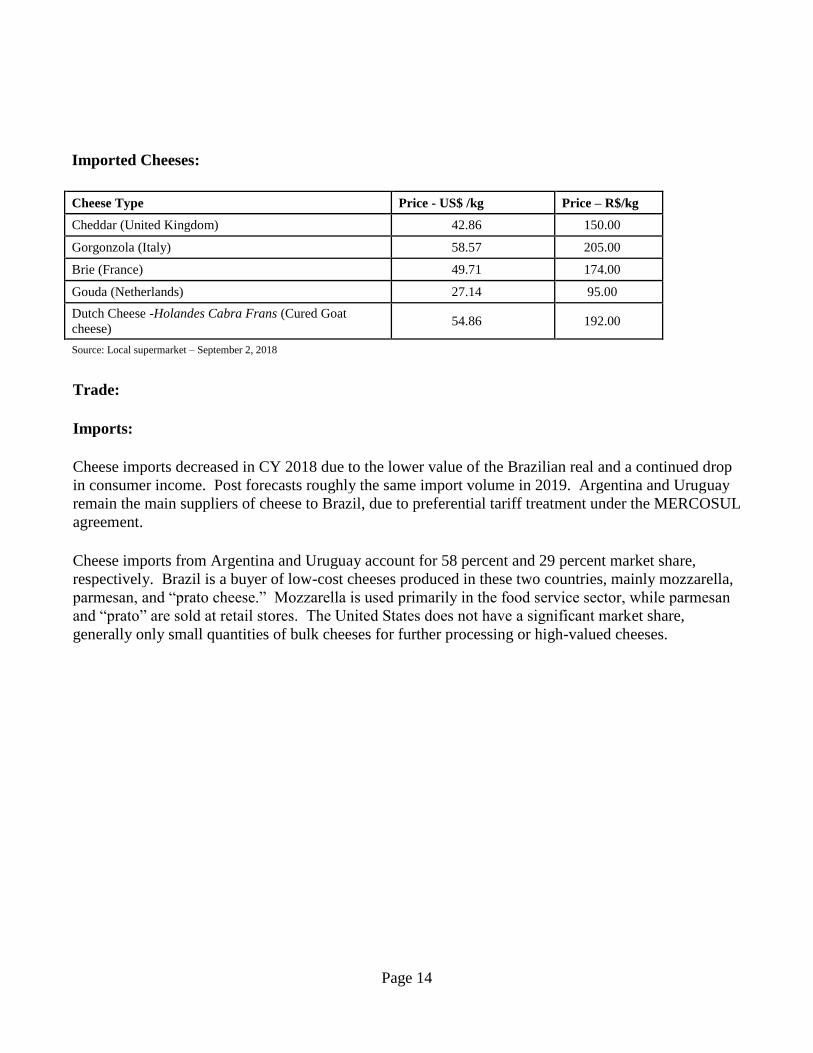
Imported Cheeses:
Cheese Type Price - US$ /kg Price – R$/kg
Cheddar (United Kingdom) 42.86 150.00
Gorgonzola (Italy) 58.57 205.00
Brie (France) 49.71 174.00
Gouda (Netherlands) 27.14 95.00
Dutch Cheese -Holandes Cabra Frans (Cured Goat
cheese) 54.86 192.00
Source: Local supermarket – September 2, 2018
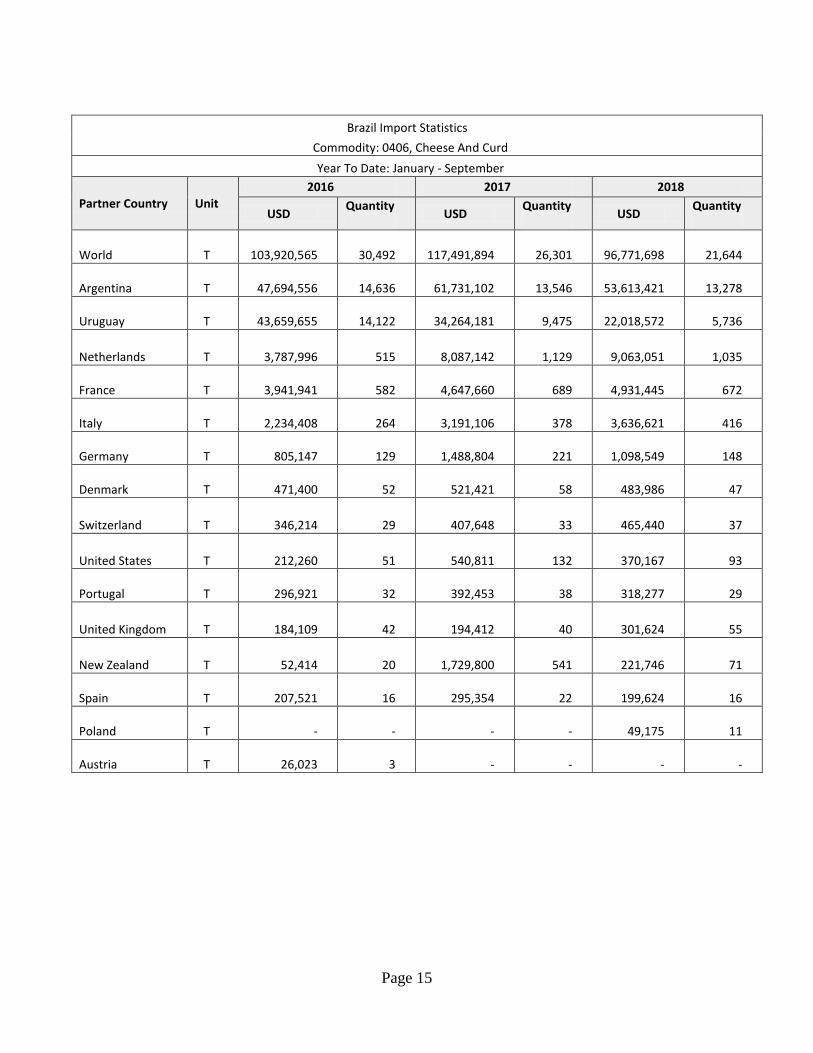
Trade:
Imports:
Cheese imports decreased in CY 2018 due to the lower value of the Brazilian real and a continued drop
in consumer income. Post forecasts roughly the same import volume in 2019. Argentina and Uruguay
remain the main suppliers of cheese to Brazil, due to preferential tariff treatment under the MERCOSUL
agreement.
Cheese imports from Argentina and Uruguay account for 58 percent and 29 percent market share,
respectively. Brazil is a buyer of low-cost cheeses produced in these two countries, mainly mozzarella,
parmesan, and “prato cheese.” Mozzarella is used primarily in the food service sector, while parmesan
and “prato” are sold at retail stores. The United States does not have a significant market share,
generally only small quantities of bulk cheeses for further processing or high-valued cheeses.
Page 15
Brazil Import Statistics
Commodity: 0406, Cheese And Curd
Year To Date: January - September
Partner Country Unit
2016 2017 2018
USD Quantity
USD
Quantity
USD Quantity
World T
103,920,565
30,492
117,491,894
26,301
96,771,698
21,644
Argentina T
47,694,556
14,636
61,731,102
13,546
53,613,421
13,278
Uruguay T
43,659,655
14,122
34,264,181
9,475
22,018,572
5,736
Netherlands T
3,787,996
515
8,087,142
1,129
9,063,051
1,035
France T
3,941,941
582
4,647,660
689
4,931,445
672
Italy T
2,234,408
264
3,191,106
378
3,636,621
416
Germany T
805,147
129
1,488,804
221
1,098,549
148
Denmark T
471,400
52
521,421
58
483,986
47
Switzerland T
346,214
29
407,648
33
465,440
37
United States T
212,260
51
540,811
132
370,167
93
Portugal T
296,921
32
392,453
38
318,277
29
United Kingdom T
184,109
42
194,412
40
301,624
55
New Zealand T
52,414
20
1,729,800
541
221,746
71
Spain T
207,521
16
295,354
22
199,624
16
Poland T
-
-
-
-
49,175
11
Austria T
26,023
3
-
-
-
-
Page 16
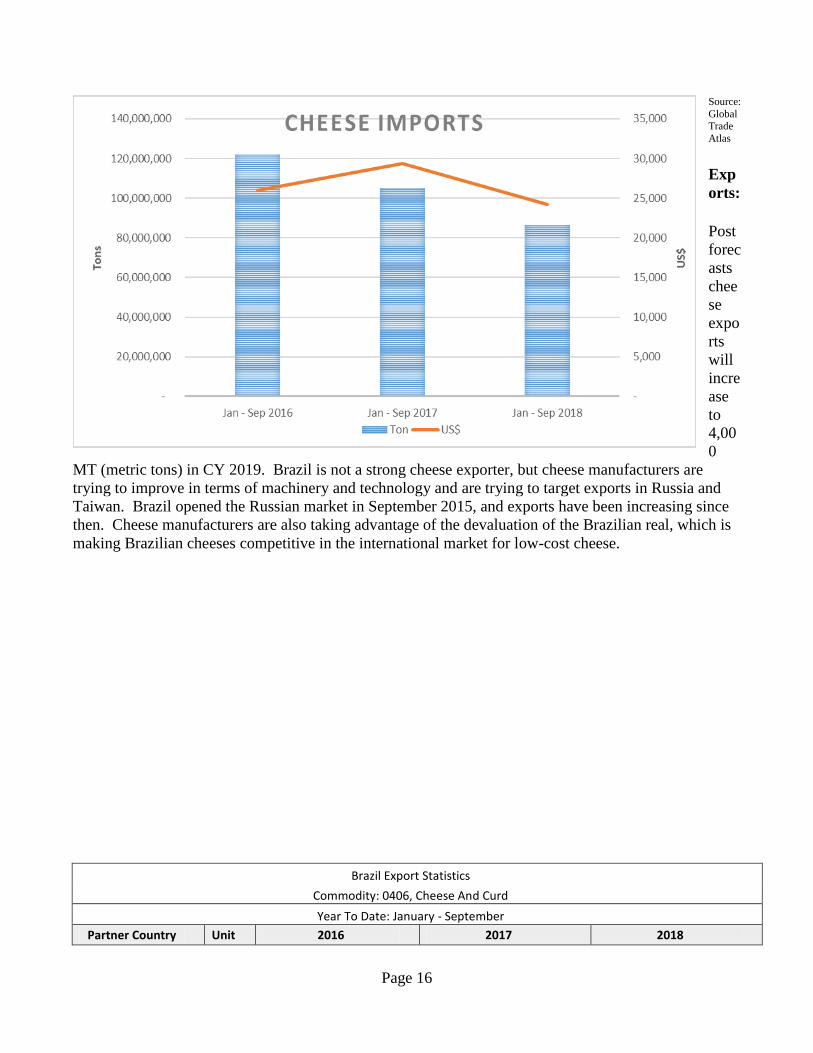
Source:
Global Trade
Atlas
Exp
orts:
Post
forec
asts
chee
se
expo
rts
will
incre
ase
to
4,00
0
MT (metric tons) in CY 2019. Brazil is not a strong cheese exporter, but cheese manufacturers are
trying to improve in terms of machinery and technology and are trying to target exports in Russia and
Taiwan. Brazil opened the Russian market in September 2015, and exports have been increasing since
then. Cheese manufacturers are also taking advantage of the devaluation of the Brazilian real, which is
making Brazilian cheeses competitive in the international market for low-cost cheese.
Brazil Export Statistics
Commodity: 0406, Cheese And Curd
Year To Date: January - September
Partner Country Unit 2016 2017 2018
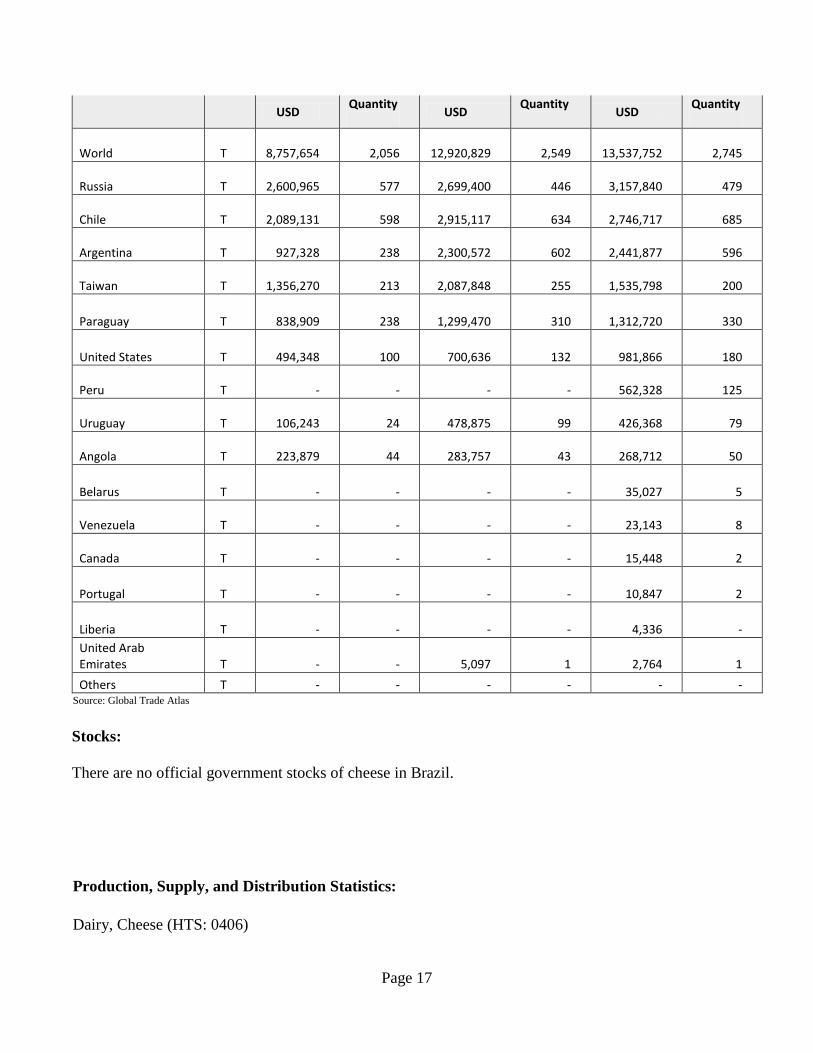
Page 17
USD Quantity
USD
Quantity
USD Quantity
World T 8,757,654
2,056 12,920,829
2,549 13,537,752
2,745
Russia T 2,600,965
577
2,699,400
446
3,157,840
479
Chile T 2,089,131
598
2,915,117
634
2,746,717
685
Argentina T
927,328
238
2,300,572
602
2,441,877
596
Taiwan T 1,356,270
213
2,087,848
255
1,535,798
200
Paraguay T
838,909
238
1,299,470
310
1,312,720
330
United States T
494,348
100
700,636
132
981,866
180
Peru T - - - -
562,328
125
Uruguay T
106,243
24
478,875
99
426,368
79
Angola T
223,879
44
283,757
43
268,712
50
Belarus T - - - - 35,027
5
Venezuela T - - - - 23,143
8
Canada T - - - - 15,448
2
Portugal T - - - - 10,847
2
Liberia T - - - -
4,336 -
United Arab Emirates T - -
5,097
1
2,764
1
Others T - - - - - - Source: Global Trade Atlas
Stocks:
There are no official government stocks of cheese in Brazil.
Production, Supply, and Distribution Statistics:
Dairy, Cheese (HTS: 0406)
Page 18
Dairy, Cheese Brazil
2017 2018 2019
Market Year Begin: Jan 2017 Market Year Begin: Jan 2018 Market Year Begin: Jan 2019
USDA Official
Old Post
New Post
USDA Official
Old Post
New Post
USDA Official
Old Post
New Post
Beginning Stocks 0 0 0 (1000 MT)
Production 772 771 780 755 770 (1000 MT)
Other Imports 30 32 30 31 31 (1000 MT)
Total Imports 30 32 30 31 31 (1000 MT)
Total Supply 802 803 810 786 801 (1000 MT)
Other Exports 3 4 3 4 4 (1000 MT)
Total Exports 3 4 3 4 4 (1000 MT)
Human Dom. Consumption
799 799 807 782 797 (1000 MT)
Other Use, Losses
0 0 0 0 0 (1000 MT)
Total Dom. Consumption
799 799 807 781 797 (1000 MT)
Total Use 802 803 810 785 801 (1000 MT)
Ending Stocks 0 0 0 0 0 (1000 MT)
Total Distribution 802 803 810 785 801 (1000 MT)
Page 19
Commodities:
Dairy, Butter
Production:
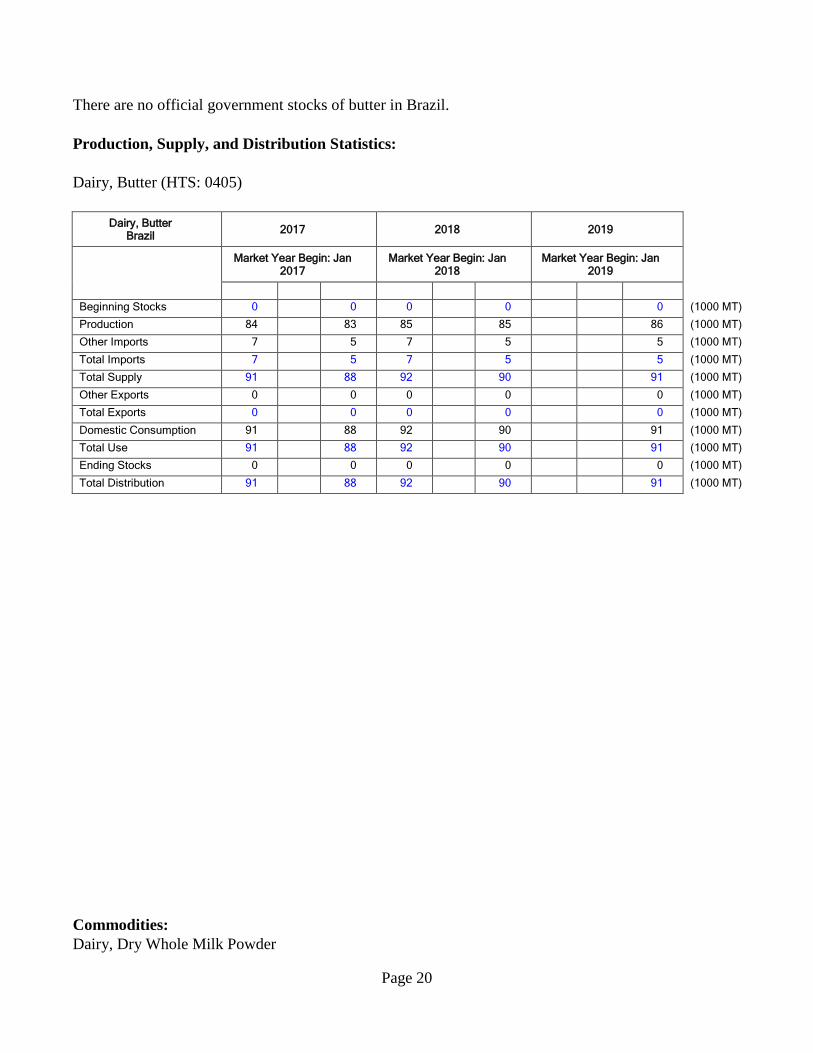
Note: There are no official statistics on production and consumption of butter in Brazil. FAS/Brasilia production estimates
for butter are based on trade sources and include “informal” butter production.
Post forecasts butter production to increase by 1 percent in CY 2019 to 86,000 MT (metric tons),
reflecting an increase in domestic demand, despite strong competition from low-priced margarine.
Production is also supported by an economic recovery and migration of consumers from vegetable fat to
dairy fat. This trend is happening due to a change in consumer’s perception of the effects of butter on
body health.
Consumption:
In CY 2017 there was a shortage of butter on supermarket shelves. The reason was higher prices and
lack of availability of fat to produce butter. Calendar year 2018 is a different scenario, although the
country faced the trucker strike, consumption of butter reached the 2016 level.
The raw material for the production of butter is milk fat. Brazilian milk generally contains around 3 to
3.5 percent fat. The production of skim milk powder generates a surplus of fat, which is used to
manufacture “requeijão,” butter, cream cheese, and sour cream. Even the production of long-life whole
milk (UHT milk) generates excess fat, since there is a standardization of the product to around 3
percent.
However, Brazil does not produce significant volumes of skim milk, as whole milk accounts for about
75 percent of milk consumed in the country. As the production of skim milk is limited, the supply of fat
to manufacture butter and other items is restricted. As mentioned previously, Brazil is a consumer of
“requeijao,” and fat is primarily destined for the production of this processed cheese spread.
Considering this scenario and with consumers searching for healthier diet alternatives, the industry is
focusing efforts to transform some of the fluid milk into fat that will go for the manufacture of butter
instead of “requeijao,” which will fuel increased in consumption in the coming years.
Trade:
Brazil typically imports around 5,000 MT of butter for industrial and retail purposes, as production in
country is limited.
Export volumes of butter are insignificant. Brazil mainly produces butter for its own consumption, so
there is no surplus butter production to export.
Stocks:
Page 20
There are no official government stocks of butter in Brazil.
Production, Supply, and Distribution Statistics:
Dairy, Butter (HTS: 0405)
Dairy, Butter Brazil
2017 2018 2019
Market Year Begin: Jan 2017
Market Year Begin: Jan 2018
Market Year Begin: Jan 2019
Beginning Stocks 0 0 0 0 0 (1000 MT)
Production 84 83 85 85 86 (1000 MT)
Other Imports 7 5 7 5 5 (1000 MT)
Total Imports 7 5 7 5 5 (1000 MT)
Total Supply 91 88 92 90 91 (1000 MT)
Other Exports 0 0 0 0 0 (1000 MT)
Total Exports 0 0 0 0 0 (1000 MT)
Domestic Consumption 91 88 92 90 91 (1000 MT)
Total Use 91 88 92 90 91 (1000 MT)
Ending Stocks 0 0 0 0 0 (1000 MT)
Total Distribution 91 88 92 90 91 (1000 MT)
Commodities:
Dairy, Dry Whole Milk Powder
Page 21
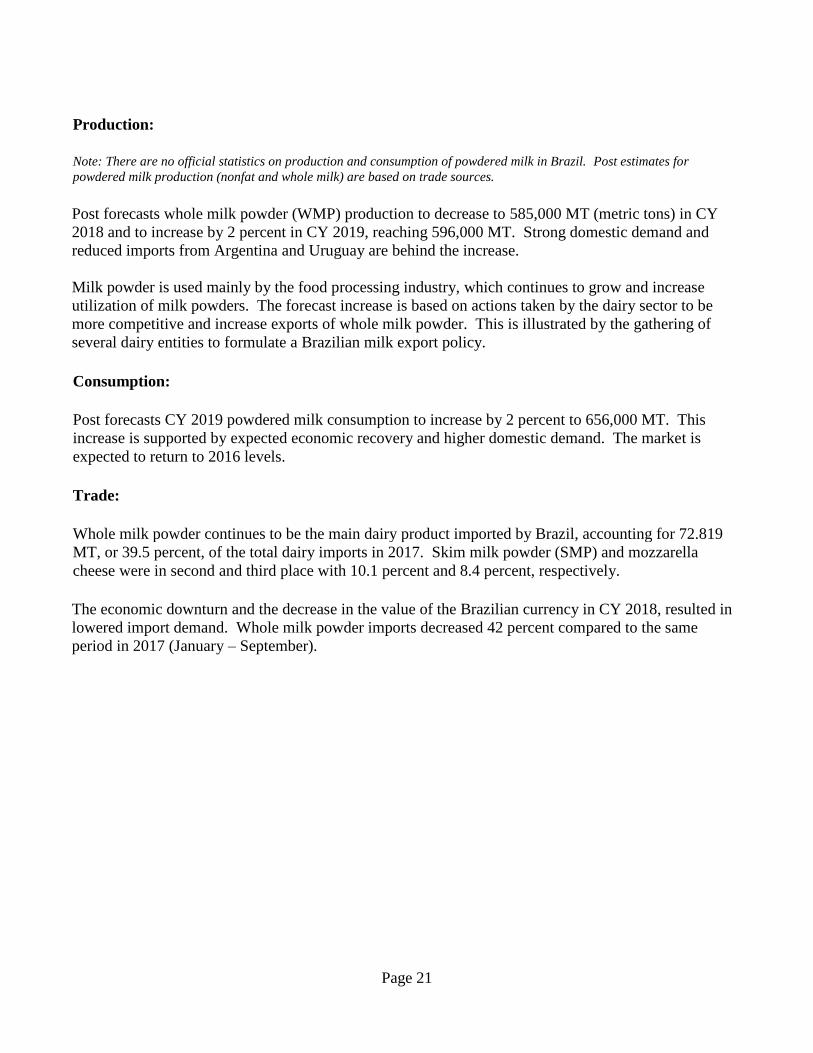
Production:
Note: There are no official statistics on production and consumption of powdered milk in Brazil. Post estimates for
powdered milk production (nonfat and whole milk) are based on trade sources.
Post forecasts whole milk powder (WMP) production to decrease to 585,000 MT (metric tons) in CY
2018 and to increase by 2 percent in CY 2019, reaching 596,000 MT. Strong domestic demand and
reduced imports from Argentina and Uruguay are behind the increase.
Milk powder is used mainly by the food processing industry, which continues to grow and increase
utilization of milk powders. The forecast increase is based on actions taken by the dairy sector to be
more competitive and increase exports of whole milk powder. This is illustrated by the gathering of
several dairy entities to formulate a Brazilian milk export policy.
Consumption:
Post forecasts CY 2019 powdered milk consumption to increase by 2 percent to 656,000 MT. This
increase is supported by expected economic recovery and higher domestic demand. The market is
expected to return to 2016 levels.
Trade:
Whole milk powder continues to be the main dairy product imported by Brazil, accounting for 72.819
MT, or 39.5 percent, of the total dairy imports in 2017. Skim milk powder (SMP) and mozzarella
cheese were in second and third place with 10.1 percent and 8.4 percent, respectively.
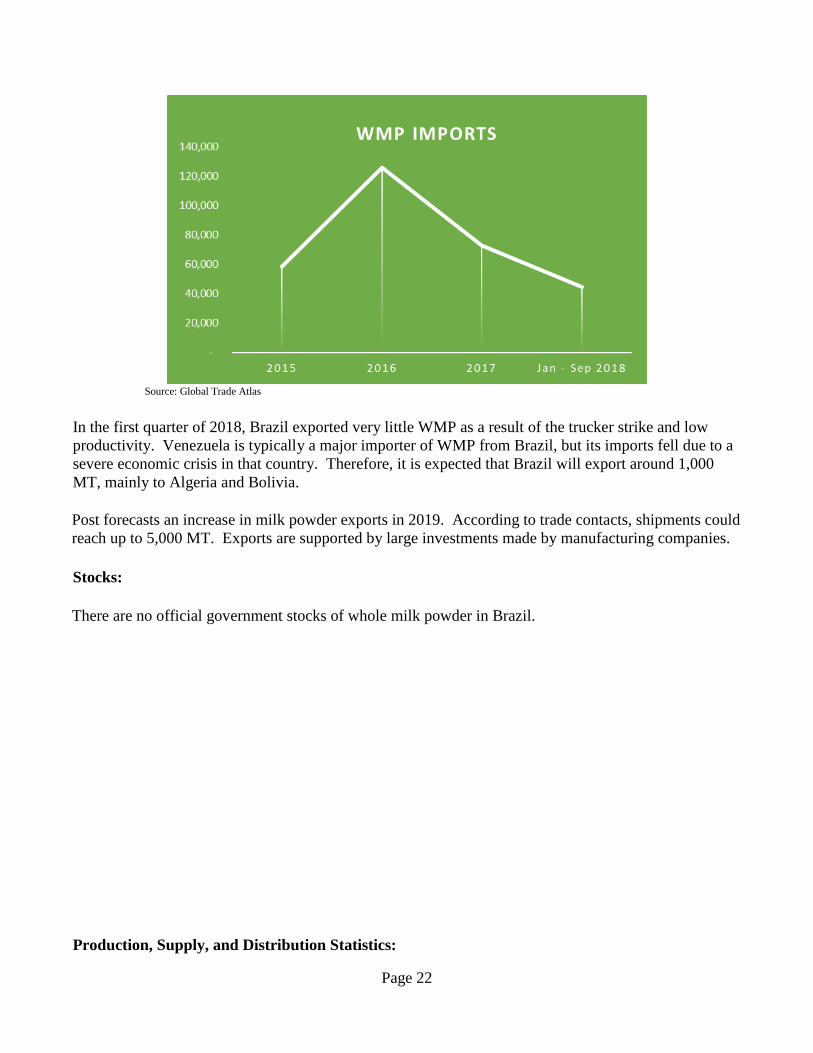
The economic downturn and the decrease in the value of the Brazilian currency in CY 2018, resulted in
lowered import demand. Whole milk powder imports decreased 42 percent compared to the same
period in 2017 (January – September).
Page 22
Source: Global Trade Atlas
In the first quarter of 2018, Brazil exported very little WMP as a result of the trucker strike and low
productivity. Venezuela is typically a major importer of WMP from Brazil, but its imports fell due to a
severe economic crisis in that country. Therefore, it is expected that Brazil will export around 1,000
MT, mainly to Algeria and Bolivia.
Post forecasts an increase in milk powder exports in 2019. According to trade contacts, shipments could
reach up to 5,000 MT. Exports are supported by large investments made by manufacturing companies.
Stocks:
There are no official government stocks of whole milk powder in Brazil.
Production, Supply, and Distribution Statistics:
Page 23
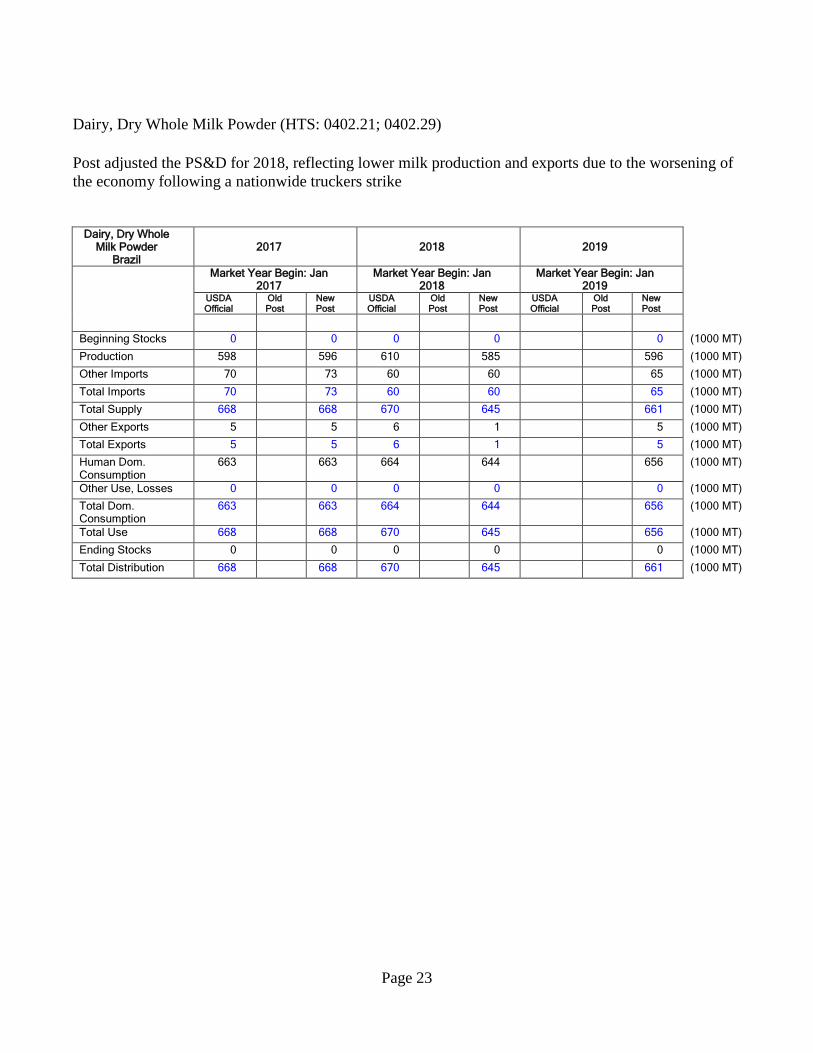
Dairy, Dry Whole Milk Powder (HTS: 0402.21; 0402.29)
Post adjusted the PS&D for 2018, reflecting lower milk production and exports due to the worsening of
the economy following a nationwide truckers strike
Dairy, Dry Whole
Milk Powder Brazil
2017 2018 2019
Market Year Begin: Jan 2017
Market Year Begin: Jan 2018
Market Year Begin: Jan 2019
USDA Official
Old Post
New Post
USDA Official
Old Post
New Post
USDA Official
Old Post
New Post
Beginning Stocks 0 0 0 0 0 (1000 MT)
Production 598 596 610 585 596 (1000 MT)
Other Imports 70 73 60 60 65 (1000 MT)
Total Imports 70 73 60 60 65 (1000 MT)
Total Supply 668 668 670 645 661 (1000 MT)
Other Exports 5 5 6 1 5 (1000 MT)
Total Exports 5 5 6 1 5 (1000 MT)
Human Dom. Consumption
663 663 664 644 656 (1000 MT)
Other Use, Losses 0 0 0 0 0 (1000 MT)
Total Dom. Consumption
663 663 664 644 656 (1000 MT)
Total Use 668 668 670 645 656 (1000 MT)
Ending Stocks 0 0 0 0 0 (1000 MT)
Total Distribution 668 668 670 645 661 (1000 MT)
Page 24
Commodities:
Dairy, Milk, Nonfat Dry
Production:
Note: There are no official statistics on production and consumption of powdered milk in Brazil. Post estimates for
powdered milk production (nonfat and whole milk) are based on trade sources.
Post revised nonfat dry milk powder (NFDM) production down to 155,000 MT (metric tons) in CY
2018, a decrease of 2 percent as a consequence of the trucker strike. Post forecasts an increase of 2
percent in CY 2019, reaching 158,000 MT.
Consumption:
Post forecasts 2018 NFDM consumption to decrease by almost 4 percent to 182,000 MT, taking into
consideration the trucker strike and the economic problems faced by the country, both of which reduced
consumers demand. Post forecasts that NFDM consumption will reach 184,000 MT in CY2019, taking
into consideration expected economic recovery.
Trade:
Nonfat dry milk powder imports largely come from Argentina and Uruguay. Depending on the type of
the product, some companies import from the United States to meet specific demand, such as special
milk for infant formulas. Brazil does not have a competitive industry or surplus NFDM supplies to
export.
Page 25
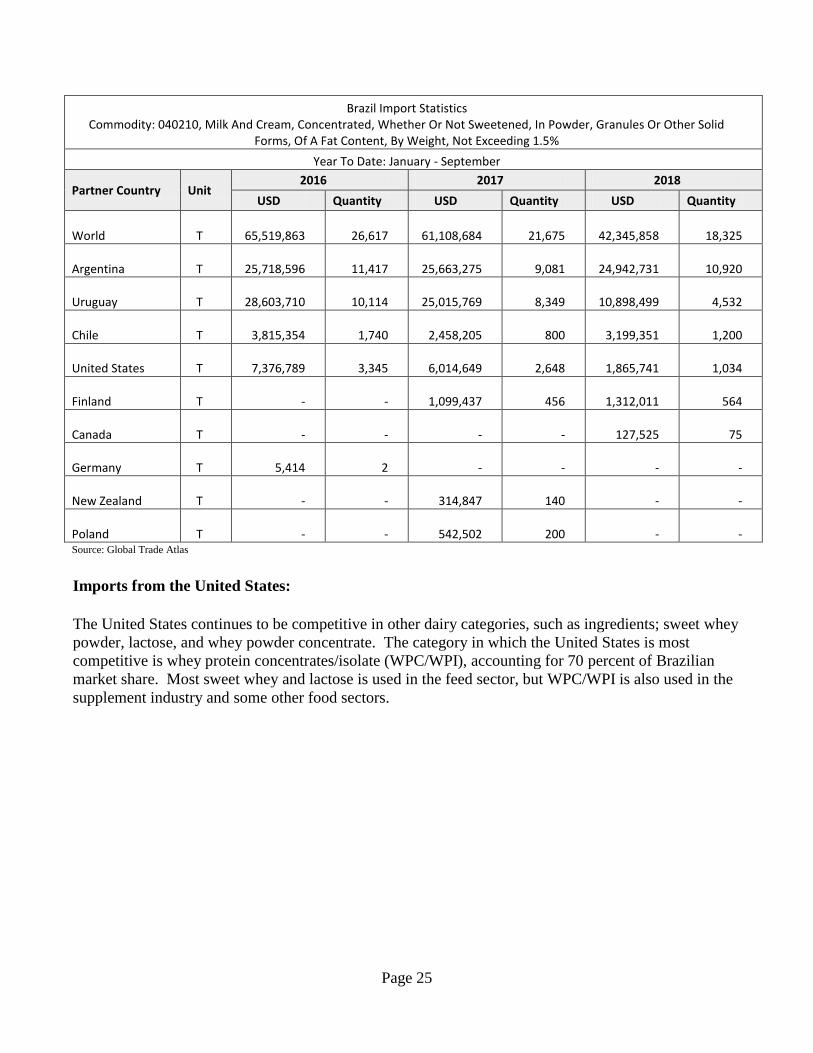
Brazil Import Statistics Commodity: 040210, Milk And Cream, Concentrated, Whether Or Not Sweetened, In Powder, Granules Or Other Solid
Forms, Of A Fat Content, By Weight, Not Exceeding 1.5%
Year To Date: January - September
Partner Country Unit 2016 2017 2018
USD Quantity USD Quantity USD Quantity
World T
65,519,863
26,617
61,108,684
21,675
42,345,858
18,325
Argentina T
25,718,596
11,417
25,663,275
9,081
24,942,731
10,920
Uruguay T
28,603,710
10,114
25,015,769
8,349
10,898,499
4,532
Chile T
3,815,354
1,740
2,458,205
800
3,199,351
1,200
United States T
7,376,789
3,345
6,014,649
2,648
1,865,741
1,034
Finland T
-
-
1,099,437
456
1,312,011
564
Canada T
-
-
-
-
127,525
75
Germany T
5,414
2
-
-
-
-
New Zealand T
-
-
314,847
140
-
-
Poland T
-
-
542,502
200
-
- Source: Global Trade Atlas
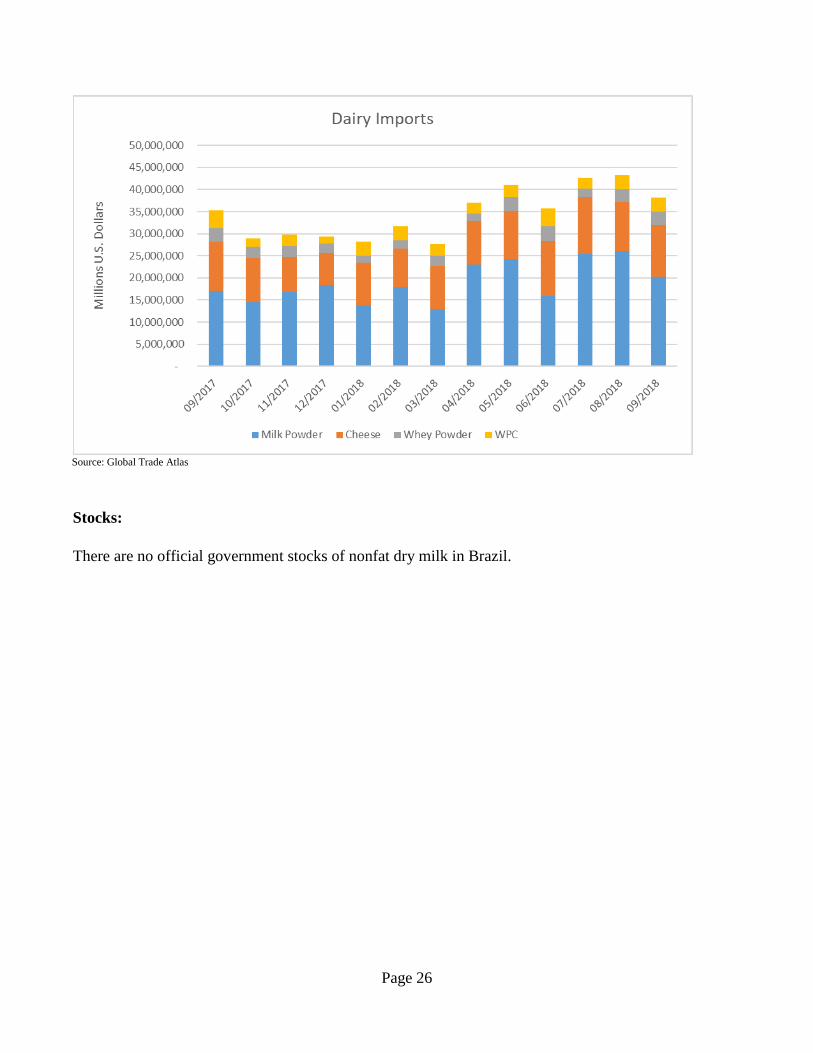
Imports from the United States:
The United States continues to be competitive in other dairy categories, such as ingredients; sweet whey
powder, lactose, and whey powder concentrate. The category in which the United States is most
competitive is whey protein concentrates/isolate (WPC/WPI), accounting for 70 percent of Brazilian
market share. Most sweet whey and lactose is used in the feed sector, but WPC/WPI is also used in the
supplement industry and some other food sectors.
Page 26
Source: Global Trade Atlas
Stocks:
There are no official government stocks of nonfat dry milk in Brazil.
Page 27
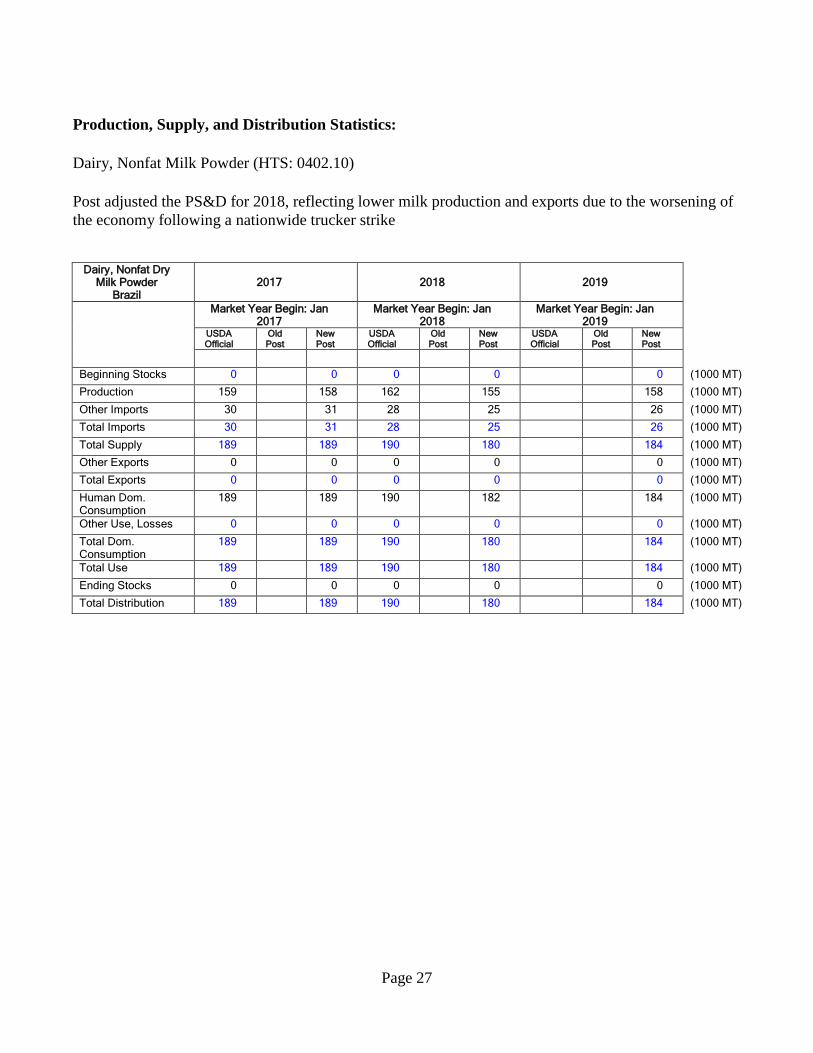
Production, Supply, and Distribution Statistics:
Dairy, Nonfat Milk Powder (HTS: 0402.10)
Post adjusted the PS&D for 2018, reflecting lower milk production and exports due to the worsening of
the economy following a nationwide trucker strike
Dairy, Nonfat Dry
Milk Powder Brazil
2017 2018 2019
Market Year Begin: Jan 2017
Market Year Begin: Jan 2018
Market Year Begin: Jan 2019
USDA Official
Old Post
New Post
USDA Official
Old Post
New Post
USDA Official
Old Post
New Post
Beginning Stocks 0 0 0 0 0 (1000 MT)
Production 159 158 162 155 158 (1000 MT)
Other Imports 30 31 28 25 26 (1000 MT)
Total Imports 30 31 28 25 26 (1000 MT)
Total Supply 189 189 190 180 184 (1000 MT)
Other Exports 0 0 0 0 0 (1000 MT)
Total Exports 0 0 0 0 0 (1000 MT)
Human Dom. Consumption
189 189 190 182 184 (1000 MT)
Other Use, Losses 0 0 0 0 0 (1000 MT)
Total Dom. Consumption
189 189 190 180 184 (1000 MT)
Total Use 189 189 190 180 184 (1000 MT)
Ending Stocks 0 0 0 0 0 (1000 MT)
Total Distribution 189 189 190 180 184 (1000 MT)