Embed Size (px)
Citation preview
THIS REPORT CONTAINS ASSESSMENTS OF COMMODITY AND TRADE ISSUES MADE BY
USDA STAFF AND NOT NECESSARILY STATEMENTS OF OFFICIAL U.S. GOVERNMENT
POLICY
Date:
GAIN Report Number:
Approved By:
Prepared By:
Report Highlights:
In 2013, $55 billion in local dairy product sales was two-percent higher than 2012. Domestic raw milk
production was 0.8 percent less however, total raw milk consumption increased by 6.6 percent, which
was satisfied by a 12.2 percent increase in imports. Drinking milk products by value grew 6% in 2013
to reach $4 billion. New government price controls edged average drinking milk prices higher in 2013.
The value of drinking milk products are expected to increase at a rate of 3% between 2013 and 2018, at
constant 2013 prices. The local raw milk price jumped13 percent to $1.1 per liter since August, 2013,
recording the highest raw milk price in the world. Cheese sales increased by 11% in current value terms
to reach $449 million in 2013. Unprocessed cheese sales increased by 15% in 2013, contributing 33% of
overall value sales of cheese in the year.
Youngsook, Oh, Ag. Marketing Specialist
Kevin Sage-EL, ATO Director
Dairy Update - ATO Seoul
Dairy and Products Annual
Korea - Republic of
KS1439
10/20/2014
Required Report - public distribution

Executive Summary: Drinking milk products achieved growth of 6% in 2013; to reach $4 billion in 2013. The average unit price of drinking milk products increased
marginally in 2013, due to the new government’s price-control initiative. The value sales of drinking milk products are expected to increase at
3% in the coming five years, at constant 2013 prices. Becoming more familiar with healthy foods and western breakfasts, local consumers are
increasing their consumption of drinking milk products. Chocolate-flavored powder drinks is set to see the highest value growth, at 6%, due to
increases in price. Seoul Dairy Cooperative is still the industry leader, with 36% of value sales, followed by Maeil Dairies with 17% of sales.
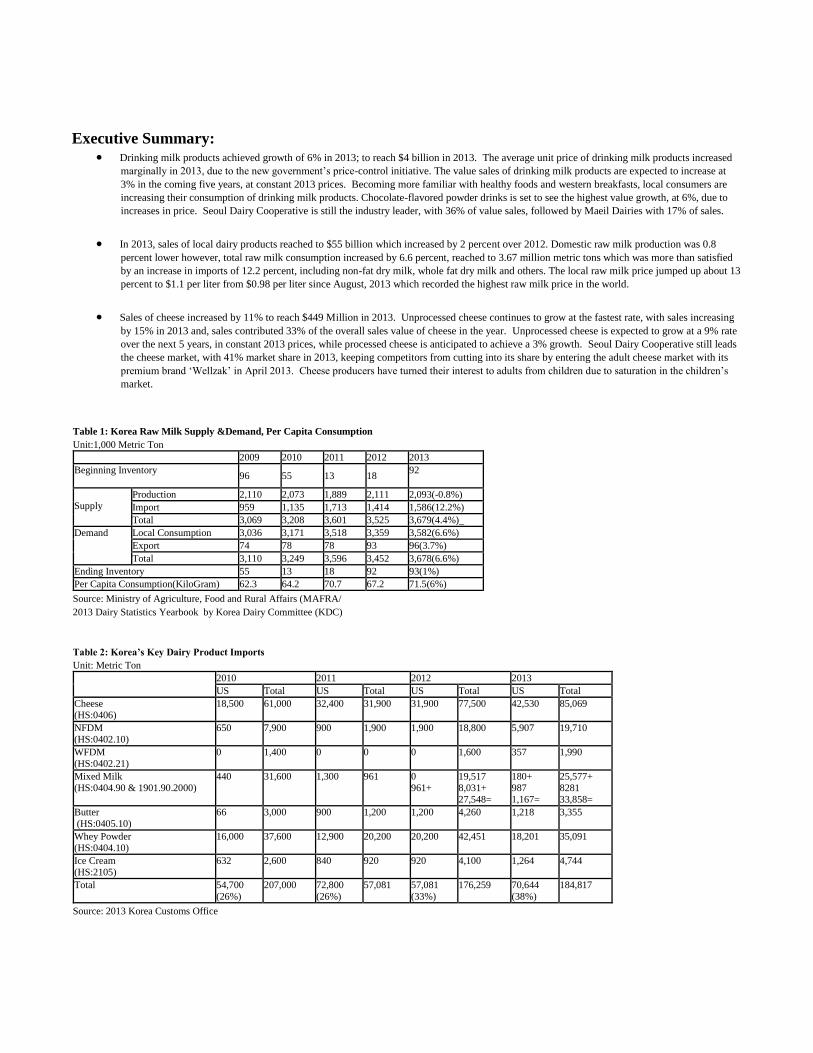
In 2013, sales of local dairy products reached to $55 billion which increased by 2 percent over 2012. Domestic raw milk production was 0.8
percent lower however, total raw milk consumption increased by 6.6 percent, reached to 3.67 million metric tons which was more than satisfied
by an increase in imports of 12.2 percent, including non-fat dry milk, whole fat dry milk and others. The local raw milk price jumped up about 13
percent to $1.1 per liter from $0.98 per liter since August, 2013 which recorded the highest raw milk price in the world.
Sales of cheese increased by 11% to reach $449 Million in 2013. Unprocessed cheese continues to grow at the fastest rate, with sales increasing
by 15% in 2013 and, sales contributed 33% of the overall sales value of cheese in the year. Unprocessed cheese is expected to grow at a 9% rate
over the next 5 years, in constant 2013 prices, while processed cheese is anticipated to achieve a 3% growth. Seoul Dairy Cooperative still leads
the cheese market, with 41% market share in 2013, keeping competitors from cutting into its share by entering the adult cheese market with its
premium brand ‘Wellzak’ in April 2013. Cheese producers have turned their interest to adults from children due to saturation in the children’s
market.
Table 1: Korea Raw Milk Supply &Demand, Per Capita Consumption
Unit:1,000 Metric Ton
2009 2010 2011 2012 2013
Beginning Inventory 96 55 13 18
92
Supply
Production 2,110 2,073 1,889 2,111 2,093(-0.8%)
Import 959 1,135 1,713 1,414 1,586(12.2%)
Total 3,069 3,208 3,601 3,525 3,679(4.4%)_
Demand Local Consumption 3,036 3,171 3,518 3,359 3,582(6.6%)
Export 74 78 78 93 96(3.7%)
Total 3,110 3,249 3,596 3,452 3,678(6.6%)
Ending Inventory 55 13 18 92 93(1%)
Per Capita Consumption(KiloGram) 62.3 64.2 70.7 67.2 71.5(6%)
Source: Ministry of Agriculture, Food and Rural Affairs (MAFRA/
2013 Dairy Statistics Yearbook by Korea Dairy Committee (KDC)
Table 2: Korea’s Key Dairy Product Imports
Unit: Metric Ton
2010 2011 2012 2013
US Total US Total US Total US Total
Cheese
(HS:0406)
18,500 61,000 32,400 31,900 31,900 77,500 42,530 85,069
NFDM
(HS:0402.10)
650 7,900 900 1,900 1,900 18,800 5,907 19,710
WFDM
(HS:0402.21)
0 1,400 0 0 0 1,600 357 1,990
Mixed Milk
(HS:0404.90 & 1901.90.2000)
440 31,600 1,300 961 0
961+
19,517
8,031+
27,548=
180+
987
1,167=
25,577+
8281
33,858=
Butter
(HS:0405.10)
66 3,000 900 1,200 1,200 4,260 1,218 3,355
Whey Powder
(HS:0404.10)
16,000 37,600 12,900 20,200 20,200 42,451 18,201 35,091
Ice Cream
(HS:2105)
632 2,600 840 920 920 4,100 1,264 4,744
Total 54,700
(26%)
207,000 72,800
(26%)
57,081 57,081
(33%)
176,259 70,644
(38%)
184,817
Source: 2013 Korea Customs Office
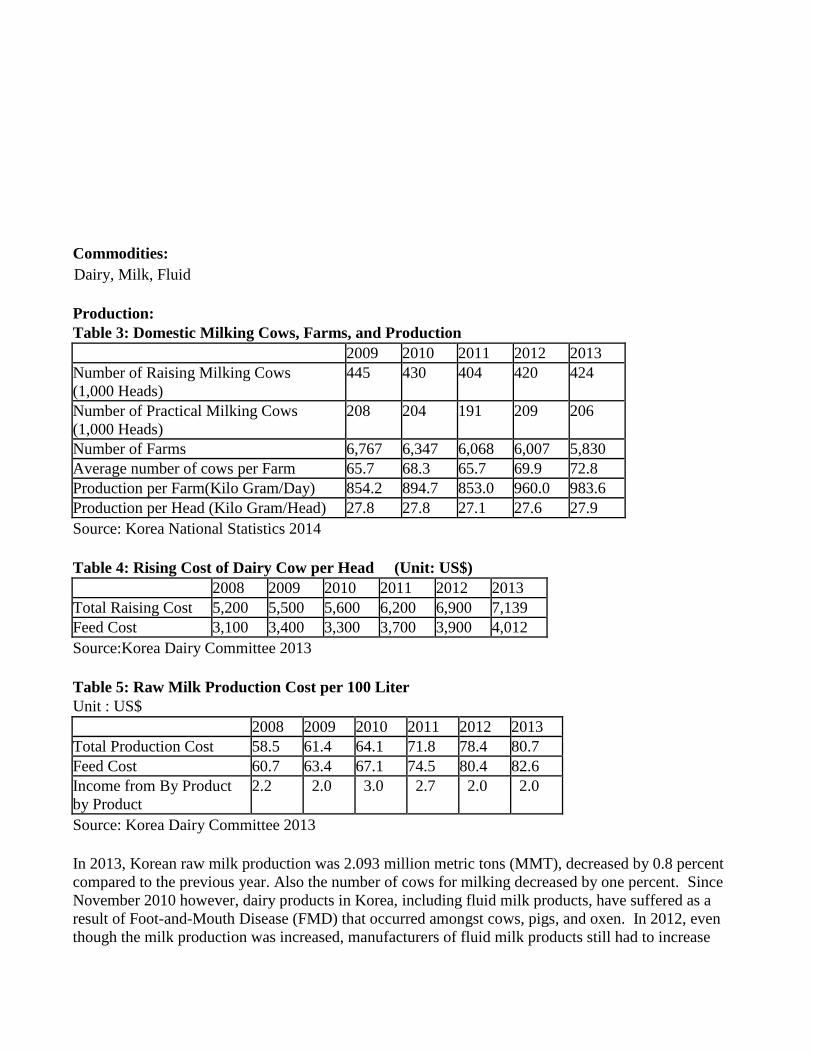
Commodities:
Production:
Table 3: Domestic Milking Cows, Farms, and Production
2009 2010 2011 2012 2013
Number of Raising Milking Cows
(1,000 Heads)
445 430 404 420 424
Number of Practical Milking Cows
(1,000 Heads)
208 204 191 209 206
Number of Farms 6,767 6,347 6,068 6,007 5,830
Average number of cows per Farm 65.7 68.3 65.7 69.9 72.8
Production per Farm(Kilo Gram/Day) 854.2 894.7 853.0 960.0 983.6
Production per Head (Kilo Gram/Head) 27.8 27.8 27.1 27.6 27.9
Source: Korea National Statistics 2014
Table 4: Rising Cost of Dairy Cow per Head (Unit: US$)
2008 2009 2010 2011 2012 2013
Total Raising Cost 5,200 5,500 5,600 6,200 6,900 7,139
Feed Cost 3,100 3,400 3,300 3,700 3,900 4,012
Source:Korea Dairy Committee 2013
Table 5: Raw Milk Production Cost per 100 Liter
Unit : US$
2008 2009 2010 2011 2012 2013
Total Production Cost 58.5 61.4 64.1 71.8 78.4 80.7
Feed Cost 60.7 63.4 67.1 74.5 80.4 82.6
Income from By Product
by Product
2.2 2.0 3.0 2.7 2.0 2.0
Source: Korea Dairy Committee 2013
In 2013, Korean raw milk production was 2.093 million metric tons (MMT), decreased by 0.8 percent
compared to the previous year. Also the number of cows for milking decreased by one percent. Since
November 2010 however, dairy products in Korea, including fluid milk products, have suffered as a
result of Foot-and-Mouth Disease (FMD) that occurred amongst cows, pigs, and oxen. In 2012, even
though the milk production was increased, manufacturers of fluid milk products still had to increase
Dairy, Milk, Fluid
their unit prices. This occurred due to production costs increasing during a slow economy along with an
increase in labor and feed costs combined with a decrease in raw materials. In the beginning of 2013,
severe cold weather influenced to decrease the production but recovered soon by government’s price
control initiative. As a result, value sales of fluid milk products increased by 5 percent in 2013. As
manufacturers are increasing their unit prices again, sales values have risen again in 2013. Fluid milk
consumption was 76 percent of total raw milk production while the remaining 24 percent was marketed
for processing.
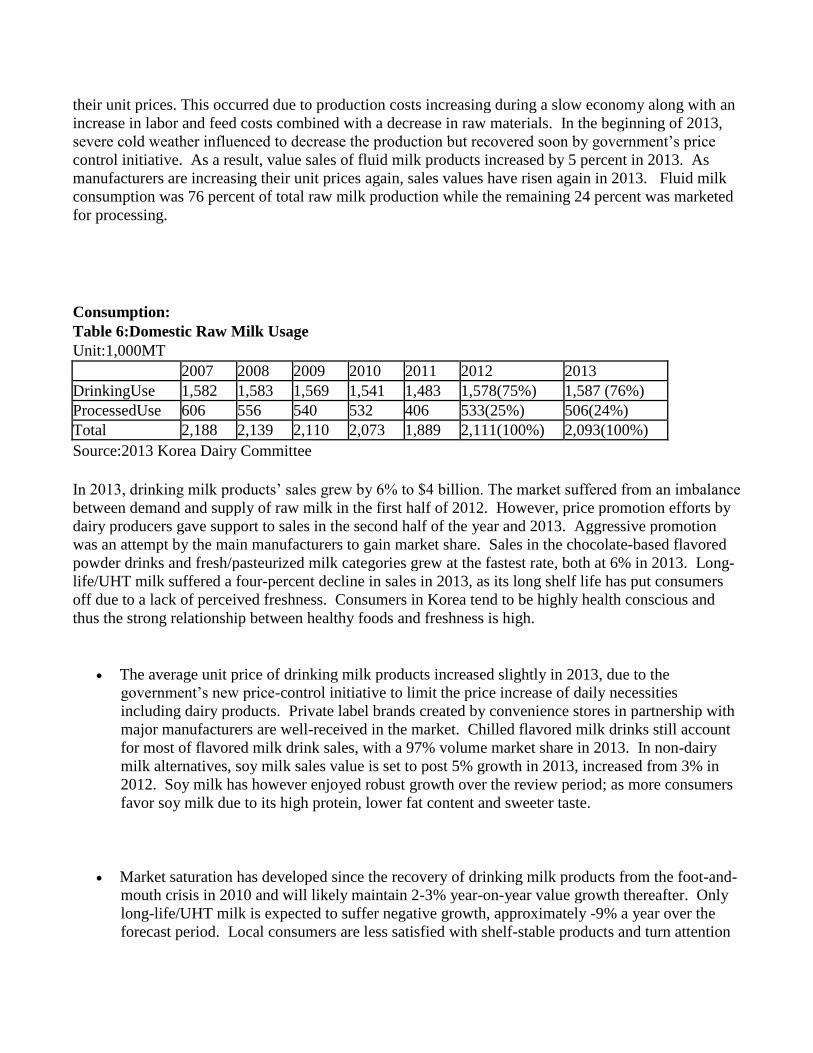
Consumption:
Table 6:Domestic Raw Milk Usage
Unit:1,000MT
2007 2008 2009 2010 2011 2012 2013
DrinkingUse 1,582 1,583 1,569 1,541 1,483 1,578(75%) 1,587 (76%)
ProcessedUse 606 556 540 532 406 533(25%) 506(24%)
Total 2,188 2,139 2,110 2,073 1,889 2,111(100%) 2,093(100%)
Source:2013 Korea Dairy Committee
In 2013, drinking milk products’ sales grew by 6% to $4 billion. The market suffered from an imbalance
between demand and supply of raw milk in the first half of 2012. However, price promotion efforts by
dairy producers gave support to sales in the second half of the year and 2013. Aggressive promotion
was an attempt by the main manufacturers to gain market share. Sales in the chocolate-based flavored
powder drinks and fresh/pasteurized milk categories grew at the fastest rate, both at 6% in 2013. Long-
life/UHT milk suffered a four-percent decline in sales in 2013, as its long shelf life has put consumers
off due to a lack of perceived freshness. Consumers in Korea tend to be highly health conscious and
thus the strong relationship between healthy foods and freshness is high.
The average unit price of drinking milk products increased slightly in 2013, due to the
government’s new price-control initiative to limit the price increase of daily necessities
including dairy products. Private label brands created by convenience stores in partnership with
major manufacturers are well-received in the market. Chilled flavored milk drinks still account
for most of flavored milk drink sales, with a 97% volume market share in 2013. In non-dairy
milk alternatives, soy milk sales value is set to post 5% growth in 2013, increased from 3% in
2012. Soy milk has however enjoyed robust growth over the review period; as more consumers
favor soy milk due to its high protein, lower fat content and sweeter taste.
Market saturation has developed since the recovery of drinking milk products from the foot-and-
mouth crisis in 2010 and will likely maintain 2-3% year-on-year value growth thereafter. Only
long-life/UHT milk is expected to suffer negative growth, approximately -9% a year over the
forecast period. Local consumers are less satisfied with shelf-stable products and turn attention
toward fresh/pasteurized milk and flavored milk drinks that are more appealing to them.
Drinking milk products value sales are expected to achieve a 3% increase in the coming five
years, at constant 2013 prices.
Flavored milk drinks with fruit juice are expected to see the highest growth rate of 4% at both
constant 2013 prices and in volume terms. Growth will accelerate, driven by the varying
strategies and marketing schemes of major manufacturers. Government policy to control unit
price is expected to be eased in the coming years. Also, small pack sizes and new product
launches will boost unit prices. For instance, cow’s milk will have unit prices increase by 8%
between 2013 and 2018. Flavored milk drinks include a large range of possible flavors
depending on which fruit juices or flavors are used, therefore the opportunity for expansion is
large.
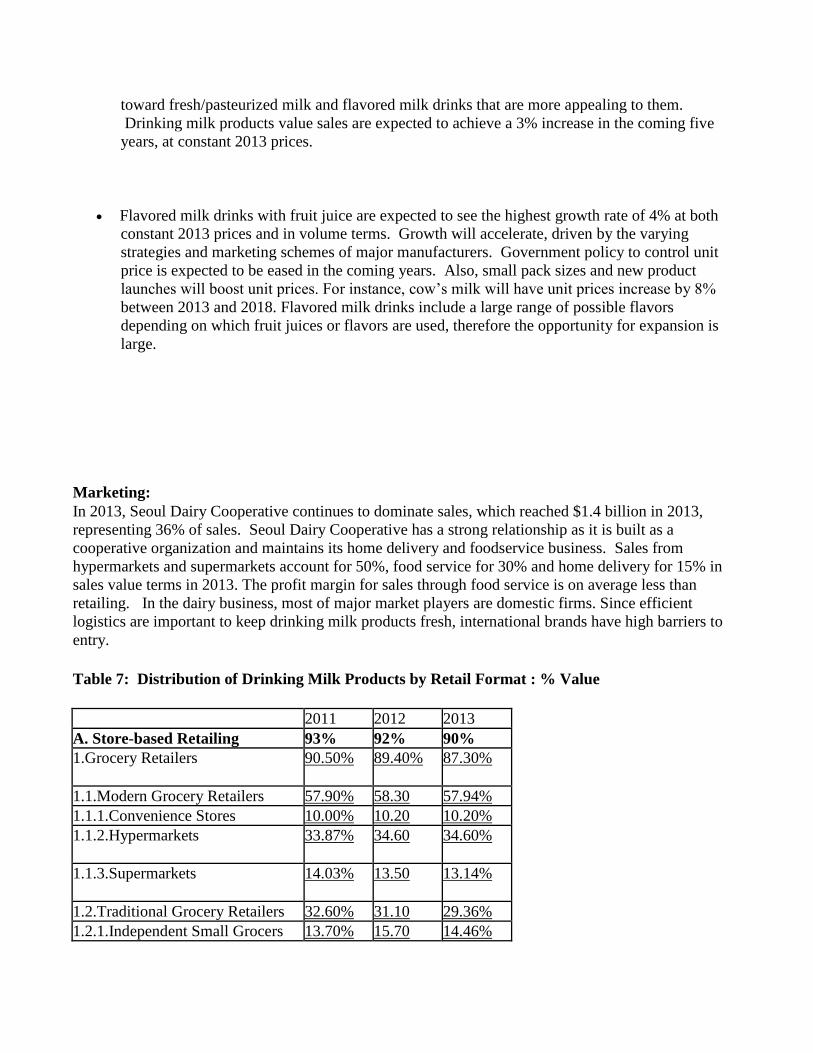
Marketing:
In 2013, Seoul Dairy Cooperative continues to dominate sales, which reached $1.4 billion in 2013,
representing 36% of sales. Seoul Dairy Cooperative has a strong relationship as it is built as a
cooperative organization and maintains its home delivery and foodservice business. Sales from
hypermarkets and supermarkets account for 50%, food service for 30% and home delivery for 15% in
sales value terms in 2013. The profit margin for sales through food service is on average less than
retailing. In the dairy business, most of major market players are domestic firms. Since efficient
logistics are important to keep drinking milk products fresh, international brands have high barriers to
entry.
Table 7: Distribution of Drinking Milk Products by Retail Format : % Value
2011 2012 2013
A. Store-based Retailing 93% 92% 90%
1.Grocery Retailers
90.50% 89.40% 87.30%
1.1.Modern Grocery Retailers 57.90% 58.30 57.94%
1.1.1.Convenience Stores 10.00% 10.20 10.20%
1.1.2.Hypermarkets
33.87% 34.60 34.60%
1.1.3.Supermarkets
14.03% 13.50 13.14%
1.2.Traditional Grocery Retailers 32.60% 31.10 29.36%
1.2.1.Independent Small Grocers 13.70% 15.70 14.46%
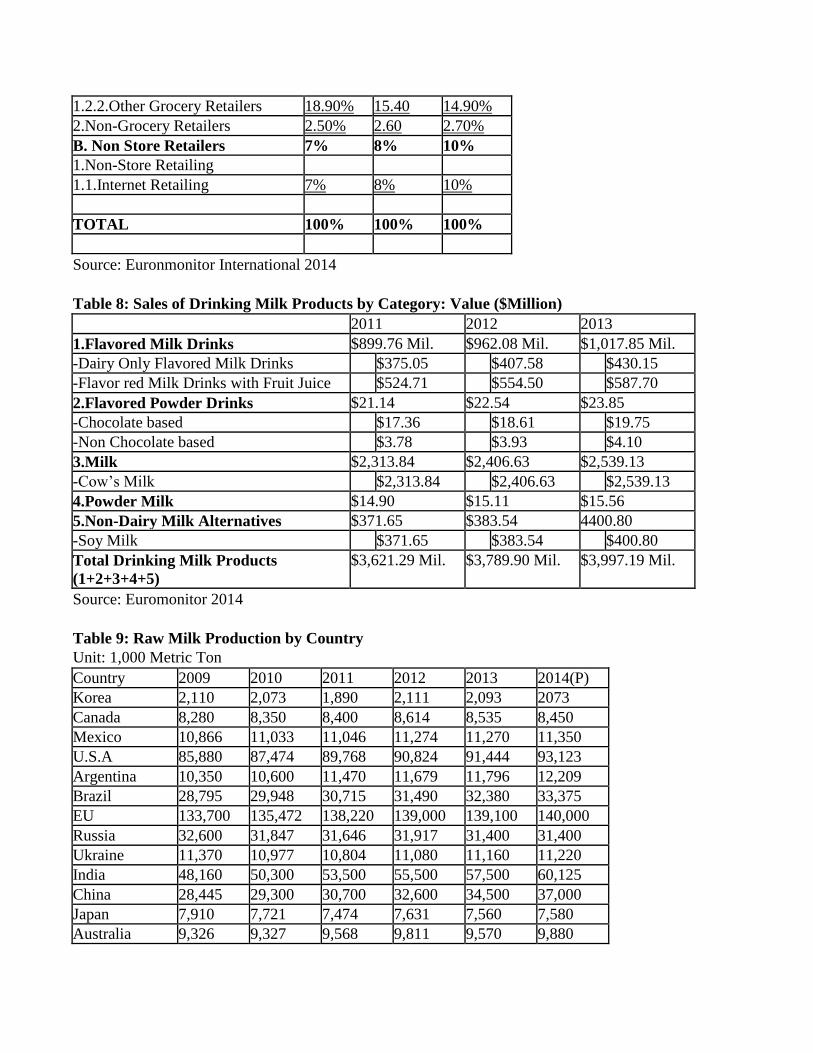
1.2.2.Other Grocery Retailers 18.90% 15.40 14.90%
2.Non-Grocery Retailers 2.50% 2.60 2.70%
B. Non Store Retailers 7% 8% 10%
1.Non-Store Retailing
1.1.Internet Retailing 7% 8% 10%
TOTAL 100% 100% 100%
Source: Euronmonitor International 2014
Table 8: Sales of Drinking Milk Products by Category: Value ($Million)
2011 2012 2013
1.Flavored Milk Drinks $899.76 Mil. $962.08 Mil. $1,017.85 Mil.
-Dairy Only Flavored Milk Drinks $375.05 $407.58 $430.15
-Flavor red Milk Drinks with Fruit Juice $524.71 $554.50 $587.70
2.Flavored Powder Drinks $21.14 $22.54 $23.85
-Chocolate based $17.36 $18.61 $19.75
-Non Chocolate based $3.78 $3.93 $4.10
3.Milk $2,313.84 $2,406.63 $2,539.13
-Cow’s Milk $2,313.84 $2,406.63 $2,539.13
4.Powder Milk $14.90 $15.11 $15.56
5.Non-Dairy Milk Alternatives $371.65 $383.54 4400.80
-Soy Milk $371.65 $383.54 $400.80
Total Drinking Milk Products
(1+2+3+4+5)
$3,621.29 Mil. $3,789.90 Mil. $3,997.19 Mil.
Source: Euromonitor 2014
Table 9: Raw Milk Production by Country
Unit: 1,000 Metric Ton
Country 2009 2010 2011 2012 2013 2014(P)
Korea 2,110 2,073 1,890 2,111 2,093 2073
Canada 8,280 8,350 8,400 8,614 8,535 8,450
Mexico 10,866 11,033 11,046 11,274 11,270 11,350
U.S.A 85,880 87,474 89,768 90,824 91,444 93,123
Argentina 10,350 10,600 11,470 11,679 11,796 12,209
Brazil 28,795 29,948 30,715 31,490 32,380 33,375
EU 133,700 135,472 138,220 139,000 139,100 140,000
Russia 32,600 31,847 31,646 31,917 31,400 31,400
Ukraine 11,370 10,977 10,804 11,080 11,160 11,220
India 48,160 50,300 53,500 55,500 57,500 60,125
China 28,445 29,300 30,700 32,600 34,500 37,000
Japan 7,910 7,721 7,474 7,631 7,560 7,580
Australia 9,326 9,327 9,568 9,811 9,570 9,880
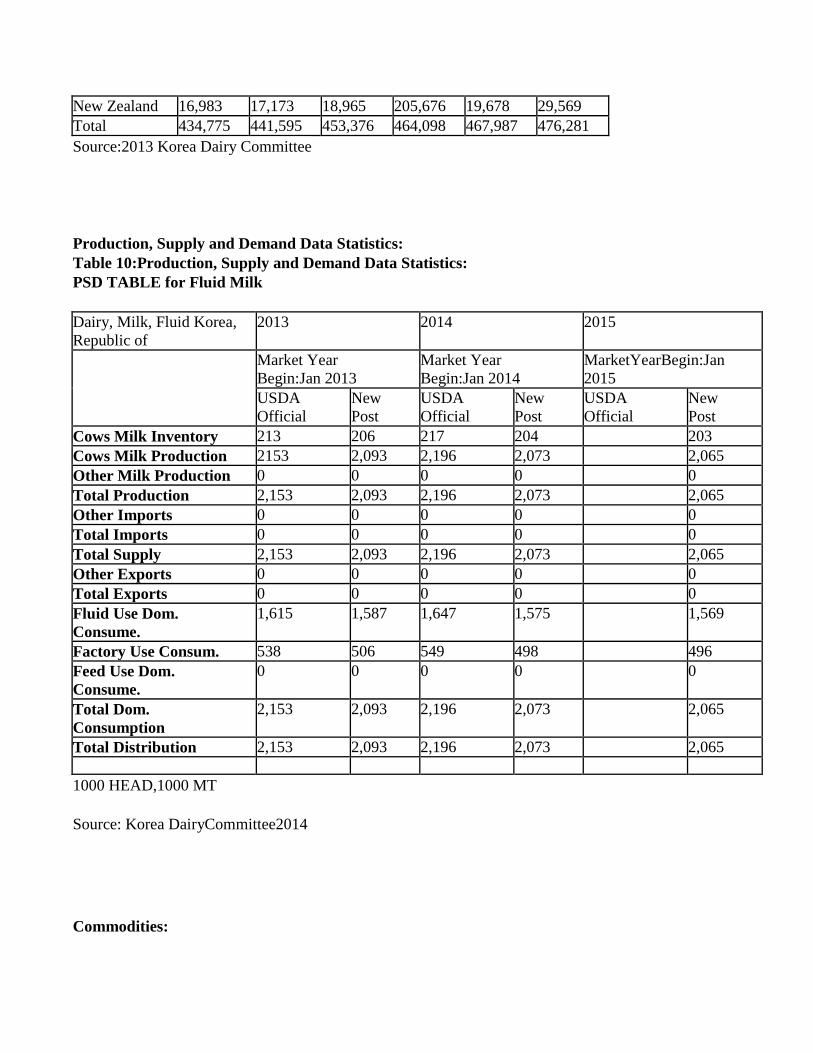
New Zealand 16,983 17,173 18,965 205,676 19,678 29,569
Total 434,775 441,595 453,376 464,098 467,987 476,281
Source:2013 Korea Dairy Committee
Production, Supply and Demand Data Statistics:
Table 10:Production, Supply and Demand Data Statistics:
PSD TABLE for Fluid Milk
Dairy, Milk, Fluid Korea,
Republic of
2013 2014 2015
Market Year
Begin:Jan 2013
Market Year
Begin:Jan 2014
MarketYearBegin:Jan
2015
USDA
Official
New
Post
USDA
Official
New
Post
USDA
Official
New
Post
Cows Milk Inventory 213 206 217 204 203
Cows Milk Production 2153 2,093 2,196 2,073 2,065
Other Milk Production 0 0 0 0 0
Total Production 2,153 2,093 2,196 2,073 2,065
Other Imports 0 0 0 0 0
Total Imports 0 0 0 0 0
Total Supply 2,153 2,093 2,196 2,073 2,065
Other Exports 0 0 0 0 0
Total Exports 0 0 0 0 0
Fluid Use Dom.
Consume.
1,615 1,587 1,647 1,575 1,569
Factory Use Consum. 538 506 549 498 496
Feed Use Dom.
Consume.
0 0 0 0 0
Total Dom.
Consumption
2,153 2,093 2,196 2,073 2,065
Total Distribution 2,153 2,093 2,196 2,073 2,065
1000 HEAD,1000 MT
Source: Korea DairyCommittee2014
Commodities:
Production:
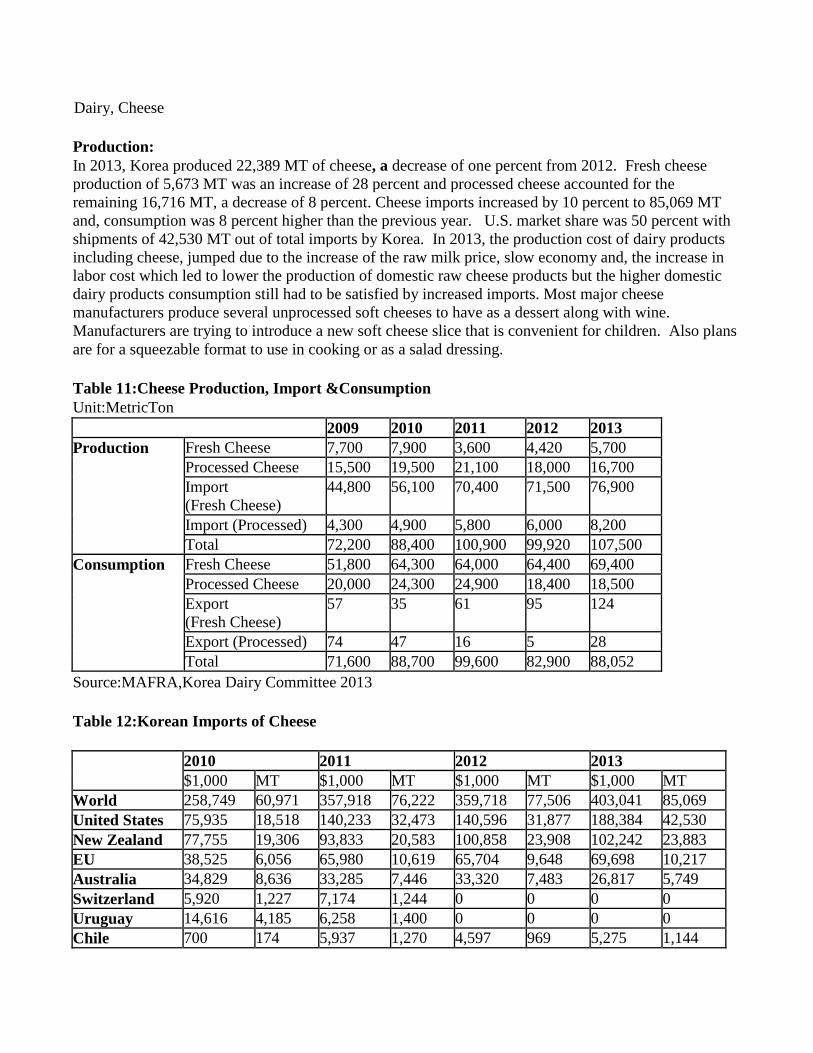
In 2013, Korea produced 22,389 MT of cheese, a decrease of one percent from 2012. Fresh cheese
production of 5,673 MT was an increase of 28 percent and processed cheese accounted for the
remaining 16,716 MT, a decrease of 8 percent. Cheese imports increased by 10 percent to 85,069 MT
and, consumption was 8 percent higher than the previous year. U.S. market share was 50 percent with
shipments of 42,530 MT out of total imports by Korea. In 2013, the production cost of dairy products
including cheese, jumped due to the increase of the raw milk price, slow economy and, the increase in
labor cost which led to lower the production of domestic raw cheese products but the higher domestic
dairy products consumption still had to be satisfied by increased imports. Most major cheese
manufacturers produce several unprocessed soft cheeses to have as a dessert along with wine.
Manufacturers are trying to introduce a new soft cheese slice that is convenient for children. Also plans
are for a squeezable format to use in cooking or as a salad dressing.
Table 11:Cheese Production, Import &Consumption
Unit:MetricTon
2009 2010 2011 2012 2013
Production Fresh Cheese 7,700 7,900 3,600 4,420 5,700
Processed Cheese 15,500 19,500 21,100 18,000 16,700
Import
(Fresh Cheese)
44,800 56,100 70,400 71,500 76,900
Import (Processed) 4,300 4,900 5,800 6,000 8,200
Total 72,200 88,400 100,900 99,920 107,500
Consumption Fresh Cheese 51,800 64,300 64,000 64,400 69,400
Processed Cheese 20,000 24,300 24,900 18,400 18,500
Export
(Fresh Cheese)
57 35 61 95 124
Export (Processed) 74 47 16 5 28
Total 71,600 88,700 99,600 82,900 88,052
Source:MAFRA,Korea Dairy Committee 2013
Table 12:Korean Imports of Cheese
2010 2011 2012 2013
$1,000 MT $1,000 MT $1,000 MT $1,000 MT
World 258,749 60,971 357,918 76,222 359,718 77,506 403,041 85,069
United States 75,935 18,518 140,233 32,473 140,596 31,877 188,384 42,530
New Zealand 77,755 19,306 93,833 20,583 100,858 23,908 102,242 23,883
EU 38,525 6,056 65,980 10,619 65,704 9,648 69,698 10,217
Australia 34,829 8,636 33,285 7,446 33,320 7,483 26,817 5,749
Switzerland 5,920 1,227 7,174 1,244 0 0 0 0
Uruguay 14,616 4,185 6,258 1,400 0 0 0 0
Chile 700 174 5,937 1,270 4,597 969 5,275 1,144
Dairy, Cheese
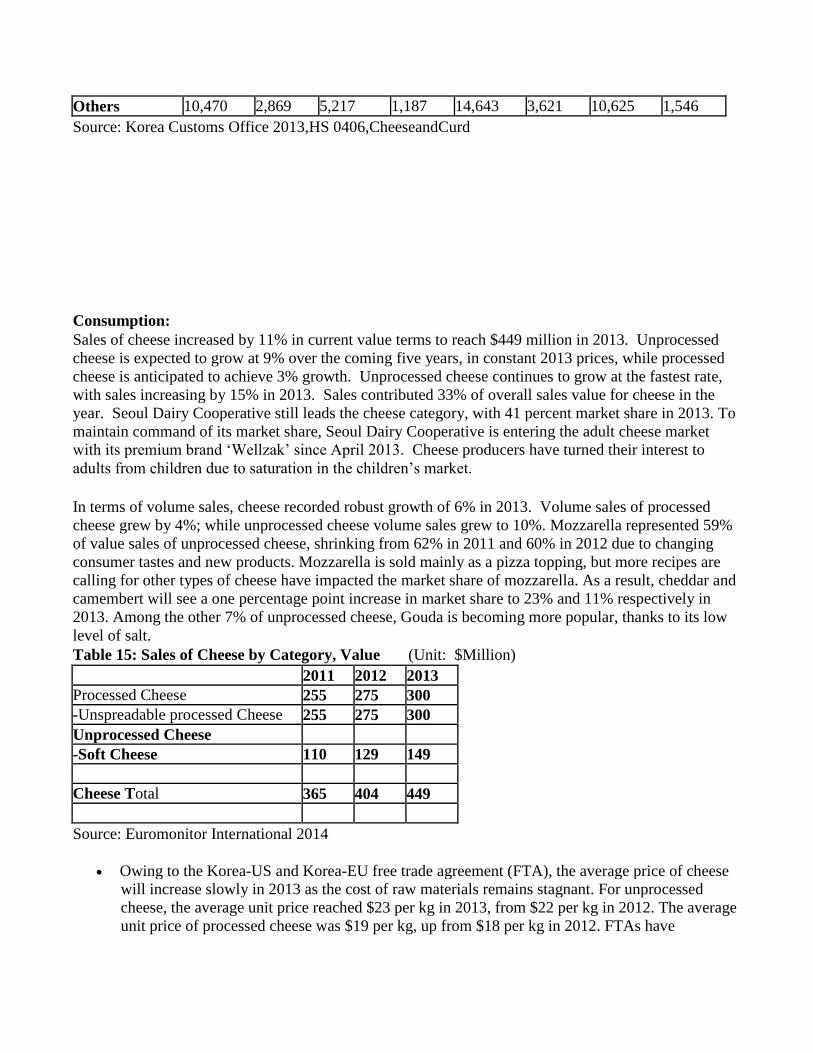
Others 10,470 2,869 5,217 1,187 14,643 3,621 10,625 1,546
Source: Korea Customs Office 2013,HS 0406,CheeseandCurd
Consumption:
Sales of cheese increased by 11% in current value terms to reach $449 million in 2013. Unprocessed
cheese is expected to grow at 9% over the coming five years, in constant 2013 prices, while processed
cheese is anticipated to achieve 3% growth. Unprocessed cheese continues to grow at the fastest rate,
with sales increasing by 15% in 2013. Sales contributed 33% of overall sales value for cheese in the
year. Seoul Dairy Cooperative still leads the cheese category, with 41 percent market share in 2013. To
maintain command of its market share, Seoul Dairy Cooperative is entering the adult cheese market
with its premium brand ‘Wellzak’ since April 2013. Cheese producers have turned their interest to
adults from children due to saturation in the children’s market.
In terms of volume sales, cheese recorded robust growth of 6% in 2013. Volume sales of processed
cheese grew by 4%; while unprocessed cheese volume sales grew to 10%. Mozzarella represented 59%
of value sales of unprocessed cheese, shrinking from 62% in 2011 and 60% in 2012 due to changing
consumer tastes and new products. Mozzarella is sold mainly as a pizza topping, but more recipes are
calling for other types of cheese have impacted the market share of mozzarella. As a result, cheddar and
camembert will see a one percentage point increase in market share to 23% and 11% respectively in
2013. Among the other 7% of unprocessed cheese, Gouda is becoming more popular, thanks to its low
level of salt.
Table 15: Sales of Cheese by Category, Value (Unit: $Million)
2011 2012 2013
Processed Cheese 255 275 300
-Unspreadable processed Cheese 255 275 300
Unprocessed Cheese
-Soft Cheese 110 129 149
Cheese Total 365 404 449
Source: Euromonitor International 2014
Owing to the Korea-US and Korea-EU free trade agreement (FTA), the average price of cheese
will increase slowly in 2013 as the cost of raw materials remains stagnant. For unprocessed
cheese, the average unit price reached $23 per kg in 2013, from $22 per kg in 2012. The average
unit price of processed cheese was $19 per kg, up from $18 per kg in 2012. FTAs have
influenced both categories, but the price gap between two categories is increasing gradually as
unprocessed cheese is increasingly made with natural cheese.
Marketing:
The growing demand for high-quality, natural cheese supports robust sales values for the coming
years. As processed cheese products become more available with natural flavor, sales will
increase. Unprocessed cheese is expected to grow at a 9%, in constant 2013 prices, whereas
processed cheese is anticipated to achieve a 3% increase over the coming five years. Cheese
producers have turned their interest to adults after saturating the children’s market. More Korean
consumers like to have cheese together with alcohol. There is an increasing popularity of
French style dining and to drink wine with cheese, which has market potential for adults.
Sales of cheese grew by 11%, to reach $4.5 million in 2013. There was a trade-off between
unspreadable processed cheese and soft cheese in sales growth. Unspreadable processed cheese
is set to see growth increase to 9% in 2013, while soft cheese is anticipated to see a decline in
growth to 15% in the year. New products will be introduced in processed cheese from local
brands, supporting sales. However, unprocessed cheese continues to grow at a rapid rate due to
market penetration of the major imported brands. Local consumers are likely to become more
familiar with imported brands and soft cheese, as demand for western-style dining rises.
Demand for natural cheese is growing, however, due to higher demand for convenience; local
consumers prefer processed cheese that contains natural cheese in Korea. Amongst unspreadable
processed cheese, more consumers are looking for string cheese as an accompaniment to
alcohol. In 2013, Seoul Dairy Cooperative maintained 42% of value sales. The market share of
Namyang Dairy Products declined to 22%, a fall of one percentage point due to the impact of
unfair business scandal of the company. Consumers boycotted the company’s products after a
group of wholesalers for Namyang reported to the public that the company is forcing its sales
agents to buy more products than they needed and the products were closed to their expiry date.
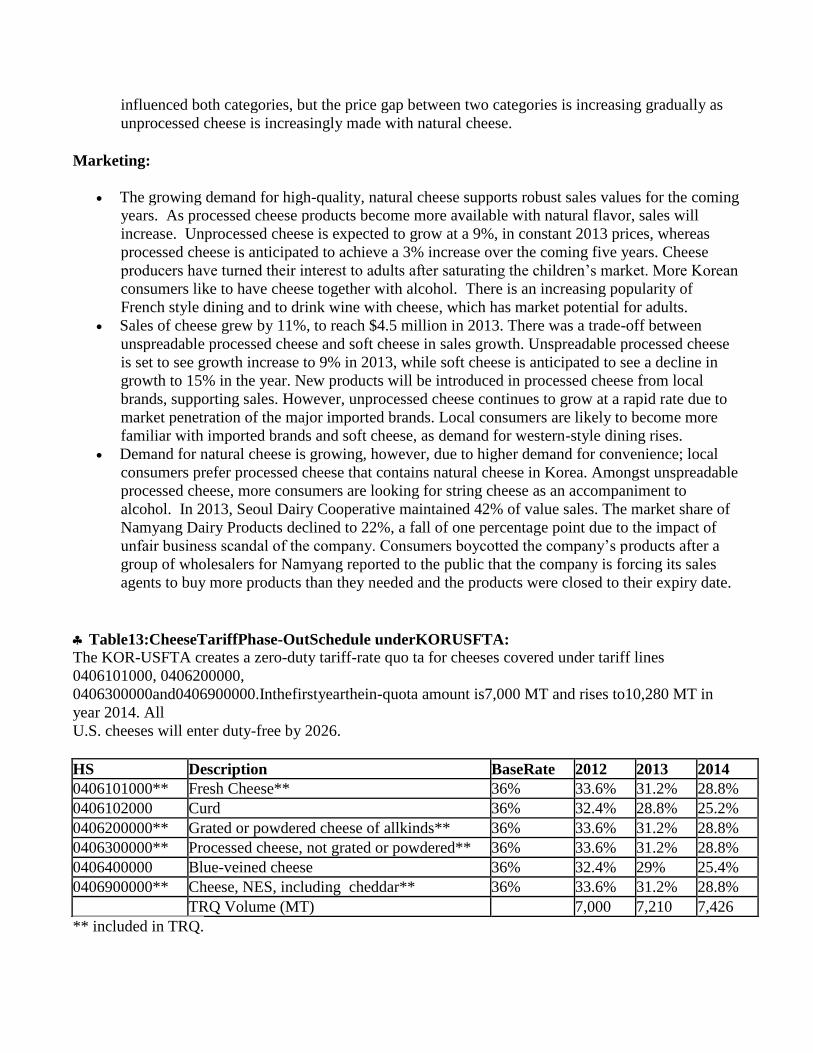
Table13:CheeseTariffPhase-OutSchedule underKORUSFTA: The KOR-USFTA creates a zero-duty tariff-rate quo ta for cheeses covered under tariff lines
0406101000, 0406200000,
0406300000and0406900000.Inthefirstyearthein-quota amount is7,000 MT and rises to10,280 MT in
year 2014. All
U.S. cheeses will enter duty-free by 2026.
HS Description BaseRate 2012 2013 2014
0406101000** Fresh Cheese** 36% 33.6% 31.2% 28.8%
0406102000 Curd 36% 32.4% 28.8% 25.2%
0406200000** Grated or powdered cheese of allkinds** 36% 33.6% 31.2% 28.8%
0406300000** Processed cheese, not grated or powdered** 36% 33.6% 31.2% 28.8%
0406400000 Blue-veined cheese 36% 32.4% 29% 25.4%
0406900000** Cheese, NES, including cheddar** 36% 33.6% 31.2% 28.8%
TRQ Volume (MT) 7,000 7,210 7,426
** included in TRQ.
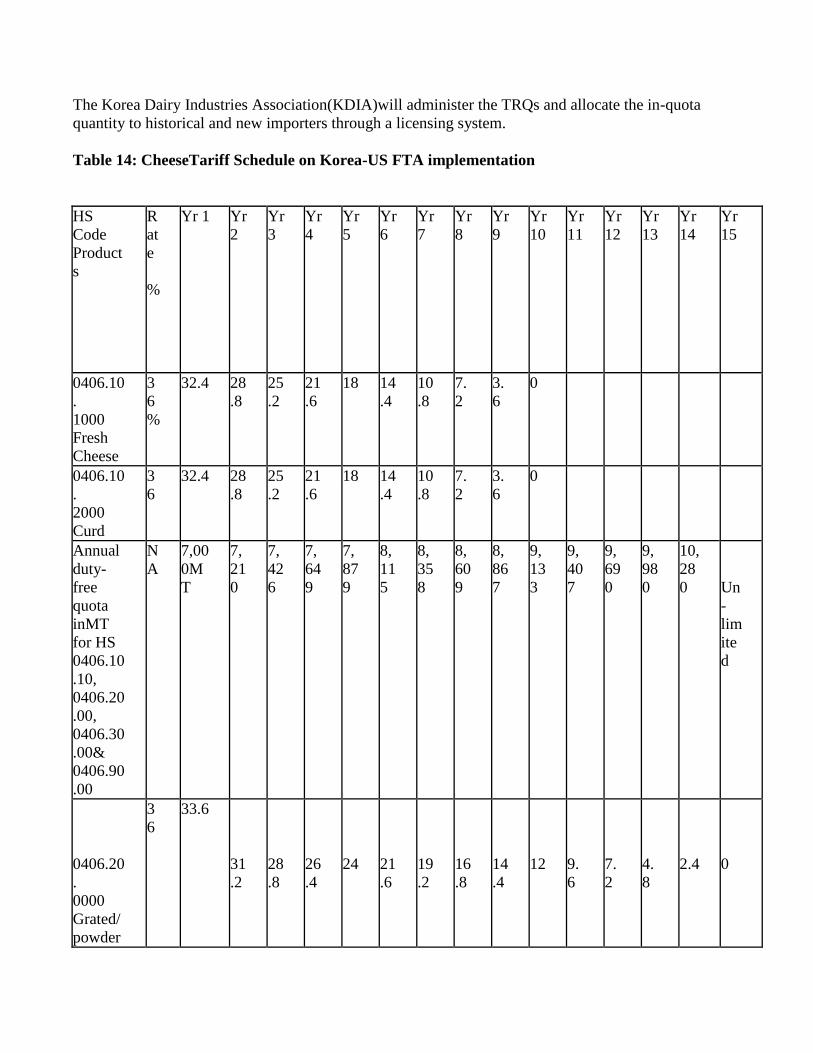
The Korea Dairy Industries Association(KDIA)will administer the TRQs and allocate the in-quota
quantity to historical and new importers through a licensing system.
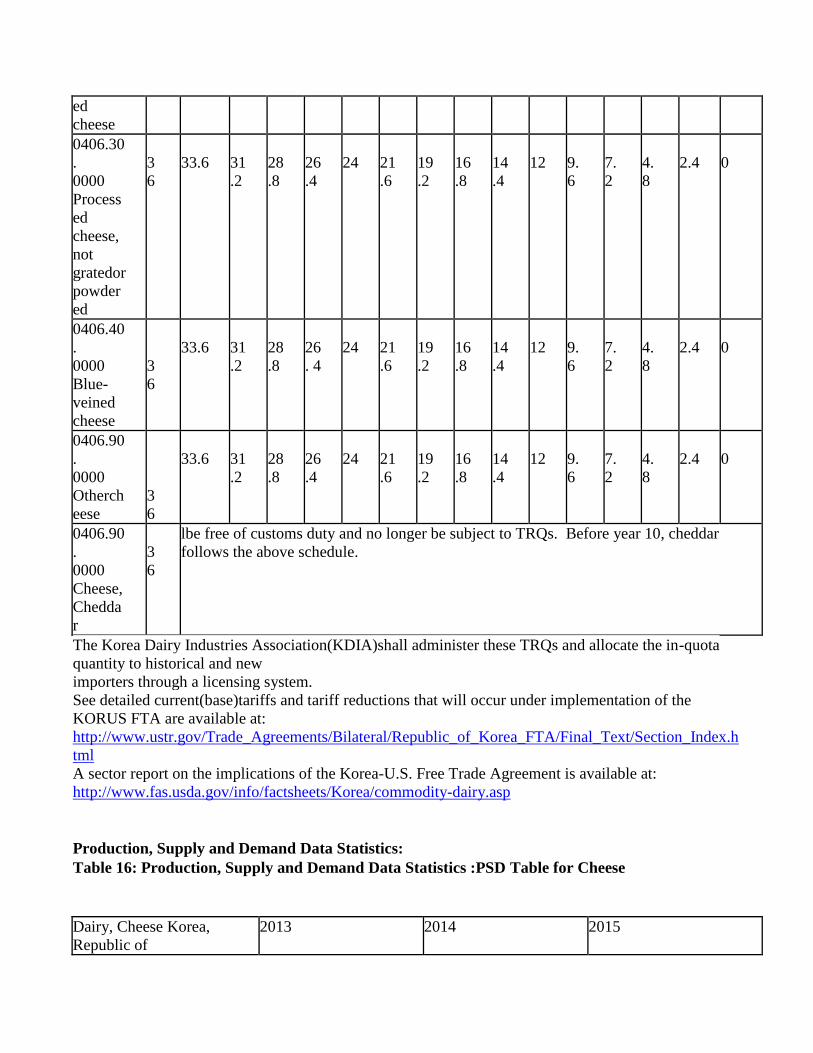
Table 14: CheeseTariff Schedule on Korea-US FTA implementation
HS
Code
Product
s
R
at
e
%
Yr 1 Yr
2
Yr
3
Yr
4
Yr
5
Yr
6
Yr
7
Yr
8
Yr
9
Yr
10
Yr
11
Yr
12
Yr
13
Yr
14
Yr
15
0406.10
.
1000
Fresh
Cheese
3
6
%
32.4 28
.8
25
.2
21
.6
18 14
.4
10
.8
7.
2
3.
6
0
0406.10
.
2000
Curd
3
6
32.4 28
.8
25
.2
21
.6
18 14
.4
10
.8
7.
2
3.
6
0
Annual
duty-
free
quota
inMT
for HS
0406.10
.10,
0406.20
.00,
0406.30
.00&
0406.90
.00
N
A
7,00
0M
T
7,
21
0
7,
42
6
7,
64
9
7,
87
9
8,
11
5
8,
35
8
8,
60
9
8,
86
7
9,
13
3
9,
40
7
9,
69
0
9,
98
0
10,
28
0
Un
-
lim
ite
d
0406.20
.
0000
Grated/
powder
3
6
33.6
31
.2
28
.8
26
.4
24
21
.6
19
.2
16
.8
14
.4
12
9.
6
7.
2
4.
8
2.4
0
ed
cheese
0406.30
.
0000
Process
ed
cheese,
not
gratedor
powder
ed
3
6
33.6
31
.2
28
.8
26
.4
24
21
.6
19
.2
16
.8
14
.4
12
9.
6
7.
2
4.
8
2.4
0
0406.40
.
0000
Blue-
veined
cheese
3
6
33.6
31
.2
28
.8
26
. 4
24
21
.6
19
.2
16
.8
14
.4
12
9.
6
7.
2
4.
8
2.4
0
0406.90
.
0000
Otherch
eese
3
6
33.6
31
.2
28
.8
26
.4
24
21
.6
19
.2
16
.8
14
.4
12
9.
6
7.
2
4.
8
2.4
0
0406.90
.
0000
Cheese,
Chedda
r
3
6
lbe free of customs duty and no longer be subject to TRQs. Before year 10, cheddar
follows the above schedule.
The Korea Dairy Industries Association(KDIA)shall administer these TRQs and allocate the in-quota
quantity to historical and new
importers through a licensing system.
See detailed current(base)tariffs and tariff reductions that will occur under implementation of the
KORUS FTA are available at:
http://www.ustr.gov/Trade_Agreements/Bilateral/Republic_of_Korea_FTA/Final_Text/Section_Index.h
tml
A sector report on the implications of the Korea-U.S. Free Trade Agreement is available at:
http://www.fas.usda.gov/info/factsheets/Korea/commodity-dairy.asp
Production, Supply and Demand Data Statistics:
Table 16: Production, Supply and Demand Data Statistics :PSD Table for Cheese
Dairy, Cheese Korea,
Republic of
2013 2014 2015
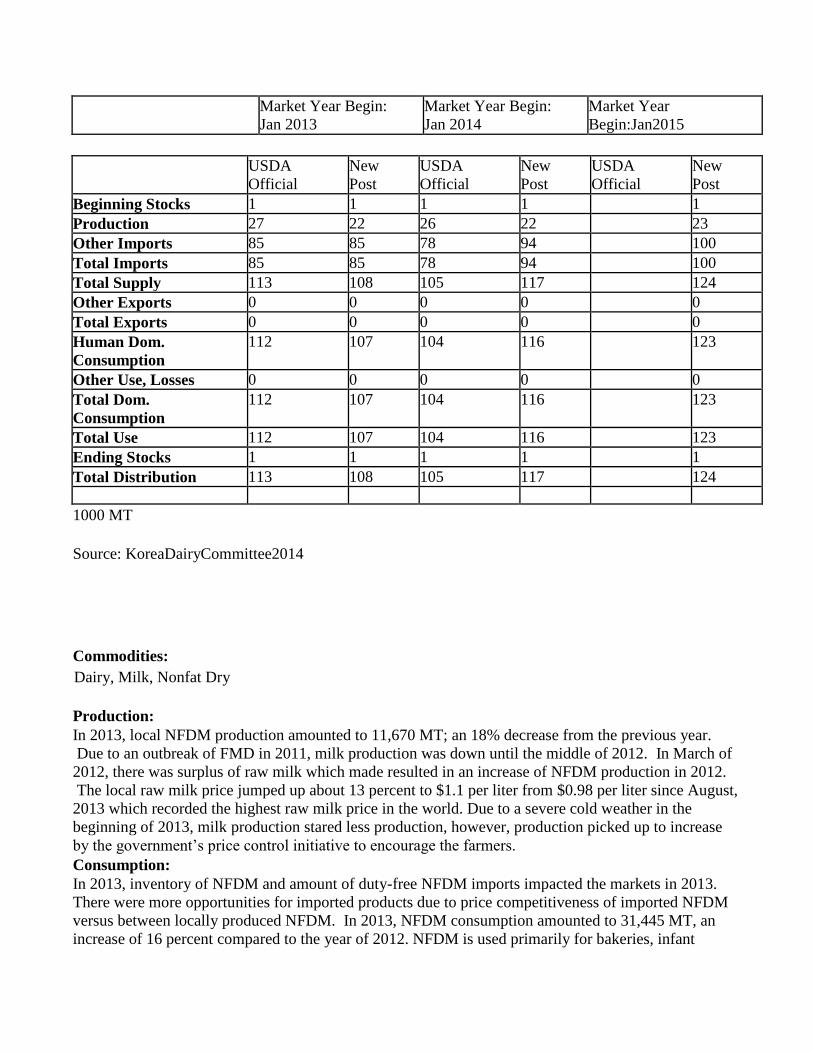
Market Year Begin:
Jan 2013
Market Year Begin:
Jan 2014
Market Year
Begin:Jan2015
USDA
Official
New
Post
USDA
Official
New
Post
USDA
Official
New
Post
Beginning Stocks 1 1 1 1 1
Production 27 22 26 22 23
Other Imports 85 85 78 94 100
Total Imports 85 85 78 94 100
Total Supply 113 108 105 117 124
Other Exports 0 0 0 0 0
Total Exports 0 0 0 0 0
Human Dom.
Consumption
112 107 104 116 123
Other Use, Losses 0 0 0 0 0
Total Dom.
Consumption
112 107 104 116 123
Total Use 112 107 104 116 123
Ending Stocks 1 1 1 1 1
Total Distribution 113 108 105 117 124
1000 MT
Source: KoreaDairyCommittee2014
Commodities:
Production:
In 2013, local NFDM production amounted to 11,670 MT; an 18% decrease from the previous year.
Due to an outbreak of FMD in 2011, milk production was down until the middle of 2012. In March of
2012, there was surplus of raw milk which made resulted in an increase of NFDM production in 2012.
The local raw milk price jumped up about 13 percent to $1.1 per liter from $0.98 per liter since August,
2013 which recorded the highest raw milk price in the world. Due to a severe cold weather in the
beginning of 2013, milk production stared less production, however, production picked up to increase
by the government’s price control initiative to encourage the farmers.
Consumption:
In 2013, inventory of NFDM and amount of duty-free NFDM imports impacted the markets in 2013.
There were more opportunities for imported products due to price competitiveness of imported NFDM
versus between locally produced NFDM. In 2013, NFDM consumption amounted to 31,445 MT, an
increase of 16 percent compared to the year of 2012. NFDM is used primarily for bakeries, infant
Dairy, Milk, Nonfat Dry
formula and as an ingredient in other dairy products. Since NFDM production is largely a result of
marketing quota policies, consumption is expected to continue to track closely with production.
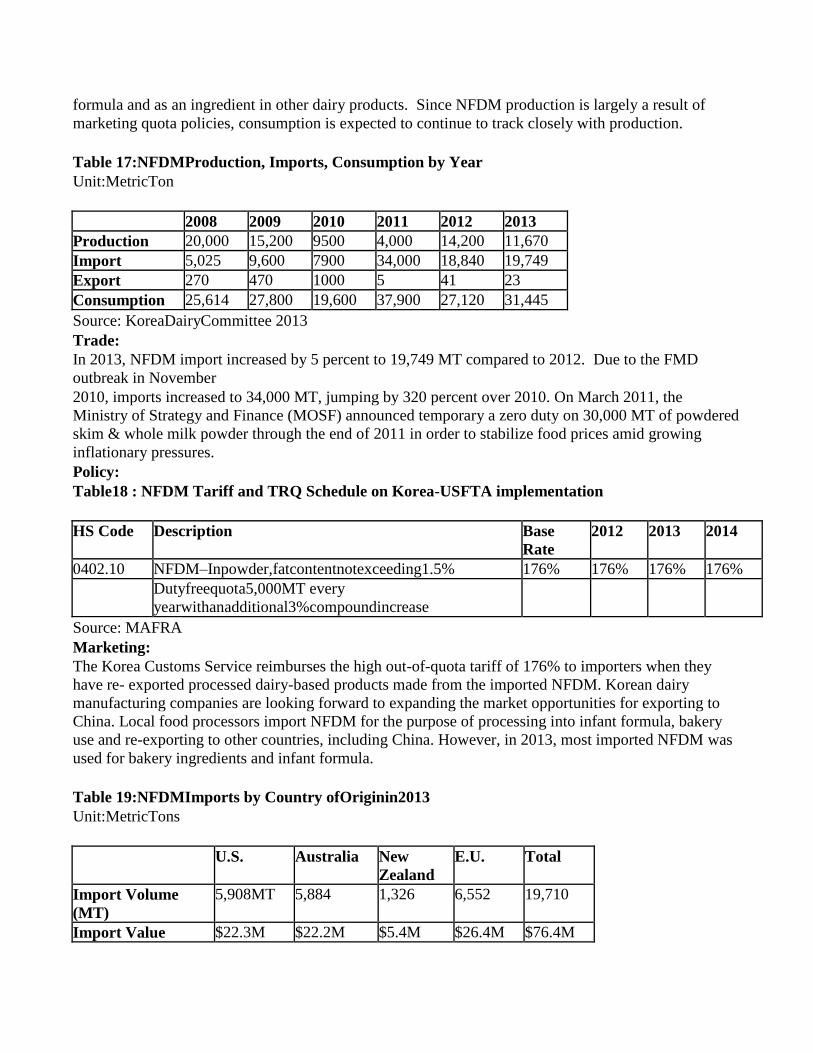
Table 17:NFDMProduction, Imports, Consumption by Year
Unit:MetricTon
2008 2009 2010 2011 2012 2013
Production 20,000 15,200 9500 4,000 14,200 11,670
Import 5,025 9,600 7900 34,000 18,840 19,749
Export 270 470 1000 5 41 23
Consumption 25,614 27,800 19,600 37,900 27,120 31,445
Source: KoreaDairyCommittee 2013
Trade:
In 2013, NFDM import increased by 5 percent to 19,749 MT compared to 2012. Due to the FMD
outbreak in November
2010, imports increased to 34,000 MT, jumping by 320 percent over 2010. On March 2011, the
Ministry of Strategy and Finance (MOSF) announced temporary a zero duty on 30,000 MT of powdered
skim & whole milk powder through the end of 2011 in order to stabilize food prices amid growing
inflationary pressures.
Policy:
Table18 : NFDM Tariff and TRQ Schedule on Korea-USFTA implementation
HS Code Description Base
Rate
2012 2013 2014
0402.10 NFDM–Inpowder,fatcontentnotexceeding1.5% 176% 176% 176% 176%
Dutyfreequota5,000MT every
yearwithanadditional3%compoundincrease
Source: MAFRA
Marketing:
The Korea Customs Service reimburses the high out-of-quota tariff of 176% to importers when they
have re- exported processed dairy-based products made from the imported NFDM. Korean dairy
manufacturing companies are looking forward to expanding the market opportunities for exporting to
China. Local food processors import NFDM for the purpose of processing into infant formula, bakery
use and re-exporting to other countries, including China. However, in 2013, most imported NFDM was
used for bakery ingredients and infant formula.
Table 19:NFDMImports by Country ofOriginin2013
Unit:MetricTons
U.S. Australia New
Zealand
E.U. Total
Import Volume
(MT)
5,908MT 5,884 1,326 6,552 19,710
Import Value $22.3M $22.2M $5.4M $26.4M $76.4M
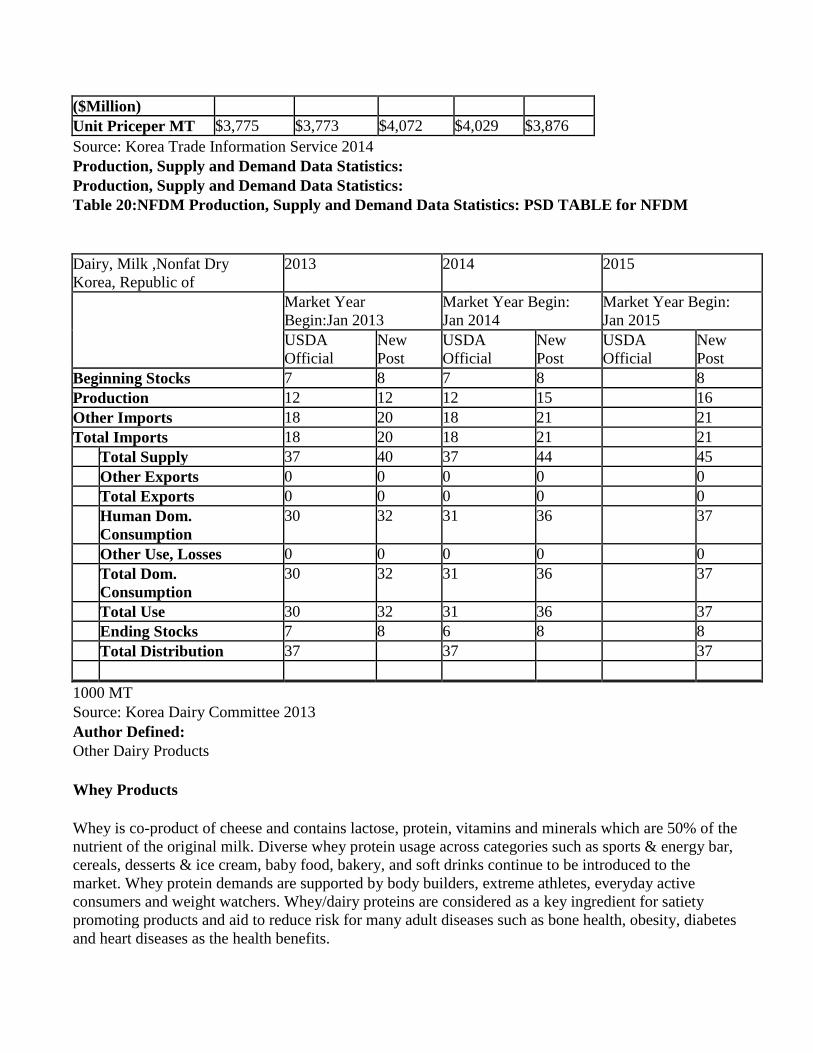
($Million)
Unit Priceper MT $3,775 $3,773 $4,072 $4,029 $3,876
Source: Korea Trade Information Service 2014
Production, Supply and Demand Data Statistics:
Production, Supply and Demand Data Statistics:
Table 20:NFDM Production, Supply and Demand Data Statistics: PSD TABLE for NFDM
Dairy, Milk ,Nonfat Dry
Korea, Republic of
2013 2014 2015
Market Year
Begin:Jan 2013
Market Year Begin:
Jan 2014
Market Year Begin:
Jan 2015
USDA
Official
New
Post
USDA
Official
New
Post
USDA
Official
New
Post
Beginning Stocks 7 8 7 8 8
Production 12 12 12 15 16
Other Imports 18 20 18 21 21
Total Imports 18 20 18 21 21
Total Supply 37 40 37 44 45
Other Exports 0 0 0 0 0
Total Exports 0 0 0 0 0
Human Dom.
Consumption
30 32 31 36 37
Other Use, Losses 0 0 0 0 0
Total Dom.
Consumption
30 32 31 36 37
Total Use 30 32 31 36 37
Ending Stocks 7 8 6 8 8
Total Distribution 37 37 37
1000 MT
Source: Korea Dairy Committee 2013
Author Defined:
Other Dairy Products
Whey Products
Whey is co-product of cheese and contains lactose, protein, vitamins and minerals which are 50% of the
nutrient of the original milk. Diverse whey protein usage across categories such as sports & energy bar,
cereals, desserts & ice cream, baby food, bakery, and soft drinks continue to be introduced to the
market. Whey protein demands are supported by body builders, extreme athletes, everyday active
consumers and weight watchers. Whey/dairy proteins are considered as a key ingredient for satiety
promoting products and aid to reduce risk for many adult diseases such as bone health, obesity, diabetes
and heart diseases as the health benefits.
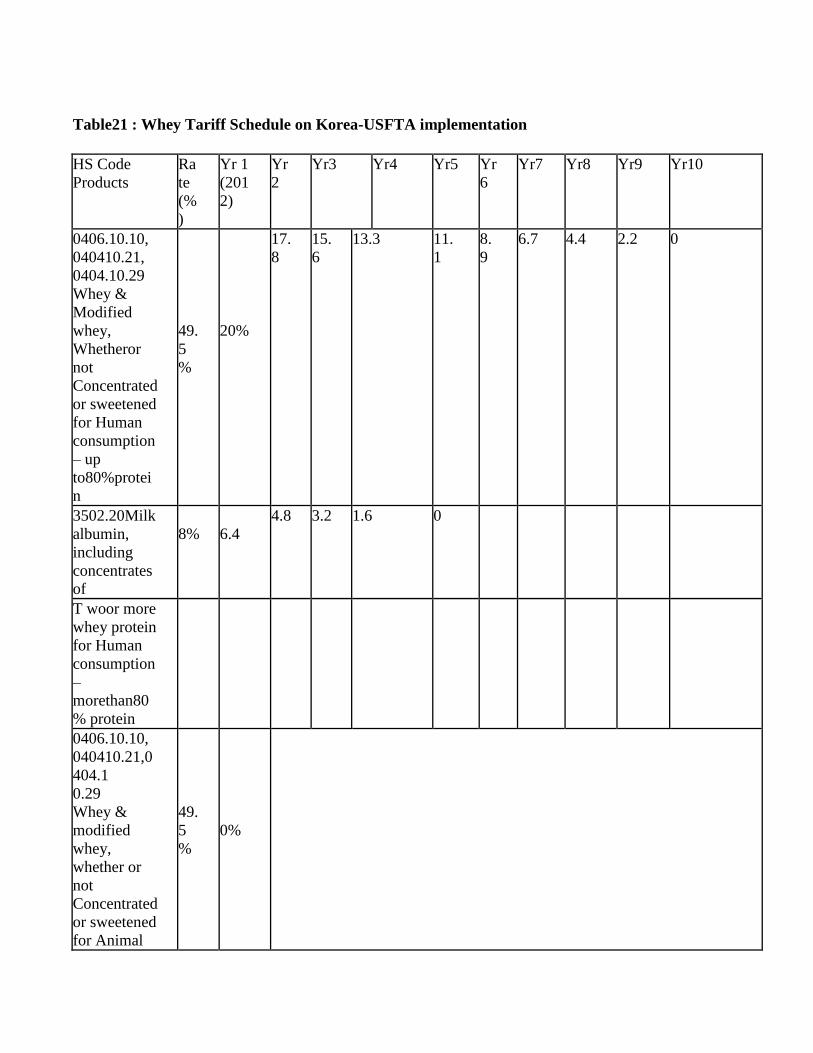
Table21 : Whey Tariff Schedule on Korea-USFTA implementation
HS Code
Products
Ra
te
(%
)
Yr 1
(201
2)
Yr
2
Yr3 Yr4 Yr5 Yr
6
Yr7 Yr8 Yr9 Yr10
0406.10.10,
040410.21,
0404.10.29
Whey &
Modified
whey,
Whetheror
not
Concentrated
or sweetened
for Human
consumption
– up
to80%protei
n
49.
5
%
20%
17.
8
15.
6
13.3 11.
1
8.
9
6.7 4.4 2.2 0
3502.20Milk
albumin,
including
concentrates
of
8%
6.4
4.8 3.2 1.6 0
T woor more
whey protein
for Human
consumption
–
morethan80
% protein
0406.10.10,
040410.21,0
404.1
0.29
Whey &
modified
whey,
whether or
not
Concentrated
or sweetened
for Animal
49.
5
%
0%
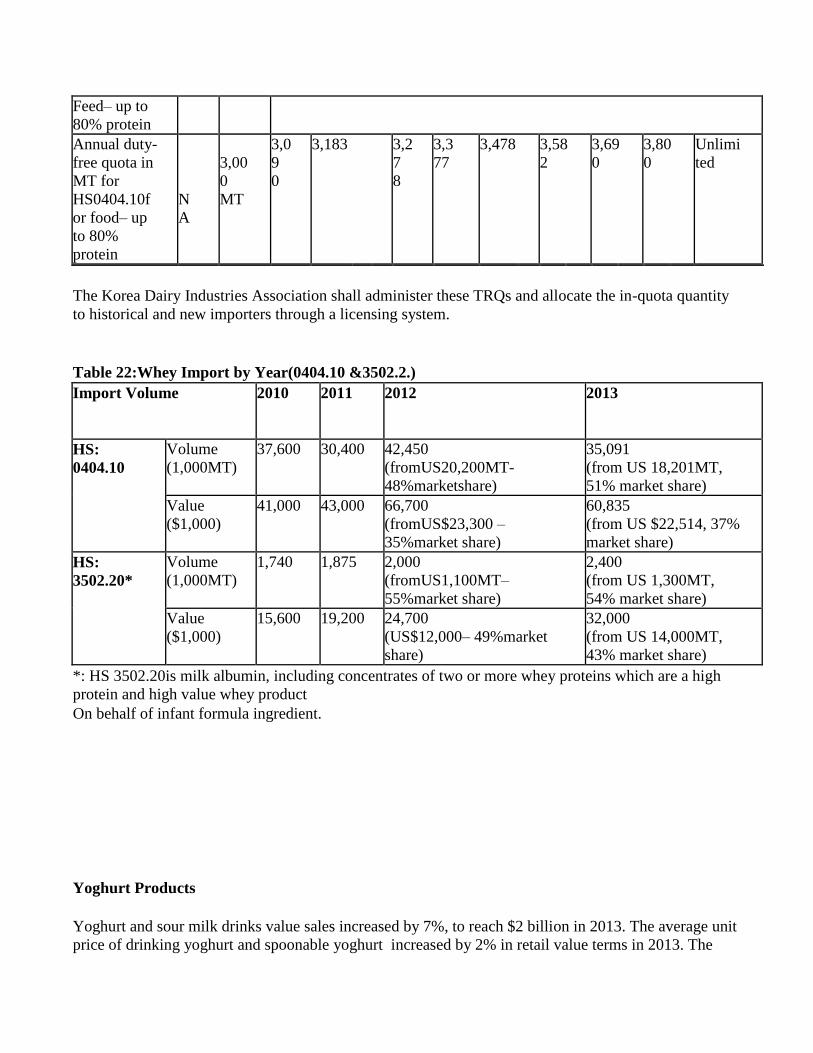
Feed– up to
80% protein
Annual duty-
free quota in
MT for
HS0404.10f
or food– up
to 80%
protein
N
A
3,00
0
MT
3,0
9
0
3,183 3,2
7
8
3,3
77
3,478 3,58
2
3,69
0
3,80
0
Unlimi
ted
The Korea Dairy Industries Association shall administer these TRQs and allocate the in-quota quantity
to historical and new importers through a licensing system.
Table 22:Whey Import by Year(0404.10 &3502.2.)
Import Volume
2010 2011 2012 2013
HS:
0404.10
Volume
(1,000MT)
37,600 30,400 42,450
(fromUS20,200MT-
48%marketshare)
35,091
(from US 18,201MT,
51% market share)
Value
($1,000)
41,000 43,000 66,700
(fromUS$23,300 –
35%market share)
60,835
(from US $22,514, 37%
market share)
HS:
3502.20*
Volume
(1,000MT)
1,740 1,875 2,000
(fromUS1,100MT–
55%market share)
2,400
(from US 1,300MT,
54% market share)
Value
($1,000)
15,600 19,200 24,700
(US$12,000– 49%market
share)
32,000
(from US 14,000MT,
43% market share)
*: HS 3502.20is milk albumin, including concentrates of two or more whey proteins which are a high
protein and high value whey product
On behalf of infant formula ingredient.
Yoghurt Products
Yoghurt and sour milk drinks value sales increased by 7%, to reach $2 billion in 2013. The average unit
price of drinking yoghurt and spoonable yoghurt increased by 2% in retail value terms in 2013. The
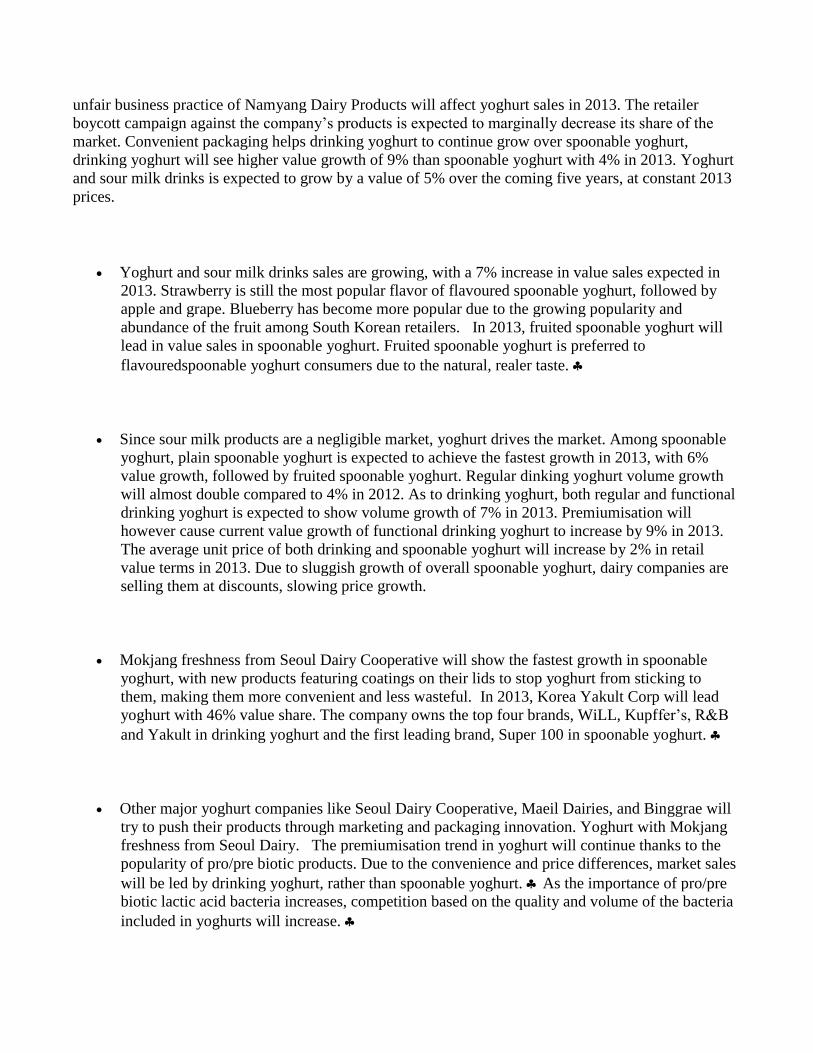
unfair business practice of Namyang Dairy Products will affect yoghurt sales in 2013. The retailer
boycott campaign against the company’s products is expected to marginally decrease its share of the
market. Convenient packaging helps drinking yoghurt to continue grow over spoonable yoghurt,
drinking yoghurt will see higher value growth of 9% than spoonable yoghurt with 4% in 2013. Yoghurt
and sour milk drinks is expected to grow by a value of 5% over the coming five years, at constant 2013
prices.
Yoghurt and sour milk drinks sales are growing, with a 7% increase in value sales expected in
2013. Strawberry is still the most popular flavor of flavoured spoonable yoghurt, followed by
apple and grape. Blueberry has become more popular due to the growing popularity and
abundance of the fruit among South Korean retailers. In 2013, fruited spoonable yoghurt will
lead in value sales in spoonable yoghurt. Fruited spoonable yoghurt is preferred to
flavouredspoonable yoghurt consumers due to the natural, realer taste.
Since sour milk products are a negligible market, yoghurt drives the market. Among spoonable
yoghurt, plain spoonable yoghurt is expected to achieve the fastest growth in 2013, with 6%
value growth, followed by fruited spoonable yoghurt. Regular dinking yoghurt volume growth
will almost double compared to 4% in 2012. As to drinking yoghurt, both regular and functional
drinking yoghurt is expected to show volume growth of 7% in 2013. Premiumisation will
however cause current value growth of functional drinking yoghurt to increase by 9% in 2013.
The average unit price of both drinking and spoonable yoghurt will increase by 2% in retail
value terms in 2013. Due to sluggish growth of overall spoonable yoghurt, dairy companies are
selling them at discounts, slowing price growth.
Mokjang freshness from Seoul Dairy Cooperative will show the fastest growth in spoonable
yoghurt, with new products featuring coatings on their lids to stop yoghurt from sticking to
them, making them more convenient and less wasteful. In 2013, Korea Yakult Corp will lead
yoghurt with 46% value share. The company owns the top four brands, WiLL, Kupffer’s, R&B
and Yakult in drinking yoghurt and the first leading brand, Super 100 in spoonable yoghurt.
Other major yoghurt companies like Seoul Dairy Cooperative, Maeil Dairies, and Binggrae will
try to push their products through marketing and packaging innovation. Yoghurt with Mokjang
freshness from Seoul Dairy. The premiumisation trend in yoghurt will continue thanks to the
popularity of pro/pre biotic products. Due to the convenience and price differences, market sales
will be led by drinking yoghurt, rather than spoonable yoghurt. As the importance of pro/pre
biotic lactic acid bacteria increases, competition based on the quality and volume of the bacteria
included in yoghurts will increase.
Ice Cream Ice cream sees recovery from negative trend with 1% growth in retail value sales, to reach $1.78 million
in 2013. All categories in ice cream show increase in average unit prices due to premiumisation trend.
Lotte Confectionery Co Ltd is ranked as the first company in ice cream with 36% retail value share in
2013. Warmer and longer summer season in South Korea turns value sales of ice cream positive in
2013.Ice cream is expected to decrease by 1% in constant value terms over the coming five years.
Frozen yoghurt posts the highest retail value growth of 4% in 2013, driven by increasing preference of
yoghurt.
Ice cream recovered from negative growth with 1% retail value growth, to reach sales of $1.78
million in 2013. The retail volume sales of ice cream still showed negative growth, as it had
since 2011, but with a decreasing rate. Ice cream sales tend to be highly influenced by weather
conditions. The early summer was warmer and longer in 2013, which had positive influence on
ice cream sales.
All categories in ice cream showed increase in average unit prices due to the premiumisation
trend. Due to increasing numbers of foodservice outlets including cafés and artisanal ice cream
franchises, consumers prefer to buy premium products even in general grocery stores,
stimulating manufacturers to develop new products with higher quality and price.
In 2013, single portion dairy ice cream grew by 2% whereas single portion water ice cream
declined by 1% in retail value terms. Vanilla is the most preferred flavor in Korea, followed by
strawberry and chocolate as in 2012. This tendency is in line with local consumers’ strong
preference for the soft and creamy taste of ice cream.
Ice cream desserts will continue positive growth in the coming years, as new dessert concepts
were developed recently.This is because more and more consumers are willing to pay premium
price for artisanal ice cream brands such as Häagen-Dazs, Natuur and Palazzo del Freddo.
Overall ice cream is expected to decrease by 1% in constant value terms over the coming five
years, mainly due to the expected decline of single portion dairy ice cream, from solid positive
growth in the review period. Large retailers will try to attract those brands in the form of
packaged retail products. However, Baskin-Robbins and Coldstone’s, popular made-to-order ice
cream shops in Korea, have not provided packaged products of each brand yet, but will take
more shares from retail brands with competitive marketing. Basically ice cream is known to
have no expiry date since it is retailed as frozen.
EXPORT REQUIREMENT:
See APHIS’website(http://www.aphis.usda.gov/regulations/vs/iregs/products/ for any sanitary
requirements for shipping cheese to Korea.
For more information, pleasecontacttheU.S.AgriculturalTradeOffice,U.S.EmbassySeoul,Korea,at
[email protected],Tel:82-2-397-4188,Fax:82-2-720-7921,or visitwww.atoseoul.com

Commodities:
Select
Select
Select