Embed Size (px)
Citation preview
Brazil A. Definitions and sources of data
The Foreign Capital and Exchange Department (Decec) of the Brazilian Central Bank
(Bacen) is responsible for the registration, supervision and follow-up of foreign direct investment (FDI) in Brazil.
FDI in Brazil is defined as imports of goods, machinery and equipment into the country
without any initial disbursement of foreign exchange, or of financial or monetary resources for use in economic activities. In both cases, the resources should belong to natural or juridical persons resident, domiciled or headquartered outside of Brazil.
FDI stock and flows before 1995 were compiled with data from the registry of FDI in the Central Bank. From 1996 up to 2000, data on foreign exchange transactions are used and only those investments larger than $10m over a year in a single company are considered. From 2001 onwards, all investment amount is taken into account. FDI inflows include investment in assets, disbursements of foreign exchange, conversion of external credits into investments and conversion into investments of other assets belonging to residents abroad. Short- and long-term loans between parent companies and their local subsidiaries, as well as other related credit made available from the country of origin of the investment, are not classified as direct investment. The amount of intra-company loans is nevertheless available among the information collected through the Census.
FDI stock data are calculated on the basis of the 1996 and 2001 Census of Foreign Capitals in Brazil, and updated using data from inflows collected through data on foreign exchange transactions. .
Reinvestment is defined as the returns produced by enterprises established in the country, attributable to persons resident or domiciled abroad, which were reutilized in the same enterprises that produced them or in another sector of the economy. The Central Bank of Brazil defines reinvestment in another sector of the national economy as the reutilization of profits in enterprises other than the original one, provided that:
a) they are not used in activities considered to be speculative, such as stock exchange transactions and real estate transactions;
b) it is proven that reinvestment permits the beneficiary enterprises to develop new technology and to increase their roll-over capital.
The flows of Brazilian investments abroad are calculated on the basis of foreign exchange
transactions. The stock data are collected annually through the Brazilian Capital Abroad Survey.
B. Statistics on FDI and the operations of TNCs
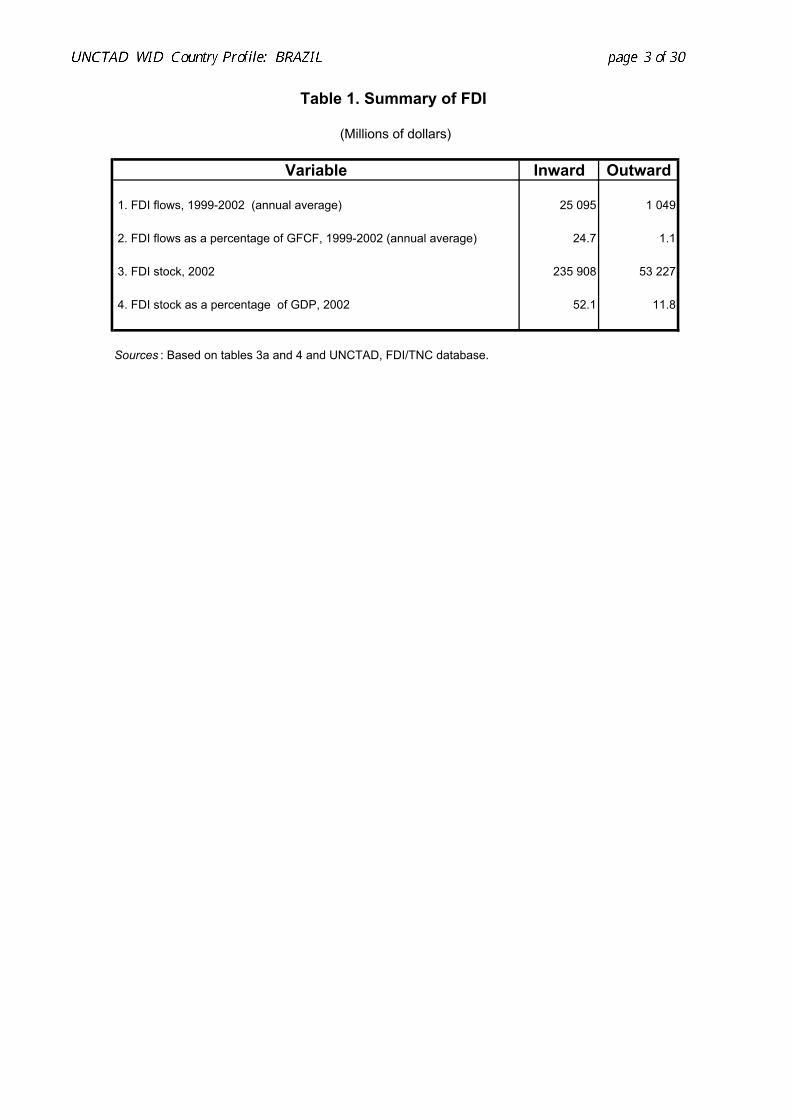
Table 1. Summary of FDI
(Millions of dollars)
Variable Inward Outward
1. FDI flows, 1999-2002 (annual average) 25 095 1 049
2. FDI flows as a percentage of GFCF, 1999-2002 (annual average) 24.7 1.1
3. FDI stock, 2002 235 908 53 227
4. FDI stock as a percentage of GDP, 2002 52.1 11.8
Sources : Based on tables 3a and 4 and UNCTAD, FDI/TNC database.
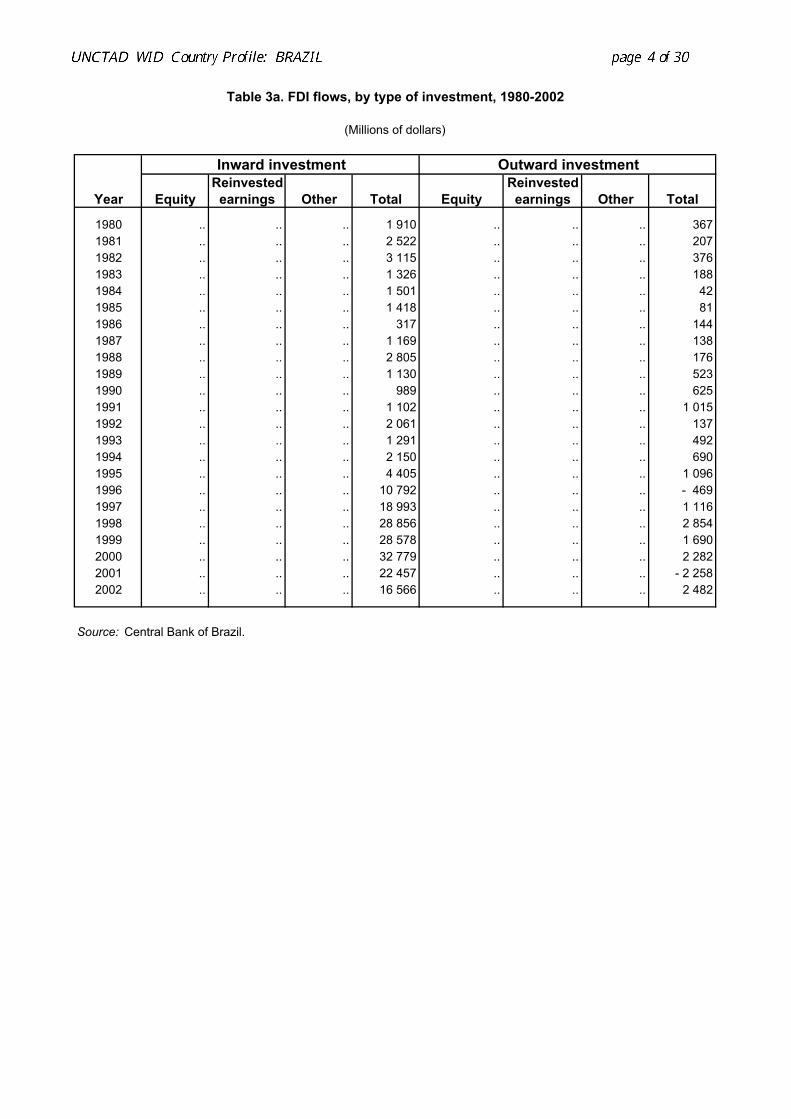
Table 3a. FDI flows, by type of investment, 1980-2002
(Millions of dollars)
Inward investment Outward investmentReinvested Reinvested
Year Equity earnings Other Total Equity earnings Other Total
1980 .. .. .. 1 910 .. .. .. 3671981 .. .. .. 2 522 .. .. .. 2071982 .. .. .. 3 115 .. .. .. 3761983 .. .. .. 1 326 .. .. .. 1881984 .. .. .. 1 501 .. .. .. 421985 .. .. .. 1 418 .. .. .. 811986 .. .. .. 317 .. .. .. 1441987 .. .. .. 1 169 .. .. .. 1381988 .. .. .. 2 805 .. .. .. 1761989 .. .. .. 1 130 .. .. .. 5231990 .. .. .. 989 .. .. .. 6251991 .. .. .. 1 102 .. .. .. 1 0151992 .. .. .. 2 061 .. .. .. 1371993 .. .. .. 1 291 .. .. .. 4921994 .. .. .. 2 150 .. .. .. 6901995 .. .. .. 4 405 .. .. .. 1 0961996 .. .. .. 10 792 .. .. .. - 4691997 .. .. .. 18 993 .. .. .. 1 1161998 .. .. .. 28 856 .. .. .. 2 8541999 .. .. .. 28 578 .. .. .. 1 6902000 .. .. .. 32 779 .. .. .. 2 2822001 .. .. .. 22 457 .. .. .. - 2 2582002 .. .. .. 16 566 .. .. .. 2 482
Source: Central Bank of Brazil.
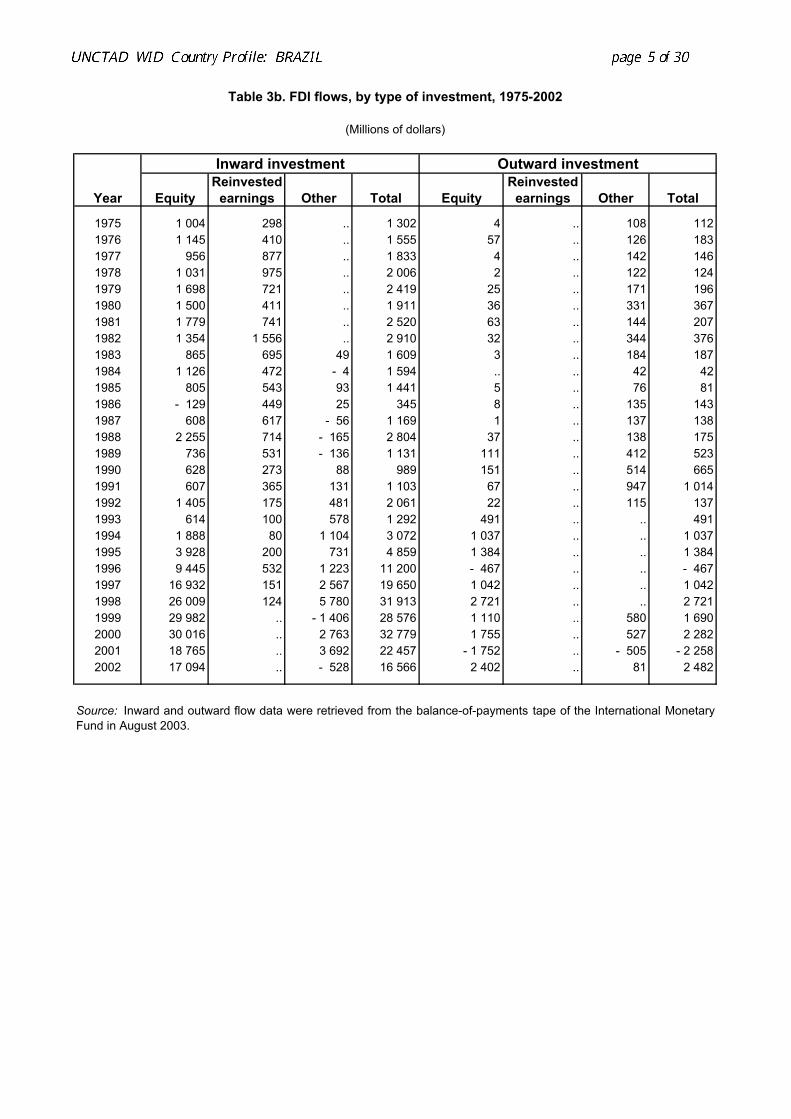
Table 3b. FDI flows, by type of investment, 1975-2002
(Millions of dollars)
Inward investment Outward investmentReinvested Reinvested
Year Equity earnings Other Total Equity earnings Other Total
1975 1 004 298 .. 1 302 4 .. 108 1121976 1 145 410 .. 1 555 57 .. 126 1831977 956 877 .. 1 833 4 .. 142 1461978 1 031 975 .. 2 006 2 .. 122 1241979 1 698 721 .. 2 419 25 .. 171 1961980 1 500 411 .. 1 911 36 .. 331 3671981 1 779 741 .. 2 520 63 .. 144 2071982 1 354 1 556 .. 2 910 32 .. 344 3761983 865 695 49 1 609 3 .. 184 1871984 1 126 472 - 4 1 594 .. .. 42 421985 805 543 93 1 441 5 .. 76 811986 - 129 449 25 345 8 .. 135 1431987 608 617 - 56 1 169 1 .. 137 1381988 2 255 714 - 165 2 804 37 .. 138 1751989 736 531 - 136 1 131 111 .. 412 5231990 628 273 88 989 151 .. 514 6651991 607 365 131 1 103 67 .. 947 1 0141992 1 405 175 481 2 061 22 .. 115 1371993 614 100 578 1 292 491 .. .. 4911994 1 888 80 1 104 3 072 1 037 .. .. 1 0371995 3 928 200 731 4 859 1 384 .. .. 1 3841996 9 445 532 1 223 11 200 - 467 .. .. - 4671997 16 932 151 2 567 19 650 1 042 .. .. 1 0421998 26 009 124 5 780 31 913 2 721 .. .. 2 7211999 29 982 .. - 1 406 28 576 1 110 .. 580 1 6902000 30 016 .. 2 763 32 779 1 755 .. 527 2 2822001 18 765 .. 3 692 22 457 - 1 752 .. - 505 - 2 2582002 17 094 .. - 528 16 566 2 402 .. 81 2 482
Source: Inward and outward flow data were retrieved from the balance-of-payments tape of the International MonetaryFund in August 2003.
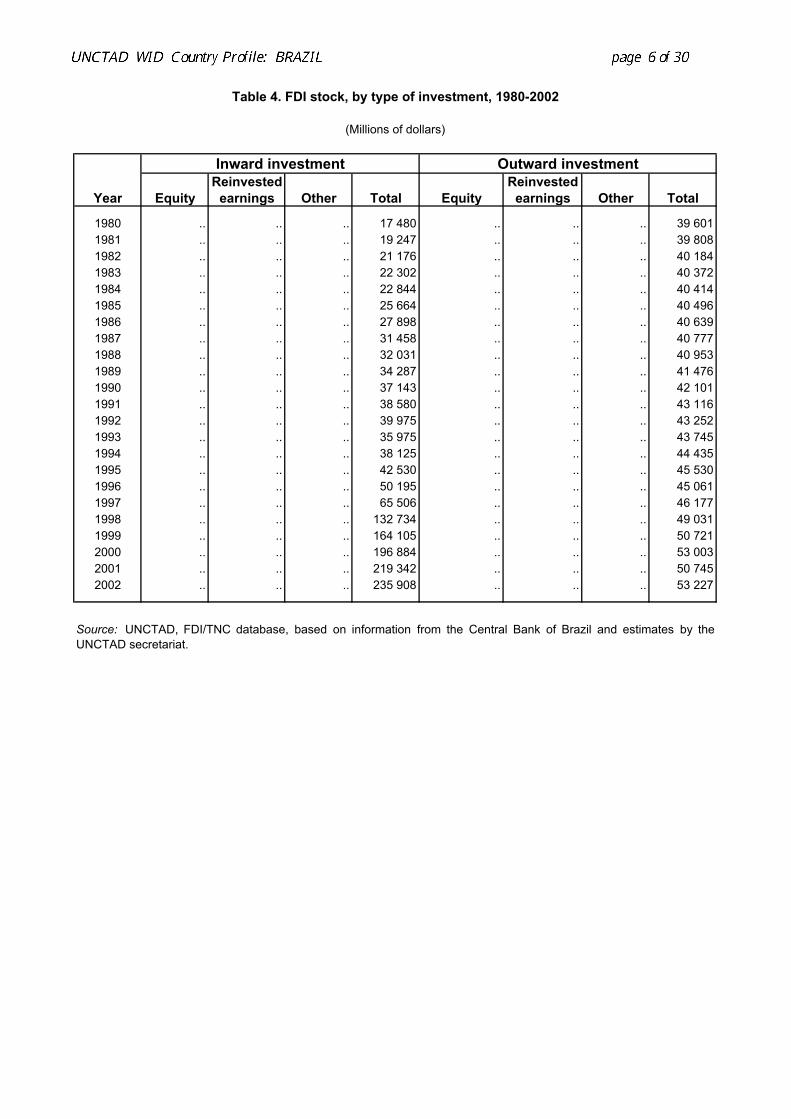
Table 4. FDI stock, by type of investment, 1980-2002
(Millions of dollars)
Inward investment Outward investmentReinvested Reinvested
Year Equity earnings Other Total Equity earnings Other Total
1980 .. .. .. 17 480 .. .. .. 39 6011981 .. .. .. 19 247 .. .. .. 39 8081982 .. .. .. 21 176 .. .. .. 40 1841983 .. .. .. 22 302 .. .. .. 40 3721984 .. .. .. 22 844 .. .. .. 40 4141985 .. .. .. 25 664 .. .. .. 40 4961986 .. .. .. 27 898 .. .. .. 40 6391987 .. .. .. 31 458 .. .. .. 40 7771988 .. .. .. 32 031 .. .. .. 40 9531989 .. .. .. 34 287 .. .. .. 41 4761990 .. .. .. 37 143 .. .. .. 42 1011991 .. .. .. 38 580 .. .. .. 43 1161992 .. .. .. 39 975 .. .. .. 43 2521993 .. .. .. 35 975 .. .. .. 43 7451994 .. .. .. 38 125 .. .. .. 44 4351995 .. .. .. 42 530 .. .. .. 45 5301996 .. .. .. 50 195 .. .. .. 45 0611997 .. .. .. 65 506 .. .. .. 46 1771998 .. .. .. 132 734 .. .. .. 49 0311999 .. .. .. 164 105 .. .. .. 50 7212000 .. .. .. 196 884 .. .. .. 53 0032001 .. .. .. 219 342 .. .. .. 50 7452002 .. .. .. 235 908 .. .. .. 53 227
Source: UNCTAD, FDI/TNC database, based on information from the Central Bank of Brazil and estimates by theUNCTAD secretariat.
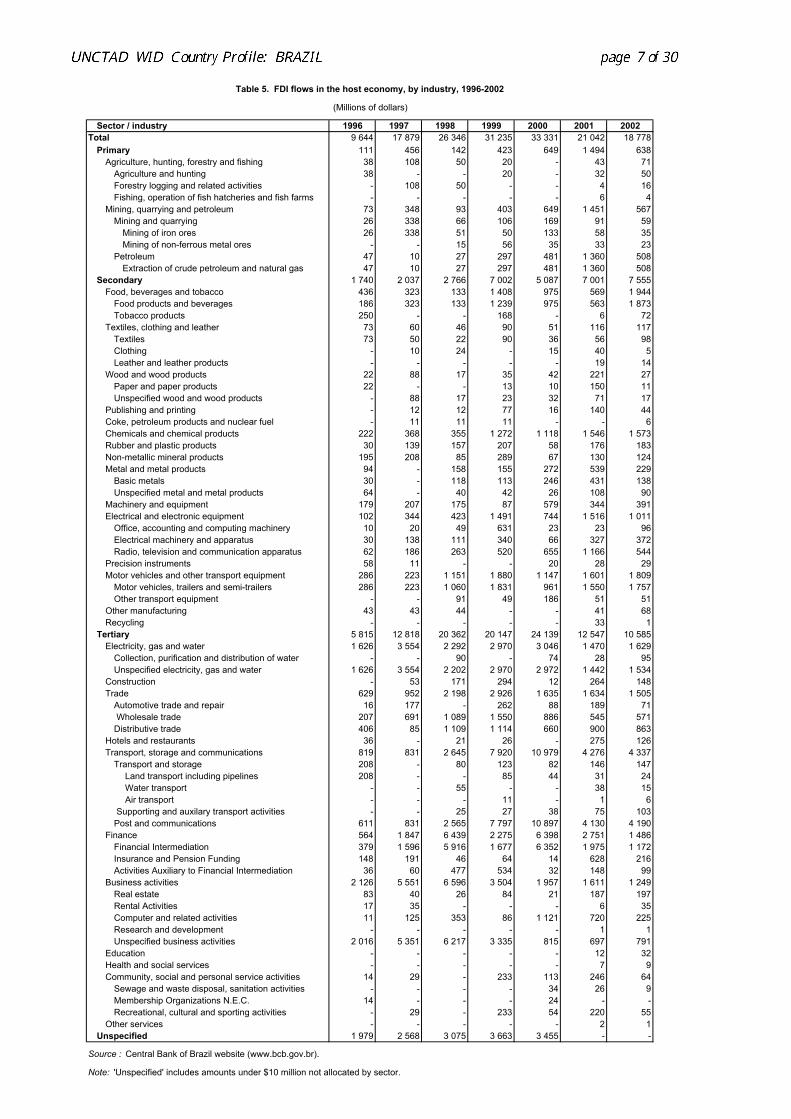
Table 5. FDI flows in the host economy, by industry, 1996-2002
(Millions of dollars)
Sector / industry 1996 1997 1998 1999 2000 2001 2002Total 9 644 17 879 26 346 31 235 33 331 21 042 18 778
Primary 111 456 142 423 649 1 494 638Agriculture, hunting, forestry and fishing 38 108 50 20 - 43 71
Agriculture and hunting 38 - - 20 - 32 50Forestry logging and related activities - 108 50 - - 4 16Fishing, operation of fish hatcheries and fish farms - - - - - 6 4
Mining, quarrying and petroleum 73 348 93 403 649 1 451 567Mining and quarrying 26 338 66 106 169 91 59
Mining of iron ores 26 338 51 50 133 58 35Mining of non-ferrous metal ores - - 15 56 35 33 23
Petroleum 47 10 27 297 481 1 360 508Extraction of crude petroleum and natural gas 47 10 27 297 481 1 360 508
Secondary 1 740 2 037 2 766 7 002 5 087 7 001 7 555Food, beverages and tobacco 436 323 133 1 408 975 569 1 944
Food products and beverages 186 323 133 1 239 975 563 1 873Tobacco products 250 - - 168 - 6 72
Textiles, clothing and leather 73 60 46 90 51 116 117Textiles 73 50 22 90 36 56 98Clothing - 10 24 - 15 40 5Leather and leather products - - - - - 19 14
Wood and wood products 22 88 17 35 42 221 27Paper and paper products 22 - - 13 10 150 11Unspecified wood and wood products - 88 17 23 32 71 17
Publishing and printing - 12 12 77 16 140 44Coke, petroleum products and nuclear fuel - 11 11 11 - - 6Chemicals and chemical products 222 368 355 1 272 1 118 1 546 1 573Rubber and plastic products 30 139 157 207 58 176 183Non-metallic mineral products 195 208 85 289 67 130 124Metal and metal products 94 - 158 155 272 539 229
Basic metals 30 - 118 113 246 431 138Unspecified metal and metal products 64 - 40 42 26 108 90
Machinery and equipment 179 207 175 87 579 344 391Electrical and electronic equipment 102 344 423 1 491 744 1 516 1 011
Office, accounting and computing machinery 10 20 49 631 23 23 96Electrical machinery and apparatus 30 138 111 340 66 327 372Radio, television and communication apparatus 62 186 263 520 655 1 166 544
Precision instruments 58 11 - - 20 28 29Motor vehicles and other transport equipment 286 223 1 151 1 880 1 147 1 601 1 809
Motor vehicles, trailers and semi-trailers 286 223 1 060 1 831 961 1 550 1 757Other transport equipment - - 91 49 186 51 51
Other manufacturing 43 43 44 - - 41 68Recycling - - - - - 33 1
Tertiary 5 815 12 818 20 362 20 147 24 139 12 547 10 585Electricity, gas and water 1 626 3 554 2 292 2 970 3 046 1 470 1 629
Collection, purification and distribution of water - - 90 - 74 28 95Unspecified electricity, gas and water 1 626 3 554 2 202 2 970 2 972 1 442 1 534
Construction - 53 171 294 12 264 148Trade 629 952 2 198 2 926 1 635 1 634 1 505
Automotive trade and repair 16 177 - 262 88 189 71 Wholesale trade 207 691 1 089 1 550 886 545 571Distributive trade 406 85 1 109 1 114 660 900 863
Hotels and restaurants 36 - 21 26 - 275 126Transport, storage and communications 819 831 2 645 7 920 10 979 4 276 4 337
Transport and storage 208 - 80 123 82 146 147 Land transport including pipelines 208 - - 85 44 31 24 Water transport - - 55 - - 38 15 Air transport - - - 11 - 1 6
Supporting and auxilary transport activities - - 25 27 38 75 103Post and communications 611 831 2 565 7 797 10 897 4 130 4 190
Finance 564 1 847 6 439 2 275 6 398 2 751 1 486Financial Intermediation 379 1 596 5 916 1 677 6 352 1 975 1 172Insurance and Pension Funding 148 191 46 64 14 628 216Activities Auxiliary to Financial Intermediation 36 60 477 534 32 148 99
Business activities 2 126 5 551 6 596 3 504 1 957 1 611 1 249Real estate 83 40 26 84 21 187 197Rental Activities 17 35 - - - 6 35Computer and related activities 11 125 353 86 1 121 720 225Research and development - - - - - 1 1Unspecified business activities 2 016 5 351 6 217 3 335 815 697 791
Education - - - - - 12 32Health and social services - - - - - 7 9Community, social and personal service activities 14 29 - 233 113 246 64
Sewage and waste disposal, sanitation activities - - - - 34 26 9Membership Organizations N.E.C. 14 - - - 24 - -Recreational, cultural and sporting activities - 29 - 233 54 220 55
Other services - - - - - 2 1Unspecified 1 979 2 568 3 075 3 663 3 455 - -
Source : Central Bank of Brazil website (www.bcb.gov.br).
Note: 'Unspecified' includes amounts under $10 million not allocated by sector.

Table 6. FDI flows in the host economy, by geographical origin, 1990-2002
(Millions of dollars)
Region/economy 1990 1991 1992 1993 1994 1996 1997 1998 1999 2000 2001 2002Total world 910.3 1 076.9 2 061.0 1 292.0 3 072.0 9 644.0 17 879.0 26 346.0 31 235.0 33 331.0 21 041.7 18 778.3
Developed countries 837.0 986.9 1 664.2 896.9 2 295.5 5 524.9 9 719.6 20 003.1 24 173.3 25 825.1 16 751.2 14 378.6Western Europe 170.8 353.0 481.0 431.7 761.2 3 238.8 4 928.9 14 754.2 15 366.0 19 848.9 11 003.3 10 257.2
European Union 164.2 325.3 374.5 409.0 734.2 3 130.0 4 847.8 14 537.2 14 961.5 19 542.0 10 582.9 9 816.1Austria 0.9 4.2 4.8 1.5 9.7 - - - - - 67.0 34.5Belgium - - 36.0 4.7 1.1 111.5 135.6 950.4 62.2 384.5 113.1 45.3Denmark 11.9 2.1 7.1 - 0.4 2.4 - - - - - 33.2 92.7Finland 1.5 - 5.2 - 4.1 0.4 0.1 - - - - - 12.7 3.8France 77.6 87.1 44.7 37.4 104.3 969.9 1 235.3 1 805.4 1 982.1 1 909.7 1 912.8 1 815.0Germany 103.4 35.2 53.1 16.2 130.1 212.0 195.9 412.8 480.8 374.6 1 047.5 628.3Greece - - - - - - - - - - 0.6 0.6Ireland 1.0 0.0 0.6 4.2 32.1 - - - - - 9.0 53.2Italy 3.3 10.1 - 93.5 81.6 30.1 12.3 57.4 646.6 408.5 488.0 281.3 472.5Luxembourg - - - 56.5 7.5 32.4 290.7 57.7 114.5 289.7 1 027.2 284.7 1 012.8Netherlands - 250.1 137.3 176.4 73.7 - 63.7 526.8 1 487.9 3 365.0 2 042.5 2 228.0 1 891.8 3 372.5Portugal 1.1 0.9 1.0 9.6 65.4 202.7 681.0 1 755.1 2 409.4 2 514.8 1 692.3 1 018.8Spain 12.9 8.3 20.7 16.8 - 3.4 586.6 545.8 5 120.2 5 702.2 9 592.9 2 766.6 586.9Sweden 21.0 0.8 - 30.2 2.5 9.3 126.0 268.6 239.2 315.3 628.6 54.3 204.9United Kingdom 90.2 - 14.8 214.4 153.2 384.2 91.5 182.5 127.9 1 268.8 393.7 416.2 474.4
Other Western Europe 6.5 27.7 106.5 22.7 27.1 108.8 81.2 217.0 404.5 306.8 420.4 441.1Gibraltar - - - - 0.2 - - - - - 89.2 19.8Liechtenstein - - 39.5 0.4 0.8 - - - - - 61.9 11.6Malta - - 0.2 - - - - - - - 0.1 -Monaco - - - - 0.1 - - - - - 4.2 2.3Norway 6.0 1.3 - - 3.7 0.2 - - - - - 83.1 60.0Switzerland - 28.5 24.6 66.8 26.0 25.7 108.8 81.2 217.0 404.5 306.8 181.8 347.4
North America 501.4 470.1 1 124.5 467.9 1 497.6 2 093.9 4 448.5 4 971.1 8 533.0 5 591.5 4 906.0 3 603.9Canada 356.9 8.6 115.7 - 4.6 21.0 118.5 66.2 278.6 445.4 192.8 441.1 989.3United States 144.5 461.5 1 008.8 472.5 1 476.7 1 975.4 4 382.3 4 692.5 8 087.6 5 398.7 4 464.9 2 614.6
Other developed countries 164.9 163.8 58.8 - 2.7 36.7 192.2 342.1 277.8 274.3 384.7 841.9 517.5Australia - - 6.7 - 5.5 - - - - - 10.7 4.0Israel - - 0.4 - 0.2 - - - - - - 4.6 9.1Japan 164.7 163.6 51.2 - 2.6 30.9 192.2 342.1 277.8 274.3 384.7 826.6 504.5New Zealand 0.2 0.2 0.5 0.1 0.2 - - - - - 0.0 -
Developing economies 73.2 90.0 388.4 394.0 763.6 1 974.6 5 324.9 2 562.3 2 970.6 3 120.5 4 289.7 4 398.9Africa 0.0 0.1 0.4 0.1 0.2 - - - - - 7.3 9.1
North Africa - - - - - - - - - - 0.3 0.1Libyan Arab Jamahiriya - - - - - - - - - - 0.3 0.1
Other Africa 0.0 0.1 0.4 0.1 0.2 - - - - - 7.0 9.0Angola - - - - - - - - - - 0.5 2.9Liberia 0.0 0.1 0.4 0.1 0.2 - - - - - 0.1 0.1Mauritius - - - - - - - - - - 0.7 0.4Seychelles - - - - - - - - - - - 0.1South Africa - - - - - - - - - - 5.7 5.6Zimbabwe - - - - - - - - - - 0.0 -
Latin America and the Caribbean 59.6 84.8 333.3 394.2 761.8 1 911.3 5 233.5 2 508.3 2 923.5 3 095.5 4 156.1 4 321.6South America 1.6 2.8 85.2 29.7 300.3 111.3 243.0 193.9 128.8 312.2 307.6 382.4
Argentina 0.1 2.2 10.7 2.3 23.5 30.1 186.9 113.3 87.8 112.7 56.8 88.5Brazil - - 6.6 24.1 266.9 - - - - - - -Chile 0.2 0.1 2.4 0.1 0.3 - - - - - 62.0 46.9Colombia - - - - 0.3 - - - - - 1.3 1.1Ecuador - - - - - - - - - - 2.3 0.5Guyana - - - - - - - - - - 0.2 0.1Paraguay - - 35.4 0.3 - 6.2 - - - - - 1.2 3.6Peru - - - - - - - - - - - 0.5Uruguay 1.3 0.3 23.2 2.3 17.4 81.2 56.1 80.6 41.0 199.5 180.6 237.5Venezuela - 0.2 6.8 0.8 - 1.8 - - - - - 3.2 3.7
Other Latin America and Caribbean 58.0 82.0 248.1 364.5 461.5 1 800.0 4 990.5 2 314.4 2 794.7 2 783.3 3 845.4 3 935.2Antigua and Barbuda - - - - - - - - - - 11.2 13.0Aruba - - - - - - - - - - - 0.2Bahamas - - 79.8 57.7 273.9 74.3 300.1 143.8 148.6 180.7 264.2 204.9Barbados - - - 0.3 10.6 - - - - - 4.8 1.6Belize - - - - - - - - - - - 0.7Bermuda 1.3 1.0 6.7 3.5 18.2 33.8 241.1 53.6 242.6 315.4 606.9 1 468.8British Virgin Islands - - 0.7 2.6 81.3 - - - - - 911.9 500.5Cayman Islands 15.1 15.3 110.4 291.2 68.4 655.7 3 382.9 1 807.1 2 114.5 2 034.5 1 755.1 1 554.5Costa Rica - - - - - - - - - - 0.1 -Cuba - - - - - - - - - - 0.3 0.2Guatemala - - - - - - - - - - 0.2 -Mexico - 0.1 - 0.5 - 2.5 - - - - - 61.1 24.4Netherlands Antilles 33.7 45.1 - 30.6 - 0.1 28.7 - - - - - 95.1 19.0Panama - 24.6 3.9 73.9 4.9 - 20.6 674.8 904.0 152.7 89.7 21.4 133.0 146.4Puerto Rico - - - - - - - - - - 0.1 0.1US Virgin Islands - - 7.0 1.3 1.3 - - - - - - -Virgin Islands - - - - - 361.4 162.4 157.1 199.3 231.3 - -
Asia 13.6 5.1 54.7 - 0.4 1.6 63.3 91.3 54.0 47.1 25.0 125.4 67.6West Asia 12.0 5.0 53.6 - - - - - - - 2.1 2.7
Bahrain 12.0 5.0 - - - - - - - - - -Cyprus 0.0 - - - - - - - - - 0.6 0.5Jordan - - - - - - - - - - 1.1 0.2
/…
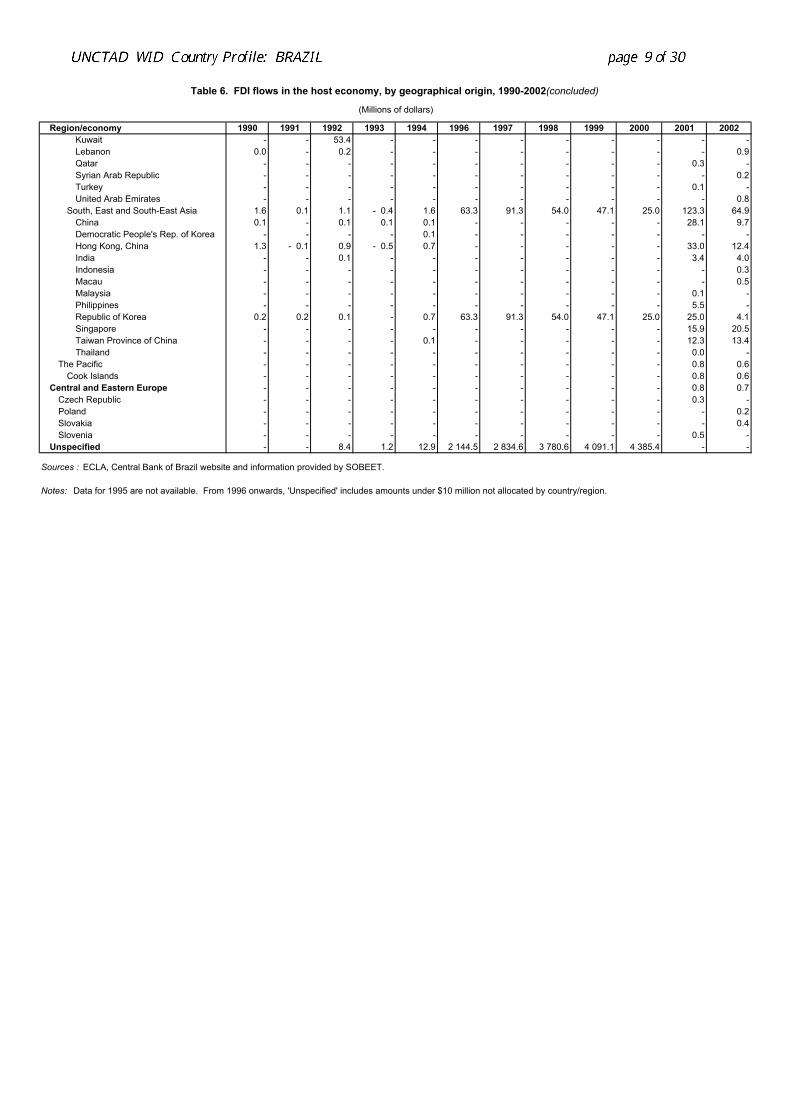
Table 6. FDI flows in the host economy, by geographical origin, 1990-2002(concluded)
(Millions of dollars)
Region/economy 1990 1991 1992 1993 1994 1996 1997 1998 1999 2000 2001 2002Kuwait - - 53.4 - - - - - - - - -Lebanon 0.0 - 0.2 - - - - - - - - 0.9Qatar - - - - - - - - - - 0.3 -Syrian Arab Republic - - - - - - - - - - - 0.2Turkey - - - - - - - - - - 0.1 -United Arab Emirates - - - - - - - - - - - 0.8
South, East and South-East Asia 1.6 0.1 1.1 - 0.4 1.6 63.3 91.3 54.0 47.1 25.0 123.3 64.9China 0.1 - 0.1 0.1 0.1 - - - - - 28.1 9.7Democratic People's Rep. of Korea - - - - 0.1 - - - - - - -Hong Kong, China 1.3 - 0.1 0.9 - 0.5 0.7 - - - - - 33.0 12.4India - - 0.1 - - - - - - - 3.4 4.0Indonesia - - - - - - - - - - - 0.3Macau - - - - - - - - - - - 0.5Malaysia - - - - - - - - - - 0.1 -Philippines - - - - - - - - - - 5.5 -Republic of Korea 0.2 0.2 0.1 - 0.7 63.3 91.3 54.0 47.1 25.0 25.0 4.1Singapore - - - - - - - - - - 15.9 20.5Taiwan Province of China - - - - 0.1 - - - - - 12.3 13.4Thailand - - - - - - - - - - 0.0 -
The Pacific - - - - - - - - - - 0.8 0.6Cook Islands - - - - - - - - - - 0.8 0.6
Central and Eastern Europe - - - - - - - - - - 0.8 0.7Czech Republic - - - - - - - - - - 0.3 -Poland - - - - - - - - - - - 0.2Slovakia - - - - - - - - - - - 0.4Slovenia - - - - - - - - - - 0.5 -
Unspecified - - 8.4 1.2 12.9 2 144.5 2 834.6 3 780.6 4 091.1 4 385.4 - -
Sources : ECLA, Central Bank of Brazil website and information provided by SOBEET.
Notes: Data for 1995 are not available. From 1996 onwards, 'Unspecified' includes amounts under $10 million not allocated by country/region.
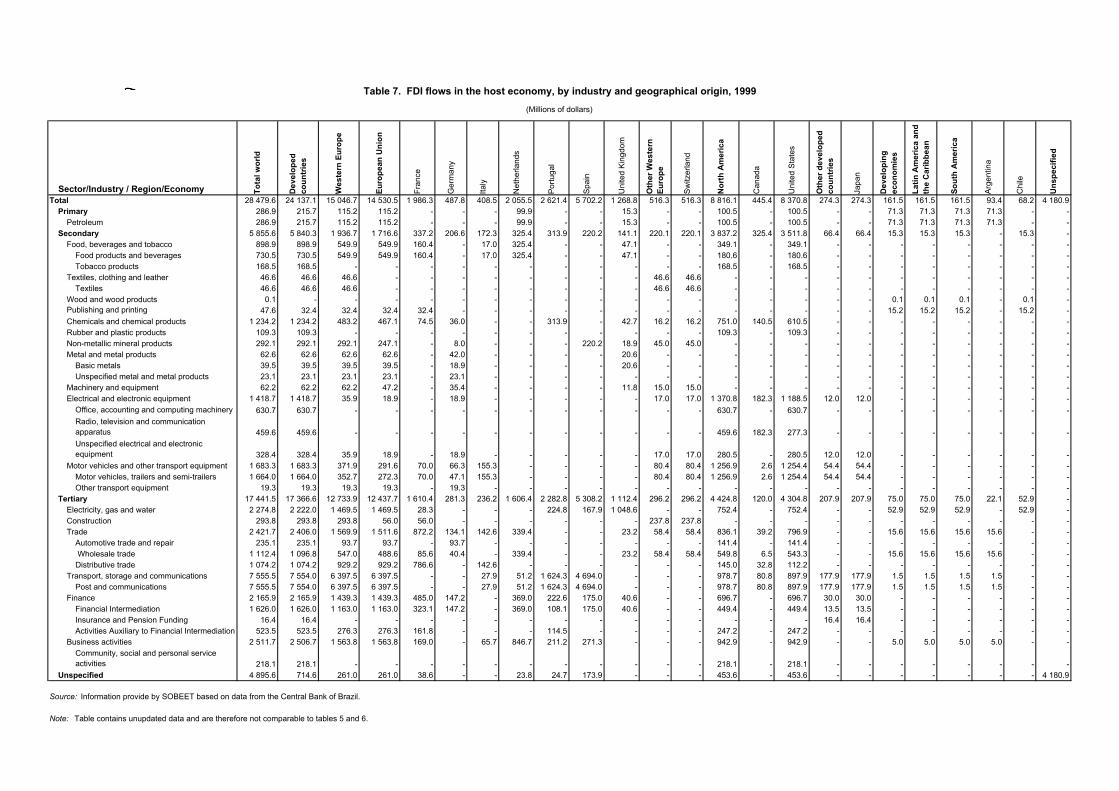
Table 7. FDI flows in the host economy, by industry and geographical origin, 1999(Millions of dollars)
Sector/Industry / Region/Economy Tota
l wor
ld
Dev
elop
ed
coun
trie
s
Wes
tern
Eur
ope
Euro
pean
Uni
on
Fran
ce
Ger
man
y
Italy
Net
herla
nds
Portu
gal
Spai
n
Uni
ted
King
dom
Oth
er W
este
rn
Euro
pe
Switz
erla
nd
Nor
th A
mer
ica
Can
ada
Uni
ted
Stat
es
Oth
er d
evel
oped
co
untr
ies
Japa
n
Dev
elop
ing
econ
omie
s
Latin
Am
eric
a an
d th
e C
arib
bean
Sout
h A
mer
ica
Arge
ntin
a
Chi
le
Uns
peci
fied
Total 28 479.6 24 137.1 15 046.7 14 530.5 1 986.3 487.8 408.5 2 055.5 2 621.4 5 702.2 1 268.8 516.3 516.3 8 816.1 445.4 8 370.8 274.3 274.3 161.5 161.5 161.5 93.4 68.2 4 180.9Primary 286.9 215.7 115.2 115.2 - - - 99.9 - - 15.3 - - 100.5 - 100.5 - - 71.3 71.3 71.3 71.3 - -
Petroleum 286.9 215.7 115.2 115.2 - - - 99.9 - - 15.3 - - 100.5 - 100.5 - - 71.3 71.3 71.3 71.3 - -Secondary 5 855.6 5 840.3 1 936.7 1 716.6 337.2 206.6 172.3 325.4 313.9 220.2 141.1 220.1 220.1 3 837.2 325.4 3 511.8 66.4 66.4 15.3 15.3 15.3 - 15.3 -
Food, beverages and tobacco 898.9 898.9 549.9 549.9 160.4 - 17.0 325.4 - - 47.1 - - 349.1 - 349.1 - - - - - - - -Food products and beverages 730.5 730.5 549.9 549.9 160.4 - 17.0 325.4 - - 47.1 - - 180.6 - 180.6 - - - - - - - -Tobacco products 168.5 168.5 - - - - - - - - - - - 168.5 - 168.5 - - - - - - - -
Textiles, clothing and leather 46.6 46.6 46.6 - - - - - - - - 46.6 46.6 - - - - - - - - - - -Textiles 46.6 46.6 46.6 - - - - - - - - 46.6 46.6 - - - - - - - - - - -
Wood and wood products 0.1 - - - - - - - - - - - - - - - - - 0.1 0.1 0.1 - 0.1 -Publishing and printing 47.6 32.4 32.4 32.4 32.4 - - - - - - - - - - - - - 15.2 15.2 15.2 - 15.2 -Chemicals and chemical products 1 234.2 1 234.2 483.2 467.1 74.5 36.0 - - 313.9 - 42.7 16.2 16.2 751.0 140.5 610.5 - - - - - - - -Rubber and plastic products 109.3 109.3 - - - - - - - - - - - 109.3 - 109.3 - - - - - - - -Non-metallic mineral products 292.1 292.1 292.1 247.1 - 8.0 - - - 220.2 18.9 45.0 45.0 - - - - - - - - - - -Metal and metal products 62.6 62.6 62.6 62.6 - 42.0 - - - - 20.6 - - - - - - - - - - - - -
Basic metals 39.5 39.5 39.5 39.5 - 18.9 - - - - 20.6 - - - - - - - - - - - - -Unspecified metal and metal products 23.1 23.1 23.1 23.1 - 23.1 - - - - - - - - - - - - - - - - - -
Machinery and equipment 62.2 62.2 62.2 47.2 - 35.4 - - - - 11.8 15.0 15.0 - - - - - - - - - - -Electrical and electronic equipment 1 418.7 1 418.7 35.9 18.9 - 18.9 - - - - - 17.0 17.0 1 370.8 182.3 1 188.5 12.0 12.0 - - - - - -
Office, accounting and computing machinery 630.7 630.7 - - - - - - - - - - - 630.7 - 630.7 - - - - - - - -Radio, television and communication apparatus 459.6 459.6 - - - - - - - - - - - 459.6 182.3 277.3 - - - - - - - -Unspecified electrical and electronic equipment 328.4 328.4 35.9 18.9 - 18.9 - - - - - 17.0 17.0 280.5 - 280.5 12.0 12.0 - - - - - -
Motor vehicles and other transport equipment 1 683.3 1 683.3 371.9 291.6 70.0 66.3 155.3 - - - - 80.4 80.4 1 256.9 2.6 1 254.4 54.4 54.4 - - - - - -Motor vehicles, trailers and semi-trailers 1 664.0 1 664.0 352.7 272.3 70.0 47.1 155.3 - - - - 80.4 80.4 1 256.9 2.6 1 254.4 54.4 54.4 - - - - - -Other transport equipment 19.3 19.3 19.3 19.3 - 19.3 - - - - - - - - - - - - - - - - - -
Tertiary 17 441.5 17 366.6 12 733.9 12 437.7 1 610.4 281.3 236.2 1 606.4 2 282.8 5 308.2 1 112.4 296.2 296.2 4 424.8 120.0 4 304.8 207.9 207.9 75.0 75.0 75.0 22.1 52.9 -Electricity, gas and water 2 274.8 2 222.0 1 469.5 1 469.5 28.3 - - - 224.8 167.9 1 048.6 - - 752.4 - 752.4 - - 52.9 52.9 52.9 - 52.9 -Construction 293.8 293.8 293.8 56.0 56.0 - - - - - - 237.8 237.8 - - - - - - - - - - -Trade 2 421.7 2 406.0 1 569.9 1 511.6 872.2 134.1 142.6 339.4 - - 23.2 58.4 58.4 836.1 39.2 796.9 - - 15.6 15.6 15.6 15.6 - -
Automotive trade and repair 235.1 235.1 93.7 93.7 - 93.7 - - - - - - - 141.4 - 141.4 - - - - - - - - Wholesale trade 1 112.4 1 096.8 547.0 488.6 85.6 40.4 - 339.4 - - 23.2 58.4 58.4 549.8 6.5 543.3 - - 15.6 15.6 15.6 15.6 - -Distributive trade 1 074.2 1 074.2 929.2 929.2 786.6 - 142.6 - - - - - - 145.0 32.8 112.2 - - - - - - - -
Transport, storage and communications 7 555.5 7 554.0 6 397.5 6 397.5 - - 27.9 51.2 1 624.3 4 694.0 - - - 978.7 80.8 897.9 177.9 177.9 1.5 1.5 1.5 1.5 - -Post and communications 7 555.5 7 554.0 6 397.5 6 397.5 - - 27.9 51.2 1 624.3 4 694.0 - - - 978.7 80.8 897.9 177.9 177.9 1.5 1.5 1.5 1.5 - -
Finance 2 165.9 2 165.9 1 439.3 1 439.3 485.0 147.2 - 369.0 222.6 175.0 40.6 - - 696.7 - 696.7 30.0 30.0 - - - - - -Financial Intermediation 1 626.0 1 626.0 1 163.0 1 163.0 323.1 147.2 - 369.0 108.1 175.0 40.6 - - 449.4 - 449.4 13.5 13.5 - - - - - -Insurance and Pension Funding 16.4 16.4 - - - - - - - - - - - - - - 16.4 16.4 - - - - - -Activities Auxiliary to Financial Intermediation 523.5 523.5 276.3 276.3 161.8 - - - 114.5 - - - - 247.2 - 247.2 - - - - - - - -
Business activities 2 511.7 2 506.7 1 563.8 1 563.8 169.0 - 65.7 846.7 211.2 271.3 - - - 942.9 - 942.9 - - 5.0 5.0 5.0 5.0 - -Community, social and personal service activities 218.1 218.1 - - - - - - - - - - - 218.1 - 218.1 - - - - - - - -
Unspecified 4 895.6 714.6 261.0 261.0 38.6 - - 23.8 24.7 173.9 - - - 453.6 - 453.6 - - - - - - - 4 180.9
Source: Information provide by SOBEET based on data from the Central Bank of Brazil.
Note: Table contains unupdated data and are therefore not comparable to tables 5 and 6.
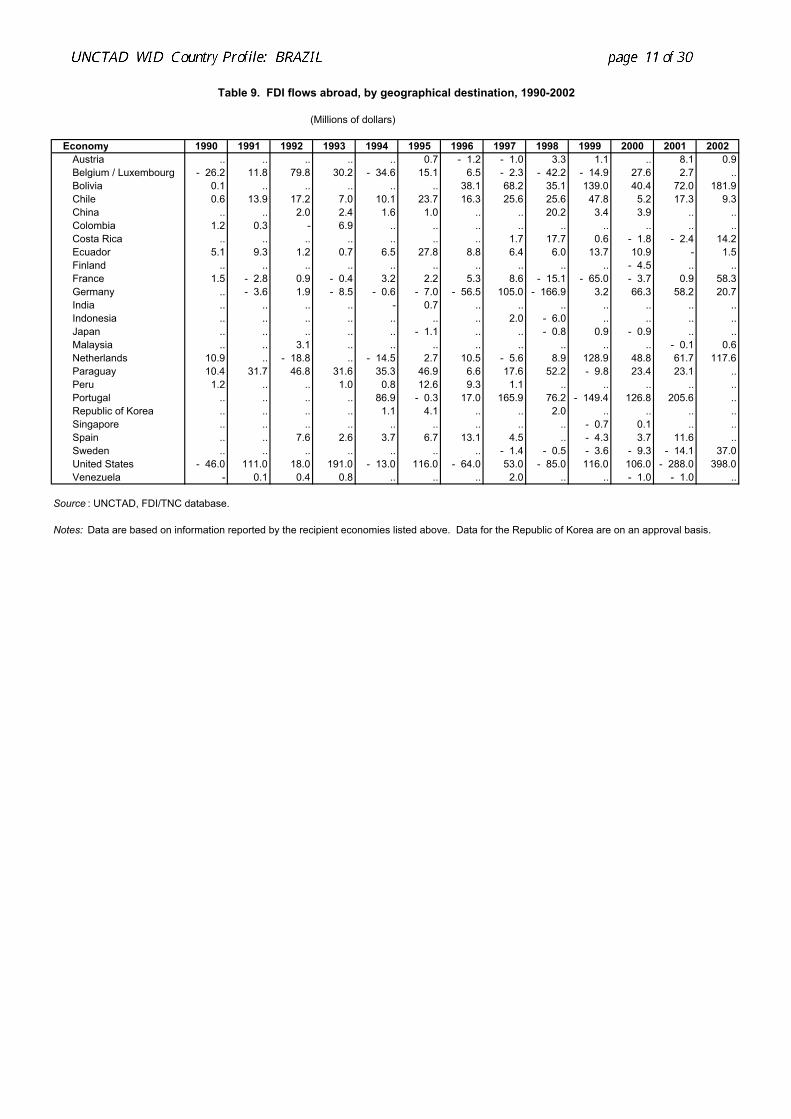
Table 9. FDI flows abroad, by geographical destination, 1990-2002
(Millions of dollars)
Economy 1990 1991 1992 1993 1994 1995 1996 1997 1998 1999 2000 2001 2002Austria .. .. .. .. .. 0.7 - 1.2 - 1.0 3.3 1.1 .. 8.1 0.9Belgium / Luxembourg - 26.2 11.8 79.8 30.2 - 34.6 15.1 6.5 - 2.3 - 42.2 - 14.9 27.6 2.7 ..Bolivia 0.1 .. .. .. .. .. 38.1 68.2 35.1 139.0 40.4 72.0 181.9Chile 0.6 13.9 17.2 7.0 10.1 23.7 16.3 25.6 25.6 47.8 5.2 17.3 9.3China .. .. 2.0 2.4 1.6 1.0 .. .. 20.2 3.4 3.9 .. ..Colombia 1.2 0.3 - 6.9 .. .. .. .. .. .. .. .. ..Costa Rica .. .. .. .. .. .. .. 1.7 17.7 0.6 - 1.8 - 2.4 14.2Ecuador 5.1 9.3 1.2 0.7 6.5 27.8 8.8 6.4 6.0 13.7 10.9 - 1.5Finland .. .. .. .. .. .. .. .. .. .. - 4.5 .. ..France 1.5 - 2.8 0.9 - 0.4 3.2 2.2 5.3 8.6 - 15.1 - 65.0 - 3.7 0.9 58.3Germany .. - 3.6 1.9 - 8.5 - 0.6 - 7.0 - 56.5 105.0 - 166.9 3.2 66.3 58.2 20.7India .. .. .. .. - 0.7 .. .. .. .. .. .. ..Indonesia .. .. .. .. .. .. .. 2.0 - 6.0 .. .. .. ..Japan .. .. .. .. .. - 1.1 .. .. - 0.8 0.9 - 0.9 .. ..Malaysia .. .. 3.1 .. .. .. .. .. .. .. .. - 0.1 0.6Netherlands 10.9 .. - 18.8 .. - 14.5 2.7 10.5 - 5.6 8.9 128.9 48.8 61.7 117.6Paraguay 10.4 31.7 46.8 31.6 35.3 46.9 6.6 17.6 52.2 - 9.8 23.4 23.1 ..Peru 1.2 .. .. 1.0 0.8 12.6 9.3 1.1 .. .. .. .. ..Portugal .. .. .. .. 86.9 - 0.3 17.0 165.9 76.2 - 149.4 126.8 205.6 ..Republic of Korea .. .. .. .. 1.1 4.1 .. .. 2.0 .. .. .. ..Singapore .. .. .. .. .. .. .. .. .. - 0.7 0.1 .. ..Spain .. .. 7.6 2.6 3.7 6.7 13.1 4.5 .. - 4.3 3.7 11.6 ..Sweden .. .. .. .. .. .. .. - 1.4 - 0.5 - 3.6 - 9.3 - 14.1 37.0United States - 46.0 111.0 18.0 191.0 - 13.0 116.0 - 64.0 53.0 - 85.0 116.0 106.0 - 288.0 398.0Venezuela - 0.1 0.4 0.8 .. .. .. 2.0 .. .. - 1.0 - 1.0 ..
Source : UNCTAD, FDI/TNC database.
Notes: Data are based on information reported by the recipient economies listed above. Data for the Republic of Korea are on an approval basis.
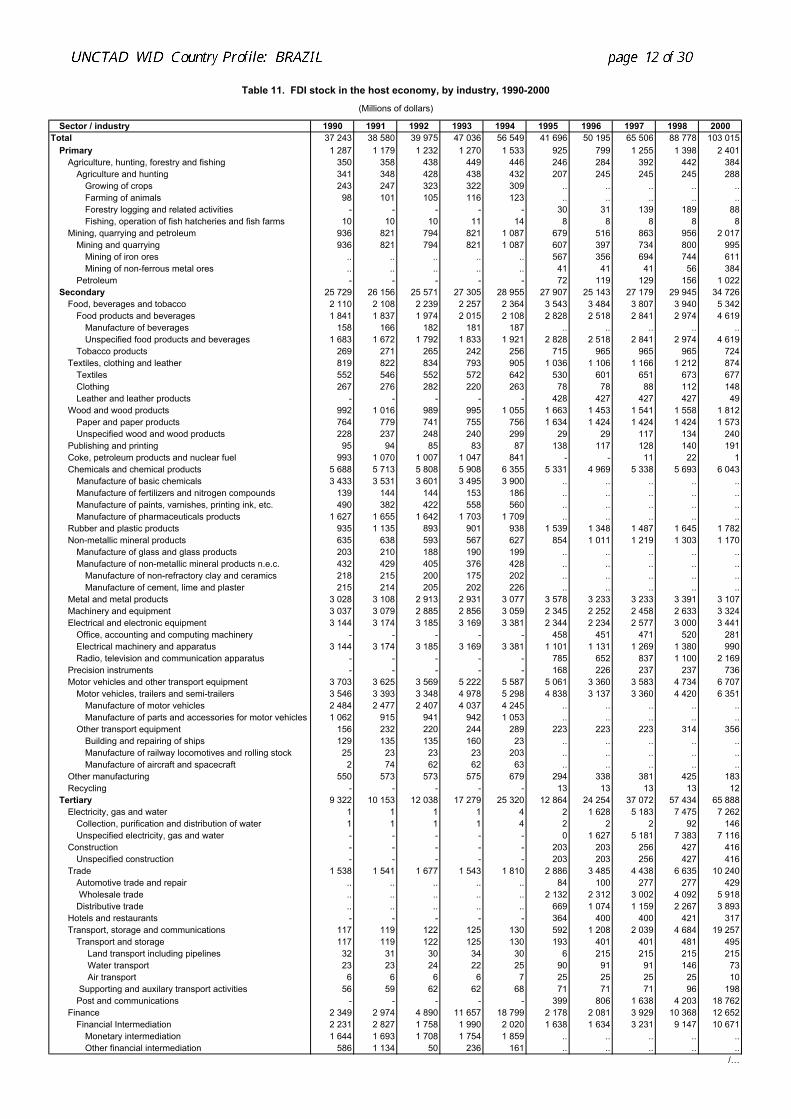
Table 11. FDI stock in the host economy, by industry, 1990-2000(Millions of dollars)
Sector / industry 1990 1991 1992 1993 1994 1995 1996 1997 1998 2000Total 37 243 38 580 39 975 47 036 56 549 41 696 50 195 65 506 88 778 103 015
Primary 1 287 1 179 1 232 1 270 1 533 925 799 1 255 1 398 2 401Agriculture, hunting, forestry and fishing 350 358 438 449 446 246 284 392 442 384
Agriculture and hunting 341 348 428 438 432 207 245 245 245 288Growing of crops 243 247 323 322 309 .. .. .. .. ..Farming of animals 98 101 105 116 123 .. .. .. .. ..Forestry logging and related activities - - - - - 30 31 139 189 88Fishing, operation of fish hatcheries and fish farms 10 10 10 11 14 8 8 8 8 8
Mining, quarrying and petroleum 936 821 794 821 1 087 679 516 863 956 2 017Mining and quarrying 936 821 794 821 1 087 607 397 734 800 995
Mining of iron ores .. .. .. .. .. 567 356 694 744 611Mining of non-ferrous metal ores .. .. .. .. .. 41 41 41 56 384
Petroleum - - - - - 72 119 129 156 1 022Secondary 25 729 26 156 25 571 27 305 28 955 27 907 25 143 27 179 29 945 34 726
Food, beverages and tobacco 2 110 2 108 2 239 2 257 2 364 3 543 3 484 3 807 3 940 5 342Food products and beverages 1 841 1 837 1 974 2 015 2 108 2 828 2 518 2 841 2 974 4 619
Manufacture of beverages 158 166 182 181 187 .. .. .. .. ..Unspecified food products and beverages 1 683 1 672 1 792 1 833 1 921 2 828 2 518 2 841 2 974 4 619
Tobacco products 269 271 265 242 256 715 965 965 965 724Textiles, clothing and leather 819 822 834 793 905 1 036 1 106 1 166 1 212 874
Textiles 552 546 552 572 642 530 601 651 673 677Clothing 267 276 282 220 263 78 78 88 112 148Leather and leather products - - - - - 428 427 427 427 49
Wood and wood products 992 1 016 989 995 1 055 1 663 1 453 1 541 1 558 1 812Paper and paper products 764 779 741 755 756 1 634 1 424 1 424 1 424 1 573Unspecified wood and wood products 228 237 248 240 299 29 29 117 134 240
Publishing and printing 95 94 85 83 87 138 117 128 140 191Coke, petroleum products and nuclear fuel 993 1 070 1 007 1 047 841 - - 11 22 1Chemicals and chemical products 5 688 5 713 5 808 5 908 6 355 5 331 4 969 5 338 5 693 6 043
Manufacture of basic chemicals 3 433 3 531 3 601 3 495 3 900 .. .. .. .. ..Manufacture of fertilizers and nitrogen compounds 139 144 144 153 186 .. .. .. .. ..Manufacture of paints, varnishes, printing ink, etc. 490 382 422 558 560 .. .. .. .. ..Manufacture of pharmaceuticals products 1 627 1 655 1 642 1 703 1 709 .. .. .. .. ..
Rubber and plastic products 935 1 135 893 901 938 1 539 1 348 1 487 1 645 1 782Non-metallic mineral products 635 638 593 567 627 854 1 011 1 219 1 303 1 170
Manufacture of glass and glass products 203 210 188 190 199 .. .. .. .. ..Manufacture of non-metallic mineral products n.e.c. 432 429 405 376 428 .. .. .. .. ..
Manufacture of non-refractory clay and ceramics 218 215 200 175 202 .. .. .. .. ..Manufacture of cement, lime and plaster 215 214 205 202 226 .. .. .. .. ..
Metal and metal products 3 028 3 108 2 913 2 931 3 077 3 578 3 233 3 233 3 391 3 107Machinery and equipment 3 037 3 079 2 885 2 856 3 059 2 345 2 252 2 458 2 633 3 324Electrical and electronic equipment 3 144 3 174 3 185 3 169 3 381 2 344 2 234 2 577 3 000 3 441
Office, accounting and computing machinery - - - - - 458 451 471 520 281Electrical machinery and apparatus 3 144 3 174 3 185 3 169 3 381 1 101 1 131 1 269 1 380 990Radio, television and communication apparatus - - - - - 785 652 837 1 100 2 169
Precision instruments - - - - - 168 226 237 237 736Motor vehicles and other transport equipment 3 703 3 625 3 569 5 222 5 587 5 061 3 360 3 583 4 734 6 707
Motor vehicles, trailers and semi-trailers 3 546 3 393 3 348 4 978 5 298 4 838 3 137 3 360 4 420 6 351Manufacture of motor vehicles 2 484 2 477 2 407 4 037 4 245 .. .. .. .. ..Manufacture of parts and accessories for motor vehicles 1 062 915 941 942 1 053 .. .. .. .. ..
Other transport equipment 156 232 220 244 289 223 223 223 314 356Building and repairing of ships 129 135 135 160 23 .. .. .. .. ..Manufacture of railway locomotives and rolling stock 25 23 23 23 203 .. .. .. .. ..Manufacture of aircraft and spacecraft 2 74 62 62 63 .. .. .. .. ..
Other manufacturing 550 573 573 575 679 294 338 381 425 183Recycling - - - - - 13 13 13 13 12
Tertiary 9 322 10 153 12 038 17 279 25 320 12 864 24 254 37 072 57 434 65 888Electricity, gas and water 1 1 1 1 4 2 1 628 5 183 7 475 7 262
Collection, purification and distribution of water 1 1 1 1 4 2 2 2 92 146Unspecified electricity, gas and water - - - - - 0 1 627 5 181 7 383 7 116
Construction - - - - - 203 203 256 427 416Unspecified construction - - - - - 203 203 256 427 416
Trade 1 538 1 541 1 677 1 543 1 810 2 886 3 485 4 438 6 635 10 240Automotive trade and repair .. .. .. .. .. 84 100 277 277 429 Wholesale trade .. .. .. .. .. 2 132 2 312 3 002 4 092 5 918Distributive trade .. .. .. .. .. 669 1 074 1 159 2 267 3 893
Hotels and restaurants - - - - - 364 400 400 421 317Transport, storage and communications 117 119 122 125 130 592 1 208 2 039 4 684 19 257
Transport and storage 117 119 122 125 130 193 401 401 481 495 Land transport including pipelines 32 31 30 34 30 6 215 215 215 215 Water transport 23 23 24 22 25 90 91 91 146 73 Air transport 6 6 6 6 7 25 25 25 25 10
Supporting and auxilary transport activities 56 59 62 62 68 71 71 71 96 198Post and communications - - - - - 399 806 1 638 4 203 18 762
Finance 2 349 2 974 4 890 11 657 18 799 2 178 2 081 3 929 10 368 12 652Financial Intermediation 2 231 2 827 1 758 1 990 2 020 1 638 1 634 3 231 9 147 10 671
Monetary intermediation 1 644 1 693 1 708 1 754 1 859 .. .. .. .. ..Other financial intermediation 586 1 134 50 236 161 .. .. .. .. ..
/…
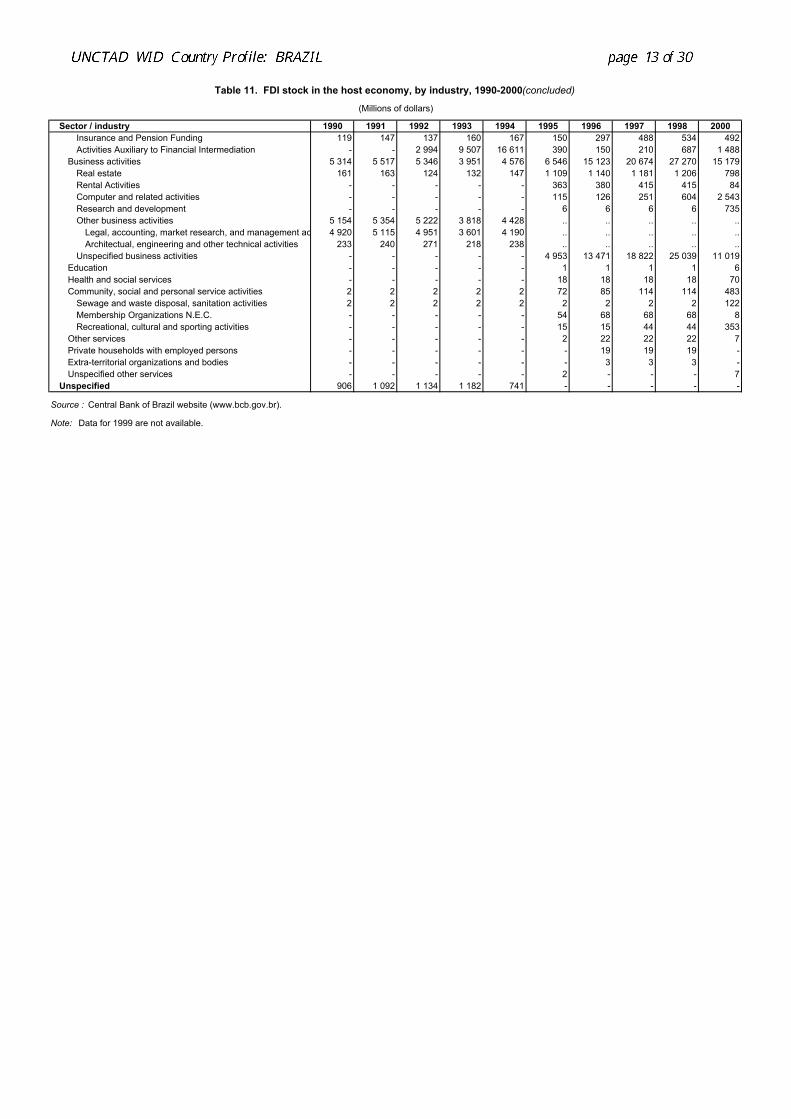
Table 11. FDI stock in the host economy, by industry, 1990-2000(concluded)
(Millions of dollars)
Sector / industry 1990 1991 1992 1993 1994 1995 1996 1997 1998 2000Insurance and Pension Funding 119 147 137 160 167 150 297 488 534 492Activities Auxiliary to Financial Intermediation - - 2 994 9 507 16 611 390 150 210 687 1 488
Business activities 5 314 5 517 5 346 3 951 4 576 6 546 15 123 20 674 27 270 15 179Real estate 161 163 124 132 147 1 109 1 140 1 181 1 206 798Rental Activities - - - - - 363 380 415 415 84Computer and related activities - - - - - 115 126 251 604 2 543Research and development - - - - - 6 6 6 6 735Other business activities 5 154 5 354 5 222 3 818 4 428 .. .. .. .. ..
Legal, accounting, market research, and management ac 4 920 5 115 4 951 3 601 4 190 .. .. .. .. ..Architectual, engineering and other technical activities 233 240 271 218 238 .. .. .. .. ..
Unspecified business activities - - - - - 4 953 13 471 18 822 25 039 11 019Education - - - - - 1 1 1 1 6Health and social services - - - - - 18 18 18 18 70Community, social and personal service activities 2 2 2 2 2 72 85 114 114 483
Sewage and waste disposal, sanitation activities 2 2 2 2 2 2 2 2 2 122Membership Organizations N.E.C. - - - - - 54 68 68 68 8Recreational, cultural and sporting activities - - - - - 15 15 44 44 353
Other services - - - - - 2 22 22 22 7Private households with employed persons - - - - - - 19 19 19 -Extra-territorial organizations and bodies - - - - - - 3 3 3 -Unspecified other services - - - - - 2 - - - 7
Unspecified 906 1 092 1 134 1 182 741 - - - - -
Source : Central Bank of Brazil website (www.bcb.gov.br).
Note: Data for 1999 are not available.
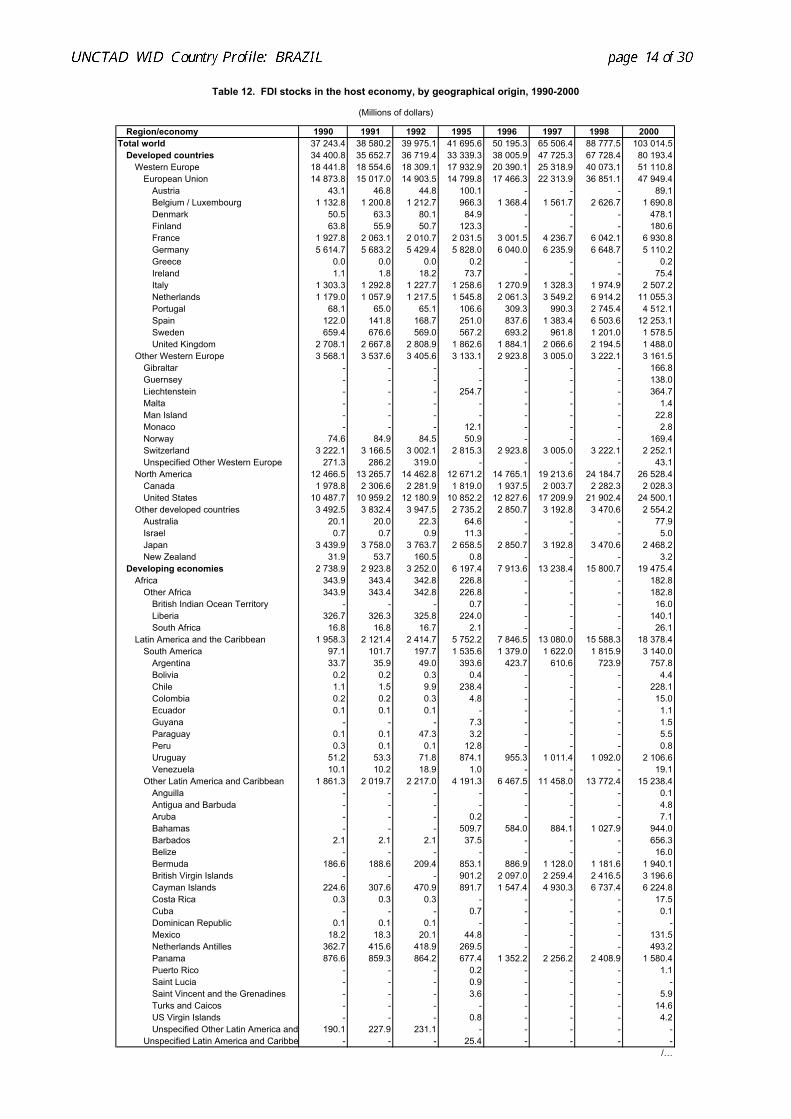
Table 12. FDI stocks in the host economy, by geographical origin, 1990-2000
(Millions of dollars)
Region/economy 1990 1991 1992 1995 1996 1997 1998 2000Total world 37 243.4 38 580.2 39 975.1 41 695.6 50 195.3 65 506.4 88 777.5 103 014.5
Developed countries 34 400.8 35 652.7 36 719.4 33 339.3 38 005.9 47 725.3 67 728.4 80 193.4Western Europe 18 441.8 18 554.6 18 309.1 17 932.9 20 390.1 25 318.9 40 073.1 51 110.8
European Union 14 873.8 15 017.0 14 903.5 14 799.8 17 466.3 22 313.9 36 851.1 47 949.4Austria 43.1 46.8 44.8 100.1 - - - 89.1Belgium / Luxembourg 1 132.8 1 200.8 1 212.7 966.3 1 368.4 1 561.7 2 626.7 1 690.8Denmark 50.5 63.3 80.1 84.9 - - - 478.1Finland 63.8 55.9 50.7 123.3 - - - 180.6France 1 927.8 2 063.1 2 010.7 2 031.5 3 001.5 4 236.7 6 042.1 6 930.8Germany 5 614.7 5 683.2 5 429.4 5 828.0 6 040.0 6 235.9 6 648.7 5 110.2Greece 0.0 0.0 0.0 0.2 - - - 0.2Ireland 1.1 1.8 18.2 73.7 - - - 75.4Italy 1 303.3 1 292.8 1 227.7 1 258.6 1 270.9 1 328.3 1 974.9 2 507.2Netherlands 1 179.0 1 057.9 1 217.5 1 545.8 2 061.3 3 549.2 6 914.2 11 055.3Portugal 68.1 65.0 65.1 106.6 309.3 990.3 2 745.4 4 512.1Spain 122.0 141.8 168.7 251.0 837.6 1 383.4 6 503.6 12 253.1Sweden 659.4 676.6 569.0 567.2 693.2 961.8 1 201.0 1 578.5United Kingdom 2 708.1 2 667.8 2 808.9 1 862.6 1 884.1 2 066.6 2 194.5 1 488.0
Other Western Europe 3 568.1 3 537.6 3 405.6 3 133.1 2 923.8 3 005.0 3 222.1 3 161.5Gibraltar - - - - - - - 166.8Guernsey - - - - - - - 138.0Liechtenstein - - - 254.7 - - - 364.7Malta - - - - - - - 1.4Man Island - - - - - - - 22.8Monaco - - - 12.1 - - - 2.8Norway 74.6 84.9 84.5 50.9 - - - 169.4Switzerland 3 222.1 3 166.5 3 002.1 2 815.3 2 923.8 3 005.0 3 222.1 2 252.1Unspecified Other Western Europe 271.3 286.2 319.0 - - - - 43.1
North America 12 466.5 13 265.7 14 462.8 12 671.2 14 765.1 19 213.6 24 184.7 26 528.4Canada 1 978.8 2 306.6 2 281.9 1 819.0 1 937.5 2 003.7 2 282.3 2 028.3United States 10 487.7 10 959.2 12 180.9 10 852.2 12 827.6 17 209.9 21 902.4 24 500.1
Other developed countries 3 492.5 3 832.4 3 947.5 2 735.2 2 850.7 3 192.8 3 470.6 2 554.2Australia 20.1 20.0 22.3 64.6 - - - 77.9Israel 0.7 0.7 0.9 11.3 - - - 5.0Japan 3 439.9 3 758.0 3 763.7 2 658.5 2 850.7 3 192.8 3 470.6 2 468.2New Zealand 31.9 53.7 160.5 0.8 - - - 3.2
Developing economies 2 738.9 2 923.8 3 252.0 6 197.4 7 913.6 13 238.4 15 800.7 19 475.4Africa 343.9 343.4 342.8 226.8 - - - 182.8
Other Africa 343.9 343.4 342.8 226.8 - - - 182.8British Indian Ocean Territory - - - 0.7 - - - 16.0Liberia 326.7 326.3 325.8 224.0 - - - 140.1South Africa 16.8 16.8 16.7 2.1 - - - 26.1
Latin America and the Caribbean 1 958.3 2 121.4 2 414.7 5 752.2 7 846.5 13 080.0 15 588.3 18 378.4South America 97.1 101.7 197.7 1 535.6 1 379.0 1 622.0 1 815.9 3 140.0
Argentina 33.7 35.9 49.0 393.6 423.7 610.6 723.9 757.8Bolivia 0.2 0.2 0.3 0.4 - - - 4.4Chile 1.1 1.5 9.9 238.4 - - - 228.1Colombia 0.2 0.2 0.3 4.8 - - - 15.0Ecuador 0.1 0.1 0.1 - - - - 1.1Guyana - - - 7.3 - - - 1.5Paraguay 0.1 0.1 47.3 3.2 - - - 5.5Peru 0.3 0.1 0.1 12.8 - - - 0.8Uruguay 51.2 53.3 71.8 874.1 955.3 1 011.4 1 092.0 2 106.6Venezuela 10.1 10.2 18.9 1.0 - - - 19.1
Other Latin America and Caribbean 1 861.3 2 019.7 2 217.0 4 191.3 6 467.5 11 458.0 13 772.4 15 238.4Anguilla - - - - - - - 0.1Antigua and Barbuda - - - - - - - 4.8Aruba - - - 0.2 - - - 7.1Bahamas - - - 509.7 584.0 884.1 1 027.9 944.0Barbados 2.1 2.1 2.1 37.5 - - - 656.3Belize - - - - - - - 16.0Bermuda 186.6 188.6 209.4 853.1 886.9 1 128.0 1 181.6 1 940.1British Virgin Islands - - - 901.2 2 097.0 2 259.4 2 416.5 3 196.6Cayman Islands 224.6 307.6 470.9 891.7 1 547.4 4 930.3 6 737.4 6 224.8Costa Rica 0.3 0.3 0.3 - - - - 17.5Cuba - - - 0.7 - - - 0.1Dominican Republic 0.1 0.1 0.1 - - - - -Mexico 18.2 18.3 20.1 44.8 - - - 131.5Netherlands Antilles 362.7 415.6 418.9 269.5 - - - 493.2Panama 876.6 859.3 864.2 677.4 1 352.2 2 256.2 2 408.9 1 580.4Puerto Rico - - - 0.2 - - - 1.1Saint Lucia - - - 0.9 - - - -Saint Vincent and the Grenadines - - - 3.6 - - - 5.9Turks and Caicos - - - - - - - 14.6US Virgin Islands - - - 0.8 - - - 4.2Unspecified Other Latin America and 190.1 227.9 231.1 - - - - -
Unspecified Latin America and Caribbe - - - 25.4 - - - -/…
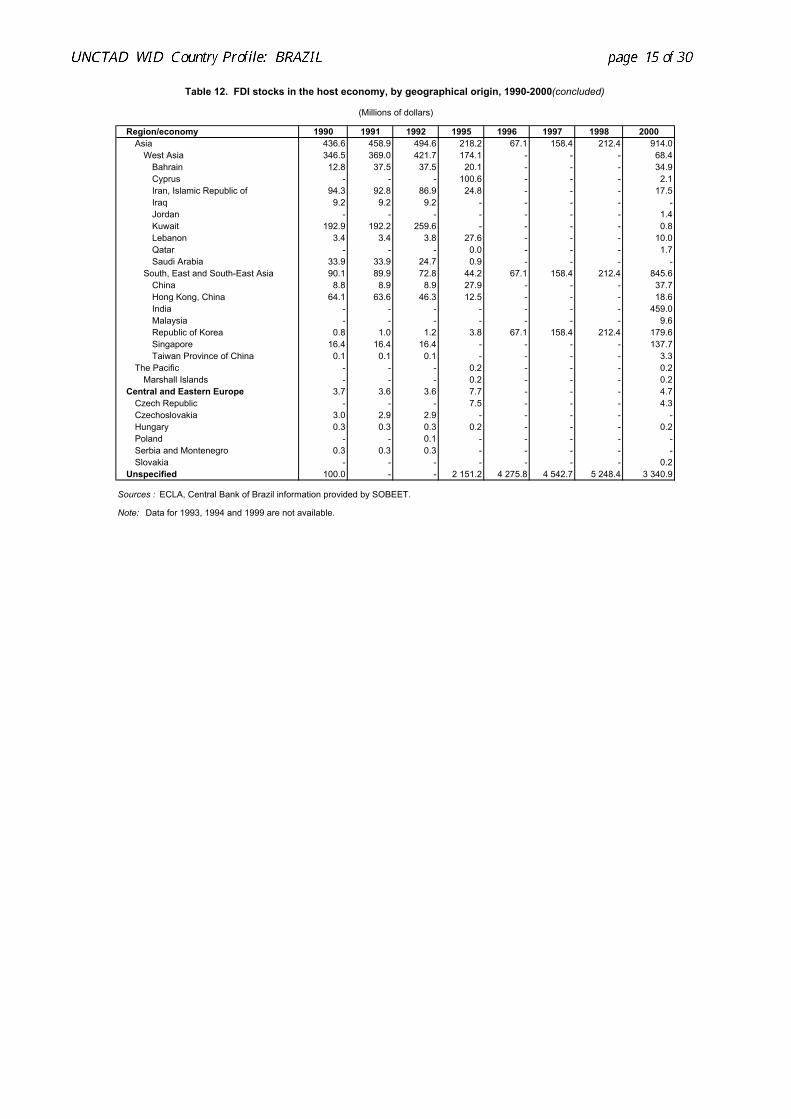
Table 12. FDI stocks in the host economy, by geographical origin, 1990-2000(concluded)
(Millions of dollars)
Region/economy 1990 1991 1992 1995 1996 1997 1998 2000Asia 436.6 458.9 494.6 218.2 67.1 158.4 212.4 914.0
West Asia 346.5 369.0 421.7 174.1 - - - 68.4Bahrain 12.8 37.5 37.5 20.1 - - - 34.9Cyprus - - - 100.6 - - - 2.1Iran, Islamic Republic of 94.3 92.8 86.9 24.8 - - - 17.5Iraq 9.2 9.2 9.2 - - - - -Jordan - - - - - - - 1.4Kuwait 192.9 192.2 259.6 - - - - 0.8Lebanon 3.4 3.4 3.8 27.6 - - - 10.0Qatar - - - 0.0 - - - 1.7Saudi Arabia 33.9 33.9 24.7 0.9 - - - -
South, East and South-East Asia 90.1 89.9 72.8 44.2 67.1 158.4 212.4 845.6China 8.8 8.9 8.9 27.9 - - - 37.7Hong Kong, China 64.1 63.6 46.3 12.5 - - - 18.6India - - - - - - - 459.0Malaysia - - - - - - - 9.6Republic of Korea 0.8 1.0 1.2 3.8 67.1 158.4 212.4 179.6Singapore 16.4 16.4 16.4 - - - - 137.7Taiwan Province of China 0.1 0.1 0.1 - - - - 3.3
The Pacific - - - 0.2 - - - 0.2Marshall Islands - - - 0.2 - - - 0.2
Central and Eastern Europe 3.7 3.6 3.6 7.7 - - - 4.7Czech Republic - - - 7.5 - - - 4.3Czechoslovakia 3.0 2.9 2.9 - - - - -Hungary 0.3 0.3 0.3 0.2 - - - 0.2Poland - - 0.1 - - - - -Serbia and Montenegro 0.3 0.3 0.3 - - - - -Slovakia - - - - - - - 0.2
Unspecified 100.0 - - 2 151.2 4 275.8 4 542.7 5 248.4 3 340.9
Sources : ECLA, Central Bank of Brazil information provided by SOBEET.
Note: Data for 1993, 1994 and 1999 are not available.
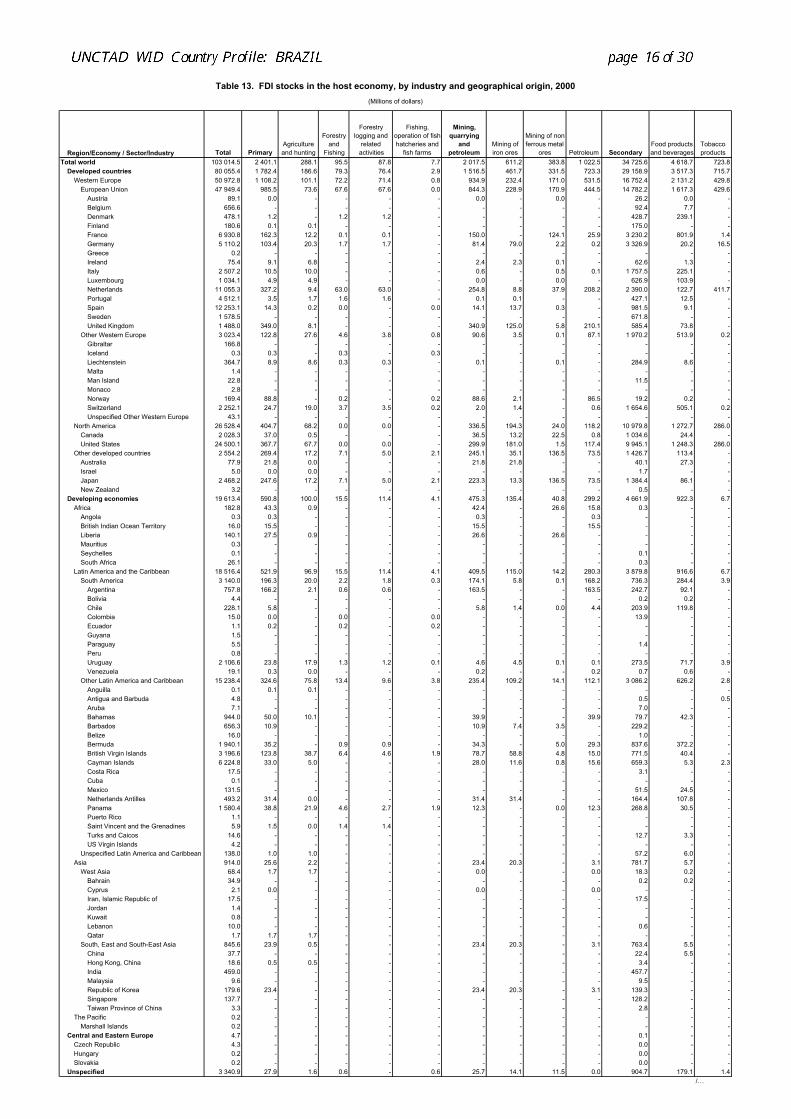
Table 13. FDI stocks in the host economy, by industry and geographical origin, 2000(Millions of dollars)
Region/Economy / Sector/Industry Total PrimaryAgriculture and hunting
Forestry and
Fishing
Forestry logging and
related activities
Fishing, operation of fish hatcheries and
fish farms
Mining, quarrying
and petroleum
Mining of iron ores
Mining of non-ferrous metal
ores Petroleum SecondaryFood products and beverages
Tobacco products
Total world 103 014.5 2 401.1 288.1 95.5 87.8 7.7 2 017.5 611.2 383.8 1 022.5 34 725.6 4 618.7 723.8Developed countries 80 055.4 1 782.4 186.6 79.3 76.4 2.9 1 516.5 461.7 331.5 723.3 29 158.9 3 517.3 715.7
Western Europe 50 972.8 1 108.2 101.1 72.2 71.4 0.8 934.9 232.4 171.0 531.5 16 752.4 2 131.2 429.8European Union 47 949.4 985.5 73.6 67.6 67.6 0.0 844.3 228.9 170.9 444.5 14 782.2 1 617.3 429.6
Austria 89.1 0.0 - - - - 0.0 - 0.0 - 26.2 0.0 -Belgium 656.6 - - - - - - - - - 92.4 7.7 -Denmark 478.1 1.2 - 1.2 1.2 - - - - - 428.7 239.1 -Finland 180.6 0.1 0.1 - - - - - - - 175.0 - -France 6 930.8 162.3 12.2 0.1 0.1 - 150.0 - 124.1 25.9 3 230.2 801.9 1.4Germany 5 110.2 103.4 20.3 1.7 1.7 - 81.4 79.0 2.2 0.2 3 326.9 20.2 16.5Greece 0.2 - - - - - - - - - - - -Ireland 75.4 9.1 6.8 - - - 2.4 2.3 0.1 - 62.6 1.3 -Italy 2 507.2 10.5 10.0 - - - 0.6 - 0.5 0.1 1 757.5 225.1 -Luxembourg 1 034.1 4.9 4.9 - - - 0.0 - 0.0 - 626.9 103.9 -Netherlands 11 055.3 327.2 9.4 63.0 63.0 - 254.8 8.8 37.9 208.2 2 390.0 122.7 411.7Portugal 4 512.1 3.5 1.7 1.6 1.6 - 0.1 0.1 - - 427.1 12.5 -Spain 12 253.1 14.3 0.2 0.0 - 0.0 14.1 13.7 0.3 - 981.5 9.1 -Sweden 1 578.5 - - - - - - - - - 671.8 - -United Kingdom 1 488.0 349.0 8.1 - - - 340.9 125.0 5.8 210.1 585.4 73.8 -
Other Western Europe 3 023.4 122.8 27.6 4.6 3.8 0.8 90.6 3.5 0.1 87.1 1 970.2 513.9 0.2Gibraltar 166.8 - - - - - - - - - - - -Iceland 0.3 0.3 - 0.3 - 0.3 - - - - - - -Liechtenstein 364.7 8.9 8.6 0.3 0.3 - 0.1 - 0.1 - 284.9 8.6 -Malta 1.4 - - - - - - - - - - - -Man Island 22.8 - - - - - - - - - 11.5 - -Monaco 2.8 - - - - - - - - - - - -Norway 169.4 88.8 - 0.2 - 0.2 88.6 2.1 - 86.5 19.2 0.2 -Switzerland 2 252.1 24.7 19.0 3.7 3.5 0.2 2.0 1.4 - 0.6 1 654.6 505.1 0.2Unspecified Other Western Europe 43.1 - - - - - - - - - - - -
North America 26 528.4 404.7 68.2 0.0 0.0 - 336.5 194.3 24.0 118.2 10 979.8 1 272.7 286.0Canada 2 028.3 37.0 0.5 - - - 36.5 13.2 22.5 0.8 1 034.6 24.4 -United States 24 500.1 367.7 67.7 0.0 0.0 - 299.9 181.0 1.5 117.4 9 945.1 1 248.3 286.0
Other developed countries 2 554.2 269.4 17.2 7.1 5.0 2.1 245.1 35.1 136.5 73.5 1 426.7 113.4 -Australia 77.9 21.8 0.0 - - - 21.8 21.8 - - 40.1 27.3 -Israel 5.0 0.0 0.0 - - - - - - - 1.7 - -Japan 2 468.2 247.6 17.2 7.1 5.0 2.1 223.3 13.3 136.5 73.5 1 384.4 86.1 -New Zealand 3.2 - - - - - - - - - 0.5 - -
Developing economies 19 613.4 590.8 100.0 15.5 11.4 4.1 475.3 135.4 40.8 299.2 4 661.9 922.3 6.7Africa 182.8 43.3 0.9 - - - 42.4 - 26.6 15.8 0.3 - -
Angola 0.3 0.3 - - - - 0.3 - - 0.3 - - -British Indian Ocean Territory 16.0 15.5 - - - - 15.5 - - 15.5 - - -Liberia 140.1 27.5 0.9 - - - 26.6 - 26.6 - - - -Mauritius 0.3 - - - - - - - - - - - -Seychelles 0.1 - - - - - - - - - 0.1 - -South Africa 26.1 - - - - - - - - - 0.3 - -
Latin America and the Caribbean 18 516.4 521.9 96.9 15.5 11.4 4.1 409.5 115.0 14.2 280.3 3 879.8 916.6 6.7South America 3 140.0 196.3 20.0 2.2 1.8 0.3 174.1 5.8 0.1 168.2 736.3 284.4 3.9
Argentina 757.8 166.2 2.1 0.6 0.6 - 163.5 - - 163.5 242.7 92.1 -Bolivia 4.4 - - - - - - - - - 0.2 0.2 -Chile 228.1 5.8 - - - - 5.8 1.4 0.0 4.4 203.9 119.8 -Colombia 15.0 0.0 - 0.0 - 0.0 - - - - 13.9 - -Ecuador 1.1 0.2 - 0.2 - 0.2 - - - - - - -Guyana 1.5 - - - - - - - - - - - -Paraguay 5.5 - - - - - - - - - 1.4 - -Peru 0.8 - - - - - - - - - - - -Uruguay 2 106.6 23.8 17.9 1.3 1.2 0.1 4.6 4.5 0.1 0.1 273.5 71.7 3.9Venezuela 19.1 0.3 0.0 - - - 0.2 - - 0.2 0.7 0.6 -
Other Latin America and Caribbean 15 238.4 324.6 75.8 13.4 9.6 3.8 235.4 109.2 14.1 112.1 3 086.2 626.2 2.8Anguilla 0.1 0.1 0.1 - - - - - - - - - -Antigua and Barbuda 4.8 - - - - - - - - - 0.5 - 0.5Aruba 7.1 - - - - - - - - - 7.0 - -Bahamas 944.0 50.0 10.1 - - - 39.9 - - 39.9 79.7 42.3 -Barbados 656.3 10.9 - - - - 10.9 7.4 3.5 - 229.2 - -Belize 16.0 - - - - - - - - - 1.0 - -Bermuda 1 940.1 35.2 - 0.9 0.9 - 34.3 - 5.0 29.3 837.6 372.2 -British Virgin Islands 3 196.6 123.8 38.7 6.4 4.6 1.9 78.7 58.8 4.8 15.0 771.5 40.4 -Cayman Islands 6 224.8 33.0 5.0 - - - 28.0 11.6 0.8 15.6 659.3 5.3 2.3Costa Rica 17.5 - - - - - - - - - 3.1 - -Cuba 0.1 - - - - - - - - - - - -Mexico 131.5 - - - - - - - - - 51.5 24.5 -Netherlands Antilles 493.2 31.4 0.0 - - - 31.4 31.4 - - 164.4 107.8 -Panama 1 580.4 38.8 21.9 4.6 2.7 1.9 12.3 - 0.0 12.3 268.8 30.5 -Puerto Rico 1.1 - - - - - - - - - - - -Saint Vincent and the Grenadines 5.9 1.5 0.0 1.4 1.4 - - - - - - - -Turks and Caicos 14.6 - - - - - - - - - 12.7 3.3 -US Virgin Islands 4.2 - - - - - - - - - - - -
Unspecified Latin America and Caribbean 138.0 1.0 1.0 - - - - - - - 57.2 6.0 -Asia 914.0 25.6 2.2 - - - 23.4 20.3 - 3.1 781.7 5.7 -
West Asia 68.4 1.7 1.7 - - - 0.0 - - 0.0 18.3 0.2 -Bahrain 34.9 - - - - - - - - - 0.2 0.2 -Cyprus 2.1 0.0 - - - - 0.0 - - 0.0 - - -Iran, Islamic Republic of 17.5 - - - - - - - - - 17.5 - -Jordan 1.4 - - - - - - - - - - - -Kuwait 0.8 - - - - - - - - - - - -Lebanon 10.0 - - - - - - - - - 0.6 - -Qatar 1.7 1.7 1.7 - - - - - - - - - -
South, East and South-East Asia 845.6 23.9 0.5 - - - 23.4 20.3 - 3.1 763.4 5.5 -China 37.7 - - - - - - - - - 22.4 5.5 -Hong Kong, China 18.6 0.5 0.5 - - - - - - - 3.4 - -India 459.0 - - - - - - - - - 457.7 - -Malaysia 9.6 - - - - - - - - - 9.5 - -Republic of Korea 179.6 23.4 - - - - 23.4 20.3 - 3.1 139.3 - -Singapore 137.7 - - - - - - - - - 128.2 - -Taiwan Province of China 3.3 - - - - - - - - - 2.8 - -
The Pacific 0.2 - - - - - - - - - - - -Marshall Islands 0.2 - - - - - - - - - - - -
Central and Eastern Europe 4.7 - - - - - - - - - 0.1 - -Czech Republic 4.3 - - - - - - - - - 0.0 - -Hungary 0.2 - - - - - - - - - 0.0 - -Slovakia 0.2 - - - - - - - - - 0.0 - -
Unspecified 3 340.9 27.9 1.6 0.6 - 0.6 25.7 14.1 11.5 0.0 904.7 179.1 1.4/…
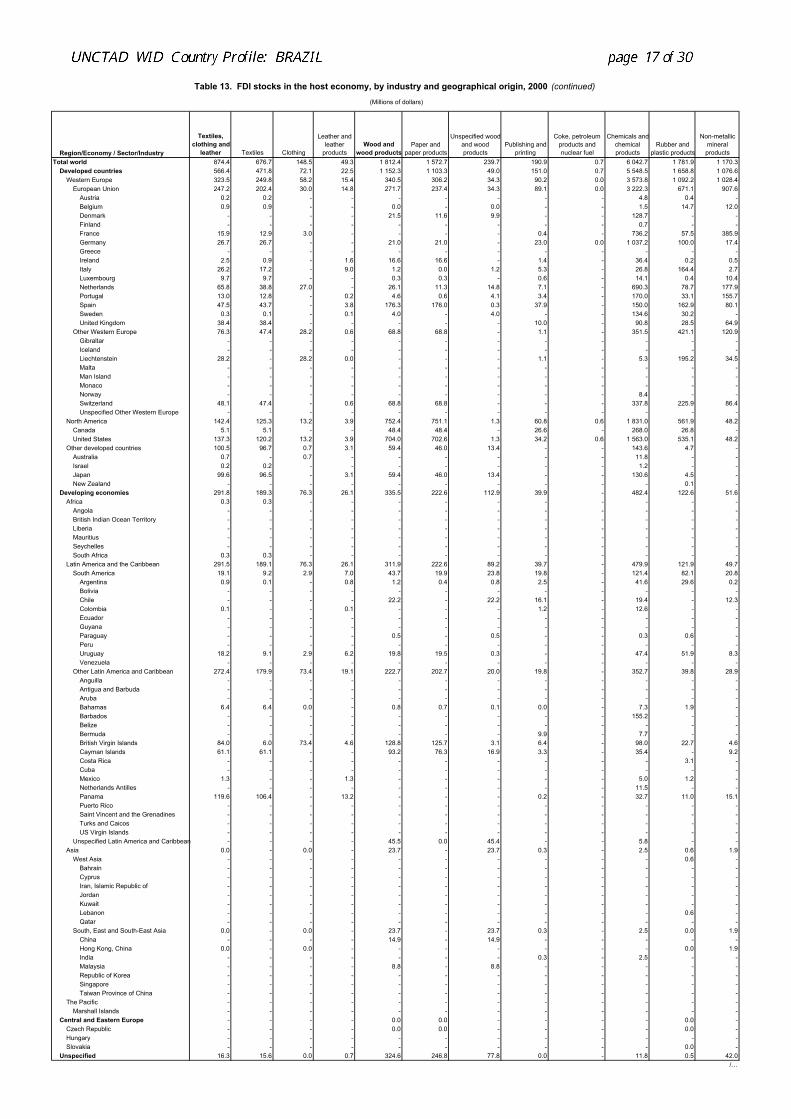
Table 13. FDI stocks in the host economy, by industry and geographical origin, 2000 (continued)
(Millions of dollars)
Region/Economy / Sector/Industry
Textiles, clothing and
leather Textiles Clothing
Leather and leather
productsWood and
wood productsPaper and
paper products
Unspecified woodand wood products
Publishing and printing
Coke, petroleum products and nuclear fuel
Chemicals andchemical products
Rubber and plastic products
Non-metallic mineral products
Total world 874.4 676.7 148.5 49.3 1 812.4 1 572.7 239.7 190.9 0.7 6 042.7 1 781.9 1 170.3Developed countries 566.4 471.8 72.1 22.5 1 152.3 1 103.3 49.0 151.0 0.7 5 548.5 1 658.8 1 076.6
Western Europe 323.5 249.8 58.2 15.4 340.5 306.2 34.3 90.2 0.0 3 573.8 1 092.2 1 028.4European Union 247.2 202.4 30.0 14.8 271.7 237.4 34.3 89.1 0.0 3 222.3 671.1 907.6
Austria 0.2 0.2 - - - - - - - 4.8 0.4 -Belgium 0.9 0.9 - - 0.0 - 0.0 - - 1.5 14.7 12.0Denmark - - - - 21.5 11.6 9.9 - - 128.7 - -Finland - - - - - - - - - 0.7 - -France 15.9 12.9 3.0 - - - - 0.4 - 736.2 57.5 385.9Germany 26.7 26.7 - - 21.0 21.0 - 23.0 0.0 1 037.2 100.0 17.4Greece - - - - - - - - - - - -Ireland 2.5 0.9 - 1.6 16.6 16.6 - 1.4 - 36.4 0.2 0.5Italy 26.2 17.2 - 9.0 1.2 0.0 1.2 5.3 - 26.8 164.4 2.7Luxembourg 9.7 9.7 - - 0.3 0.3 - 0.6 - 14.1 0.4 10.4Netherlands 65.8 38.8 27.0 - 26.1 11.3 14.8 7.1 - 690.3 78.7 177.9Portugal 13.0 12.8 - 0.2 4.6 0.6 4.1 3.4 - 170.0 33.1 155.7Spain 47.5 43.7 - 3.8 176.3 176.0 0.3 37.9 - 150.0 162.9 80.1Sweden 0.3 0.1 - 0.1 4.0 - 4.0 - - 134.6 30.2 -United Kingdom 38.4 38.4 - - - - - 10.0 - 90.8 28.5 64.9
Other Western Europe 76.3 47.4 28.2 0.6 68.8 68.8 - 1.1 - 351.5 421.1 120.9Gibraltar - - - - - - - - - - - -Iceland - - - - - - - - - - - -Liechtenstein 28.2 - 28.2 0.0 - - - 1.1 - 5.3 195.2 34.5Malta - - - - - - - - - - - -Man Island - - - - - - - - - - - -Monaco - - - - - - - - - - - -Norway - - - - - - - - - 8.4 - -Switzerland 48.1 47.4 - 0.6 68.8 68.8 - - - 337.8 225.9 86.4Unspecified Other Western Europe - - - - - - - - - - - -
North America 142.4 125.3 13.2 3.9 752.4 751.1 1.3 60.8 0.6 1 831.0 561.9 48.2Canada 5.1 5.1 - - 48.4 48.4 - 26.6 - 268.0 26.8 -United States 137.3 120.2 13.2 3.9 704.0 702.6 1.3 34.2 0.6 1 563.0 535.1 48.2
Other developed countries 100.5 96.7 0.7 3.1 59.4 46.0 13.4 - - 143.6 4.7 -Australia 0.7 - 0.7 - - - - - - 11.8 - -Israel 0.2 0.2 - - - - - - - 1.2 - -Japan 99.6 96.5 - 3.1 59.4 46.0 13.4 - - 130.6 4.5 -New Zealand - - - - - - - - - - 0.1 -
Developing economies 291.8 189.3 76.3 26.1 335.5 222.6 112.9 39.9 - 482.4 122.6 51.6Africa 0.3 0.3 - - - - - - - - - -
Angola - - - - - - - - - - - -British Indian Ocean Territory - - - - - - - - - - - -Liberia - - - - - - - - - - - -Mauritius - - - - - - - - - - - -Seychelles - - - - - - - - - - - -South Africa 0.3 0.3 - - - - - - - - - -
Latin America and the Caribbean 291.5 189.1 76.3 26.1 311.9 222.6 89.2 39.7 - 479.9 121.9 49.7South America 19.1 9.2 2.9 7.0 43.7 19.9 23.8 19.8 - 121.4 82.1 20.8
Argentina 0.9 0.1 - 0.8 1.2 0.4 0.8 2.5 - 41.6 29.6 0.2Bolivia - - - - - - - - - - - -Chile - - - - 22.2 - 22.2 16.1 - 19.4 - 12.3Colombia 0.1 - - 0.1 - - - 1.2 - 12.6 - -Ecuador - - - - - - - - - - - -Guyana - - - - - - - - - - - -Paraguay - - - - 0.5 - 0.5 - - 0.3 0.6 -Peru - - - - - - - - - - - -Uruguay 18.2 9.1 2.9 6.2 19.8 19.5 0.3 - - 47.4 51.9 8.3Venezuela - - - - - - - - - - - -
Other Latin America and Caribbean 272.4 179.9 73.4 19.1 222.7 202.7 20.0 19.8 - 352.7 39.8 28.9Anguilla - - - - - - - - - - - -Antigua and Barbuda - - - - - - - - - - - -Aruba - - - - - - - - - - - -Bahamas 6.4 6.4 0.0 - 0.8 0.7 0.1 0.0 - 7.3 1.9 -Barbados - - - - - - - - - 155.2 - -Belize - - - - - - - - - - - -Bermuda - - - - - - - 9.9 - 7.7 - -British Virgin Islands 84.0 6.0 73.4 4.6 128.8 125.7 3.1 6.4 - 98.0 22.7 4.6Cayman Islands 61.1 61.1 - - 93.2 76.3 16.9 3.3 - 35.4 - 9.2Costa Rica - - - - - - - - - - 3.1 -Cuba - - - - - - - - - - - -Mexico 1.3 - - 1.3 - - - - - 5.0 1.2 -Netherlands Antilles - - - - - - - - - 11.5 - -Panama 119.6 106.4 - 13.2 - - - 0.2 - 32.7 11.0 15.1Puerto Rico - - - - - - - - - - - -Saint Vincent and the Grenadines - - - - - - - - - - - -Turks and Caicos - - - - - - - - - - - -US Virgin Islands - - - - - - - - - - - -
Unspecified Latin America and Caribbean - - - - 45.5 0.0 45.4 - - 5.8 - -Asia 0.0 - 0.0 - 23.7 - 23.7 0.3 - 2.5 0.6 1.9
West Asia - - - - - - - - - - 0.6 -Bahrain - - - - - - - - - - - -Cyprus - - - - - - - - - - - -Iran, Islamic Republic of - - - - - - - - - - - -Jordan - - - - - - - - - - - -Kuwait - - - - - - - - - - - -Lebanon - - - - - - - - - - 0.6 -Qatar - - - - - - - - - - - -
South, East and South-East Asia 0.0 - 0.0 - 23.7 - 23.7 0.3 - 2.5 0.0 1.9China - - - - 14.9 - 14.9 - - - - -Hong Kong, China 0.0 - 0.0 - - - - - - - 0.0 1.9India - - - - - - - 0.3 - 2.5 - -Malaysia - - - - 8.8 - 8.8 - - - - -Republic of Korea - - - - - - - - - - - -Singapore - - - - - - - - - - - -Taiwan Province of China - - - - - - - - - - - -
The Pacific - - - - - - - - - - - -Marshall Islands - - - - - - - - - - - -
Central and Eastern Europe - - - - 0.0 0.0 - - - - 0.0 -Czech Republic - - - - 0.0 0.0 - - - - 0.0 -Hungary - - - - - - - - - - - -Slovakia - - - - - - - - - - 0.0 -
Unspecified 16.3 15.6 0.0 0.7 324.6 246.8 77.8 0.0 - 11.8 0.5 42.0/…
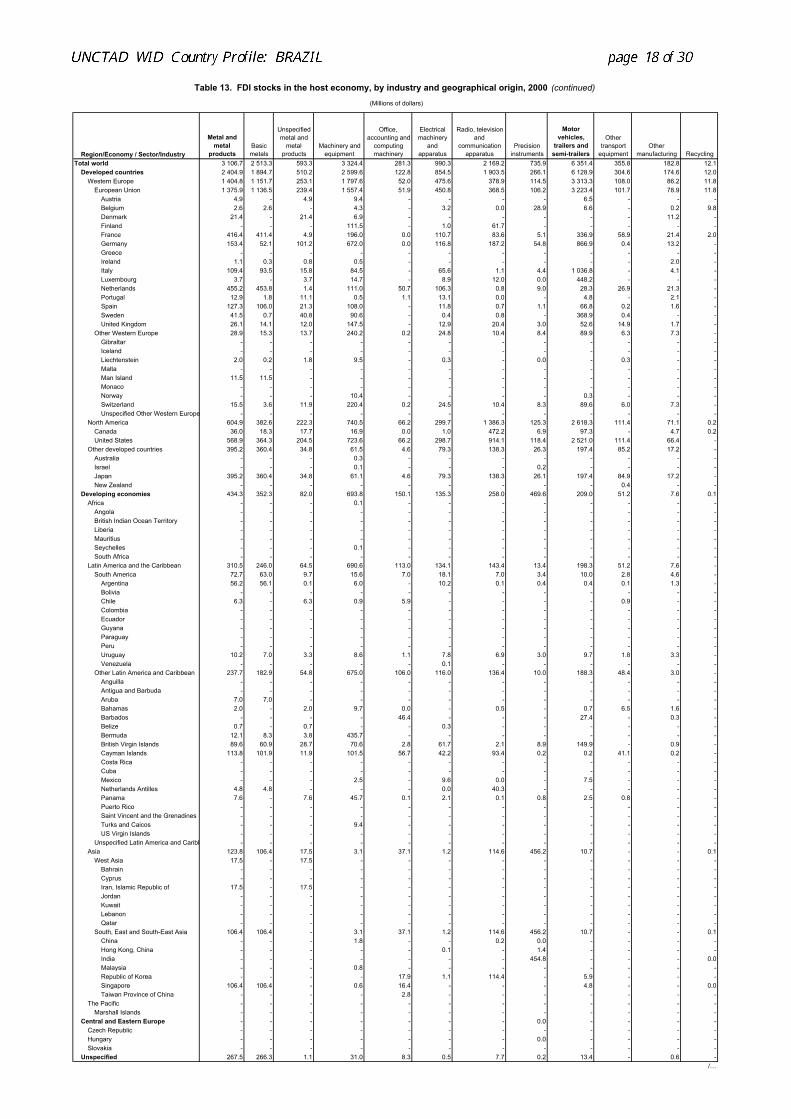
Table 13. FDI stocks in the host economy, by industry and geographical origin, 2000 (continued)
(Millions of dollars)
Region/Economy / Sector/Industry
Metal and metal
productsBasic metals
Unspecified metal and
metal products
Machinery and equipment
Office, accounting and
computing machinery
Electrical machinery
and apparatus
Radio, television and
communication apparatus
Precision instruments
Motor vehicles,
trailers and semi-trailers
Other transport
equipmentOther
manufacturing RecyclingTotal world 3 106.7 2 513.3 593.3 3 324.4 281.3 990.3 2 169.2 735.9 6 351.4 355.8 182.8 12.1
Developed countries 2 404.9 1 894.7 510.2 2 599.6 122.8 854.5 1 903.5 266.1 6 128.9 304.6 174.6 12.0Western Europe 1 404.8 1 151.7 253.1 1 797.6 52.0 475.6 378.9 114.5 3 313.3 108.0 86.2 11.8
European Union 1 375.9 1 136.5 239.4 1 557.4 51.9 450.8 368.5 106.2 3 223.4 101.7 78.9 11.8Austria 4.9 - 4.9 9.4 - - - - 6.5 - - -Belgium 2.6 2.6 - 4.3 - 3.2 0.0 28.9 6.6 - 0.2 9.8Denmark 21.4 - 21.4 6.9 - - - - - - 11.2 -Finland - - - 111.5 - 1.0 61.7 - - - - -France 416.4 411.4 4.9 196.0 0.0 110.7 83.6 5.1 336.9 58.9 21.4 2.0Germany 153.4 52.1 101.2 672.0 0.0 116.8 187.2 54.8 866.9 0.4 13.2 -Greece - - - - - - - - - - - -Ireland 1.1 0.3 0.8 0.5 - - - - - - 2.0 -Italy 109.4 93.5 15.8 84.5 - 65.6 1.1 4.4 1 036.8 - 4.1 -Luxembourg 3.7 - 3.7 14.7 - 8.9 12.0 0.0 448.2 - - -Netherlands 455.2 453.8 1.4 111.0 50.7 106.3 0.8 9.0 28.3 26.9 21.3 -Portugal 12.9 1.8 11.1 0.5 1.1 13.1 0.0 - 4.8 - 2.1 -Spain 127.3 106.0 21.3 108.0 - 11.8 0.7 1.1 66.8 0.2 1.6 -Sweden 41.5 0.7 40.8 90.6 - 0.4 0.8 - 368.9 0.4 - -United Kingdom 26.1 14.1 12.0 147.5 - 12.9 20.4 3.0 52.6 14.9 1.7 -
Other Western Europe 28.9 15.3 13.7 240.2 0.2 24.8 10.4 8.4 89.9 6.3 7.3 -Gibraltar - - - - - - - - - - - -Iceland - - - - - - - - - - - -Liechtenstein 2.0 0.2 1.8 9.5 - 0.3 - 0.0 - 0.3 - -Malta - - - - - - - - - - - -Man Island 11.5 11.5 - - - - - - - - - -Monaco - - - - - - - - - - - -Norway - - - 10.4 - - - - 0.3 - - -Switzerland 15.5 3.6 11.9 220.4 0.2 24.5 10.4 8.3 89.6 6.0 7.3 -Unspecified Other Western Europe - - - - - - - - - - - -
North America 604.9 382.6 222.3 740.5 66.2 299.7 1 386.3 125.3 2 618.3 111.4 71.1 0.2Canada 36.0 18.3 17.7 16.9 0.0 1.0 472.2 6.9 97.3 - 4.7 0.2United States 568.9 364.3 204.5 723.6 66.2 298.7 914.1 118.4 2 521.0 111.4 66.4 -
Other developed countries 395.2 360.4 34.8 61.5 4.6 79.3 138.3 26.3 197.4 85.2 17.2 -Australia - - - 0.3 - - - - - - - -Israel - - - 0.1 - - - 0.2 - - - -Japan 395.2 360.4 34.8 61.1 4.6 79.3 138.3 26.1 197.4 84.9 17.2 -New Zealand - - - - - - - - - 0.4 - -
Developing economies 434.3 352.3 82.0 693.8 150.1 135.3 258.0 469.6 209.0 51.2 7.6 0.1Africa - - - 0.1 - - - - - - - -
Angola - - - - - - - - - - - -British Indian Ocean Territory - - - - - - - - - - - -Liberia - - - - - - - - - - - -Mauritius - - - - - - - - - - - -Seychelles - - - 0.1 - - - - - - - -South Africa - - - - - - - - - - - -
Latin America and the Caribbean 310.5 246.0 64.5 690.6 113.0 134.1 143.4 13.4 198.3 51.2 7.6 -South America 72.7 63.0 9.7 15.6 7.0 18.1 7.0 3.4 10.0 2.8 4.6 -
Argentina 56.2 56.1 0.1 6.0 - 10.2 0.1 0.4 0.4 0.1 1.3 -Bolivia - - - - - - - - - - - -Chile 6.3 - 6.3 0.9 5.9 - - - - 0.9 - -Colombia - - - - - - - - - - - -Ecuador - - - - - - - - - - - -Guyana - - - - - - - - - - - -Paraguay - - - - - - - - - - - -Peru - - - - - - - - - - - -Uruguay 10.2 7.0 3.3 8.6 1.1 7.8 6.9 3.0 9.7 1.8 3.3 -Venezuela - - - - - 0.1 - - - - - -
Other Latin America and Caribbean 237.7 182.9 54.8 675.0 106.0 116.0 136.4 10.0 188.3 48.4 3.0 -Anguilla - - - - - - - - - - - -Antigua and Barbuda - - - - - - - - - - - -Aruba 7.0 7.0 - - - - - - - - - -Bahamas 2.0 - 2.0 9.7 0.0 - 0.5 - 0.7 6.5 1.6 -Barbados - - - - 46.4 - - - 27.4 - 0.3 -Belize 0.7 - 0.7 - - 0.3 - - - - - -Bermuda 12.1 8.3 3.8 435.7 - - - - - - - -British Virgin Islands 89.6 60.9 28.7 70.6 2.8 61.7 2.1 8.9 149.9 - 0.9 -Cayman Islands 113.8 101.9 11.9 101.5 56.7 42.2 93.4 0.2 0.2 41.1 0.2 -Costa Rica - - - - - - - - - - - -Cuba - - - - - - - - - - - -Mexico - - - 2.5 - 9.6 0.0 - 7.5 - - -Netherlands Antilles 4.8 4.8 - - - 0.0 40.3 - - - - -Panama 7.6 - 7.6 45.7 0.1 2.1 0.1 0.8 2.5 0.8 - -Puerto Rico - - - - - - - - - - - -Saint Vincent and the Grenadines - - - - - - - - - - - -Turks and Caicos - - - 9.4 - - - - - - - -US Virgin Islands - - - - - - - - - - - -
Unspecified Latin America and Caribb - - - - - - - - - - - -Asia 123.8 106.4 17.5 3.1 37.1 1.2 114.6 456.2 10.7 - - 0.1
West Asia 17.5 - 17.5 - - - - - - - - -Bahrain - - - - - - - - - - - -Cyprus - - - - - - - - - - - -Iran, Islamic Republic of 17.5 - 17.5 - - - - - - - - -Jordan - - - - - - - - - - - -Kuwait - - - - - - - - - - - -Lebanon - - - - - - - - - - - -Qatar - - - - - - - - - - - -
South, East and South-East Asia 106.4 106.4 - 3.1 37.1 1.2 114.6 456.2 10.7 - - 0.1China - - - 1.8 - - 0.2 0.0 - - - -Hong Kong, China - - - - - 0.1 - 1.4 - - - -India - - - - - - - 454.8 - - - 0.0Malaysia - - - 0.8 - - - - - - - -Republic of Korea - - - - 17.9 1.1 114.4 - 5.9 - - -Singapore 106.4 106.4 - 0.6 16.4 - - - 4.8 - - 0.0Taiwan Province of China - - - - 2.8 - - - - - - -
The Pacific - - - - - - - - - - - -Marshall Islands - - - - - - - - - - - -
Central and Eastern Europe - - - - - - - 0.0 - - - -Czech Republic - - - - - - - - - - - -Hungary - - - - - - - 0.0 - - - -Slovakia - - - - - - - - - - - -
Unspecified 267.5 266.3 1.1 31.0 8.3 0.5 7.7 0.2 13.4 - 0.6 -/…
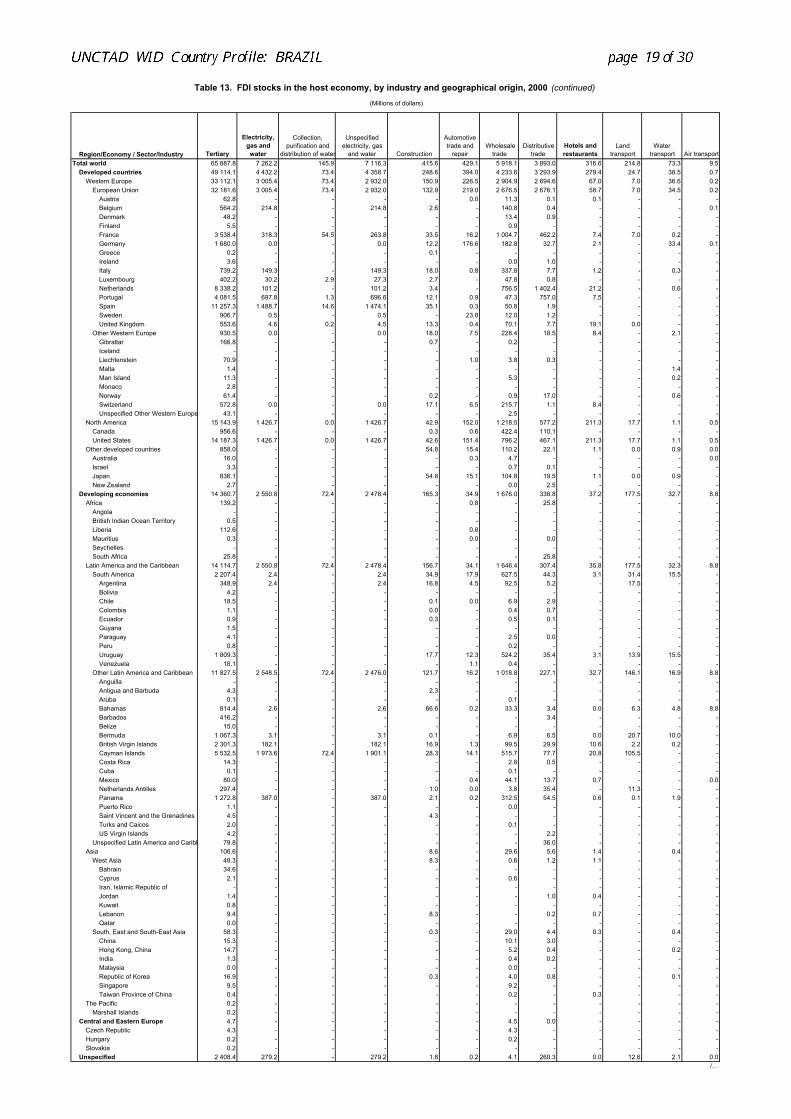
Table 13. FDI stocks in the host economy, by industry and geographical origin, 2000 (continued)
(Millions of dollars)
Region/Economy / Sector/Industry Tertiary
Electricity, gas and water
Collection, purification and
distribution of water
Unspecified electricity, gas
and water Construction
Automotive trade and
repair Wholesale
tradeDistributive
tradeHotels and restaurants
Land transport
Water transport Air transport
Total world 65 887.8 7 262.2 145.9 7 116.3 415.6 429.1 5 918.1 3 893.0 316.6 214.8 73.3 9.5Developed countries 49 114.1 4 432.2 73.4 4 358.7 248.6 394.0 4 233.6 3 293.9 279.4 24.7 38.5 0.7
Western Europe 33 112.1 3 005.4 73.4 2 932.0 150.9 226.5 2 904.9 2 694.6 67.0 7.0 36.6 0.2European Union 32 181.6 3 005.4 73.4 2 932.0 132.9 219.0 2 676.5 2 676.1 58.7 7.0 34.5 0.2
Austria 62.8 - - - - 0.0 11.3 0.1 0.1 - - -Belgium 564.2 214.8 - 214.8 2.6 - 140.8 0.4 - - - 0.1Denmark 48.2 - - - - - 13.4 0.9 - - - -Finland 5.5 - - - - - 0.9 - - - - -France 3 538.4 318.3 54.5 263.8 33.5 16.2 1 004.7 462.2 7.4 7.0 0.2 -Germany 1 680.0 0.0 - 0.0 12.2 176.6 182.8 32.7 2.1 - 33.4 0.1Greece 0.2 - - - 0.1 - - - - - - -Ireland 3.6 - - - - - 0.0 1.0 - - - -Italy 739.2 149.3 - 149.3 18.0 0.8 337.8 7.7 1.2 - 0.3 -Luxembourg 402.2 30.2 2.9 27.3 2.7 - 47.8 0.8 - - - -Netherlands 8 338.2 101.2 - 101.2 3.4 - 756.5 1 402.4 21.2 - 0.6 -Portugal 4 081.5 697.8 1.3 696.6 12.1 0.9 47.3 757.0 7.5 - - -Spain 11 257.3 1 488.7 14.6 1 474.1 35.1 0.3 50.8 1.9 - - - -Sweden 906.7 0.5 - 0.5 - 23.8 12.0 1.2 - - - -United Kingdom 553.6 4.6 0.2 4.5 13.3 0.4 70.1 7.7 19.1 0.0 - -
Other Western Europe 930.5 0.0 - 0.0 18.0 7.5 228.4 18.5 8.4 - 2.1 -Gibraltar 166.8 - - - 0.7 - 0.2 - - - - -Iceland - - - - - - - - - - - -Liechtenstein 70.9 - - - - 1.0 3.8 0.3 - - - -Malta 1.4 - - - - - - - - - 1.4 -Man Island 11.3 - - - - - 5.3 - - - 0.2 -Monaco 2.8 - - - - - - - - - - -Norway 61.4 - - - 0.2 - 0.9 17.0 - - 0.6 -Switzerland 572.8 0.0 - 0.0 17.1 6.5 215.7 1.1 8.4 - - -Unspecified Other Western Europe 43.1 - - - - - 2.5 - - - - -
North America 15 143.9 1 426.7 0.0 1 426.7 42.9 152.0 1 218.5 577.2 211.3 17.7 1.1 0.5Canada 956.6 - - - 0.3 0.6 422.4 110.1 - - - -United States 14 187.3 1 426.7 0.0 1 426.7 42.6 151.4 796.2 467.1 211.3 17.7 1.1 0.5
Other developed countries 858.0 - - - 54.8 15.4 110.2 22.1 1.1 0.0 0.9 0.0Australia 16.0 - - - - 0.3 4.7 - - - - 0.0Israel 3.3 - - - - - 0.7 0.1 - - - -Japan 836.1 - - - 54.8 15.1 104.8 19.5 1.1 0.0 0.9 -New Zealand 2.7 - - - - - 0.0 2.5 - - - -
Developing economies 14 360.7 2 550.8 72.4 2 478.4 165.3 34.9 1 676.0 338.8 37.2 177.5 32.7 8.8Africa 139.2 - - - - 0.8 - 25.8 - - - -
Angola - - - - - - - - - - - -British Indian Ocean Territory 0.5 - - - - - - - - - - -Liberia 112.6 - - - - 0.8 - - - - - -Mauritius 0.3 - - - - 0.0 - 0.0 - - - -Seychelles - - - - - - - - - - - -South Africa 25.8 - - - - - - 25.8 - - - -
Latin America and the Caribbean 14 114.7 2 550.8 72.4 2 478.4 156.7 34.1 1 646.4 307.4 35.8 177.5 32.3 8.8South America 2 207.4 2.4 - 2.4 34.9 17.9 627.5 44.3 3.1 31.4 15.5 -
Argentina 348.9 2.4 - 2.4 16.8 4.5 92.5 5.2 - 17.5 - -Bolivia 4.2 - - - - - - - - - - -Chile 18.5 - - - 0.1 0.0 6.9 2.9 - - - -Colombia 1.1 - - - 0.0 - 0.4 0.7 - - - -Ecuador 0.9 - - - 0.3 - 0.5 0.1 - - - -Guyana 1.5 - - - - - - - - - - -Paraguay 4.1 - - - - - 2.5 0.0 - - - -Peru 0.8 - - - - - 0.2 - - - - -Uruguay 1 809.3 - - - 17.7 12.3 524.2 35.4 3.1 13.9 15.5 -Venezuela 18.1 - - - - 1.1 0.4 - - - - -
Other Latin America and Caribbean 11 827.5 2 548.5 72.4 2 476.0 121.7 16.2 1 018.8 227.1 32.7 146.1 16.9 8.8Anguilla - - - - - - - - - - - -Antigua and Barbuda 4.3 - - - 2.3 - - - - - - -Aruba 0.1 - - - - - 0.1 - - - - -Bahamas 814.4 2.6 - 2.6 66.6 0.2 33.3 3.4 0.0 6.3 4.8 8.8Barbados 416.2 - - - - - - 3.4 - - - -Belize 15.0 - - - - - - - - - - -Bermuda 1 067.3 3.1 - 3.1 0.1 - 6.9 6.5 0.0 20.7 10.0 -British Virgin Islands 2 301.3 182.1 - 182.1 16.9 1.3 99.5 29.9 10.6 2.2 0.2 -Cayman Islands 5 532.5 1 973.6 72.4 1 901.1 28.3 14.1 515.7 77.7 20.8 105.5 - -Costa Rica 14.3 - - - - - 2.8 0.5 - - - -Cuba 0.1 - - - - - 0.1 - - - - -Mexico 80.0 - - - - 0.4 44.1 13.7 0.7 - - 0.0Netherlands Antilles 297.4 - - - 1.0 0.0 3.8 35.4 - 11.3 - -Panama 1 272.8 387.0 - 387.0 2.1 0.2 312.5 54.5 0.6 0.1 1.9 -Puerto Rico 1.1 - - - - - 0.0 - - - - -Saint Vincent and the Grenadines 4.5 - - - 4.3 - - - - - - -Turks and Caicos 2.0 - - - - - 0.1 - - - - -US Virgin Islands 4.2 - - - - - - 2.2 - - - -
Unspecified Latin America and Caribb 79.8 - - - - - - 36.0 - - - -Asia 106.6 - - - 8.6 - 29.6 5.6 1.4 - 0.4 -
West Asia 48.3 - - - 8.3 - 0.6 1.2 1.1 - - -Bahrain 34.6 - - - - - - - - - - -Cyprus 2.1 - - - - - 0.6 - - - - -Iran, Islamic Republic of - - - - - - - - - - - -Jordan 1.4 - - - - - - 1.0 0.4 - - -Kuwait 0.8 - - - - - - - - - - -Lebanon 9.4 - - - 8.3 - - 0.2 0.7 - - -Qatar 0.0 - - - - - - - - - - -
South, East and South-East Asia 58.3 - - - 0.3 - 29.0 4.4 0.3 - 0.4 -China 15.3 - - - - - 10.1 3.0 - - - -Hong Kong, China 14.7 - - - - - 5.2 0.4 - - 0.2 -India 1.3 - - - - - 0.4 0.2 - - - -Malaysia 0.0 - - - - - 0.0 - - - - -Republic of Korea 16.9 - - - 0.3 - 4.0 0.8 - - 0.1 -Singapore 9.5 - - - - - 9.2 - - - - -Taiwan Province of China 0.4 - - - - - 0.2 - 0.3 - - -
The Pacific 0.2 - - - - - - - - - - -Marshall Islands 0.2 - - - - - - - - - - -
Central and Eastern Europe 4.7 - - - - - 4.5 0.0 - - - -Czech Republic 4.3 - - - - - 4.3 - - - - -Hungary 0.2 - - - - - 0.2 - - - - -Slovakia 0.2 - - - - - - - - - - -
Unspecified 2 408.4 279.2 - 279.2 1.8 0.2 4.1 260.3 0.0 12.6 2.1 0.0/…
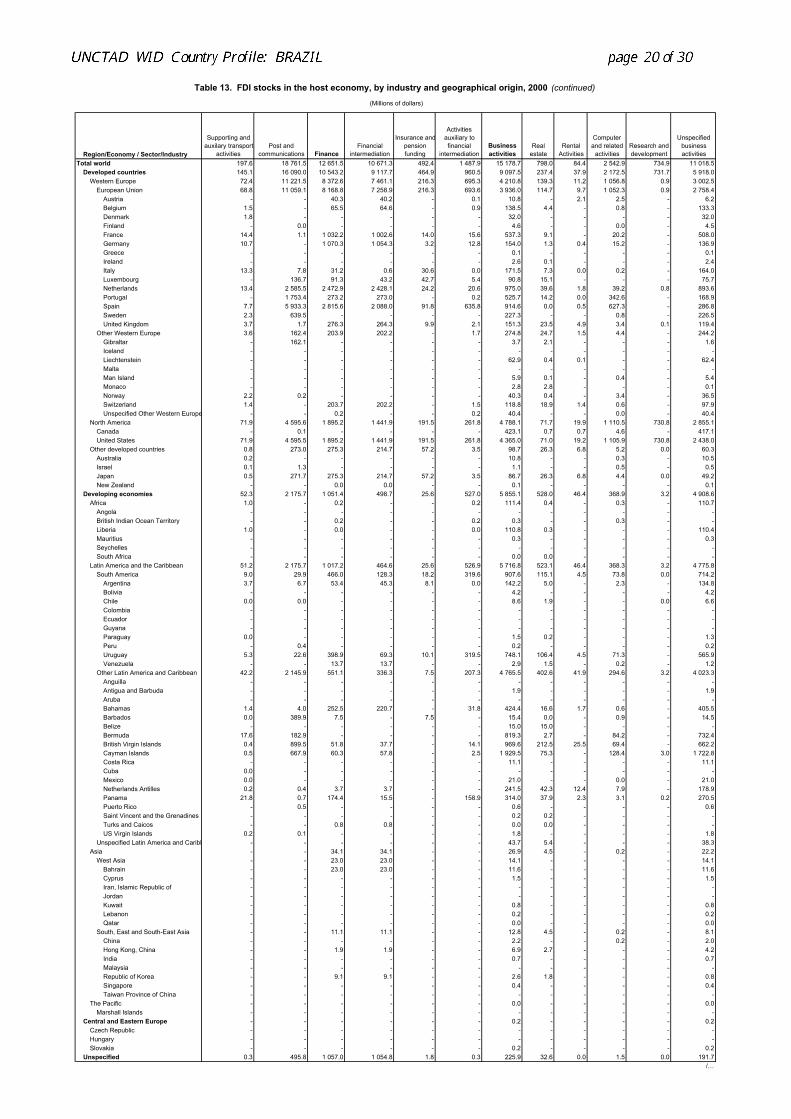
Table 13. FDI stocks in the host economy, by industry and geographical origin, 2000 (continued)
(Millions of dollars)
Region/Economy / Sector/Industry
Supporting and auxilary transport
activitiesPost and
communications FinanceFinancial
intermediation
Insurance andpension funding
Activities auxiliary to financial
intermediationBusiness activities
Real estate
Rental Activities
Computer and related
activitiesResearch and development
Unspecified business activities
Total world 197.6 18 761.5 12 651.5 10 671.3 492.4 1 487.9 15 178.7 798.0 84.4 2 542.9 734.9 11 018.5Developed countries 145.1 16 090.0 10 543.2 9 117.7 464.9 960.5 9 097.5 237.4 37.9 2 172.5 731.7 5 918.0
Western Europe 72.4 11 221.5 8 372.6 7 461.1 216.3 695.3 4 210.8 139.3 11.2 1 056.8 0.9 3 002.5European Union 68.8 11 059.1 8 168.8 7 258.9 216.3 693.6 3 936.0 114.7 9.7 1 052.3 0.9 2 758.4
Austria - - 40.3 40.2 - 0.1 10.8 - 2.1 2.5 - 6.2Belgium 1.5 - 65.5 64.6 - 0.9 138.5 4.4 - 0.8 - 133.3Denmark 1.8 - - - - - 32.0 - - - - 32.0Finland - 0.0 - - - - 4.6 - - 0.0 - 4.5France 14.4 1.1 1 032.2 1 002.6 14.0 15.6 537.3 9.1 - 20.2 - 508.0Germany 10.7 - 1 070.3 1 054.3 3.2 12.8 154.0 1.3 0.4 15.2 - 136.9Greece - - - - - - 0.1 - - - - 0.1Ireland - - - - - - 2.6 0.1 - - - 2.4Italy 13.3 7.8 31.2 0.6 30.6 0.0 171.5 7.3 0.0 0.2 - 164.0Luxembourg - 136.7 91.3 43.2 42.7 5.4 90.8 15.1 - - - 75.7Netherlands 13.4 2 585.5 2 472.9 2 428.1 24.2 20.6 975.0 39.6 1.8 39.2 0.8 893.6Portugal - 1 753.4 273.2 273.0 - 0.2 525.7 14.2 0.0 342.6 - 168.9Spain 7.7 5 933.3 2 815.6 2 088.0 91.8 635.8 914.6 0.0 0.5 627.3 - 286.8Sweden 2.3 639.5 - - - - 227.3 - - 0.8 - 226.5United Kingdom 3.7 1.7 276.3 264.3 9.9 2.1 151.3 23.5 4.9 3.4 0.1 119.4
Other Western Europe 3.6 162.4 203.9 202.2 - 1.7 274.8 24.7 1.5 4.4 - 244.2Gibraltar - 162.1 - - - - 3.7 2.1 - - - 1.6Iceland - - - - - - - - - - - -Liechtenstein - - - - - - 62.9 0.4 0.1 - - 62.4Malta - - - - - - - - - - - -Man Island - - - - - - 5.9 0.1 - 0.4 - 5.4Monaco - - - - - - 2.8 2.8 - - - 0.1Norway 2.2 0.2 - - - - 40.3 0.4 - 3.4 - 36.5Switzerland 1.4 - 203.7 202.2 - 1.5 118.8 18.9 1.4 0.6 - 97.9Unspecified Other Western Europe - - 0.2 - - 0.2 40.4 - - 0.0 - 40.4
North America 71.9 4 595.6 1 895.2 1 441.9 191.5 261.8 4 788.1 71.7 19.9 1 110.5 730.8 2 855.1Canada - 0.1 - - - - 423.1 0.7 0.7 4.6 - 417.1United States 71.9 4 595.5 1 895.2 1 441.9 191.5 261.8 4 365.0 71.0 19.2 1 105.9 730.8 2 438.0
Other developed countries 0.8 273.0 275.3 214.7 57.2 3.5 98.7 26.3 6.8 5.2 0.0 60.3Australia 0.2 - - - - - 10.8 - - 0.3 - 10.5Israel 0.1 1.3 - - - - 1.1 - - 0.5 - 0.5Japan 0.5 271.7 275.3 214.7 57.2 3.5 86.7 26.3 6.8 4.4 0.0 49.2New Zealand - - 0.0 0.0 - - 0.1 - - - - 0.1
Developing economies 52.3 2 175.7 1 051.4 498.7 25.6 527.0 5 855.1 528.0 46.4 368.9 3.2 4 908.6Africa 1.0 - 0.2 - - 0.2 111.4 0.4 - 0.3 - 110.7
Angola - - - - - - - - - - - -British Indian Ocean Territory - - 0.2 - - 0.2 0.3 - - 0.3 - -Liberia 1.0 - 0.0 - - 0.0 110.8 0.3 - - - 110.4Mauritius - - - - - - 0.3 - - - - 0.3Seychelles - - - - - - - - - - - -South Africa - - - - - - 0.0 0.0 - - - -
Latin America and the Caribbean 51.2 2 175.7 1 017.2 464.6 25.6 526.9 5 716.8 523.1 46.4 368.3 3.2 4 775.8South America 9.0 29.9 466.0 128.3 18.2 319.6 907.6 115.1 4.5 73.8 0.0 714.2
Argentina 3.7 6.7 53.4 45.3 8.1 0.0 142.2 5.0 - 2.3 - 134.8Bolivia - - - - - - 4.2 - - - - 4.2Chile 0.0 0.0 - - - - 8.6 1.9 - - 0.0 6.6Colombia - - - - - - - - - - - -Ecuador - - - - - - - - - - - -Guyana - - - - - - - - - - - -Paraguay 0.0 - - - - - 1.5 0.2 - - - 1.3Peru - 0.4 - - - - 0.2 - - - - 0.2Uruguay 5.3 22.6 398.9 69.3 10.1 319.5 748.1 106.4 4.5 71.3 - 565.9Venezuela - - 13.7 13.7 - - 2.9 1.5 - 0.2 - 1.2
Other Latin America and Caribbean 42.2 2 145.9 551.1 336.3 7.5 207.3 4 765.5 402.6 41.9 294.6 3.2 4 023.3Anguilla - - - - - - - - - - - -Antigua and Barbuda - - - - - - 1.9 - - - - 1.9Aruba - - - - - - - - - - - -Bahamas 1.4 4.0 252.5 220.7 - 31.8 424.4 16.6 1.7 0.6 - 405.5Barbados 0.0 389.9 7.5 - 7.5 - 15.4 0.0 - 0.9 - 14.5Belize - - - - - - 15.0 15.0 - - - -Bermuda 17.6 182.9 - - - - 819.3 2.7 - 84.2 - 732.4British Virgin Islands 0.4 899.5 51.8 37.7 - 14.1 969.6 212.5 25.5 69.4 - 662.2Cayman Islands 0.5 667.9 60.3 57.8 - 2.5 1 929.5 75.3 - 128.4 3.0 1 722.8Costa Rica - - - - - - 11.1 - - - - 11.1Cuba 0.0 - - - - - - - - - - -Mexico 0.0 - - - - - 21.0 - - 0.0 - 21.0Netherlands Antilles 0.2 0.4 3.7 3.7 - - 241.5 42.3 12.4 7.9 - 178.9Panama 21.8 0.7 174.4 15.5 - 158.9 314.0 37.9 2.3 3.1 0.2 270.5Puerto Rico - 0.5 - - - - 0.6 - - - - 0.6Saint Vincent and the Grenadines - - - - - - 0.2 0.2 - - - -Turks and Caicos - - 0.8 0.8 - - 0.0 0.0 - - - -US Virgin Islands 0.2 0.1 - - - - 1.8 - - - - 1.8
Unspecified Latin America and Caribb - - - - - - 43.7 5.4 - - - 38.3Asia - - 34.1 34.1 - - 26.9 4.5 - 0.2 - 22.2
West Asia - - 23.0 23.0 - - 14.1 - - - - 14.1Bahrain - - 23.0 23.0 - - 11.6 - - - - 11.6Cyprus - - - - - - 1.5 - - - - 1.5Iran, Islamic Republic of - - - - - - - - - - - -Jordan - - - - - - - - - - - -Kuwait - - - - - - 0.8 - - - - 0.8Lebanon - - - - - - 0.2 - - - - 0.2Qatar - - - - - - 0.0 - - - - 0.0
South, East and South-East Asia - - 11.1 11.1 - - 12.8 4.5 - 0.2 - 8.1China - - - - - - 2.2 - - 0.2 - 2.0Hong Kong, China - - 1.9 1.9 - - 6.9 2.7 - - - 4.2India - - - - - - 0.7 - - - - 0.7Malaysia - - - - - - - - - - - -Republic of Korea - - 9.1 9.1 - - 2.6 1.8 - - - 0.8Singapore - - - - - - 0.4 - - - - 0.4Taiwan Province of China - - - - - - - - - - - -
The Pacific - - - - - - 0.0 - - - - 0.0Marshall Islands - - - - - - - - - - - -
Central and Eastern Europe - - - - - - 0.2 - - - - 0.2Czech Republic - - - - - - - - - - - -Hungary - - - - - - - - - - - -Slovakia - - - - - - 0.2 - - - - 0.2
Unspecified 0.3 495.8 1 057.0 1 054.8 1.8 0.3 225.9 32.6 0.0 1.5 0.0 191.7/…
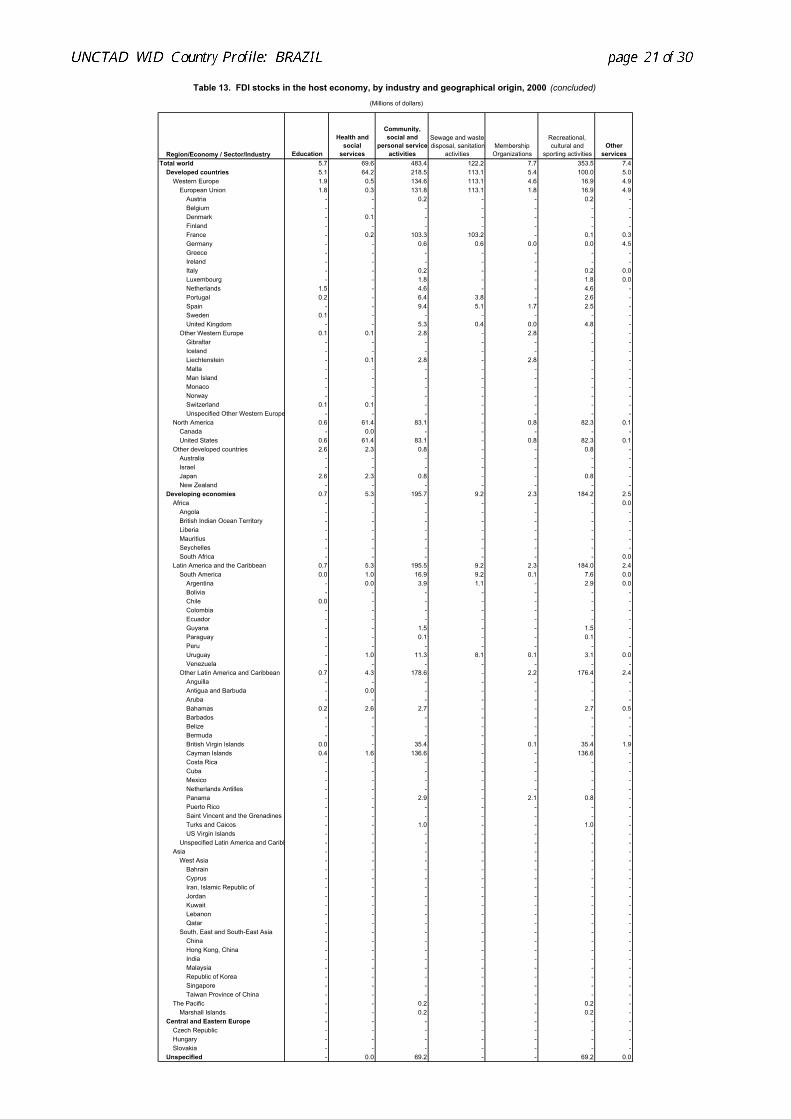
Table 13. FDI stocks in the host economy, by industry and geographical origin, 2000 (concluded)(Millions of dollars)
Region/Economy / Sector/Industry Education
Health and social
services
Community, social and
personal service activities
Sewage and waste disposal, sanitation
activitiesMembership
Organizations
Recreational, cultural and
sporting activitiesOther
servicesTotal world 5.7 69.6 483.4 122.2 7.7 353.5 7.4
Developed countries 5.1 64.2 218.5 113.1 5.4 100.0 5.0Western Europe 1.9 0.5 134.6 113.1 4.6 16.9 4.9
European Union 1.8 0.3 131.8 113.1 1.8 16.9 4.9Austria - - 0.2 - - 0.2 -Belgium - - - - - - -Denmark - 0.1 - - - - -Finland - - - - - - -France - 0.2 103.3 103.2 - 0.1 0.3Germany - - 0.6 0.6 0.0 0.0 4.5Greece - - - - - - -Ireland - - - - - - -Italy - - 0.2 - - 0.2 0.0Luxembourg - - 1.8 - - 1.8 0.0Netherlands 1.5 - 4.6 - - 4.6 -Portugal 0.2 - 6.4 3.8 - 2.6 -Spain - - 9.4 5.1 1.7 2.5 -Sweden 0.1 - - - - - -United Kingdom - - 5.3 0.4 0.0 4.8 -
Other Western Europe 0.1 0.1 2.8 - 2.8 - -Gibraltar - - - - - - -Iceland - - - - - - -Liechtenstein - 0.1 2.8 - 2.8 - -Malta - - - - - - -Man Island - - - - - - -Monaco - - - - - - -Norway - - - - - - -Switzerland 0.1 0.1 - - - - -Unspecified Other Western Europe - - - - - - -
North America 0.6 61.4 83.1 - 0.8 82.3 0.1Canada - 0.0 - - - - -United States 0.6 61.4 83.1 - 0.8 82.3 0.1
Other developed countries 2.6 2.3 0.8 - - 0.8 -Australia - - - - - - -Israel - - - - - - -Japan 2.6 2.3 0.8 - - 0.8 -New Zealand - - - - - - -
Developing economies 0.7 5.3 195.7 9.2 2.3 184.2 2.5Africa - - - - - - 0.0
Angola - - - - - - -British Indian Ocean Territory - - - - - - -Liberia - - - - - - -Mauritius - - - - - - -Seychelles - - - - - - -South Africa - - - - - - 0.0
Latin America and the Caribbean 0.7 5.3 195.5 9.2 2.3 184.0 2.4South America 0.0 1.0 16.9 9.2 0.1 7.6 0.0
Argentina - 0.0 3.9 1.1 - 2.9 0.0Bolivia - - - - - - -Chile 0.0 - - - - - -Colombia - - - - - - -Ecuador - - - - - - -Guyana - - 1.5 - - 1.5 -Paraguay - - 0.1 - - 0.1 -Peru - - - - - - -Uruguay - 1.0 11.3 8.1 0.1 3.1 0.0Venezuela - - - - - - -
Other Latin America and Caribbean 0.7 4.3 178.6 - 2.2 176.4 2.4Anguilla - - - - - - -Antigua and Barbuda - 0.0 - - - - -Aruba - - - - - - -Bahamas 0.2 2.6 2.7 - - 2.7 0.5Barbados - - - - - - -Belize - - - - - - -Bermuda - - - - - - -British Virgin Islands 0.0 - 35.4 - 0.1 35.4 1.9Cayman Islands 0.4 1.6 136.6 - - 136.6 -Costa Rica - - - - - - -Cuba - - - - - - -Mexico - - - - - - -Netherlands Antilles - - - - - - -Panama - - 2.9 - 2.1 0.8 -Puerto Rico - - - - - - -Saint Vincent and the Grenadines - - - - - - -Turks and Caicos - - 1.0 - - 1.0 -US Virgin Islands - - - - - - -
Unspecified Latin America and Caribb - - - - - - -Asia - - - - - - -
West Asia - - - - - - -Bahrain - - - - - - -Cyprus - - - - - - -Iran, Islamic Republic of - - - - - - -Jordan - - - - - - -Kuwait - - - - - - -Lebanon - - - - - - -Qatar - - - - - - -
South, East and South-East Asia - - - - - - -China - - - - - - -Hong Kong, China - - - - - - -India - - - - - - -Malaysia - - - - - - -Republic of Korea - - - - - - -Singapore - - - - - - -Taiwan Province of China - - - - - - -
The Pacific - - 0.2 - - 0.2 -Marshall Islands - - 0.2 - - 0.2 -
Central and Eastern Europe - - - - - - -Czech Republic - - - - - - -Hungary - - - - - - -Slovakia - - - - - - -
Unspecified - 0.0 69.2 - - 69.2 0.0
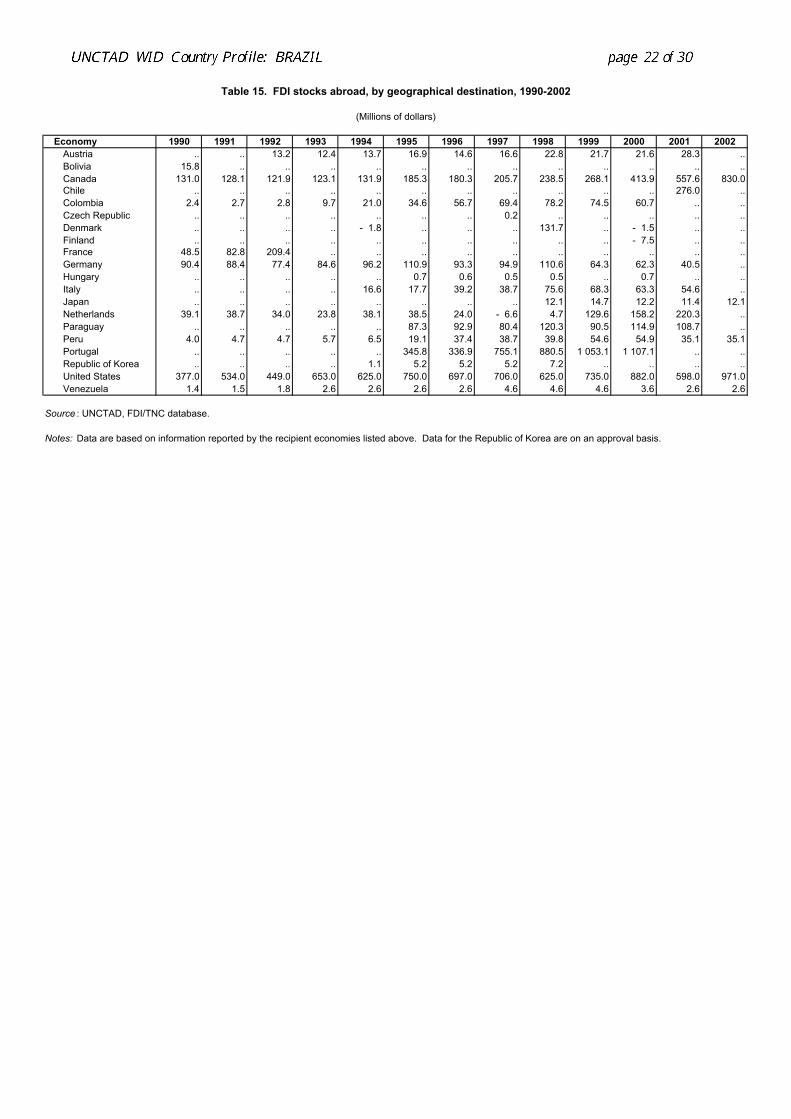
Table 15. FDI stocks abroad, by geographical destination, 1990-2002
(Millions of dollars)
Economy 1990 1991 1992 1993 1994 1995 1996 1997 1998 1999 2000 2001 2002Austria .. .. 13.2 12.4 13.7 16.9 14.6 16.6 22.8 21.7 21.6 28.3 ..Bolivia 15.8 .. .. .. .. .. .. .. .. .. .. .. ..Canada 131.0 128.1 121.9 123.1 131.9 185.3 180.3 205.7 238.5 268.1 413.9 557.6 830.0Chile .. .. .. .. .. .. .. .. .. .. .. 276.0 ..Colombia 2.4 2.7 2.8 9.7 21.0 34.6 56.7 69.4 78.2 74.5 60.7 .. ..Czech Republic .. .. .. .. .. .. .. 0.2 .. .. .. .. ..Denmark .. .. .. .. - 1.8 .. .. .. 131.7 .. - 1.5 .. ..Finland .. .. .. .. .. .. .. .. .. .. - 7.5 .. ..France 48.5 82.8 209.4 .. .. .. .. .. .. .. .. .. ..Germany 90.4 88.4 77.4 84.6 96.2 110.9 93.3 94.9 110.6 64.3 62.3 40.5 ..Hungary .. .. .. .. .. 0.7 0.6 0.5 0.5 .. 0.7 .. ..Italy .. .. .. .. 16.6 17.7 39.2 38.7 75.6 68.3 63.3 54.6 ..Japan .. .. .. .. .. .. .. .. 12.1 14.7 12.2 11.4 12.1Netherlands 39.1 38.7 34.0 23.8 38.1 38.5 24.0 - 6.6 4.7 129.6 158.2 220.3 ..Paraguay .. .. .. .. .. 87.3 92.9 80.4 120.3 90.5 114.9 108.7 ..Peru 4.0 4.7 4.7 5.7 6.5 19.1 37.4 38.7 39.8 54.6 54.9 35.1 35.1Portugal .. .. .. .. .. 345.8 336.9 755.1 880.5 1 053.1 1 107.1 .. ..Republic of Korea .. .. .. .. 1.1 5.2 5.2 5.2 7.2 .. .. .. ..United States 377.0 534.0 449.0 653.0 625.0 750.0 697.0 706.0 625.0 735.0 882.0 598.0 971.0Venezuela 1.4 1.5 1.8 2.6 2.6 2.6 2.6 4.6 4.6 4.6 3.6 2.6 2.6
Source : UNCTAD, FDI/TNC database.
Notes: Data are based on information reported by the recipient economies listed above. Data for the Republic of Korea are on an approval basis.
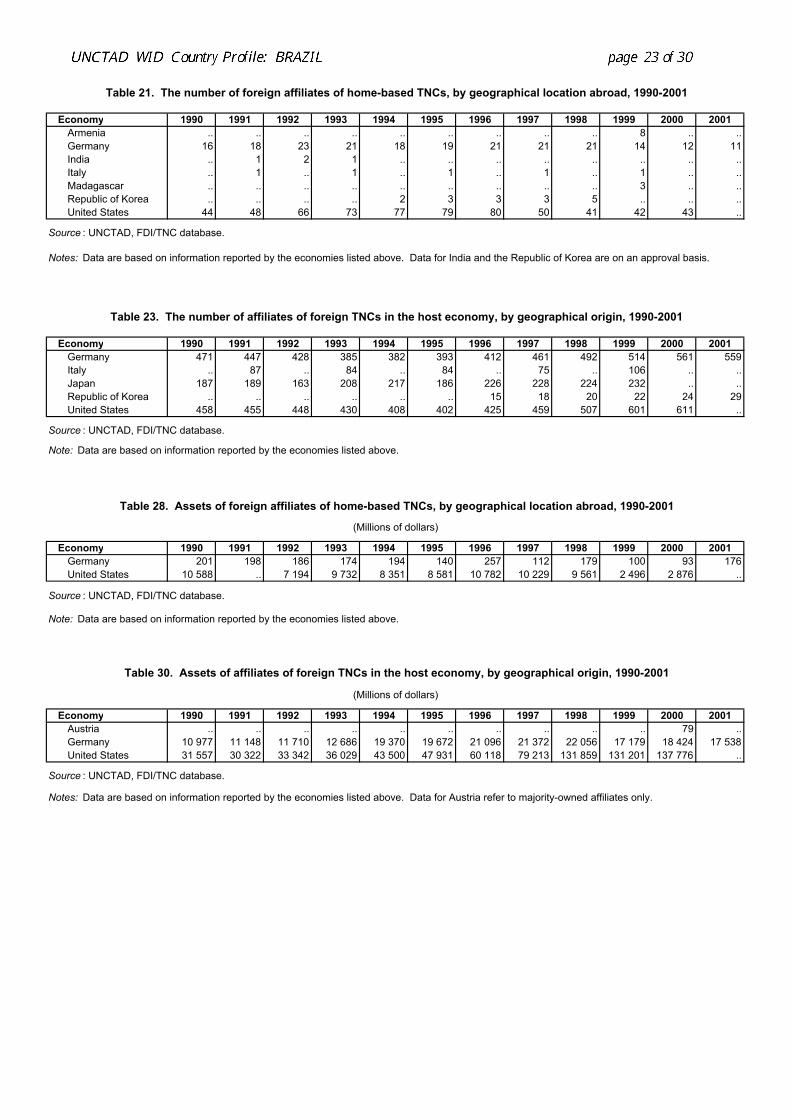
Table 21. The number of foreign affiliates of home-based TNCs, by geographical location abroad, 1990-2001
Economy 1990 1991 1992 1993 1994 1995 1996 1997 1998 1999 2000 2001Armenia .. .. .. .. .. .. .. .. .. 8 .. ..Germany 16 18 23 21 18 19 21 21 21 14 12 11India .. 1 2 1 .. .. .. .. .. .. .. ..Italy .. 1 .. 1 .. 1 .. 1 .. 1 .. ..Madagascar .. .. .. .. .. .. .. .. .. 3 .. ..Republic of Korea .. .. .. .. 2 3 3 3 5 .. .. ..United States 44 48 66 73 77 79 80 50 41 42 43 ..
Source : UNCTAD, FDI/TNC database.
Notes: Data are based on information reported by the economies listed above. Data for India and the Republic of Korea are on an approval basis.
Table 23. The number of affiliates of foreign TNCs in the host economy, by geographical origin, 1990-2001
Economy 1990 1991 1992 1993 1994 1995 1996 1997 1998 1999 2000 2001Germany 471 447 428 385 382 393 412 461 492 514 561 559Italy .. 87 .. 84 .. 84 .. 75 .. 106 .. ..Japan 187 189 163 208 217 186 226 228 224 232 .. ..Republic of Korea .. .. .. .. .. .. 15 18 20 22 24 29United States 458 455 448 430 408 402 425 459 507 601 611 ..
Source : UNCTAD, FDI/TNC database.
Note: Data are based on information reported by the economies listed above.
Table 28. Assets of foreign affiliates of home-based TNCs, by geographical location abroad, 1990-2001
(Millions of dollars)
Economy 1990 1991 1992 1993 1994 1995 1996 1997 1998 1999 2000 2001Germany 201 198 186 174 194 140 257 112 179 100 93 176United States 10 588 .. 7 194 9 732 8 351 8 581 10 782 10 229 9 561 2 496 2 876 ..
Source : UNCTAD, FDI/TNC database.
Note: Data are based on information reported by the economies listed above.
Table 30. Assets of affiliates of foreign TNCs in the host economy, by geographical origin, 1990-2001
(Millions of dollars)
Economy 1990 1991 1992 1993 1994 1995 1996 1997 1998 1999 2000 2001Austria .. .. .. .. .. .. .. .. .. .. 79 ..Germany 10 977 11 148 11 710 12 686 19 370 19 672 21 096 21 372 22 056 17 179 18 424 17 538United States 31 557 30 322 33 342 36 029 43 500 47 931 60 118 79 213 131 859 131 201 137 776 ..
Source : UNCTAD, FDI/TNC database.
Notes: Data are based on information reported by the economies listed above. Data for Austria refer to majority-owned affiliates only.
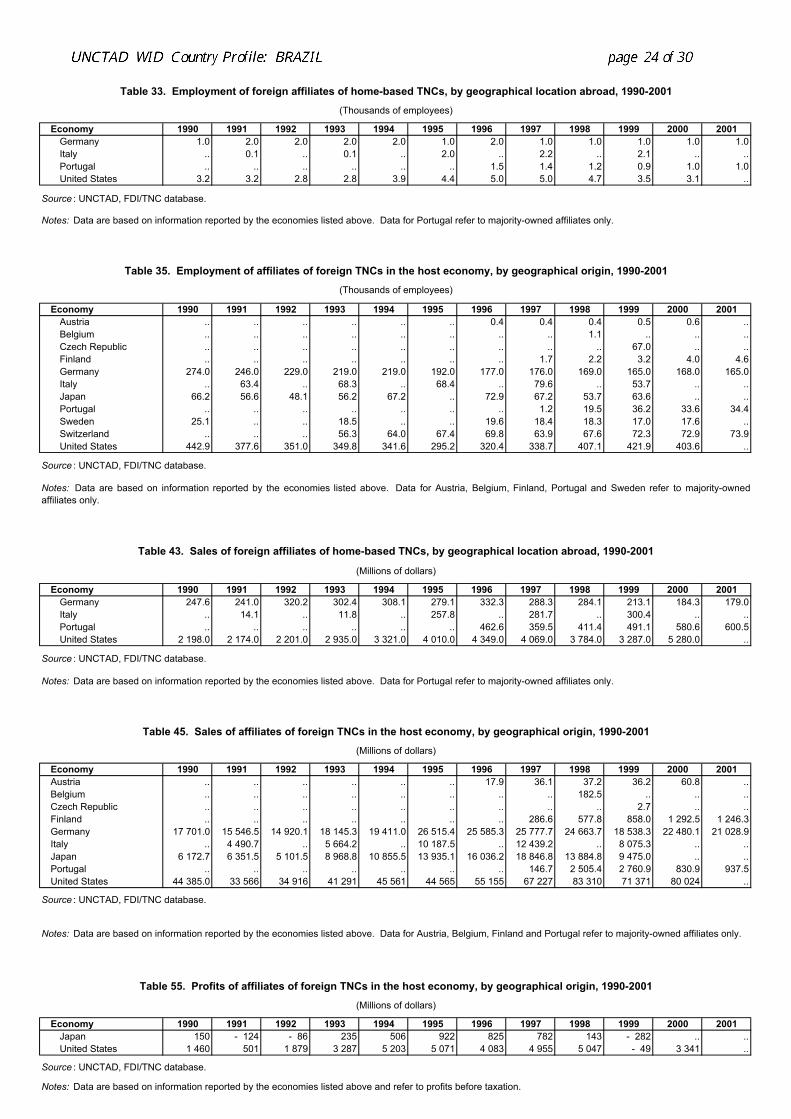
Table 33. Employment of foreign affiliates of home-based TNCs, by geographical location abroad, 1990-2001(Thousands of employees)
Economy 1990 1991 1992 1993 1994 1995 1996 1997 1998 1999 2000 2001Germany 1.0 2.0 2.0 2.0 2.0 1.0 2.0 1.0 1.0 1.0 1.0 1.0Italy .. 0.1 .. 0.1 .. 2.0 .. 2.2 .. 2.1 .. ..Portugal .. .. .. .. .. .. 1.5 1.4 1.2 0.9 1.0 1.0United States 3.2 3.2 2.8 2.8 3.9 4.4 5.0 5.0 4.7 3.5 3.1 ..
Source : UNCTAD, FDI/TNC database.
Notes: Data are based on information reported by the economies listed above. Data for Portugal refer to majority-owned affiliates only.
Table 35. Employment of affiliates of foreign TNCs in the host economy, by geographical origin, 1990-2001(Thousands of employees)
Economy 1990 1991 1992 1993 1994 1995 1996 1997 1998 1999 2000 2001Austria .. .. .. .. .. .. 0.4 0.4 0.4 0.5 0.6 ..Belgium .. .. .. .. .. .. .. .. 1.1 .. .. ..Czech Republic .. .. .. .. .. .. .. .. .. 67.0 .. ..Finland .. .. .. .. .. .. .. 1.7 2.2 3.2 4.0 4.6Germany 274.0 246.0 229.0 219.0 219.0 192.0 177.0 176.0 169.0 165.0 168.0 165.0Italy .. 63.4 .. 68.3 .. 68.4 .. 79.6 .. 53.7 .. ..Japan 66.2 56.6 48.1 56.2 67.2 .. 72.9 67.2 53.7 63.6 .. ..Portugal .. .. .. .. .. .. .. 1.2 19.5 36.2 33.6 34.4Sweden 25.1 .. .. 18.5 .. .. 19.6 18.4 18.3 17.0 17.6 ..Switzerland .. .. .. 56.3 64.0 67.4 69.8 63.9 67.6 72.3 72.9 73.9United States 442.9 377.6 351.0 349.8 341.6 295.2 320.4 338.7 407.1 421.9 403.6 ..
Source : UNCTAD, FDI/TNC database.
Table 43. Sales of foreign affiliates of home-based TNCs, by geographical location abroad, 1990-2001
(Millions of dollars)
Economy 1990 1991 1992 1993 1994 1995 1996 1997 1998 1999 2000 2001Germany 247.6 241.0 320.2 302.4 308.1 279.1 332.3 288.3 284.1 213.1 184.3 179.0Italy .. 14.1 .. 11.8 .. 257.8 .. 281.7 .. 300.4 .. ..Portugal .. .. .. .. .. .. 462.6 359.5 411.4 491.1 580.6 600.5United States 2 198.0 2 174.0 2 201.0 2 935.0 3 321.0 4 010.0 4 349.0 4 069.0 3 784.0 3 287.0 5 280.0 ..
Source : UNCTAD, FDI/TNC database.
Notes: Data are based on information reported by the economies listed above. Data for Portugal refer to majority-owned affiliates only.
Table 45. Sales of affiliates of foreign TNCs in the host economy, by geographical origin, 1990-2001(Millions of dollars)
Economy 1990 1991 1992 1993 1994 1995 1996 1997 1998 1999 2000 2001Austria .. .. .. .. .. .. 17.9 36.1 37.2 36.2 60.8 ..Belgium .. .. .. .. .. .. .. .. 182.5 .. .. ..Czech Republic .. .. .. .. .. .. .. .. .. 2.7 .. ..Finland .. .. .. .. .. .. .. 286.6 577.8 858.0 1 292.5 1 246.3Germany 17 701.0 15 546.5 14 920.1 18 145.3 19 411.0 26 515.4 25 585.3 25 777.7 24 663.7 18 538.3 22 480.1 21 028.9Italy .. 4 490.7 .. 5 664.2 .. 10 187.5 .. 12 439.2 .. 8 075.3 .. ..Japan 6 172.7 6 351.5 5 101.5 8 968.8 10 855.5 13 935.1 16 036.2 18 846.8 13 884.8 9 475.0 .. ..Portugal .. .. .. .. .. .. .. 146.7 2 505.4 2 760.9 830.9 937.5United States 44 385.0 33 566 34 916 41 291 45 561 44 565 55 155 67 227 83 310 71 371 80 024 ..
Source : UNCTAD, FDI/TNC database.
Table 55. Profits of affiliates of foreign TNCs in the host economy, by geographical origin, 1990-2001(Millions of dollars)
Economy 1990 1991 1992 1993 1994 1995 1996 1997 1998 1999 2000 2001Japan 150 - 124 - 86 235 506 922 825 782 143 - 282 .. ..United States 1 460 501 1 879 3 287 5 203 5 071 4 083 4 955 5 047 - 49 3 341 ..
Source : UNCTAD, FDI/TNC database.
Notes: Data are based on information reported by the economies listed above and refer to profits before taxation.
Notes: Data are based on information reported by the economies listed above. Data for Austria, Belgium, Finland, Portugal and Sweden refer to majority-ownedaffiliates only.
Notes: Data are based on information reported by the economies listed above. Data for Austria, Belgium, Finland and Portugal refer to majority-owned affiliates only.
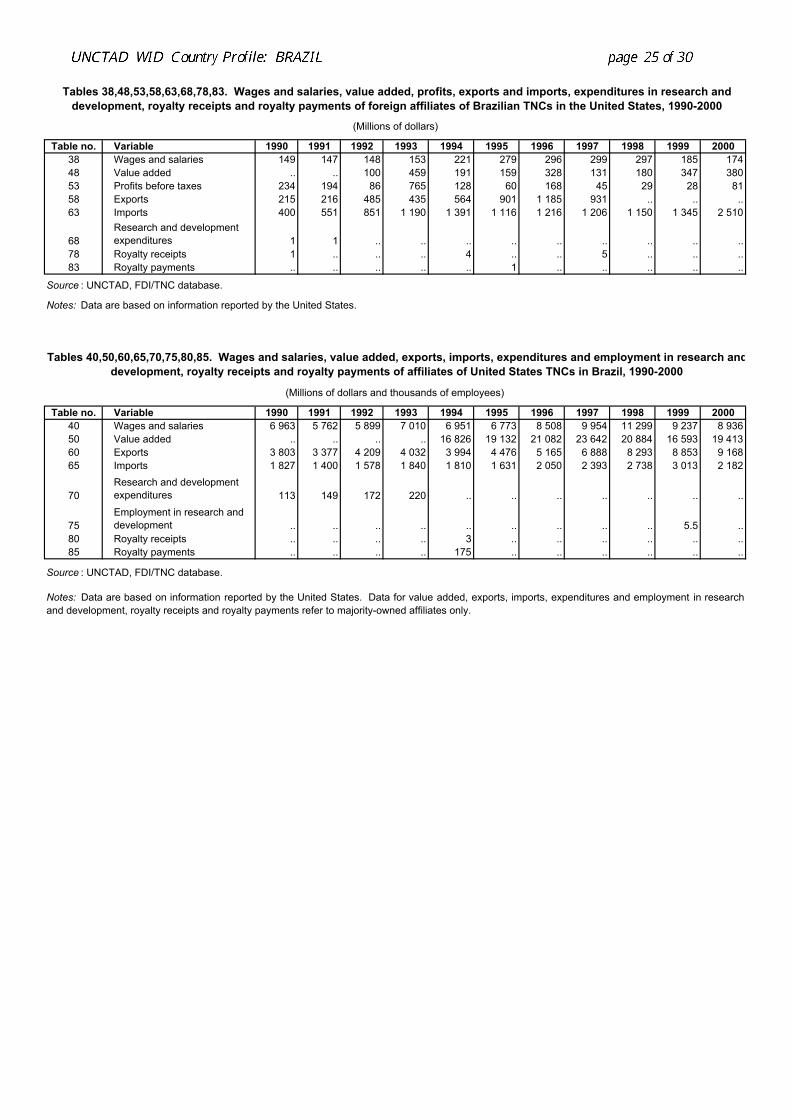
(Millions of dollars)
Table no. Variable 1990 1991 1992 1993 1994 1995 1996 1997 1998 1999 200038 Wages and salaries 149 147 148 153 221 279 296 299 297 185 17448 Value added .. .. 100 459 191 159 328 131 180 347 38053 Profits before taxes 234 194 86 765 128 60 168 45 29 28 8158 Exports 215 216 485 435 564 901 1 185 931 .. .. ..63 Imports 400 551 851 1 190 1 391 1 116 1 216 1 206 1 150 1 345 2 510
68Research and development expenditures 1 1 .. .. .. .. .. .. .. .. ..
78 Royalty receipts 1 .. .. .. 4 .. .. 5 .. .. ..83 Royalty payments .. .. .. .. .. 1 .. .. .. .. ..
Source : UNCTAD, FDI/TNC database.
Notes: Data are based on information reported by the United States.
(Millions of dollars and thousands of employees)
Table no. Variable 1990 1991 1992 1993 1994 1995 1996 1997 1998 1999 200040 Wages and salaries 6 963 5 762 5 899 7 010 6 951 6 773 8 508 9 954 11 299 9 237 8 93650 Value added .. .. .. .. 16 826 19 132 21 082 23 642 20 884 16 593 19 41360 Exports 3 803 3 377 4 209 4 032 3 994 4 476 5 165 6 888 8 293 8 853 9 16865 Imports 1 827 1 400 1 578 1 840 1 810 1 631 2 050 2 393 2 738 3 013 2 182
70Research and development expenditures 113 149 172 220 .. .. .. .. .. .. ..
75Employment in research and development .. .. .. .. .. .. .. .. .. 5.5 ..
80 Royalty receipts .. .. .. .. 3 .. .. .. .. .. ..85 Royalty payments .. .. .. .. 175 .. .. .. .. .. ..
Source : UNCTAD, FDI/TNC database.
Tables 38,48,53,58,63,68,78,83. Wages and salaries, value added, profits, exports and imports, expenditures in research and development, royalty receipts and royalty payments of foreign affiliates of Brazilian TNCs in the United States, 1990-2000
Tables 40,50,60,65,70,75,80,85. Wages and salaries, value added, exports, imports, expenditures and employment in research anddevelopment, royalty receipts and royalty payments of affiliates of United States TNCs in Brazil, 1990-2000
Notes: Data are based on information reported by the United States. Data for value added, exports, imports, expenditures and employment in researchand development, royalty receipts and royalty payments refer to majority-owned affiliates only.
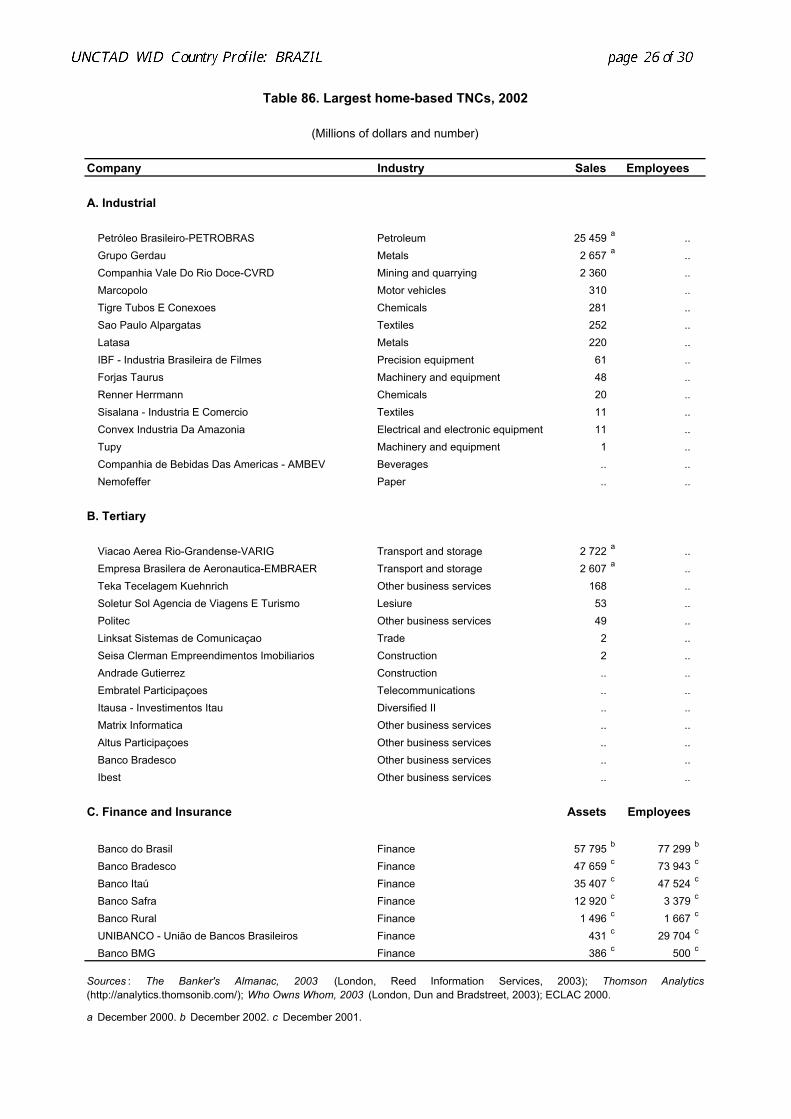
Table 86. Largest home-based TNCs, 2002
(Millions of dollars and number)
Company Industry Sales Employees
A. Industrial
Petróleo Brasileiro-PETROBRAS Petroleum 25 459 a ..
Grupo Gerdau Metals 2 657 a ..
Companhia Vale Do Rio Doce-CVRD Mining and quarrying 2 360 ..Marcopolo Motor vehicles 310 ..Tigre Tubos E Conexoes Chemicals 281 ..Sao Paulo Alpargatas Textiles 252 ..Latasa Metals 220 ..IBF - Industria Brasileira de Filmes Precision equipment 61 ..Forjas Taurus Machinery and equipment 48 ..Renner Herrmann Chemicals 20 ..Sisalana - Industria E Comercio Textiles 11 ..Convex Industria Da Amazonia Electrical and electronic equipment 11 ..Tupy Machinery and equipment 1 ..Companhia de Bebidas Das Americas - AMBEV Beverages .. ..Nemofeffer Paper .. ..
B. Tertiary
Viacao Aerea Rio-Grandense-VARIG Transport and storage 2 722 a ..
Empresa Brasilera de Aeronautica-EMBRAER Transport and storage 2 607 a ..
Teka Tecelagem Kuehnrich Other business services 168 ..Soletur Sol Agencia de Viagens E Turismo Lesiure 53 ..Politec Other business services 49 ..Linksat Sistemas de Comunicaçao Trade 2 ..Seisa Clerman Empreendimentos Imobiliarios Construction 2 ..Andrade Gutierrez Construction .. ..Embratel Participaçoes Telecommunications .. ..Itausa - Investimentos Itau Diversified II .. ..Matrix Informatica Other business services .. ..Altus Participaçoes Other business services .. ..Banco Bradesco Other business services .. ..Ibest Other business services .. ..
C. Finance and Insurance Assets Employees
Banco do Brasil Finance 57 795 b 77 299 b
Banco Bradesco Finance 47 659 c 73 943 c
Banco Itaú Finance 35 407 c 47 524 c
Banco Safra Finance 12 920 c 3 379 c
Banco Rural Finance 1 496 c 1 667 c
UNIBANCO - União de Bancos Brasileiros Finance 431 c 29 704 c
Banco BMG Finance 386 c 500 c
a December 2000. b December 2002. c December 2001.
Sources : The Banker's Almanac, 2003 (London, Reed Information Services, 2003); Thomson Analytics(http://analytics.thomsonib.com/); Who Owns Whom, 2003 (London, Dun and Bradstreet, 2003); ECLAC 2000.
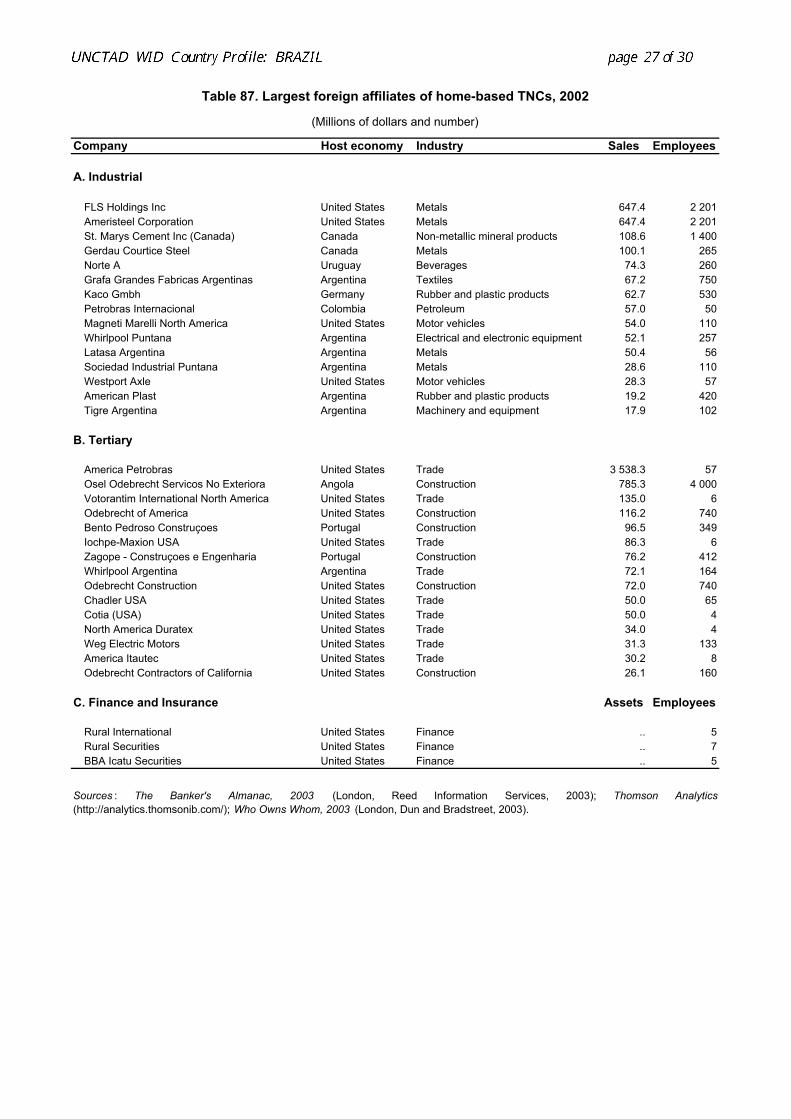
Table 87. Largest foreign affiliates of home-based TNCs, 2002
(Millions of dollars and number)
Company Host economy Industry Sales Employees
A. Industrial
FLS Holdings Inc United States Metals 647.4 2 201Ameristeel Corporation United States Metals 647.4 2 201St. Marys Cement Inc (Canada) Canada Non-metallic mineral products 108.6 1 400Gerdau Courtice Steel Canada Metals 100.1 265Norte A Uruguay Beverages 74.3 260Grafa Grandes Fabricas Argentinas Argentina Textiles 67.2 750Kaco Gmbh Germany Rubber and plastic products 62.7 530Petrobras Internacional Colombia Petroleum 57.0 50Magneti Marelli North America United States Motor vehicles 54.0 110Whirlpool Puntana Argentina Electrical and electronic equipment 52.1 257Latasa Argentina Argentina Metals 50.4 56Sociedad Industrial Puntana Argentina Metals 28.6 110Westport Axle United States Motor vehicles 28.3 57American Plast Argentina Rubber and plastic products 19.2 420Tigre Argentina Argentina Machinery and equipment 17.9 102
B. Tertiary
America Petrobras United States Trade 3 538.3 57Osel Odebrecht Servicos No Exteriora Angola Construction 785.3 4 000Votorantim International North America United States Trade 135.0 6Odebrecht of America United States Construction 116.2 740Bento Pedroso Construçoes Portugal Construction 96.5 349Iochpe-Maxion USA United States Trade 86.3 6Zagope - Construçoes e Engenharia Portugal Construction 76.2 412Whirlpool Argentina Argentina Trade 72.1 164Odebrecht Construction United States Construction 72.0 740Chadler USA United States Trade 50.0 65Cotia (USA) United States Trade 50.0 4North America Duratex United States Trade 34.0 4Weg Electric Motors United States Trade 31.3 133America Itautec United States Trade 30.2 8Odebrecht Contractors of California United States Construction 26.1 160
C. Finance and Insurance Assets Employees
Rural International United States Finance .. 5Rural Securities United States Finance .. 7BBA Icatu Securities United States Finance .. 5
Sources : The Banker's Almanac, 2003 (London, Reed Information Services, 2003); Thomson Analytics(http://analytics.thomsonib.com/); Who Owns Whom, 2003 (London, Dun and Bradstreet, 2003).
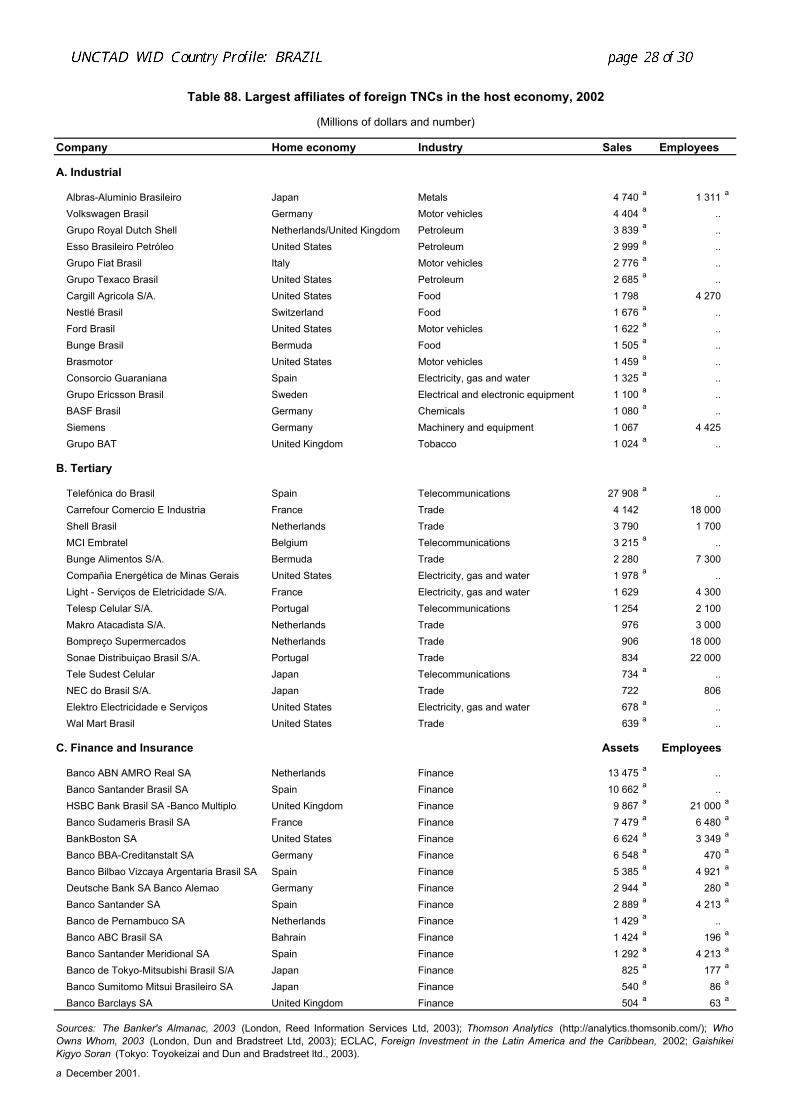
Table 88. Largest affiliates of foreign TNCs in the host economy, 2002
(Millions of dollars and number)
Company Home economy Industry Sales Employees
A. Industrial
Albras-Aluminio Brasileiro Japan Metals 4 740 a 1 311 a
Volkswagen Brasil Germany Motor vehicles 4 404 a ..
Grupo Royal Dutch Shell Netherlands/United Kingdom Petroleum 3 839 a ..
Esso Brasileiro Petróleo United States Petroleum 2 999 a ..
Grupo Fiat Brasil Italy Motor vehicles 2 776 a ..
Grupo Texaco Brasil United States Petroleum 2 685 a ..
Cargill Agricola S/A. United States Food 1 798 4 270Nestlé Brasil Switzerland Food 1 676 a ..
Ford Brasil United States Motor vehicles 1 622 a ..
Bunge Brasil Bermuda Food 1 505 a ..
Brasmotor United States Motor vehicles 1 459 a ..
Consorcio Guaraniana Spain Electricity, gas and water 1 325 a ..
Grupo Ericsson Brasil Sweden Electrical and electronic equipment 1 100 a ..
BASF Brasil Germany Chemicals 1 080 a ..
Siemens Germany Machinery and equipment 1 067 4 425Grupo BAT United Kingdom Tobacco 1 024 a ..
B. Tertiary
Telefónica do Brasil Spain Telecommunications 27 908 a ..
Carrefour Comercio E Industria France Trade 4 142 18 000Shell Brasil Netherlands Trade 3 790 1 700MCI Embratel Belgium Telecommunications 3 215 a ..
Bunge Alimentos S/A. Bermuda Trade 2 280 7 300Compañia Energética de Minas Gerais United States Electricity, gas and water 1 978 a ..
Light - Serviços de Eletricidade S/A. France Electricity, gas and water 1 629 4 300Telesp Celular S/A. Portugal Telecommunications 1 254 2 100Makro Atacadista S/A. Netherlands Trade 976 3 000Bompreço Supermercados Netherlands Trade 906 18 000Sonae Distribuiçao Brasil S/A. Portugal Trade 834 22 000Tele Sudest Celular Japan Telecommunications 734 a ..
NEC do Brasil S/A. Japan Trade 722 806Elektro Electricidade e Serviços United States Electricity, gas and water 678 a ..
Wal Mart Brasil United States Trade 639 a ..
C. Finance and Insurance Assets Employees
Banco ABN AMRO Real SA Netherlands Finance 13 475 a ..
Banco Santander Brasil SA Spain Finance 10 662 a ..
HSBC Bank Brasil SA -Banco Multiplo United Kingdom Finance 9 867 a 21 000 a
Banco Sudameris Brasil SA France Finance 7 479 a 6 480 a
BankBoston SA United States Finance 6 624 a 3 349 a
Banco BBA-Creditanstalt SA Germany Finance 6 548 a 470 a
Banco Bilbao Vizcaya Argentaria Brasil SA Spain Finance 5 385 a 4 921 a
Deutsche Bank SA Banco Alemao Germany Finance 2 944 a 280 a
Banco Santander SA Spain Finance 2 889 a 4 213 a
Banco de Pernambuco SA Netherlands Finance 1 429 a ..
Banco ABC Brasil SA Bahrain Finance 1 424 a 196 a
Banco Santander Meridional SA Spain Finance 1 292 a 4 213 a
Banco de Tokyo-Mitsubishi Brasil S/A Japan Finance 825 a 177 a
Banco Sumitomo Mitsui Brasileiro SA Japan Finance 540 a 86 a
Banco Barclays SA United Kingdom Finance 504 a 63 a
a December 2001.
Sources: The Banker's Almanac, 2003 (London, Reed Information Services Ltd, 2003); Thomson Analytics (http://analytics.thomsonib.com/); Who Owns Whom, 2003 (London, Dun and Bradstreet Ltd, 2003); ECLAC, Foreign Investment in the Latin America and the Caribbean, 2002; Gaishikei Kigyo Soran (Tokyo: Toyokeizai and Dun and Bradstreet ltd., 2003).
D. Sources of information Official
1. Central Bank of Brazil: http://www.bcb.gov.br 2. Investe Brasil: http://www.investebrasil.org/html/home.htm
Secondary
1. Costa, Ionara & Sergio Robles Reis de Queiroz, “Foreign direct investment and technological capabilities in Brazilian industry”, Research Policy, December 2002, Vol. 31, Issues 8 and 9, p. 1431.
2. Crener, Maxime A., Henault, Georges M. & Kahl, Alfred L., “Reduction of conflicts
between host governments and transnational corporations: a case study of Brazil”, Management International Review, 1983, Vol. 23, Issue 3, p. 36.
3. DeGouvea Neto, Raul, “Brazilian emerging multinationals: a conduit for export of
technology”, Thunderbird International Business Review, November/December 1995, Vol. 37, Issue 6, p. 583.
4. DeGouvea Neto, Raul, “Case study: TV Globo - The Brazilian media giant”,
Thunderbird International Business Review, March/April 1997, Vol. 39, Issue 2, p. 255.
5. DeGouvea Neto, Raul, “Mercosur: fostering regional economic integration”, Thunderbird International Business Review, November/December 1998, Vol. 40, Issue 6, p. 585.
6. DeGouvea Neto, Raul , “Brazil and Mexico - partners in sowing a free trade area of the
Americas”, Thunderbird International Business Review, September/October 2002, Vol. 44, Issue 5, p. 603.
7. DeGouvea, Raul & Jana Hranaiova, “Brazil and the FTAA: strategic trade options”,
Multinational Business Review, Fall 2002, vol. 10, Issue 2, p. 33.
8. DeSouza, Leao, Andrade, Guidelines on Brazil’s Foreign Investment Law, 2001.
9. Dias Martins, Monica, “Globalization and development in Brazil”, Latin American Perspectives, November 2002, Vol. 29, Issue 6, p. 94.
10. Hill, Joseph A, Hunt, Judith R, Vichas, Robert P., “Direct foreign investment in Latin
America: are governmental policies attracting or discouraging potential investors?”, International Journal of Management, September 1993, Vol. 10, Issue 3, p. 373.
11. Jacoby, David, “Anticipating the birth of the American Economic Area (AEA)”,
Multinational Business, Spring 1992, p. 37.
12. Jurn, Iksu & Hong Y Park, “The trade effects on the non-member countries of the regional integration: The case of the Mercosur”, Multinational Business Review, Fall 2002, vol. 10, Issue 2, p. 23.
13. Manzetti, Luigi, “The politics of privatization and deregulation in Latin America”,
Quarterly Review of Economics and Finance, Summer 1994, Vol. 34, p. 43.
14. Mortimore, Michael, “Corporate strategies for FDI in the context of Latin America's New Economic Model”, World Development, September 2000, Vol. 28, Issue 9, p. 1611.
15. Neves, Mario, Designing Polices that Stimulate Foreign Investment in Brazil
(Washington D.C.; The George Washington University), Fall 2002.
16. Robock, Stefan H., “Controlling multinational enterprises: The Brazilian experience”, Journal of Contemporary Business, Autumn 1977, Vol. 6, Issue 4, p. 53.
17. Shapiro, Helen, “Determinants of firm entry into the Brazilian automobile manufacturing
industry, 1956-1968”, Business History Review, Winter 1991, Vol. 65, Issue 4, p. 876.
18. Spalding, Mark, “Exporting environmentalism: U.S. multinational chemical corporations in Brazil and Mexico”, Journal of Environment & Development, June 2001, Vol. 10, Issue 2, p. 217.
19. Staubus, Janette, “The Brazilian-Argentine Free Trade Agreement: two weak links Join”,
Multinational Business, Spring 1989, p. 30.
20. Sutlja, George “The social and economic impacts of transnational corporation: Case studies of the U.S. paper industry in Brazil”, Journal of International Business Studies, Spring 1979,Vol. 10, Issue 1, p.108.
21. Vasconcellos, Geraldo M, “Factors affecting foreign direct investment in the Brazilian
manufacturing sector: 1955-1980”, Management International Review, Fourth Quarter 1988, vol. 28, Issue 4, p. 53.
22. Wells, Christopher, “Brazilian Multinationals”, Journal of World Business, Winter 1988,
Vol. 23, Issue 4, p. 13.
23. Willmore, Larry, “Transnationals and Foreign Trade: Evidence from Brazil”, The Journal of Development Studie, January 1992 Vol. 28, Issue 2, p. 314.