Embed Size (px)
Citation preview
Fore
st In
dust
ries
Inte
llige
nce
LTD
A TRAFFIC REPORT
A TRAFFIC REPORT
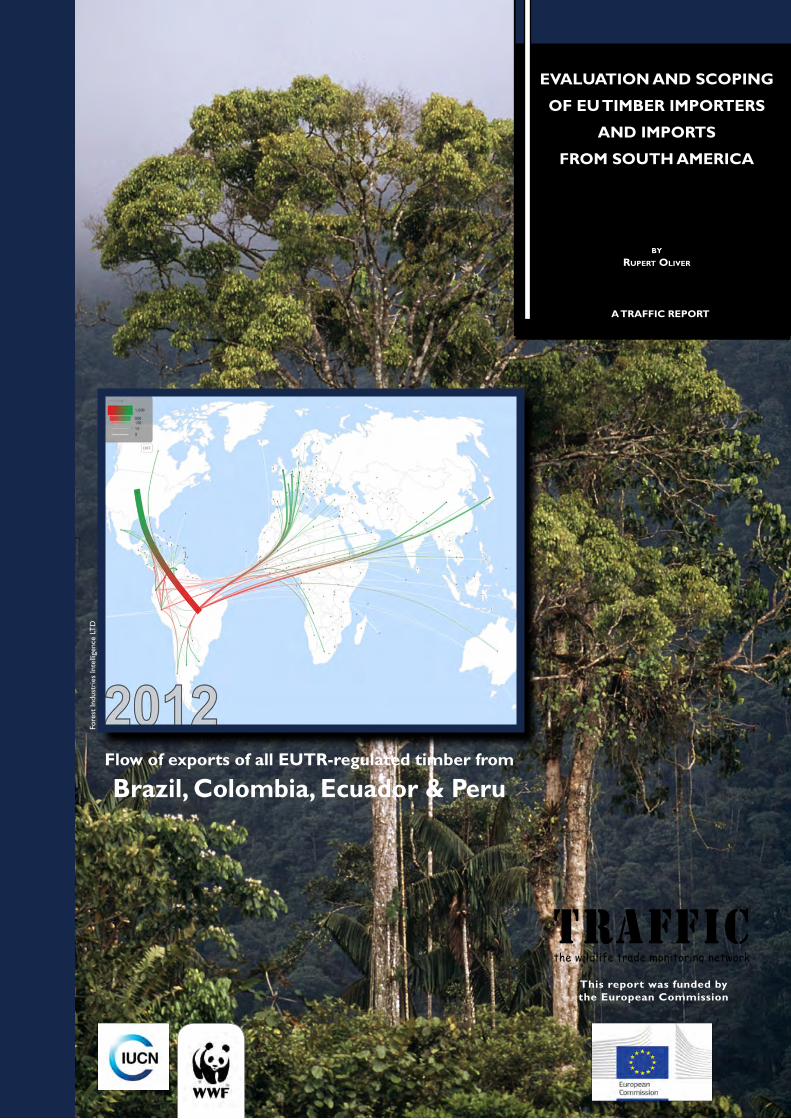
EvAluATIOn And sCOPIng
OF Eu TImbER ImPORTERs
And ImPORTs
FROm sOuTh AmERICA
by
RupeRt OliveR
Flow of exports of all EuTR-regulated timber from
brazil, Colombia, Ecuador & Peru
This report was funded by the European Commission
Published by TRAFFIC International, Cambridge, UK
© 2013 TRAFFIC InternationalAll rights reserved.
All material appearing in this publication is copyrightedand may be reproduced with permission. Any reproductionin full or in part of this publication must credit TRAFFIC International as the copyright owner.
The views of the authors expressed in this publication donot necessarily reflect those of the TRAFFIC network, WWF or IUCN
The designation of geographical entities in thispublication, and the presentation of the material, do notimply the expression of any opinion whatsoever on thepart of TRAFFIC or its supporting organizations concerning the legal status of any country, territory, or area, or its authorities, or concerningthe delimitation of its frontiers or boundaries.
Vernacular names as well as scientific names have been used throughout this report but it should be noted that vernacular names can apply to more than one species and often each species can have more than one vernacular name. This report has been produced responsibly and carefully, but disclaims all warranties, express or implied, as to the accuracy of the information
The TRAFFIC symbol copyright and RegisteredTrademark ownership is held by WWF. TRAFFIC is astrategic alliance of WWF and IUCN.
Suggested citation: Oliver, R. (2013). Evaluation and scoping of EU timber importers and imports from South America. TRAFFIC International.
ISBN 978-1-85850-358-5
Cover photograph:Rich and almost untouched forest that goes all the way to the Andean Highlands, Baboso, Colombia. Credit: Pablo Corral/WWF-Canon
TRAFFIC is a UK registered charity - 1076722
This publication has been produced with the financial assistance of the European Union. The contents of this document are the sole responsibility of TRAFFIC International and can under no circumstances be regarded as reflecting the position of the European Union.
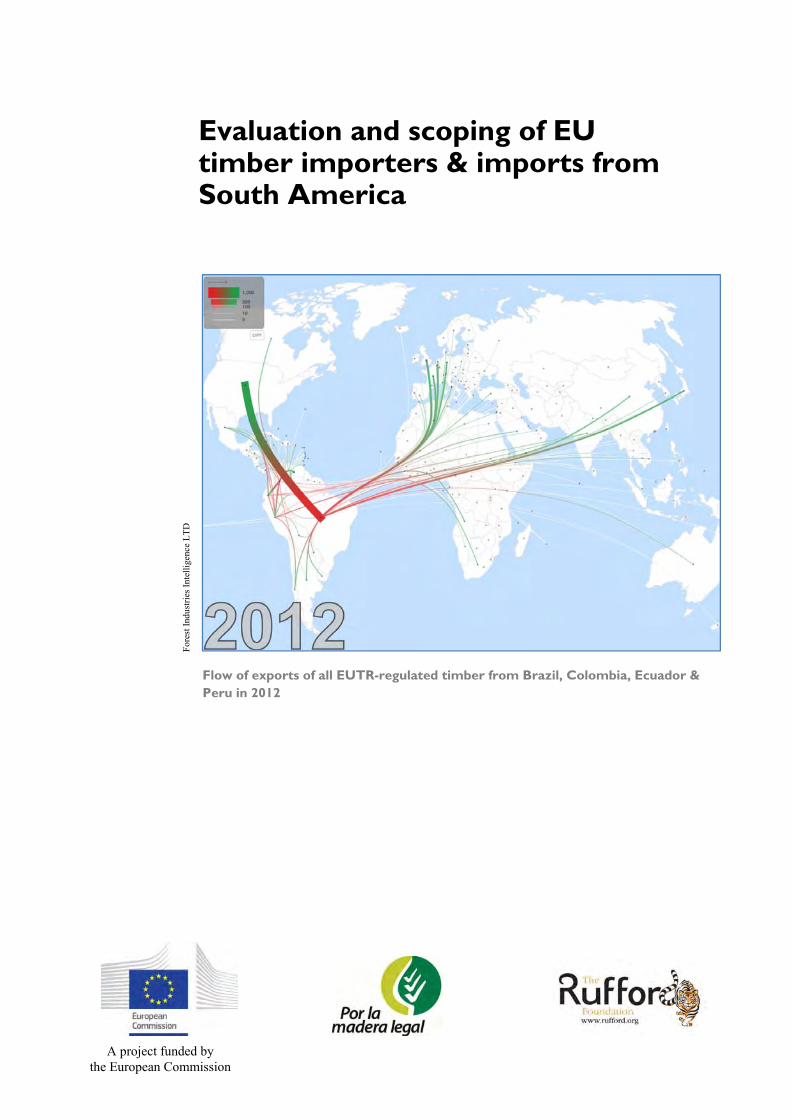
Evaluation and scoping of EU timber importers & imports from South America
Flow of exports of all EUTR-regulated timber from Brazil, Colombia, Ecuador & Peru in 2012
For
est I
ndus
tries
Inte
llige
nce
LTD
A project funded by the European Commission

Evaluation and scoping of EU timber importers & imports from South America
CONTENTS Acknowledgements ............................................................................................................................................ v
List of acronyms ................................................................................................................................................ v
Executive summary ........................................................................................................................................ viii
Introduction ....................................................................................................................................................... 1
Background ..................................................................................................................................................... 1
Study scope ...................................................................................................................................................... 1
Data sources and quality .................................................................................................................................. 2
Sources of trade data ...................................................................................................................................... 2
Quality of trade data ................................................................................................................................... 3
Production data ........................................................................................................................................... 6
Secondary sources ....................................................................................................................................... 7
Overarching trends .......................................................................................................................................... 7
Brazil ................................................................................................................................................................. 11
Wood supply .................................................................................................................................................. 11
Forest resources and tenure ....................................................................................................................... 11
Plantations ................................................................................................................................................. 12
Forest agencies .......................................................................................................................................... 13
Forest Regulation ...................................................................................................................................... 13
Forest certification .................................................................................................................................... 16
Timber production ..................................................................................................................................... 16
Trade overview .............................................................................................................................................. 18
EU timber and paper imports from Brazil ..................................................................................................... 20
Brazil timber and paper exports by product .................................................................................................. 22
Colombia .......................................................................................................................................................... 33
Wood supply .................................................................................................................................................. 33
Forest area and tenure .............................................................................................................................. 33
Forest regulation ....................................................................................................................................... 34
Natural forest management ....................................................................................................................... 35
Plantations ................................................................................................................................................. 35
Timber production ..................................................................................................................................... 36
Trade overview .............................................................................................................................................. 37
EU timber and paper imports from Colombia ............................................................................................... 39
Colombia timber and paper exports by product ............................................................................................ 41
Evaluation and scoping of EU timber importers & imports from South America
Ecuador ............................................................................................................................................................ 45
Wood supply .................................................................................................................................................. 45
Forest area and tenure .............................................................................................................................. 45
Forest regulation ....................................................................................................................................... 46
Plantations ................................................................................................................................................. 47
Timber production ..................................................................................................................................... 47
Forest products industry ............................................................................................................................ 48
Trade overview .............................................................................................................................................. 49
EU timber and paper products imports from Ecuador ................................................................................... 50
Ecuador timber and paper exports by product ............................................................................................... 51
Peru ................................................................................................................................................................... 55
Wood supply .................................................................................................................................................. 55
Forest resources and tenure ...................................................................................................................... 55
Plantations ................................................................................................................................................. 56
Forest regulation ....................................................................................................................................... 56
Forest production ...................................................................................................................................... 58
Trade overview .............................................................................................................................................. 59
EU timber and paper products imports from Peru ......................................................................................... 62
Peru timber and paper exports by product ..................................................................................................... 63
Conclusion………………………………………………………………………………………………… … 66
Evaluation and scoping of EU timber importers & imports from South America
ACKNOWLEDGEMENTS
TRAFFIC acknowledges the following for their support and reviewing the draft and providing comments: Nhaydu Bohorquez, Steven Broad, Anna Fanzeres, Teddi Peneherrera, Bernardo Ortiz, Luca Nizzola, Vasilis Tsipidis, Jose Nunez-Mino, Chen Hin Keong, Willow Outhwaite, Tom Osborn and Richard Thomas. Florence Bennett and Susan Vivian assisted in preparing the report for publication.
This publication is an activity of the EC funded project “Supporting the implementation of the EU-FLEGT Action Plan in South America: catalysing initiatives to control and verify the origin of timber in trade and support related improvements in forest governance” (DCI-ENV/21.040100/20-656/2011/277-872). The project is implemented by TRAFFIC, UICN-SUR and WWF-Colombia.
For more information on the project please visit: www.flegt.info
The Rufford Foundation is gratefully acknowledged for its publications production support to TRAFFIC.
LIST OF ACRONYMS
ADEX Peru’s Wood and Timber Industry Association AIDESEP Asociación Interétnica de Desarrollo de la Selva Peruana/Interethnic Association for the
Development of the Peruvian Rainforest AIMA Asociación Ecuatoriana de Industriales de Madera/Ecuador Wood Industry Association
ANLA Colombia National Authority of Environmental Licenses ASOTECA Asociación Ecuatoriana de Productores de Teca y Maderas Tropicales/Ecuador
Association for Teak and Tropical Wood Production
BTS Business and Trade Statistics Ltd
CERFLOR Brazil Certificação Florestal
CIF Certificado de Incentivo Forestal/Colombia Certificate of Incentives in Forestry CN Combined Nomenclature of the EU (relates to trade product codes)
CNFP Cadastro Nacional de Florestas Públicas/Brazil National Public Forest Registry
COMAFORS Corporación de Manejo Forestal Sustentable/Ecuador Sustainable Forest Management Corporation
COMEXT Eurostat External Trade database
CONAP Confederación de Nacionalidades Amazónicas del Perú/Confederation of Amazonian Nationalities of Peru
DANE La Sección de Estadísticas Ambientales de Naciones/Colombia National Statistics Office
Evaluation and scoping of EU timber importers & imports from South America
DETER Real Time System for Detection of Deforestation
DGFFS Direccion General de Flora y Fauna Silvestre/General Directorate of Forests and Wildlife of Peru
DOF Documento de Origen Forestal/IBAMA’s Forest Origin Document
EPRD Economic Policy and Regional Development Ltd
EU European Union
EUTR European Union Timber Regulation
FAO UN Food and Agriculture Organization
FII Forest Industries Intelligence Ltd
FLEGT Forest Law Enforcement, Governance and Trade
FPP Forest People’s Programme
FRA Forest Resource Assessment of the UN FAO
FSC Forest Stewardship Council
FTA Free Trade Agreement
FUNTAC Fundaçāo De Tecnología Do Acre/Technology Foundation of the State of Acre
GTA Global Trade Atlas HS Harmonized System (relates to trade product codes) IBAMA Instituto Brasileiro do Meio Ambiente e dos Recursos Naturais Renováveis
ICMBio Chico Mendes Institute for the Conservation of Biodiversity
IDEAM Instituto de Hidrología, Meteorología y Estudios Ambientales/Colombia Institute for Hydrology, Meteorology and Environment
IMAZON Instituto do Homem e Meio Ambiente da Amazônia/Institute of Man and Environment in the Amazon
INPE Brazilian National Institute of Space Research
INRENA Peru National Institute of Natural Resources ITTO International Tropical Timber Organization JFSQ Joint Forest Sector Questionnaire (regularly issued by UN)
MDF Medium Density Fibreboard
MINAGRI Ministry of Agriculture and Irrigation of Peru MMA Ministério do Meio Ambiente/Brazil Ministry of Environment
Evaluation and scoping of EU timber importers & imports from South America

NTFP Non-Timber Forest Product OSINFOR Organismo Supervisor de Recursos Forestales y del Fauna Silvestre/Peru Agency for the
Supervision of Forest Resources and Wildlife PAFSI Programas de Aprovechamiento Forestal Simplificado/Ecuador simplified forest
management programs PAFSU Programas de Aprovechamiento Forestal Sustentable/Ecuador sustainable forest
management programmes
PAOF Planejamento Anual de Outorga Florestal/Brazil Annual Forest Concession Plan PEFC Programme for Endorsement of Forest Certification
PFE Permanent Forest Estate (defined by ITTO)
PMFS Planos de manejo florestal sustentável/Brazilian sustainable forest management plans
POA Peru annual forest operating plans PPCDAm Plano de Prevenção e Controle do Desmatamento na Amazônia/Brazil's Action Plan for
Prevention and Control of Legal Amazon Deforestation PROFORESTAL Unidad Para el Desarrollo Forestal del Ecuador/Ecuador Unit of Forestry Development
RWE Roundwood Equivalent (relates to wood product volumes) SERFOR Servicio Nacional Forestal y de Fauna Silvestre/National Forest and Wildlife Service of
Peru SFB Serviço Florestal Brasileiro/Brazil Forest Service SFM Sustainable Forest Management SINAFOR National System of Forest and Wildlife Management of Peru SISFLORA Sistema de Comercialização e Transporte de Produtos Florestais/State of Mato Grosso
and Pará Forest Origin Document system UN United Nations UNECE United Nations Economic Commission for Europe
USA United States of America
Evaluation and scoping of EU timber importers & imports from South America
EXECUTIVE SUMMARY
South America contains approximately 21% of total world forest according to UN Food and Agriculture Organization (FAO) (2010) data, of which three quarters is primary forest. The Amazonian basin is estimated by FAO to host 799 million ha of forest of which 637 million ha is primary forest. In Brazil the proportion of primary forest exceeds 90%. Forest plantation area in South America, which contains predominantly eucalypt and pine species, is still quite limited but is expanding and these forests are contributing a rising share of the region’s timber supply. Between 2000 and 2010 South America’s plantation area increased 37% to 13.8 million ha. Plantations now make up 1.6% of total forest area of the region. Despite South America’s large forest area, it currently plays a relatively limited role in the global international (i.e. cross-border) trade in forest products, accounting for approximately 5% of the world’s timber and timber products exports. Brazil is by far the largest exporter of wood products in South America, alone accounting for 2.7% of world exports and 55% of exports by South American countries. Colombia, Ecuador and Peru are quite significant players in the regional South American market but are only relatively very small suppliers to the global market. Conditions in Amazonia are not conducive to the commercial production of timber for the international market. Large transport distances, infrequency of valuable timber species, lengthy wet seasons and the prevalence of short-term, forest conversion operations all add to the difficulties of commercial timber production. In recent years, the contribution of the Amazonian region to commercial supply of timber on international markets has been falling, driven by a range of factors including low international competitiveness and improved forest law enforcement, including on some of the most commercially valuable species. Other economic factors in South America have also contributed to Amazonia’s declining role in international wood markets, including volatility in exchange rates and rising regional demand which has further reduced incentives to export. Meanwhile, the principal export markets for Amazonian wood products have also been transformed in recent years. The value of global trade in all timber products declined sharply in 2009, mainly due to the severe economic downturn in Europe and North America. Importers in western countries are now much less inclined to purchase from areas like Amazonia where supplies are uncertain and irregular and prices volatile. Introduction of the US Lacey Act amendment in 2008 and the European Union Timber Regulation (EUTR) from March 2013 have further encouraged a more risk-adverse attitude amongst western importers. Efforts are now being made to help reverse the decline through a focus on more secure and less volatile supply of Amazonian wood products from legally-verified and certified forest areas. This effort also includes encouraging market recognition for a wider range of lesser-known Amazonian species so as to improve the financial returns from sustainable harvesting operations and to reduce the pressure on better known commercial species.
Evaluation and scoping of EU timber importers & imports from South America
This report contributes to monitoring the impact and effectiveness of European Forest Law Enforcement, Governance and Trade (FLEGT)-related policy measures in South America through provision of preliminary baseline data on changes in timber trade between the region and Europe and other world export markets. It brings up to date information from previous studies on trends in timber trade from South America to the European Union (EU) and allows for future monitoring of trade shifts from the focus countries to the EU 28 Member States. To put EU trade into context, the report also includes commentary on timber production in the focus countries and comprehensive data on exports of timber products to non-EU markets. A key aim of the report is to increase stakeholders’ understanding of the complexities of the trade between South America and Europe. The report provides a useful point of reference which can be used to design tools or guidelines in order to prioritize resources and efforts to support on-going improvements and compliance with the EUTR regulation and the FLEGT Action Plan more broadly. The report should also be useful to EU competent authorities, operators and traders for risk assessment and mitigation measures for timber destined for the EU markets. The report focuses on timber trade from Brazil, Colombia, Ecuador and Peru. It adopts a broad definition of "timber" to include all "timber and timber products" as defined by the EUTR. Analysis was conducted on timber products covered by the EUTR and excludes those also excluded by the EUTR. Information derives mainly from primary sources, particularly from COMEXT, the Eurostat reference database for external trade; Brazilian export data supplied by Business and Trade Statistics Ltd (BTS); and the Global Trade Atlas (GTA) by Global Trade Information Services. The quality of available trade data is highly variable and it can be said that in general trade value data tend to be more reliable than trade tonnage data, which in turn are more reliable than volumetric data. This report takes into account volumetric and tonnage data where appropriate, though results are presented in terms of trade value. Trade flow analysis of the four countries shows a dramatic downturn in trade to the USA between 2007 and 2012, characterized by a fall in plantation-derived softwood products (particularly from Brazil but reflective of the Amazonia region as a whole), in turn as a result of the financial crisis (reduction in demand), currency volatility and competition from China. The value of trade to Europe and Asia declined less markedly during the same period, with the fall in Amazonian product trade offset by an increase in exports of hardwood-derived wood pulp, mainly from Brazil plantations.
Evaluation and scoping of EU timber importers & imports from South America
INTRODUCTION
Background
This report has been commissioned by TRAFFIC and undertaken by Forest Industries Intelligence (FII), an independent UK-based consultancy. The report is part of the EU funded project “Supporting the implementation of the EU FLEGT Action Plan in South America: Catalysing initiatives to control and verify the origin of the timber in trade and support related improvements in forest governance"1. The project contributes to the EU policy and regulatory programme to support the fight against illegal logging including the Forest Law Enforcement, Governance and Trade (FLEGT) Action Plan and the EU Timber Regulation (EUTR). It aligns with measures in other timber consuming countries such as the Lacey Act Amendment in the USA, the Illegal Logging Act in Australia and explicit clauses included in Free Trade Agreements (FTA) such as the recently signed FTA between the EU and Peru. The report contributes to monitoring the impact and effectiveness of European FLEGT-related policy measures in South America through provision of preliminary baseline data on changes in timber trade between the region and Europe and other world export markets. It brings up-to-date information from previous studies on trends in timber trade from South America to the EU and allows for future monitoring of trade shifts from the focus countries to the EU 28 Member States2. To put EU trade into context, the report also includes commentary on timber production in the focus countries and comprehensive data on exports of timber products to non-EU markets. A key aim of the report is to increase stakeholders understanding of the complexities of the trade between South America and Europe. The report provides a useful point of reference which can be used to design tools or guidelines in order to prioritize resources and efforts to support on-going improvements and compliance with the EUTR regulation and the FLEGT Action Plan more broadly. The report should also be useful to EU competent authorities, operators and traders for risk assessment and mitigation measures for timber destined for the EU markets. Study scope
The study covers trade with four focus countries, namely Brazil, Colombia, Ecuador and Peru. It adopts a broad definition of "timber" to include all "timber and timber products" as defined by the EUTR. With reference to the EUTR3 and the EU's Combined Nomenclature (CN)4 for classification of traded goods into and within the EU, this report includes coverage of:
1 European Commission/EuropeAid Regional Programmes Latin America and Caribbean DCI‐ENV/21.040100/20‐656/2011/277‐872, Project website: www.flegt.info 2 Formerly the EU27, but 28 Member States since 1 July 2013 following Croatia’s accession to the EU 3 EUTR includes Regulation No 995/2010 of the European Parliament and of the Council of 20 October 2010, the Commission delegated Regulation of 23 February 2012, and the Commission implementing Regulation (EU) No 607/2012 of 6 July 2012. Further details and links to all formal documents are provided by the European Commission at http://ec.europa.eu/environment/forests/timber_regulation.htm
Evaluation and scoping of EU timber importers & imports from South America 1
The majority of solid timber products5 from CN Chapter (wood products) including: 4401 (fuelwood), 4403 (logs), 4406 (sleepers), 4407 (lumber), 4408 (veneer), 4409 (mouldings and strips), 4410 (particleboard), 4411 (fibreboard), 4412 (plywood), 4413 (densified wood), 4414 (frames for pictures and the like), 4415 (packing cases and pallets), 4416 (casks and barrels), and 4418 (joinery products).
All solid timber products in Chapter 94 (furniture) explicitly identified as composed of wood under the heading 9403 (other furniture categories) and 9406 (prefabricated buildings).
All virgin wood-based pulp products in Chapter 47, both mechanical and chemical, composed of softwood, hardwood and mixed wood species.
All products in Chapter 48 (Paper). The EUTR explicitly excludes some products from the definition of "timber and timber products" and these are also excluded from the analysis in this report. Exclusions include:
Solid timber products in CN Chapter 44 under headings 4402 (charcoal), 4417 (tools), 4419 (kitchenware), and 4420 (marquetry, ornaments and “other”).
Wood furniture in CN Chapter 94 under heading 9401 (seating) and all other furniture and pre-fabricated buildings from Chapter 94 that are not explicitly identified as composed primarily of wood.
All pulp types in CN Chapter 47 derived from fibres other than virgin wood fibre (such as recycled paper, cotton or bamboo) and all recovered paper.
All “printed paper” products in CN Chapter 49 such as books, newspapers and magazines. Data sources and quality Sources of trade data
The vast majority of the trade data in this report is derived and summarized from primary sources. Trade flow data are principally derived from three sources:
EU import data are ultimately derived from COMEXT, the Eurostat reference database for external trade. These data, which are provided by Eurostat in their raw form on a monthly basis6, have been thoroughly processed, analysed and summarized by Forest Industries Intelligence Ltd (FII)7.
Brazilian export data for timber products in CN Chapters 44 (wood) and 94 (furniture) have been prepared by FII from data supplied by Business and Trade Statistics Ltd (BTS), a UK based company which sources data from government statistical agencies around the world.
Data for pulp and paper exports from Brazil and all timber product exports from Colombia, Ecuador and Peru, are derived from the Global Trade Atlas (GTA) by Global Trade Information Services. This is an online subscription-based trade data system that allows users to view world trade flows for
4 The Combined Nomenclature (CN) is the EU component of the international Harmonized System (HS) of Customs products codes. Information and a link to the CN system of the EU is available at: http://ec.europa.eu/taxation_customs/customs/customs_duties/tariff_aspects/combined_nomenclature/ 5 Note that the term “solid timber products” is used throughout this report to differentiate timber products contained in Chapters 44 (wood) and 94 (furniture) from pulp and paper products. 6 Raw unprocessed COMEXT data for all commodities can be downloaded at: http://epp.eurostat.ec.europa.eu/NavTree_prod/everybody/BulkDownloadListing?sort=1&dir=comext%2F201211%2Fdata 7 A complete set of these data prepared by FII that have been cleaned and summarized (for each TRAFFIC focus country, EU Member State and product group) is available at: http://www.traffic.org/storage/TRAFFIC_all_EU_trade.xlsx
Evaluation and scoping of EU timber importers & imports from South America 2
products of interest using the latest import/export data from the official sources of more than 80 Countries8.
Quality of trade data
Based on FII’s analysis of international timber trade flows over many years, it can be said that, in general, trade value data tends to be more reliable than trade tonnage data, which in turn is more reliable than volumetric data (e.g. cubic metres). The collection of volumetric data on timber products is extremely prone to error, often so much that it is almost unusable. This applies equally to data derived from producer countries and importing countries, including the EU. The reasons for this failure in data collection are uncertain and will vary, however it is probably due to wide variations in the volumetric units used for different products and by different actors (e.g. cubic metres, square metres, board feet, cubic feet, hoppus feet, timber ton etc.) and widespread lack of understanding of these units by government officials responsible for recording trade volumes (or who lack the time or inclination to convert them). In the case of EU import data, FII has developed a comprehensive statistical system to check and as far as possible clean errors by comparing volumetric data with the available information on tonnage and value. To allow comparison in EU import volumes between different product groups, FII has also calculated volumes in cubic metres of roundwood equivalent (RWE), drawing on conversion factors developed by UN agencies.9 While every effort has been made to ensure these data are as representative as possible, it is emphasized that calculation of RWE data requires many assumptions (e.g. with respect to likely conversion efficiencies) and draws ultimately on low quality volumetric data. They should therefore be treated with considerable caution. Another limitation of the timber trade data is that they provide little or no differentiation on the basis of species other than into the very broad categories of “hardwood” and “softwood”. Nearly all countries now define traded goods according to the international Harmonized System (HS) of product codes. Those countries using the system are committed to harmonizing using this coding system at the 6-digit level. At this level, for some wood material product groups (logs, sawn, veneers, and plywood), the HS system requires collection of separate data for “tropical hardwood”. It also requires data collection for a small number of named timber species such as Mahogany Swietenia spp. and the group “Virola, imbuia and balsa”. Countries using the HS system also have the option of sub-dividing codes further at the 8-digit or 10-digit level to provide more detailed information on individual timber species. In practice, the information provided on species by many countries is practically worthless. The major category of “tropical hardwood” is defined in the HS codes with reference to a list of named species. Unfortunately, this list is far from exhaustive and has not kept up with the times. Many so-called “lesser known species” – which are particularly dominant in the South American tropical hardwood trade – do not appear on the list. As a result, any trade in these species is typically listed under the “other hardwood”
8 More details of the service are available at http://www.gtis.com/english/GTIS_GTA.html 9 For a discussion and details of these factors see http://www.unece.org/fileadmin/DAM/timber/publications/DP‐49.pdf
Evaluation and scoping of EU timber importers & imports from South America 3
category. There is often no way of differentiating trade in these tropical species from hardwoods derived from non-tropical regions (such as plantation grown eucalypts from southern Brazil). Even when countries have sought to improve the quality of species data by further sub-dividing product codes at the 8-digit or 10-digit level, there are often significant flaws in data collection. Again this may simply be due to a lack of understanding, time and resources at the relevant data collection points.
Evaluation and scoping of EU timber importers & imports from South America 4
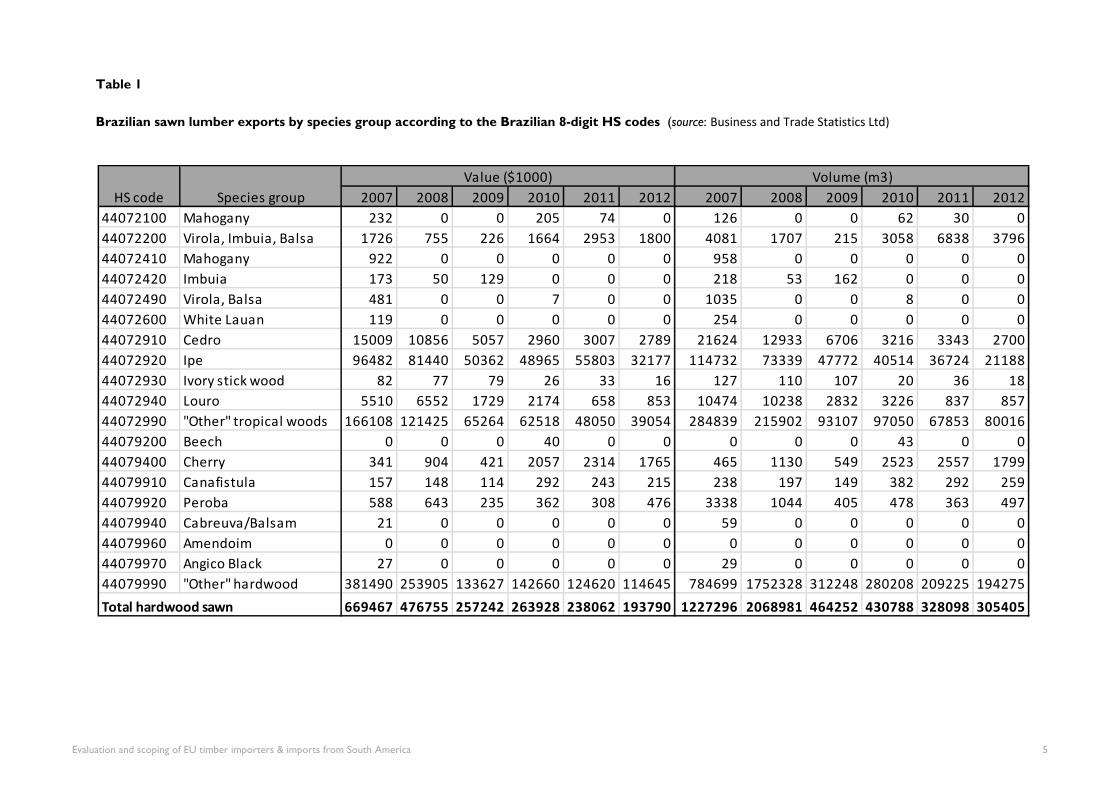
Table 1
Brazilian sawn lumber exports by species group according to the Brazilian 8-digit HS codes (source: Business and Trade Statistics Ltd)
2007 2008 2009 2010 2011 2012 2007 2008 2009 2010 2011 2012
44072100 Mahogany 232 0 0 205 74 0 126 0 0 62 30 0
44072200 Virola, Imbuia, Balsa 1726 755 226 1664 2953 1800 4081 1707 215 3058 6838 3796
44072410 Mahogany 922 0 0 0 0 0 958 0 0 0 0 0
44072420 Imbuia 173 50 129 0 0 0 218 53 162 0 0 0
44072490 Virola, Balsa 481 0 0 7 0 0 1035 0 0 8 0 0
44072600 White Lauan 119 0 0 0 0 0 254 0 0 0 0 0
44072910 Cedro 15009 10856 5057 2960 3007 2789 21624 12933 6706 3216 3343 2700
44072920 Ipe 96482 81440 50362 48965 55803 32177 114732 73339 47772 40514 36724 21188
44072930 Ivory stick wood 82 77 79 26 33 16 127 110 107 20 36 18
44072940 Louro 5510 6552 1729 2174 658 853 10474 10238 2832 3226 837 857
44072990 "Other" tropical woods 166108 121425 65264 62518 48050 39054 284839 215902 93107 97050 67853 80016
44079200 Beech 0 0 0 40 0 0 0 0 0 43 0 0
44079400 Cherry 341 904 421 2057 2314 1765 465 1130 549 2523 2557 1799
44079910 Canafistula 157 148 114 292 243 215 238 197 149 382 292 259
44079920 Peroba 588 643 235 362 308 476 3338 1044 405 478 363 497
44079940 Cabreuva/Balsam 21 0 0 0 0 0 59 0 0 0 0 0
44079960 Amendoim 0 0 0 0 0 0 0 0 0 0 0 0
44079970 Angico Black 27 0 0 0 0 0 29 0 0 0 0 0
44079990 "Other" hardwood 381490 253905 133627 142660 124620 114645 784699 1752328 312248 280208 209225 194275
669467 476755 257242 263928 238062 193790 1227296 2068981 464252 430788 328098 305405
Value ($1000) Volume (m3)
Species groupHS code
Total hardwood sawn
Evaluation and scoping of EU timber importers & imports from South America 5
To illustrate these problems, Table 1 shows Brazilian sawn hardwood export data for the last five years broken down as far as possible by species. This table provides some useful information on the (rapidly declining) trade in a few species traditionally important in the Brazilian export trade including Ipe Handroanthus spp., Cedro Cedrela odorata and Louro Sectonia rubra or Ocotea rubra. However data on other species are very limited. As Brazil’s dependence on “big name” tropical hardwoods has waned, the vast majority of Brazil’s exports now consist of “other” hardwoods not separately identified in the trade statistics. There are other issues with these data. For example, there is no way to separate the trade in Virola Virola spp., Imbuia Ocotea porosa, and Balsa Ochroma pyramidale which are unrelated species with very different applications. The data suggest significant trade in “cherry” which is not native to Brazil. This is probably due to misidentification of several species known colloquially as “Brazilian cherry” but which are unrelated. Where possible, an attempt is made in this report to name the key species likely to be involved in trade flows. However due to the shortcomings in data collection, quantitative analysis of species trade flows is mainly limited to the broad categories of “hardwood” and “softwood”. Production data
Reference is made in this report to log and timber production data in the four focus countries. Generally the quality of timber production data is even lower than that of trade data. Very few government authorities regularly commit significant resources to compilation of production data. Compilation of such data can be very challenging, particularly when harvesting and processing activities are distributed amongst numerous fragmented smaller operators. This is typical throughout the Amazonian region where compilation of log production data is further complicated by the vast area involved and relatively high dependence on wood from largely unregulated timber harvesting and forest conversion operations. The main international source of wood production data is the UN. Various UN agencies including the International Tropical Timber Organization (ITTO), the United Nations Economic Commission for Europe (UNECE), and the Food and Agriculture Organization of the United Nations (FAO) jointly gather data through the Joint Forest Sector Questionnaire (JFSQ) 10 . The JFSQ is issued annually to national correspondents based in competent government departments in every UN-member country of the world. While the data benefits from being freely available, they have significant weaknesses. The data are provided separately for “coniferous”, “tropical non-coniferous” and “other non-coniferous wood”, but no additional species-specific data are provided. Data on secondary and tertiary products are not presented regularly. However the main weakness from the perspective of monitoring trade trends is due to the failure of many key timber producing and consuming countries to collate and report accurately and completely in the JFSQ or to participate regularly in the survey. Unfortunately, the production data compiled by UN agencies relating to the four focus countries are particularly poor. Of the four countries, only data on Peru are updated regularly on an annual basis. UN production data for Brazil and Ecuador were last updated in 2009 and for Colombia in 2010 and were equally patchy in the preceding years.
10 Production data used in this report is mainly derived from the ITTO database at: http://www.itto.int/annual_review_output/
Evaluation and scoping of EU timber importers & imports from South America 6
Where possible, efforts have been made to fill gaps in data on production in the four focus countries by referring to reports by national forest authorities and to other secondary sources. Secondary sources
A range of secondary sources were consulted during preparation of this report, all of which are referenced where appropriate in the text. However particular reference is made here to the following reports:
“Timber trade flows within, to and from South America (Flujos de Madera en, hacia y desde América del Sur)” prepared by the Economic Policy and Regional Development Ltd (EPRD) Consortium with funding from the EU and published in February 201311. The EPRD study had a broader focus than the current report as it considered all South American countries and their interaction with global markets. The time period considered by the EPRD is from 2001 through to 2010/11. The current report draws on the EPRD study as an important source of background information. It builds on that study by providing more detailed data on individual product trade flows from the four focus countries and has a stronger focus on trade with the EU. It also updates the data for the focus countries to the year 2012.
The report "Status of tropical forest management 2011: Latin America and the Carribean" Technical Report 38 of the International Tropical Timber Council12. Building on a series of earlier reports commissioned by the ITTO in 1989, 2000 and 2005, the ITTO report comprehensively reviews and provides an update of the status of forest management in the 33 ITTO Producer Member Countries. The current report draws heavily on the ITTO report in the summary sections on commercial forest resources, regulation and the status of timber production in each of the four focus countries.
Data on forest area in the South American countries is mainly derived from the FAO 2010 Global Forest Resources Assessment (FRA)13. This is the most recent update of a series of FAO assessments undertaken every five years in an attempt to provide a consistent approach to describing the world’s forests and how they are changing. The Assessment is based on two primary sources of data: country reports prepared by national correspondents and remote sensing conducted by FAO together with national focal points and regional partners.
Overarching trends
South America as a whole is host to 865 million ha of forest, around 21% of total world forest area (4 billion ha) according to FAO data. Three quarters of forest area in South America is primary forest. In Brazil the proportion of primary forest rises to above 90%14. The Amazonian basin is estimated by FAO to host 799 million ha of forest of which 637 million ha is primary forest.
11 The EPRD Consortium report is available at: http://capacity4dev.ec.europa.eu/system/files/file/23/04/2013_‐_1515/final_report.pdf 12 The complete ITTO report on “Status of tropical forest management” is available at: http://www.itto.int/direct/topics/topics_pdf_download/topics_id=2660&no=0&disp=inline 13 FAO Forest resource Assessment documents and database at: http://www.fao.org/forestry/fra/fra2010/en/ 14 FAO Forest Resource Assessment 2010 tables (available at http://www.fao.org/forestry/fra/fra2010/en/) report that Brazil has a primary forest area of 476.6 million ha which is 92% of total forest area in the country.
Evaluation and scoping of EU timber importers & imports from South America 7
Forest plantation area in South America is still quite limited but is expanding and these forests are contributing a rising share of the region’s timber supply. According to FAO data, total plantation area in the region is around 13.8 million ha, of which 7.4 million ha are in Brazil. South America’s plantation area increased 37% between 2000 and 2010. Plantations now make up 1.6% of total forest area of the region15. Dominant species are pine and eucalypts. Despite South America’s large forest area, it plays a relatively limited role in the global trade in forest products, accounting for 5% of the world’s timber and timber products exports (see Chart 1.1). Brazil is by far the largest exporter of wood products in South America, alone accounting for 2.7% of world exports and 55% of exports by South American countries. Colombia, Ecuador and Peru are quite significant players in the regional South American market but are only relatively very small suppliers to the global market. Chart 1.1
Chart 1.2
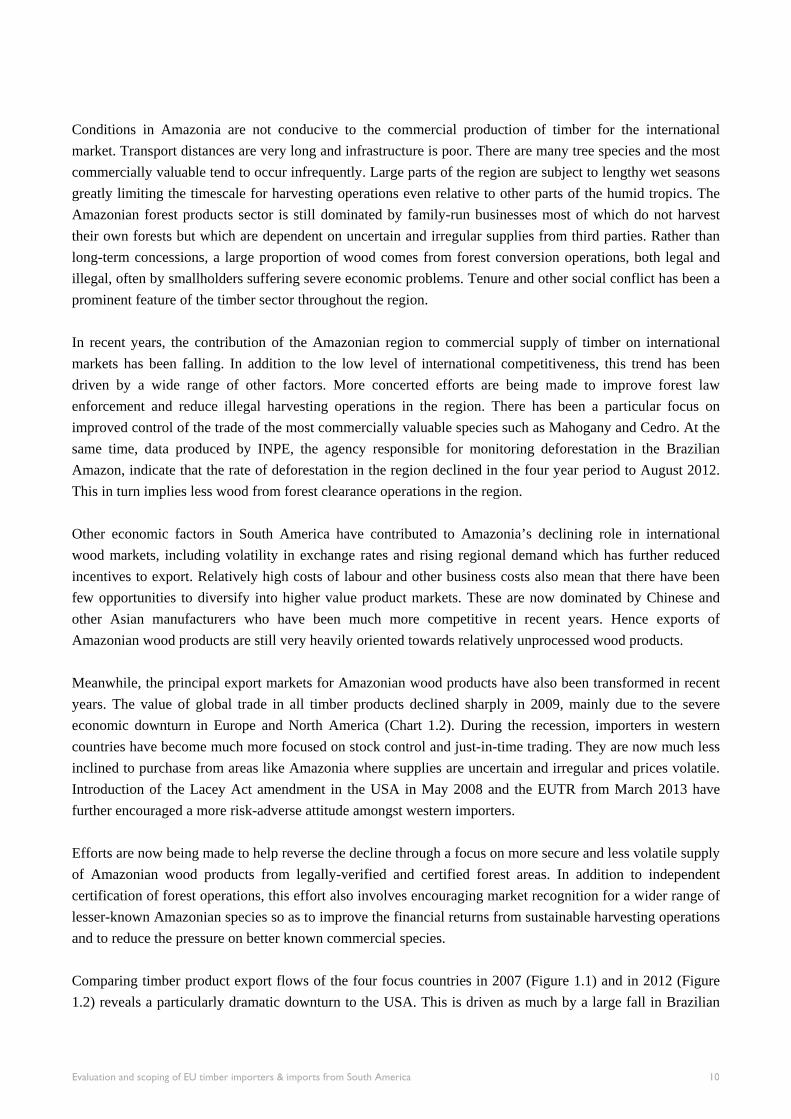
The contrast between Brazil as a globally significant wood supplier and the three other focus countries as more regionally oriented suppliers is illustrated in Figures 1.1 and 1.2. These show trade flows (by USD value) of timber and timber products from the four countries in the years 2007 and 2012. In both years, Brazil exported a large quantity of timber products to the United States, Europe and Asia. However, exports from Colombia, Ecuador and Peru were destined mainly for other countries in the Amazonian and Caribbean regions.
15 Data relating to South American plantation area is derived from the FAO Forest Resource Assessment 2010 available at http://www.fao.org/forestry/fra/fra2010/en/.
Evaluation and scoping of EU timber importers & imports from South America 8
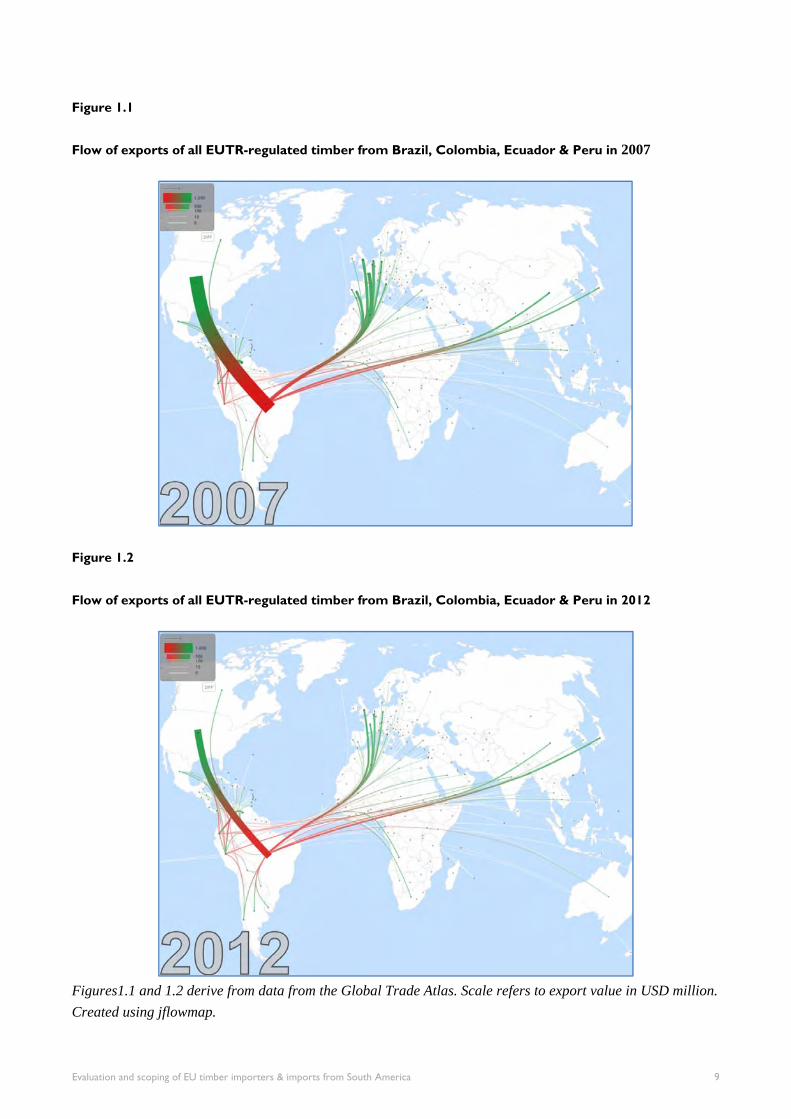
Figure 1.1
Flow of exports of all EUTR-regulated timber from Brazil, Colombia, Ecuador & Peru in 2007
Figure 1.2
Flow of exports of all EUTR-regulated timber from Brazil, Colombia, Ecuador & Peru in 2012
Figures1.1 and 1.2 derive from data from the Global Trade Atlas. Scale refers to export value in USD million.
Created using jflowmap.
Evaluation and scoping of EU timber importers & imports from South America 9
Conditions in Amazonia are not conducive to the commercial production of timber for the international market. Transport distances are very long and infrastructure is poor. There are many tree species and the most commercially valuable tend to occur infrequently. Large parts of the region are subject to lengthy wet seasons greatly limiting the timescale for harvesting operations even relative to other parts of the humid tropics. The Amazonian forest products sector is still dominated by family-run businesses most of which do not harvest their own forests but which are dependent on uncertain and irregular supplies from third parties. Rather than long-term concessions, a large proportion of wood comes from forest conversion operations, both legal and illegal, often by smallholders suffering severe economic problems. Tenure and other social conflict has been a prominent feature of the timber sector throughout the region. In recent years, the contribution of the Amazonian region to commercial supply of timber on international markets has been falling. In addition to the low level of international competitiveness, this trend has been driven by a wide range of other factors. More concerted efforts are being made to improve forest law enforcement and reduce illegal harvesting operations in the region. There has been a particular focus on improved control of the trade of the most commercially valuable species such as Mahogany and Cedro. At the same time, data produced by INPE, the agency responsible for monitoring deforestation in the Brazilian Amazon, indicate that the rate of deforestation in the region declined in the four year period to August 2012. This in turn implies less wood from forest clearance operations in the region. Other economic factors in South America have contributed to Amazonia’s declining role in international wood markets, including volatility in exchange rates and rising regional demand which has further reduced incentives to export. Relatively high costs of labour and other business costs also mean that there have been few opportunities to diversify into higher value product markets. These are now dominated by Chinese and other Asian manufacturers who have been much more competitive in recent years. Hence exports of Amazonian wood products are still very heavily oriented towards relatively unprocessed wood products. Meanwhile, the principal export markets for Amazonian wood products have also been transformed in recent years. The value of global trade in all timber products declined sharply in 2009, mainly due to the severe economic downturn in Europe and North America (Chart 1.2). During the recession, importers in western countries have become much more focused on stock control and just-in-time trading. They are now much less inclined to purchase from areas like Amazonia where supplies are uncertain and irregular and prices volatile. Introduction of the Lacey Act amendment in the USA in May 2008 and the EUTR from March 2013 have further encouraged a more risk-adverse attitude amongst western importers. Efforts are now being made to help reverse the decline through a focus on more secure and less volatile supply of Amazonian wood products from legally-verified and certified forest areas. In addition to independent certification of forest operations, this effort also involves encouraging market recognition for a wider range of lesser-known Amazonian species so as to improve the financial returns from sustainable harvesting operations and to reduce the pressure on better known commercial species. Comparing timber product export flows of the four focus countries in 2007 (Figure 1.1) and in 2012 (Figure 1.2) reveals a particularly dramatic downturn to the USA. This is driven as much by a large fall in Brazilian
Evaluation and scoping of EU timber importers & imports from South America 10
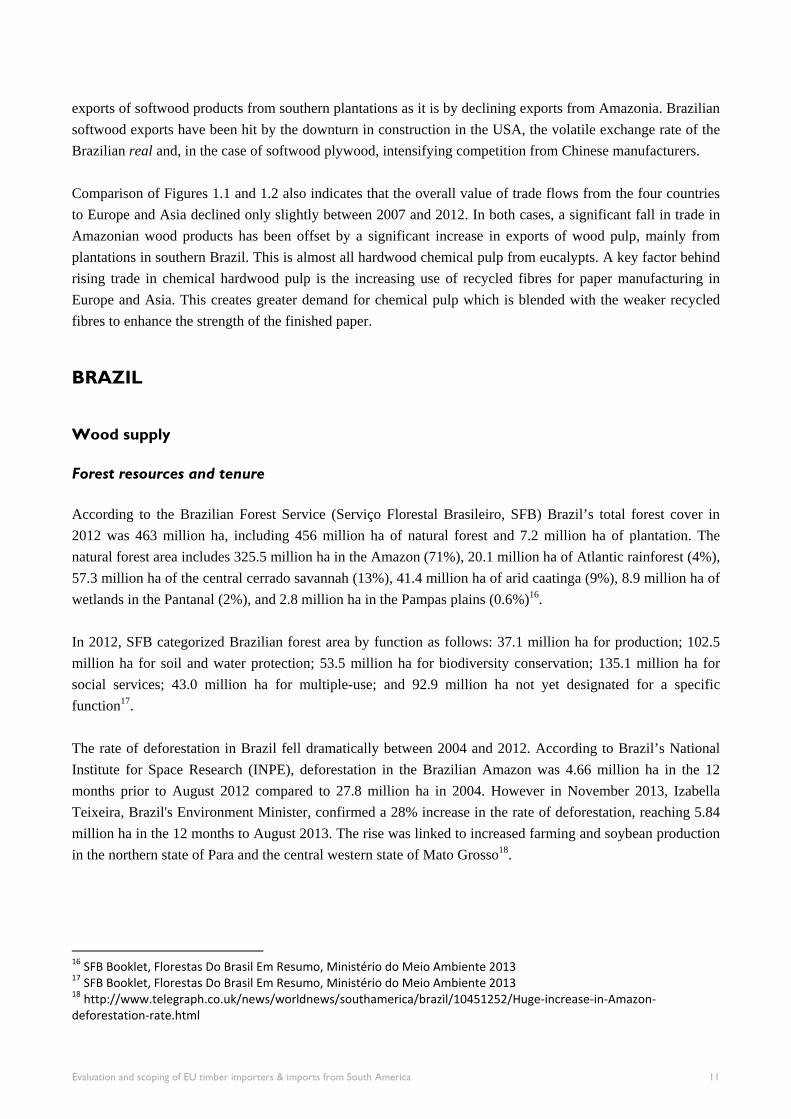
exports of softwood products from southern plantations as it is by declining exports from Amazonia. Brazilian softwood exports have been hit by the downturn in construction in the USA, the volatile exchange rate of the Brazilian real and, in the case of softwood plywood, intensifying competition from Chinese manufacturers. Comparison of Figures 1.1 and 1.2 also indicates that the overall value of trade flows from the four countries to Europe and Asia declined only slightly between 2007 and 2012. In both cases, a significant fall in trade in Amazonian wood products has been offset by a significant increase in exports of wood pulp, mainly from plantations in southern Brazil. This is almost all hardwood chemical pulp from eucalypts. A key factor behind rising trade in chemical hardwood pulp is the increasing use of recycled fibres for paper manufacturing in Europe and Asia. This creates greater demand for chemical pulp which is blended with the weaker recycled fibres to enhance the strength of the finished paper.
BRAZIL
Wood supply
Forest resources and tenure
According to the Brazilian Forest Service (Serviço Florestal Brasileiro, SFB) Brazil’s total forest cover in 2012 was 463 million ha, including 456 million ha of natural forest and 7.2 million ha of plantation. The natural forest area includes 325.5 million ha in the Amazon (71%), 20.1 million ha of Atlantic rainforest (4%), 57.3 million ha of the central cerrado savannah (13%), 41.4 million ha of arid caatinga (9%), 8.9 million ha of wetlands in the Pantanal (2%), and 2.8 million ha in the Pampas plains (0.6%)16. In 2012, SFB categorized Brazilian forest area by function as follows: 37.1 million ha for production; 102.5 million ha for soil and water protection; 53.5 million ha for biodiversity conservation; 135.1 million ha for social services; 43.0 million ha for multiple-use; and 92.9 million ha not yet designated for a specific function17. The rate of deforestation in Brazil fell dramatically between 2004 and 2012. According to Brazil’s National Institute for Space Research (INPE), deforestation in the Brazilian Amazon was 4.66 million ha in the 12 months prior to August 2012 compared to 27.8 million ha in 2004. However in November 2013, Izabella Teixeira, Brazil's Environment Minister, confirmed a 28% increase in the rate of deforestation, reaching 5.84 million ha in the 12 months to August 2013. The rise was linked to increased farming and soybean production in the northern state of Para and the central western state of Mato Grosso18.
16 SFB Booklet, Florestas Do Brasil Em Resumo, Ministério do Meio Ambiente 2013 17 SFB Booklet, Florestas Do Brasil Em Resumo, Ministério do Meio Ambiente 2013 18 http://www.telegraph.co.uk/news/worldnews/southamerica/brazil/10451252/Huge‐increase‐in‐Amazon‐deforestation‐rate.html
Evaluation and scoping of EU timber importers & imports from South America 11
In 2013, 297 million ha of Brazilian forest land was identified as publicly owned in the National Public Forest Registry19. While publicly owned forests are located in different biomes and regions of the country, most (92%) is found in the Amazon biome. Most public forest land is subject to various legal restrictions making it inaccessible for commercial timber exploitation. The area of public forest land includes 221 million ha owned by the Federal government and 76 million ha owned by State or municipal governments20. The following categories of federal forest land are not available for commercial timber exploitation: 102.82 million ha of indigenous lands; 32.54 million ha of totally protected forest areas; 2.18 million ha of additional areas “of interest for full protection”; 22.64 million ha of various forest categories for community use; 2.9 million ha of military areas; and 35.1 million ha of Federal forests without “Assigned Destinations” in the Registry. The remaining 22.9 million ha (7.7%) of federal forest land is technically available for allocation to sustainable timber production under concession agreements with the federal government. Some State forest land is also allocated for commercial timber exploitation under concession agreements with the State governments. While a process has been on-going since 2006 to allocate areas of public forest land for commercial timber concessions, most timber harvested in Brazil currently derives from privately owned forest. However, according to the 1988 Federal Constitution (Article 225) all forests are considered to be a common asset for all inhabitants, and ownership and tenure disputes are a major problem. In addition, private owners are only able to exercise their rights within the limits imposed by the 1965 Forest Code and the revised Forest Law passed in October 2012. There are legal stipulations to set aside “legal reserves” and “permanent preservation areas” in private forest areas (see Forest Regulation p. 21). Plantations
In addition to the area of Permanent Forest Estate (PFE) in natural forest, there were 7.2 million ha of plantations in Brazil in 2012, mostly privately owned and mostly located outside the tropical region in southern Brazil. The vast majority of softwood and non-tropical hardwood logs harvested in Brazil derive from these plantations. Around 71% of the area is eucalypts and 22% is pine. The remaining 7% consists of a variety of species including Acacia mearnsii, A. mangium, Hevea brasiliensis, Schizolobium amazonicum, Tectona grandis, Araucaria angustifolia and Populus spp.21 Brazil’s plantation industry is heavily export oriented, particularly focusing on supply of hardwood pulp and softwood plywood.
19 According to SFB, the National Public Forest Registry (CNFP – Cadastro Nacional de Florestas Públicas) is an essential instrument for forest planning strategy and forest management, as it identifies public forests and gathers georeferenced data about them. CNFP provides public managers and society with a reliable and updated database from which maps, images, and relevant information can be obtained, thus contributing to transparency in forest management and to social participation in the process. Once public forests are registered, it is possible to identify their state of conservation and designate them a status according to their potential purposes, which the law establishes under the name ‘destinations’. Assigning a public area a specific purpose is now a key part of Brazilian government strategy to conserve the Amazon rainforest by barring deforestation. 20 From the 2013 Planejamento Anual de Outorga Florestal (PAOF ‐ Annual Forest Concession Plan) prepared by Brazilian Forest Service (Serviço Florestal Brasileiro, SFB). 21 SFB Booklet, Florestas Do Brasil Em Resumo, Ministério do Meio Ambiente 2013
Evaluation and scoping of EU timber importers & imports from South America 12
Forest agencies22
The Ministry of Environment (Ministério do Meio Ambiente – MMA) is responsible for forestry in Brazil as well as for planning, co-ordinating and controlling activities related to the national environment policy. It also formulates policies for developing the forest related initiatives and conservation of natural ecosystems. It supervises the activities of the Brazilian Institute of Environment and Renewable Resources (Instituto Brasileiro do Meio Ambiente e dos Recursos Naturais Renováveis – IBAMA), the Chico Mendes Institute for the Conservation of Biodiversity – ICMBio) and the Brazilian Forest Service. It also chairs the National Council for the Environment (Conselho Nacional do Meio Ambiente) and takes part in the President’s Chamber for Natural Resources Policies, which coordinates various aspects related to forests. Amongst other functions, IBAMA, which was established in 1989, issues and regulates permits for forest exploitation, and implements and co-ordinates the National Forest Program. 23 The SFB was established in 2006 as the secretariat of the MMA (with no legal or financial independency) with responsibility over public forest management for sustainable production including a new concession system for federal owned public forests. The SFB is also responsible for organizing and implementing the Brazilian National Forest Inventory. Similar institutions exist at the State level for State-owned public forests. Other agencies with responsibilities related to forest resources include the National Colonization and Agrarian Reform Institute (Instituto Nacional de Colonização e Reforma Agrária), and the Indian National Foundation (Fundação Nacional do Índio), which is responsible for the preservation of Amerindian culture24. Forest Regulation
Under the Brazilian 1965 Forest Code (Law 4771/65), a certain percentage (at least) of private land in rural areas must be maintained under native vegetation (called “Legal reserves”). The required percentage is 80% of Amazonian properties, 35% of savannah properties, 20% of native grassland properties and areas within the Atlantic Forest Region. By law, these Legal reserves in Amazonia may be harvested for timber and other products on the basis of sustainable forest management plans (planos de manejo florestal sustentável – PMFSs). In addition, landowners were required to maintain corridors of riverbank forest between 30 and 500 m wide depending on the width of the water body, and forest areas with declivity equal or higher than 45 degrees. In practice, for most of the years of the Forest Code’s existence, the Legal reserve requirements of the Forest Code were not effectively enforced and land occupiers cleared forest well above the allowed threshold. However, in 2004 the Brazilian Government introduced a package of policies known as the PPCDAm (see box).
22 This section is primarily derived from "Status of tropical forest management 2011: Latin America and the Caribbean" Technical Report 38 of the International Tropical Timber Council. 23 Brazil published the first legislation regulating a National Forest Program in 2000 (Decree no. 3420 of the 20th April). Revised legislation was published in 2003 (Decree no. 4864 of 24th October). 24 Commercial forest management is forbidden within Indian Territories; timber can only be extracted for use by the community inside the area.
Evaluation and scoping of EU timber importers & imports from South America 13
The PPCDAm contributed to significant reduction in the rate of illegal deforestation in Amazonia between 2004 and 2012. However it also sparked a push-back from politicians in Congress representing agricultural interests. There was intense lobbying for a reduction in the area of land to be held as forest reserve. There was a demand for a moratorium on the requirement for smaller farmers to reforest areas converted in earlier years and to allow a part of the reforestation obligation of larger owners to comprise commercial cash crops instead of natural forest. There were also calls for a significant reduction in the riparian protection area. The intense political debate eventually culminated with the passage of a new Forest Law in October 2012. The final text was a compromise and did not entirely satisfy either the farm or the conservation lobby26. The new law carries over from the previous legislation the requirement to maintain forest cover on 80% of rural
25 Derived from: Jesse Libra, University of Texas at Austin, “Managing Deforestation: Lessons from Brazil”, Blog posted on September 26, 2013, http://blogs.utexas.edu/mecc/2013/09/26/managing‐deforestation‐lessons‐from‐brazil/ 26 For a detailed discussion of the political debate surrounding the 2012 Forest Law, see the series of blog articles at Nature.com including: Susan Moran, Brazilian bill weakens Amazon protection, 07 December 2011, http://www.nature.com/news/brazilian‐bill‐weakens‐amazon‐protection‐1.9584; Jeff Tollefson, President prunes forest reforms, 4 June 2012, http://www.nature.com/news/president‐prunes‐forest‐reforms‐1.10772; and Claudio Angelo, Brazilian Congress waters down forest protection, 31 August 2012, http://blogs.nature.com/news/2012/08/brazilian‐congress‐waters‐down‐forest‐protection.html
Action Plan for Prevention and Control of Legal Amazon Deforestation (PPCDAm)25 The PPCDAm was launched in 2004 at a time when high beef and soybean prices caused a sudden spike in deforestation rates. The Plan introduced a radical multi-sectoral and inter-ministerial environmental policy that called for co-ordination between federal, State, and local governments, as well as outside organizations. The Plan involved three main components: 1. Command and Control efforts: Law Enforcement: PPCDAm made important institutional changes that allowed for an increase in
law enforcement personnel, and therefore regulation, in the northern provinces with the highest levels of deforestation.
Differential Laws: The Plan helped the government establish laws which allowed them to take “differentiated action” against regions with very high deforestation rates.
2. Environmental Monitoring: Increased land area under protection: Deforestation is more likely to occur on undesignated land.
Protection is thought to deter deforestation because it results in increased regulation and stricter legal consequences.
DETER: Real Time System for Detection of Deforestation (DETER), run by INPE, captures and processes images on forest cover for the entire Brazilian Amazon every 15 days. The images allow the government to find deforestation hotspots, and concentrate law enforcement efforts in these areas.
3. Economic Incentives: Conditional Credit: Under the guidance of PPCDAm, Brazil’s National Monetary Council
approved a rural credit scheme which made receiving credit conditional on the ability of farmers to prove they were in compliance with environmental laws. It is estimated that this alone reduced deforestation by 17%.
Evaluation and scoping of EU timber importers & imports from South America 14
properties in the Amazon, 35% in the central savanna region and 20% in other areas of the country. However small farmers can now include river margins and steep hillsides when accounting for the total area of woodlands they are preserving (i.e. Legal Reserves). Because including such land was already mandatory, this effectively reduces the total amount required to be conserved.27 The new law also effectively provides an amnesty from fines for illegally clearing trees before July 2008 in return for signing an agreement specifying specific reforestation or other measures that must be taken to bring a property back into compliance. However, all replanting must be of native forest species and no agricultural crops are allowed as part of the reforestation plan. Brazil's MMA said that the requirements of the new law could result in the reforestation of a total land area of about 30 million ha. It remains unclear, however, whether the government will be able to enforce the reforestation requirement successfully or any of the other new provisions. From the perspective of the Amazonian timber industry, one of the potentially most significant developments in recent years was the introduction as part of the 2006 Law on Public Forest Management regulations allowing (for the first time) legal timber production on public forest land under a concession system. There is now the opportunity to regularize considerable quantities of timber production that were previously illegal. Finalizing the procedures to allocate and regulate concessions has taken longer than expected. However, by the start of 2013, 233 000 ha of federal public forests had been granted as concessions and SFB were in the process of granting a further 832 000 ha. The National Forest Plan of 2013 establishes that a total of 5.3 million ha of federal forest lands were eligible to be granted as concessions during the year28. In addition to federal forest lands, the State of Pará has granted 477 000 ha of concessions for commercial exploitation in State-owned forests and an additional 235 000 ha are planned for future concessions. The States of Amapá and Acre have respectively identified areas of around 2 million ha and 187 000 ha of State-owned forest suitable for allocation as commercial concessions. In the State of Amazonas, around 440 000 ha have been identified as appropriate for allocation as concessions, although in this instance the emphasis will be on local community use rather than commercial exploitation. Since September 2006, forest product transportation has been controlled through a national information system, IBAMA’s Forest Origin Document system (“Documento de Origen Forestal” – DOF). The States of Mato Grosso and Pará have their own parallel systems to control forest products transportation (SISFLORA). Under the DOF and SISFLORA systems, forest products are tracked from their harvest to the final stage of marketing. The entire supply and transportation chain must be updated online in real time. According to ITTO, these systems have significantly improved the control of illegal logging in Brazil.
27 Reuters news agency, Brazil's Rousseff enacts forest law in blow to farm lobby, 18 October 2012. Available at: http://www.reuters.com/article/2012/10/18/us‐brazil‐forest‐law‐idUSBRE89H1IL20121018 28 From the 2013 Planejamento Anual de Outorga Florestal (PAOF ‐ Annual Forest Concession Plan) prepared by SFB.
Evaluation and scoping of EU timber importers & imports from South America 15
Forest certification
A large proportion of Brazil’s plantation resource is now certified either to Forest Stewardship Council (FSC) or CERFLOR, a national certification system that has been endorsed by the Programme for Endorsement of Forest Certification (PEFC). By the end of 2012, around 3.5 million ha of eucalypt plantation and 1.8m ha of pine plantation were certified29. Only around 1 million ha of Amazonian native forest available for commercial timber production is currently certified, all under the FSC system30. This area includes: 450 000 ha in the state of Para managed by the Brazilian Grupo Orsa; around 300 000 ha also in the state of Para managed by the Brazilian Cikel group; 120 000 ha in Amazonas state managed by the Swiss Precious Woods Group; 73 000 ha in Rondonia managed by a Brazilian group specializing in the production of wood floors; and 60 000 ha of forest reserve managed under a concession agreement by FUNTAC, the Technology Foundation of the State of Acre. Timber production
The most recent data from ITTO estimates that annual commercial production of logs in Brazil during 2010 was 128.4 million m3, of which 62.0 million m3 was non-tropical hardwood, 35.5 million m3 was softwood, and 30.8 million m3 was tropical hardwood31. Considering the composition of logs, it seems likely that at least three quarters of Brazil’s commercial log production volume in 2010 derived from plantations rather than native forests. The plantation sector is a significant growth industry and production volumes are widely forecast to continue to rise in the future. This is being driven both by a surge in demand for biomass energy, notably to supply charcoal for steel manufacturing, and by a strong expansion in Brazil’s eucalypt pulp sector. According to FAO, Brazil’s total wood pulp production capacity was 15 million tonnes (t) in 2010, of which 10 million was “market pulp” (i.e. for sale in the open market and not including pulp used in own plant or shipped to associated companies within the country). About 90% of market pulp produced in Brazil is exported. Brazilian pulp production has been conservatively estimated to increase 42% between 2010 (13 million t) and 2016 to just over 20 million t32. FAO estimates Brazil’s paper making capacity was 11 million t in 2010 and forecast this to rise to 11.4 million t by 2014. The ITTO estimate of 30.8 million m3 of tropical hardwood production in Brazil is unclear as to what assumptions have been made with respect to unregulated harvesting in the Amazon region. Data on wood production volume in the Brazilian Amazon has been suspect in the past, not least due to the significant
29 Estimated by FII drawing on data at PEFC and FSC websites 30 This area excludes certified areas which are not available for commercial timber exploitation, for example 1.54 million ha of tribal lands of the Comunidade Kayapó na Terra Indígena do Baú which are FSC certified for production of non‐timber forest products. 31 FII analysis of ITTO Annual Review data available from http://www.itto.int/annual_review_output/ 32 International Forest Industries, January 2013, "Brazil – the world’s largest industrial eucalypt estate", http://www.internationalforestindustries.com/2013/01/25/brazil‐%E2%80%93‐the‐world%E2%80%99s‐largest‐industrial‐eucalypt‐estate/
Evaluation and scoping of EU timber importers & imports from South America 16
unknown amounts of wood being derived from illegal forest clearance operations. For example, an estimate by Chatham House using a “wood balance” approach based on 2009 data suggested that illegal wood in that year might have contributed as much as 95% or as little as 33% of total supply in the Brazilian Amazon depending on the statistics used. Chatham House conclude that “the nature of the issues with the source data and the balance of available evidence from elsewhere (including expert perceptions surveys) suggests the real figure may lie somewhere in between”33. It remains to be seen how new enforcement measures under the PPCDAm and the introduction of the new concession system and 2012 Forest Law will impact on the long term supply of timber products from the Brazilian Amazon. However, these measures are expected to reduce supply in the short term – due to decreased availability from conversion forest and other illegal harvesting – but may improve security and regularity of supply in the long term. What is certain is that a significant proportion of commercial timber harvested in the past, even when authorized by government authorities, derived from forest clearance rather than sustainable forest management. An SFB analysis of wood originating from natural forests during the period 2007 to 2010, drawing on data from IBAMA’s DOF system, shows that approximately 49% originated from sustainable forest management and 51% from authorized deforestation. The majority of authorized deforestation was for conversion to alternative agricultural use, with a small proportion due to infrastructure and urban development34. The best estimates of wood utilization in Amazonia derive from incomplete surveys of forest processing companies jointly undertaken at irregular intervals by the Brazilian Forest Service and IMAZON, the Institute of Man and Environment in the Amazon. The most recent survey was released in 2009 which included interviews with 846 out of 2227 companies identified as engaged in wood processing in the Brazilian Amazon region35. The survey estimated that 14.2 million m3 of roundwood was consumed by surveyed companies generating 5.8 million m3 of processed wood. The majority (72%) was sawnwood with low added value (boards, battens, rafters and similar). Another 15% was transformed into more added-value products (flooring, window frames, decking etc.) and the remainder (13%) was converted into plywood and similar laminated products. The 2009 survey indicated a significant reduction in log consumption in the Amazon compared to earlier surveys in 1998 and 2004. In 1998, consumption of logs by surveyed companies was estimated at 28.3 million m3. This estimate fell to 24.5 million m3 in 2004 and to 14.2 million m3 in 2009. According to IMAZON, the significant decrease in log consumption was related to three main causes: increasing regulatory control; replacement of tropical timber by competing products such as MDF and laminates in Brazil’s domestic construction sector; and the global economic crisis. 33 Lawson & MacFaul, Illegal Logging and Related Trade, Indicators of the Global Response, Chatham House July 2010 http://www.chathamhouse.org/sites/default/files/public/Research/Energy,%20Environment%20and%20Development/0710pr_illegallogging.pdf 34 SFB Booklet, Florestas Do Brasil Em Resumo, Ministério do Meio Ambiente 2013 35 SFB & IMAZON, 2010, A atividade madeireira na Amazônia brasileira: produção, receita e mercados,
http://www.imazon.org.br/publicacoes/livretos/a‐atividade‐madeireira‐na‐amazonia‐brasileira/at_download/file
Evaluation and scoping of EU timber importers & imports from South America 17
The survey also indicated major changes in the market for processed wood from Amazonia. In 1998, 14% of the total volume produced was exported. In 2004, factors such as a more favourable exchange rate and rising demand for Amazonian timber in Europe, North America and Asia increased this proportion to 36%. However in 2009, the share of wood from the region entering international trade decreased to only 21% of total production. As production of traditional Amazonian species like Mahogany, Cedro and Virola has declined in the Brazilian Amazon, the focus has switched to other species such as Sapupira (a heavy duty flooring species), Tauari (a light general joinery species), Tatajuba Bagassa guianensis (a heavy duty joinery species), Jatoba Hymenaea courbaril (dark species favoured in flooring), Ipe, Garapa Apuleia leiocarpa and Massaranduba Manilkara bidentata (the last three all decking timbers). Trade overview36
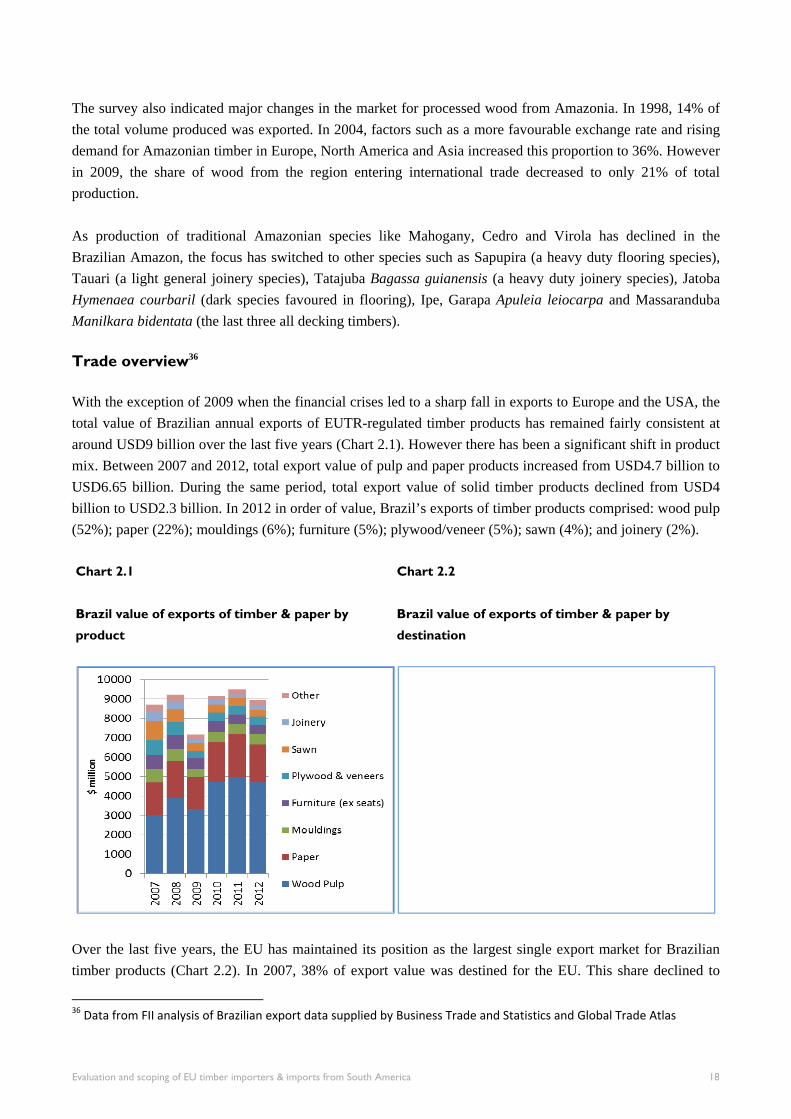
With the exception of 2009 when the financial crises led to a sharp fall in exports to Europe and the USA, the total value of Brazilian annual exports of EUTR-regulated timber products has remained fairly consistent at around USD9 billion over the last five years (Chart 2.1). However there has been a significant shift in product mix. Between 2007 and 2012, total export value of pulp and paper products increased from USD4.7 billion to USD6.65 billion. During the same period, total export value of solid timber products declined from USD4 billion to USD2.3 billion. In 2012 in order of value, Brazil’s exports of timber products comprised: wood pulp (52%); paper (22%); mouldings (6%); furniture (5%); plywood/veneer (5%); sawn (4%); and joinery (2%).
Chart 2.1
Brazil value of exports of timber & paper by
product
Chart 2.2
Brazil value of exports of timber & paper by
destination
Over the last five years, the EU has maintained its position as the largest single export market for Brazilian timber products (Chart 2.2). In 2007, 38% of export value was destined for the EU. This share declined to
36 Data from FII analysis of Brazilian export data supplied by Business Trade and Statistics and Global Trade Atlas
Evaluation and scoping of EU timber importers & imports from South America 18
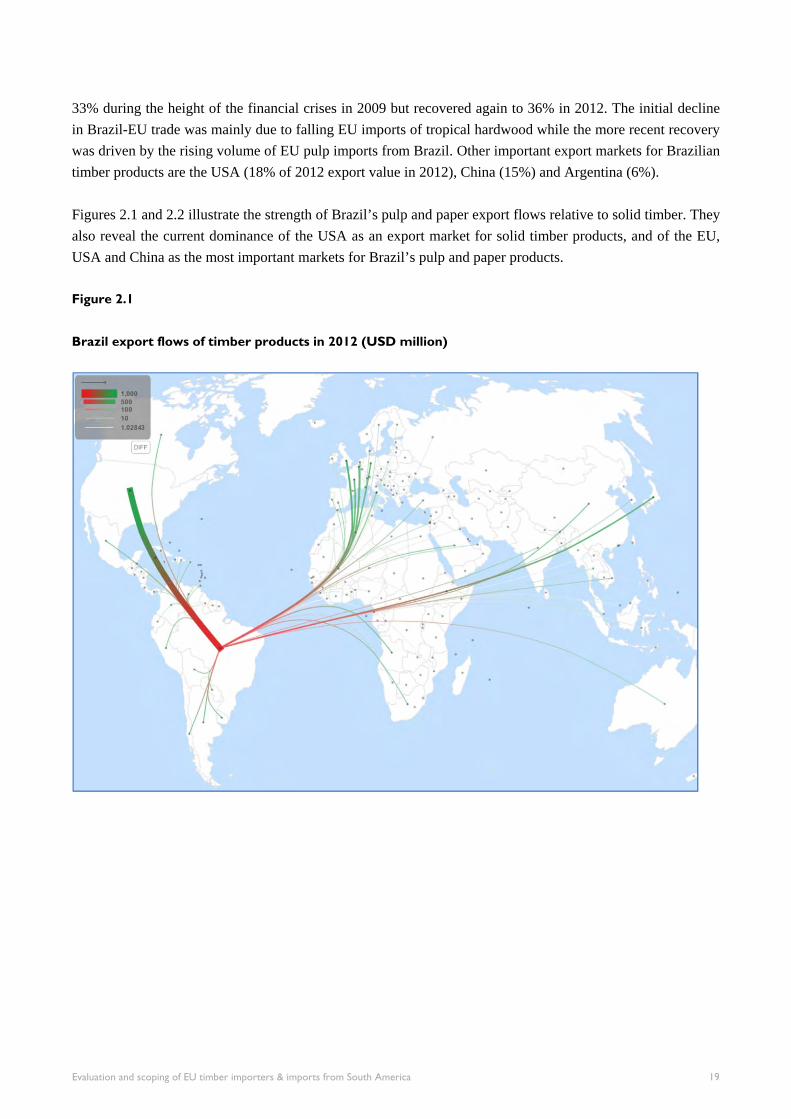
33% during the height of the financial crises in 2009 but recovered again to 36% in 2012. The initial decline in Brazil-EU trade was mainly due to falling EU imports of tropical hardwood while the more recent recovery was driven by the rising volume of EU pulp imports from Brazil. Other important export markets for Brazilian timber products are the USA (18% of 2012 export value in 2012), China (15%) and Argentina (6%). Figures 2.1 and 2.2 illustrate the strength of Brazil’s pulp and paper export flows relative to solid timber. They also reveal the current dominance of the USA as an export market for solid timber products, and of the EU, USA and China as the most important markets for Brazil’s pulp and paper products. Figure 2.1
Brazil export flows of timber products in 2012 (USD million)
Evaluation and scoping of EU timber importers & imports from South America 19
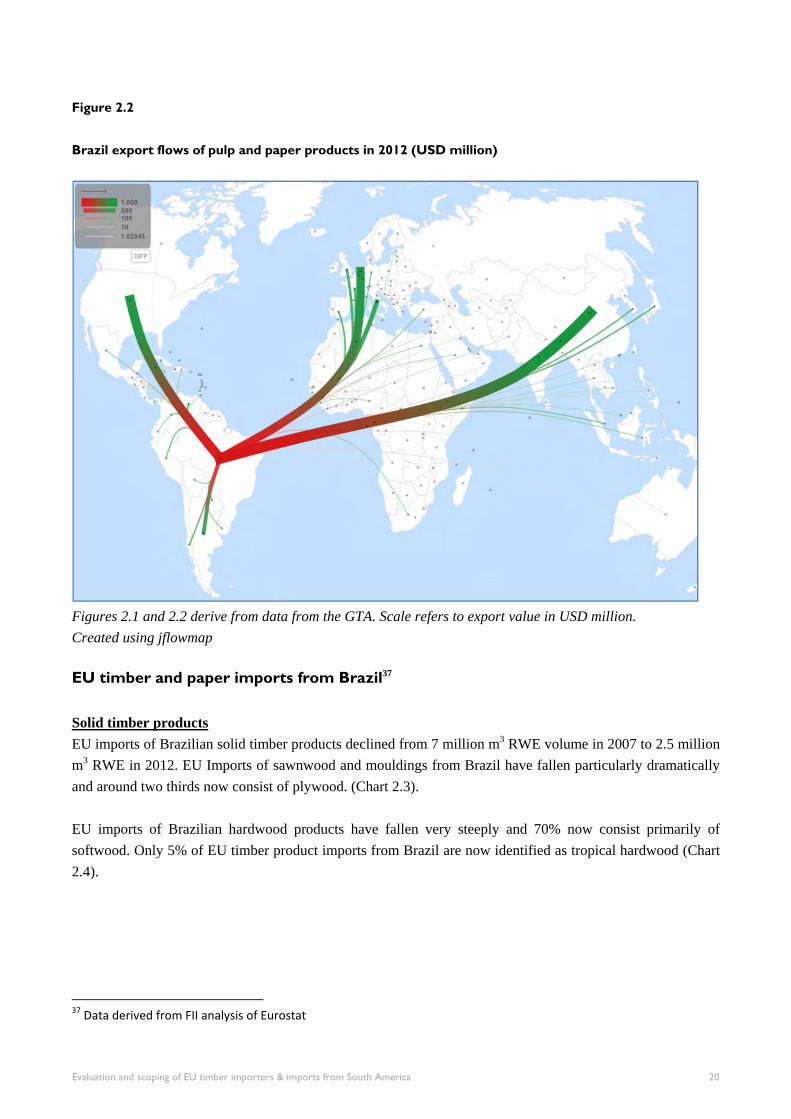
Figure 2.2
Brazil export flows of pulp and paper products in 2012 (USD million)
Figures 2.1 and 2.2 derive from data from the GTA. Scale refers to export value in USD million.
Created using jflowmap EU timber and paper imports from Brazil37
Solid timber products EU imports of Brazilian solid timber products declined from 7 million m3 RWE volume in 2007 to 2.5 million m3 RWE in 2012. EU Imports of sawnwood and mouldings from Brazil have fallen particularly dramatically and around two thirds now consist of plywood. (Chart 2.3). EU imports of Brazilian hardwood products have fallen very steeply and 70% now consist primarily of softwood. Only 5% of EU timber product imports from Brazil are now identified as tropical hardwood (Chart 2.4).
37 Data derived from FII analysis of Eurostat
Evaluation and scoping of EU timber importers & imports from South America 20
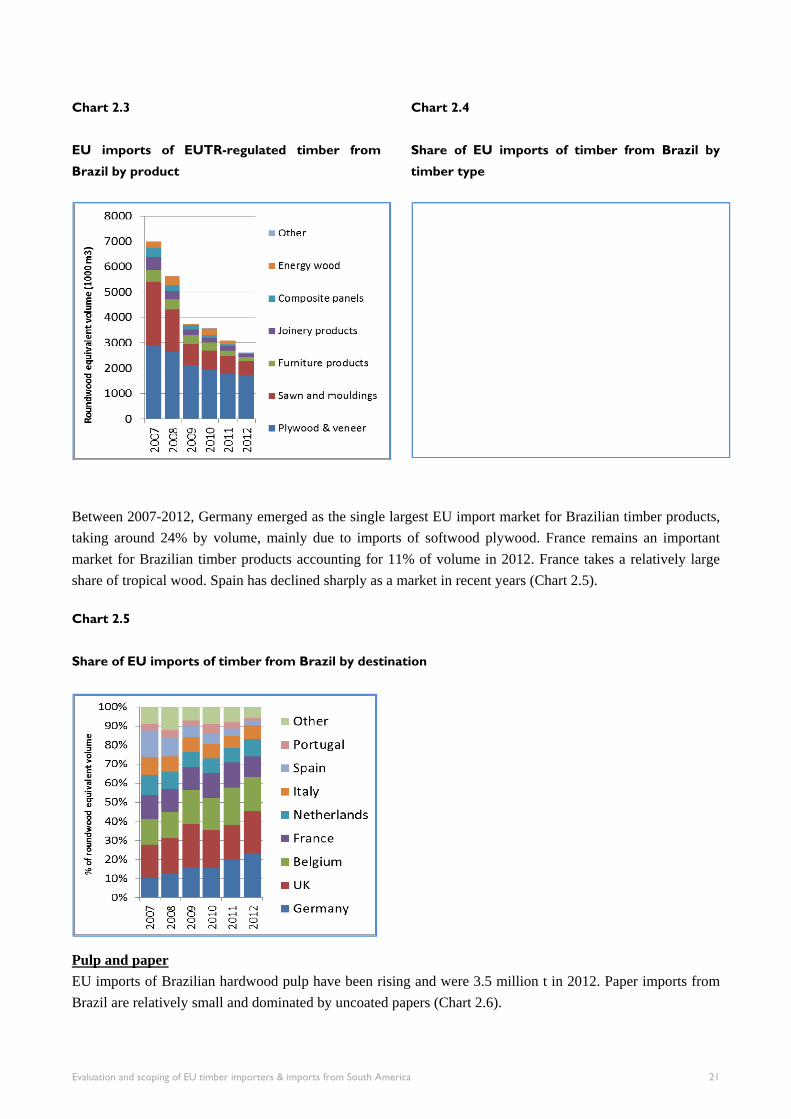
Chart 2.3
EU imports of EUTR-regulated timber from
Brazil by product
Chart 2.4
Share of EU imports of timber from Brazil by
timber type
Between 2007-2012, Germany emerged as the single largest EU import market for Brazilian timber products, taking around 24% by volume, mainly due to imports of softwood plywood. France remains an important market for Brazilian timber products accounting for 11% of volume in 2012. France takes a relatively large share of tropical wood. Spain has declined sharply as a market in recent years (Chart 2.5).
Chart 2.5
Share of EU imports of timber from Brazil by destination
Pulp and paper EU imports of Brazilian hardwood pulp have been rising and were 3.5 million t in 2012. Paper imports from Brazil are relatively small and dominated by uncoated papers (Chart 2.6).
Evaluation and scoping of EU timber importers & imports from South America 21
Chart 2.6
EU imports of EUTR-regulated paper from Brazil
by product
Chart 2.7
Share of EU imports of paper from Brazil by
destination
Netherlands, Italy and Germany are the largest import markets for Brazilian pulp and paper together accounting for 56% by tonnage (Chart 2.7) Brazil timber and paper exports by product38
Logs Exports of logs from natural forests in Brazil have been banned since 1996. However small and irregular volumes of plantation logs, notably Teak Tectona grandis, and preservative treated softwood logs are exported every year (Chart 2.8). India is the largest single market followed by Peru and Viet Nam. Exports to the EU are generally less than 1000 t a year, mostly of Teak and “other hardwoods” destined for Germany and Sweden (Chart 2.9).
38 Data from FII analysis of Brazilian export data supplied by BTS and GTA
Evaluation and scoping of EU timber importers & imports from South America 22
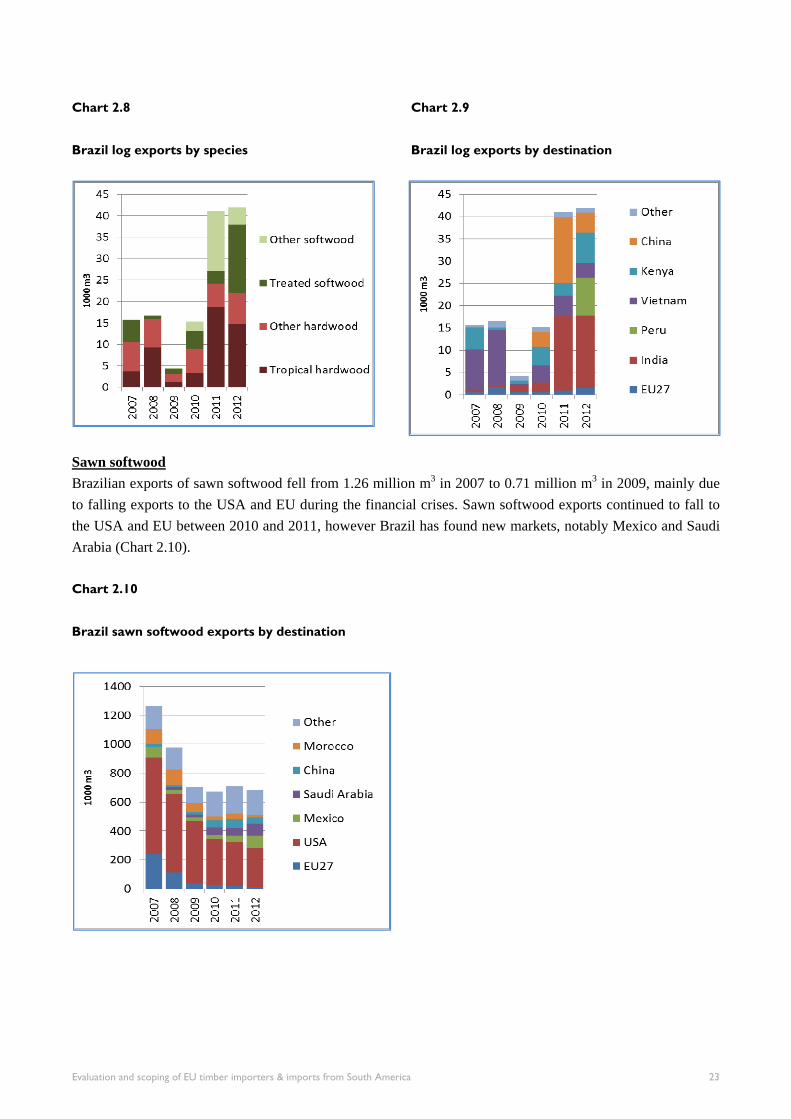
Chart 2.8
Brazil log exports by species
Chart 2.9
Brazil log exports by destination
Sawn softwood Brazilian exports of sawn softwood fell from 1.26 million m3 in 2007 to 0.71 million m3 in 2009, mainly due to falling exports to the USA and EU during the financial crises. Sawn softwood exports continued to fall to the USA and EU between 2010 and 2011, however Brazil has found new markets, notably Mexico and Saudi Arabia (Chart 2.10). Chart 2.10
Brazil sawn softwood exports by destination
Evaluation and scoping of EU timber importers & imports from South America 23
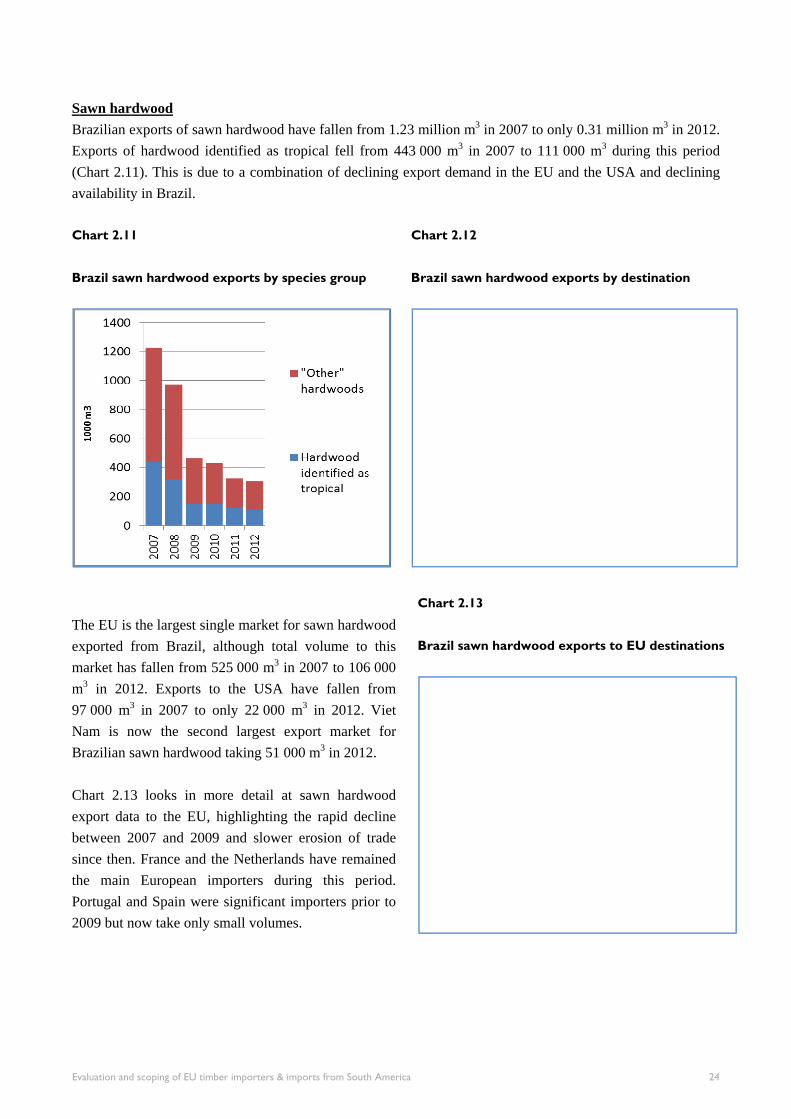
Sawn hardwood Brazilian exports of sawn hardwood have fallen from 1.23 million m3 in 2007 to only 0.31 million m3 in 2012. Exports of hardwood identified as tropical fell from 443 000 m3 in 2007 to 111 000 m3 during this period (Chart 2.11). This is due to a combination of declining export demand in the EU and the USA and declining availability in Brazil.
Chart 2.11
Brazil sawn hardwood exports by species group
Chart 2.12
Brazil sawn hardwood exports by destination
The EU is the largest single market for sawn hardwood exported from Brazil, although total volume to this market has fallen from 525 000 m3 in 2007 to 106 000 m3 in 2012. Exports to the USA have fallen from 97 000 m3 in 2007 to only 22 000 m3 in 2012. Viet Nam is now the second largest export market for Brazilian sawn hardwood taking 51 000 m3 in 2012. Chart 2.13 looks in more detail at sawn hardwood export data to the EU, highlighting the rapid decline between 2007 and 2009 and slower erosion of trade since then. France and the Netherlands have remained the main European importers during this period. Portugal and Spain were significant importers prior to 2009 but now take only small volumes.
Chart 2.13
Brazil sawn hardwood exports to EU destinations
Evaluation and scoping of EU timber importers & imports from South America 24
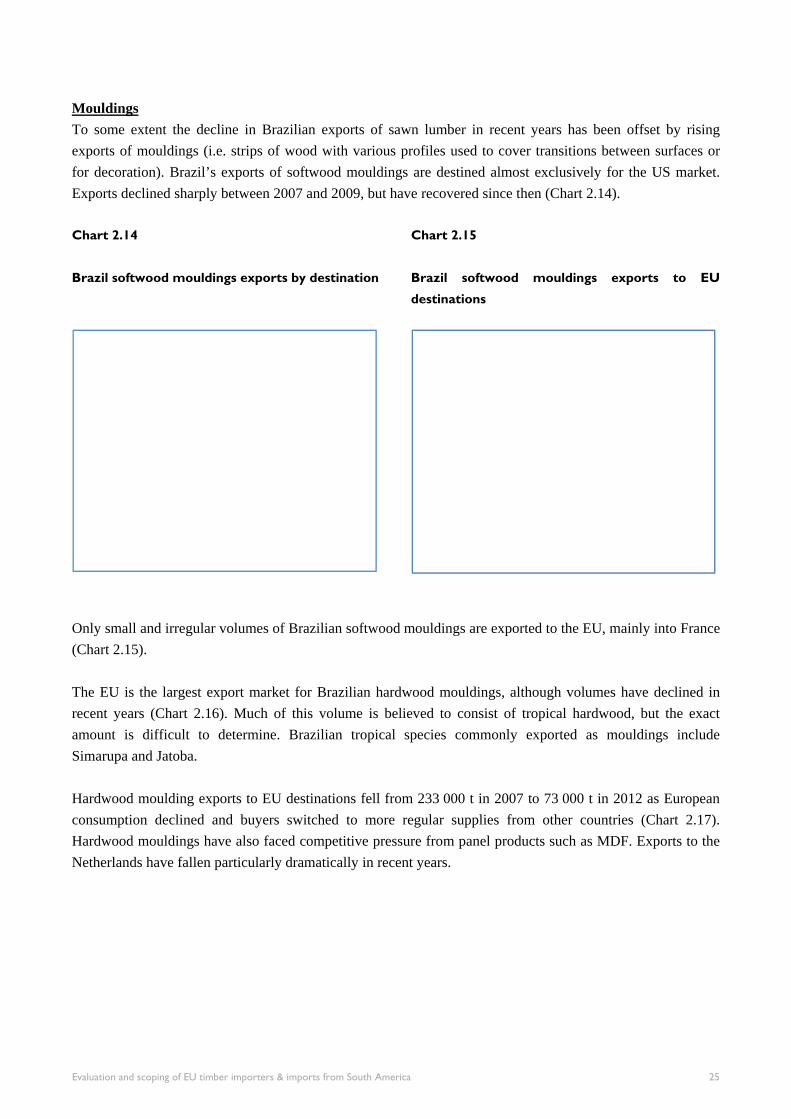
Mouldings To some extent the decline in Brazilian exports of sawn lumber in recent years has been offset by rising exports of mouldings (i.e. strips of wood with various profiles used to cover transitions between surfaces or for decoration). Brazil’s exports of softwood mouldings are destined almost exclusively for the US market. Exports declined sharply between 2007 and 2009, but have recovered since then (Chart 2.14). Chart 2.14
Brazil softwood mouldings exports by destination
Chart 2.15
Brazil softwood mouldings exports to EU
destinations
Only small and irregular volumes of Brazilian softwood mouldings are exported to the EU, mainly into France (Chart 2.15). The EU is the largest export market for Brazilian hardwood mouldings, although volumes have declined in recent years (Chart 2.16). Much of this volume is believed to consist of tropical hardwood, but the exact amount is difficult to determine. Brazilian tropical species commonly exported as mouldings include Simarupa and Jatoba. Hardwood moulding exports to EU destinations fell from 233 000 t in 2007 to 73 000 t in 2012 as European consumption declined and buyers switched to more regular supplies from other countries (Chart 2.17). Hardwood mouldings have also faced competitive pressure from panel products such as MDF. Exports to the Netherlands have fallen particularly dramatically in recent years.
Evaluation and scoping of EU timber importers & imports from South America 25
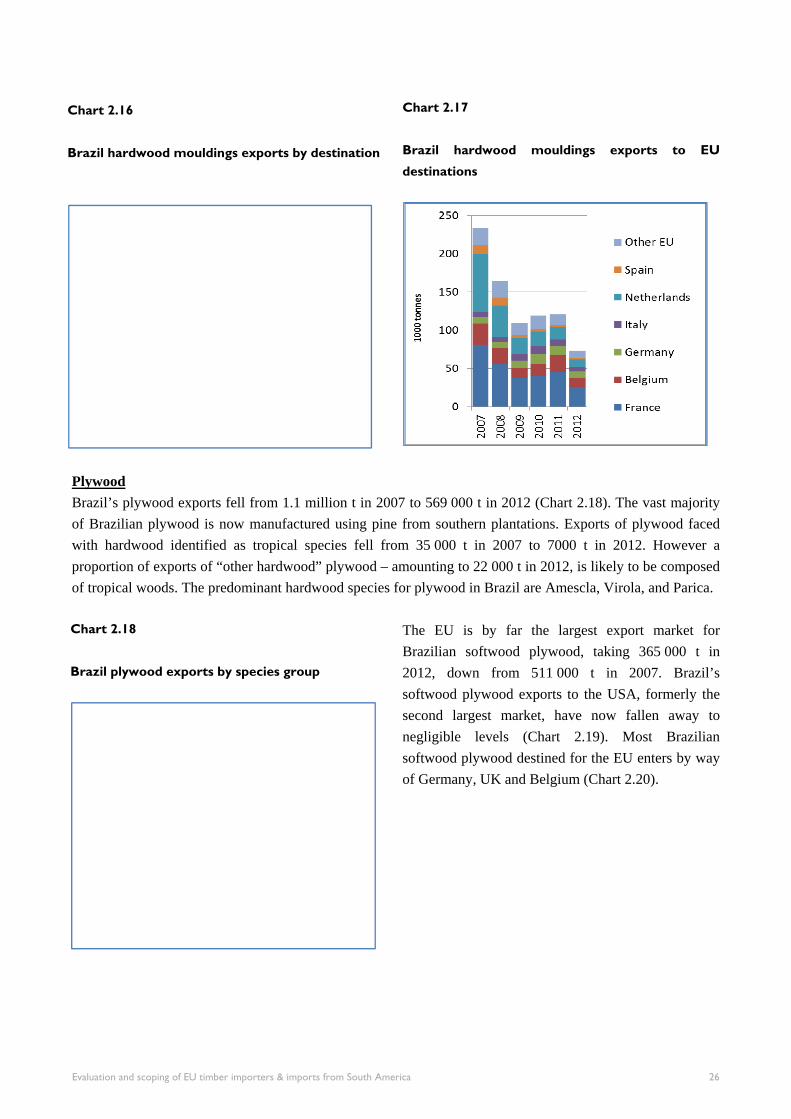
Chart 2.17
Brazil hardwood mouldings exports to EU
destinations
Plywood Brazil’s plywood exports fell from 1.1 million t in 2007 to 569 000 t in 2012 (Chart 2.18). The vast majority of Brazilian plywood is now manufactured using pine from southern plantations. Exports of plywood faced with hardwood identified as tropical species fell from 35 000 t in 2007 to 7000 t in 2012. However a proportion of exports of “other hardwood” plywood – amounting to 22 000 t in 2012, is likely to be composed of tropical woods. The predominant hardwood species for plywood in Brazil are Amescla, Virola, and Parica.
The EU is by far the largest export market for Brazilian softwood plywood, taking 365 000 t in 2012, down from 511 000 t in 2007. Brazil’s softwood plywood exports to the USA, formerly the second largest market, have now fallen away to negligible levels (Chart 2.19). Most Brazilian softwood plywood destined for the EU enters by way of Germany, UK and Belgium (Chart 2.20).
Chart 2.16
Brazil hardwood mouldings exports by destination
Chart 2.18
Brazil plywood exports by species group
Evaluation and scoping of EU timber importers & imports from South America 26
Chart 2.19
Brazil softwood plywood exports by destination
Chart 2.20
Brazil softwood plywood exports to the EU
The EU and USA were formerly the largest export markets for Brazilian hardwood plywood, but exports to both markets have fallen away to negligible levels over the last five years (Chart 2.21). Argentina is now the largest export market for this commodity. Most hardwood plywood destined for the EU in the past entered by way of the UK, with most of the rest going to Italy, Germany, and Belgium (Chart 2.22). Chart 2.22
Brazil hardwood plywood exports to EU
destinations
Veneer Brazil’s veneer exports fell very steeply from around 140 000 t in 2007 to 50 000 t in 2008 and then to an average of around 20 000 t in the 2009–2012 period (Chart 2.23). Hardwoods formerly made up a significant
Chart 2.21
Brazil hardwood plywood exports by destination
Evaluation and scoping of EU timber importers & imports from South America 27
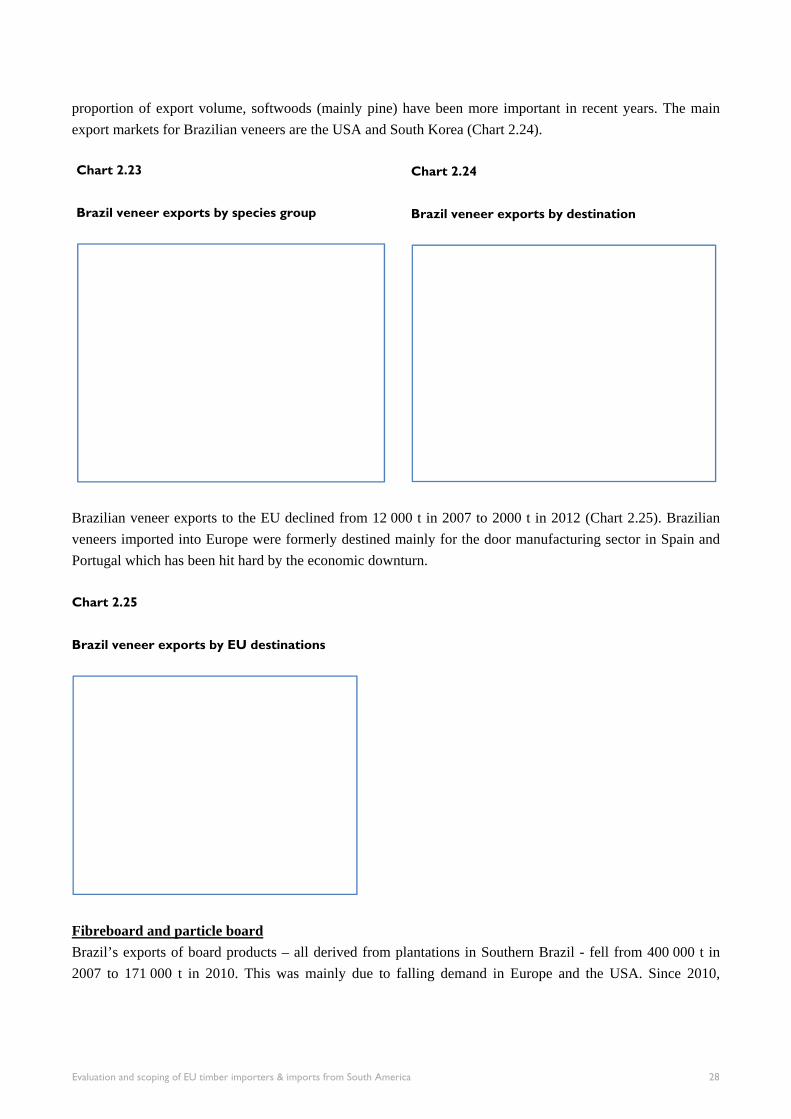
proportion of export volume, softwoods (mainly pine) have been more important in recent years. The main export markets for Brazilian veneers are the USA and South Korea (Chart 2.24).
Chart 2.24
Brazil veneer exports by destination
Brazilian veneer exports to the EU declined from 12 000 t in 2007 to 2000 t in 2012 (Chart 2.25). Brazilian veneers imported into Europe were formerly destined mainly for the door manufacturing sector in Spain and Portugal which has been hit hard by the economic downturn. Chart 2.25
Brazil veneer exports by EU destinations
Fibreboard and particle board Brazil’s exports of board products – all derived from plantations in Southern Brazil - fell from 400 000 t in 2007 to 171 000 t in 2010. This was mainly due to falling demand in Europe and the USA. Since 2010,
Chart 2.23
Brazil veneer exports by species group
Evaluation and scoping of EU timber importers & imports from South America 28
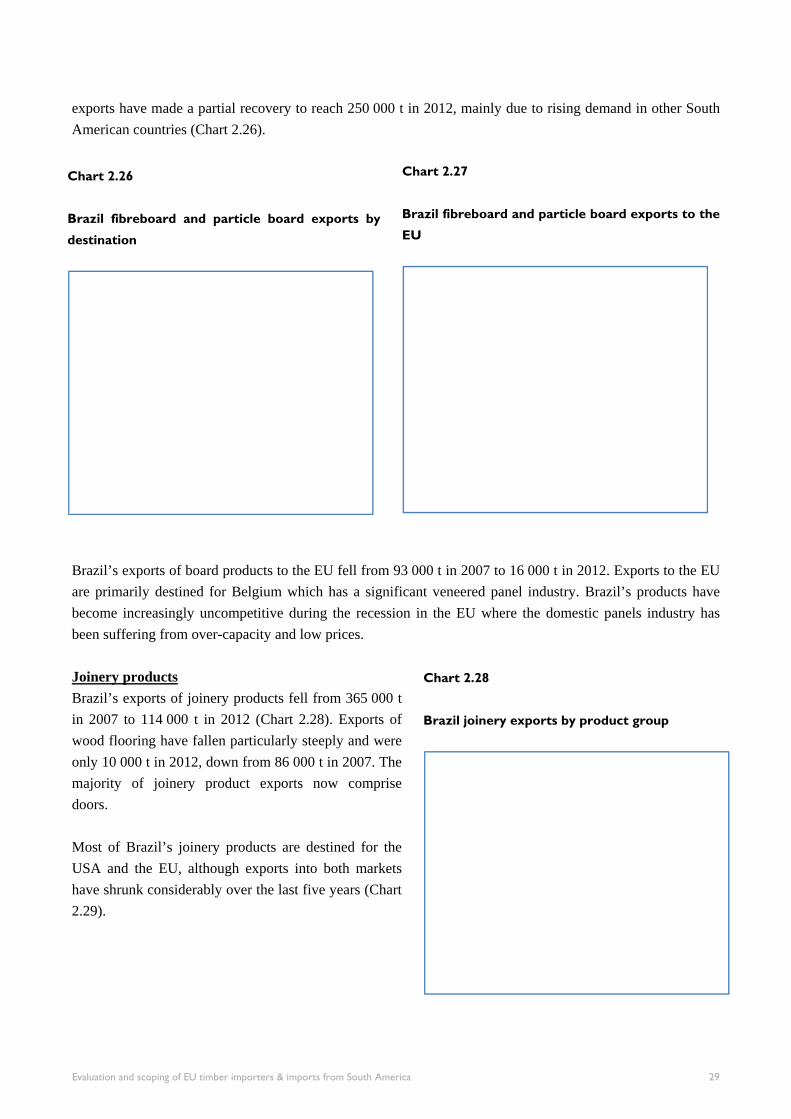
exports have made a partial recovery to reach 250 000 t in 2012, mainly due to rising demand in other South American countries (Chart 2.26).
Chart 2.27
Brazil fibreboard and particle board exports to the
EU
Brazil’s exports of board products to the EU fell from 93 000 t in 2007 to 16 000 t in 2012. Exports to the EU are primarily destined for Belgium which has a significant veneered panel industry. Brazil’s products have become increasingly uncompetitive during the recession in the EU where the domestic panels industry has been suffering from over-capacity and low prices. Joinery products Brazil’s exports of joinery products fell from 365 000 t in 2007 to 114 000 t in 2012 (Chart 2.28). Exports of wood flooring have fallen particularly steeply and were only 10 000 t in 2012, down from 86 000 t in 2007. The majority of joinery product exports now comprise doors. Most of Brazil’s joinery products are destined for the USA and the EU, although exports into both markets have shrunk considerably over the last five years (Chart 2.29).
Chart 2.26
Brazil fibreboard and particle board exports by
destination
Chart 2.28
Brazil joinery exports by product group
Evaluation and scoping of EU timber importers & imports from South America 29
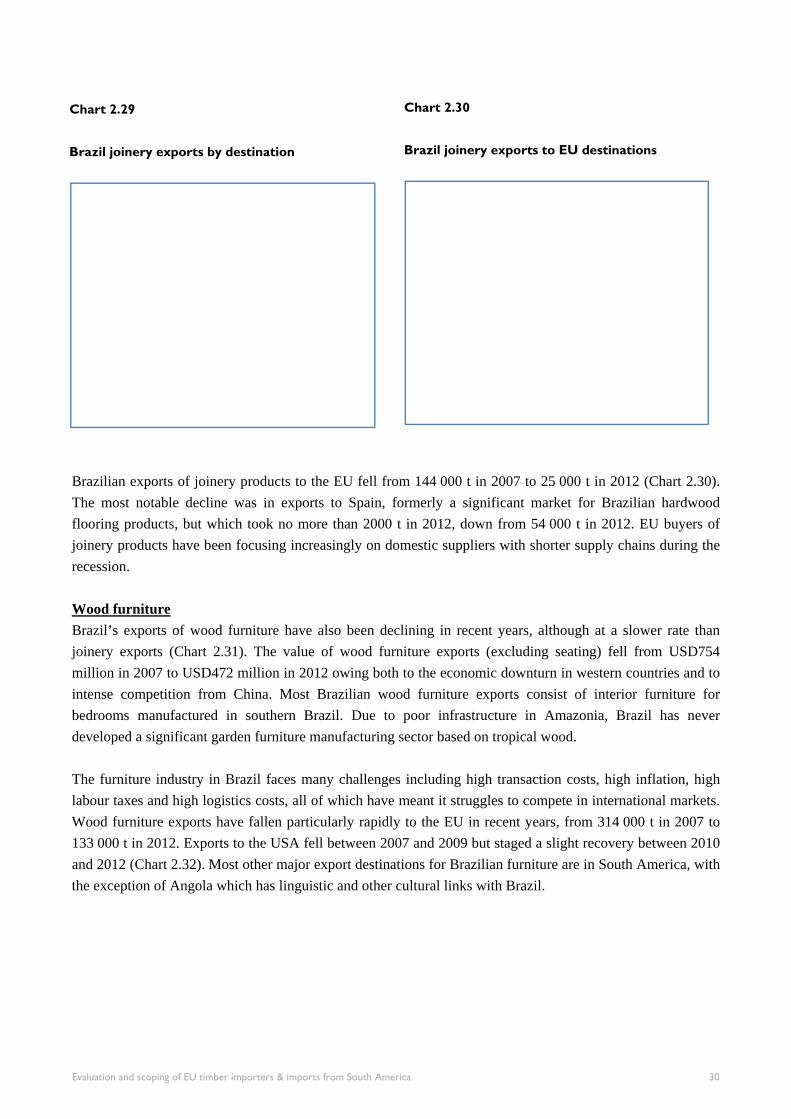
Chart 2.30
Brazil joinery exports to EU destinations
Brazilian exports of joinery products to the EU fell from 144 000 t in 2007 to 25 000 t in 2012 (Chart 2.30). The most notable decline was in exports to Spain, formerly a significant market for Brazilian hardwood flooring products, but which took no more than 2000 t in 2012, down from 54 000 t in 2012. EU buyers of joinery products have been focusing increasingly on domestic suppliers with shorter supply chains during the recession. Wood furniture Brazil’s exports of wood furniture have also been declining in recent years, although at a slower rate than joinery exports (Chart 2.31). The value of wood furniture exports (excluding seating) fell from USD754 million in 2007 to USD472 million in 2012 owing both to the economic downturn in western countries and to intense competition from China. Most Brazilian wood furniture exports consist of interior furniture for bedrooms manufactured in southern Brazil. Due to poor infrastructure in Amazonia, Brazil has never developed a significant garden furniture manufacturing sector based on tropical wood. The furniture industry in Brazil faces many challenges including high transaction costs, high inflation, high labour taxes and high logistics costs, all of which have meant it struggles to compete in international markets. Wood furniture exports have fallen particularly rapidly to the EU in recent years, from 314 000 t in 2007 to 133 000 t in 2012. Exports to the USA fell between 2007 and 2009 but staged a slight recovery between 2010 and 2012 (Chart 2.32). Most other major export destinations for Brazilian furniture are in South America, with the exception of Angola which has linguistic and other cultural links with Brazil.
Chart 2.29
Brazil joinery exports by destination
Evaluation and scoping of EU timber importers & imports from South America 30
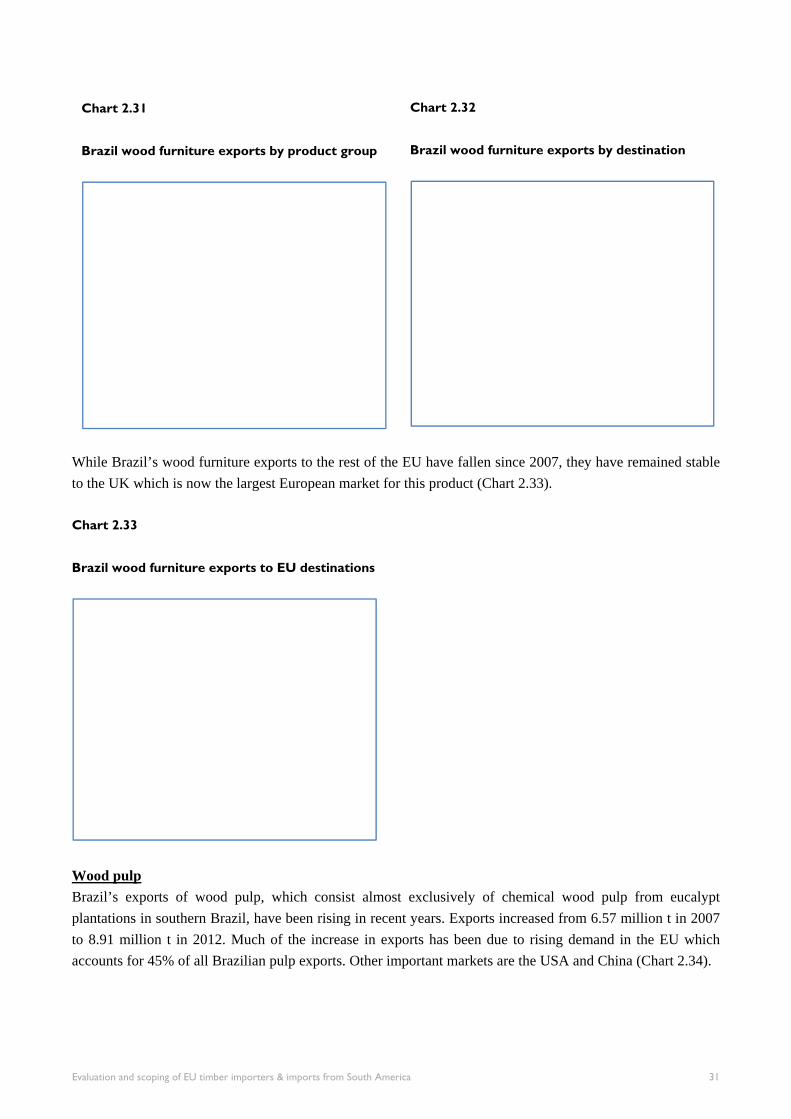
Chart 2.32
Brazil wood furniture exports by destination
While Brazil’s wood furniture exports to the rest of the EU have fallen since 2007, they have remained stable to the UK which is now the largest European market for this product (Chart 2.33). Chart 2.33
Brazil wood furniture exports to EU destinations
Wood pulp Brazil’s exports of wood pulp, which consist almost exclusively of chemical wood pulp from eucalypt plantations in southern Brazil, have been rising in recent years. Exports increased from 6.57 million t in 2007 to 8.91 million t in 2012. Much of the increase in exports has been due to rising demand in the EU which accounts for 45% of all Brazilian pulp exports. Other important markets are the USA and China (Chart 2.34).
Chart 2.31
Brazil wood furniture exports by product group
Evaluation and scoping of EU timber importers & imports from South America 31
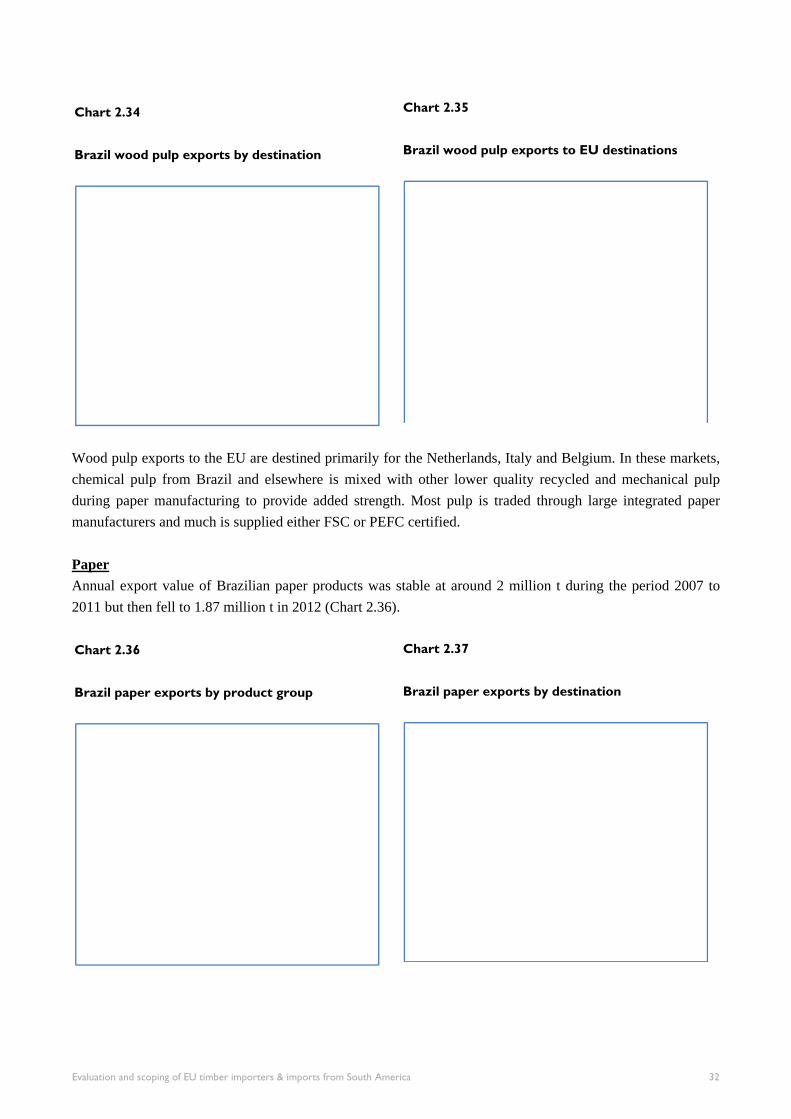
Chart 2.35
Brazil wood pulp exports to EU destinations
Wood pulp exports to the EU are destined primarily for the Netherlands, Italy and Belgium. In these markets, chemical pulp from Brazil and elsewhere is mixed with other lower quality recycled and mechanical pulp during paper manufacturing to provide added strength. Most pulp is traded through large integrated paper manufacturers and much is supplied either FSC or PEFC certified. Paper Annual export value of Brazilian paper products was stable at around 2 million t during the period 2007 to 2011 but then fell to 1.87 million t in 2012 (Chart 2.36).
Chart 2.37
Brazil paper exports by destination
Chart 2.34
Brazil wood pulp exports by destination
Chart 2.36
Brazil paper exports by product group
Evaluation and scoping of EU timber importers & imports from South America 32
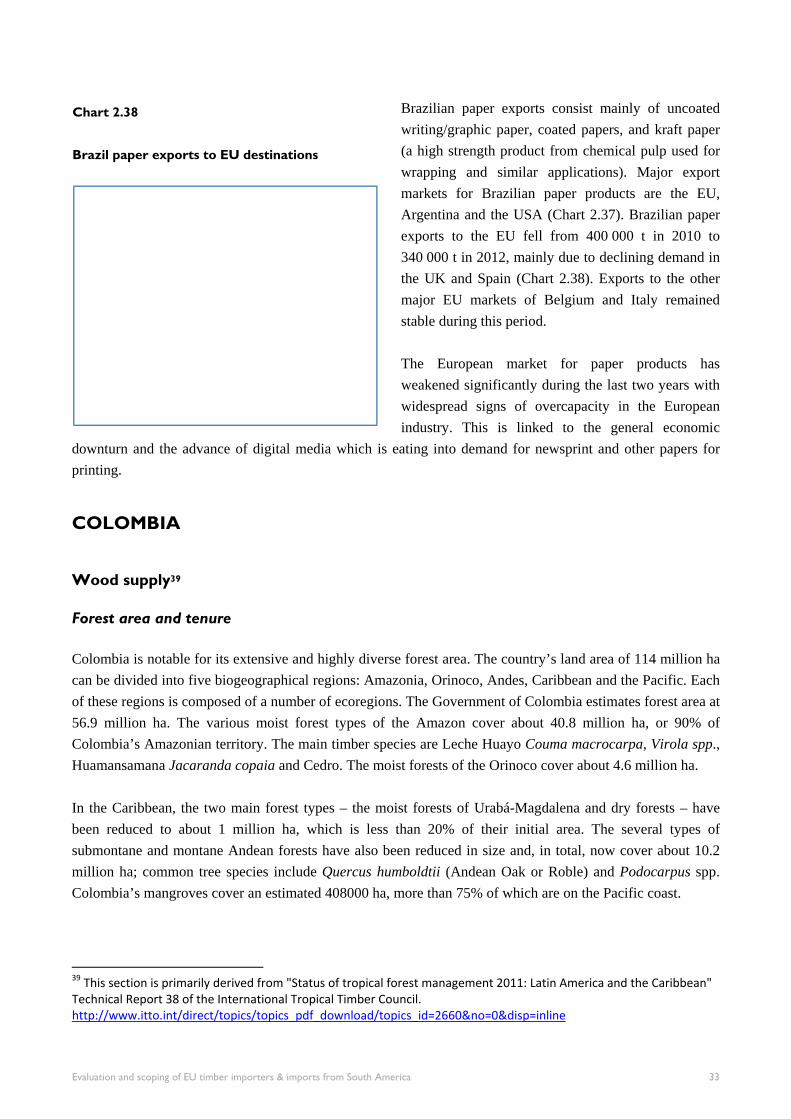
Brazilian paper exports consist mainly of uncoated writing/graphic paper, coated papers, and kraft paper (a high strength product from chemical pulp used for wrapping and similar applications). Major export markets for Brazilian paper products are the EU, Argentina and the USA (Chart 2.37). Brazilian paper exports to the EU fell from 400 000 t in 2010 to 340 000 t in 2012, mainly due to declining demand in the UK and Spain (Chart 2.38). Exports to the other major EU markets of Belgium and Italy remained stable during this period. The European market for paper products has weakened significantly during the last two years with widespread signs of overcapacity in the European industry. This is linked to the general economic
downturn and the advance of digital media which is eating into demand for newsprint and other papers for printing.
COLOMBIA
Wood supply39 Forest area and tenure
Colombia is notable for its extensive and highly diverse forest area. The country’s land area of 114 million ha can be divided into five biogeographical regions: Amazonia, Orinoco, Andes, Caribbean and the Pacific. Each of these regions is composed of a number of ecoregions. The Government of Colombia estimates forest area at 56.9 million ha. The various moist forest types of the Amazon cover about 40.8 million ha, or 90% of Colombia’s Amazonian territory. The main timber species are Leche Huayo Couma macrocarpa, Virola spp., Huamansamana Jacaranda copaia and Cedro. The moist forests of the Orinoco cover about 4.6 million ha. In the Caribbean, the two main forest types – the moist forests of Urabá-Magdalena and dry forests – have been reduced to about 1 million ha, which is less than 20% of their initial area. The several types of submontane and montane Andean forests have also been reduced in size and, in total, now cover about 10.2 million ha; common tree species include Quercus humboldtii (Andean Oak or Roble) and Podocarpus spp. Colombia’s mangroves cover an estimated 408000 ha, more than 75% of which are on the Pacific coast.
39 This section is primarily derived from "Status of tropical forest management 2011: Latin America and the Caribbean" Technical Report 38 of the International Tropical Timber Council. http://www.itto.int/direct/topics/topics_pdf_download/topics_id=2660&no=0&disp=inline
Chart 2.38
Brazil paper exports to EU destinations
Evaluation and scoping of EU timber importers & imports from South America 33
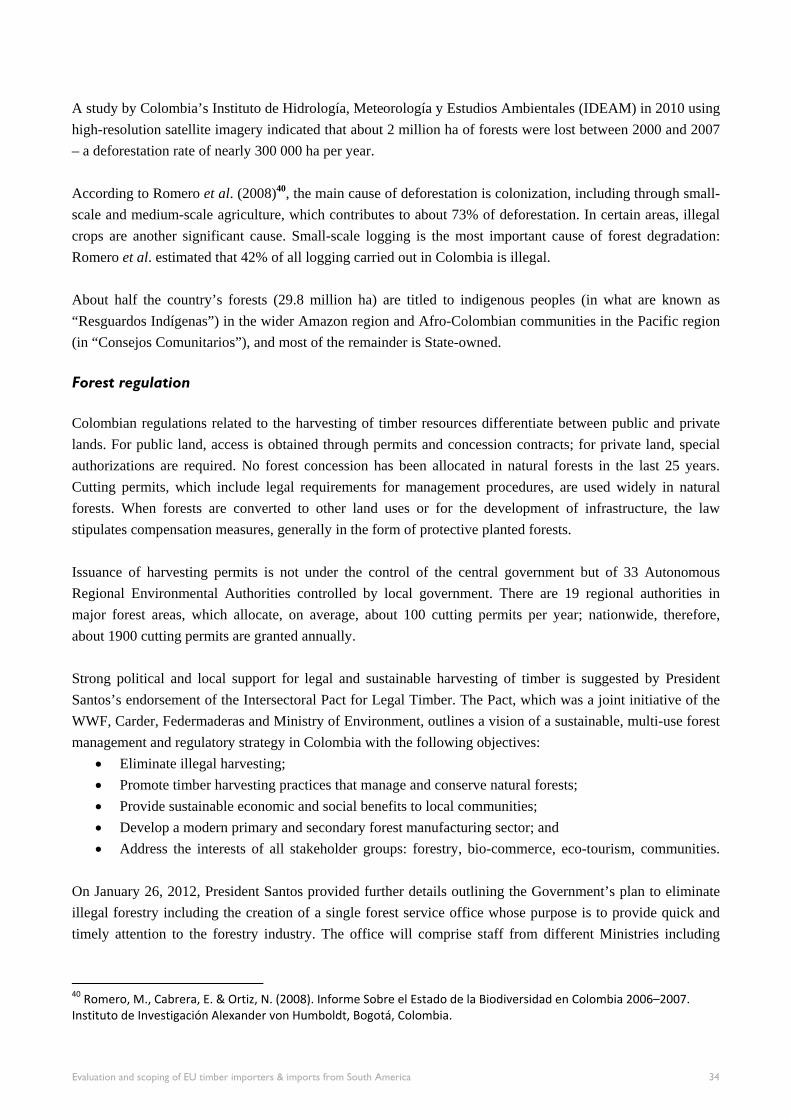
A study by Colombia’s Instituto de Hidrología, Meteorología y Estudios Ambientales (IDEAM) in 2010 using high-resolution satellite imagery indicated that about 2 million ha of forests were lost between 2000 and 2007 – a deforestation rate of nearly 300 000 ha per year. According to Romero et al. (2008)40, the main cause of deforestation is colonization, including through small-scale and medium-scale agriculture, which contributes to about 73% of deforestation. In certain areas, illegal crops are another significant cause. Small-scale logging is the most important cause of forest degradation: Romero et al. estimated that 42% of all logging carried out in Colombia is illegal. About half the country’s forests (29.8 million ha) are titled to indigenous peoples (in what are known as “Resguardos Indígenas”) in the wider Amazon region and Afro-Colombian communities in the Pacific region (in “Consejos Comunitarios”), and most of the remainder is State-owned. Forest regulation
Colombian regulations related to the harvesting of timber resources differentiate between public and private lands. For public land, access is obtained through permits and concession contracts; for private land, special authorizations are required. No forest concession has been allocated in natural forests in the last 25 years. Cutting permits, which include legal requirements for management procedures, are used widely in natural forests. When forests are converted to other land uses or for the development of infrastructure, the law stipulates compensation measures, generally in the form of protective planted forests. Issuance of harvesting permits is not under the control of the central government but of 33 Autonomous Regional Environmental Authorities controlled by local government. There are 19 regional authorities in major forest areas, which allocate, on average, about 100 cutting permits per year; nationwide, therefore, about 1900 cutting permits are granted annually. Strong political and local support for legal and sustainable harvesting of timber is suggested by President Santos’s endorsement of the Intersectoral Pact for Legal Timber. The Pact, which was a joint initiative of the WWF, Carder, Federmaderas and Ministry of Environment, outlines a vision of a sustainable, multi-use forest management and regulatory strategy in Colombia with the following objectives:
Eliminate illegal harvesting; Promote timber harvesting practices that manage and conserve natural forests; Provide sustainable economic and social benefits to local communities; Develop a modern primary and secondary forest manufacturing sector; and Address the interests of all stakeholder groups: forestry, bio-commerce, eco-tourism, communities.
On January 26, 2012, President Santos provided further details outlining the Government’s plan to eliminate illegal forestry including the creation of a single forest service office whose purpose is to provide quick and timely attention to the forestry industry. The office will comprise staff from different Ministries including
40 Romero, M., Cabrera, E. & Ortiz, N. (2008). Informe Sobre el Estado de la Biodiversidad en Colombia 2006–2007. Instituto de Investigación Alexander von Humboldt, Bogotá, Colombia.
Evaluation and scoping of EU timber importers & imports from South America 34
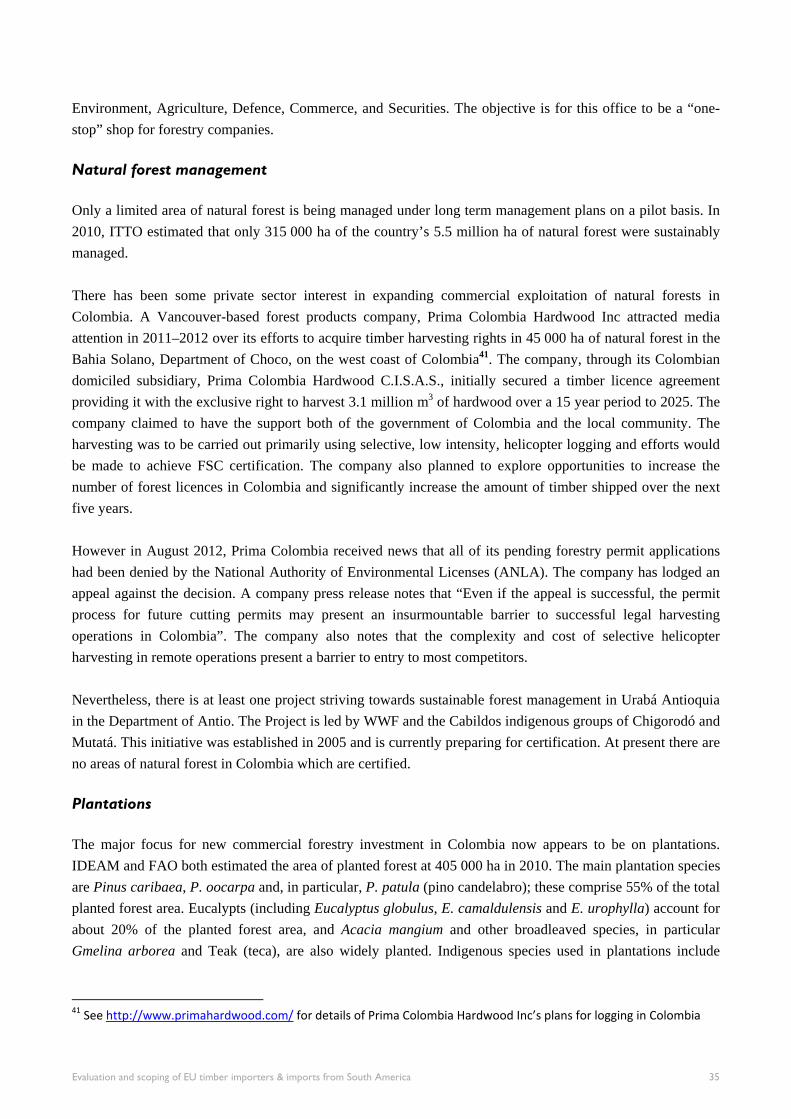
Environment, Agriculture, Defence, Commerce, and Securities. The objective is for this office to be a “one-stop” shop for forestry companies. Natural forest management
Only a limited area of natural forest is being managed under long term management plans on a pilot basis. In 2010, ITTO estimated that only 315 000 ha of the country’s 5.5 million ha of natural forest were sustainably managed. There has been some private sector interest in expanding commercial exploitation of natural forests in Colombia. A Vancouver-based forest products company, Prima Colombia Hardwood Inc attracted media attention in 2011–2012 over its efforts to acquire timber harvesting rights in 45 000 ha of natural forest in the Bahia Solano, Department of Choco, on the west coast of Colombia41. The company, through its Colombian domiciled subsidiary, Prima Colombia Hardwood C.I.S.A.S., initially secured a timber licence agreement providing it with the exclusive right to harvest 3.1 million m3 of hardwood over a 15 year period to 2025. The company claimed to have the support both of the government of Colombia and the local community. The harvesting was to be carried out primarily using selective, low intensity, helicopter logging and efforts would be made to achieve FSC certification. The company also planned to explore opportunities to increase the number of forest licences in Colombia and significantly increase the amount of timber shipped over the next five years. However in August 2012, Prima Colombia received news that all of its pending forestry permit applications had been denied by the National Authority of Environmental Licenses (ANLA). The company has lodged an appeal against the decision. A company press release notes that “Even if the appeal is successful, the permit process for future cutting permits may present an insurmountable barrier to successful legal harvesting operations in Colombia”. The company also notes that the complexity and cost of selective helicopter harvesting in remote operations present a barrier to entry to most competitors. Nevertheless, there is at least one project striving towards sustainable forest management in Urabá Antioquia in the Department of Antio. The Project is led by WWF and the Cabildos indigenous groups of Chigorodó and Mutatá. This initiative was established in 2005 and is currently preparing for certification. At present there are no areas of natural forest in Colombia which are certified. Plantations
The major focus for new commercial forestry investment in Colombia now appears to be on plantations. IDEAM and FAO both estimated the area of planted forest at 405 000 ha in 2010. The main plantation species are Pinus caribaea, P. oocarpa and, in particular, P. patula (pino candelabro); these comprise 55% of the total planted forest area. Eucalypts (including Eucalyptus globulus, E. camaldulensis and E. urophylla) account for about 20% of the planted forest area, and Acacia mangium and other broadleaved species, in particular Gmelina arborea and Teak (teca), are also widely planted. Indigenous species used in plantations include
41 See http://www.primahardwood.com/ for details of Prima Colombia Hardwood Inc’s plans for logging in Colombia
Evaluation and scoping of EU timber importers & imports from South America 35
Cordia alliodora (vara de humo), Bombacopsis quinata (ceiba tolúa), Tabebuia rosea, Alnus acuminata (aliso), Lafoensia speciosa and Quercus humboldtii. The country intends to increase its planted forest area, particularly for production purposes, to 5 million ha or more in coming years. In 2010, Law 1377 was approved, which permits the use of planted forests for production purposes, even if they have been declared as protection forests. In order to improve efficiency and competitiveness it also eliminates the requirement that the owners of planted forests receive government permission to harvest their commercial plantations. Regulations that restrict the export of logs from natural forests have been in place for more than 15 years; only roundwood harvested in planted forests may be exported. The government now offers the “Certificado de Incentivo Forestal” (CIF), a subsidy for forest plantations with a total budget of COP429 billion (USD225 million). There is also a revenue tax exemption for new forest plantations. Various joint ventures between South American forestry operators and international investors are now becoming engaged in new plantation establishment in the country. For example, the Antioquia Project links together Cotopaxi, an Ecuadorian panels manufacturer and the Forest Company Limited, a Guernsey-based forest investment company42 . The latter, which was established in 2007 and has invested in five forest plantations in Brazil as well as Colombia, has raised USD300 million in equity capital from institutional investors and others. The Company is investing specifically in forestry projects that are or will be certified by the FSC and does not acquire native forest for harvesting. The Antioquia project involves establishment and management of pine plantations and development of wood-based panel and sawing capacity in Colombia. Ireland-based Smurfit Kappa, one of the world's leading producers of paper-based packaging, has also invested in plantations in Colombia. Their largest wood source in the country includes 69 000 ha of eucalypt plantations, 6400 ha of which is managed in partnership with private landowners. The whole area has been FSC certified since 2003. Timber production
According to ITTO, drawing on IDEAM data, more than 14 million m3 were harvested in Colombia in the period 2004–09, about 2.3 million m3 per year. About 251 timber species are used, but only a few predominate. About 80% of wood used in the country derives from natural forest and 20% from plantations. However the latter are much more significant in international trade. According to ITTO, each year commercial plantations supply more than 500 000 m3 of eucalypts and 200 000 m3 of pine. Precise information on species harvested from natural forests is less readily available. However ITTO estimate that the harvest of Prioria copaifera (cativo) and Campnosperma panamensis (sajo) is each in excess of 100 000 m3 per year. ITTO also note that, in practice, many timber species are subject to uncontrolled salvage logging, especially in the Pacific region, among them Brosimum utile (sande, huina), Carapa guianensis (andiroba), Cedro, and Tabebuia serratifolia/T. rosea (cedro rosado).
42 Details of The Forest Company at http://theforestcompany.se
Evaluation and scoping of EU timber importers & imports from South America 36
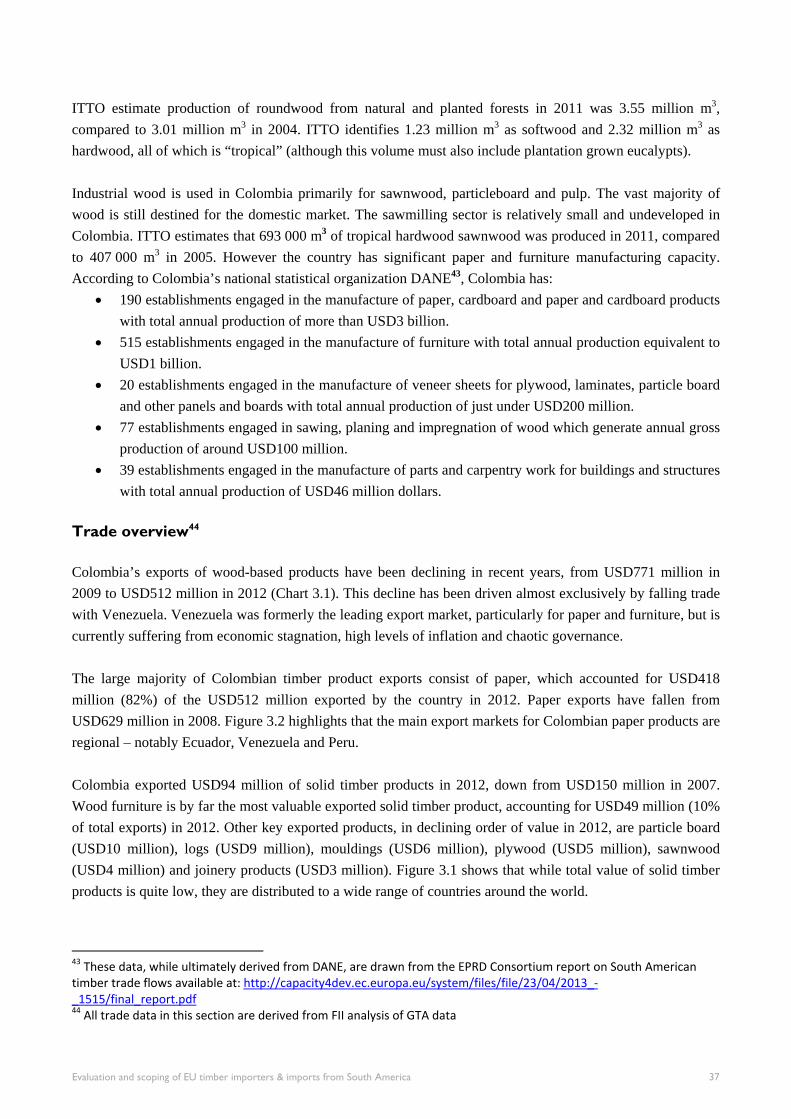
ITTO estimate production of roundwood from natural and planted forests in 2011 was 3.55 million m3, compared to 3.01 million m3 in 2004. ITTO identifies 1.23 million m3 as softwood and 2.32 million m3 as hardwood, all of which is “tropical” (although this volume must also include plantation grown eucalypts). Industrial wood is used in Colombia primarily for sawnwood, particleboard and pulp. The vast majority of wood is still destined for the domestic market. The sawmilling sector is relatively small and undeveloped in Colombia. ITTO estimates that 693 000 m3 of tropical hardwood sawnwood was produced in 2011, compared to 407 000 m3 in 2005. However the country has significant paper and furniture manufacturing capacity. According to Colombia’s national statistical organization DANE43, Colombia has:
190 establishments engaged in the manufacture of paper, cardboard and paper and cardboard products with total annual production of more than USD3 billion.
515 establishments engaged in the manufacture of furniture with total annual production equivalent to USD1 billion.
20 establishments engaged in the manufacture of veneer sheets for plywood, laminates, particle board and other panels and boards with total annual production of just under USD200 million.
77 establishments engaged in sawing, planing and impregnation of wood which generate annual gross production of around USD100 million.
39 establishments engaged in the manufacture of parts and carpentry work for buildings and structures with total annual production of USD46 million dollars.
Trade overview44
Colombia’s exports of wood-based products have been declining in recent years, from USD771 million in 2009 to USD512 million in 2012 (Chart 3.1). This decline has been driven almost exclusively by falling trade with Venezuela. Venezuela was formerly the leading export market, particularly for paper and furniture, but is currently suffering from economic stagnation, high levels of inflation and chaotic governance. The large majority of Colombian timber product exports consist of paper, which accounted for USD418 million (82%) of the USD512 million exported by the country in 2012. Paper exports have fallen from USD629 million in 2008. Figure 3.2 highlights that the main export markets for Colombian paper products are regional – notably Ecuador, Venezuela and Peru. Colombia exported USD94 million of solid timber products in 2012, down from USD150 million in 2007. Wood furniture is by far the most valuable exported solid timber product, accounting for USD49 million (10% of total exports) in 2012. Other key exported products, in declining order of value in 2012, are particle board (USD10 million), logs (USD9 million), mouldings (USD6 million), plywood (USD5 million), sawnwood (USD4 million) and joinery products (USD3 million). Figure 3.1 shows that while total value of solid timber products is quite low, they are distributed to a wide range of countries around the world.
43 These data, while ultimately derived from DANE, are drawn from the EPRD Consortium report on South American timber trade flows available at: http://capacity4dev.ec.europa.eu/system/files/file/23/04/2013_‐_1515/final_report.pdf 44 All trade data in this section are derived from FII analysis of GTA data
Evaluation and scoping of EU timber importers & imports from South America 37
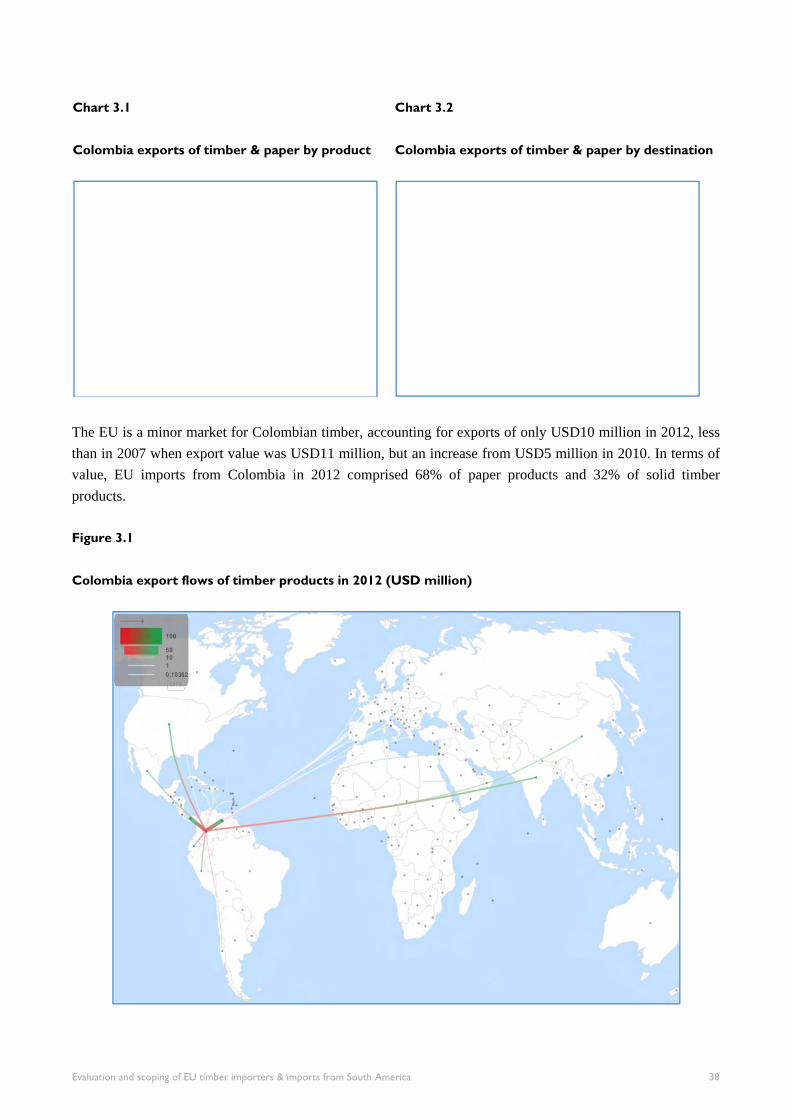
Chart 3.1
Colombia exports of timber & paper by product
Chart 3.2
Colombia exports of timber & paper by destination
The EU is a minor market for Colombian timber, accounting for exports of only USD10 million in 2012, less than in 2007 when export value was USD11 million, but an increase from USD5 million in 2010. In terms of value, EU imports from Colombia in 2012 comprised 68% of paper products and 32% of solid timber products. Figure 3.1
Colombia export flows of timber products in 2012 (USD million)
Evaluation and scoping of EU timber importers & imports from South America 38
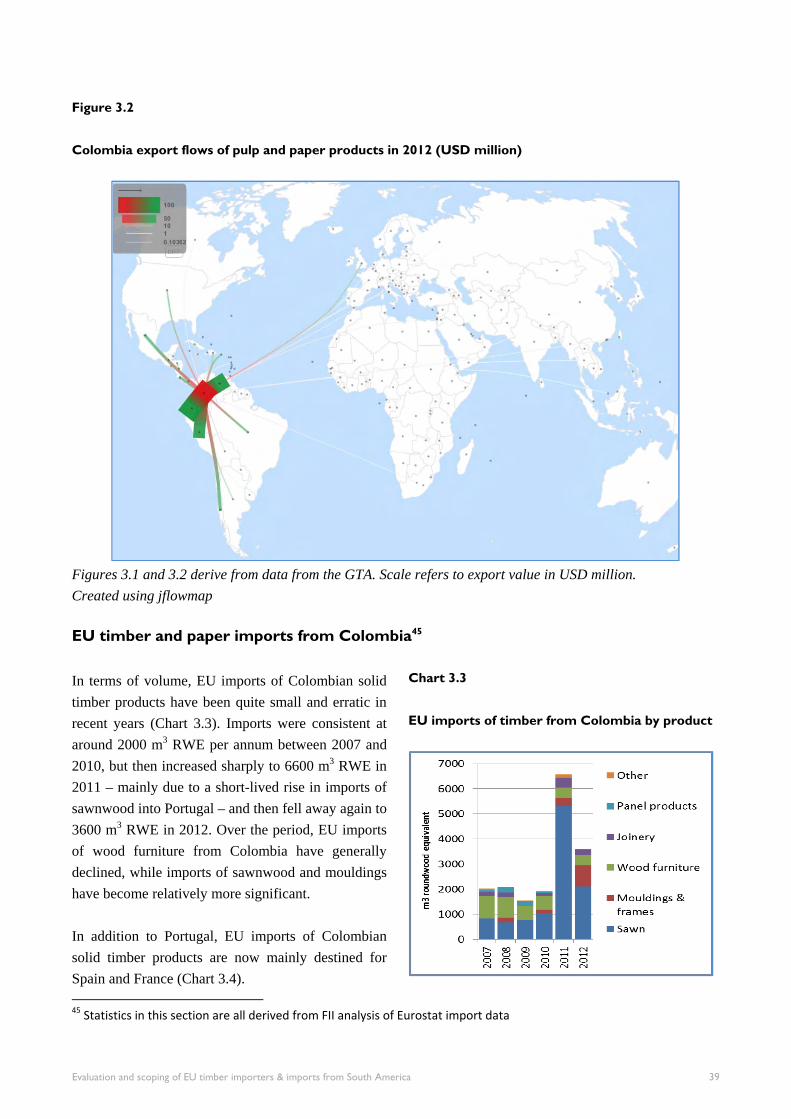
Figure 3.2
Colombia export flows of pulp and paper products in 2012 (USD million)
Figures 3.1 and 3.2 derive from data from the GTA. Scale refers to export value in USD million.
Created using jflowmap
EU timber and paper imports from Colombia45
In terms of volume, EU imports of Colombian solid timber products have been quite small and erratic in recent years (Chart 3.3). Imports were consistent at around 2000 m3 RWE per annum between 2007 and 2010, but then increased sharply to 6600 m3 RWE in 2011 – mainly due to a short-lived rise in imports of sawnwood into Portugal – and then fell away again to 3600 m3 RWE in 2012. Over the period, EU imports of wood furniture from Colombia have generally declined, while imports of sawnwood and mouldings have become relatively more significant. In addition to Portugal, EU imports of Colombian solid timber products are now mainly destined for Spain and France (Chart 3.4). 45 Statistics in this section are all derived from FII analysis of Eurostat import data
Chart 3.3
EU imports of timber from Colombia by product
Evaluation and scoping of EU timber importers & imports from South America 39
Chart 3.5
EU imports of paper from Colombia by product
EU imports of Colombian paper products surged in 2012 to 4100 t, up from 1360 t the previous year (Chart 3.5). This was all due to the sudden emergence of Colombia as a supplier of uncoated kraft paper (from chemical pulp) into the EU. Colombia also supplies small quantities of toilet and other sanitary papers into the EU. Most Colombian paper products imported into the EU are destined for France, Spain, Italy and the Netherlands. Only in the case of France has the volume in any one year exceeded 1500 t.
Chart 3.4
EU imports of timber from Colombia by
destination
Chart 3.6
EU imports of paper from Colombia by destination
Evaluation and scoping of EU timber importers & imports from South America 40
Colombia timber and paper exports by product46
Logs Colombia’s log exports increased from less than 15 000 m3 in 2007 to over 40 000 m3 in 2010 and then declined again to 28 000 m3 in 2012 (Chart 3.7). The sharp rise in exports before 2010 was driven by rising demand in China and to a lesser extent India. The EU barely features in this market. Exports to China fell away after 2010 while exports to India continued to rise. Log exports to India are likely to be mainly plantation Teak which is very dominant in the Indian market.
Sawn Colombia’s sawnwood are limited and have been erratic in recent years with most of the volume destined for other South American markets (Chart 3.8). Total exports have not exceeded 12 000 m3 in any of the six years prior to 2013. Venezuela was the main market before 2010 but exports to that destination dwindled to negligible levels in 2012. The leading markets in 2012 were India, China and Panama. Exports to the EU are estimated (from Colombian export data) to have been valued at no more than USD320 000 in 2012 and below 500 m3. The apparent increase recorded in EU imports during 2011 is not reflected in the export figures (which is not unusual given data quality issues). 46 Statistics in this section are all derived from FII analysis of GTA data
Chart 3.8
Colombia sawn exports
Chart 3.7
Colombia log exports
Evaluation and scoping of EU timber importers & imports from South America 41
Mouldings Prior to 2009, Colombia was exporting a significant volume of mouldings to Venezuela, up to 100 000 m3 valued up to USD25 million per year (Chart 3.9). That trade declined very sharply to negligible levels in 2010 and 2011. In 2012, exports increased again to 20 000 m3 with rising demand in Venezuela. Mexico also emerged as a more significant market. Exports to the EU were around 1500 m3 in 2012, up from negligible levels in previous years.
Plywood Colombia’s plywood exports are also low and strongly influenced by events in Venezuela (Chart 3.10). In the last six years, exports peaked at 16 000 m3 in 2008, the majority destined for Venezuela. Exports then fell sharply in 2010 to below 4000 m3 before recovering slightly just above 6000 m3 in 2012. In 2012, exports went almost exclusively to Venezuela and Puerto Rico. Both the EU and USA were importing small quantities of Colombian plywood until 2009. However, zero trade to both destinations was recorded in 2012.
Chart 3.10
Colombia plywood and veneer exports
Chart 3.9
Colombia mouldings exports
Evaluation and scoping of EU timber importers & imports from South America 42
Panel products Colombia’s exports of composite wood panels have been rising in recent years to reach 23 000 m3 in 2012 (Chart 3.11). Exports were destined almost exclusively for other countries in the region and there is no trade with the EU. Chart 3.11
Colombia particle board and fibreboard exports
Joinery products Colombia’s exports of joinery products have been declining in recent years and were valued at USD3 million in 2012 (Chart 3.12). Exports to Venezuela, formerly the largest export market, have fallen to negligible levels. The largest export market in 2012 was Panama. Small amounts of joinery products have been exported to the USA in the past but trade with the EU is negligible.
Chart 3.12
Colombia joinery product exports
Evaluation and scoping of EU timber importers & imports from South America 43
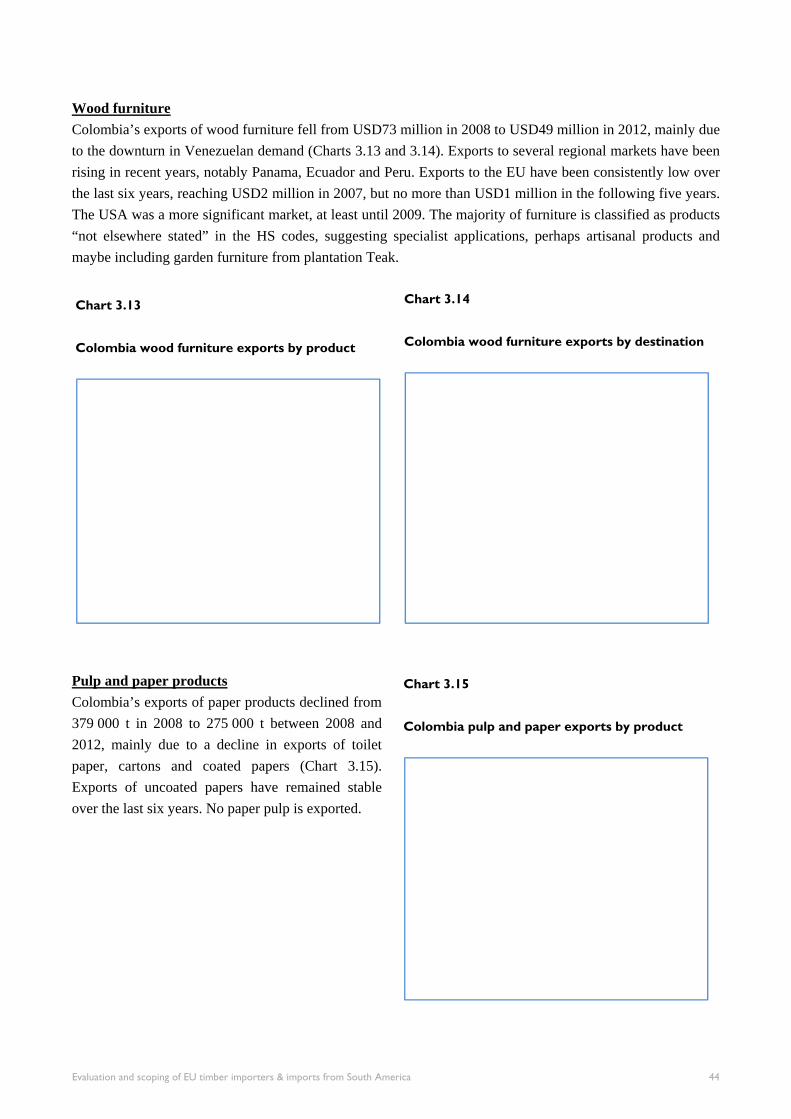
Wood furniture Colombia’s exports of wood furniture fell from USD73 million in 2008 to USD49 million in 2012, mainly due to the downturn in Venezuelan demand (Charts 3.13 and 3.14). Exports to several regional markets have been rising in recent years, notably Panama, Ecuador and Peru. Exports to the EU have been consistently low over the last six years, reaching USD2 million in 2007, but no more than USD1 million in the following five years. The USA was a more significant market, at least until 2009. The majority of furniture is classified as products “not elsewhere stated” in the HS codes, suggesting specialist applications, perhaps artisanal products and maybe including garden furniture from plantation Teak.
Chart 3.14
Colombia wood furniture exports by destination
Pulp and paper products Colombia’s exports of paper products declined from 379 000 t in 2008 to 275 000 t between 2008 and 2012, mainly due to a decline in exports of toilet paper, cartons and coated papers (Chart 3.15). Exports of uncoated papers have remained stable over the last six years. No paper pulp is exported.
Chart 3.13
Colombia wood furniture exports by product
Chart 3.15
Colombia pulp and paper exports by product
Evaluation and scoping of EU timber importers & imports from South America 44
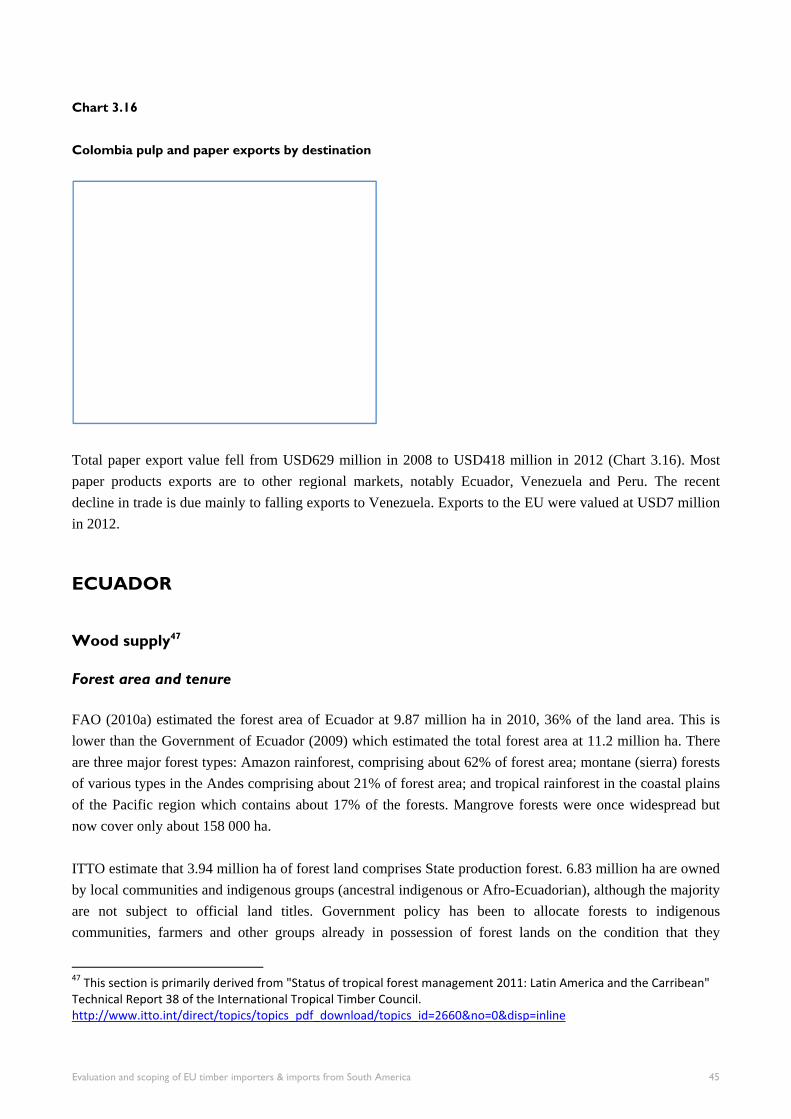
Chart 3.16
Colombia pulp and paper exports by destination
Total paper export value fell from USD629 million in 2008 to USD418 million in 2012 (Chart 3.16). Most paper products exports are to other regional markets, notably Ecuador, Venezuela and Peru. The recent decline in trade is due mainly to falling exports to Venezuela. Exports to the EU were valued at USD7 million in 2012. ECUADOR
Wood supply47 Forest area and tenure
FAO (2010a) estimated the forest area of Ecuador at 9.87 million ha in 2010, 36% of the land area. This is lower than the Government of Ecuador (2009) which estimated the total forest area at 11.2 million ha. There are three major forest types: Amazon rainforest, comprising about 62% of forest area; montane (sierra) forests of various types in the Andes comprising about 21% of forest area; and tropical rainforest in the coastal plains of the Pacific region which contains about 17% of the forests. Mangrove forests were once widespread but now cover only about 158 000 ha. ITTO estimate that 3.94 million ha of forest land comprises State production forest. 6.83 million ha are owned by local communities and indigenous groups (ancestral indigenous or Afro-Ecuadorian), although the majority are not subject to official land titles. Government policy has been to allocate forests to indigenous communities, farmers and other groups already in possession of forest lands on the condition that they
47 This section is primarily derived from "Status of tropical forest management 2011: Latin America and the Carribean" Technical Report 38 of the International Tropical Timber Council. http://www.itto.int/direct/topics/topics_pdf_download/topics_id=2660&no=0&disp=inline
Evaluation and scoping of EU timber importers & imports from South America 45
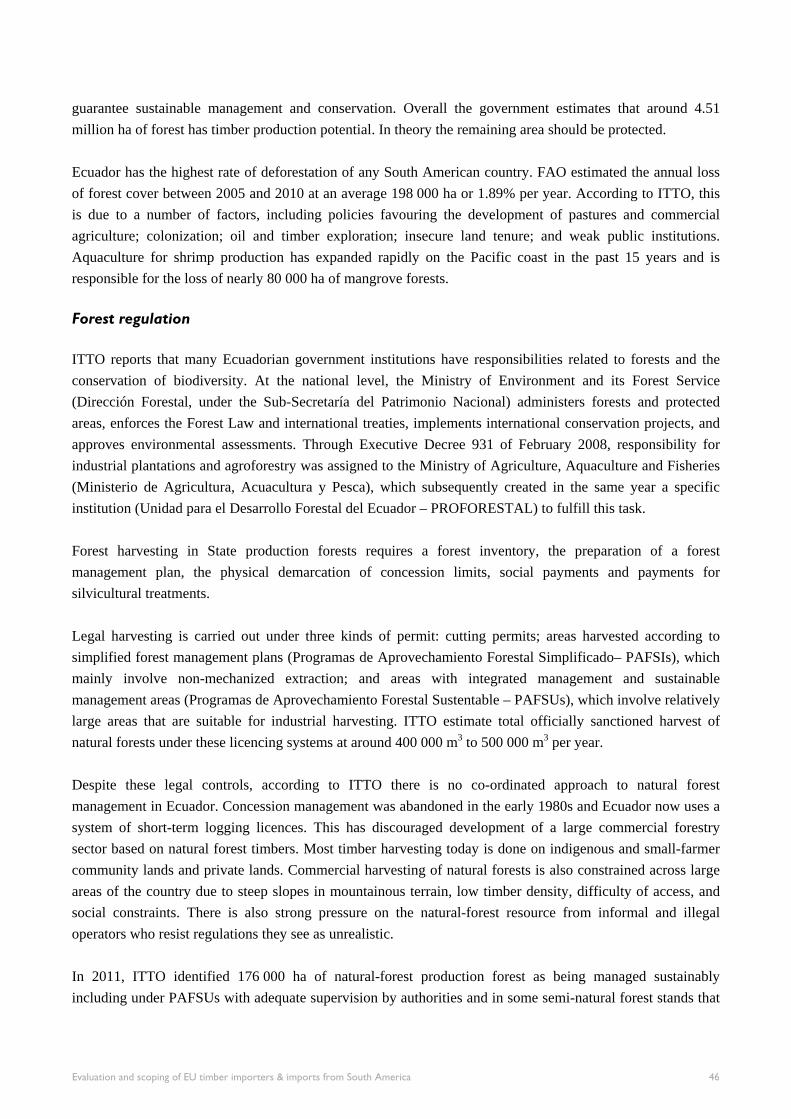
guarantee sustainable management and conservation. Overall the government estimates that around 4.51 million ha of forest has timber production potential. In theory the remaining area should be protected. Ecuador has the highest rate of deforestation of any South American country. FAO estimated the annual loss of forest cover between 2005 and 2010 at an average 198 000 ha or 1.89% per year. According to ITTO, this is due to a number of factors, including policies favouring the development of pastures and commercial agriculture; colonization; oil and timber exploration; insecure land tenure; and weak public institutions. Aquaculture for shrimp production has expanded rapidly on the Pacific coast in the past 15 years and is responsible for the loss of nearly 80 000 ha of mangrove forests. Forest regulation
ITTO reports that many Ecuadorian government institutions have responsibilities related to forests and the conservation of biodiversity. At the national level, the Ministry of Environment and its Forest Service (Dirección Forestal, under the Sub-Secretaría del Patrimonio Nacional) administers forests and protected areas, enforces the Forest Law and international treaties, implements international conservation projects, and approves environmental assessments. Through Executive Decree 931 of February 2008, responsibility for industrial plantations and agroforestry was assigned to the Ministry of Agriculture, Aquaculture and Fisheries (Ministerio de Agricultura, Acuacultura y Pesca), which subsequently created in the same year a specific institution (Unidad para el Desarrollo Forestal del Ecuador – PROFORESTAL) to fulfill this task. Forest harvesting in State production forests requires a forest inventory, the preparation of a forest management plan, the physical demarcation of concession limits, social payments and payments for silvicultural treatments. Legal harvesting is carried out under three kinds of permit: cutting permits; areas harvested according to simplified forest management plans (Programas de Aprovechamiento Forestal Simplificado– PAFSIs), which mainly involve non-mechanized extraction; and areas with integrated management and sustainable management areas (Programas de Aprovechamiento Forestal Sustentable – PAFSUs), which involve relatively large areas that are suitable for industrial harvesting. ITTO estimate total officially sanctioned harvest of natural forests under these licencing systems at around 400 000 m3 to 500 000 m3 per year. Despite these legal controls, according to ITTO there is no co-ordinated approach to natural forest management in Ecuador. Concession management was abandoned in the early 1980s and Ecuador now uses a system of short-term logging licences. This has discouraged development of a large commercial forestry sector based on natural forest timbers. Most timber harvesting today is done on indigenous and small-farmer community lands and private lands. Commercial harvesting of natural forests is also constrained across large areas of the country due to steep slopes in mountainous terrain, low timber density, difficulty of access, and social constraints. There is also strong pressure on the natural-forest resource from informal and illegal operators who resist regulations they see as unrealistic. In 2011, ITTO identified 176 000 ha of natural-forest production forest as being managed sustainably including under PAFSUs with adequate supervision by authorities and in some semi-natural forest stands that
Evaluation and scoping of EU timber importers & imports from South America 46
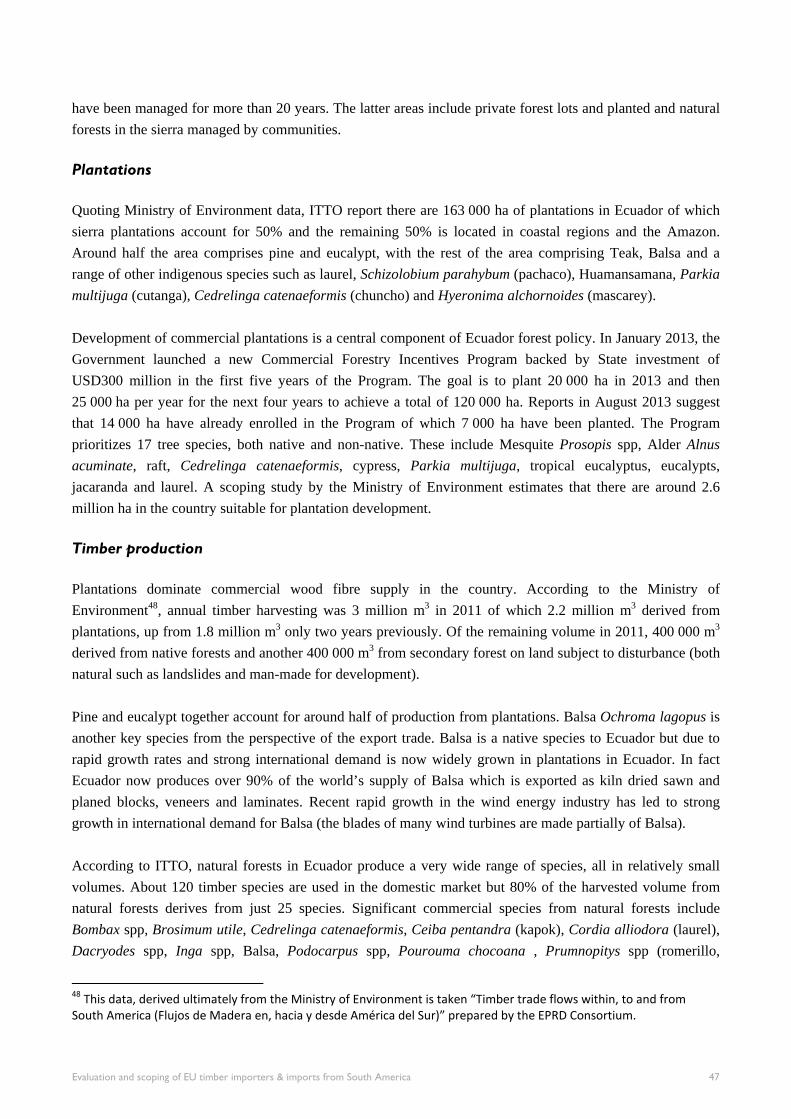
have been managed for more than 20 years. The latter areas include private forest lots and planted and natural forests in the sierra managed by communities. Plantations
Quoting Ministry of Environment data, ITTO report there are 163 000 ha of plantations in Ecuador of which sierra plantations account for 50% and the remaining 50% is located in coastal regions and the Amazon. Around half the area comprises pine and eucalypt, with the rest of the area comprising Teak, Balsa and a range of other indigenous species such as laurel, Schizolobium parahybum (pachaco), Huamansamana, Parkia
multijuga (cutanga), Cedrelinga catenaeformis (chuncho) and Hyeronima alchornoides (mascarey). Development of commercial plantations is a central component of Ecuador forest policy. In January 2013, the Government launched a new Commercial Forestry Incentives Program backed by State investment of USD300 million in the first five years of the Program. The goal is to plant 20 000 ha in 2013 and then 25 000 ha per year for the next four years to achieve a total of 120 000 ha. Reports in August 2013 suggest that 14 000 ha have already enrolled in the Program of which 7 000 ha have been planted. The Program prioritizes 17 tree species, both native and non-native. These include Mesquite Prosopis spp, Alder Alnus
acuminate, raft, Cedrelinga catenaeformis, cypress, Parkia multijuga, tropical eucalyptus, eucalypts, jacaranda and laurel. A scoping study by the Ministry of Environment estimates that there are around 2.6 million ha in the country suitable for plantation development. Timber production
Plantations dominate commercial wood fibre supply in the country. According to the Ministry of Environment48, annual timber harvesting was 3 million m3 in 2011 of which 2.2 million m3 derived from plantations, up from 1.8 million m3 only two years previously. Of the remaining volume in 2011, 400 000 m3 derived from native forests and another 400 000 m3 from secondary forest on land subject to disturbance (both natural such as landslides and man-made for development). Pine and eucalypt together account for around half of production from plantations. Balsa Ochroma lagopus is another key species from the perspective of the export trade. Balsa is a native species to Ecuador but due to rapid growth rates and strong international demand is now widely grown in plantations in Ecuador. In fact Ecuador now produces over 90% of the world’s supply of Balsa which is exported as kiln dried sawn and planed blocks, veneers and laminates. Recent rapid growth in the wind energy industry has led to strong growth in international demand for Balsa (the blades of many wind turbines are made partially of Balsa). According to ITTO, natural forests in Ecuador produce a very wide range of species, all in relatively small volumes. About 120 timber species are used in the domestic market but 80% of the harvested volume from natural forests derives from just 25 species. Significant commercial species from natural forests include Bombax spp, Brosimum utile, Cedrelinga catenaeformis, Ceiba pentandra (kapok), Cordia alliodora (laurel), Dacryodes spp, Inga spp, Balsa, Podocarpus spp, Pourouma chocoana , Prumnopitys spp (romerillo,
48 This data, derived ultimately from the Ministry of Environment is taken “Timber trade flows within, to and from South America (Flujos de Madera en, hacia y desde América del Sur)” prepared by the EPRD Consortium.
Evaluation and scoping of EU timber importers & imports from South America 47
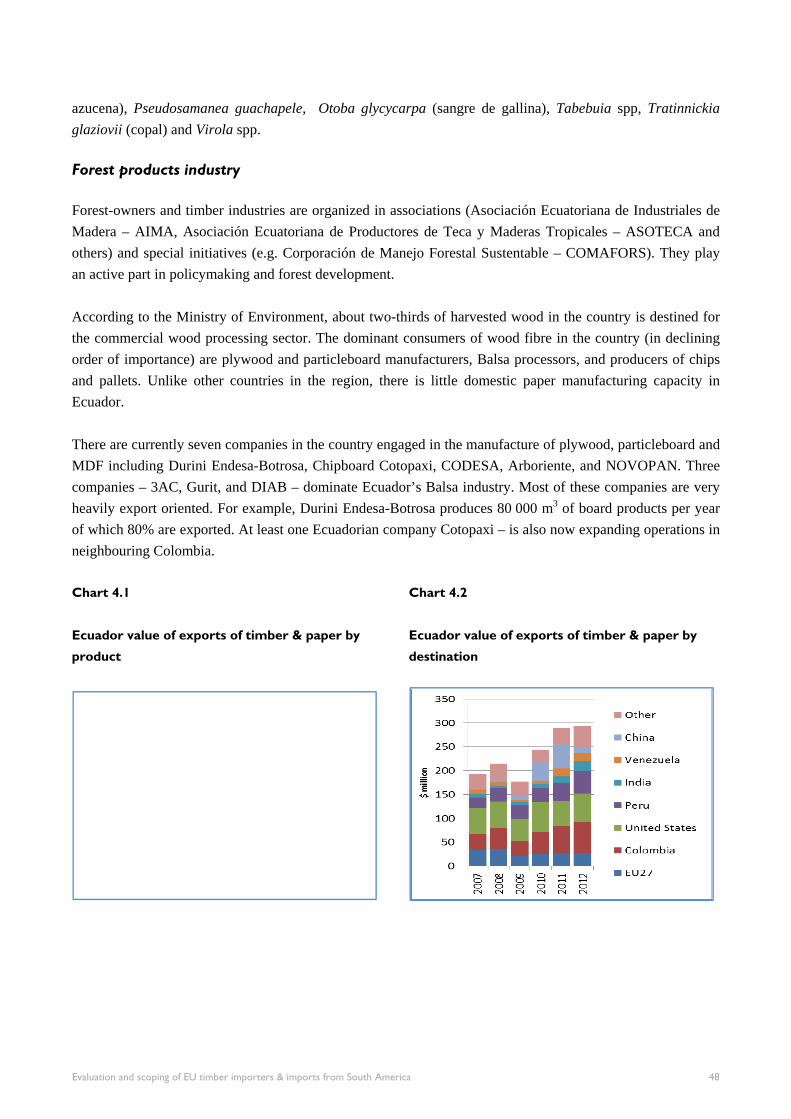
azucena), Pseudosamanea guachapele, Otoba glycycarpa (sangre de gallina), Tabebuia spp, Tratinnickia
glaziovii (copal) and Virola spp. Forest products industry
Forest-owners and timber industries are organized in associations (Asociación Ecuatoriana de Industriales de Madera – AIMA, Asociación Ecuatoriana de Productores de Teca y Maderas Tropicales – ASOTECA and others) and special initiatives (e.g. Corporación de Manejo Forestal Sustentable – COMAFORS). They play an active part in policymaking and forest development. According to the Ministry of Environment, about two-thirds of harvested wood in the country is destined for the commercial wood processing sector. The dominant consumers of wood fibre in the country (in declining order of importance) are plywood and particleboard manufacturers, Balsa processors, and producers of chips and pallets. Unlike other countries in the region, there is little domestic paper manufacturing capacity in Ecuador. There are currently seven companies in the country engaged in the manufacture of plywood, particleboard and MDF including Durini Endesa-Botrosa, Chipboard Cotopaxi, CODESA, Arboriente, and NOVOPAN. Three companies – 3AC, Gurit, and DIAB – dominate Ecuador’s Balsa industry. Most of these companies are very heavily export oriented. For example, Durini Endesa-Botrosa produces 80 000 m3 of board products per year of which 80% are exported. At least one Ecuadorian company Cotopaxi – is also now expanding operations in neighbouring Colombia. Chart 4.1
Ecuador value of exports of timber & paper by
product
Chart 4.2
Ecuador value of exports of timber & paper by
destination
Evaluation and scoping of EU timber importers & imports from South America 48
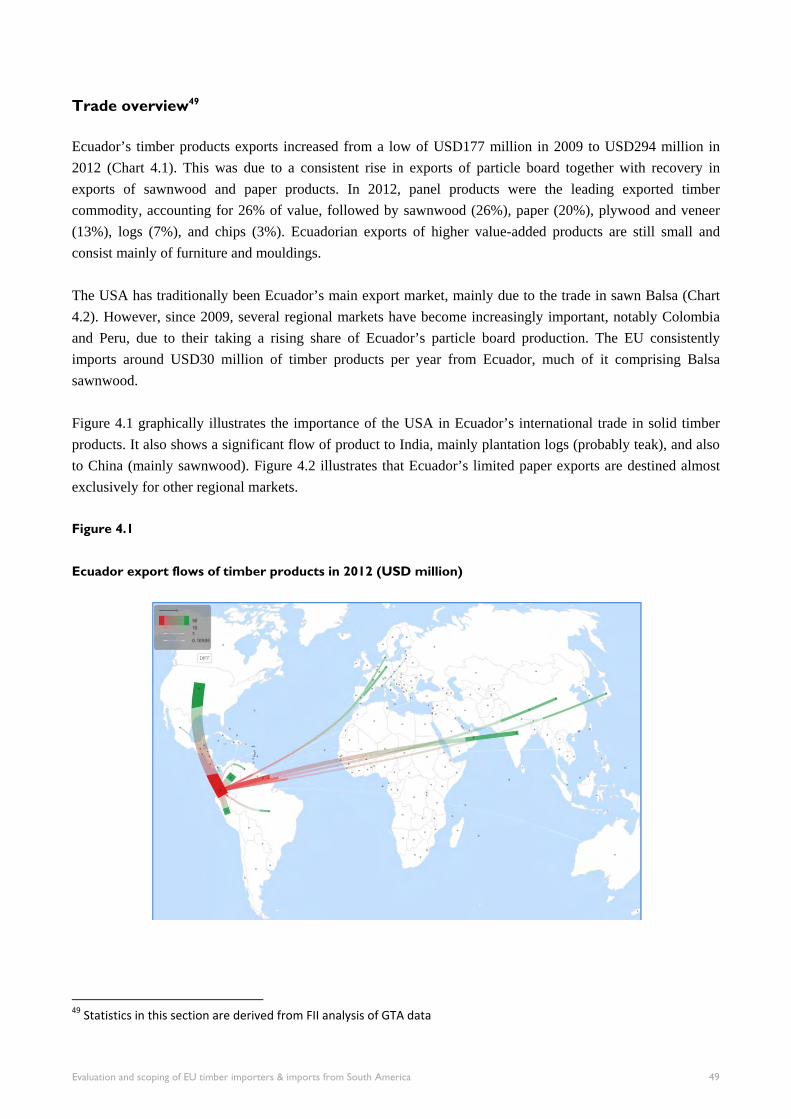
Trade overview49
Ecuador’s timber products exports increased from a low of USD177 million in 2009 to USD294 million in 2012 (Chart 4.1). This was due to a consistent rise in exports of particle board together with recovery in exports of sawnwood and paper products. In 2012, panel products were the leading exported timber commodity, accounting for 26% of value, followed by sawnwood (26%), paper (20%), plywood and veneer (13%), logs (7%), and chips (3%). Ecuadorian exports of higher value-added products are still small and consist mainly of furniture and mouldings. The USA has traditionally been Ecuador’s main export market, mainly due to the trade in sawn Balsa (Chart 4.2). However, since 2009, several regional markets have become increasingly important, notably Colombia and Peru, due to their taking a rising share of Ecuador’s particle board production. The EU consistently imports around USD30 million of timber products per year from Ecuador, much of it comprising Balsa sawnwood. Figure 4.1 graphically illustrates the importance of the USA in Ecuador’s international trade in solid timber products. It also shows a significant flow of product to India, mainly plantation logs (probably teak), and also to China (mainly sawnwood). Figure 4.2 illustrates that Ecuador’s limited paper exports are destined almost exclusively for other regional markets.
Figure 4.1
Ecuador export flows of timber products in 2012 (USD million)
49 Statistics in this section are derived from FII analysis of GTA data
Evaluation and scoping of EU timber importers & imports from South America 49
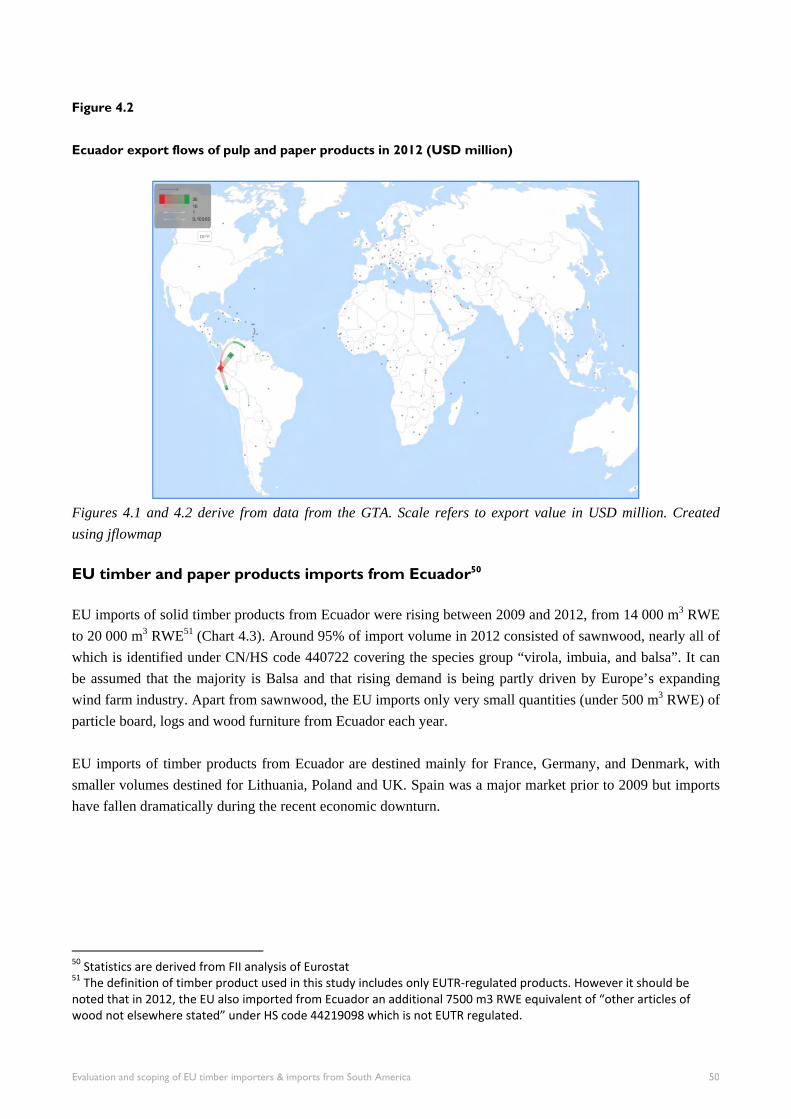
Figure 4.2
Ecuador export flows of pulp and paper products in 2012 (USD million)
Figures 4.1 and 4.2 derive from data from the GTA. Scale refers to export value in USD million. Created
using jflowmap
EU timber and paper products imports from Ecuador50
EU imports of solid timber products from Ecuador were rising between 2009 and 2012, from 14 000 m3 RWE to 20 000 m3 RWE51 (Chart 4.3). Around 95% of import volume in 2012 consisted of sawnwood, nearly all of which is identified under CN/HS code 440722 covering the species group “virola, imbuia, and balsa”. It can be assumed that the majority is Balsa and that rising demand is being partly driven by Europe’s expanding wind farm industry. Apart from sawnwood, the EU imports only very small quantities (under 500 m3 RWE) of particle board, logs and wood furniture from Ecuador each year. EU imports of timber products from Ecuador are destined mainly for France, Germany, and Denmark, with smaller volumes destined for Lithuania, Poland and UK. Spain was a major market prior to 2009 but imports have fallen dramatically during the recent economic downturn.
50 Statistics are derived from FII analysis of Eurostat 51 The definition of timber product used in this study includes only EUTR‐regulated products. However it should be noted that in 2012, the EU also imported from Ecuador an additional 7500 m3 RWE equivalent of “other articles of wood not elsewhere stated” under HS code 44219098 which is not EUTR regulated.
Evaluation and scoping of EU timber importers & imports from South America 50
Chart 4.4
EU imports of timber from Ecuador by
destination
EU imports of paper products from Ecuador are almost non-existent – totalling no more than 50 t in any of the last six years. Most of this volume has comprised paper cartons. Ecuador timber and paper exports by product
Logs Ecuador’s log exports have been erratic in the last five years, assessment of trends not helped by the fact that between 2007 and 2010 a significant volume was recorded as exported to “other” countries not identified separately in the trade statistics (Chart 4.5). However a clearer picture emerges in 2011 and 2012 of rising exports to India which took nearly 100% of the 163 000 t traded. Most of this is almost certainly plantation Teak.
Chart 4.3
EU imports of timber from Ecuador by product
Chart 4.5
Ecuador log exports
Evaluation and scoping of EU timber importers & imports from South America 51
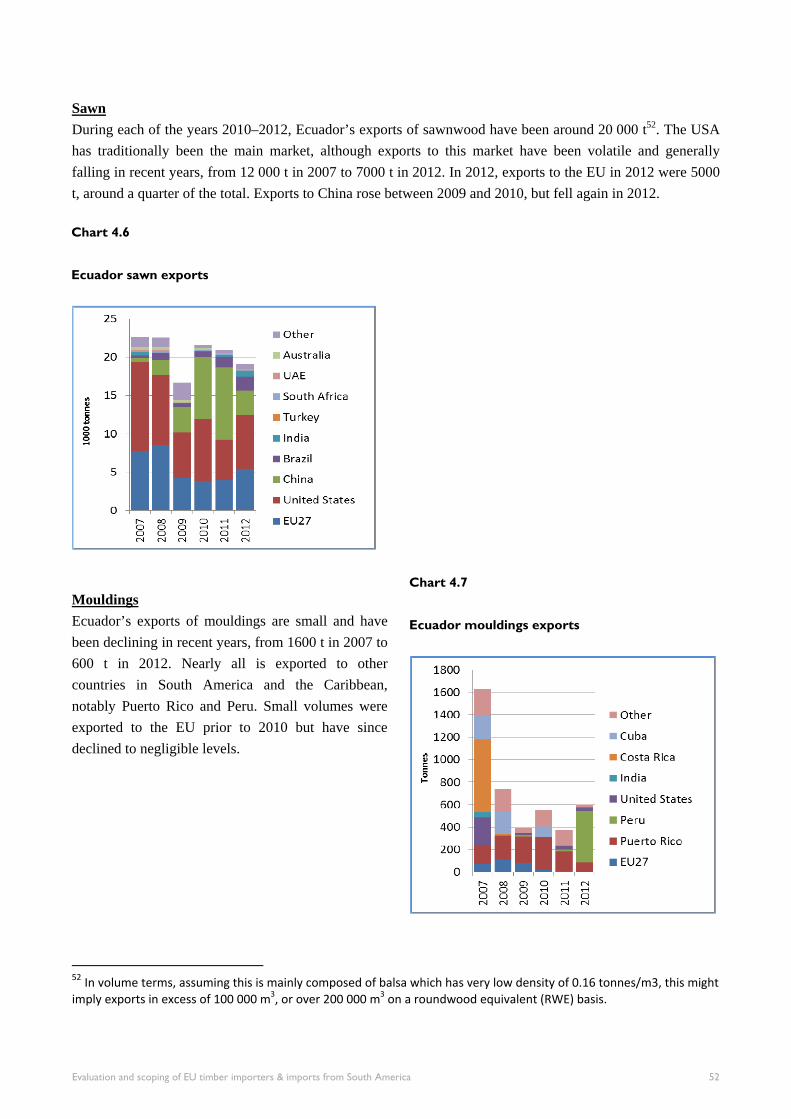
Sawn During each of the years 2010–2012, Ecuador’s exports of sawnwood have been around 20 000 t52. The USA has traditionally been the main market, although exports to this market have been volatile and generally falling in recent years, from 12 000 t in 2007 to 7000 t in 2012. In 2012, exports to the EU in 2012 were 5000 t, around a quarter of the total. Exports to China rose between 2009 and 2010, but fell again in 2012.
Mouldings Ecuador’s exports of mouldings are small and have been declining in recent years, from 1600 t in 2007 to 600 t in 2012. Nearly all is exported to other countries in South America and the Caribbean, notably Puerto Rico and Peru. Small volumes were exported to the EU prior to 2010 but have since declined to negligible levels. 52 In volume terms, assuming this is mainly composed of balsa which has very low density of 0.16 tonnes/m3, this might imply exports in excess of 100 000 m3, or over 200 000 m3 on a roundwood equivalent (RWE) basis.
Chart 4.6
Ecuador sawn exports
Chart 4.7
Ecuador mouldings exports
Evaluation and scoping of EU timber importers & imports from South America 52
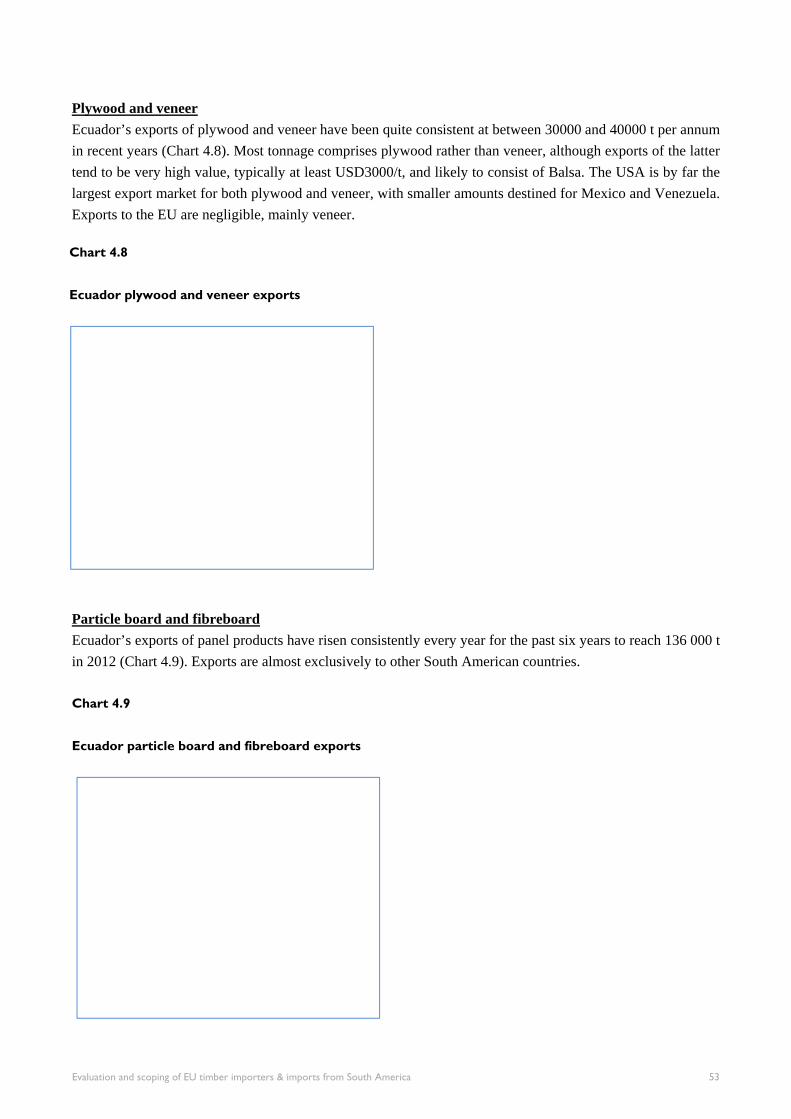
Plywood and veneer Ecuador’s exports of plywood and veneer have been quite consistent at between 30000 and 40000 t per annum in recent years (Chart 4.8). Most tonnage comprises plywood rather than veneer, although exports of the latter tend to be very high value, typically at least USD3000/t, and likely to consist of Balsa. The USA is by far the largest export market for both plywood and veneer, with smaller amounts destined for Mexico and Venezuela. Exports to the EU are negligible, mainly veneer.
Particle board and fibreboard Ecuador’s exports of panel products have risen consistently every year for the past six years to reach 136 000 t in 2012 (Chart 4.9). Exports are almost exclusively to other South American countries. Chart 4.9
Ecuador particle board and fibreboard exports
Chart 4.8
Ecuador plywood and veneer exports
Evaluation and scoping of EU timber importers & imports from South America 53
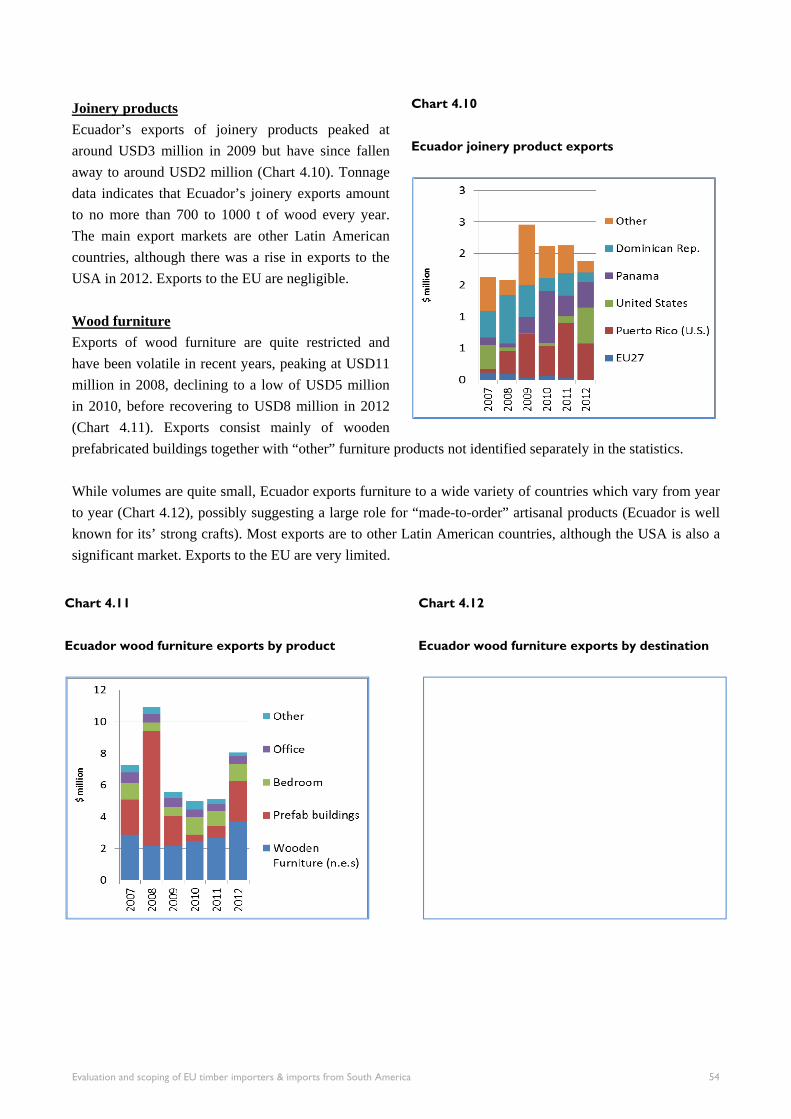
Joinery products Ecuador’s exports of joinery products peaked at around USD3 million in 2009 but have since fallen away to around USD2 million (Chart 4.10). Tonnage data indicates that Ecuador’s joinery exports amount to no more than 700 to 1000 t of wood every year. The main export markets are other Latin American countries, although there was a rise in exports to the USA in 2012. Exports to the EU are negligible. Wood furniture Exports of wood furniture are quite restricted and have been volatile in recent years, peaking at USD11 million in 2008, declining to a low of USD5 million in 2010, before recovering to USD8 million in 2012 (Chart 4.11). Exports consist mainly of wooden prefabricated buildings together with “other” furniture products not identified separately in the statistics. While volumes are quite small, Ecuador exports furniture to a wide variety of countries which vary from year to year (Chart 4.12), possibly suggesting a large role for “made-to-order” artisanal products (Ecuador is well known for its’ strong crafts). Most exports are to other Latin American countries, although the USA is also a significant market. Exports to the EU are very limited.
Chart 4.10
Ecuador joinery product exports
Chart 4.11
Ecuador wood furniture exports by product
Chart 4.12
Ecuador wood furniture exports by destination
Evaluation and scoping of EU timber importers & imports from South America 54
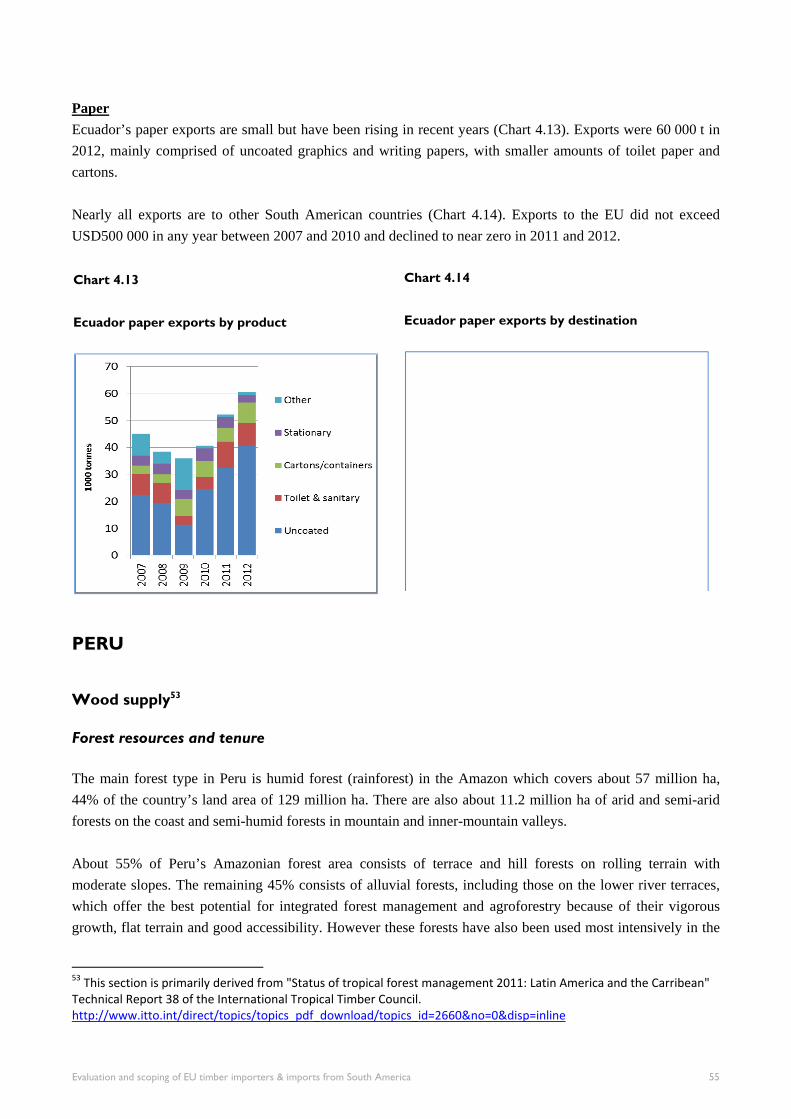
Paper Ecuador’s paper exports are small but have been rising in recent years (Chart 4.13). Exports were 60 000 t in 2012, mainly comprised of uncoated graphics and writing papers, with smaller amounts of toilet paper and cartons. Nearly all exports are to other South American countries (Chart 4.14). Exports to the EU did not exceed USD500 000 in any year between 2007 and 2010 and declined to near zero in 2011 and 2012.
Chart 4.14
Ecuador paper exports by destination
PERU
Wood supply53 Forest resources and tenure
The main forest type in Peru is humid forest (rainforest) in the Amazon which covers about 57 million ha, 44% of the country’s land area of 129 million ha. There are also about 11.2 million ha of arid and semi-arid forests on the coast and semi-humid forests in mountain and inner-mountain valleys. About 55% of Peru’s Amazonian forest area consists of terrace and hill forests on rolling terrain with moderate slopes. The remaining 45% consists of alluvial forests, including those on the lower river terraces, which offer the best potential for integrated forest management and agroforestry because of their vigorous growth, flat terrain and good accessibility. However these forests have also been used most intensively in the
53 This section is primarily derived from "Status of tropical forest management 2011: Latin America and the Carribean" Technical Report 38 of the International Tropical Timber Council. http://www.itto.int/direct/topics/topics_pdf_download/topics_id=2660&no=0&disp=inline
Chart 4.13
Ecuador paper exports by product
Evaluation and scoping of EU timber importers & imports from South America 55
past, leaving large expanses of secondary forest (purma) dominated by stands of fast-growing, light-demanding pioneer species. According to FAO, annual deforestation in Peru during the period 2000 to 2010 was 94 000 ha (0.1%), a significant decline from an annual deforestation rate of 269 000 (0.4%) in the previous decade. About one-third of the forest estate is degraded or secondary. Quoting the Peruvian government, ITTO identify direct causes of deforestation as: infra-structure development (particularly highways and new and expanding settlements in the Amazon Basin); the expansion of cash crops, shifting cultivation and illicit coca farms; mining, oil exploitation and hydro-electric schemes; as well as illegal logging. Indirect causes include migration to the Amazon region; agricultural policies favouring cash-crop development; development policies that favour energy generation; and new investment opportunities due to globalization. According to ITTO, the national and provincial governments hold tenure over around 54.5 million ha of Peruvian forests. Of the remaining forest area, local government (e.g. municipalities, villages) hold tenure over 2.9 million ha, and communities and indigenous groups hold tenure over 13.2 million ha. Only 1.95 million ha is in private ownership. Tenure over a significant proportion of the Peruvian forest resource is still disputed. The Forest People’s Programme, an NGO, claims that: “over a third of [Peru’s] 69 million ha of forest are traditionally occupied and used by Amazonian indigenous peoples …who seek the full legal recognition of their possession of these lands.”54 FPP claim that “an estimated 20 million ha of indigenous territories remain unrecognised”. Plantations
According to ITTO, the total planted forest is 820 000 ha, nearly 600 000 ha of which are for timber and fuelwood production and the remainder are for protection. Most plantations are located outside the Amazon in the Andes and the main species being planted are Eucalyptus globulus, Polylepis spp. and Alnus acuminata. Many of these plantations are on poor soils and have had only limited success. Forest regulation
According to ITTO, under the 2000 Forest Law, the forest is classified into various categories including: permanent production forests; protection forests; forests for future use (forest plantations, secondary forests and degraded forests for restoration); natural protected areas; forests in indigenous and rural communities; and local forests. Permanent production forests are intended to combine conservation functions with timber and non-timber production and an approved forest management plan is required. The national forest strategy prepared in 2002 was officially adopted by the Peruvian Government in August 2004 (in Decreto Supremo 031-2004-AG). It is implemented through the Forestry and Wildlife Law (Ley Forestal y de Fauna Silvestre – Ley 27308), which was adopted in 2000. The law prescribes several options 54 The reality of REDD+ in Peru: Between theory and practice ‐ Indigenous Amazonian Peoples’ analyses and alternatives. Forest Peoples Programme. November 2011. http://www.forestpeoples.org/sites/fpp/files/publication/2011/11/reality‐redd‐peru‐between‐theory‐and‐practice‐website_0.pdf
Evaluation and scoping of EU timber importers & imports from South America 56
for SFM and reforestation, including 40-year concessions for commercial timber, Non-Timber Forest Products (NTFPs), ecotourism and environmental services (Article 10); the sustainable management of forests belonging to indigenous communities (Article 12); the sustainable management of local forests by local governments and rural populations (Decree 014/2001); and the establishment of 40-year reforestation concessions. Following escalating indigenous protests concerning management of the Peruvian forests and their land tenure and use rights during the period 2006 to 2009, the Government eventually convened a National Coordination Group for the Development of the Amazonian Peoples (the National Group). This brought together different sectors of the government and the two most important indigenous organizations, AIDESEP and CONAP, to address all aspects of development. This led in turn to the government committing to a more participatory national consultative process for drafting a new forest law. The Forestry Law Platform was created for this process involving representatives of civil society, indigenous organizations, scientists, and professional organizations. The new Forests and Wildlife Law (Law 29763) was approved in July 2011 and was originally due to come into force before July 2012 with the publication of implementing regulations. However this process has been delayed. In August 2013, the Ministry of Agriculture and Irrigation (MINAGRI) announced that the law will apply from the second quarter of 2014 following further consultation on the draft regulations. Although account was taken of the consultations of the National Group and Forestry Law Platform, different opinions exist regarding the extent to which their recommendations were actually incorporated into the new Law 29763. A central component of the new law is to implement the National System of Forest and Wildlife Management (SINAFOR). This System is meant to integrate all the various ministries, entities and public institutions at national, regional and local scales that play a role in management, including local and regional governments as well as the management committees of various forests. The new law is substantively similar to the previous law with respect to the leasing, functioning, obligations and oversight of logging concessions. However the law also emphasizes issues relating to the governance of forest resources and Sustainable Forest Management (SFM) and particularly refers to participatory forest management and the need to apply the principle of free, prior and informed consent to the management and conservation of forest resources. Through introduction of SINAFOR, the Government intends to rationalize the rapid and chaotic process of restructuring that has been on-going in Peru’s forest regulatory regime since 2006. Between 2000 and 2006, forest regulation was centrally controlled by the National Institute of Natural Resources (INRENA). However in 2006 and 2007, many of INRENA’s powers were formally transferred to the regional governments as part of a larger process of decentralization in Peru. In 2008, INRENA was eliminated altogether, and what remained of its resources and functions at the central level was consolidated into the General Directorate of Forests and Wildlife (Direccion General de Flora y Fauna Silvestre – DGFFS) within the Ministry of Agriculture. Since 2009, DGFFS has gradually transferred authority for granting of forest permits and concessions as well as enforcement actions to the regional governments.
Evaluation and scoping of EU timber importers & imports from South America 57
Meanwhile, the Government also created in 2008 the Agency for the Supervision of Forest Resources and Wildlife (Organismo Supervisor de Recursos Forestales y del Fauna Silvestre – OSINFOR) under the Presidency of the Council of Ministers (Presidencia del Concejo de Ministros). OSINFOR’s critical role is to conduct “supervisions”, field visits by officers charged with inspecting the forestry practices of concessionaires, private landowners or communities to see whether they comply with their own annual operating plans (POAs) as well as regional or national regulations. If OSINFOR finds infractions, it has the authority to suspend activity in the concession or community while the forest authority conducts further investigation. OSINFOR, too, has undergone a process of decentralization to the regions over the last few years. The 2011 Forests and Wildlife Law mandates the establishment of another new agency, the National Forest and Wildlife Service (Servicio Nacional Forestal y de Fauna Silvestre – SERFOR) under the Ministry of Agriculture. This agency is intended to act as the national forest authority with primary responsibility for implementation of SINAFOR. The DGFFS will eventually be absorbed into SERFOR’s structure. A key part of SERFOR’s role will be to regulate all forest products intended for export. The 2011 Forests and Wildlife Law states that the export of logs for commercial purposes is prohibited, except for logs cut from forest plantations managed under concession agreements. The law also requires that transportation of all forest products is regulated through transport guide documents (guías de transporte). These are legal documents that will only be given to the title-holder of a SERFOR approved forest authorization certificate. SERFOR will inspect forest products intended for transport, and their transportation will be entered into a national registry. Forest production
According to ITTO, as of 2010, 33.3 million ha of permanent production forests had been classified within the PFE. However, only a small proportion of this had been officially allocated for production purposes. At that time, 588 forest concessions had been registered in the Huánuco, Loreto, Madre de Dios, San Martín and Ucayali regions of Peru over a total area of 7.56 million ha. Of the 588 concessions, 500 had approved and valid contracts with government at the start of 2010. At only 12 900 ha, the average area per concession is small relative to many other tropical producing countries. Furthermore, many are in formerly selectively harvested areas such as the flood zone along Amazonian tributaries and constitute what in some areas will be the third intervention within the last 30–40 years. Since many primary species are no longer present in large volumes, the concessions are increasingly harvesting only lesser-known species. In September 2013, the chairman of Peru’s Wood and Timber Industry association ADEX said that fewer than 80 concessions with an area of only 2 million ha are currently being utilized55. He suggested that current production is well below potential. Nevertheless ITTO reports that industrial roundwood production in Peru reached 1.8 million m3 in 2012, a sharp rise from 1.5 million in 2011 and 1.4 million m3 in 2010.
55 ITTO Market News Service, Report 1‐14 September 2013.
Evaluation and scoping of EU timber importers & imports from South America 58
In September 2013 there were around 550 000 ha of FSC certified forests in Peru distributed between eight companies and two forest communities. All certificates are held by Peruvian operators with the exception of the US multinational Bozovich that exploits a 50 000 ha concession of natural tropical forest56. According to ITTO, most industrial roundwood harvested in Peru is used for sawnwood production which reached 853 000 m3 in 2012, up from 710 000 m3 the previous year and 630 000 m3 in 2010. There are about 250 sawmills in Peru, most of which have a small installed capacity (averaging 2900 m3 per year). Only about 25% of sawmills have band-saws and a capacity of 10 000 m3 per year or more. Nearly all production is recorded by ITTO as tropical hardwood, although a significant proportion is assumed to consist of eucalypt from plantations in the Andean region of Peru where it is widely used in local construction. ITTO note that at least 100 species are used for timber in Peru, but about 25 meet 80% of the demand. In the past, the most important timber species harvested in the Peruvian Amazon was Big-leaf Mahogany or Caoba Swietenia macrophylla. While still an important species, Big-leaf Mahogany is no longer in the top ten harvested species by volume. However, the falsification of information concerning the illegal cutting of Big-leaf Mahogany and other illegal practices continues to be reported57. Peru and Bolivia are the world’s largest exporters of Big-leaf Mahogany. ITTO ranked the five most commonly harvested species in Peru (according to average sawnwood production for the period 1991–2008) as:
Eucalyptus globulus (eucalipto) 258 000 m3 from planted forests in Andean valleys. Virola spp. (cumala) 218 000 m3; from low-lying and low hill Amazon forests. Cedrelinga catenaeformis (tornillo) 173 300 m3 from low hill Amazon forests. Chorisia intregrifolia (lupuna) 147 100 m3 from terrace and low hill Amazon forests. Cedrela odorata (cedro), 127 000 m3 from inundated and low hill Amazon forests.
In Peru’s domestic market, Guazuma spp (bolaina) and Calycophyllum spruceanum (capirona) are the most traded species. Other important species include Amburana cearensis (ishipingo), Dipteryx micrantha (shihuahuaco), Hura crepitans (catahua) and Cariniana decandra (cachimbo). According to UN FAO data, Peru has no domestic pulp manufacturing capacity, either wood pulp or based on recycled paper. However Peru imports around 100 000 t of pulp a year, mainly from Chile and the USA, from which it manufactures paper, some of which is exported. According to FAO, Peru’s paper production capacity was 99 000 t in 2010 and forecast to rise to 113 000 t by 2014. Trade overview58
Between 2007 and 2012, Peru export timber and paper products with a total value of between USD250 million USD325 per annum (Chart 5.1). Exports of solid timber products were declining during this period, from 56 ITTO Market News Service, Report 1‐14 September 2013 57 For example, see National Geographic, April 2013, “Mahogany’s last stand” at http://ngm.nationalgeographic.com/2013/04/mahogany/wallace‐text. See also report “The Laundering Machine”, Environmental Investigation Agency (EIA), 2012. 58 Statistics in this section are derived from FII analysis of GTA data.
Evaluation and scoping of EU timber importers & imports from South America 59
USD208 million in 2007 to USD165 million in 2012. Solid timber exports are dominated by tropical sawn hardwood and mouldings together with small volumes of plywood. Since 1972 all exports of logs from natural forest have been banned, while exports of plantation logs have only been allowed if no final processing is required before use. Peru has never evolved an internationally competitive wood manufacturing sector and exports of value added products such as wood furniture have remained at low levels. However exports of paper products have been rising, from USD63 million in 2007 to USD111 million in 2012. In 2012, the value of total Peruvian exports of timber and paper were split roughly 50:50 between markets inside and outside South America (Chart 5.2). Chart 5.1
Peru value of exports of timber & paper by product
Chart 5.2
Peru value of exports of timber & paper by
destination
The largest markets for exports outside South America were China, Mexico, and the USA. Exports to China were rising rapidly before 2010, but then declined again in 2011 and 2012. Exports to Mexico and the USA declined sharply in 2009 during the financial crises and have recovered only slowly since then. Of other South American countries, the main export markets in 2012 were all immediate neighbours to Peru: Chile, Ecuador and Bolivia. Peruvian timber and paper products exports to the EU declined from USD11 million in 2007 to USD7 million in 2009 during the economic crises before rebounding to USD14 million. Exports to the EU consist almost exclusively of sawn hardwood and mouldings. Figures 5.1 and 5.2 graphically illustrate the contrast between Peru’s export trade in solid timber products and paper. The former are almost exclusively exported to countries outside South America, with China the leading market in 2012, followed by the USA and Mexico. Paper is exported primarily to other South American countries.
Evaluation and scoping of EU timber importers & imports from South America 60
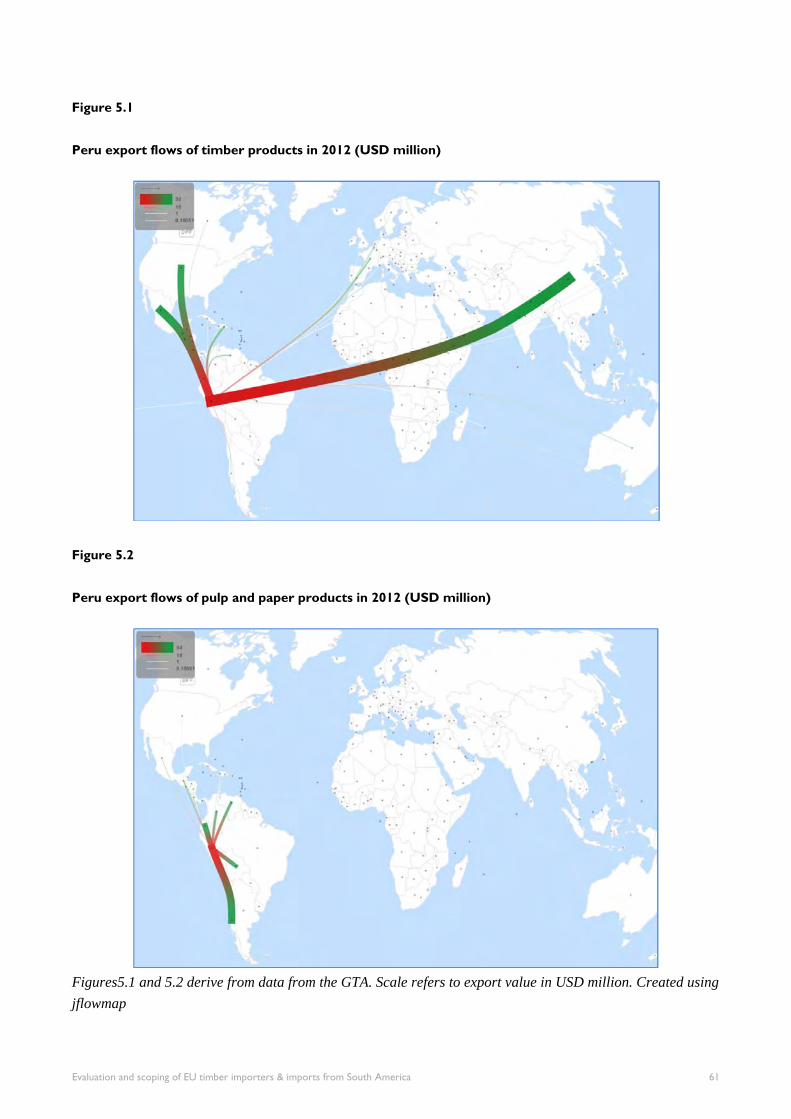
Figure 5.1
Peru export flows of timber products in 2012 (USD million)
Figure 5.2
Peru export flows of pulp and paper products in 2012 (USD million)
Figures5.1 and 5.2 derive from data from the GTA. Scale refers to export value in USD million. Created using
jflowmap
Evaluation and scoping of EU timber importers & imports from South America 61
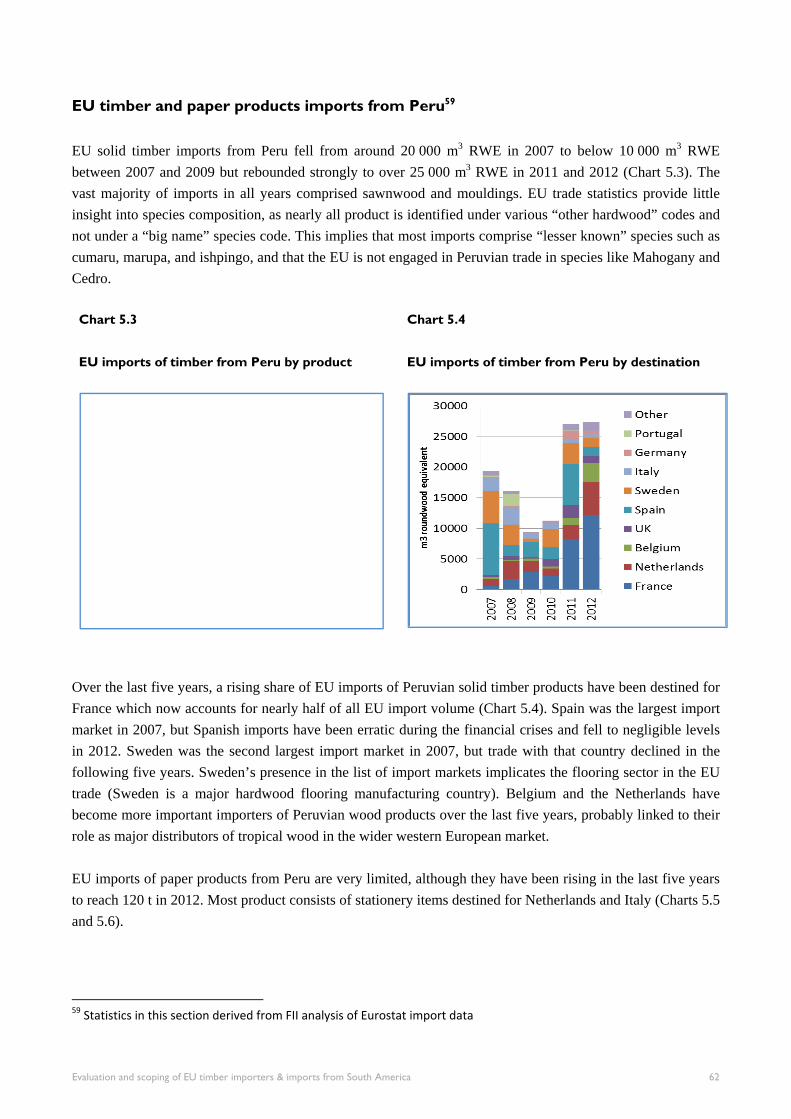
EU timber and paper products imports from Peru59
EU solid timber imports from Peru fell from around 20 000 m3 RWE in 2007 to below 10 000 m3 RWE between 2007 and 2009 but rebounded strongly to over 25 000 m3 RWE in 2011 and 2012 (Chart 5.3). The vast majority of imports in all years comprised sawnwood and mouldings. EU trade statistics provide little insight into species composition, as nearly all product is identified under various “other hardwood” codes and not under a “big name” species code. This implies that most imports comprise “lesser known” species such as cumaru, marupa, and ishpingo, and that the EU is not engaged in Peruvian trade in species like Mahogany and Cedro.
Over the last five years, a rising share of EU imports of Peruvian solid timber products have been destined for France which now accounts for nearly half of all EU import volume (Chart 5.4). Spain was the largest import market in 2007, but Spanish imports have been erratic during the financial crises and fell to negligible levels in 2012. Sweden was the second largest import market in 2007, but trade with that country declined in the following five years. Sweden’s presence in the list of import markets implicates the flooring sector in the EU trade (Sweden is a major hardwood flooring manufacturing country). Belgium and the Netherlands have become more important importers of Peruvian wood products over the last five years, probably linked to their role as major distributors of tropical wood in the wider western European market. EU imports of paper products from Peru are very limited, although they have been rising in the last five years to reach 120 t in 2012. Most product consists of stationery items destined for Netherlands and Italy (Charts 5.5 and 5.6).
59 Statistics in this section derived from FII analysis of Eurostat import data
Chart 5.3
EU imports of timber from Peru by product
Chart 5.4
EU imports of timber from Peru by destination
Evaluation and scoping of EU timber importers & imports from South America 62
Chart 5.6
EU imports of paper from Peru by destination
Peru timber and paper exports by product60
Sawn Peru’s exports of sawnwood, all hardwood, fell from 490 000 m3 in 2007 to 230 000 m3 in 2010, but then recovered slightly to 260 000 m3 in 2012. The downward trend was driven by declining demand during the financial crises in the USA and Mexico, by far the dominant markets prior to 2009, and by tightening availability of tropical hardwood in Peru. In 2009 China emerged as a more important market for Peruvian
sawn hardwood, importing around 60 000 m3 per year. Export data indicates that the EU is only a very small market for Peruvian sawnwood taking no more than 3000 to 4000 m3 per year61.
60 Statistics in this section are derived from FII analysis of GTA data 61 For unknown reasons, Peruvian export figures indicate slightly lower levels of trade in sawnwood with the EU than the EU import data
Chart 5.5
EU imports of paper from Peru by product
Chart 5.7
Peru sawn exports
Evaluation and scoping of EU timber importers & imports from South America 63
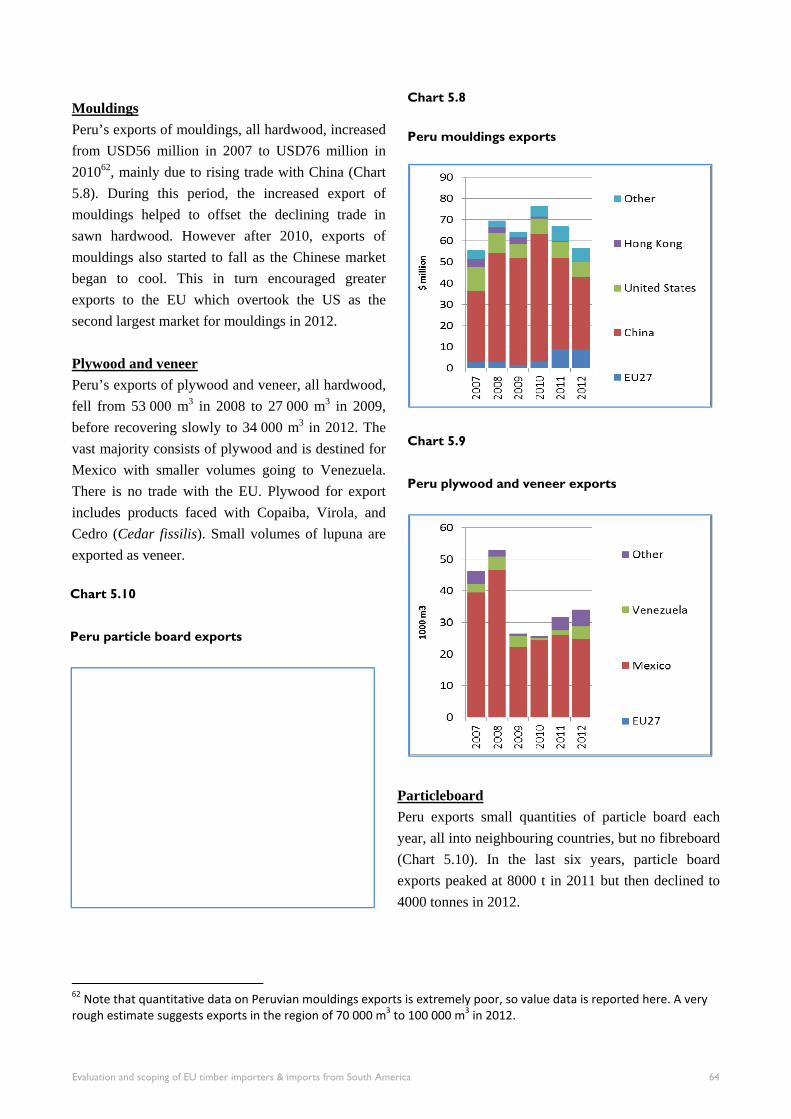
Mouldings Peru’s exports of mouldings, all hardwood, increased from USD56 million in 2007 to USD76 million in 201062, mainly due to rising trade with China (Chart 5.8). During this period, the increased export of mouldings helped to offset the declining trade in sawn hardwood. However after 2010, exports of mouldings also started to fall as the Chinese market began to cool. This in turn encouraged greater exports to the EU which overtook the US as the second largest market for mouldings in 2012. Plywood and veneer Peru’s exports of plywood and veneer, all hardwood, fell from 53 000 m3 in 2008 to 27 000 m3 in 2009, before recovering slowly to 34 000 m3 in 2012. The vast majority consists of plywood and is destined for Mexico with smaller volumes going to Venezuela. There is no trade with the EU. Plywood for export includes products faced with Copaiba, Virola, and Cedro (Cedar fissilis). Small volumes of lupuna are exported as veneer.
Particleboard Peru exports small quantities of particle board each year, all into neighbouring countries, but no fibreboard (Chart 5.10). In the last six years, particle board exports peaked at 8000 t in 2011 but then declined to 4000 tonnes in 2012.
62 Note that quantitative data on Peruvian mouldings exports is extremely poor, so value data is reported here. A very rough estimate suggests exports in the region of 70 000 m3 to 100 000 m3 in 2012.
Chart 5.8
Peru mouldings exports
Chart 5.9
Peru plywood and veneer exports
Chart 5.10
Peru particle board exports
Evaluation and scoping of EU timber importers & imports from South America 64
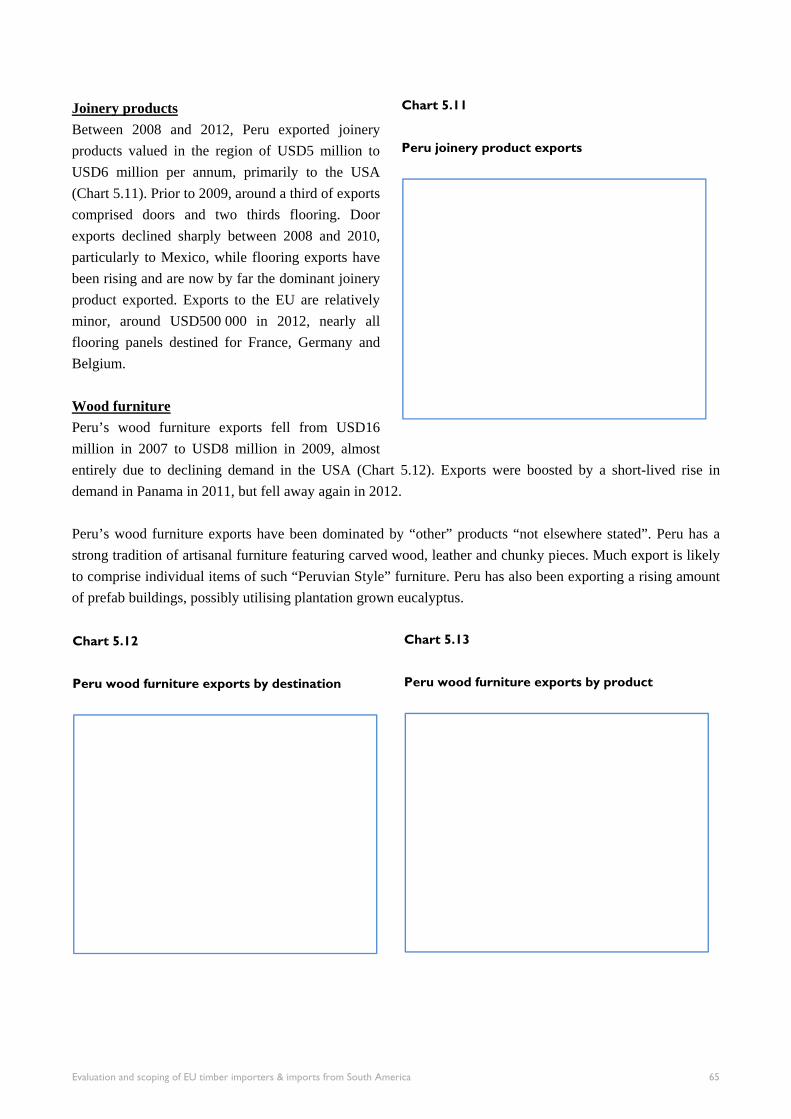
Joinery products Between 2008 and 2012, Peru exported joinery products valued in the region of USD5 million to USD6 million per annum, primarily to the USA (Chart 5.11). Prior to 2009, around a third of exports comprised doors and two thirds flooring. Door exports declined sharply between 2008 and 2010, particularly to Mexico, while flooring exports have been rising and are now by far the dominant joinery product exported. Exports to the EU are relatively minor, around USD500 000 in 2012, nearly all flooring panels destined for France, Germany and Belgium. Wood furniture Peru’s wood furniture exports fell from USD16 million in 2007 to USD8 million in 2009, almost entirely due to declining demand in the USA (Chart 5.12). Exports were boosted by a short-lived rise in demand in Panama in 2011, but fell away again in 2012. Peru’s wood furniture exports have been dominated by “other” products “not elsewhere stated”. Peru has a strong tradition of artisanal furniture featuring carved wood, leather and chunky pieces. Much export is likely to comprise individual items of such “Peruvian Style” furniture. Peru has also been exporting a rising amount of prefab buildings, possibly utilising plantation grown eucalyptus.
Chart 5.13
Peru wood furniture exports by product
Chart 5.11
Peru joinery product exports
Chart 5.12
Peru wood furniture exports by destination
Evaluation and scoping of EU timber importers & imports from South America 65
Paper Peru’s exports of paper products, manufactured using imported pulp, have been rising. Exports were 100 000 tonnes in 2012 (Chart 5.14). Chart 5.15
Peru pulp and paper exports by destination
Exports consist primarily of uncoated writing/graphic papers and toilet paper. All exports are destined for other South American countries (Chart 5.15). CONCLUSION
This report provides a baseline for timber and timber products trade, as defined under the EUTR, from Brazil, Colombia, Ecuador and Peru to the EU. Details are also provided on trade to the USA and Asia to provide context to EU trade. Of the four countries analysed, Brazil is the most important in terms of overall trade to the EU, though from all four countries international trade has decreased since 2007, though this if offset somewhat with increased trade of pulp products from Brazil. Regional trade of timber and timber products within South America remains high.
Chart 5.14
Peru pulp and paper exports by product
Evaluation and scoping of EU timber importers & imports from South America 66
TRAFFIC, the wildlife trade monitoring network, is the leading non-governmental organization working globally on trade in wild animals andplants in the context of both biodiversity conservation and sustainabledevelopment.
For further information contact:TRAFFIC International219a Huntingdon RoadCambridge CB3 0DLUKTelephone: (44) 1223 277427Fax: (44) 1223 277237Email: [email protected]: www.traffic.org
Dec
embe
r 20
13