Embed Size (px)
Citation preview
Brain maps, great and small: lessonsfrom comparative studies of primate
visual cortical organizationMarcello G. P. Rosa1,* and Rowan Tweedale2
1Department of Physiology, Monash University Centre for Brain and Behaviour, Monash University,Clayton, VIC 3800, Australia
2Queensland Brain Institute, The University of Queensland, QLD 4072, Australia
In this paper, we review evidence from comparative studies of primate cortical organization,highlighting recent findings and hypotheses that may help us to understand the rules governingevolutionary changes of the cortical map and the process of formation of areas during development.We argue that clear unequivocal views of cortical areas and their homologies are more likely to emergefor ‘core’ fields, including the primary sensory areas, which are specified early in development byprecise molecular identification steps. In primates, the middle temporal area is probably one of theseprimordial cortical fields. Areas that form at progressively later stages of development correspond toprogressively more recent evolutionary events, their development being less firmly anchored inmolecular specification. The certainty with which areal boundaries can be delimited, and likelyhomologies can be assigned, becomes increasingly blurred in parallel with this evolutionary/develop-mental sequence. For example, while current concepts for the definition of cortical areas have beenvindicated in allowing a clarification of the organization of the New World monkey ‘third tier’ visualcortex (the third and dorsomedial areas, V3 and DM), our analyses suggest that more flexiblemapping criteria may be needed to unravel the organization of higher-order visual association andpolysensory areas.
Keywords: visual cortex; evolution; development; visuotopic organization; architecture; marmoset
1. INTRODUCTIONIn 1886 a young Australian, Alfred Walter Campbell,moved to Great Britain to pursue a medical education.Following a degree from The University of Edinburgh,postgraduate experience in London, Vienna andPrague, and a subsequent doctorate in Medicine,Campbell took up a position as resident doctor andneuropathologist at the Rainhill Asylum near Liver-pool. There he worked for the next 13 years, duringwhich time he completed several highly influentialstudies investigating correlations between neurologicallesions and histological observations (for review, seeEadie 2003). Campbell’s principal contribution, His-tological studies on the localisation of cerebral function waspublished in 1905, the same year in which he returnedto Australia to become the country’s first full-timeneurology specialist. This study, the centenary of whichis celebrated by the present volume, was ‘.preparedfor publication in the Philosophical Transactions, butthe manuscript, when laid before the Council, wasadjudged of inordinate length.’ (Campbell 1905).Having gone through recent similar experiences withcertain of our own journal submissions, we find ameasure of solace in this fact. Fortunately for Campbell
and for following generations of neuroscientists,The Royal Society had the insight of offering a specialgrant to enable the publication of his study as a book, inrecognition of its perceived importance and quality.Campbell’s monography was published approximatelyat the same time as Brodmann’s most famous papers inthe Journal fur Psychologie und Neurologie (Brodmann1903a,b, 1905a,b, 1906, 1908a,b), and only slightlypredated Brodmann’s own magnum opus (Brodmann1909). While Brodmann’s scheme of nomenclature,which recognized a larger number of cortical areas,became the more commonly used over the subsequent100 years, Campbell’s more conservative approach(proposing fewer areas, while recognizing that some ofthose changed gradually in character across the surfaceof the brain) resulted in what remains an essentiallyaccurate description of the main cortical subdivisionsand their topographic distribution, even by today’sstandards (see also Von Bonin 1970).
The present paper has been built around threeprincipal concepts, all of which were already reflectedin both Campbell’s and Brodmann’s works. First, weargue that one is unlikely to attain a complete under-standing of the human cortex without a detailedknowledge of the organization of animal brains. Bothinvestigators invested substantial time and effort instudying mammals of different orders, with theobjective of determining shared and derived featuresof cortical organization, and hence understanding therules governing brain evolution.
Phil. Trans. R. Soc. B (2005) 360, 665–691
doi:10.1098/rstb.2005.1626
Published online 29 April 2005
One contribution of 12 to a Theme Issue ‘Cerebral cartography1905–2005’.
*Author for correspondence ([email protected]).
665 q 2005 The Royal Society
on October 23, 2012rstb.royalsocietypublishing.orgDownloaded from
Second, we propose that a full understanding ofthe organization and function of the adult cerebralcortex can be achieved only through a knowledge ofbrain development. In this respect, Campbell wasparticularly influenced by the developmental studiesof cortical myelogenesis conducted by Flechsig (forreview, see Flechsig 1920), which in his opinionprovided important clues for the parsing of primaryfrom higher-order sensory areas. Brodmann wentfurther in recognizing this principle, by conductinghis own investigations on the genesis of the histologi-cal differences between cortical areas; these provideda sound scientific rationale for his proposal of sixprincipal layers in the neocortex, which are modifiedat later stages of development to produce the varietyof laminar organizations seen in adults (Brodmann1909).
Third, we suggest that cortical areas show genuinevariations in their degree of definition, and that thesevariations are linked to their evolutionary and develop-mental histories. A degree of uncertainty was explicitlyacknowledged by both of the authors we now celebrate,in particular with regards to their definition of areasforming the large association fields of the primatetemporal, parietal and frontal lobes. Unlike the primarysensorimotor fields, these were reported as havingsomewhat indistinct borders, such that they changedgradually in character or blended with their neighbourswithout sharp limits. Whereas this uncertainty hastraditionally been seen as the result of technicallimitations, we argue that this is not necessarily thecase.
Here, we will examine the results of our owninvestigations, primarily those based on the visualcortex of New World monkeys, in the context of these
ideas. Simian primates belong to two superfamilies,Platyrrhini (or New World monkeys, which include thesquirrel, owl, marmoset and capuchin monkeys) andCatarrhini (including Old World ‘monkeys’, such asmacaques, apes and humans). Studies of New Worldmonkeys offer unique views of aspects of brainorganization, which help to illuminate the generalrules governing the development and evolution of theprimate cerebral cortex. For example, as noted byBrodmann, the lissencephalic nature of the brain inmany of the smaller species of New World monkeysresults in particular advantages for the cortical inves-tigator, facilitating experiments that would otherwisebe difficult or impossible, and simplifying the analysisof histological material.1 Knowledge about the corticalorganization of New World monkeys is thereforeimportant in allowing informed interpretation of themanner in which scientific data obtained in differentanimal models impact on our understanding ofthe human brain. This requires information about therelative importance of factors such as brain size, habitsand phylogenetic history in determining systematicdifferences in cortical organization, particularly amongspecies within the same taxon (e.g. Huffman et al.1999).
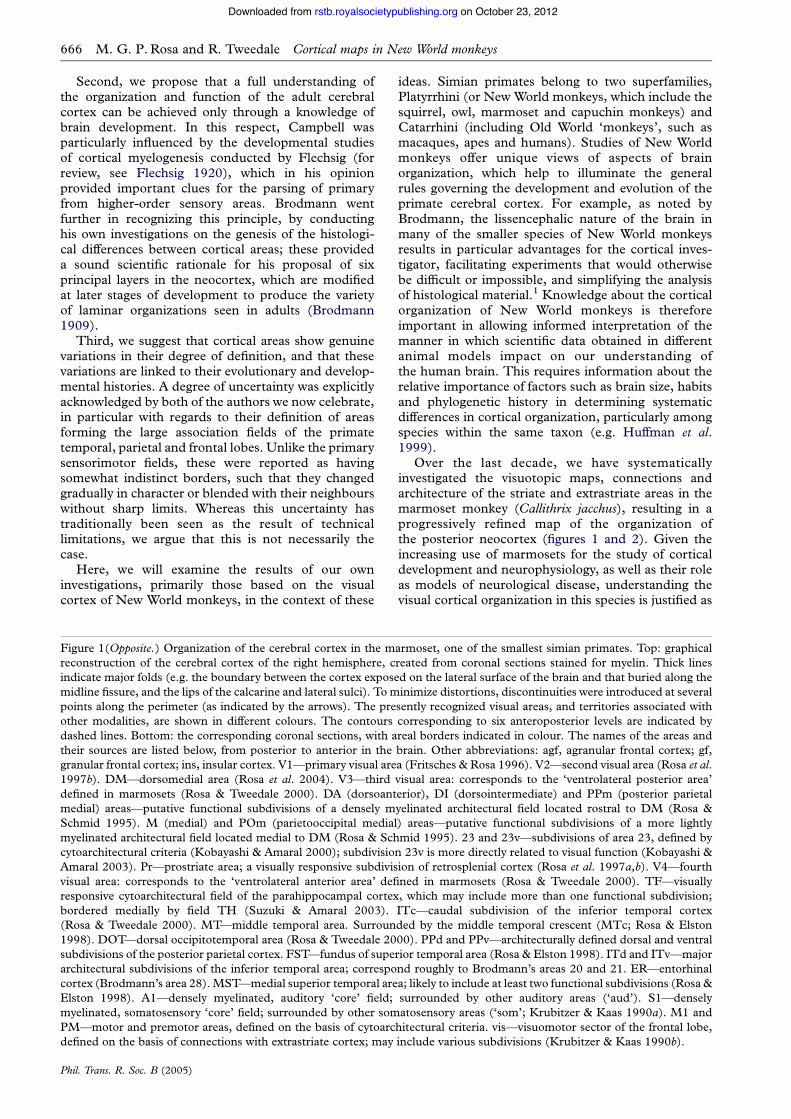
Over the last decade, we have systematicallyinvestigated the visuotopic maps, connections andarchitecture of the striate and extrastriate areas in themarmoset monkey (Callithrix jacchus), resulting in aprogressively refined map of the organization ofthe posterior neocortex (figures 1 and 2). Given theincreasing use of marmosets for the study of corticaldevelopment and neurophysiology, as well as their roleas models of neurological disease, understanding thevisual cortical organization in this species is justified as
Figure 1(Opposite.) Organization of the cerebral cortex in the marmoset, one of the smallest simian primates. Top: graphicalreconstruction of the cerebral cortex of the right hemisphere, created from coronal sections stained for myelin. Thick linesindicate major folds (e.g. the boundary between the cortex exposed on the lateral surface of the brain and that buried along themidline fissure, and the lips of the calcarine and lateral sulci). To minimize distortions, discontinuities were introduced at severalpoints along the perimeter (as indicated by the arrows). The presently recognized visual areas, and territories associated withother modalities, are shown in different colours. The contours corresponding to six anteroposterior levels are indicated bydashed lines. Bottom: the corresponding coronal sections, with areal borders indicated in colour. The names of the areas andtheir sources are listed below, from posterior to anterior in the brain. Other abbreviations: agf, agranular frontal cortex; gf,granular frontal cortex; ins, insular cortex. V1—primary visual area (Fritsches & Rosa 1996). V2—second visual area (Rosa et al.1997b). DM—dorsomedial area (Rosa et al. 2004). V3—third visual area: corresponds to the ‘ventrolateral posterior area’defined in marmosets (Rosa & Tweedale 2000). DA (dorsoanterior), DI (dorsointermediate) and PPm (posterior parietalmedial) areas—putative functional subdivisions of a densely myelinated architectural field located rostral to DM (Rosa &Schmid 1995). M (medial) and POm (parietooccipital medial) areas—putative functional subdivisions of a more lightlymyelinated architectural field located medial to DM (Rosa & Schmid 1995). 23 and 23v—subdivisions of area 23, defined bycytoarchitectural criteria (Kobayashi & Amaral 2000); subdivision 23v is more directly related to visual function (Kobayashi &Amaral 2003). Pr—prostriate area; a visually responsive subdivision of retrosplenial cortex (Rosa et al. 1997a,b). V4—fourthvisual area: corresponds to the ‘ventrolateral anterior area’ defined in marmosets (Rosa & Tweedale 2000). TF—visuallyresponsive cytoarchitectural field of the parahippocampal cortex, which may include more than one functional subdivision;bordered medially by field TH (Suzuki & Amaral 2003). ITc—caudal subdivision of the inferior temporal cortex(Rosa & Tweedale 2000). MT—middle temporal area. Surrounded by the middle temporal crescent (MTc; Rosa & Elston1998). DOT—dorsal occipitotemporal area (Rosa & Tweedale 2000). PPd and PPv—architecturally defined dorsal and ventralsubdivisions of the posterior parietal cortex. FST—fundus of superior temporal area (Rosa & Elston 1998). ITd and ITv—majorarchitectural subdivisions of the inferior temporal area; correspond roughly to Brodmann’s areas 20 and 21. ER—entorhinalcortex (Brodmann’s area 28).MST—medial superior temporal area; likely to include at least two functional subdivisions (Rosa &Elston 1998). A1—densely myelinated, auditory ‘core’ field; surrounded by other auditory areas (‘aud’). S1—denselymyelinated, somatosensory ‘core’ field; surrounded by other somatosensory areas (‘som’; Krubitzer & Kaas 1990a). M1 andPM—motor and premotor areas, defined on the basis of cytoarchitectural criteria. vis—visuomotor sector of the frontal lobe,defined on the basis of connections with extrastriate cortex; may include various subdivisions (Krubitzer & Kaas 1990b).
666 M. G. P. Rosa and R. Tweedale Cortical maps in New World monkeys
Phil. Trans. R. Soc. B (2005)
on October 23, 2012rstb.royalsocietypublishing.orgDownloaded from
a potential reference atlas for investigators working indifferent fields. More interesting, however, for thepurpose of the present review, is the fact thatmarmosets are among the smallest living monkeys,and in this way provide an important means ofcomparison for understanding the evolutionary effectsof massive changes in brain size among primates. Putsimply, comparing the marmoset’s 8 g brain withthe 80 g brain of the macaque may help to illuminatethe types of differences to be expected between thebrains of monkeys and humans (more than 1000 g), aswell as the likely developmental mechanisms andevolutionary events responsible for these differencesacross primates in general. We have recently discussedthe evidence for the various areas and the types of
visuotopic maps therein (Rosa 1997, 2002; Rosa &Tweedale 2004); the reader is directed to thesereferences for additional detail. The present reviewwill concentrate on a few cortical areas, whichilluminate concepts of the organization of extrastriatecortex emerging from our comparative studies.
2. STUDYING THE EVOLUTION OF ‘PRIMATE’BRAINSNeuroscience is firmly based on the study of a few‘model species’, which have been largely determinedby the choices made by pioneer investigators. Whilegood optics and frontalized eyes have certainly beenimportant elements in studies of the primate visual
Figure 1. (Caption opposite.)
Cortical maps in New World monkeys M. G. P. Rosa and R. Tweedale 667
Phil. Trans. R. Soc. B (2005)
on October 23, 2012rstb.royalsocietypublishing.orgDownloaded from
system, these early choices were often determined bymore practical factors, including a prior tradition ofuse in other types of physiological experiments(meaning well-tested preparations and drugregimes), the existence of good neuroanatomicalinformation, size, and last, but certainly not least,availability. It is in no small measure owing to suchhistorical contingencies that present-day references tothe ‘monkey’ or ‘primate’ cortex are normally under-stood to refer to Old World monkeys, typicallythe rhesus (Macaca mulatta) or long-tailed (Macacafascicularis) macaque species. In contrast with otherspecies, macaques were readily available to investi-gators on both sides of the Atlantic at the time whenthe foundations of our current understanding of
visual cortical processing were established. Moreover,they quickly proved suitable for studies of the anatomy(Kuypers et al. 1965; Zeki 1969) and physiology(Daniel & Whitteridge 1961; Hubel & Wiesel 1968;Dubner & Zeki 1971) of both striate andextrastriate areas.2
Good choices by pioneers in a given field tendto perpetuate, as similar practical constraints applyto most laboratories exploring the same or relatedquestions. With time, the sheer mass of prior literatureon a given species tends to become the key issue, asresearchers will naturally prefer to build upon a solidfoundation of knowledge, rather than retrace the basicsteps and controls that are needed when investigating anew animal model. Today, most of our knowledge
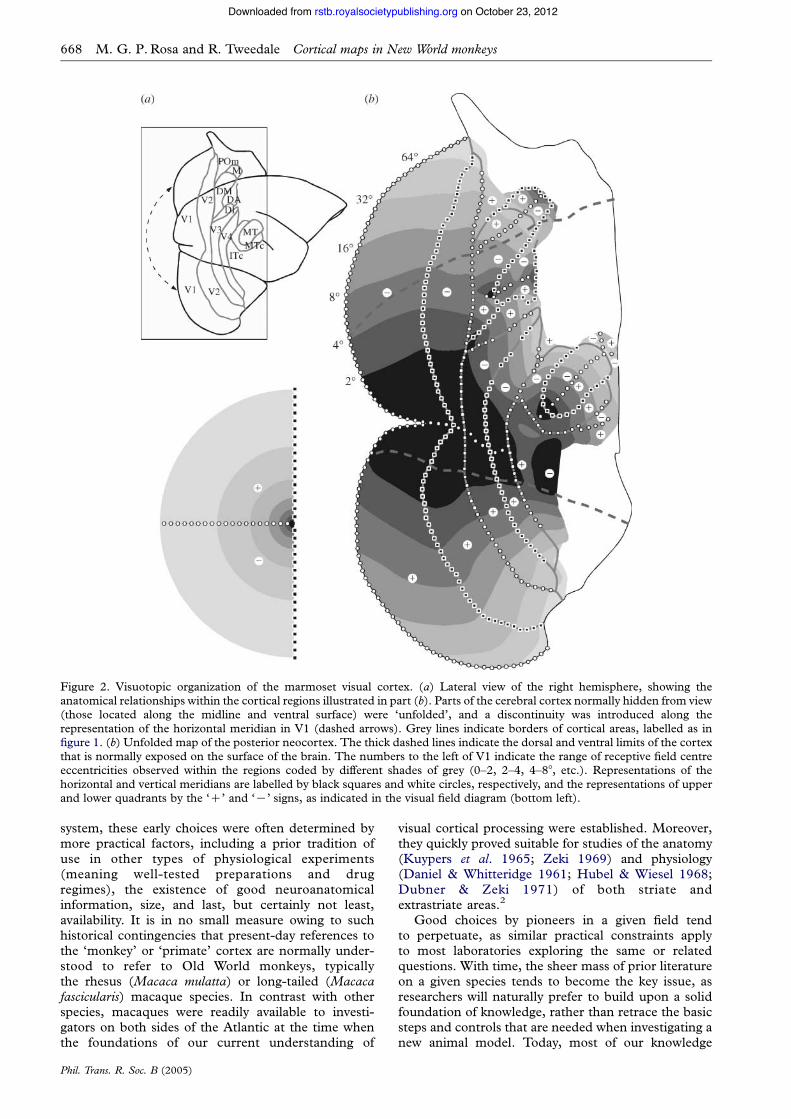
Figure 2. Visuotopic organization of the marmoset visual cortex. (a) Lateral view of the right hemisphere, showing theanatomical relationships within the cortical regions illustrated in part (b). Parts of the cerebral cortex normally hidden from view(those located along the midline and ventral surface) were ‘unfolded’, and a discontinuity was introduced along therepresentation of the horizontal meridian in V1 (dashed arrows). Grey lines indicate borders of cortical areas, labelled as infigure 1. (b) Unfolded map of the posterior neocortex. The thick dashed lines indicate the dorsal and ventral limits of the cortexthat is normally exposed on the surface of the brain. The numbers to the left of V1 indicate the range of receptive field centreeccentricities observed within the regions coded by different shades of grey (0–2, 2–4, 4–88, etc.). Representations of thehorizontal and vertical meridians are labelled by black squares and white circles, respectively, and the representations of upperand lower quadrants by the ‘C’ and ‘K’ signs, as indicated in the visual field diagram (bottom left).
668 M. G. P. Rosa and R. Tweedale Cortical maps in New World monkeys
Phil. Trans. R. Soc. B (2005)
on October 23, 2012rstb.royalsocietypublishing.orgDownloaded from
regarding the primate brain has been realized in studiesusingmacaques, and this genus remains a touchstone ofmodern systems neuroscience. Yet it is important torecognize that the study of a single species or genuscannot alone unravel basic rules governing the anatomy,physiology and development of the primate brain ingeneral, or the human brain in particular. Heuristicmistakes commonly found in the scientific literatureinclude the uncritical extrapolation of observationsmade only in macaques as directly applicable tothe human brain, and the justification of the choiceof the macaque for a given study owing to its being‘closer to human’ in terms of brain organization. Suchstatements need to be carefully qualified.While it is truethat the macaque brain offers an excellent guide to theanatomy and physiology of the human brain, cleardifferences in the size, location, visuotopic organizationand even cellular structure of visual areas have also beendocumented (Preuss et al. 1999; Van Essen et al. 2001;Tootell et al. 2003; Preuss 2004).More importantly, andalso more interestingly in terms of illuminating aspectsof cortical development and evolution, these differencesappear to be localized to specific cortical regions, ratherthan reflecting a uniform expansion of the sameunderlying cortical organization (see below). At thesame time, the correct assertion that Old Worldmonkeys such as the macaque are more closely relatedto humans than New World monkeys needs to betempered by an appreciation of the evolutionarydistances involved. Current minimum estimates placethe divergence between the lineages leading to present-day New World and Old World simians (the latterincluding humans) at around 35 Myr, while thedivergence betweenOldWorldmonkeys and hominoidsis placed at 25 Myr (Glazko & Nei 2003; Schrago &Russo 2003). Thus, present-day New World and OldWorld monkeys have both developed independentlyfrom the human lineage for much of their evolutionaryhistory. If one proposes that the organization of theNewWorld monkey brain is less representative of the type ofinformation needed to understand the human brainbecause of an additional 10 Myr of independentevolution, one must also be prepared to accept thatmuch larger differences could have arisen in the 25 Myrseparating humans and macaques.
It is in this context that comparative informationabout the cortical organization in different speciesbecomes crucial. One needs to determine robustpatterns of common organization, which can givestrong indications of how the human brain is likely tobe organized, even where no direct evidence exists.Finding features of cortical organization that arepresently shared by species of New World and OldWorld monkeys strongly implies that the developmen-tal mechanisms responsible for their generation werealready present in a common ancestor group thatexisted long before the first apes; hence all present-daysimians, including humans, would in all likelihood haveinherited the corresponding genetic machinery. How-ever, it is also important to recognize that themorphologies of adult animals are the result of acomplex interaction between genetic and epigeneticfactors. Relatively small variations of a similar set ofdevelopmental ‘instructions’, or even different
environmental influences, have the potential to giverise to different adult brain phenotypes (Striedter 1998;Kornack 2000). One clear example of this fact comesfrom the observation that New World and Old Worldmonkeys of similar brain size (Cebus apella andM. fascicularis) have similar patterns of ocular domi-nance columns in the primary visual area (V1; Rosaet al. 1988, 1992), while smaller New World monkeys(e.g. Saimiri and Callithrix) have ocular dominancecolumns that are less sharply segregated, more frag-mented, and may even be absent in a substantialfraction of the population (Adams & Horton 2003).This strongly suggests that, while all simian primateshave the potential to express ocular dominance columnsas adults, at least in terms of their genetic code (theonly trait that can be directly inherited by offspring),certain other conditions have to be fulfilled at the timeof brain development for these columns to persist intoadulthood (Markstahler et al. 1998). In this particularexample, the conditions may include certain types ofvisual experience involving a minimum degree ofdecorrelation between the images seen by the twoeyes (hence, species with smaller interocular separ-ations may tend to have weak or absent columns).Thus, without additional information one cannotreadily assume that every monkey, or even thehypothetical common ancestors, would necessarilyhave ocular dominance columns as adults. We willreturn to the concept of adult brain characters as‘attractors’ in a potentially multistable developmentallandscape (Striedter 1998) at various points in thisreview, particularly when we discuss the differentconfigurations of cortical areas found in primates. Forthe moment, it is important to emphasize that notingthe existence of shared morphological characteristics isonly part of what is required to understand corticalevolution. Equally important is to pinpoint charactersthat vary in predictable ways, according to factors suchas brain size and habits (de Winter & Oxnard 2001),and to understand the rules governing this variability.Finally, whenever possible, one needs to identifyautapomorphic characters, which are shared only bymembers of a related group of species to the exclusionof other branches of the primate phylogenetic tree.
3. THE CONCEPT OF HOMOLOGY AS APPLIEDTO THE CEREBRAL CORTEXCentral to any analysis of evolutionary patterns are theconcepts of analogy and homology. Two structureswith completely distinct evolutionary origins mayperform the same functions, in which case they aredeemed analogous. On the other hand, homologousstructures are those which reflect the common inheri-tance of a given biological character. Although homo-logous structures do tend to share a given morphologyand to perform similar functions in related species, thisis not necessarily the case; herein lies a major challengeto present-day neurobiologists (Striedter 1998). Esta-blishing homologies is a particularly important step intracing evolutionary patterns specific to a givenstructure. The most objective way of deciding whetheror not two neural structures are homologous (be theycortical areas, columnar systems, or classes of neurons)
Cortical maps in New World monkeys M. G. P. Rosa and R. Tweedale 669
Phil. Trans. R. Soc. B (2005)
on October 23, 2012rstb.royalsocietypublishing.orgDownloaded from
is by consideration of their embryological origin. Thispoint of view has been particularly well articulated byRomer (1955),3 and was also championed byBrodmann (1909), who made extensive use of embryo-logical material in defending the concept of homo-genetic isocortex, and hence establishing the view ofmost neocortices as evolutionary and developmentalvariations of a common, six-layered plan. Here wedefend the point of view that a one-to-one correspon-dence between cortical areas in different species ofprimates is unlikely to exist, particularly among higher-order sensory and association fields. Rather, in manycases it makes more sense to apply the concept ofhomology to larger fields, which comprehend variable,developmentally multistable configurations of areas indifferent species.
In theory, the direct comparison of morphologicalor biochemical (e.g. gene expression) characteristics incorresponding developmental stages of two species canprovide a direct means of establishing homologybetween brain structures. Given the impossibility ofobtaining direct evidence on anything other than themost general morphological characteristics of thebrains of the hypothetical common ancestors, deve-lopmental studies have the best potential to providerigorous tests of phylogenetic hypotheses. Yet inpractice, with the exception of primary sensorimotorfields (Donoghue & Rakic 1999; Gitton et al. 1999)and phylogenetically older cortices (Levitt 1984;Pimenta et al. 1996), this remains an unfulfilledpromise. There is little evidence of developmentalsteps that are particular to, or promote the definitionof, a specific cortical area. Instead, the molecularspecification steps currently described for most six-layered cortices usually take the shape of smoothrostrocaudal or mediolateral gradients of ligands,which are relatively conserved between all mammalianspecies. As discussed in detail below, we interpret thisas indicating a particular status for certain areas,including the classically defined primary sensorycortices. By virtue of their genetically ‘hard-wired’definition during earlier stages of embryogenesis,including sharply defined molecular borders, theseareas could act as constant reference points, or‘molecular anchors’ (Rosa 2002) that guide thesubsequent sequential formation of other sensorimo-tor maps in the cortex. According to this model, mostother areas, including those forming the majority ofthe primate isocortex, could have their boundariesdetermined purely or mainly by a combination of weakmolecular definition (e.g. smooth gradients of ligands)and activity-dependent processes, provided that atemporal hierarchy of maturation similar to thatproposed by Flechsig (1920) exists (e.g. figure 5).Whether or not future experimental work proves thisto be the case, in practice, the observed smoothgradients of molecular expression provide little interms of sharp developmental criteria on which to basedecisions regarding the homologies of most corticalareas. This issue becomes particularly significant ifone is focusing on regions that have, in all likelihood,experienced marked growth and subdivision duringthe evolution of primates. For example, the posteriorparietal cortex includes more subdivisions in primates
than it does in non-primates, and appears to berelatively smaller and less subdivided in marmosetsthan in macaques (Rosa 1999; Manger et al. 2002). Insuch a case, one could imagine that the same pool ofventricular zone cells or the same region of the corticalplate that gives rise to an area in one of these speciesmay, as a result of additional cell divisions at laterstages of development and subsequent regionalspecialization, form the origin of several areas in thehuman brain. Thus, the marmoset, macaque andhuman configurations could be seen as differentendpoints of the same underlying ‘epigenetic land-scape’ (Striedter 1998). In this situation, although onecould certainly say that the human posterior parietalcortex is, as a whole, homologous to the posteriorparietal cortex of New World and Old World monkeys,formulating the question ‘which area of the humanbrain corresponds to a specific area in the monkey?’may not always result in a unique answer.
Given these complications with the application of adevelopmental definition of homology to cortical areas(at least if one thinks of each area as a separate trait), itis a fact of life that homologies tend to be proposedprimarily on the basis of less satisfactory criteria. Thisin turn has led to endless debates regarding whether ornot given cortical areas observed in different species aretruly homologous, or whether they represent cases ofparallel evolution (having originated from distinctevolutionary events). A particularly illustrative examplein this regard is the discussion of whether or not themiddle temporal area (MT, also known as V5) isspecific to primates. Several authors have demons-trated the existence of visual areas that are probablehomologues of MT in various non-primate species,including cats (Creutzfeldt 1988; Payne 1993; Burkeet al. 1998), flying foxes (Rosa 1999) and rodents(Paolini & Sereno 1998). In these cases, homology wasproposed on the basis of various combinations ofcriteria, including location relative to V1 and thesecond visual areas (V2), visuotopic organization,selectivity for direction of motion, and pattern ofafferent connections. However, in none of these specieshas an area that is identical to MT in all respects beendescribed. Key features, such as the particularly densemyelination that characterizes primate MT, are lackingin the putative homologues of cats and squirrels.While the proposed MT homologue in flying foxes isdensely myelinated (Rosa et al. 1993a), it is stillunknown whether this area has a concentration ofdirection-selective neurons. At present, we favour thehypothesis that the emergence of a MT homologue wasa relatively early event in eutherian evolution (see Rosa1999 for details); as pointed out above, homologousstructures are not necessarily identical. However, itmust also be conceded that there is simply not enoughinformation to completely rule out the possibility thatthis area represents a new evolutionary event, particularto primates (Kaas 2002). As argued below, newdevelopmental evidence pointing to a unique spatial,temporal and chemical delimitation of the neuronsforming the MT cortex may provide a way to resolvethis issue. From the practical point of view, itis important to realize that, even 100 years afterCampbell and Brodmann, cortical maps remain
670 M. G. P. Rosa and R. Tweedale Cortical maps in New World monkeys
Phil. Trans. R. Soc. B (2005)
on October 23, 2012rstb.royalsocietypublishing.orgDownloaded from
works in progress, particularly when it comes todefining homologous patterns of organization.
4. COMPARING PRIMATES OF DIFFERENT SIZESFigure 3 illustrates an unfolded view of the cerebralcortices of diurnal New World (a,b) and OldWorld (c,d ) simians, encompassing nearly the entire
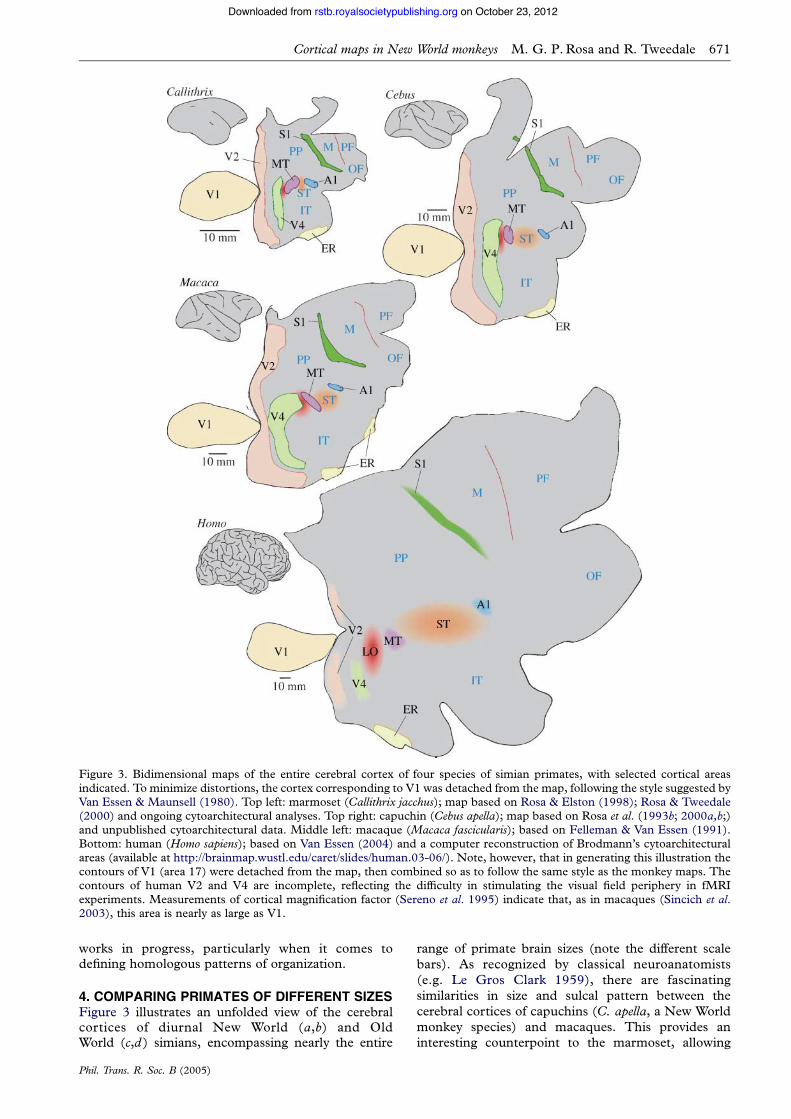
range of primate brain sizes (note the different scalebars). As recognized by classical neuroanatomists(e.g. Le Gros Clark 1959), there are fascinatingsimilarities in size and sulcal pattern between thecerebral cortices of capuchins (C. apella, a New Worldmonkey species) and macaques. This provides aninteresting counterpoint to the marmoset, allowing
Figure 3. Bidimensional maps of the entire cerebral cortex of four species of simian primates, with selected cortical areasindicated. To minimize distortions, the cortex corresponding to V1 was detached from the map, following the style suggested byVan Essen & Maunsell (1980). Top left: marmoset (Callithrix jacchus); map based on Rosa & Elston (1998); Rosa & Tweedale(2000) and ongoing cytoarchitectural analyses. Top right: capuchin (Cebus apella); map based on Rosa et al. (1993b; 2000a,b;)and unpublished cytoarchitectural data. Middle left: macaque (Macaca fascicularis); based on Felleman & Van Essen (1991).Bottom: human (Homo sapiens); based on Van Essen (2004) and a computer reconstruction of Brodmann’s cytoarchitecturalareas (available at http://brainmap.wustl.edu/caret/slides/human.03-06/). Note, however, that in generating this illustration thecontours of V1 (area 17) were detached from the map, then combined so as to follow the same style as the monkey maps. Thecontours of human V2 and V4 are incomplete, reflecting the difficulty in stimulating the visual field periphery in fMRIexperiments. Measurements of cortical magnification factor (Sereno et al. 1995) indicate that, as in macaques (Sincich et al.2003), this area is nearly as large as V1.
Cortical maps in New World monkeys M. G. P. Rosa and R. Tweedale 671
Phil. Trans. R. Soc. B (2005)
on October 23, 2012rstb.royalsocietypublishing.orgDownloaded from
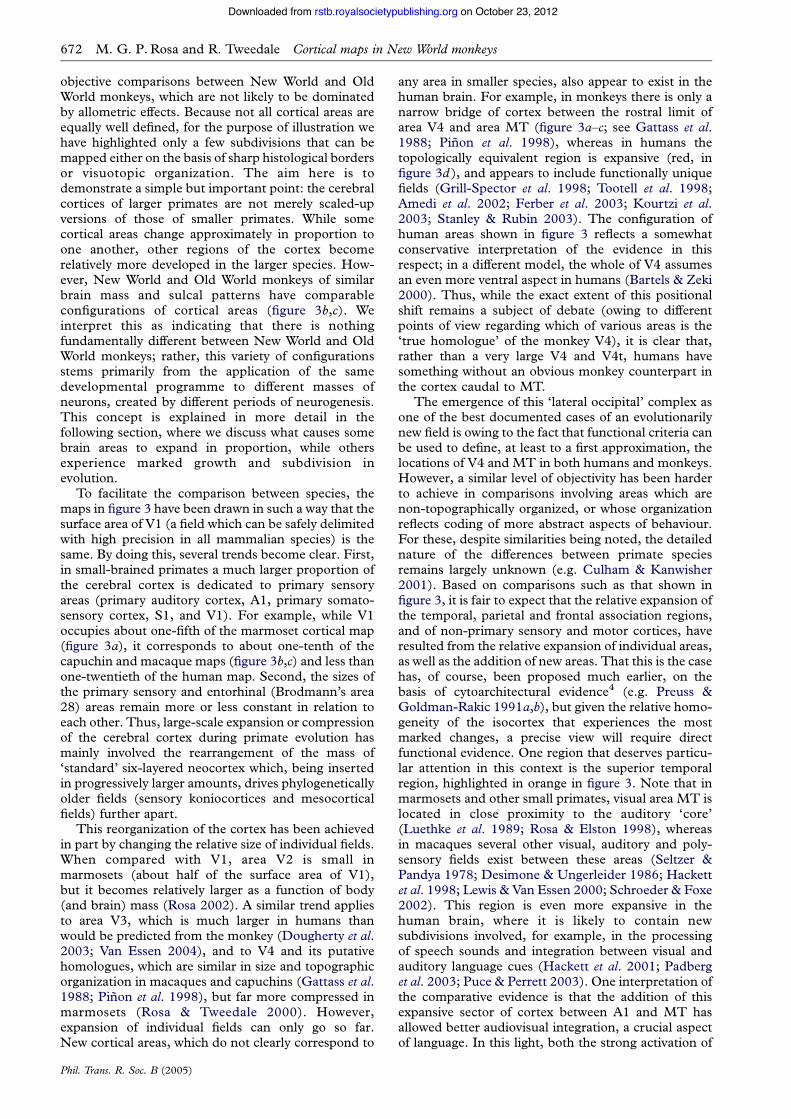
objective comparisons between New World and OldWorld monkeys, which are not likely to be dominatedby allometric effects. Because not all cortical areas areequally well defined, for the purpose of illustration wehave highlighted only a few subdivisions that can bemapped either on the basis of sharp histological bordersor visuotopic organization. The aim here is todemonstrate a simple but important point: the cerebralcortices of larger primates are not merely scaled-upversions of those of smaller primates. While somecortical areas change approximately in proportion toone another, other regions of the cortex becomerelatively more developed in the larger species. How-ever, New World and Old World monkeys of similarbrain mass and sulcal patterns have comparableconfigurations of cortical areas (figure 3b,c). Weinterpret this as indicating that there is nothingfundamentally different between New World and OldWorld monkeys; rather, this variety of configurationsstems primarily from the application of the samedevelopmental programme to different masses ofneurons, created by different periods of neurogenesis.This concept is explained in more detail in thefollowing section, where we discuss what causes somebrain areas to expand in proportion, while othersexperience marked growth and subdivision inevolution.
To facilitate the comparison between species, themaps in figure 3 have been drawn in such a way that thesurface area of V1 (a field which can be safely delimitedwith high precision in all mammalian species) is thesame. By doing this, several trends become clear. First,in small-brained primates a much larger proportion ofthe cerebral cortex is dedicated to primary sensoryareas (primary auditory cortex, A1, primary somato-sensory cortex, S1, and V1). For example, while V1occupies about one-fifth of the marmoset cortical map(figure 3a), it corresponds to about one-tenth of thecapuchin and macaque maps (figure 3b,c) and less thanone-twentieth of the human map. Second, the sizes ofthe primary sensory and entorhinal (Brodmann’s area28) areas remain more or less constant in relation toeach other. Thus, large-scale expansion or compressionof the cerebral cortex during primate evolution hasmainly involved the rearrangement of the mass of‘standard’ six-layered neocortex which, being insertedin progressively larger amounts, drives phylogeneticallyolder fields (sensory koniocortices and mesocorticalfields) further apart.
This reorganization of the cortex has been achievedin part by changing the relative size of individual fields.When compared with V1, area V2 is small inmarmosets (about half of the surface area of V1),but it becomes relatively larger as a function of body(and brain) mass (Rosa 2002). A similar trend appliesto area V3, which is much larger in humans thanwould be predicted from the monkey (Dougherty et al.2003; Van Essen 2004), and to V4 and its putativehomologues, which are similar in size and topographicorganization in macaques and capuchins (Gattass et al.1988; Pinon et al. 1998), but far more compressed inmarmosets (Rosa & Tweedale 2000). However,expansion of individual fields can only go so far.New cortical areas, which do not clearly correspond to
any area in smaller species, also appear to exist in thehuman brain. For example, in monkeys there is only anarrow bridge of cortex between the rostral limit ofarea V4 and area MT (figure 3a–c; see Gattass et al.1988; Pinon et al. 1998), whereas in humans thetopologically equivalent region is expansive (red, infigure 3d ), and appears to include functionally uniquefields (Grill-Spector et al. 1998; Tootell et al. 1998;Amedi et al. 2002; Ferber et al. 2003; Kourtzi et al.2003; Stanley & Rubin 2003). The configuration ofhuman areas shown in figure 3 reflects a somewhatconservative interpretation of the evidence in thisrespect; in a different model, the whole of V4 assumesan even more ventral aspect in humans (Bartels & Zeki2000). Thus, while the exact extent of this positionalshift remains a subject of debate (owing to differentpoints of view regarding which of various areas is the‘true homologue’ of the monkey V4), it is clear that,rather than a very large V4 and V4t, humans havesomething without an obvious monkey counterpart inthe cortex caudal to MT.
The emergence of this ‘lateral occipital’ complex asone of the best documented cases of an evolutionarilynew field is owing to the fact that functional criteria canbe used to define, at least to a first approximation, thelocations of V4 and MT in both humans and monkeys.However, a similar level of objectivity has been harderto achieve in comparisons involving areas which arenon-topographically organized, or whose organizationreflects coding of more abstract aspects of behaviour.For these, despite similarities being noted, the detailednature of the differences between primate speciesremains largely unknown (e.g. Culham & Kanwisher2001). Based on comparisons such as that shown infigure 3, it is fair to expect that the relative expansion ofthe temporal, parietal and frontal association regions,and of non-primary sensory and motor cortices, haveresulted from the relative expansion of individual areas,as well as the addition of new areas. That this is the casehas, of course, been proposed much earlier, on thebasis of cytoarchitectural evidence4 (e.g. Preuss &Goldman-Rakic 1991a,b), but given the relative homo-geneity of the isocortex that experiences the mostmarked changes, a precise view will require directfunctional evidence. One region that deserves particu-lar attention in this context is the superior temporalregion, highlighted in orange in figure 3. Note that inmarmosets and other small primates, visual area MT islocated in close proximity to the auditory ‘core’(Luethke et al. 1989; Rosa & Elston 1998), whereasin macaques several other visual, auditory and poly-sensory fields exist between these areas (Seltzer &Pandya 1978; Desimone & Ungerleider 1986; Hackettet al. 1998; Lewis & Van Essen 2000; Schroeder & Foxe2002). This region is even more expansive in thehuman brain, where it is likely to contain newsubdivisions involved, for example, in the processingof speech sounds and integration between visual andauditory language cues (Hackett et al. 2001; Padberget al. 2003; Puce & Perrett 2003). One interpretation ofthe comparative evidence is that the addition of thisexpansive sector of cortex between A1 and MT hasallowed better audiovisual integration, a crucial aspectof language. In this light, both the strong activation of
672 M. G. P. Rosa and R. Tweedale Cortical maps in New World monkeys
Phil. Trans. R. Soc. B (2005)
on October 23, 2012rstb.royalsocietypublishing.orgDownloaded from
area MT by lip movements in humans and the specificdeficits MT lesions cause in terms of lip-reading ability(as opposed to all biological motion) could be seen asthe result of a recent evolutionary adaptation of a moregeneral-purpose primate motion-processing system,which was driven by specific needs of hominoidevolution (Campbell et al. 1997; Sekiyama et al.2003). However, the close proximity of A1 and MTin small primates and the polysensory nature of some ofthe areas in between may hint at a phylogeneticallyolder role for the MT complex of areas in visual-auditory integration. This possibility needs to beexplored by means of a systematic study of this regionin smaller primates, including single-cell analyses ofvisual and auditory responses and more detailedanatomical tracing.
While the exact developmental mechanism under-lying the non-uniformity of evolutionary changesacross the surface of the cortex remains conjectural,an educated guess can be offered on the basis of whatwe know about the dynamics of cell proliferation givingrise to different parts of the brain (Kornack 2000;Finlay et al. 2001). During embryonic development ofthe cortex, the pool of progenitor cells in the ventricularzone undergoes a gradual change in the mode of celldivision (Kornack 2000; Caviness et al. 2003). Initially,most cell divisions are symmetric non-terminating(whereby both daughter cells become progenitorcells). This gradually changes to an asymmetric mode(i.e. one of the daughter cells remains as a progenitorcell in the ventricular zone, while the other migrates asa postmitotic neuron to form the developing cortex),and then to a symmetric terminating mode (in whichboth daughter cells become postmitotic neurons). Evenslight changes in the duration of these phases can havedramatic effects on the resultant number of neuronsthat comprise a particular structure. This has been welldocumented with respect to the fact that primates tendto have a larger fraction of the cortex formed bysupragranular layers, in comparison with rodents. Inthis case, the inside-out pattern of cortical developmentmeans that postmitotic cells generated in ‘late’,additional cell division cycles (enabled by the longergestation in primates) tend to aggregate in layers two tofour. This effect is compounded by the fact that theduration of the cell cycle also accelerates towards theend of the primate gestation period, in such a way thatrelatively more cell divisions occur during thefinal third of cortical neurogenesis (Kornack 2000).A localized expansion of certain regions of the cortexcould happen if these corresponded to sectors of theproliferative epithelium that underwent slightly latertransitions between modes of division. One mightconjecture, for example, that cells in the ventricularzone sectors giving rise to V1 (and other ‘core fields’)would tend to enter the symmetric terminating modeearlier than those in sectors giving rise to V2, hence therelative enlargement of the latter area in species thatundergo a longer period of corticogenesis. This isessentially an extension of Finlay & Darlington’s(1995) evolutionary/developmental argument to sub-divisions of the cerebral cortex. These authors pro-posed the existence of differential effects of order ofneurogenesis (and other developmental events) on the
size of brain components (‘late-generated structuresbecome disproportionately large in large brains’;Darlington et al. 1999, p. 367). This argument will beexpanded in § 5, where we deal with the relativephylogenetic stability of area MT.
5. PRIMARY AND NON-PRIMARY AREAS INDEVELOPMENT AND EVOLUTION: THE CASEOF AREA MTWhat makes the relative size of some cortical areasconstant across species, whereas other regions showmarked variation? A possible clue to the answer to thisquestion comes from the fact that one rostral visualarea, MT, defies the trend among extrastriate cortices,in that it corresponds to a nearly constant proportion ofthe size of primary cortical fields in all primates (Rosa2002). We propose that this can be explained accordingto the hypothesis that MT is part of a framework ofprimordial cortical areas, which are specified throughwell-defined transitions at relatively early stages of pre-and postnatal development (Rosa 2002), and whichwere already present from early stages of primateevolution. By contrast, the main focuses of isocorticalexpansion and differentiation (where, as outlinedabove, areas show more variability between relatedspecies) would correspond to regions that form andmature later in development, with a lesser degree ofmolecular specification; these also correspond to morerecent evolutionary acquisitions.
Of particular relevance for this argument is the factthat MT is noteworthy among extrastriate areas, owingto its accelerated maturation in pre- and postnatal life.The early development of MT in relation to otherextrastriate areas was first suggested on the basis of ananatomical comparison between the pattern of myeli-nation in newborn human brains (Flechsig 1920) andfunctional mapping of motion selectivity in adults; aspointed out by Watson et al. (1993), human MT seemsto correspond to one of the few regions of cortex thatare already myelinated at birth (Flechsig’s Feld 16 ).That the functional maturation of MT also occursearlier than that of other visual areas (with the exceptionof V1) has been suggested by research showing thecomparatively early development of pattern motionselectivity (Dobkins et al. 2004) and other presumedMT-related visual functions (Fine et al. 2003). Thevalidity of these inferences was confirmed by recentstudies of the postnatal development of cytoskeletaland calcium-binding protein expression in marmosets,which have confirmed a precise correspondencebetween a sharply defined region of early maturingcortex in the superior part of the temporal lobe and theborders of developing area MT (Bourne et al. 2004).Significantly, this same study demonstrated that thehistological maturation of MT is concomitant with thematuration of the primary sensory fields A1, S1 andV1, preceding that of most other cortical areas by a fewweeks (Bourne et al. in press).
This developmental observation has added supportto the concept of MTas a primary sensory area, whichhas so far been argued primarily from functionaland anatomical points of view (Rosa & Elston 1998;Rosa 2002). In traditional schemes of hierarchical
Cortical maps in New World monkeys M. G. P. Rosa and R. Tweedale 673
Phil. Trans. R. Soc. B (2005)
on October 23, 2012rstb.royalsocietypublishing.orgDownloaded from
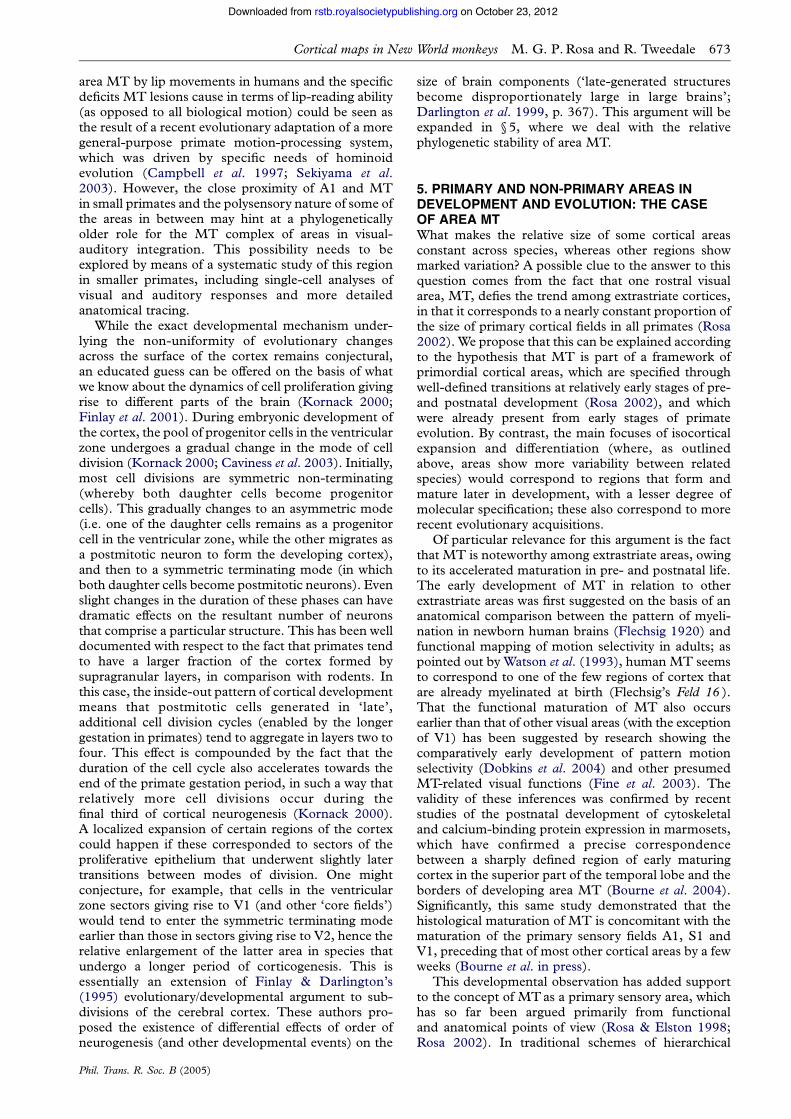
processing, MT is usually seen as a higher-order visualarea, occupying the fourth or fifth level of corticalprocessing. However, MT has a number of character-istics that are shared with primary sensory areas, butare rare among other fields. For example, MT neuronsreceive direct retinal innervations through a small, butwell-defined nucleus of the inferior pulvinar complex(O’Brien et al. 2001). As pointed out by Cusick et al.(1993), this nucleus (medial inferior pulvinar, or PIM)stands out from the rest of the pulvinar complex byvirtue of having the expected neurochemical charac-teristics of a primary relay nucleus. Perhaps owing tothe existence of this ‘lemniscal’ pathway, MT neuronsrespond with very short latencies in comparison withcells in all other areas except V1 (ffytche et al. 1995;Schmolesky et al. 1998; Raiguel et al. 1999), andmany remain active even after extensive lesions of V1(Rodman et al. 1989; Girard et al. 1992; Rosa et al.2000b; Azzopardi et al. 2003). In fact, MT neurons canmediate conscious visual sensation even in the absenceof V1, provided that stimuli of certain spatio-temporalcharacteristics are presented (Barbur et al. 1993;Sahraie et al. 1997; Zeki & ffytche 1998). Finally, MTis also unusual among extrastriate areas in forming arelatively simple and precise ‘first-order’ representationof the visual field (Allman & Kaas 1971; Fiorani et al.1989; Xu et al. 2004), the significance of which will bediscussed in §6, and in having sharply circumscribedhistological borders, comparable in definition only withthose of primary sensory areas such as A1 and S1(figure 4; see also Tootell et al. 1985; Huffman &Krubitzer 2001; Sincich et al. 2003). In opposition tothis body of evidence, the argument for MTas a higher-order area relies primarily on the study of laminarpatterns of corticocortical connections (e.g. Felleman& Van Essen 1991). While we recognize that thequantitative analysis of these types of data usuallyreveals a good anatomical correlate of the probablelevels of processing within the same hierarchical path-way (e.g. through the use of the ‘supragranular/infragranular index’; Barone et al. 2000; Vezoli et al.2004), it is also the case that the relationship tends tobreak down when one analyses connections betweenareas that may not operate strictly in series. Forexample, contrary to the expectations of a hierarchical
model, frontal lobe projections to visual cortexoriginate predominantly from supragranular layers(Shipp et al. 1998). Whereas the concept of twoprimary visual areas might sound strange to some, itwould probably not cause much reaction among mostauditory physiologists, who have grown accustomed,over a quarter of a century, to the idea of more thanone auditory ‘core’ field (e.g. Reale & Imig 1980).
It has long been known that primary sensory fieldsare among the first cortical areas to develop5, includingachieving morphological/histological maturation andundergoing critical periods (Conde et al. 1996; Gogtayet al. 2004). In embryonic life, preplate regions that aredestined to become primary areas also becomecommitted relatively early by means of sharp, geneti-cally regulated molecular specification steps (Polleuxet al. 1997; Donoghue & Rakic 1999; Smart et al.2002). In this context, it will be important to testwhether a high level of molecular specification appliesto MT, as predicted by the hypothesis outlined above.One would expect, for example, that MT-specificexpression of the Eph receptors and their ligands(ephrins) may occur at some stages of corticogenesis,including a sharp molecular border similar to thatdemonstrated for developing V1 (Donoghue & Rakic1999).
In summary, the unusual characteristics of area MT(among extrastriate areas) support the idea that theclear histological boundaries and the relative stabilityof the proportions between primary areas and ‘older’cortices (such as the entorhinal area; see figure 3) arelikely to result from these areas claiming definedterritories of the protomap or preplate ahead of otherareas, guided by precise molecular labels. As arguedabove, modulations of the duration of the cell cycleand the number of cell divisions, which form theprobable evolutionary mechanism of cortical expan-sion (Kornack & Rakic 1998), would be more likely toaffect the configurations of regions forming later indevelopment, including the expansion of individualareas and the emergence of new fields. Late-maturingareas of the human brain, such as the prefrontaland inferior temporal cortices, are among thosewhich have experienced relatively recent expansionand subdivision in primate evolution (Preuss &
Figure 4. Vibratome slices through flat-mounted preparations of the posterior neocortex of three marmosets, showing thedistinctive architecture of area MT. Caudal is towards the left, and dorsal towards the top of each panel. These slices have notbeen stained, and the borders of V1 (arrows) and MT are made visible only by differences in myelination (highly myelinatedregions appearing lighter). The borders of MTare distinct throughout, while those of V1 are clearer in the deeper layers (rightpanel). The primary auditory cortex appears as another heavily myelinated region, just below the lip of the lateral sulcus (leftpanel). For details, see Rosa & Elston (1998).
674 M. G. P. Rosa and R. Tweedale Cortical maps in New World monkeys
Phil. Trans. R. Soc. B (2005)
on October 23, 2012rstb.royalsocietypublishing.orgDownloaded from
Goldman-Rakic 1991a,b; Conde et al. 1996; Woo et al.1997; Cruz et al. 2003; Gogtay et al. 2004).
In theory, it is also the case that the later a givencortical region matures, the greater the chance thatenvironmental or other epigenetic factors could play arole in defining its final configuration in the cortex.Yet although it is clear that adaptations to specificecological niches correlate with changes in the sizesand configuration of areas, as well as their topo-graphic maps (Huffman et al. 1999; Rosa & Krubitzer1999), the exact manner in which different corticalphenotypes emerge in development, particularlyamong closely related species, remains for the mostpart unknown. Consistent correlations between cor-tical structure and habits have been difficult toestablish among primates. However, homologues ofV2 and V4 are smaller (relative to V1) in nocturnalprimate species than would be expected by comparisonwith diurnal species of similar size (Rosa et al. 1997a,b;Rosa 2002).
6. ‘CORE’ FIELDS AND THE FORMATIONOF SENSORIMOTOR MAPSIn this section, we examine the possible consequencesof asynchrony in the formation and maturation ofcortical areas for the establishment of topographicmaps, with the focus on visual areas. To date, it remainsunclear whether visuotopic maps have a function infacilitating certain types of neural computations (seeRosa 1997; Rosa & Tweedale 2004, for reviews).Nonetheless, they form one of the most importantcomponents of the currently accepted definition ofwhat constitutes a visual area, and therefore under-standing the relationship between maps and areas is ofsome practical importance. Despite this, there is littleinformation available on the developmental stepsresponsible for the formation of topographies outsidethe primary sensory areas (Rosa 2002). This constitu-tes a major limitation to our understanding of corticalarealization, as the maps found in higher-order areastend to be the ones that are coarser, topologically morecomplex and, according to some investigators, mayeven comprise incomplete representations of thesensory surface. Hence, their interpretation is morecontroversial, as demonstrated in §7 of the presentpaper.
In the absence of direct evidence, it has beeninstructive to consider to what extent the character-istics of adult cortical sensory maps may provide hintsabout the likely developmental mechanisms involved intheir formation. Recently, we proposed that theobserved asynchrony in cortical development, withthe primary sensory areas leading the way, combinedwith an almost universal drive towards configurationsthat maximize overlap between the receptive fields ofadjacent neurons, would have the potential to con-siderably simplify the formation of visual topographiessimilar to those observed in non-primary cortices ofadult primates (Rosa 2002). The key features of thisargument are summarized in figure 5. Briefly, weproposed that only the topographic organizations of‘core’ areas need to be under a strict genetic control,such as that implied by the patterns of ligand
expression during the phase of establishment ofthalamocortical innervations (e.g. Vanderhaeghenet al. 2000). The precise maps generated in theseearly forming areas could then act as reference points,or ‘anchors’, for the specification of additional sensorymaps, which would develop sequentially as a functionof distance from the primary area; this gradient-likematuration is supported by studies in primates (Condeet al. 1996; Bourne et al. in press). A crucial predictionof this model has been confirmed recently in exper-iments involving ferret pups, when it was demonstratedthat early lesions of V1 (thereby removing the maintopographic ‘anchor’) have widespread consequencesfor the visuotopic organization of adult extrastriatecortex, including V2, V3, and temporal and parietalareas (Restrepo et al. 2003). Even though receptivefields of near-normal size were observed in theterritories expected to correspond to these areas, anddespite the preservation of local topographic continu-ity, the global visuotopic maps and patterns of callosalconnections became disrupted beyond recognition.
A process similar to the one depicted in figure 5would require a hypothetical developmental mecha-nism that promotes local topographic continuity, withcells in adjacent columns having overlapping receptivefields, not only within the same area, but also acrossareas. Whereas the nature of the continuity-promotingmechanism remains unknown, the organization ofadult cortices strongly implies that receptive fieldoverlap of adjacent cells is a major constraint intopographic map development (Kaas & Catania2002). Neurons in the early postnatal cortex undergosignificant changes in their mode of intercellularcommunication, which could underlie the tendencyto retain topographies consisting of gradual changes,and to ‘prune out’ those reflecting decorrelated activityin adjacent cells (reflecting innervations by disparatevisual field loci). For example, late prenatal and earlypostnatal neurons communicate extensively throughgap junctions, forming clusters of coupled cells thatshare intracellular messengers, and which tend tobecome active in synchrony (Montoro & Yuste inpress). The reliance on gap junction signallingdecreases gradually over the first few weeks of life, inan opposite relationship to the emergence of chemicalsynaptic activity. It has been suggested that thebiophysical characteristics of the connexins expressedin different phases of postnatal maturation woulddictate that only cells with synchronous depolarizationsmaintain their gap junction communication, particu-larly after the early postnatal period (Maxeiner et al.2003). This could potentially provide a way ofstabilizing maps that are based on a smooth progressionof receptive field position.
According to the model illustrated in figure 5, thetemporally graded development of extrastriate cortexaround two primary nodes (V1 and MT) would haveprofound consequences for the functional organizationof the adult primate brain (Rosa 2002). First, while thevisual maps of these early forming, precisely specifiedareas could organize as simple isomorphs of the sensorysurface (as predicted from modelling studies ofspontaneous map formation within structures withsharply defined boundaries; Willshaw & Von der
Cortical maps in New World monkeys M. G. P. Rosa and R. Tweedale 675
Phil. Trans. R. Soc. B (2005)
on October 23, 2012rstb.royalsocietypublishing.orgDownloaded from
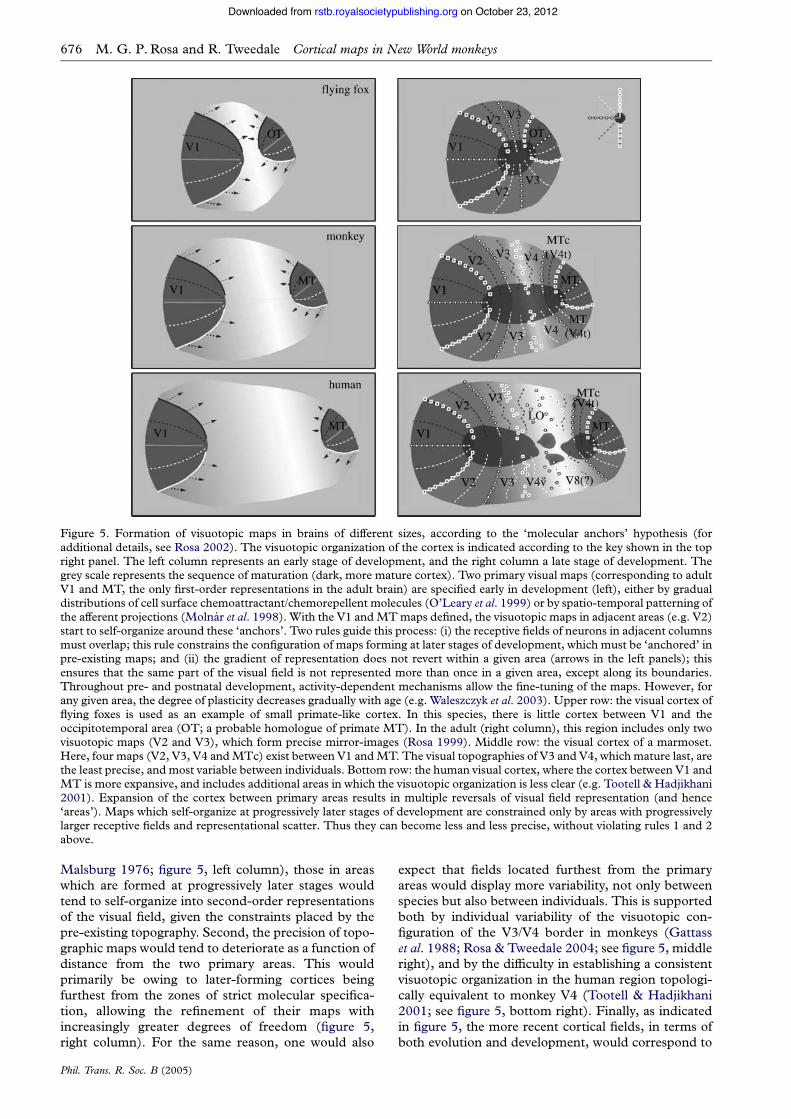
Malsburg 1976; figure 5, left column), those in areaswhich are formed at progressively later stages wouldtend to self-organize into second-order representationsof the visual field, given the constraints placed by thepre-existing topography. Second, the precision of topo-graphic maps would tend to deteriorate as a function ofdistance from the two primary areas. This wouldprimarily be owing to later-forming cortices beingfurthest from the zones of strict molecular specifica-tion, allowing the refinement of their maps withincreasingly greater degrees of freedom (figure 5,right column). For the same reason, one would also
expect that fields located furthest from the primaryareas would display more variability, not only betweenspecies but also between individuals. This is supportedboth by individual variability of the visuotopic con-figuration of the V3/V4 border in monkeys (Gattasset al. 1988; Rosa & Tweedale 2004; see figure 5, middleright), and by the difficulty in establishing a consistentvisuotopic organization in the human region topologi-cally equivalent to monkey V4 (Tootell & Hadjikhani2001; see figure 5, bottom right). Finally, as indicatedin figure 5, the more recent cortical fields, in terms ofboth evolution and development, would correspond to
Figure 5. Formation of visuotopic maps in brains of different sizes, according to the ‘molecular anchors’ hypothesis (foradditional details, see Rosa 2002). The visuotopic organization of the cortex is indicated according to the key shown in the topright panel. The left column represents an early stage of development, and the right column a late stage of development. Thegrey scale represents the sequence of maturation (dark, more mature cortex). Two primary visual maps (corresponding to adultV1 and MT, the only first-order representations in the adult brain) are specified early in development (left), either by gradualdistributions of cell surface chemoattractant/chemorepellent molecules (O’Leary et al. 1999) or by spatio-temporal patterning ofthe afferent projections (Molnar et al. 1998). With the V1 andMTmaps defined, the visuotopic maps in adjacent areas (e.g. V2)start to self-organize around these ‘anchors’. Two rules guide this process: (i) the receptive fields of neurons in adjacent columnsmust overlap; this rule constrains the configuration of maps forming at later stages of development, which must be ‘anchored’ inpre-existing maps; and (ii) the gradient of representation does not revert within a given area (arrows in the left panels); thisensures that the same part of the visual field is not represented more than once in a given area, except along its boundaries.Throughout pre- and postnatal development, activity-dependent mechanisms allow the fine-tuning of the maps. However, forany given area, the degree of plasticity decreases gradually with age (e.g. Waleszczyk et al. 2003). Upper row: the visual cortex offlying foxes is used as an example of small primate-like cortex. In this species, there is little cortex between V1 and theoccipitotemporal area (OT; a probable homologue of primate MT). In the adult (right column), this region includes only twovisuotopic maps (V2 and V3), which form precise mirror-images (Rosa 1999). Middle row: the visual cortex of a marmoset.Here, four maps (V2, V3, V4 andMTc) exist between V1 andMT. The visual topographies of V3 and V4, whichmature last, arethe least precise, and most variable between individuals. Bottom row: the human visual cortex, where the cortex between V1 andMT is more expansive, and includes additional areas in which the visuotopic organization is less clear (e.g. Tootell & Hadjikhani2001). Expansion of the cortex between primary areas results in multiple reversals of visual field representation (and hence‘areas’). Maps which self-organize at progressively later stages of development are constrained only by areas with progressivelylarger receptive fields and representational scatter. Thus they can become less and less precise, without violating rules 1 and 2above.
676 M. G. P. Rosa and R. Tweedale Cortical maps in New World monkeys
Phil. Trans. R. Soc. B (2005)
on October 23, 2012rstb.royalsocietypublishing.orgDownloaded from
those added at the centre of the regions of expansion.As observed experimentally, they have the coarsestsensory representations, which may combine morethan one modality (for example, the cortex between A1and MT). This would also have implications in thesearch for homologous areas in different primatespecies: although it should be possible to establishone-to-one homologies among those areas that matureduring earlier stages of development, the correspon-dence is likely to become increasingly blurred for ‘late’areas.
7. HOWWELL DOWE KNOWWHATWE THINKWEKNOW? THE CASE OF THE ‘THIRD TIER’ VISUALCORTEX IN NEW WORLD MONKEYSThe current ‘textbook’ view of visual cortex is that itconsists of morphologically distinct, functionally dedi-cated and stereotypically connected cortical areas, eachforming a topographic map of the visual field. Inpractice, however, more often than not the exactrelationship between architectural fields, connection-ally defined fields and topographic maps has provenharder to elucidate than suggested by this statement.Even today it is fair to say that there are only three areas(V1, V2 and MT) for which a precise correspondencehas been demonstrated between delimitations based onsuch a wide correlation of criteria. Although manymore areas have been proposed, they remain subjects ofdispute. In this section, we highlight the pitfallsinvolved in mapping visual cortical subdivisions, andconclude that it is likely that much of the presentuncertainty simply reflects the fragmentary nature ofthe experimental evidence so far obtained. We will dothis by focusing in some detail on the history of theorganization of the strip of cortex located immediatelyrostral to V2 (the ‘third tier’ extrastriate cortex) in NewWorld monkeys. This region has been the focus of along-standing controversy, and it is only very recentlythat a clearer picture of its organization has started toemerge.
In a series of classical studies of the visual cortex ofowl monkeys (a New World species), Allman & Kaas(1975) defined a series of ‘third tier’ areas, eachforming a complete visuotopic map of the contralateralhemifield. Among these was the dorsomedial area(DM), which occupied the dorsal-most aspect of theoccipital lobe and adjacent midline. According to theoriginal description, DM included representations ofthe upper and lower visual quadrants that adjoined V2,and was distinct from all adjacent areas by virtue ofbeing heavily myelinated, and (as demonstrated bysubsequent investigations) by having stronger connec-tions with V1 (Lin et al. 1982; Weller et al. 1991;Krubitzer & Kaas 1993). At the same time, studies ofthe third visual complex in Old World macaquemonkeys described a different pattern of organization.In this genus, the cortex anterior to dorsal V2 onlyrepresented the lower visual quadrant, in a mannerconsistent with the hypothesis that this region was partof a more extensive third visual area (V3) that formed amirror-image of V2 (Zeki 1969, 1978; Van Essen &Zeki 1978; Gattass et al. 1988). Although at firstglance these data indicated that different species of
monkey might have rather different patterns of areas,other studies also started to document intriguingsimilarities between the area(s) rostral to V2 in NewWorld and Old World monkeys. For example, similarto New World monkeys, the parts of the macaque thirdcomplex adjacent to dorsal V2 were found to be moredensely myelinated, and to receive much strongerprojections from V1, than those adjacent to ventral V2(Van Essen et al. 1986; Colby et al. 1988; Stepniewska& Kaas 1996; Felleman et al. 1997; Beck & Kaas 1999;Nakamura et al. 2004). These histological and con-nectional parallels have also suggested another possi-bility: that the reported differences could be moreapparent than real, reflecting, at least in part, differentcriteria used by different studies to define theboundaries of areas in this region.
The possibility of errors in interpretation has beenhighlighted by the studies of Lyon & Kaas (2001,2002), who reached the conclusion that there is not,in fact, an area DM in the dorsal cortex adjacent toV2 of New World monkeys (including marmosets,titis, owl monkeys and squirrel monkeys). Instead, onthe basis of anatomical tracing, these authorsproposed that the dorsal ‘third tier’ region in thesespecies formed an elongated topographic map of thelower contralateral quadrant, which was part of a V3similar to that described in Old World monkeys(figure 6a). According to this model, a smaller areaDM, including representations of both quadrants,would be located entirely rostral to V3. Thisprovided an attractive way of unifying data obtainedin several primate taxa, by implying a one-to-onecorrespondence between the areas of Old World andNew World monkeys: in both types of primate therewould be area V3, forming a reduced mirror-imageof V2, followed by another area (DM in New Worldmonkeys, V3a in the macaque) restricted to thedorsal extrastriate cortex. However, this proposal alsoled to several important unanswered questions. Forexample, how could it be reconciled with the earlierelectrophysiological evidence of an upper quadrantrepresentation located immediately adjacent to dorsalV2 in New World monkeys (Allman & Kaas 1975)?The presence of such a region was a key piece ofinformation leading to the original proposal of DM,which had since been independently confirmed byother studies (Krubitzer & Kaas 1993; Rosa &Schmid 1995; Sereno 1998). Moreover, what werethe implications of the connectional and histologicalasymmetries between dorsal and ventral cortex,observed by earlier studies, in terms of the singleV3 model? Clearly, major incompatibilities remained.
In recent studies, our laboratory revisited theorganization of the New World monkey third visualcomplex through a comprehensive combination ofanatomical tracing, fine-grained physiological record-ings and histological techniques (Rosa & Tweedale2000; Rosa et al. 2000a, 2005). The use of multiple,mutually reinforcing methods in the same experimentsallowed us to clarify this situation substantially. As isoften the case in science, the truth lay somewhere inbetween these two proposed models (figure 6b). Onone hand, we confirmed that New World monkeys(marmosets in this case) do have a V3-like area, which
Cortical maps in New World monkeys M. G. P. Rosa and R. Tweedale 677
Phil. Trans. R. Soc. B (2005)
on October 23, 2012rstb.royalsocietypublishing.orgDownloaded from
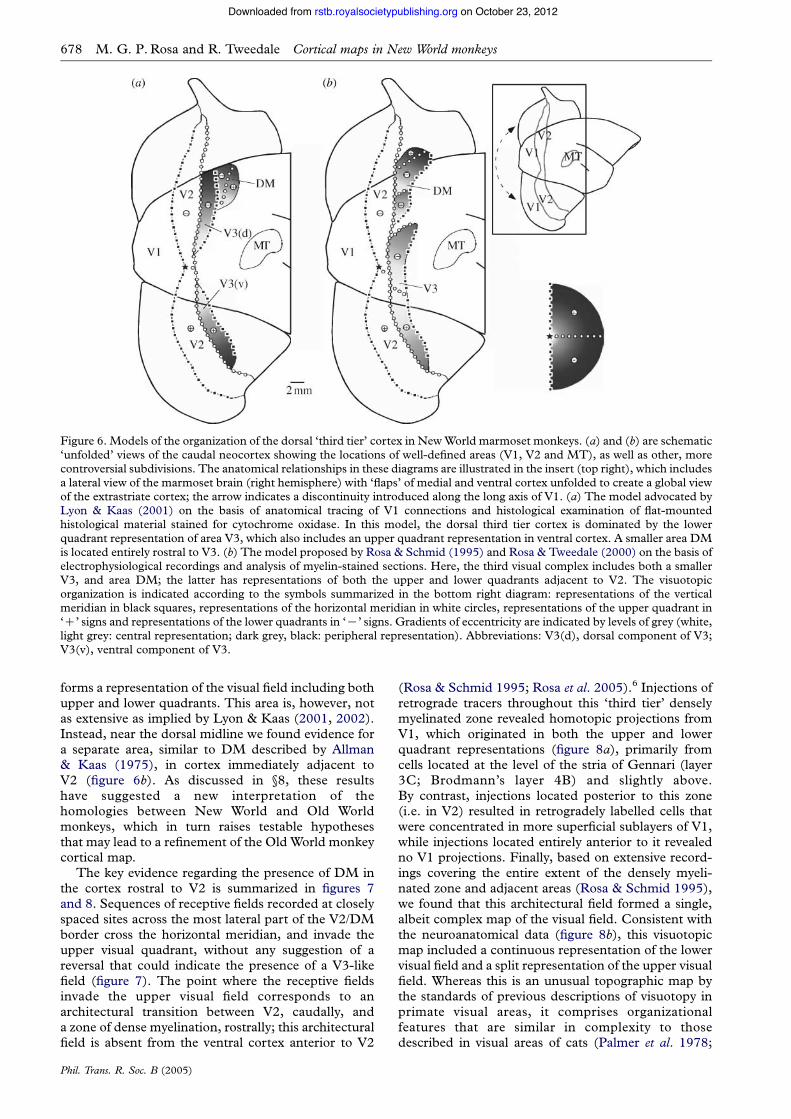
forms a representation of the visual field including bothupper and lower quadrants. This area is, however, notas extensive as implied by Lyon & Kaas (2001, 2002).Instead, near the dorsal midline we found evidence fora separate area, similar to DM described by Allman& Kaas (1975), in cortex immediately adjacent toV2 (figure 6b). As discussed in §8, these resultshave suggested a new interpretation of thehomologies between New World and Old Worldmonkeys, which in turn raises testable hypothesesthat may lead to a refinement of the Old World monkeycortical map.
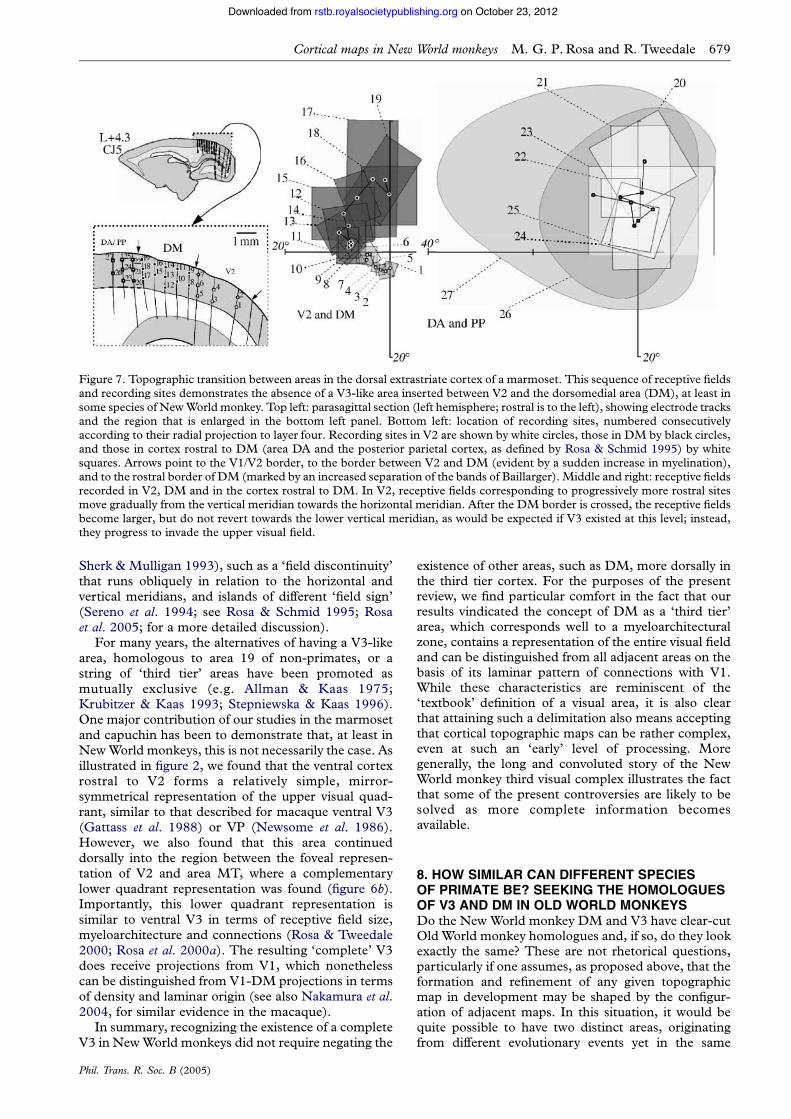
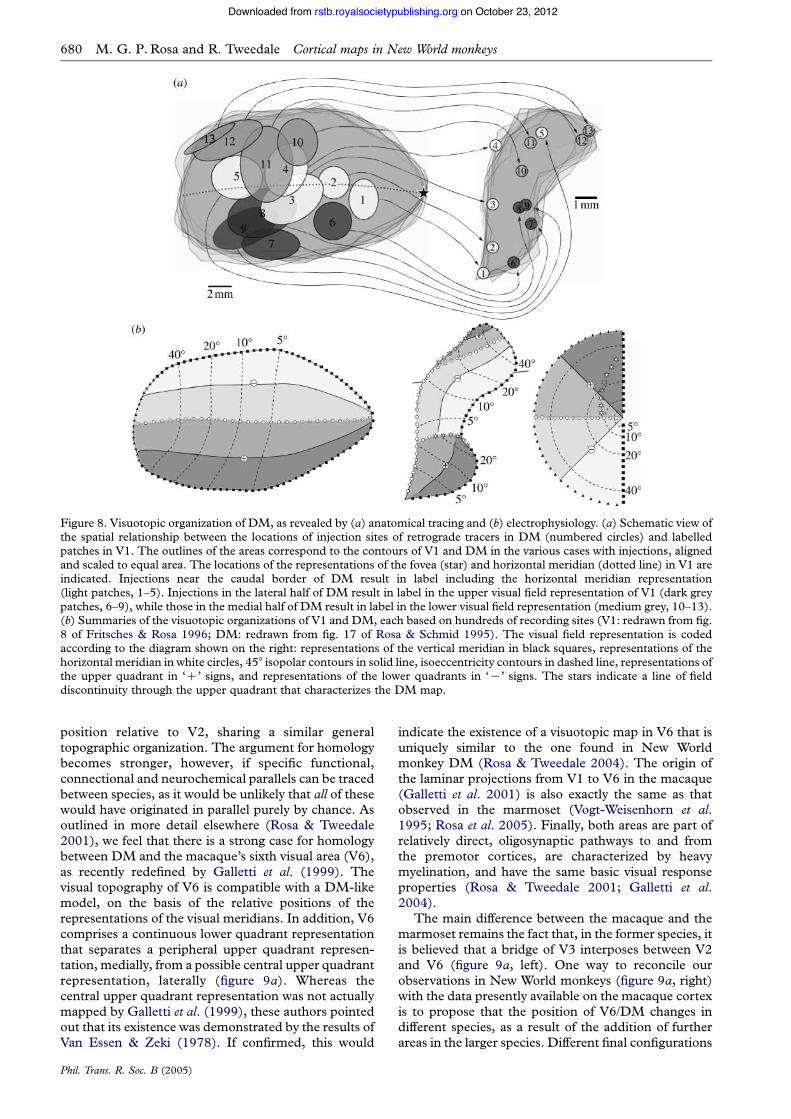
The key evidence regarding the presence of DM inthe cortex rostral to V2 is summarized in figures 7and 8. Sequences of receptive fields recorded at closelyspaced sites across the most lateral part of the V2/DMborder cross the horizontal meridian, and invade theupper visual quadrant, without any suggestion of areversal that could indicate the presence of a V3-likefield (figure 7). The point where the receptive fieldsinvade the upper visual field corresponds to anarchitectural transition between V2, caudally, anda zone of dense myelination, rostrally; this architecturalfield is absent from the ventral cortex anterior to V2
(Rosa & Schmid 1995; Rosa et al. 2005).6 Injections ofretrograde tracers throughout this ‘third tier’ denselymyelinated zone revealed homotopic projections fromV1, which originated in both the upper and lowerquadrant representations (figure 8a), primarily fromcells located at the level of the stria of Gennari (layer3C; Brodmann’s layer 4B) and slightly above.By contrast, injections located posterior to this zone(i.e. in V2) resulted in retrogradely labelled cells thatwere concentrated in more superficial sublayers of V1,while injections located entirely anterior to it revealedno V1 projections. Finally, based on extensive record-ings covering the entire extent of the densely myeli-nated zone and adjacent areas (Rosa & Schmid 1995),we found that this architectural field formed a single,albeit complex map of the visual field. Consistent withthe neuroanatomical data (figure 8b), this visuotopicmap included a continuous representation of the lowervisual field and a split representation of the upper visualfield. Whereas this is an unusual topographic map bythe standards of previous descriptions of visuotopy inprimate visual areas, it comprises organizationalfeatures that are similar in complexity to thosedescribed in visual areas of cats (Palmer et al. 1978;
Figure 6. Models of the organization of the dorsal ‘third tier’ cortex in NewWorld marmoset monkeys. (a) and (b) are schematic‘unfolded’ views of the caudal neocortex showing the locations of well-defined areas (V1, V2 and MT), as well as other, morecontroversial subdivisions. The anatomical relationships in these diagrams are illustrated in the insert (top right), which includesa lateral view of the marmoset brain (right hemisphere) with ‘flaps’ of medial and ventral cortex unfolded to create a global viewof the extrastriate cortex; the arrow indicates a discontinuity introduced along the long axis of V1. (a) The model advocated byLyon & Kaas (2001) on the basis of anatomical tracing of V1 connections and histological examination of flat-mountedhistological material stained for cytochrome oxidase. In this model, the dorsal third tier cortex is dominated by the lowerquadrant representation of area V3, which also includes an upper quadrant representation in ventral cortex. A smaller area DMis located entirely rostral to V3. (b) The model proposed by Rosa & Schmid (1995) and Rosa & Tweedale (2000) on the basis ofelectrophysiological recordings and analysis of myelin-stained sections. Here, the third visual complex includes both a smallerV3, and area DM; the latter has representations of both the upper and lower quadrants adjacent to V2. The visuotopicorganization is indicated according to the symbols summarized in the bottom right diagram: representations of the verticalmeridian in black squares, representations of the horizontal meridian in white circles, representations of the upper quadrant in‘C’ signs and representations of the lower quadrants in ‘K’ signs. Gradients of eccentricity are indicated by levels of grey (white,light grey: central representation; dark grey, black: peripheral representation). Abbreviations: V3(d), dorsal component of V3;V3(v), ventral component of V3.
678 M. G. P. Rosa and R. Tweedale Cortical maps in New World monkeys
Phil. Trans. R. Soc. B (2005)
on October 23, 2012rstb.royalsocietypublishing.orgDownloaded from
Sherk & Mulligan 1993), such as a ‘field discontinuity’that runs obliquely in relation to the horizontal andvertical meridians, and islands of different ‘field sign’(Sereno et al. 1994; see Rosa & Schmid 1995; Rosaet al. 2005; for a more detailed discussion).
For many years, the alternatives of having a V3-likearea, homologous to area 19 of non-primates, or astring of ‘third tier’ areas have been promoted asmutually exclusive (e.g. Allman & Kaas 1975;Krubitzer & Kaas 1993; Stepniewska & Kaas 1996).One major contribution of our studies in the marmosetand capuchin has been to demonstrate that, at least inNewWorld monkeys, this is not necessarily the case. Asillustrated in figure 2, we found that the ventral cortexrostral to V2 forms a relatively simple, mirror-symmetrical representation of the upper visual quad-rant, similar to that described for macaque ventral V3(Gattass et al. 1988) or VP (Newsome et al. 1986).However, we also found that this area continueddorsally into the region between the foveal represen-tation of V2 and area MT, where a complementarylower quadrant representation was found (figure 6b).Importantly, this lower quadrant representation issimilar to ventral V3 in terms of receptive field size,myeloarchitecture and connections (Rosa & Tweedale2000; Rosa et al. 2000a). The resulting ‘complete’ V3does receive projections from V1, which nonethelesscan be distinguished from V1-DM projections in termsof density and laminar origin (see also Nakamura et al.2004, for similar evidence in the macaque).
In summary, recognizing the existence of a completeV3 in NewWorld monkeys did not require negating the
existence of other areas, such as DM, more dorsally inthe third tier cortex. For the purposes of the presentreview, we find particular comfort in the fact that ourresults vindicated the concept of DM as a ‘third tier’area, which corresponds well to a myeloarchitecturalzone, contains a representation of the entire visual fieldand can be distinguished from all adjacent areas on thebasis of its laminar pattern of connections with V1.While these characteristics are reminiscent of the‘textbook’ definition of a visual area, it is also clearthat attaining such a delimitation also means acceptingthat cortical topographic maps can be rather complex,even at such an ‘early’ level of processing. Moregenerally, the long and convoluted story of the NewWorld monkey third visual complex illustrates the factthat some of the present controversies are likely to besolved as more complete information becomesavailable.
8. HOW SIMILAR CAN DIFFERENT SPECIESOF PRIMATE BE? SEEKING THE HOMOLOGUESOF V3 AND DM IN OLD WORLD MONKEYSDo the New World monkey DM and V3 have clear-cutOld World monkey homologues and, if so, do they lookexactly the same? These are not rhetorical questions,particularly if one assumes, as proposed above, that theformation and refinement of any given topographicmap in development may be shaped by the configur-ation of adjacent maps. In this situation, it would bequite possible to have two distinct areas, originatingfrom different evolutionary events yet in the same
Figure 7. Topographic transition between areas in the dorsal extrastriate cortex of a marmoset. This sequence of receptive fieldsand recording sites demonstrates the absence of a V3-like area inserted between V2 and the dorsomedial area (DM), at least insome species of NewWorldmonkey. Top left: parasagittal section (left hemisphere; rostral is to the left), showing electrode tracksand the region that is enlarged in the bottom left panel. Bottom left: location of recording sites, numbered consecutivelyaccording to their radial projection to layer four. Recording sites in V2 are shown by white circles, those in DM by black circles,and those in cortex rostral to DM (area DA and the posterior parietal cortex, as defined by Rosa & Schmid 1995) by whitesquares. Arrows point to the V1/V2 border, to the border between V2 and DM (evident by a sudden increase in myelination),and to the rostral border of DM (marked by an increased separation of the bands of Baillarger). Middle and right: receptive fieldsrecorded in V2, DM and in the cortex rostral to DM. In V2, receptive fields corresponding to progressively more rostral sitesmove gradually from the vertical meridian towards the horizontal meridian. After the DM border is crossed, the receptive fieldsbecome larger, but do not revert towards the lower vertical meridian, as would be expected if V3 existed at this level; instead,they progress to invade the upper visual field.
Cortical maps in New World monkeys M. G. P. Rosa and R. Tweedale 679
Phil. Trans. R. Soc. B (2005)
on October 23, 2012rstb.royalsocietypublishing.orgDownloaded from
position relative to V2, sharing a similar generaltopographic organization. The argument for homologybecomes stronger, however, if specific functional,connectional and neurochemical parallels can be tracedbetween species, as it would be unlikely that all of thesewould have originated in parallel purely by chance. Asoutlined in more detail elsewhere (Rosa & Tweedale2001), we feel that there is a strong case for homologybetween DM and the macaque’s sixth visual area (V6),as recently redefined by Galletti et al. (1999). Thevisual topography of V6 is compatible with a DM-likemodel, on the basis of the relative positions of therepresentations of the visual meridians. In addition, V6comprises a continuous lower quadrant representationthat separates a peripheral upper quadrant represen-tation, medially, from a possible central upper quadrantrepresentation, laterally (figure 9a). Whereas thecentral upper quadrant representation was not actuallymapped by Galletti et al. (1999), these authors pointedout that its existence was demonstrated by the results ofVan Essen & Zeki (1978). If confirmed, this would
indicate the existence of a visuotopic map in V6 that isuniquely similar to the one found in New Worldmonkey DM (Rosa & Tweedale 2004). The origin ofthe laminar projections from V1 to V6 in the macaque(Galletti et al. 2001) is also exactly the same as thatobserved in the marmoset (Vogt-Weisenhorn et al.1995; Rosa et al. 2005). Finally, both areas are part ofrelatively direct, oligosynaptic pathways to and fromthe premotor cortices, are characterized by heavymyelination, and have the same basic visual responseproperties (Rosa & Tweedale 2001; Galletti et al.2004).
The main difference between the macaque and themarmoset remains the fact that, in the former species, itis believed that a bridge of V3 interposes between V2and V6 (figure 9a, left). One way to reconcile ourobservations in New World monkeys (figure 9a, right)with the data presently available on the macaque cortexis to propose that the position of V6/DM changes indifferent species, as a result of the addition of furtherareas in the larger species. Different final configurations
Figure 8. Visuotopic organization of DM, as revealed by (a) anatomical tracing and (b) electrophysiology. (a) Schematic view ofthe spatial relationship between the locations of injection sites of retrograde tracers in DM (numbered circles) and labelledpatches in V1. The outlines of the areas correspond to the contours of V1 and DM in the various cases with injections, alignedand scaled to equal area. The locations of the representations of the fovea (star) and horizontal meridian (dotted line) in V1 areindicated. Injections near the caudal border of DM result in label including the horizontal meridian representation(light patches, 1–5). Injections in the lateral half of DM result in label in the upper visual field representation of V1 (dark greypatches, 6–9), while those in the medial half of DM result in label in the lower visual field representation (medium grey, 10–13).(b) Summaries of the visuotopic organizations of V1 and DM, each based on hundreds of recording sites (V1: redrawn from fig.8 of Fritsches & Rosa 1996; DM: redrawn from fig. 17 of Rosa & Schmid 1995). The visual field representation is codedaccording to the diagram shown on the right: representations of the vertical meridian in black squares, representations of thehorizontal meridian in white circles, 458 isopolar contours in solid line, isoeccentricity contours in dashed line, representations ofthe upper quadrant in ‘C’ signs, and representations of the lower quadrants in ‘K’ signs. The stars indicate a line of fielddiscontinuity through the upper quadrant that characterizes the DM map.
680 M. G. P. Rosa and R. Tweedale Cortical maps in New World monkeys
Phil. Trans. R. Soc. B (2005)
on October 23, 2012rstb.royalsocietypublishing.orgDownloaded from
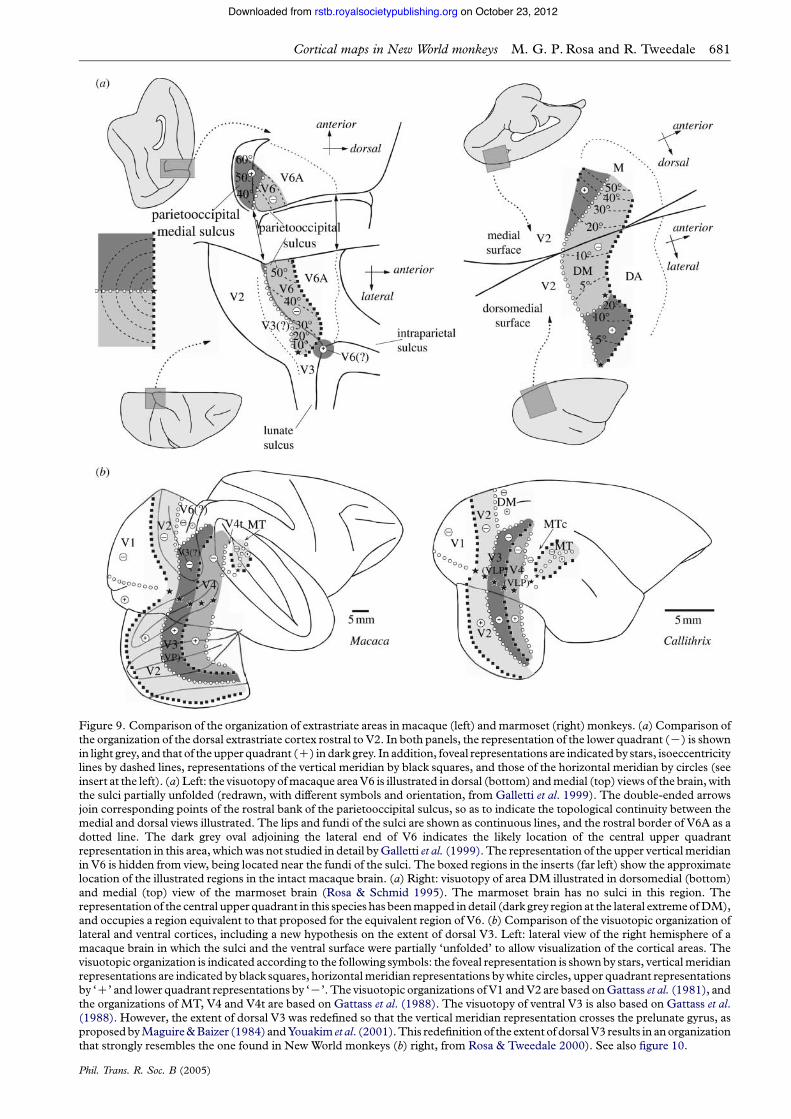
Figure 9. Comparison of the organization of extrastriate areas in macaque (left) andmarmoset (right) monkeys. (a) Comparison ofthe organization of the dorsal extrastriate cortex rostral to V2. In both panels, the representation of the lower quadrant (K) is shownin light grey, and that of theupper quadrant (C) in dark grey. In addition, foveal representations are indicatedby stars, isoeccentricitylines by dashed lines, representations of the vertical meridian by black squares, and those of the horizontal meridian by circles (seeinsert at the left). (a) Left: the visuotopy ofmacaque areaV6 is illustrated in dorsal (bottom) andmedial (top) views of the brain,withthe sulci partially unfolded (redrawn, with different symbols and orientation, from Galletti et al. 1999). The double-ended arrowsjoin corresponding points of the rostral bank of the parietooccipital sulcus, so as to indicate the topological continuity between themedial and dorsal views illustrated. The lips and fundi of the sulci are shown as continuous lines, and the rostral border of V6A as adotted line. The dark grey oval adjoining the lateral end of V6 indicates the likely location of the central upper quadrantrepresentation in this area, whichwas not studied in detail byGalletti et al. (1999). The representation of the upper verticalmeridianin V6 is hidden from view, being located near the fundi of the sulci. The boxed regions in the inserts (far left) show the approximatelocation of the illustrated regions in the intact macaque brain. (a) Right: visuotopy of area DM illustrated in dorsomedial (bottom)and medial (top) view of the marmoset brain (Rosa & Schmid 1995). The marmoset brain has no sulci in this region. Therepresentationof the central upper quadrant in this species has beenmapped in detail (dark grey region at the lateral extremeofDM),and occupies a region equivalent to that proposed for the equivalent region of V6. (b) Comparison of the visuotopic organization oflateral and ventral cortices, including a new hypothesis on the extent of dorsal V3. Left: lateral view of the right hemisphere of amacaque brain in which the sulci and the ventral surface were partially ‘unfolded’ to allow visualization of the cortical areas. Thevisuotopic organization is indicated according to the following symbols: the foveal representation is shownby stars, verticalmeridianrepresentations are indicated by black squares, horizontalmeridian representations bywhite circles, upper quadrant representationsby ‘C’ and lower quadrant representations by ‘K’. The visuotopic organizations of V1 andV2 are based onGattass et al. (1981), andthe organizations of MT, V4 and V4t are based on Gattass et al. (1988). The visuotopy of ventral V3 is also based on Gattass et al.(1988). However, the extent of dorsal V3 was redefined so that the vertical meridian representation crosses the prelunate gyrus, asproposedbyMaguire&Baizer (1984)andYouakim et al. (2001).This redefinitionof the extent of dorsalV3 results in anorganizationthat strongly resembles the one found in New World monkeys (b) right, from Rosa & Tweedale 2000). See also figure 10.
Cortical maps in New World monkeys M. G. P. Rosa and R. Tweedale 681
Phil. Trans. R. Soc. B (2005)
on October 23, 2012rstb.royalsocietypublishing.orgDownloaded from
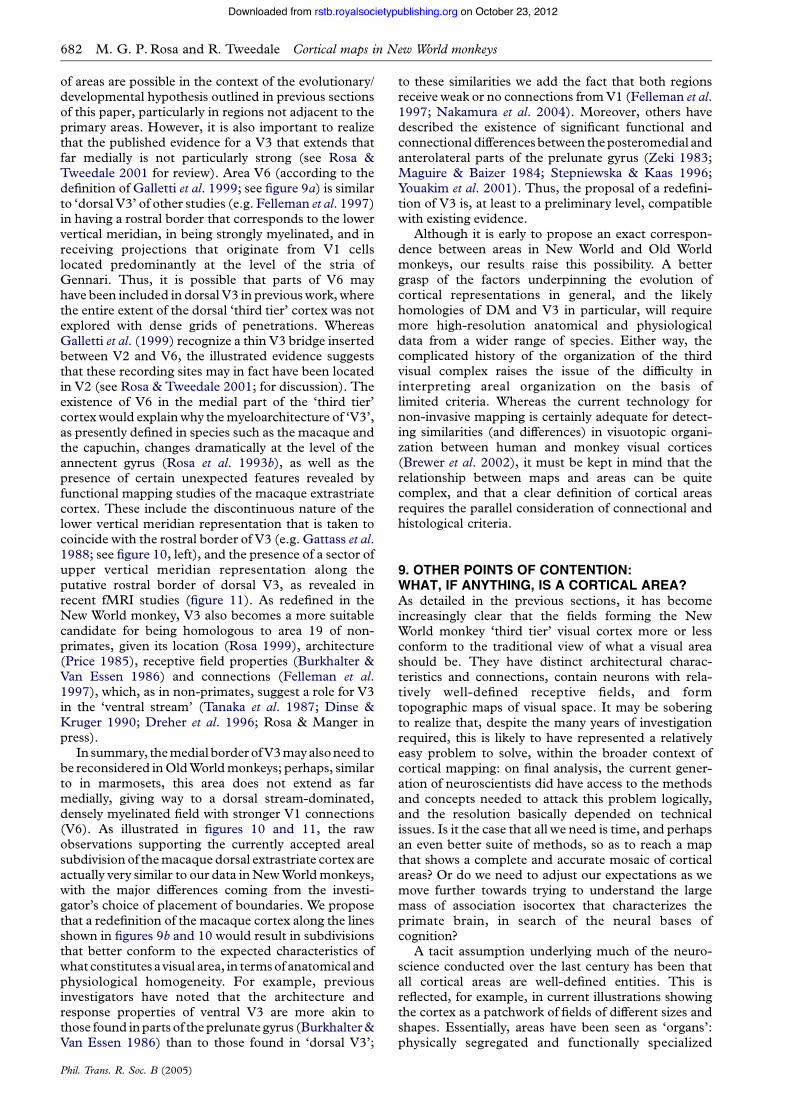
of areas are possible in the context of the evolutionary/developmental hypothesis outlined in previous sectionsof this paper, particularly in regions not adjacent to theprimary areas. However, it is also important to realizethat the published evidence for a V3 that extends thatfar medially is not particularly strong (see Rosa &Tweedale 2001 for review). Area V6 (according to thedefinition of Galletti et al. 1999; see figure 9a) is similarto ‘dorsal V3’ of other studies (e.g. Felleman et al. 1997)in having a rostral border that corresponds to the lowervertical meridian, in being strongly myelinated, and inreceiving projections that originate from V1 cellslocated predominantly at the level of the stria ofGennari. Thus, it is possible that parts of V6 mayhave been included in dorsal V3 in previouswork, wherethe entire extent of the dorsal ‘third tier’ cortex was notexplored with dense grids of penetrations. WhereasGalletti et al. (1999) recognize a thin V3 bridge insertedbetween V2 and V6, the illustrated evidence suggeststhat these recording sites may in fact have been locatedin V2 (see Rosa & Tweedale 2001; for discussion). Theexistence of V6 in the medial part of the ‘third tier’cortexwould explainwhy themyeloarchitecture of ‘V3’,as presently defined in species such as the macaque andthe capuchin, changes dramatically at the level of theannectent gyrus (Rosa et al. 1993b), as well as thepresence of certain unexpected features revealed byfunctional mapping studies of the macaque extrastriatecortex. These include the discontinuous nature of thelower vertical meridian representation that is taken tocoincide with the rostral border of V3 (e.g. Gattass et al.1988; see figure 10, left), and the presence of a sector ofupper vertical meridian representation along theputative rostral border of dorsal V3, as revealed inrecent fMRI studies (figure 11). As redefined in theNew World monkey, V3 also becomes a more suitablecandidate for being homologous to area 19 of non-primates, given its location (Rosa 1999), architecture(Price 1985), receptive field properties (Burkhalter &Van Essen 1986) and connections (Felleman et al.1997), which, as in non-primates, suggest a role for V3in the ‘ventral stream’ (Tanaka et al. 1987; Dinse &Kruger 1990; Dreher et al. 1996; Rosa & Manger inpress).
In summary, themedial border ofV3mayalsoneed tobe reconsidered inOldWorldmonkeys; perhaps, similarto in marmosets, this area does not extend as farmedially, giving way to a dorsal stream-dominated,densely myelinated field with stronger V1 connections(V6). As illustrated in figures 10 and 11, the rawobservations supporting the currently accepted arealsubdivision of themacaque dorsal extrastriate cortex areactually very similar to our data inNewWorldmonkeys,with the major differences coming from the investi-gator’s choice of placement of boundaries. We proposethat a redefinition of the macaque cortex along the linesshown in figures 9b and 10 would result in subdivisionsthat better conform to the expected characteristics ofwhat constitutes avisual area, in termsof anatomical andphysiological homogeneity. For example, previousinvestigators have noted that the architecture andresponse properties of ventral V3 are more akin tothose found inparts of theprelunate gyrus (Burkhalter&Van Essen 1986) than to those found in ‘dorsal V3’;
to these similarities we add the fact that both regionsreceive weak or no connections fromV1 (Felleman et al.1997; Nakamura et al. 2004). Moreover, others havedescribed the existence of significant functional andconnectional differencesbetween theposteromedial andanterolateral parts of the prelunate gyrus (Zeki 1983;Maguire & Baizer 1984; Stepniewska & Kaas 1996;Youakim et al. 2001). Thus, the proposal of a redefini-tion of V3 is, at least to a preliminary level, compatiblewith existing evidence.
Although it is early to propose an exact correspon-dence between areas in New World and Old Worldmonkeys, our results raise this possibility. A bettergrasp of the factors underpinning the evolution ofcortical representations in general, and the likelyhomologies of DM and V3 in particular, will requiremore high-resolution anatomical and physiologicaldata from a wider range of species. Either way, thecomplicated history of the organization of the thirdvisual complex raises the issue of the difficulty ininterpreting areal organization on the basis oflimited criteria. Whereas the current technology fornon-invasive mapping is certainly adequate for detect-ing similarities (and differences) in visuotopic organi-zation between human and monkey visual cortices(Brewer et al. 2002), it must be kept in mind that therelationship between maps and areas can be quitecomplex, and that a clear definition of cortical areasrequires the parallel consideration of connectional andhistological criteria.
9. OTHER POINTS OF CONTENTION:WHAT, IF ANYTHING, IS A CORTICAL AREA?As detailed in the previous sections, it has becomeincreasingly clear that the fields forming the NewWorld monkey ‘third tier’ visual cortex more or lessconform to the traditional view of what a visual areashould be. They have distinct architectural charac-teristics and connections, contain neurons with rela-tively well-defined receptive fields, and formtopographic maps of visual space. It may be soberingto realize that, despite the many years of investigationrequired, this is likely to have represented a relativelyeasy problem to solve, within the broader context ofcortical mapping: on final analysis, the current gener-ation of neuroscientists did have access to the methodsand concepts needed to attack this problem logically,and the resolution basically depended on technicalissues. Is it the case that all we need is time, and perhapsan even better suite of methods, so as to reach a mapthat shows a complete and accurate mosaic of corticalareas? Or do we need to adjust our expectations as wemove further towards trying to understand the largemass of association isocortex that characterizes theprimate brain, in search of the neural bases ofcognition?
A tacit assumption underlying much of the neuro-science conducted over the last century has been thatall cortical areas are well-defined entities. This isreflected, for example, in current illustrations showingthe cortex as a patchwork of fields of different sizes andshapes. Essentially, areas have been seen as ‘organs’:physically segregated and functionally specialized
682 M. G. P. Rosa and R. Tweedale Cortical maps in New World monkeys
Phil. Trans. R. Soc. B (2005)
on October 23, 2012rstb.royalsocietypublishing.orgDownloaded from
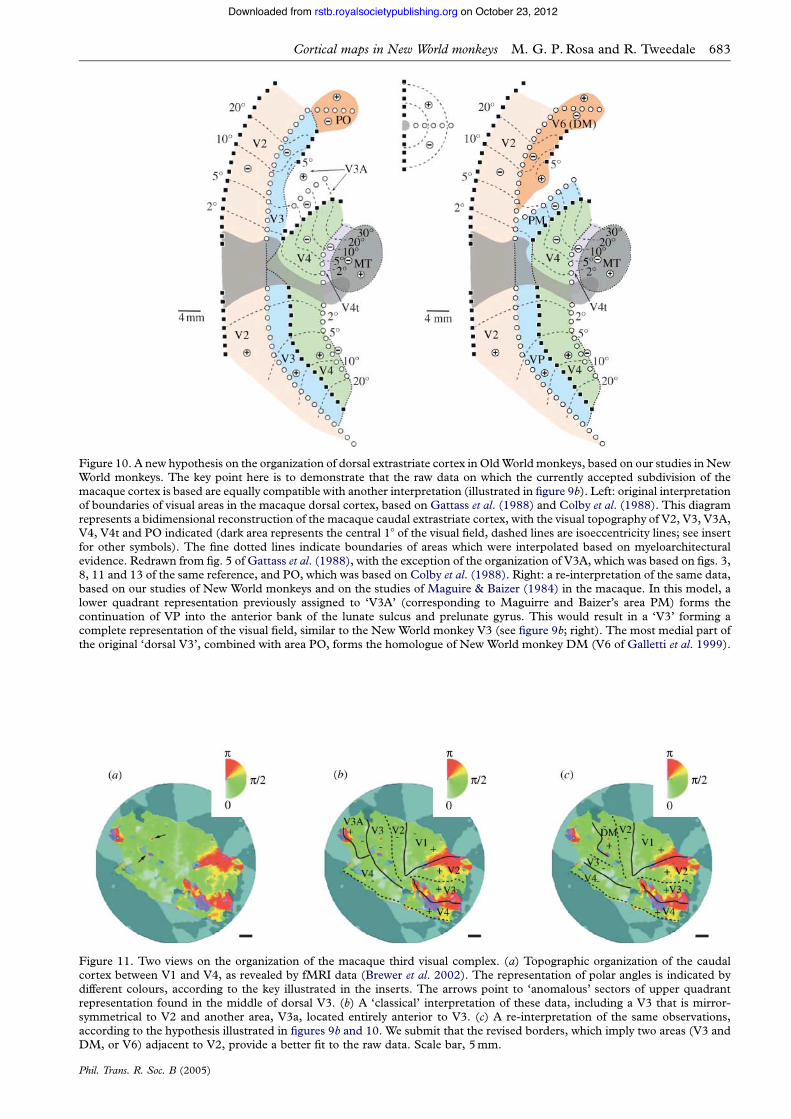
Figure 10. A new hypothesis on the organization of dorsal extrastriate cortex in OldWorld monkeys, based on our studies in NewWorld monkeys. The key point here is to demonstrate that the raw data on which the currently accepted subdivision of themacaque cortex is based are equally compatible with another interpretation (illustrated in figure 9b). Left: original interpretationof boundaries of visual areas in the macaque dorsal cortex, based on Gattass et al. (1988) and Colby et al. (1988). This diagramrepresents a bidimensional reconstruction of the macaque caudal extrastriate cortex, with the visual topography of V2, V3, V3A,V4, V4t and PO indicated (dark area represents the central 18 of the visual field, dashed lines are isoeccentricity lines; see insertfor other symbols). The fine dotted lines indicate boundaries of areas which were interpolated based on myeloarchitecturalevidence. Redrawn from fig. 5 of Gattass et al. (1988), with the exception of the organization of V3A, which was based on figs. 3,8, 11 and 13 of the same reference, and PO, which was based on Colby et al. (1988). Right: a re-interpretation of the same data,based on our studies of New World monkeys and on the studies of Maguire & Baizer (1984) in the macaque. In this model, alower quadrant representation previously assigned to ‘V3A’ (corresponding to Maguirre and Baizer’s area PM) forms thecontinuation of VP into the anterior bank of the lunate sulcus and prelunate gyrus. This would result in a ‘V3’ forming acomplete representation of the visual field, similar to the New World monkey V3 (see figure 9b; right). The most medial part ofthe original ‘dorsal V3’, combined with area PO, forms the homologue of New World monkey DM (V6 of Galletti et al. 1999).
Figure 11. Two views on the organization of the macaque third visual complex. (a) Topographic organization of the caudalcortex between V1 and V4, as revealed by fMRI data (Brewer et al. 2002). The representation of polar angles is indicated bydifferent colours, according to the key illustrated in the inserts. The arrows point to ‘anomalous’ sectors of upper quadrantrepresentation found in the middle of dorsal V3. (b) A ‘classical’ interpretation of these data, including a V3 that is mirror-symmetrical to V2 and another area, V3a, located entirely anterior to V3. (c) A re-interpretation of the same observations,according to the hypothesis illustrated in figures 9b and 10. We submit that the revised borders, which imply two areas (V3 andDM, or V6) adjacent to V2, provide a better fit to the raw data. Scale bar, 5mm.
Cortical maps in New World monkeys M. G. P. Rosa and R. Tweedale 683
Phil. Trans. R. Soc. B (2005)
on October 23, 2012rstb.royalsocietypublishing.orgDownloaded from
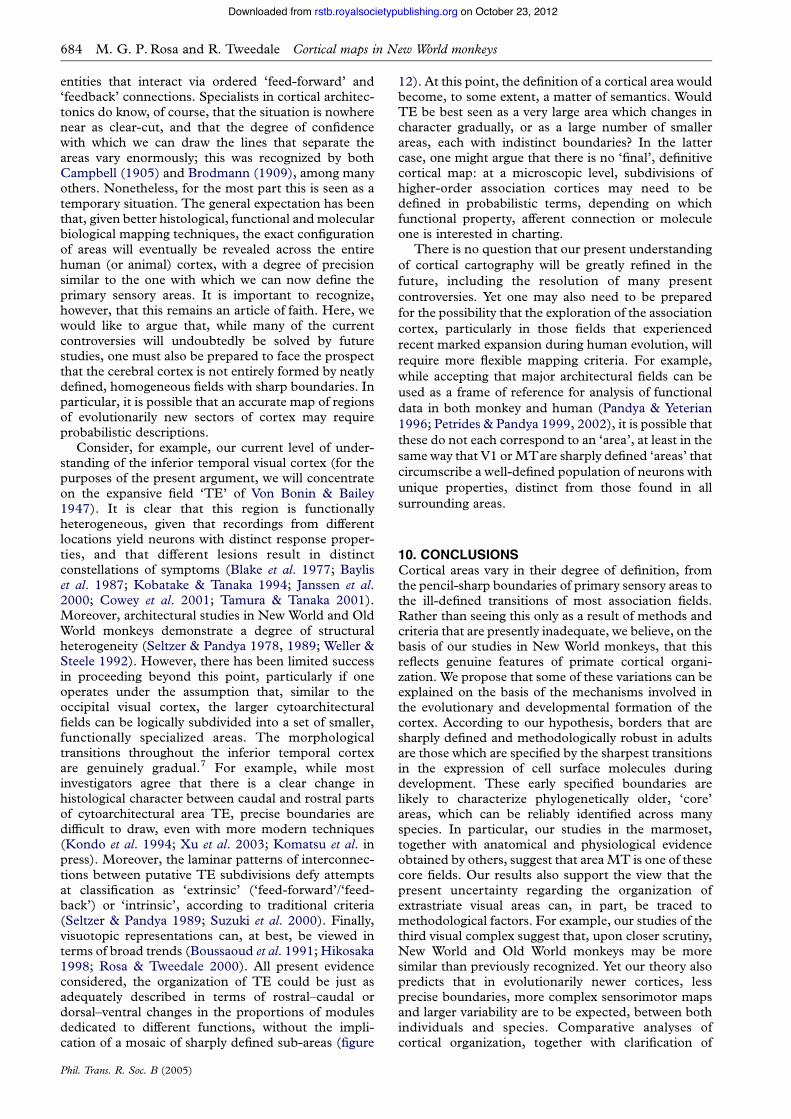
entities that interact via ordered ‘feed-forward’ and‘feedback’ connections. Specialists in cortical architec-tonics do know, of course, that the situation is nowherenear as clear-cut, and that the degree of confidencewith which we can draw the lines that separate theareas vary enormously; this was recognized by bothCampbell (1905) and Brodmann (1909), among manyothers. Nonetheless, for the most part this is seen as atemporary situation. The general expectation has beenthat, given better histological, functional and molecularbiological mapping techniques, the exact configurationof areas will eventually be revealed across the entirehuman (or animal) cortex, with a degree of precisionsimilar to the one with which we can now define theprimary sensory areas. It is important to recognize,however, that this remains an article of faith. Here, wewould like to argue that, while many of the currentcontroversies will undoubtedly be solved by futurestudies, one must also be prepared to face the prospectthat the cerebral cortex is not entirely formed by neatlydefined, homogeneous fields with sharp boundaries. Inparticular, it is possible that an accurate map of regionsof evolutionarily new sectors of cortex may requireprobabilistic descriptions.
Consider, for example, our current level of under-standing of the inferior temporal visual cortex (for thepurposes of the present argument, we will concentrateon the expansive field ‘TE’ of Von Bonin & Bailey1947). It is clear that this region is functionallyheterogeneous, given that recordings from differentlocations yield neurons with distinct response proper-ties, and that different lesions result in distinctconstellations of symptoms (Blake et al. 1977; Bayliset al. 1987; Kobatake & Tanaka 1994; Janssen et al.2000; Cowey et al. 2001; Tamura & Tanaka 2001).Moreover, architectural studies in New World and OldWorld monkeys demonstrate a degree of structuralheterogeneity (Seltzer & Pandya 1978, 1989; Weller &Steele 1992). However, there has been limited successin proceeding beyond this point, particularly if oneoperates under the assumption that, similar to theoccipital visual cortex, the larger cytoarchitecturalfields can be logically subdivided into a set of smaller,functionally specialized areas. The morphologicaltransitions throughout the inferior temporal cortexare genuinely gradual.7 For example, while mostinvestigators agree that there is a clear change inhistological character between caudal and rostral partsof cytoarchitectural area TE, precise boundaries aredifficult to draw, even with more modern techniques(Kondo et al. 1994; Xu et al. 2003; Komatsu et al. inpress). Moreover, the laminar patterns of interconnec-tions between putative TE subdivisions defy attemptsat classification as ‘extrinsic’ (‘feed-forward’/‘feed-back’) or ‘intrinsic’, according to traditional criteria(Seltzer & Pandya 1989; Suzuki et al. 2000). Finally,visuotopic representations can, at best, be viewed interms of broad trends (Boussaoud et al. 1991; Hikosaka1998; Rosa & Tweedale 2000). All present evidenceconsidered, the organization of TE could be just asadequately described in terms of rostral–caudal ordorsal–ventral changes in the proportions of modulesdedicated to different functions, without the impli-cation of a mosaic of sharply defined sub-areas (figure
12). At this point, the definition of a cortical area wouldbecome, to some extent, a matter of semantics. WouldTE be best seen as a very large area which changes incharacter gradually, or as a large number of smallerareas, each with indistinct boundaries? In the lattercase, one might argue that there is no ‘final’, definitivecortical map: at a microscopic level, subdivisions ofhigher-order association cortices may need to bedefined in probabilistic terms, depending on whichfunctional property, afferent connection or moleculeone is interested in charting.
There is no question that our present understandingof cortical cartography will be greatly refined in thefuture, including the resolution of many presentcontroversies. Yet one may also need to be preparedfor the possibility that the exploration of the associationcortex, particularly in those fields that experiencedrecent marked expansion during human evolution, willrequire more flexible mapping criteria. For example,while accepting that major architectural fields can beused as a frame of reference for analysis of functionaldata in both monkey and human (Pandya & Yeterian1996; Petrides & Pandya 1999, 2002), it is possible thatthese do not each correspond to an ‘area’, at least in thesame way that V1 orMTare sharply defined ‘areas’ thatcircumscribe a well-defined population of neurons withunique properties, distinct from those found in allsurrounding areas.
10. CONCLUSIONSCortical areas vary in their degree of definition, fromthe pencil-sharp boundaries of primary sensory areas tothe ill-defined transitions of most association fields.Rather than seeing this only as a result of methods andcriteria that are presently inadequate, we believe, on thebasis of our studies in New World monkeys, that thisreflects genuine features of primate cortical organi-zation. We propose that some of these variations can beexplained on the basis of the mechanisms involved inthe evolutionary and developmental formation of thecortex. According to our hypothesis, borders that aresharply defined and methodologically robust in adultsare those which are specified by the sharpest transitionsin the expression of cell surface molecules duringdevelopment. These early specified boundaries arelikely to characterize phylogenetically older, ‘core’areas, which can be reliably identified across manyspecies. In particular, our studies in the marmoset,together with anatomical and physiological evidenceobtained by others, suggest that areaMT is one of thesecore fields. Our results also support the view that thepresent uncertainty regarding the organization ofextrastriate visual areas can, in part, be traced tomethodological factors. For example, our studies of thethird visual complex suggest that, upon closer scrutiny,New World and Old World monkeys may be moresimilar than previously recognized. Yet our theory alsopredicts that in evolutionarily newer cortices, lessprecise boundaries, more complex sensorimotor mapsand larger variability are to be expected, between bothindividuals and species. Comparative analyses ofcortical organization, together with clarification of
684 M. G. P. Rosa and R. Tweedale Cortical maps in New World monkeys
Phil. Trans. R. Soc. B (2005)
on October 23, 2012rstb.royalsocietypublishing.orgDownloaded from

the developmental mechanisms underlying the for-mation of cortical maps (in particular, the degree ofgenetic specification involved in the establishment ofdifferent areas), will have a significant impact on ourfuture efforts in cortical mapping.
The gradual process of refinement of our under-standing of the cerebral cortex will also raise the issue ofnomenclature as a crucial limitation of our currentapproaches to brain mapping. As illustrated by theconvoluted history of the third tier visual cortex, it isrelatively common to find that areas that are probablyhomologous, or parts thereof, have been given severaldistinct names by different researchers. More worrying,however, is the fact that the same names may have beengiven to different areas, as this may imply falsehomologies or analogies, and the consequent creationof much confusion for scientists, clinicians andstudents alike. This situation is, in no small part,owing to a lack of consensus regarding how best todefine a cortical area. We believe that only through abetter understanding of the processes of formation ofareas in development and evolution will objectivecriteria emerge to allow a sensible, systematic nomen-clature of the primate cortical areas.
The authors thank Dr Paul Manger for insightful discussionsand comments on the manuscript. This study was supportedby project grants from the National Health and MedicalResearch Council and Australian Research Council, and byequipment grants from the Clive and Vera RamaciottiFoundation and ANZ Charitable Trust.
ENDNOTES
1 ‘In 1904 I pointed out in a publication that brains without sulci(lissencephalic) possessed great advantages over gyrencephalicones for topical localisation, that is, the histological delimitationof cortical areas, for on the smooth surfaces of such hemispheresthe shape, position and extent of the individual fields were more
clearly visible than on folded surfaces, and that often it was onlypossible to understand the complex relationships of gyrencephalichemispheres by reference to them.’ From Brodmann (1909;ch. IV).
2 It may be of historical interest to note, however, that the ubiquityof the use of macaques in studies of cortical organization was notnearly as prevalent at the time of Brodmann’s and Campbell’sinvestigations as it is today. Although this fact is not alwaysrecognized, Brodmann’s most famous diagram representing thecytoarchitectural areas of the OldWorld monkey cerebral cortex isbased on the study of a guenon (genus Cercopithecus). Campbellconducted parallel investigations on the cortex of various speciesof apes, using specimens obtained from Sherrington’s laboratoryfollowing his studies on stimulation of motor cortex in theseanimals.
3 ‘Function is no sure guide, for organs which are clearlyhomologous in two animals may be put to quite different uses.Observation shows that the shape, size or color of a structure giveslittle positive evidence of identity. Similarity in general anatomicposition and relations to adjacent organs is a more useful clue toidentification. Best of all is similarity in developmental history.Embryologic processes in vertebrates tend to be conservative, andorgans which are quite different in the adult condition may revealtheir homology through similarity in early embryonic stages.’ InRomer (1955; ch. 1).
4 ‘The regions distinguished in man and the gyrencephalic monkeysare also found in their entirety in the marmoset, but usually insimplified form and arrangement and sometimes with a reducednumber of areas.’ In Brodmann (1909; ch. IV).
5 ‘The value of embryological researches has already been proved,at any rate in one direction, by taking advantage of the natural lawthat the maturation or myelinisation of the various tracts of fibresstanding in relation with various functions does not occurcoincidentally but follows a set sequence. Observing the tenetsof this law the surface of the brain can be subdivided inaccordance with the different times at which the medullatedconstituents become apparent. To exemplify my meaning I havemerely to point to the visuo-sensory area; the calcarine cortex, inwhich the seeing function concentrates itself, is found to containmyelinised fibres at a relatively early date, certainly at a time whensuch fibres are absent from the surrounding field.’ FromCampbell(1905; Introduction).
6Myeloarchitectural evidence for an asymmetry between the dorsaland ventral extrastriate cortices anterior to V2 can be found as farback as Campbell’s work, and Campbell may in fact have been
Figure 12. Hypothetical views of the functional and anatomical transitions at the boundary of two cortical areas. Each diagramrepresents a number of cellular columns spanning from layer one (top) to the white matter (bottom), and two populations ofafferent axons. Left: in this case, the border is unambiguous—anatomical and functional definitions coincide. This is becauseduring development the afferent connections have segregated along a precise border, creating a sharp functional transitionbetween cells with one type of neural response (dark columns) and those with a different type of neural response (white columns).This could also result in sharp histological transitions (for example, if afferent 1 represented a highly myelinated, fast conductingpathway, and afferent 2 a less myelinated pathway). Right: because the proportions of cells with different response properties andconnections change gradually, in this second case the border is ambiguous as far as can be assessed by any single criterion.For example, based on the pattern of connections, one may recognize two areas that gradually merge onto each other, or threeareas defined by different combinations of afferents. The histological characteristics would also be expected to change gradually.
Cortical maps in New World monkeys M. G. P. Rosa and R. Tweedale 685
Phil. Trans. R. Soc. B (2005)
on October 23, 2012rstb.royalsocietypublishing.orgDownloaded from
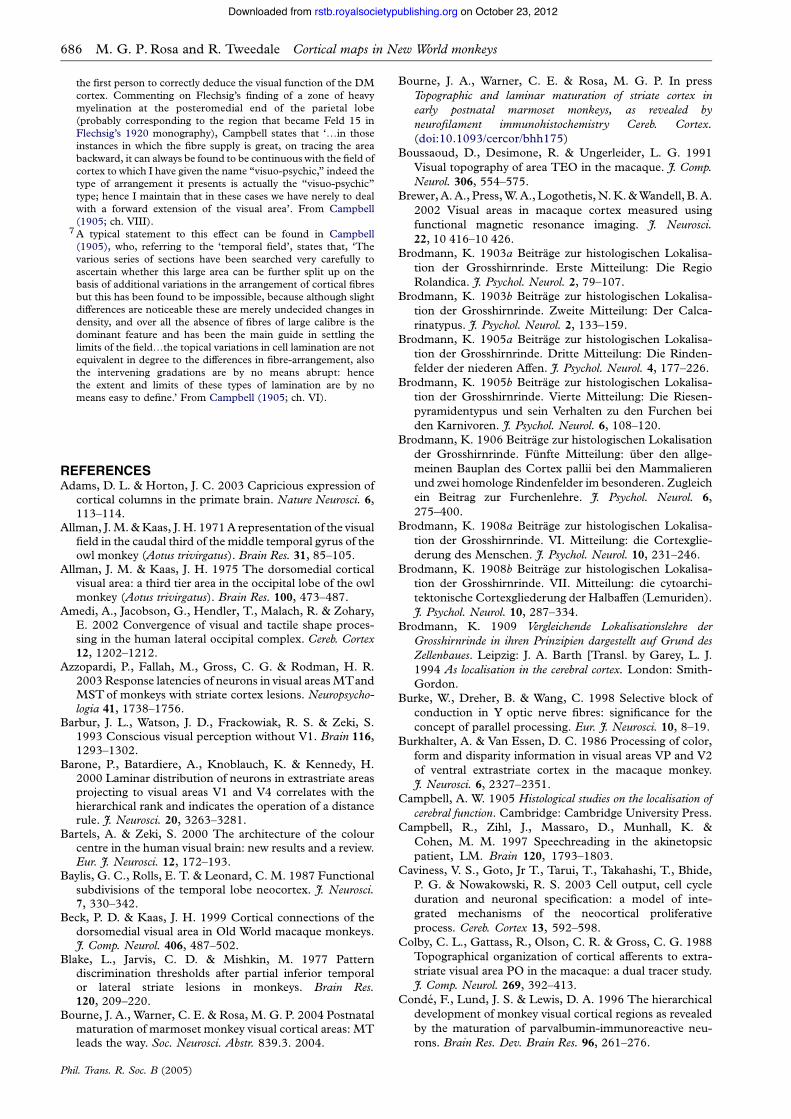
the first person to correctly deduce the visual function of the DMcortex. Commenting on Flechsig’s finding of a zone of heavymyelination at the posteromedial end of the parietal lobe(probably corresponding to the region that became Feld 15 inFlechsig’s 1920 monography), Campbell states that ‘.in thoseinstances in which the fibre supply is great, on tracing the areabackward, it can always be found to be continuous with the field ofcortex to which I have given the name “visuo-psychic,” indeed thetype of arrangement it presents is actually the “visuo-psychic”type; hence I maintain that in these cases we have nerely to dealwith a forward extension of the visual area’. From Campbell(1905; ch. VIII).
7A typical statement to this effect can be found in Campbell(1905), who, referring to the ‘temporal field’, states that, ‘Thevarious series of sections have been searched very carefully toascertain whether this large area can be further split up on thebasis of additional variations in the arrangement of cortical fibresbut this has been found to be impossible, because although slightdifferences are noticeable these are merely undecided changes indensity, and over all the absence of fibres of large calibre is thedominant feature and has been the main guide in settling thelimits of the field.the topical variations in cell lamination are notequivalent in degree to the differences in fibre-arrangement, alsothe intervening gradations are by no means abrupt: hencethe extent and limits of these types of lamination are by nomeans easy to define.’ From Campbell (1905; ch. VI).
REFERENCESAdams, D. L. & Horton, J. C. 2003 Capricious expression of
cortical columns in the primate brain. Nature Neurosci. 6,113–114.
Allman, J.M.&Kaas, J. H. 1971A representation of the visualfield in the caudal third of the middle temporal gyrus of theowl monkey (Aotus trivirgatus). Brain Res. 31, 85–105.
Allman, J. M. & Kaas, J. H. 1975 The dorsomedial corticalvisual area: a third tier area in the occipital lobe of the owlmonkey (Aotus trivirgatus). Brain Res. 100, 473–487.
Amedi, A., Jacobson, G., Hendler, T., Malach, R. & Zohary,E. 2002 Convergence of visual and tactile shape proces-sing in the human lateral occipital complex. Cereb. Cortex12, 1202–1212.
Azzopardi, P., Fallah, M., Gross, C. G. & Rodman, H. R.2003 Response latencies of neurons in visual areasMTandMSTof monkeys with striate cortex lesions. Neuropsycho-logia 41, 1738–1756.
Barbur, J. L., Watson, J. D., Frackowiak, R. S. & Zeki, S.1993 Conscious visual perception without V1. Brain 116,1293–1302.
Barone, P., Batardiere, A., Knoblauch, K. & Kennedy, H.2000 Laminar distribution of neurons in extrastriate areasprojecting to visual areas V1 and V4 correlates with thehierarchical rank and indicates the operation of a distancerule. J. Neurosci. 20, 3263–3281.
Bartels, A. & Zeki, S. 2000 The architecture of the colourcentre in the human visual brain: new results and a review.Eur. J. Neurosci. 12, 172–193.
Baylis, G. C., Rolls, E. T. & Leonard, C. M. 1987 Functionalsubdivisions of the temporal lobe neocortex. J. Neurosci.7, 330–342.
Beck, P. D. & Kaas, J. H. 1999 Cortical connections of thedorsomedial visual area in Old World macaque monkeys.J. Comp. Neurol. 406, 487–502.
Blake, L., Jarvis, C. D. & Mishkin, M. 1977 Patterndiscrimination thresholds after partial inferior temporalor lateral striate lesions in monkeys. Brain Res.120, 209–220.
Bourne, J. A., Warner, C. E. & Rosa, M. G. P. 2004 Postnatalmaturation of marmoset monkey visual cortical areas: MTleads the way. Soc. Neurosci. Abstr. 839.3. 2004.
Bourne, J. A., Warner, C. E. & Rosa, M. G. P. In pressTopographic and laminar maturation of striate cortex inearly postnatal marmoset monkeys, as revealed byneurofilament immunohistochemistry Cereb. Cortex.(doi:10.1093/cercor/bhh175)
Boussaoud, D., Desimone, R. & Ungerleider, L. G. 1991Visual topography of area TEO in the macaque. J. Comp.Neurol. 306, 554–575.
Brewer, A.A., Press,W.A., Logothetis,N.K.&Wandell, B.A.2002 Visual areas in macaque cortex measured usingfunctional magnetic resonance imaging. J. Neurosci.22, 10 416–10 426.
Brodmann, K. 1903a Beitrage zur histologischen Lokalisa-tion der Grosshirnrinde. Erste Mitteilung: Die RegioRolandica. J. Psychol. Neurol. 2, 79–107.
Brodmann, K. 1903b Beitrage zur histologischen Lokalisa-tion der Grosshirnrinde. Zweite Mitteilung: Der Calca-rinatypus. J. Psychol. Neurol. 2, 133–159.
Brodmann, K. 1905a Beitrage zur histologischen Lokalisa-tion der Grosshirnrinde. Dritte Mitteilung: Die Rinden-felder der niederen Affen. J. Psychol. Neurol. 4, 177–226.
Brodmann, K. 1905b Beitrage zur histologischen Lokalisa-tion der Grosshirnrinde. Vierte Mitteilung: Die Riesen-pyramidentypus und sein Verhalten zu den Furchen beiden Karnivoren. J. Psychol. Neurol. 6, 108–120.
Brodmann, K. 1906 Beitrage zur histologischen Lokalisationder Grosshirnrinde. Funfte Mitteilung: uber den allge-meinen Bauplan des Cortex pallii bei den Mammalierenund zwei homologe Rindenfelder im besonderen. Zugleichein Beitrag zur Furchenlehre. J. Psychol. Neurol. 6,275–400.
Brodmann, K. 1908a Beitrage zur histologischen Lokalisa-tion der Grosshirnrinde. VI. Mitteilung: die Cortexglie-derung des Menschen. J. Psychol. Neurol. 10, 231–246.
Brodmann, K. 1908b Beitrage zur histologischen Lokalisa-tion der Grosshirnrinde. VII. Mitteilung: die cytoarchi-tektonische Cortexgliederung der Halbaffen (Lemuriden).J. Psychol. Neurol. 10, 287–334.
Brodmann, K. 1909 Vergleichende Lokalisationslehre derGrosshirnrinde in ihren Prinzipien dargestellt auf Grund desZellenbaues. Leipzig: J. A. Barth [Transl. by Garey, L. J.1994 As localisation in the cerebral cortex. London: Smith-Gordon.
Burke, W., Dreher, B. & Wang, C. 1998 Selective block ofconduction in Y optic nerve fibres: significance for theconcept of parallel processing. Eur. J. Neurosci. 10, 8–19.
Burkhalter, A. & Van Essen, D. C. 1986 Processing of color,form and disparity information in visual areas VP and V2of ventral extrastriate cortex in the macaque monkey.J. Neurosci. 6, 2327–2351.
Campbell, A. W. 1905 Histological studies on the localisation ofcerebral function. Cambridge: Cambridge University Press.
Campbell, R., Zihl, J., Massaro, D., Munhall, K. &Cohen, M. M. 1997 Speechreading in the akinetopsicpatient, LM. Brain 120, 1793–1803.
Caviness, V. S., Goto, Jr T., Tarui, T., Takahashi, T., Bhide,P. G. & Nowakowski, R. S. 2003 Cell output, cell cycleduration and neuronal specification: a model of inte-grated mechanisms of the neocortical proliferativeprocess. Cereb. Cortex 13, 592–598.
Colby, C. L., Gattass, R., Olson, C. R. & Gross, C. G. 1988Topographical organization of cortical afferents to extra-striate visual area PO in the macaque: a dual tracer study.J. Comp. Neurol. 269, 392–413.
Conde, F., Lund, J. S. & Lewis, D. A. 1996 The hierarchicaldevelopment of monkey visual cortical regions as revealedby the maturation of parvalbumin-immunoreactive neu-rons. Brain Res. Dev. Brain Res. 96, 261–276.
686 M. G. P. Rosa and R. Tweedale Cortical maps in New World monkeys
Phil. Trans. R. Soc. B (2005)
on October 23, 2012rstb.royalsocietypublishing.orgDownloaded from
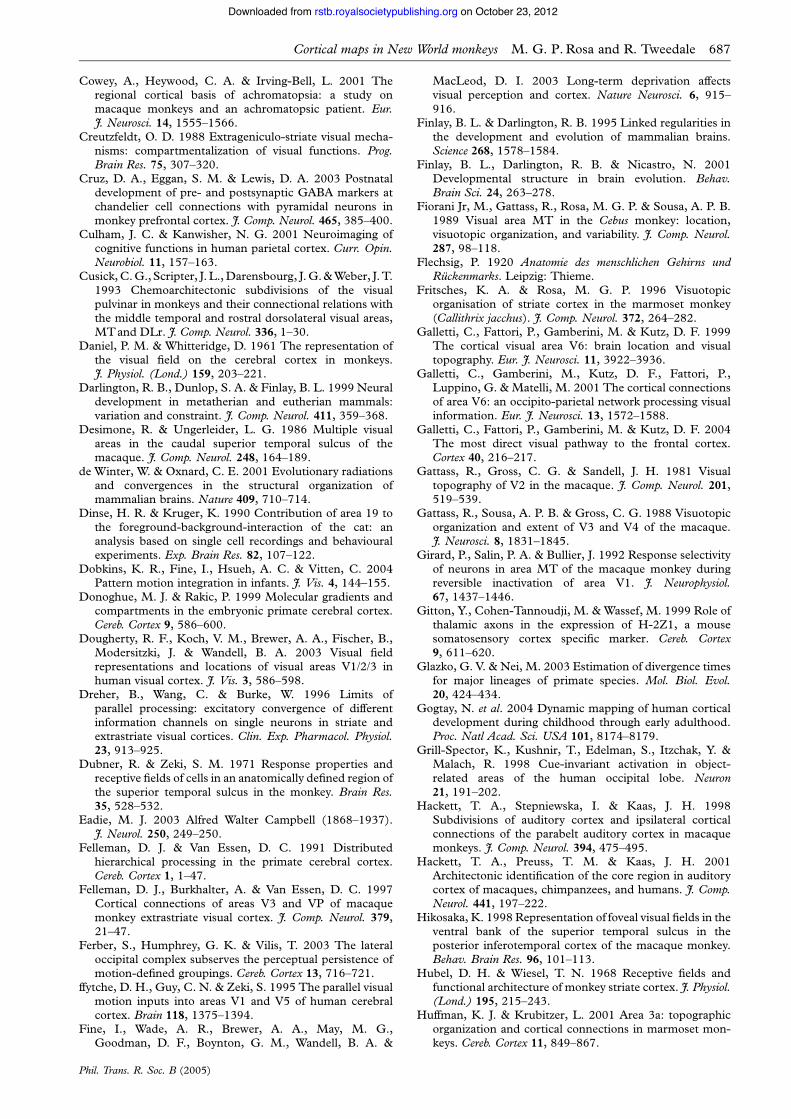
Cowey, A., Heywood, C. A. & Irving-Bell, L. 2001 Theregional cortical basis of achromatopsia: a study onmacaque monkeys and an achromatopsic patient. Eur.J. Neurosci. 14, 1555–1566.
Creutzfeldt, O. D. 1988 Extrageniculo-striate visual mecha-nisms: compartmentalization of visual functions. Prog.Brain Res. 75, 307–320.
Cruz, D. A., Eggan, S. M. & Lewis, D. A. 2003 Postnataldevelopment of pre- and postsynaptic GABA markers atchandelier cell connections with pyramidal neurons inmonkey prefrontal cortex. J. Comp. Neurol. 465, 385–400.
Culham, J. C. & Kanwisher, N. G. 2001 Neuroimaging ofcognitive functions in human parietal cortex. Curr. Opin.Neurobiol. 11, 157–163.
Cusick,C.G.,Scripter, J. L.,Darensbourg, J.G.&Weber, J.T.1993 Chemoarchitectonic subdivisions of the visualpulvinar in monkeys and their connectional relations withthe middle temporal and rostral dorsolateral visual areas,MTand DLr. J. Comp. Neurol. 336, 1–30.
Daniel, P. M. & Whitteridge, D. 1961 The representation ofthe visual field on the cerebral cortex in monkeys.J. Physiol. (Lond.) 159, 203–221.
Darlington, R. B., Dunlop, S. A. & Finlay, B. L. 1999 Neuraldevelopment in metatherian and eutherian mammals:variation and constraint. J. Comp. Neurol. 411, 359–368.
Desimone, R. & Ungerleider, L. G. 1986 Multiple visualareas in the caudal superior temporal sulcus of themacaque. J. Comp. Neurol. 248, 164–189.
de Winter, W. & Oxnard, C. E. 2001 Evolutionary radiationsand convergences in the structural organization ofmammalian brains. Nature 409, 710–714.
Dinse, H. R. & Kruger, K. 1990 Contribution of area 19 tothe foreground-background-interaction of the cat: ananalysis based on single cell recordings and behaviouralexperiments. Exp. Brain Res. 82, 107–122.
Dobkins, K. R., Fine, I., Hsueh, A. C. & Vitten, C. 2004Pattern motion integration in infants. J. Vis. 4, 144–155.
Donoghue, M. J. & Rakic, P. 1999 Molecular gradients andcompartments in the embryonic primate cerebral cortex.Cereb. Cortex 9, 586–600.
Dougherty, R. F., Koch, V. M., Brewer, A. A., Fischer, B.,Modersitzki, J. & Wandell, B. A. 2003 Visual fieldrepresentations and locations of visual areas V1/2/3 inhuman visual cortex. J. Vis. 3, 586–598.
Dreher, B., Wang, C. & Burke, W. 1996 Limits ofparallel processing: excitatory convergence of differentinformation channels on single neurons in striate andextrastriate visual cortices. Clin. Exp. Pharmacol. Physiol.23, 913–925.
Dubner, R. & Zeki, S. M. 1971 Response properties andreceptive fields of cells in an anatomically defined region ofthe superior temporal sulcus in the monkey. Brain Res.35, 528–532.
Eadie, M. J. 2003 Alfred Walter Campbell (1868–1937).J. Neurol. 250, 249–250.
Felleman, D. J. & Van Essen, D. C. 1991 Distributedhierarchical processing in the primate cerebral cortex.Cereb. Cortex 1, 1–47.
Felleman, D. J., Burkhalter, A. & Van Essen, D. C. 1997Cortical connections of areas V3 and VP of macaquemonkey extrastriate visual cortex. J. Comp. Neurol. 379,21–47.
Ferber, S., Humphrey, G. K. & Vilis, T. 2003 The lateraloccipital complex subserves the perceptual persistence ofmotion-defined groupings. Cereb. Cortex 13, 716–721.
ffytche, D. H., Guy, C. N. & Zeki, S. 1995 The parallel visualmotion inputs into areas V1 and V5 of human cerebralcortex. Brain 118, 1375–1394.
Fine, I., Wade, A. R., Brewer, A. A., May, M. G.,Goodman, D. F., Boynton, G. M., Wandell, B. A. &
MacLeod, D. I. 2003 Long-term deprivation affectsvisual perception and cortex. Nature Neurosci. 6, 915–916.
Finlay, B. L. & Darlington, R. B. 1995 Linked regularities inthe development and evolution of mammalian brains.Science 268, 1578–1584.
Finlay, B. L., Darlington, R. B. & Nicastro, N. 2001Developmental structure in brain evolution. Behav.Brain Sci. 24, 263–278.
Fiorani Jr, M., Gattass, R., Rosa, M. G. P. & Sousa, A. P. B.1989 Visual area MT in the Cebus monkey: location,visuotopic organization, and variability. J. Comp. Neurol.287, 98–118.
Flechsig, P. 1920 Anatomie des menschlichen Gehirns undRuckenmarks. Leipzig: Thieme.
Fritsches, K. A. & Rosa, M. G. P. 1996 Visuotopicorganisation of striate cortex in the marmoset monkey(Callithrix jacchus). J. Comp. Neurol. 372, 264–282.
Galletti, C., Fattori, P., Gamberini, M. & Kutz, D. F. 1999The cortical visual area V6: brain location and visualtopography. Eur. J. Neurosci. 11, 3922–3936.
Galletti, C., Gamberini, M., Kutz, D. F., Fattori, P.,Luppino, G. & Matelli, M. 2001 The cortical connectionsof area V6: an occipito-parietal network processing visualinformation. Eur. J. Neurosci. 13, 1572–1588.
Galletti, C., Fattori, P., Gamberini, M. & Kutz, D. F. 2004The most direct visual pathway to the frontal cortex.Cortex 40, 216–217.
Gattass, R., Gross, C. G. & Sandell, J. H. 1981 Visualtopography of V2 in the macaque. J. Comp. Neurol. 201,519–539.
Gattass, R., Sousa, A. P. B. & Gross, C. G. 1988 Visuotopicorganization and extent of V3 and V4 of the macaque.J. Neurosci. 8, 1831–1845.
Girard, P., Salin, P. A. & Bullier, J. 1992 Response selectivityof neurons in area MT of the macaque monkey duringreversible inactivation of area V1. J. Neurophysiol.67, 1437–1446.
Gitton, Y., Cohen-Tannoudji, M. & Wassef, M. 1999 Role ofthalamic axons in the expression of H-2Z1, a mousesomatosensory cortex specific marker. Cereb. Cortex9, 611–620.
Glazko, G. V. & Nei, M. 2003 Estimation of divergence timesfor major lineages of primate species. Mol. Biol. Evol.20, 424–434.
Gogtay, N. et al. 2004 Dynamic mapping of human corticaldevelopment during childhood through early adulthood.Proc. Natl Acad. Sci. USA 101, 8174–8179.
Grill-Spector, K., Kushnir, T., Edelman, S., Itzchak, Y. &Malach, R. 1998 Cue-invariant activation in object-related areas of the human occipital lobe. Neuron21, 191–202.
Hackett, T. A., Stepniewska, I. & Kaas, J. H. 1998Subdivisions of auditory cortex and ipsilateral corticalconnections of the parabelt auditory cortex in macaquemonkeys. J. Comp. Neurol. 394, 475–495.
Hackett, T. A., Preuss, T. M. & Kaas, J. H. 2001Architectonic identification of the core region in auditorycortex of macaques, chimpanzees, and humans. J. Comp.Neurol. 441, 197–222.
Hikosaka, K. 1998 Representation of foveal visual fields in theventral bank of the superior temporal sulcus in theposterior inferotemporal cortex of the macaque monkey.Behav. Brain Res. 96, 101–113.
Hubel, D. H. & Wiesel, T. N. 1968 Receptive fields andfunctional architecture of monkey striate cortex. J. Physiol.(Lond.) 195, 215–243.
Huffman, K. J. & Krubitzer, L. 2001 Area 3a: topographicorganization and cortical connections in marmoset mon-keys. Cereb. Cortex 11, 849–867.
Cortical maps in New World monkeys M. G. P. Rosa and R. Tweedale 687
Phil. Trans. R. Soc. B (2005)
on October 23, 2012rstb.royalsocietypublishing.orgDownloaded from

Huffman, K. J., Nelson, J., Clarey, J. & Krubitzer, L. 1999Organization of somatosensory cortex in three species ofmarsupials, Dasyurus hallucatus, Dactylopsila trivirgata,and Monodelphis domestica: neural correlates of morpho-logical specializations. J. Comp. Neurol. 403, 5–32.
Janssen, P., Vogels, R. & Orban, G. A. 2000 Selectivity for 3Dshape that reveals distinct areas within macaque inferiortemporal cortex. Science 288, 2054–2056.
Kaas, J. 2002 Convergences in the modular and arealorganization of the forebrain of mammals: implicationsfor the reconstruction of forebrain evolution. Brain Behav.Evol. 59, 262–272.
Kaas, J. H. & Catania, K. C. 2002 How do features of sensoryrepresentations develop? Bioessays 24, 334–343.
Kobatake, E. & Tanaka, K. 1994 Neuronal selectivities tocomplex object features in the ventral visual pathway of themacaque cerebral cortex. J. Neurophysiol. 71, 856–867.
Kobayashi, Y. & Amaral, D. G. 2000 Macaque monkeyretrosplenial cortex. I. Three-dimensional and cyto-architectonic organization. J. Comp. Neurol. 426, 339–365.
Kobayashi, Y. & Amaral, D. G. 2003 Macaque monkeyretrosplenial cortex. II. Cortical afferents. J. Comp. Neurol.466, 48–79.
Komatsu, Y., Watakabe, A., Hashikawa, T., Tochitani, S. &Yamamori, T. In press Retinol-binding protein gene ishighly expressed in higher-order association areas of theprimate neocortex. Cereb. Cortex.
Kondo, H., Hashikawa, T., Tanaka, K. & Jones, E. G. 1994Neurochemical gradient along the monkey occipito–temporal cortical pathway. Neuroreport 5, 613–616.
Kornack, D. R. 2000 Neurogenesis and the evolution ofcortical diversity: mode, tempo, and partitioning duringdevelopment and persistence in adulthood. Brain Behav.Evol. 55, 336–344.
Kornack, D. R. & Rakic, P. 1998 Changes in cell-cyclekinetics during the development and evolution of primateneocortex. Proc. Natl Acad. Sci. USA 95, 1242–1246.
Kourtzi, Z., Erb, M., Grodd, W. & Bulthoff, H. H. 2003Representation of the perceived 3-D object shape in thehuman lateral occipital complex.Cereb.Cortex13, 911–920.
Krubitzer, L. A. & Kaas, J. H. 1990a The organization andconnections of somatosensory cortex in marmosets.J. Neurosci. 10, 952–974.
Krubitzer, L. A. & Kaas, J. H. 1990b Cortical connections ofMT in four species of primates: areal, modular, andretinotopic patterns. Vis. Neurosci. 5, 165–204.
Krubitzer, L. A. & Kaas, J. H. 1993 The dorsomedial visualarea of owl monkeys: connections, myeloarchitecture,and homologies in other primates. J. Comp. Neurol. 334,497–528.
Kuypers, H. G., Szwarcbart, M. K., Mishkin, M. & Rosvold,H. E. 1965 Occipitotemporal corticocortical connectionsin the rhesus monkey. Exp. Neurol. 11, 245–262.
Le Gros Clark, W. E. 1959 The antecedents of man: anintroduction to the evolution of the primates. Edinburgh:Edinburgh University Press.
Levitt, P. 1984 A monoclonal antibody to limbic systemneurons. Science 223, 299–301.
Lewis, J. W. & Van Essen, D. C. 2000 Mapping ofarchitectonic subdivisions in the macaque monkey, withemphasis on parieto–occipital cortex. J. Comp. Neurol.428, 79–111.
Lin, C. S., Weller, R. E. & Kaas, J. H. 1982 Corticalconnections of striate cortex in the owl monkey. J. Comp.Neurol. 211, 165–176.
Luethke, L. E., Krubitzer, L. A. & Kaas, J. H. 1989Connections of primary auditory cortex in the NewWorld monkey, Saguinus. J. Comp. Neurol. 285, 487–513.
Lyon, D. C. & Kaas, J. H. 2001 Connectional and
architectonic evidence for dorsal and ventral V3, anddorsomedial area in marmoset monkeys. J. Neurosci.21, 249–261.
Lyon, D. C. & Kaas, J. H. 2002 Evidence from V1connections for both dorsal and ventral subdivisions ofV3 in three species of New World monkeys. J. Comp.Neurol. 449, 281–297.
Maguire, W. M. & Baizer, J. S. 1984 Visuotopic organizationof the prelunate gyrus in rhesus monkey. J. Neurosci.4, 1690–1704.
Manger, P. R., Masiello, I. & Innocenti, G. M. 2002 Arealorganization of the posterior parietal cortex of the ferret(Mustela putorius). Cereb. Cortex 12, 1280–1297.
Markstahler, U., Bach, M. & Spatz, W. B. 1998 Transientmolecular visualization of ocular dominance columns(ODCs) in normal adult marmosets despite the deseg-regated termination of the retino–geniculo–cortical path-ways. J. Comp. Neurol. 393, 118–134.
Maxeiner, S., Kruger, O., Schilling, K., Traub, O., Urschel,S. & Willecke, K. 2003 Spatiotemporal transcription ofconnexin45 during brain development results in neuronalexpression in adult mice. Neuroscience 119, 689–700.
Molnar, Z., Adams, R. & Blakemore, C. 1998 Mechanismsunderlying the early establishment of thalamocorticalconnections in the rat. J. Neurosci. 18, 5723–5745.
Montoro, R. J. & Yuste, R. In press Gap junctions indeveloping neocortex: a review. Brain Res. Brain Res. Rev.
Nakamura, H., Le, W. R., Wakita, M., Mikami, A. & Itoh, K.2004 Projections from the cytochrome oxidase modules ofvisual area V2 to the ventral posterior area in the macaque.Exp. Brain Res. 155, 102–110.
Newsome, W. T., Maunsell, J. H. & Van Essen, D. C. 1986Ventral posterior visual area of the macaque: visualtopography and areal boundaries. J. Comp. Neurol. 252,139–153.
O’Brien, B. J., Abel, P. L. & Olavarria, J. F. 2001 The retinalinput to calbindin-D28k-defined subdivisions in macaqueinferior pulvinar. Neurosci. Lett. 312, 145–148.
O’Leary, D. D., Yates, P. A. & McLaughlin, T. 1999Molecular development of sensory maps: representingsights and smells in the brain. Cell 96, 255–269.
Padberg, J., Seltzer, B. & Cusick, C. G. 2003 Architectonicsand cortical connections of the upper bank of the superiortemporal sulcus in the rhesus monkey: an analysis in thetangential plane. J. Comp. Neurol. 467, 418–434.
Palmer, L. A., Rosenquist, A. C. & Tusa, R. J. 1978 Theretinotopic organization of lateral suprasylvian visual areasin the cat. J. Comp. Neurol. 177, 237–256.
Pandya, D. N. & Yeterian, E. H. 1996 Comparison ofprefrontal architecture and connections. Phil. Trans. R.Soc. B 351, 1423–1432.
Paolini, M. & Sereno, M. I. 1998 Direction selectivity in themiddle lateral and lateral (ML and L) visual areas in theCalifornia ground squirrel. Cereb. Cortex 8, 362–371.
Payne, B. R. 1993 Evidence for visual cortical area homologsin cat and macaque monkey. Cereb. Cortex 3, 1–25.
Petrides, M. & Pandya, D. N. 1999 Dorsolateral prefrontalcortex: comparative cytoarchitectonic analysis in thehuman and the macaque brain and corticocortical con-nection patterns. Eur. J. Neurosci. 11, 1011–1036.
Petrides, M. & Pandya, D. N. 2002 Comparative cytoarchi-tectonic analysis of the human and the macaque ventro-lateral prefrontal cortex and corticocortical connectionpatterns in the monkey. Eur. J. Neurosci. 16, 291–310.
Pimenta, A. F., Reinoso, B. S. & Levitt, P. 1996 Expression ofthe mRNAs encoding the limbic system-associated mem-brane protein (LAMP). II. Fetal rat brain. J. Comp. Neurol.375, 289–302.
688 M. G. P. Rosa and R. Tweedale Cortical maps in New World monkeys
Phil. Trans. R. Soc. B (2005)
on October 23, 2012rstb.royalsocietypublishing.orgDownloaded from
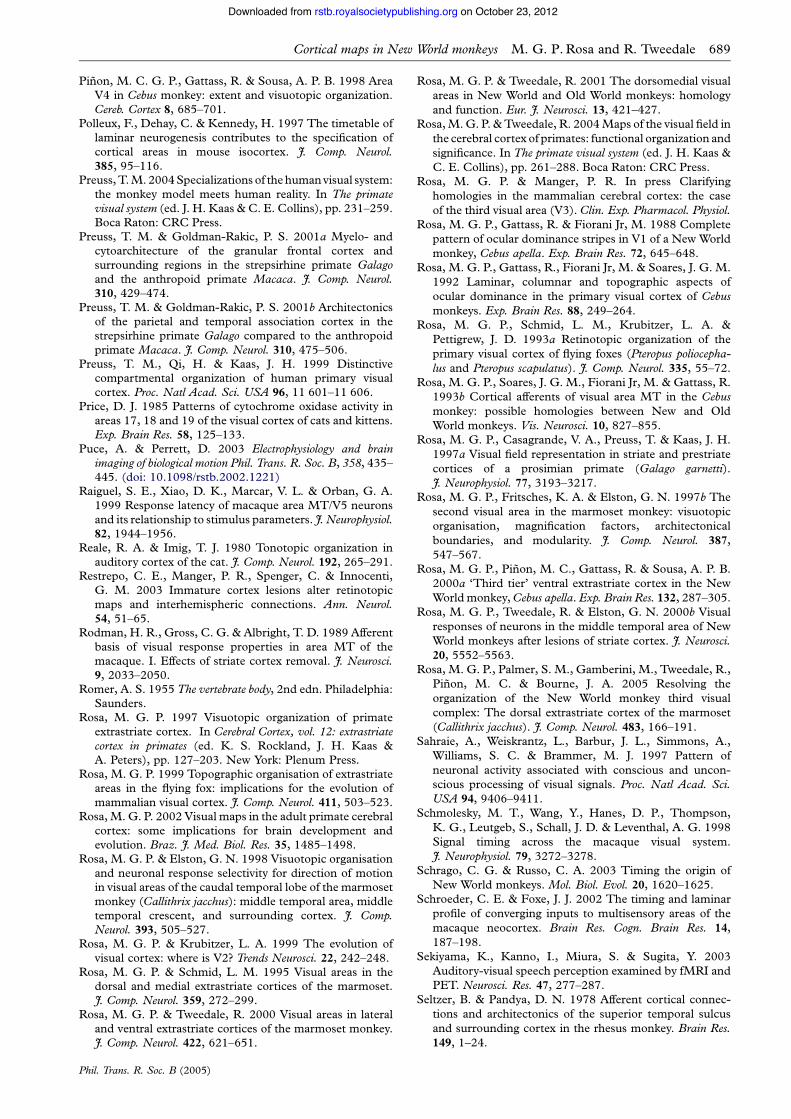
Pinon, M. C. G. P., Gattass, R. & Sousa, A. P. B. 1998 AreaV4 in Cebus monkey: extent and visuotopic organization.Cereb. Cortex 8, 685–701.
Polleux, F., Dehay, C. & Kennedy, H. 1997 The timetable oflaminar neurogenesis contributes to the specification ofcortical areas in mouse isocortex. J. Comp. Neurol.385, 95–116.
Preuss,T.M.2004Specializations of the humanvisual system:the monkey model meets human reality. In The primatevisual system (ed. J. H. Kaas &C. E. Collins), pp. 231–259.Boca Raton: CRC Press.
Preuss, T. M. & Goldman-Rakic, P. S. 2001a Myelo- andcytoarchitecture of the granular frontal cortex andsurrounding regions in the strepsirhine primate Galagoand the anthropoid primate Macaca. J. Comp. Neurol.310, 429–474.
Preuss, T. M. & Goldman-Rakic, P. S. 2001b Architectonicsof the parietal and temporal association cortex in thestrepsirhine primate Galago compared to the anthropoidprimate Macaca. J. Comp. Neurol. 310, 475–506.
Preuss, T. M., Qi, H. & Kaas, J. H. 1999 Distinctivecompartmental organization of human primary visualcortex. Proc. Natl Acad. Sci. USA 96, 11 601–11 606.
Price, D. J. 1985 Patterns of cytochrome oxidase activity inareas 17, 18 and 19 of the visual cortex of cats and kittens.Exp. Brain Res. 58, 125–133.
Puce, A. & Perrett, D. 2003 Electrophysiology and brainimaging of biological motion Phil. Trans. R. Soc. B, 358, 435–445. (doi: 10.1098/rstb.2002.1221)
Raiguel, S. E., Xiao, D. K., Marcar, V. L. & Orban, G. A.1999 Response latency of macaque area MT/V5 neuronsand its relationship to stimulus parameters. J. Neurophysiol.82, 1944–1956.
Reale, R. A. & Imig, T. J. 1980 Tonotopic organization inauditory cortex of the cat. J. Comp. Neurol. 192, 265–291.
Restrepo, C. E., Manger, P. R., Spenger, C. & Innocenti,G. M. 2003 Immature cortex lesions alter retinotopicmaps and interhemispheric connections. Ann. Neurol.54, 51–65.
Rodman, H. R., Gross, C. G. & Albright, T. D. 1989 Afferentbasis of visual response properties in area MT of themacaque. I. Effects of striate cortex removal. J. Neurosci.9, 2033–2050.
Romer, A. S. 1955 The vertebrate body, 2nd edn. Philadelphia:Saunders.
Rosa, M. G. P. 1997 Visuotopic organization of primateextrastriate cortex. In Cerebral Cortex, vol. 12: extrastriatecortex in primates (ed. K. S. Rockland, J. H. Kaas &A. Peters), pp. 127–203. New York: Plenum Press.
Rosa, M. G. P. 1999 Topographic organisation of extrastriateareas in the flying fox: implications for the evolution ofmammalian visual cortex. J. Comp. Neurol. 411, 503–523.
Rosa,M. G. P. 2002 Visual maps in the adult primate cerebralcortex: some implications for brain development andevolution. Braz. J. Med. Biol. Res. 35, 1485–1498.
Rosa, M. G. P. & Elston, G. N. 1998 Visuotopic organisationand neuronal response selectivity for direction of motionin visual areas of the caudal temporal lobe of the marmosetmonkey (Callithrix jacchus): middle temporal area, middletemporal crescent, and surrounding cortex. J. Comp.Neurol. 393, 505–527.
Rosa, M. G. P. & Krubitzer, L. A. 1999 The evolution ofvisual cortex: where is V2? Trends Neurosci. 22, 242–248.
Rosa, M. G. P. & Schmid, L. M. 1995 Visual areas in thedorsal and medial extrastriate cortices of the marmoset.J. Comp. Neurol. 359, 272–299.
Rosa, M. G. P. & Tweedale, R. 2000 Visual areas in lateraland ventral extrastriate cortices of the marmoset monkey.J. Comp. Neurol. 422, 621–651.
Rosa, M. G. P. & Tweedale, R. 2001 The dorsomedial visualareas in New World and Old World monkeys: homologyand function. Eur. J. Neurosci. 13, 421–427.
Rosa,M.G. P. &Tweedale, R. 2004Maps of the visual field inthe cerebral cortex of primates: functional organization andsignificance. In The primate visual system (ed. J. H. Kaas &C. E. Collins), pp. 261–288. Boca Raton: CRC Press.
Rosa, M. G. P. & Manger, P. R. In press Clarifyinghomologies in the mammalian cerebral cortex: the caseof the third visual area (V3). Clin. Exp. Pharmacol. Physiol.
Rosa, M. G. P., Gattass, R. & Fiorani Jr, M. 1988 Completepattern of ocular dominance stripes in V1 of a New Worldmonkey, Cebus apella. Exp. Brain Res. 72, 645–648.
Rosa, M. G. P., Gattass, R., Fiorani Jr, M. & Soares, J. G. M.1992 Laminar, columnar and topographic aspects ofocular dominance in the primary visual cortex of Cebusmonkeys. Exp. Brain Res. 88, 249–264.
Rosa, M. G. P., Schmid, L. M., Krubitzer, L. A. &Pettigrew, J. D. 1993a Retinotopic organization of theprimary visual cortex of flying foxes (Pteropus poliocepha-lus and Pteropus scapulatus). J. Comp. Neurol. 335, 55–72.
Rosa, M. G. P., Soares, J. G. M., Fiorani Jr, M. & Gattass, R.1993b Cortical afferents of visual area MT in the Cebusmonkey: possible homologies between New and OldWorld monkeys. Vis. Neurosci. 10, 827–855.
Rosa, M. G. P., Casagrande, V. A., Preuss, T. & Kaas, J. H.1997a Visual field representation in striate and prestriatecortices of a prosimian primate (Galago garnetti).J. Neurophysiol. 77, 3193–3217.
Rosa, M. G. P., Fritsches, K. A. & Elston, G. N. 1997b Thesecond visual area in the marmoset monkey: visuotopicorganisation, magnification factors, architectonicalboundaries, and modularity. J. Comp. Neurol. 387,547–567.
Rosa, M. G. P., Pinon, M. C., Gattass, R. & Sousa, A. P. B.2000a ‘Third tier’ ventral extrastriate cortex in the NewWorldmonkey,Cebus apella. Exp. Brain Res. 132, 287–305.
Rosa, M. G. P., Tweedale, R. & Elston, G. N. 2000b Visualresponses of neurons in the middle temporal area of NewWorld monkeys after lesions of striate cortex. J. Neurosci.20, 5552–5563.
Rosa, M. G. P., Palmer, S. M., Gamberini, M., Tweedale, R.,Pinon, M. C. & Bourne, J. A. 2005 Resolving theorganization of the New World monkey third visualcomplex: The dorsal extrastriate cortex of the marmoset(Callithrix jacchus). J. Comp. Neurol. 483, 166–191.
Sahraie, A., Weiskrantz, L., Barbur, J. L., Simmons, A.,Williams, S. C. & Brammer, M. J. 1997 Pattern ofneuronal activity associated with conscious and uncon-scious processing of visual signals. Proc. Natl Acad. Sci.USA 94, 9406–9411.
Schmolesky, M. T., Wang, Y., Hanes, D. P., Thompson,K. G., Leutgeb, S., Schall, J. D. & Leventhal, A. G. 1998Signal timing across the macaque visual system.J. Neurophysiol. 79, 3272–3278.
Schrago, C. G. & Russo, C. A. 2003 Timing the origin ofNew World monkeys. Mol. Biol. Evol. 20, 1620–1625.
Schroeder, C. E. & Foxe, J. J. 2002 The timing and laminarprofile of converging inputs to multisensory areas of themacaque neocortex. Brain Res. Cogn. Brain Res. 14,187–198.
Sekiyama, K., Kanno, I., Miura, S. & Sugita, Y. 2003Auditory-visual speech perception examined by fMRI andPET. Neurosci. Res. 47, 277–287.
Seltzer, B. & Pandya, D. N. 1978 Afferent cortical connec-tions and architectonics of the superior temporal sulcusand surrounding cortex in the rhesus monkey. Brain Res.149, 1–24.
Cortical maps in New World monkeys M. G. P. Rosa and R. Tweedale 689
Phil. Trans. R. Soc. B (2005)
on October 23, 2012rstb.royalsocietypublishing.orgDownloaded from
Seltzer, B. & Pandya, D. N. 1989 Intrinsic connections andarchitectonics of the superior temporal sulcus in the rhesusmonkey. J. Comp. Neurol. 290, 451–471.
Sereno, M. I. 1998 Brain mapping in animals and humans.Curr. Opin. Neurobiol. 8, 188–194.
Sereno, M. I., McDonald, C. T. & Allman, J. M. 1994Analysis of retinotopic maps in extrastriate cortex. Cereb.Cortex 4, 601–620.
Sereno, M. I., Dale, A. M., Reppas, J. B., Kwong, K. K.,Belliveau, J. W., Brady, T. J., Rosen, B. R. & Tootell,R. B. H. 1995 Borders of multiple visual areas in humansrevealed by functional magnetic resonance imaging.Science 268, 889–893.
Sherk, H. & Mulligan, K. A. 1993 A reassessment of thelower visual field map in striate-recipient lateral supra-sylvian cortex. Vis. Neurosci. 10, 131–158.
Shipp, S., Blanton, M. & Zeki, S. 1998 A visuo-somatomotorpathway through superior parietal cortex in the macaquemonkey: cortical connections of areas V6 and V6A. Eur.J. Neurosci. 10, 3171–3193.
Sincich, L. C., Adams, D. L. & Horton, J. C. 2003 Completeflatmounting of the macaque cerebral cortex. Vis. Neuro-sci. 20, 663–686.
Smart, I. H., Dehay, C., Giroud, P., Berland, M. & Kennedy,H. 2002 Unique morphological features of the prolifera-tive zones and postmitotic compartments of the neuralepithelium giving rise to striate and extrastriate cortex inthe monkey. Cereb. Cortex 12, 37–53.
Stanley, D. A. & Rubin, N. 2003 fMRI activation in responseto illusory contours and salient regions in the humanlateral occipital complex. Neuron 37, 323–331.
Stepniewska, I. & Kaas, J. H. 1996 Topographic patterns ofV2 cortical connections in macaque monkeys. J. Comp.Neurol. 371, 129–152.
Striedter, G. F. 1998 Stepping into the same river twice:homologues as recurring attractors in epigenetic land-scapes. Brain Behav. Evol. 52, 218–231.
Suzuki, W. A. & Amaral, D. G. 2003 Perirhinal andparahippocampal cortices of the macaque monkey:cytoarchitectonic and chemoarchitectonic organization.J. Comp. Neurol. 463, 67–91.
Suzuki, W., Saleem, K. S. & Tanaka, K. 2000 Divergentbackward projections from the anterior part of theinferotemporal cortex (area TE) in the macaque.J. Comp. Neurol. 422, 206–228.
Tamura, H. & Tanaka, K. 2001 Visual response properties ofcells in the ventral and dorsal parts of the macaqueinferotemporal cortex. Cereb. Cortex 11, 384–399.
Tanaka, K., Ohzawa, I., Ramoa, A. S. & Freeman, R. D. 1987Receptive field properties of cells in area 19 of the cat. Exp.Brain Res. 65, 549–558.
Tootell, R. B. H. & Hadjikhani, N. 2001 Where is ‘dorsal V4’in human visual cortex? Retinotopic, topographic andfunctional evidence. Cereb. Cortex 11, 298–311.
Tootell, R. B. H., Hamilton, S. L. & Silverman, M. S. 1985Topography of cytochrome oxidase activity in owl monkeycortex. J. Neurosci. 5, 2786–2800.
Tootell, R. B. H., Mendola, J. D., Hadjikhani, N. K.,Liu, A. K. & Dale, A. M. 1998 The representation ofthe ipsilateral visual field in human cerebral cortex.Proc. Natl Acad. Sci. USA 95, 818–824.
Tootell, R. B. H., Tsao, D. & Vanduffel, W. 2003 Neuroima-ging weighs in: humans meet macaques in ‘primate’ visualcortex. J. Neurosci. 23, 3981–3989.
Vanderhaeghen, P., Lu, Q., Prakash, N., Frisen, J.,Walsh, C. A., Frostig, R. D. & Flanagan, J. G.2000 A mapping label required for normal scale ofbody representation in the cortex. Nature Neurosci. 3,358–365.
Van Essen, D. C. 2004 Organization of visual areas inmacaque and human cerebral cortex. In The visualneurosciences (ed. L. Chalupa & J. S. Werner), pp. 507–521. Cambridge, MA: MIT Press.
Van Essen, D. C. & Maunsell, J. H. 1980 Two-dimensionalmaps of the cerebral cortex. J. Comp. Neurol. 191,255–281.
Van Essen, D. C. & Zeki, S. M. 1978 The topographicorganization of rhesus monkey prestriate cortex. J. Physiol.(Lond.) 277, 193–226.
Van Essen, D. C., Newsome, W. T., Maunsell, J. H. &Bixby, J. L. 1986 The projections from striate cortex(V1) to areas V2 and V3 in the macaque monkey:asymmetries, areal boundaries, and patchy connections.J. Comp. Neurol. 244, 451–480.
Van Essen, D. C., Lewis, J. W., Drury, H. A., Hadjikhani, N.,Tootell, R. B. H., Bakircioglu, M. & Miller, M. I. 2001Mapping visual cortex in monkeys and humans usingsurface-based atlases. Vis. Res. 41, 1359–1378.
Vezoli, J., Falchier, A., Jouve, B., Knoblauch, K., Young,M.&Kennedy, H. 2004 Quantitative analysis of connectivity inthe visual cortex: extracting function from structure.Neuroscientist 10, 476–482.
Vogt-Weisenhorn, D. M., Illing, R. B. & Spatz, W. B. 1995Morphology and connections of neurons in area 17projecting to the extrastriate areas MT and 19DM andto the superior colliculus in the monkey Callithrix jacchus.J. Comp. Neurol. 362, 233–255.
Von Bonin, G. 1970 Walter Campbell (1868–1937). In Thefounders of neurology (ed. W. Haymaker & F. Schiller),pp. 102–104. Springfield: Thomas.
Von Bonin, G. & Bailey, P. 1947 The neocortex of Macacamulatta. Urbana: University of Illinois Press.
Waleszczyk, W. J., Wang, C., Young, J. M., Burke, W.,Calford, M. B. & Dreher, B. 2003 Laminar differences inplasticity in area 17 following retinal lesions in kittens oradult cats. Eur. J. Neurosci. 17, 2351–2368.
Watson, J. D., Myers, R., Frackowiak, R. S., Hajnal, J. V.,Woods, R. P., Mazziotta, J. C., Shipp, S. & Zeki, S. 1993Area V5 of the human brain: evidence from a combinedstudy using positron emission tomography and magneticresonance imaging. Cereb. Cortex 3, 79–94.
Weller, R. E. & Steele, G. E. 1992 Cortical connections ofsubdivisions of inferior temporal cortex in squirrelmonkeys. J. Comp. Neurol. 324, 37–66.
Weller, R. E., Steele, G. E. & Cusick, C. G. 1991 Corticalconnections of dorsal cortex rostral to V II in squirrelmonkeys. J. Comp. Neurol. 306, 521–537.
Willshaw, D. J. & von der Malsburg, C. 1976 How patternedneural connections can be set up by self-organization.Proc. R. Soc. B 194, 431–445.
Woo, T. U., Pucak, M. L., Kye, C. H., Matus, C. V. &Lewis, D. A. 1997 Peripubertal refinement of theintrinsic and associational circuitry in monkey prefrontalcortex. Neuroscience 80, 1149–1158.
Xu, L., Tanigawa, H. & Fujita, I. 2003 Distribution ofalpha-amino-3-hydroxy-5-methyl-4-isoxazolepropionate-type glutamate receptor subunits (GluR2/3) along theventral visual pathway in the monkey. J. Comp. Neurol.456, 396–407.
Xu, X., Collins, C. E., Kaskan, P. M., Khaytin, I.,Kaas, J. H. & Casagrande, V. A. 2004 Opticalimaging of visually evoked responses in prosimianprimates reveals conserved features of the middletemporal visual area. Proc. Natl Acad. Sci. USA 101,2566–2571.
Youakim, M., Bender, D. B. & Baizer, J. S. 2001 Verticalmeridian representation on the prelunate gyrus in area V4of macaque. Brain Res. Bull. 56, 93–100.
690 M. G. P. Rosa and R. Tweedale Cortical maps in New World monkeys
Phil. Trans. R. Soc. B (2005)
on October 23, 2012rstb.royalsocietypublishing.orgDownloaded from

Zeki, S. M. 1969 Representation of central visual fields inprestriate cortex of monkey. Brain Res. 14, 271–291.
Zeki, S. M. 1978 The third visual complex of rhesusmonkey prestriate cortex. J. Physiol. 277, 245–272.
Zeki, S. M. 1983 The distribution of wavelength andorientation selective cells in different areas of monkeyvisual cortex. Proc. R. Soc. B 217, 449–470.
Zeki, S. & ffytche, D.H. 1998TheRiddoch syndrome: insightsinto the neurobiology of conscious vision.Brain 121, 25–45.
GLOSSARYDM: dorsomedial areaMT: middle temporal area
Cortical maps in New World monkeys M. G. P. Rosa and R. Tweedale 691
Phil. Trans. R. Soc. B (2005)
on October 23, 2012rstb.royalsocietypublishing.orgDownloaded from