Embed Size (px)
Citation preview

Analysts: Sajid Huq
[email protected] Farjad Siddiqui
Moderate Profit Growth Expected amid Banking Sector Downturn We forecast BRAC Bank Limited (BBL) Loan & Advance (L&A) will grow
18% YoY and deposits will grow 21% YoY in 2011. We further expect
2011-LDR of 86%, lower than 2010-level of 98%. LDR is expected to fall
owing to 2011E multi-year high deposits growth rate (GR) driven by a
slowing stock market as well as significant M2 GR contraction. We
anticipate 2011 net interest margin (NIM) of 4.86% and interest rate
spread (IRS) of 5.07%.
BBL has the largest SME operation in the industry and thus basic
business model is SME oriented. BBL is continually searching for
diversifying its business to protect profitability in future competition–
bKash and ELDORADO are such initiatives.
As a non-PD, BBL is not expected to be substantially affected by 2011
government borrowing. However, increased Statutory Liquidity Reserve
(SLR) requirements since December 2010 are expected to raise BBL’s
treasury investments by 20%. BBL’s aggregate yield from treasuries
(including capital gains) is 18%. We expect investment income from
treasury securities GR of 56.47% YoY in 2011 on booking of trading
profit from ‘held-for-trade’ (HFT) and ‘available-for-sale’ treasury bonds.
BBL secured 4th position in total inward remittance market share among
all the domestic private commercial banks (PCBs) and 7th position
among all the domestic banks in 2011. We estimate 2011 commission &
fees income GR of 15% YoY, decline from 2010 GR of 22% YoY
considering significant fall in income from merchant bank-brokerage
subsidiaries.
On set of high inflation and decline in IRS income whereas a 44% market
correction eroded portfolio gains from 2010 DGEN appreciation of nearly
83%. We estimate 2011 EPS to be BDT 6.95, against BDT 6.28 in 2010,
10.7% higher YoY, but lower than 4-Year average GR of 58.61%.
Last but not least, worth noting that BBL has lower P/E ratio and higher
ROE than most leading banks in other frontier markets (e.g., Sri Lanka,
and Oman). Comparative price multiples and trading liquidity are
illustrated in enclosed report for select frontier market banks via scatter
plot.
Rating: We estimate EPS of BDT 8.70 and BVPS of BDT 31.00 for the
year ending December 2012, and set a target price of BDT 52.00 per
share with an OUTPERFORM rating. This implies a 35.50% price return
on current share price of BDT 38.20 (as on 14h February 2012).
BRAC Bank Ltd DSE: BRACBANK Bloomberg: BRAC:BD
Rating: Outperform Dec-2012 Fair Value Estimate: BDT 52 per share
February 14, 2012
Sources: Company Annual Report, BRAC EPL Research
Price performance of BBL in last 12 months
Sources: Dhaka Stock Exchange
Revenue BDT MM 2010 2011E 2012E
Net Interest Income 5,141.6 4,772.4 6,582.6
Investment Income 2,259.3 2,530.8 2,369.5
Commissions Income 2,771.3 3,187.0 3,760.6
Other income 227.3 262.3 346.2
Total revenue 10,399.5 10,752.4 13,058.9
Other Key Indica-
tors (%) 2010 2011E 2012E
Int. Rate Spread % 6.94% 5.75% 6.75%
NIM % 6.36% 4.86% 5.61%
Cost-to-Income 46.93% 53.00% 49.00% NPL 5.85% 5.60%
Margin and effi-
ciency (%) 2010 2011E 2012E
Operating efficiency 46.93% 53.00% 49.00%
Loan/Deposit 98.21% 85.73% 83.67%
ROE 21.39% 22.99% 29.38%
ROA 1.91% 1.72% 1.78%
Company Summary
Ticker BRACBANK Sector Bank Date of Operation Inception 4-Jul-01 Date of Listing 28-Jan-07 Financial Year End December Number of Shares (mn) 321.13 Current Market Capitalization (BDT bn) 12.23 DSE Market Capitalization (BDT bn) 2,235.80 % of DSE Market Capitalization 0.55% 52 Week High (BDT) 650 52 Week Low (BDT) 30.2 YTD Return (%) -17.00% 52 Week Average Volume Traded (BDT mn) 28.5 Trailing EPS (BDT) 6.28 Trailing P/E ratio (x) 6.71
.0
70.0
140.0
210.0
280.0
350.0
420.0
20
30
40
50
60
70
80
Tu
rno
ve
r, B
DT
MM
Pri
ce,
BD
T
Turnover Price

BRAC Bank Ltd (DSE: BRACBANK; Bloomberg: BRAC:BD)
2
Growth in Loans and Advances (L&A) We estimate BRAC Bank Ltd (BBL) 2011 L&A growth rate (GR) of 18% YoY,
lower than 2010 L&A GR of 35% YoY, and 4-year L&A CAGR of 42%, on 2H11
M2 GR of -5.2% (21.3% to 19.6% June-Nov11) driven by inflationary pressures
and FX depreciation. Bangladesh Bank (BB) raised repo rates multiple times,
restricted loan-deposit ratio (LDR) to 90% and allowed large loans very
selectively. Mandate by BB to domestic private banks is to enable large loans to
agriculture, SME, and export-oriented sectors, but restrict them in case of
capital markets, real estate, and retail sectors.
M2 GR fell in March-Sep11 nearing BB’s FY12 year-end target of 18%. We
anticipate an M2 GR lower than BB-target, as BB tries to mitigate the
inflationary effect of a BoP deficit and FX depreciation. Government borrowing
is likely to drop in 1H12 with its impact becoming clearer in 2H12—on upward
revision of energy prices.
BBL ensures diversified geographical reach in SME loan disbursement via wide distribution channel. Network of 81 branches are complemented by 22 SME Service Centers, 48 SME/Krishi Branches, and 405 SME Unit offices across the country.
Figure 1: BBL L&A Growth
Figure 2: BBL L&A Composition
Sources: Company Annual Report, BRAC EPL Research
Sources: Company Annual Report (As on 4Q10)
66%62%
22%
35%
18%
0%
10%
20%
30%
40%
50%
60%
70%
0
20,000
40,000
60,000
80,000
100,000
120,000
2007 2008 2009 2010 2011E
GR
(Y
oY
)
L&
A (B
DT
MM
)
L&A (BDT MM) GR (YoY)
Overdraft2%
Demand loan
20%
Term loans24%
Lease Receivable
1%
SME50%
Credit Cards
2%
Staff Loan1%
Bills0.3%
BRAC Bank Ltd (DSE: BRACBANK; Bloomberg: BRAC:BD)
3
SME is expected to be the key future growth driver of the bank (BBL) and
domestic economy as well. SME has been ignored for years but domestic
banks have started to add more focus. It can give a thrust to the banks at the
moment when there is a declining demand from big clients. BBL’s years long
SME focused business tactics, strategically located SME centers and employee
expertise to serve SME clients are expected to shape the bank’s future
success.
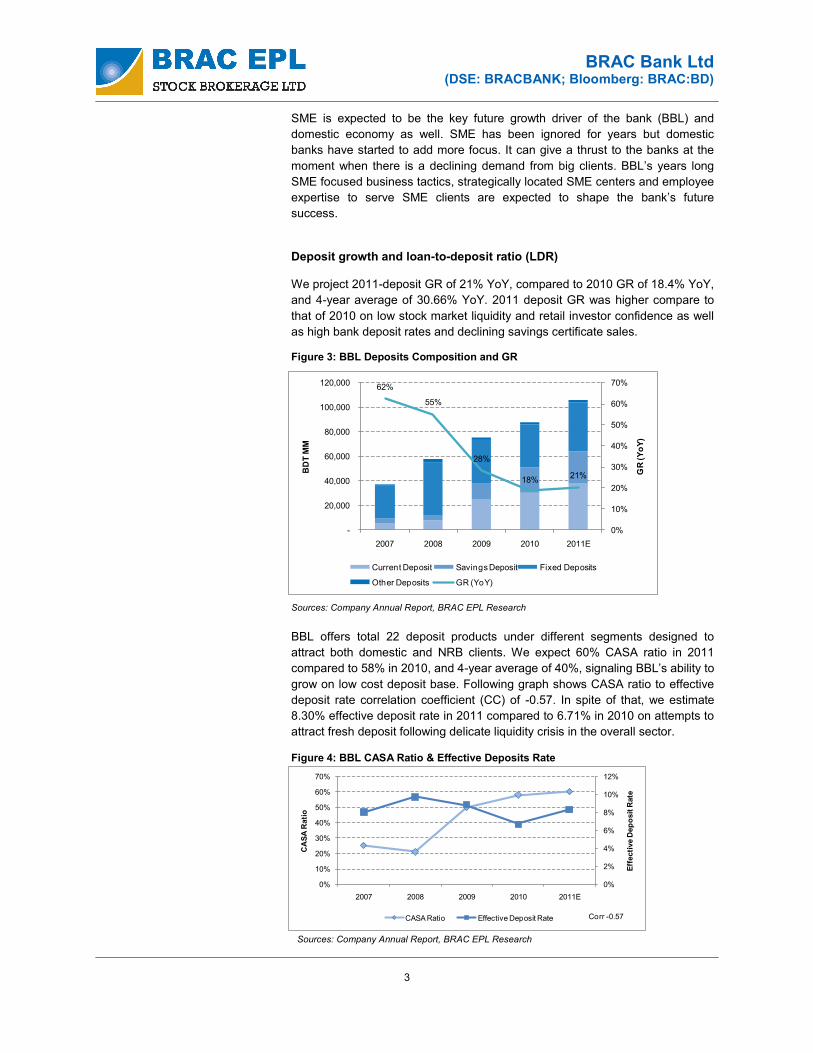
Deposit growth and loan-to-deposit ratio (LDR) We project 2011-deposit GR of 21% YoY, compared to 2010 GR of 18.4% YoY,
and 4-year average of 30.66% YoY. 2011 deposit GR was higher compare to
that of 2010 on low stock market liquidity and retail investor confidence as well
as high bank deposit rates and declining savings certificate sales.
BBL offers total 22 deposit products under different segments designed to
attract both domestic and NRB clients. We expect 60% CASA ratio in 2011
compared to 58% in 2010, and 4-year average of 40%, signaling BBL’s ability to
grow on low cost deposit base. Following graph shows CASA ratio to effective
deposit rate correlation coefficient (CC) of -0.57. In spite of that, we estimate
8.30% effective deposit rate in 2011 compared to 6.71% in 2010 on attempts to
attract fresh deposit following delicate liquidity crisis in the overall sector.
Figure 3: BBL Deposits Composition and GR
Sources: Company Annual Report, BRAC EPL Research
Figure 4: BBL CASA Ratio & Effective Deposits Rate
Sources: Company Annual Report, BRAC EPL Research
62%
55%
28%
18%21%
0%
10%
20%
30%
40%
50%
60%
70%
-
20,000
40,000
60,000
80,000
100,000
120,000
2007 2008 2009 2010 2011E
GR
(Y
oY
)
BD
T M
M
Current Deposit Savings Deposit Fixed Deposits
Other Deposits GR (YoY)
0%
2%
4%
6%
8%
10%
12%
0%
10%
20%
30%
40%
50%
60%
70%
2007 2008 2009 2010 2011E
Eff
ecti
ve D
ep
osit
Rate
CA
SA
Rati
o
CASA Ratio Effective Deposit Rate Corr -0.57
BRAC Bank Ltd (DSE: BRACBANK; Bloomberg: BRAC:BD)
4
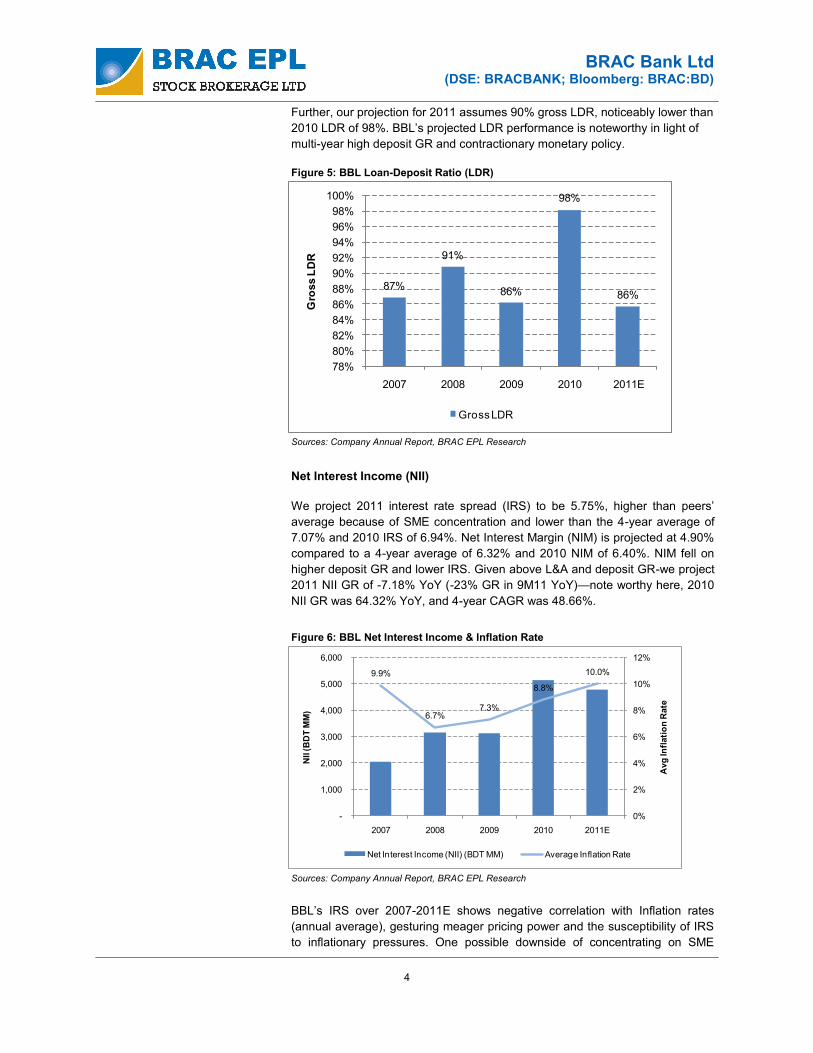
Further, our projection for 2011 assumes 90% gross LDR, noticeably lower than
2010 LDR of 98%. BBL’s projected LDR performance is noteworthy in light of
multi-year high deposit GR and contractionary monetary policy.
Net Interest Income (NII)
We project 2011 interest rate spread (IRS) to be 5.75%, higher than peers’
average because of SME concentration and lower than the 4-year average of
7.07% and 2010 IRS of 6.94%. Net Interest Margin (NIM) is projected at 4.90%
compared to a 4-year average of 6.32% and 2010 NIM of 6.40%. NIM fell on
higher deposit GR and lower IRS. Given above L&A and deposit GR-we project
2011 NII GR of -7.18% YoY (-23% GR in 9M11 YoY)—note worthy here, 2010
NII GR was 64.32% YoY, and 4-year CAGR was 48.66%.
BBL’s IRS over 2007-2011E shows negative correlation with Inflation rates
(annual average), gesturing meager pricing power and the susceptibility of IRS
to inflationary pressures. One possible downside of concentrating on SME
Figure 6: BBL Net Interest Income & Inflation Rate
Sources: Company Annual Report, BRAC EPL Research
Sources: Company Annual Report, BRAC EPL Research
Figure 5: BBL Loan-Deposit Ratio (LDR)
87%
91%
86%
98%
86%
78%
80%
82%
84%
86%
88%
90%
92%
94%
96%
98%
100%
2007 2008 2009 2010 2011E
Gro
ss L
DR
Gross LDR
9.9%
6.7%7.3%
8.8%
10.0%
0%
2%
4%
6%
8%
10%
12%
-
1,000
2,000
3,000
4,000
5,000
6,000
2007 2008 2009 2010 2011E
Avg
Infl
ati
on
Rate
NII (B
DT
MM
)
Net Interest Income (NII) (BDT MM) Average Inflation Rate

BRAC Bank Ltd (DSE: BRACBANK; Bloomberg: BRAC:BD)
5
sector is the relatively less flexibility of loan re-pricing, as most of the clients are
not worthy that much. So, linear adjustment of loan rate with incremental
deposit rate is quite difficult.
In spite of NIM shock in a particularly difficult year for banks—BBL’s core
earnings driver is expected to be its IRS and deposit GR in 2011. IRS income
contributed 49% to 2010 total operating income and 44% in 2011 is expected.
However, we anticipate NIMs to be condensed for conventional commercial
banks over time amid increasing competition.
BBL’s new avenues in business Bangladesh bank sector has been enjoying higher IRS than that of other frontier
market banks. In the longer run, competition would drive domestic banks’ NII
down, and eventually profitability. Bangladesh Bank (BB) has recently issued a
directive to bring the IRS to 5%, lower than historical level.
Figure 8: Operating Income Composition
Figure 7: BBL Interest Rate Spread, NIM & Average Inflation Rate
Sources: Company Annual Report, BRAC EPL Research
-10%
-6%
-2%
2%
6%
10%
14%
0%
1%
2%
3%
4%
5%
6%
7%
8%
9%
2007 2008 2009 2010 2011E
Avg
Infl
ati
on
Rate
Inte
rest R
ate
Sp
read
& N
IM
Interest Rate Spread NIM Average Inflation Rate
58%52%
42%49% 44%
22% 32%
31%27%
30%
20% 15%26% 22% 24%
0.5% 0.3% 1% 2% 2%
0%
20%
40%
60%
80%
100%
120%
2007 2008 2009 2010 2011E
Co
mp
osit
ion o
f O
pera
ting
Incom
e
Net Interest Income Commission Income Invetsment Income Other Income
Sources: Company Annual Report, BRAC EPL Research

BRAC Bank Ltd (DSE: BRACBANK; Bloomberg: BRAC:BD)
6
In this reality, BBL has concentrated on searching for alternative avenues of revenue generation that is linked to mobile technology- possible growth driver of domestic banking sector. bKash bKash is a joint venture between BBL and US-based ‘Money in Motion’ that
aims to serve the 83% of the population living on less than $2 a day. bKash‟s
one of the distribution partners is BRAC, an NGO with a large geographic
footprint and more than 8 million microfinance group members in Bangladesh,
enabling bKash to offer services where they are most needed.
While only 9% of Bangladeshis are banked, more than 44% of population owns
a mobile phone, making Bangladesh an ideal market for the introduction of
mobile financial services.
EL DORADO EL DORADO is a web based remittance and payment processing system for
BDT payments. A key issue facing the Bangladesh remittance delivery network
is the lack of electronic interconnectivity between banks, which is an important
factor if one bank has the obligation to deliver remittance proceeds to a
customer of another bank.
Non-Interest Income Non-interest income constitutes 55.62% of BBL’s 2011E total operating income.
As per 4-year average, its proportion was 49.45% of total operating income,
with investment income at 20.58% and commissions & fees income at 27.84%.
Commission income and Exchange gains are expected to have GR at 52% and
40% respectively in 2011. Foreign currency comes from export
and remittances. After meeting the internal needs like financing import clients,
excess currency are sold in the local market to the other banks. Profit
from foreign exchange dealings comes from the rate spread between position
taken and position sold. Over last 1 year, when BDT depreciated around 16%
against US$, that is expected to be the basic driver behind 40% GR in 2011
exchange gain.
Sources: World Bank Database
Table 1: Interest Rate Spread Comparative Analysis
2006 2007 2008 2009 2010
Bangladesh 7.66% 6.20% 6.80% 6.70% 6.40% 5.90%
Indonesia 7.84% 4.60% 5.90% 5.10% 5.20% 6.20%
Kuwait 5.44% 3.70% 3.10% 2.80% 3.30% 2.60%
Malaysia 2.66% 3.30% 3.20% 3.00% 3.00% 2.50%
Oman 5.68% 3.40% 3.10% 2.60% 3.30% 3.50%
Pakistan 12.66% 6.80% 6.50% 6.00% 5.90% 5.90%
Philippines 5.06% 4.50% 5.00% 4.30% 5.80% 4.50%
Qatar 6.68% 2.90% 3.00% 3.90% 2.80% 4.40%
Sri Lanka 11.54% 6.00% 8.00% 8.00% 5.10% 3.30%
Vietnam 10.96% 3.50% 3.70% 3.10% 2.20% 1.90%
Interest Rate Spread over Time5 Yr Avg
InflationCountr ies

BRAC Bank Ltd (DSE: BRACBANK; Bloomberg: BRAC:BD)
7
from foreign exchange dealings comes from the rate spread between position
taken and position sold. Over last 1 year, when BDT depreciated around 16%
against US$, that is expected to be the basic driver behind 40% GR in 2011
exchange gain.
Investment Income As a non-PD, BBL is not expected to be substantially affected by 2011
government borrowing. Higher government borrowing (BDT 69.3 billion in Jul-
Sept11, a 23x rise YoY) is not expected to directly affect BBL’s 2011 treasury
investment portfolio. However, increased Statutory Liquidity Reserve (SLR)
requirements since December 2010 are expected to raise BBL’s treasury
investments by 20% in 2011 compared to 4-year average GR of 31%.
Figure 9: Comparative Analysis of Operating Income Composition (As on 9M 2011)
Sources: Company Annual Report, BRAC EPL Research
Figure 10: BBL Non-Interest Income Composition
Sources: Company Annual Report, BRAC EPL Research
36% 40%29%
43%35%
68%
37%
32% 24% 42%24% 38%
1%
30%
26%
18%
23% 28%22% 28% 30%
6%18%
6% 6% 5% 3% 3%
0%
10%
20%
30%
40%
50%
60%
70%
80%
90%
100%
Prime Bank National Bank
Southeast Bank
Eastern Bank
NCC Bank Islami Bank Bangladesh
BRAC Bank
Co
mp
osit
ion o
f O
pera
ting
Incom
e
Net interest Income Investment Income Fee Income Other Income
120 259 426 1,026 923 654
1,693 1,840
1,745 2,241
693
909
1,924
2,259
2,531
16
20
85
227
262
-
1,000
2,000
3,000
4,000
5,000
6,000
7,000
2007 2008 2009 2010 2011E
BD
T M
M
Commission Income Fees Income Investment Income Other Income
BRAC Bank Ltd (DSE: BRACBANK; Bloomberg: BRAC:BD)
8
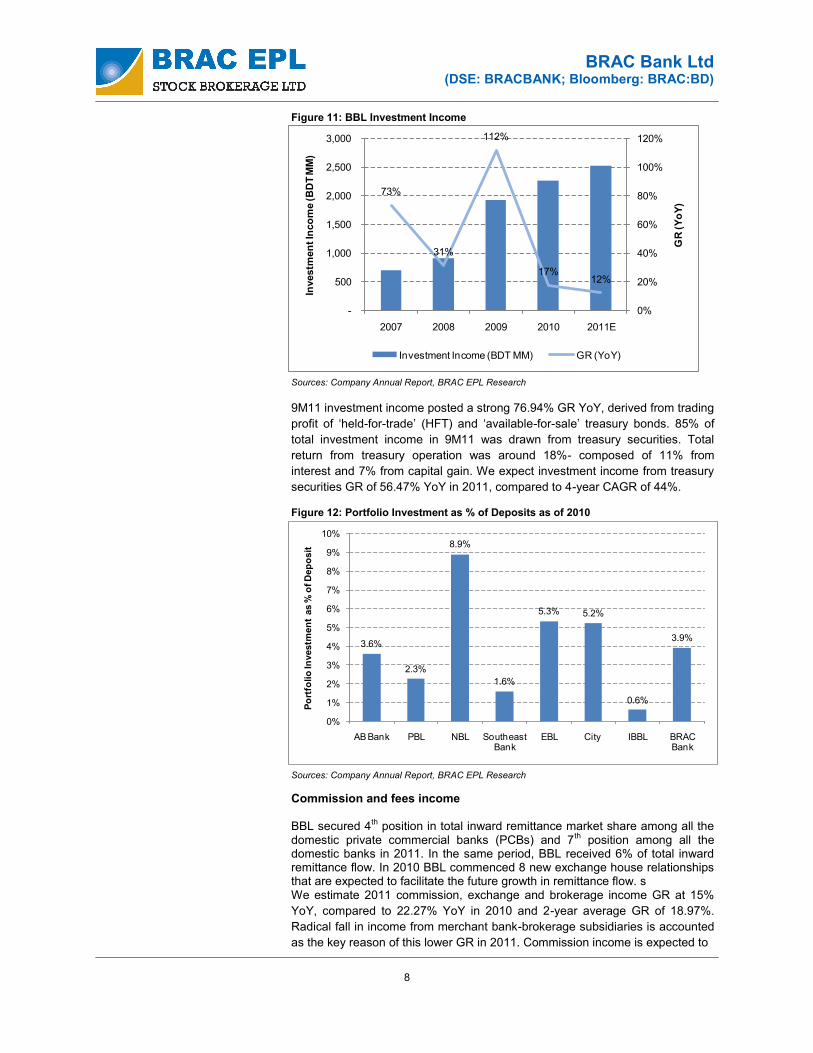
9M11 investment income posted a strong 76.94% GR YoY, derived from trading
profit of ‘held-for-trade’ (HFT) and ‘available-for-sale’ treasury bonds. 85% of
total investment income in 9M11 was drawn from treasury securities. Total
return from treasury operation was around 18%- composed of 11% from
interest and 7% from capital gain. We expect investment income from treasury
securities GR of 56.47% YoY in 2011, compared to 4-year CAGR of 44%.
Commission and fees income BBL secured 4th position in total inward remittance market share among all the domestic private commercial banks (PCBs) and 7th position among all the domestic banks in 2011. In the same period, BBL received 6% of total inward remittance flow. In 2010 BBL commenced 8 new exchange house relationships that are expected to facilitate the future growth in remittance flow. s We estimate 2011 commission, exchange and brokerage income GR at 15%
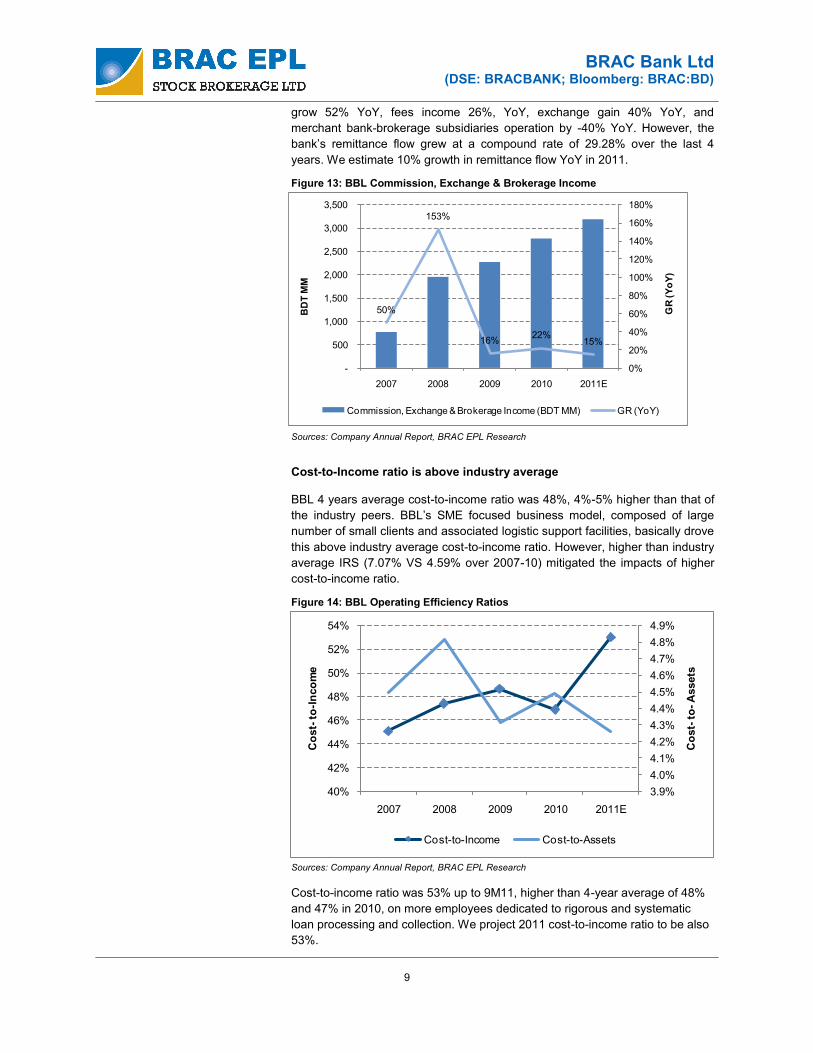
YoY, compared to 22.27% YoY in 2010 and 2-year average GR of 18.97%.
Radical fall in income from merchant bank-brokerage subsidiaries is accounted
as the key reason of this lower GR in 2011. Commission income is expected to
Figure 11: BBL Investment Income
Sources: Company Annual Report, BRAC EPL Research
Figure 12: Portfolio Investment as % of Deposits as of 2010
Sources: Company Annual Report, BRAC EPL Research
73%
31%
112%
17%12%
0%
20%
40%
60%
80%
100%
120%
-
500
1,000
1,500
2,000
2,500
3,000
2007 2008 2009 2010 2011E
GR
(Y
oY
)
Investm
en
t In
co
me (B
DT M
M)
Investment Income (BDT MM) GR (YoY)
3.6%
2.3%
8.9%
1.6%
5.3% 5.2%
0.6%
3.9%
0%
1%
2%
3%
4%
5%
6%
7%
8%
9%
10%
AB Bank PBL NBL Southeast Bank
EBL City IBBL BRAC Bank
Po
rtfo
lio
Investm
en
t as %
of D
ep
osit
BRAC Bank Ltd (DSE: BRACBANK; Bloomberg: BRAC:BD)
9
grow 52% YoY, fees income 26%, YoY, exchange gain 40% YoY, and
merchant bank-brokerage subsidiaries operation by -40% YoY. However, the
bank’s remittance flow grew at a compound rate of 29.28% over the last 4
years. We estimate 10% growth in remittance flow YoY in 2011.
Cost-to-Income ratio is above industry average BBL 4 years average cost-to-income ratio was 48%, 4%-5% higher than that of
the industry peers. BBL’s SME focused business model, composed of large
number of small clients and associated logistic support facilities, basically drove
this above industry average cost-to-income ratio. However, higher than industry
average IRS (7.07% VS 4.59% over 2007-10) mitigated the impacts of higher
cost-to-income ratio.
Cost-to-income ratio was 53% up to 9M11, higher than 4-year average of 48%
and 47% in 2010, on more employees dedicated to rigorous and systematic
loan processing and collection. We project 2011 cost-to-income ratio to be also
53%.
Figure 13: BBL Commission, Exchange & Brokerage Income
Sources: Company Annual Report, BRAC EPL Research
50%
153%
16%22%
15%
0%
20%
40%
60%
80%
100%
120%
140%
160%
180%
-
500
1,000
1,500
2,000
2,500
3,000
3,500
2007 2008 2009 2010 2011E
GR
(Y
oY
)
BD
T M
M
Commission, Exchange & Brokerage Income (BDT MM) GR (YoY)
Figure 14: BBL Operating Efficiency Ratios
3.9%
4.0%
4.1%
4.2%
4.3%
4.4%
4.5%
4.6%
4.7%
4.8%
4.9%
40%
42%
44%
46%
48%
50%
52%
54%
2007 2008 2009 2010 2011E
Co
st-
to-A
ssets
Co
st-
to-I
nco
me
Cost-to-Income Cost-to-Assets
Sources: Company Annual Report, BRAC EPL Research

BRAC Bank Ltd (DSE: BRACBANK; Bloomberg: BRAC:BD)
10
Moderate growth in EPS in spite of macro shocks The year 2011 has been severe on the bank sector. High inflation and
government borrowing cut IRS income whereas a 44%-market correction
eroded portfolio gains from 2010 DGEN appreciation of near 83%. We expect
BBL EPS stream and GR to be as follows.
BBL lower but positive income GR in 2011 is owing to combined outcome of macro shocks, lower IRS and lower income from non banking operation, moderate commission and fees income GR, profit booking from treasury operation and higher costs. We project 2011 EPS to be BDT 6.95, against BDT 6.28 in 2010, 10.7% higher YoY. EPS 4-Year average GR is 58.61% as of Dec10. EPS grew -10.84% YoY in 9M11. Inflation and BBL’s profit growth EPS GR YoY averaged 58.61% over 2007-2010. Inflation and net profit GR
exhibit negative correlation coefficient (CC) of -0.20. Below graph depicts higher
net profit YoY GR despite rising average inflation rate. Below graphs also depict
CC of non interest income YoY GR to average inflation rate of -0.64 and NII GR
to average inflation rate CC of 0.07. This is unexpected since negative
Figure 15: BBL EPS Trend
Sources: Company Annual Report, BRAC EPL Research
1.87
2.95
4.16
6.28
6.95
85.0%
57.4%
41.1%
50.9%
10.7%
0%
10%
20%
30%
40%
50%
60%
70%
80%
90%
-
1
2
3
4
5
6
7
8
2007 2008 2009 2010 2011E
GR
Dilu
ted
EP
S
Diluted EPS GR
Figure 16: Correlation between Inflation & BBL Income Components
-20%
0%
20%
40%
60%
80%
100%
-20%
-16%
-12%
-8%
-4%
0%
4%
8%
12%
2007 2008 2009 2010 2011E
GR
in In
com
es (%
)
Ave
rag
e In
flat
ion
Rat
e
Average Inflation Rate GR in Net Interest Income
GR in Non Interest Income
Sources: BRAC EPL Research
BRAC Bank Ltd (DSE: BRACBANK; Bloomberg: BRAC:BD)
11
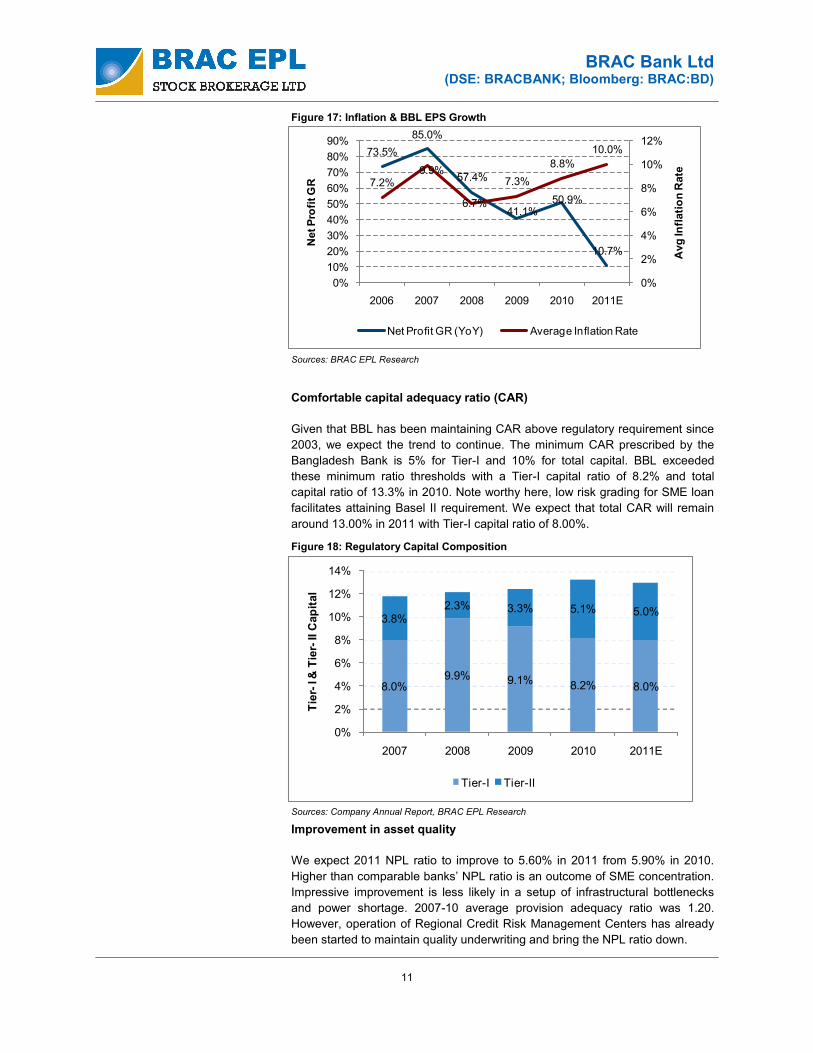
Comfortable capital adequacy ratio (CAR)
Given that BBL has been maintaining CAR above regulatory requirement since
2003, we expect the trend to continue. The minimum CAR prescribed by the
Bangladesh Bank is 5% for Tier-I and 10% for total capital. BBL exceeded
these minimum ratio thresholds with a Tier-I capital ratio of 8.2% and total
capital ratio of 13.3% in 2010. Note worthy here, low risk grading for SME loan
facilitates attaining Basel II requirement. We expect that total CAR will remain
around 13.00% in 2011 with Tier-I capital ratio of 8.00%.
Improvement in asset quality
We expect 2011 NPL ratio to improve to 5.60% in 2011 from 5.90% in 2010.
Higher than comparable banks’ NPL ratio is an outcome of SME concentration.
Impressive improvement is less likely in a setup of infrastructural bottlenecks
and power shortage. 2007-10 average provision adequacy ratio was 1.20.
However, operation of Regional Credit Risk Management Centers has already
been started to maintain quality underwriting and bring the NPL ratio down.
Figure 17: Inflation & BBL EPS Growth
73.5%
85.0%
57.4%
41.1%50.9%
10.7%
7.2%9.9%
6.7%
7.3%
8.8%
10.0%
0%
2%
4%
6%
8%
10%
12%
0%
10%
20%
30%
40%
50%
60%
70%
80%
90%
2006 2007 2008 2009 2010 2011E
Avg
Infl
ati
on
Rate
Net P
rofi
t G
R
Net Profit GR (YoY) Average Inflation Rate
Sources: BRAC EPL Research
Figure 18: Regulatory Capital Composition
8.0%9.9% 9.1% 8.2% 8.0%
3.8%2.3% 3.3% 5.1% 5.0%
0%
2%
4%
6%
8%
10%
12%
14%
2007 2008 2009 2010 2011E
Tie
r-I &
Tie
r-II C
ap
ital
Tier-I Tier-II
Sources: Company Annual Report, BRAC EPL Research

BRAC Bank Ltd (DSE: BRACBANK; Bloomberg: BRAC:BD)
12
However, operation of Regional Credit Risk Management Centers has already
been started to maintain quality underwriting and bring the NPL ratio down.
Increasing return-ROE is increasing We project ROE and ROA for 2011 to be 23.0% and 1.7%, respectively, up
from 21.4% and down from 1.9% in 2010. Higher ROE is driven by moderate
earnings growth and gradual paying off of preference share.
Table 2: BBL Asset Quality
Figure 19: BBL Gross NPL Ratio
Sources: Company Annual Report
Asset Quality 2009 2010
NPLs to total loans and advances 6.04% 5.85%
Provision for classified loans,MM 2,587 2,996
4.5%4.7%
6.0% 5.9%5.6%
0%
1%
2%
3%
4%
5%
6%
7%
2007 2008 2009 2010 2011E
Gro
ss N
PL
Rati
o
Gross NPL Ratio
Sources: Company Annual Report, BRAC EPL Research
Figure 20: BBL ROE & ROA Trend
31.6%
22.9%
19.2%21.4%
23.0%
1.9% 1.6% 1.6% 1.9% 1.7%
0%
5%
10%
15%
20%
25%
30%
35%
2007 2008 2009 2010 2011E
RO
E &
RO
A
ROE ROA
Sources: Company Annual Report, BRAC EPL Research

BRAC Bank Ltd (DSE: BRACBANK; Bloomberg: BRAC:BD)
13
BBL in comparison to leading frontier market banks
A quick look at the some of the largest listed banks in frontier markets such as
Pakistan, Sri Lanka, Nigeria and Oman indicates how BBL fares in relation to its
frontier market peers.
With regards to profitability ratios BBL outperforms most of the leading banks in
Pakistan, Sri Lanka, Oman and Romania. Among the 7 tabulated above, BBL
is carrying below median P/E ratio and slightly above median P/B ratio.
Considering its ROE (highest among the above banks) and ROA, undoubtedly
BBL has further scope to appreciate in market.
Sources: BRAC EPL Research, Capital IQ (As on Dec 31, 2011)
Table 3: BBL in Comparison to other Frontier Market Banks (as on Dec 31, 2011)
MCAP
(USD mn)
BRAC Bank
Habib Bank (HB) Pakistan 1,317.10 7.1x 1.3x 19.20% 1.90%
National Bank of Pakistan (NBP) Pakistan 822.6 4.1x 0.6x 14.60% 1.90%
Commercial Bank of Ceylon PLC (CBC) Sri Lanka 711.7 14.1x 2.2x 18.00% 2.00%
Banca Transilvania (BT) Romania 465.4 10.9x 0.8x 13.10% 1.20%
Bank Muscat (BM) Oman 3,037.20 10.1x 1.4x 12.60% 1.60%
Access Bank (AB) Nigeria 536.3 7.9x 0.5x 7.30% 1.60%
1.72%Bangladesh 144.74 5.6x 1.4x 22.99%
Frontier Market Banks Country P/E P/B ROE ROA
Figure 21: BBL in Comparison to other Frontier Market Banks (as on Dec 31, 2011)
BRAC Bank
HB
NBP
CBC
BT BM
AB
0%
5%
10%
15%
20%
25%
0.8% 1.0% 1.2% 1.4% 1.6% 1.8% 2.0% 2.2%
RO
E (%
)
ROA (%)
Sources: BRAC EPL Research, Capital IQ (As on Dec 31, 2011)

BRAC Bank Ltd (DSE: BRACBANK; Bloomberg: BRAC:BD)
14
Rating Our rating considered 2012E EPS and BVPS, 2012-outlook for the banking sector and other related factors. Considering the estimated EPS of BDT 8.70 and BVPS of BDT 31.00 for 2012, we estimate a fair value of BDT 52.00 per share with an OUTPERFORM rating. This fair value implies an 8.4x potential P/E and 1.45x potential P/B of the company’s Stock and 35.50% price gain over next 10 months investment horizons.

BRAC Bank Ltd (DSE: BRACBANK; Bloomberg: BRAC:BD)
15
Balance Sheet, MM BDT 2008 2009 2010 2011E 2012E 2013E
Property & Assets:
Cash 4,315.9 6,619.1 9,853.0 13,382.6 19,793.8 26,138.0
Balance with Other Banks & F.I 3,195.0 5,649.1 3,887.3 3,906.7 3,984.8 4,383.3
Money at call .0 1,300.0 .0 .0 .0 .0
Investment 8,245.4 10,383.3 13,125.5 14,309.2 17,283.7 20,587.1
Loan & Advance 52,676.7 64,150.8 86,573.9 102,157.2 124,631.8 155,789.8
Fixed Assets 1,472.0 1,666.6 1,854.2 2,781.4 3,476.7 4,172.1
Other Assets 2,536.9 4,846.4 7,507.2 8,257.9 9,083.7 10,173.8
Total Assets 72,441.9 94,615.3 122,801.2 144,795.0 178,254.6 221,244.0
Liabilities & Equities:
Liabilities:
Borrowing from other banks, F.I 2,280.0 2,450.0 10,352.5 12,940.7 16,175.8 19,411.0
Deposits 58,006.9 74,455.7 88,154.9 106,226.6 132,783.3 165,979.1
Other Liability 6,717.5 8,878.4 13,742.4 16,216.1 19,135.0 22,579.3
Total Liabilities 67,004.4 85,784.1 112,249.8 135,383.3 168,094.1 207,969.3
Shareholder's Equity: 5,437.5 8,831.2 10,551.3 9,411.7 10,160.5 13,274.6
Total Liabilities & Equities 72,441.9 94,615.3 122,801.2 144,795.0 178,254.6 221,244.0
Income Statement, MM BDT 2008 2009 2010 2011E 2012E 2013E
Interest/Investment Income 8,021.1 9,202.3 11,028.5 13,805.9 17,307.7 21,659.2
Interest/profit paid on deposit 4,865.1 6,073.2 5,886.8 9,033.5 10,725.1 13,374.0
Net Interest Income 3,156.0 3,129.1 5,141.6 4,772.4 6,582.6 8,285.3
Income from investments 909.1 1,923.8 2,259.3 2,530.8 2,369.5 2,194.4
Commission, Excng & Brok 1,951.2 2,266.5 2,771.3 3,187.0 3,760.6 4,437.5
Other Income 19.9 85.1 227.3 262.3 346.2 541.5
Total Operating Income 6,036.2 7,404.6 10,399.5 10,752.4 13,058.9 15,458.7
Operating Expense 2,862.3 3,603.6 4,880.4 5,698.8 6,398.8 6,956.4
Profit Before Provision 3,173.9 3,801.1 5,519.1 5,053.6 6,660.0 8,502.3
Provision 1,150.5 1,574.0 2,053.0 1,228.9 1,658.9 2,003.5
Pre-Tax Profit 2,023.5 2,227.1 3,466.1 3,824.8 5,001.1 6,498.7
Tax 1,050.0 853.7 1,393.0 1,529.9 2,125.5 2,794.5
Profit After Tax 973.5 1,373.4 2,073.1 2,294.9 2,875.6 3,704.3
2008 2009 2010 2011E 2012E 2013E
Total Assets Growth 56.18% 30.61% 29.79% 17.91% 23.11% 24.12%
L & A Growth 62.28% 21.78% 34.95% 18.00% 22.00% 25.00%
Deposit Growth 55.23% 28.36% 18.40% 20.50% 25.00% 25.00%
EPS GR 57.43% 41.08% 50.95% 10.70% 25.31% 28.82%
IMPORTANT DISCLOSURES
Analyst Certification: Each research analyst and research associate who authored this document and whose name appears herein certifies that the recommendations and opinions expressed in the research report accurately reflect their personal views about any and all of the securities or issuers discussed therein that are within the coverage universe. Disclaimer: Estimates and projections herein are our own and are based on assumptions that we believe to be reasonable. Information presented herein, while obtained from sources we believe to be reliable, is not guaranteed either as to accuracy or completeness. Neither the information nor any opinion expressed herein constitutes a solicitation of the purchase or sale of any security. As it acts for public companies from time to time, BRAC-EPL may have a relationship with the above mentioned company(s). This report is intended for distribution in only those jurisdictions in which BRAC-EPL is registered and any distribution outside those jurisdictions is strictly prohibited. Compensation of Analysts: The compensation of research analysts is intended to reflect the value of the services they provide to the clients of BRAC-EPL. As with most other employees, the compensation of research analysts is impacted by the overall profitability of the firm, which may include revenues from corporate finance activities of the firm's Corporate Finance department. However, Research analysts' compensation is not directly related to specific corporate finance transaction. General Risk Factors: BRAC-EPL will conduct a comprehensive risk assessment for each company under coverage at the time of initiating research coverage and also revisit this assessment when subsequent update reports are published or material company events occur. Following are some general risks that can impact future operational and financial performance: (1) Industry fundamentals with respect to customer demand or product / service pricing could change expected revenues and earnings; (2) Issues relating to major competitors or market shares or new product expectations could change investor attitudes; (3) Unforeseen developments with respect to the management, financial condition or accounting policies alter the prospective valuation; or (4) Interest rates, currency or major segments of the economy could alter investor confidence and investment prospects.
BRAC EPL Stock Brokerage Capital Markets Group
Sajid Huq Amit Senior Research Analyst [email protected] 01755 541 254
Parvez Morshed Chowdhury Research Analyst [email protected] 01730 357 154
Ali Imam Investment Analyst [email protected] 01730 357 153
Khandakar Safwan Saad Research Associate [email protected] 01730 357 779
Aasim Tajwaar Matin Research Associate [email protected] 01730 727 913
M M Shahnewaz Kabir Shawon Research Associate [email protected] 01730 727 918
Farjad Siddiqui Research Associate [email protected] 01730 727 924
BRAC EPL Research www.bracepl.com 121/B Gulshan Avenue Gulshan-2, Dhaka-1212 Tel: +88 02 881 9421-5 Fax: +88 02 881 9426 E-Mail: [email protected]
BRAC Bank Ltd (DSE: BRACBANK; Bloomberg: BRAC:BD)
Institutional Sales and Trading
Delwar Hussain (Del) Head of Institutional Sales and Trading
[email protected] 01755 541 252