Embed Size (px)
Citation preview

TopicAn Analysis of Financial Performance

Supervised By:
Sk. Habibur Rahaman
Senior Lecturer
Manarat International University
Prepared By:
Al Sukran- 1413MBA50346Manarat International University

Introduction

Background of the Study
• This is a report on my internship at BRAC BANK LTDthis report details my experiences at the company.
• The internship and this report are part of my MBArequirements for the ACCOUNTING at major atManarat International University. As an accountingstudent I have to work with accounting related topic.I discuss about An Analysis of Financial Performanceof BRAC Bank Ltd. So I analysis some data base ondifferent ratio analysis.

Objective of the Study
This report is designed to know more about theFinancial Ratio Analysis of BRAC BANK LTD. andanalyze the ratio of this organization and identify thefinancial condition of this organization. In addition,the study seeks to achieve the following objectives:
• To analysis the Financial Statement of Brac Bank Ltd.
• To calculate the financial ratios and identify the areasof concern.
• To identify and assess the present Financial RatioAnalysis of Brac Bank Limited.

Methodology of the Study
This report is prepared by two sources
• Primary Sources: Basically this type of Sources included working at bank and interviews with others the bankers of BRAC BANK LTD.
• Secondary Sources: Secondary data were collected in the following ways:
– Data gathered within the organization itself.
– Data gathered from Texts
– Internet sources.
– General reports
– Annual reports
– Official documents

Limitation of the Study
However the some of the limitations I have face while preparing this Report are listed as follows:
–Time Limitation
–Inadequate Data
–Lack of Record
–Lack of experiences

Overview of BRAC Bank Ltd
BRAC Bank was founded on 4 July 2001 as a private commercial bankfocused on Small and Medium Enterprises (SME). BRAC Bank wasfounded to reach the large number of unbanked people which werenot covered by traditional bank. The main concept of the bank wasto facilitate Small and Medium Enterprises (SME). Since then theBank has become a leading bank in Bangladesh.
Financial Services - SME Banking, Retails Banking, Card Service (Credit& Debit), Foreign Exchange & Related Services, Wholesale Banking &Custodial Service, Probashi Banking
Distribution Network - Branch : 166 (Dec, 2014),
SME Unit Office : 458, Remittance Delivery Point : 1800 ,
ATM Booth : 350+, Apon Somoy (Financial Kiosk) : 16

Analysis and Findings

Analysis
Ratios allow us to compare companies acrossindustries, big and small, to identify their strengthsand weaknesses. Financial ratios are often dividedinto four main categories:
• Analyzing Liquidity Ratio
• Analyzing Activity Ratio
• Analyzing Debt Ratio
• Analyzing Profitability

Ratio Analysis of Brac Bank Ltd

Current Ratio
Figure: Current Ratio
Year 2010 2011 2012 2013
Current Asset 108,791,342,196 120,691,016,472 157,898,600,871 157,010,788,637
Current Liability 95,407,908,332 107,837,411,843 144,202,510,136 139,510,917,707
Current Ratio 1.14 1.12 1.09 1.13
1.14
1.12
1.09
1.13
Current Ratio=Current Asset/Current Liabilities

Operating Cash Flow Ratio
Figure: Operating Cash Flow
Year 2010 2011 2012 2013
Operating Cash
Flow (1,439,205,626) 933,830,374 19,855,243,700 (5,679,858,459)
Current Liability 95,407,908,332 107,837,411,843 144,202,510,136 139,510,917,707
Operating Cash
Flow Ratio -0.02 0.01 0.14 -0.04
Operating Cash Flow Ratio=Operating Cash Flow/Total Debt
-0.020.01
0.14
-0.04
Cash Income Ratio
Figure: Cost Income Ratio
Year 2010 2011 2012 2013
Total Operating
Income 9,527,527,784 10,134,733,422 10,894,801,767 12,460,835,400
Total Operating
Expenses 4,751,309,242 5,164,822,269 5,749,605,759 6,535,958,634
Cost Income
Ratio 0.50 0.51 0.53 0.52
Cost Income Ratio = Total operating Expenses/Total Operating Income
0.50
0.51
0.53
0.52

Total Asset Turnover
Figure: Total Asset Turnover
Year 2010 2011 2012 2013
Total Operating
Income 9,527,527,784 10,134,733,422 10,894,801,767 12,460,835,400
Total Asset 117,297,555,748 133,201,048,438 173,676,792,029 171,901,669,638
Total Asset
Turnover Ratio 0.08 0.08 0.06 0.07
Total Asset Turnover= Operating Income/Total Asset
0.08 0.08
0.060.07

Investment to Deposit Ratio
Figure: Investment to Deposit Ratio
Year 2010 2011 2012 2013
Total Investment 12,855,985,261 14,198,827,511 25,372,525,282 21,298,625,661
Total Deposit 88,157,908,331 103,725,529,225 134,646,448,482 124,746,344,037
Investment to
Deposit Ratio 0.15 0.14 0.19 0.17
Investment to Deposit Ratio = Total investment/Total Deposit
0.08 0.14
0.190.17
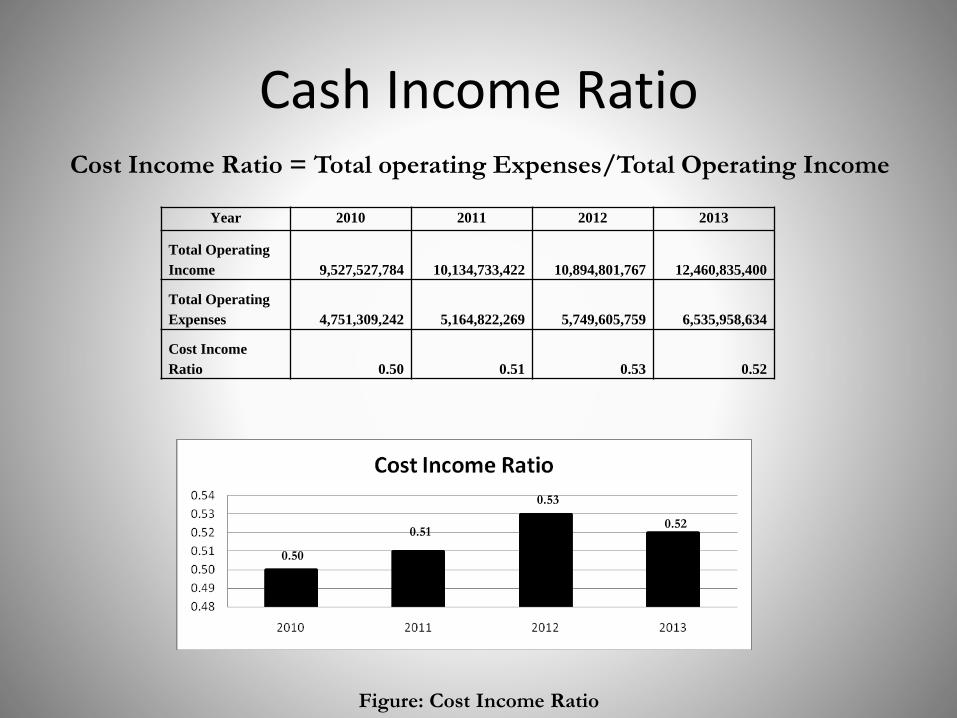
Debt Ratio
Figure: Debt Ratio
Year 2010 2011 2012 2013
Total Liabilities 107,879,663,647 123,598,443,600 163,522,243,477 160,314,216,168
Total Asset 117,297,555,748 133,201,048,438 173,676,792,029 171,901,669,638
Debt ratio 0.92 0.93 0.94 0.93
Debt ratio= Total Liabilities/Total Assets
0.92
0.93
0.94
0.93

Time Interest Earned Ratio
Figure: Time Interest Earned Ratio
Year 2010 2011 2012 2013
Earning Before
Interest & Tax 4,956,218,541 5,164,822,269 5,145,196,008 5,924,876,766
Interest 1,984,711,371 2,053,030,038 1,987,929,120 2,900,072,524
Time Interest
Earned Ratio 2.50 2.52 2.59 2.04
Time Interest Earned Ratio =Earnings before interest & Taxes/Interest
2.50 2.52 2.59
2.04

Net Profit Margin
Figure: Net Profit Margin
Year 2010 2011 2012 2013
Net Profit after
Tax 1,670,361,526 1,702,381,869 540,381,091 1,246,324,101
Total Operating
Income 9,527,527,784 10,134,733,422 10,894,801,767 12,460,835,400
Net Profit Margin 0.18 0.17 0.05 0.10
Net Profit Margin=Net profit after tax/operating income
0.18 0.17
0.050.10
0
0.05
0.1
0.15
0.2
2010 2011 2012 2013
Net Profit Margin0.18 0.17
0.05
0.10

Return On Asset
Figure: Return On Asset
Year 2010 2011 2012 2013
Return on Asset
(ROA) 1.55% 1.36% 0.35% 0.72%
Return on Asset (ROA) =Net Profit after tax/Total Asset
1.55%1.36%
0.35%
0.72%

Return On Asset
Figure: Return On Equity
Year 2010 2011 2012 2013
Return on Equity 18.95% 17.90% 5.47% 11.46%
Return on Equity=Net Profit after Tax/ Shareholders equity
18.95% 17.90%
5.47%
11.46%

Earnings Per Share
Figure: Earnings Per Share
Year 2010 2011 2012 2013
Earnings per
Share 5.68 5.54 1.52 3.20
Earnings per Share =Earnings available for common stock holder /
No of shares of common stock
5.68 5.54
1.52
3.20

Cost of Fund
Figure: Cost of Fund
Year 2010 2011 2012 2013
Cost of Fund 8.54% 8.66% 8.43% 8.13%
8.54%8.66%
8.43%
8.13%

Credit Deposit Ratio
Figure: Credit Deposit Ratio
Year 2010 2011 2012 2013
Credit Deposit
Ratio 95.63% 84.82% 76.96% 82.30%
95.63%84.82%
76.96% 82.30%

Return on Investment
Figure: Return on Investment
Year 2010 2011 2012 2013
Return on
Investment 9.00% 12.41% 3.44% 6.05%
9.00%
12.41%
3.44%6.05%

Net Asset Value Per Share
Figure: Net Asset Value Per Share
Year 2010 2011 2012 2013
Net Asset Value
Per Share 33.29 28.80 26.34 26.14
0
10
20
30
40
2010 2011 2012 2013
Net Asset Value Per Share33.29
28.80 26.34 26.14
Findings
• In the analysis it has seen that in 2010 BBL’s current ratio was highest and2012 it was lowest among the years. It has seen that BBL maintains currentratio more than 1:1 ratios. It indicates that BBL’s liquidity position is notbad.
• In 2010 BBL’s Cost Income Ratio was lowest it indicates positive sign. Weknow that the lowest the ratio, the higher the operating efficiency. Butcompany maintains an average around .50 per year.
• The greater the total asset turnover; it considered more efficiency. Fromthe analysis it has seen that in year 2010 to 2012 total asset turnover ratioof BBL decreasing but at 2013 it’s higher than previous which indicatebetter efficiency of BBL.
• BBL’s investment to deposit ratio is decreasing in years 2010 to 2011 whichconveys negative signal for the bank. But in 2012 it’s again increasing.Company maintains an average Investment to deposit ratio around 0.16.
• From the analysis it has seen that BBL’s debt ratios were satisfactory rangein compare to other banks and also it was decreasing trend.

Findings
• In the year 2010 to 2012 BBL’s net profit margin decreasing year by yearwhich indicate that the bank’s operating result were not improving. But in2013 it improved better than previous year.
• From the analysis it has seen that BBL’s Returns on Asset were graduallydecreasing and in 2010 to 2012. But it’s improved from 2012 to 2013.
• From the analysis return on equity of BBL’s was around 18% in 2010 and2011. In 2012 because of recession and bad market position Return onEquity reduced unbelievably at 5.47%. But in 2013 BBL’s able to increasetheir ROE at 11.46%.
• From the analysis we found that earnings per share is 5.50 in 2010 & 2011But in 2012 EPS was decrease at 1.52 and in 2013 again BBL’s EPS remainincrease.
• From analysis Net Asset Value Per Share of BBL’s was 33.29 in 2010. But it isdecreasing year by year. But it maintains an average 26.00 last two years

Recommendations
• It is seen in the study that the liquidity ratio of B.B.L during 2012 & 2013.The liquidity of the bank should be reds by improving current & quick ratio.But company should maintain this properly and has to improve.
• It is further seen that the loan to deposit ratio of the bank was lowerduring 2012 & 2013. Therefore the loan to deposit ratio must be improveby increasing need loan.
• Assets utilization ratio was also lower in 2011 & 2012. In case B.B.L. Thisratio should also be increased by increasing operating income.
• Finally, at the end of the year we can see that although there have somedifficulties but we can overcome those difficulties by removing all theweaknesses to develop the product effectively and grab more opportunityhidden in the banking industry and the bank should also increase thestrength with their solid brand image, experience and skills of theemployees. With their strengths BRAC BANK LTD. can also reduce thethreats existing in the market.

Conclusions
• Banking sector is the chief financial intermediaries in a country. It’s alsotrue for Bangladesh. BRAC BANK LTD is a very challenging institution. In theage of globalization and free trade, the process and the system of running abank is changing. BBL is continuously managing itself with this changingenvironment. The days are gone for banks to keep their functions confinedwithin the periphery of accepting deposit and lending money as well asmaking a profit. The company strategies are clear and concise. It was alsofound that the bank is doing better in most of the sectors and theirperformance is better than average.
• Finally it can be said that the bank is doing very good in the competitivemarket and if it can continue to perform this way it can become a leadingbanking institution which can play a pivotal role in the development of thecountry.

Thank You