Embed Size (px)
Citation preview
Student visa and temporary graduate visa programme trends2009-10 to 2015-16

Table of ContentsPage
About this report 1
Enquiries 1
Definition of terms 2
Background to the student visa and temporary graduate visa programme 4
Key initiatives in the financial year 2013-14 6
Executive summary 9
Section 1 Lodged 11
Section 2 Granted 17
Section 3 Grant rates 37
Section 4 Visa holders in Australia 43
Section 5 Destinations 47
Section 6 Subclass 485 visa 49

This report provides annual data about the student visa and Temporary Graduate visa programme administered by the Department of Immigration and Border Protection (the department). The report has been provided to assist education providers, representative bodies and policymakers.
It is expected that this report will be further developed over time to increase and improve information sharing about the student visa and Temporary Graduate visa programme.
It is important to note that the information used in this report comes from a new data source. Consequently, figures for previous financial years have been revised and may differ slightly from those previously published by the department.
Data is sourced from several departmental visa processing and recording systems. Data can be dynamic and there can be delays in transmission of information from the department's global operations. Variations in figures between this report and previous issues can occur. The current financial year should always be considered provisional.
For privacy reasons < 5 has been used where a number in a table is between 1 and 4. In addition, the number of countries reported on has been increased to 50 for lodgements, grants and grant rates.
Further data about the student visa and Temporary Graduate visa programme, including recent quarterly statistics and student visa grants by sector and country is available on the department's website at: http://www.border.gov.au/about/reports-publications/research-statistics/statistics/study-in-australia
Further information about the student visa and Temporary Graduate visa programme is available at: www.immi.gov.au/students
EnquiriesAny comment or enquiries concerning this report should be sent to [email protected] quoting report Id BR0109.
About this report
BR0109 Student visa and temporary graduate visa programme trends | 2015-16 | page 1 of 53
Definition of termsApplicant type: Under the Migration Regulations 1994 (the Regulations), there are two types of
applicants. These are primary applicants and secondary applicants. These terms are defined below.
If the table or graph heading includes the word 'primary', such as 'primary applications' or 'primary visa holders', dependants (secondary applicants) are not included.
Citizenship country: The country of citizenship of the visa applicant or visa holder. Where a visa applicant or visa holder has more than one citizenship country, either the citizenship of the travel document or the citizenship nominated by the visa applicant is used.
Destination: Where a visa holder has moved from one type of visa to another. This most commonly occurs where a temporary visa holder applies for a permanent visa. However, many temporary visa holders go on to apply for a further temporary visa. The original visa is determined by the last visa held prior to the destination visa being granted. Destination visas include visas granted in Australia and outside Australia.
Granted: Unless otherwise specified, the number of visas granted includes primary and review grants.
In Australia: In this report, refers to the location of the client at the time the application was lodged. An applicant in Australia may already hold a visa of the same kind or may be applying for another type of visa. Student visa applicants subject to Assessment Level 1 can lodge their first student visa application while in Australia.
Last visa held: This refers to the last substantive visa held by a visa holder (that is, the last visa other than a bridging visa) prior to a point in time. The last visa held may have expired or still be in effect.
Lodged: Lodged is the count of paper applications receipted in a departmental office or submitted electronically.
Outside Australia: In this report, refers to the location of the client at the time the application was lodged. Generally, student visa applicants subject to Assessment Levels 2-3 are required to lodge their first student visa application while outside Australia.
Primary applicant: The primary applicant is the person who must satisfy the primary criteria for the grant of a visa under the Regulations. In this case, it would be the person proposing to study in Australia.
Primary application: An application lodged by a primary applicant.
Primary grant: An outcome where a decision maker (which may include system generated decision making) makes an assessment based on the initial visa application which results in a visa being granted to an applicant.
Primary visa holder: A person who has had a primary application for a visa granted.
Secondary applicant: Secondary applicants must satisfy the secondary criteria for the grant of a visa under the Regulations. In this case, a secondary applicant is generally a dependant of the primary applicant.
Secondary application: A visa application lodged by a secondary applicant.
Secondary visa holder: A person who has had a secondary application for a visa granted.
Snapshot date: The snapshot date is a point in time at which a count is undertaken. In this report, the number of visa holders in Australia at a point in time is used.
Visa applicant: Used to refer to clients applying for a visa. Unless otherwise specified, the term covers both primary and secondary applicants.
Visa holders in Australia: The number of visa holders lawfully in Australia. This is not a count of all valid visas, as a number of visa holders may be outside Australia on the snapshot date.
BR0109 Student visa and temporary graduate visa programme trends | 2015-16 | page 2 of 53
International students must have a valid visa for the duration of their studies in Australia. Most international students will need a student visa. However, visitor visas permit up to three months study and working holiday maker visas permit up to four months study. Further information about these visa options are available at: www.immi.gov.au/visitors/
There are eight types of student visa:
1. English Language Intensive Course for Overseas Students sector (ELICOS) (subclass 570) visa. This visa isfor international students undertaking a stand-alone English language course that leads to a certificate levelaward or non-formal award.
2. Schools sector (subclass 571) visa. This visa is designed for international students applying to study inAustralia in a primary, junior secondary or senior secondary school course or an approved secondary schoolexchange program.
3. Vocational Education and Training sector (subclass 572) visa. This visa is designed for international studentsapplying to study in Australia and whose main course of study is a certificate, vocational education and trainingdiploma, vocational education and training advanced diploma, vocational graduate certificate or vocationalgraduate diploma.
4. Higher Education sector (subclass 573) visa. This visa is designed for international students applying to studyin Australia and whose main course of study is a bachelor degree, associate degree, higher education diploma,higher education advanced diploma, graduate certificate, graduate diploma or Masters by coursework.
5. Postgraduate Research sector (subclass 574) visa. This visa is designed for international students who want tostudy a Master’s degree by research or a Doctoral degree in Australia.
6. Non Award sector (subclass 575) visa. This visa is designed for international students who want to study nonaward foundation studies or other full time courses not leading to an Australian award.
7. AusAID or Defence sector (subclass 576) visa. This visa is designed for international students who aresponsored by AusAID or Defence to study a full-time course of any type in Australia.
8. Student Guardian (subclass 580) visa. This visa is designed for a parent or close relative to accompany anunderage student to Australia.
To be eligible for a student visa, applicants must be accepted for full time study in a course listed on the Commonwealth Register of Institutions and Courses for Overseas Students (CRICOS). Applicants must also meet financial, health insurance, English language proficiency and health and character requirements
There is no limit on the number of student visas issued each year. If applicants meet requirements, they will be granted a student visa. Student visas are issued for the entire period of study in Australia, as evidenced by the Confirmation of Enrolment (CoE) documentation provided by the applicant’s education provider. Visas are issued in alignment with the period for which the applicant has Overseas Student Health Cover (OSHC).
Family members
Students can apply to have partners and dependant children under the age of eighteen accompany them to Australia. These family members are known as secondary visa holders and are counted in student visa numbers. A parent or guardian seeking to accompany an international student to Australia may be eligible for a Student Guardian (subclass 580) visa.
Course Packaging
Many international students choose to package their principal course with a foundation or ELICOS course. These students are granted a subclass of visa that relates to their principal course. Consequently, the visa grant data does not necessarily reflect the numbers of international students enrolled in these courses. For international student enrolment data, please see the Australian Education International’s website: https://aei.gov.au/research/international-student-data/pages/default.aspx
BR0109 Student visa and temporary graduate visa programme trends | 2015-16 | page 3 of 53
Background to the student visa programme
Ability to work
Student visas include a visa condition that, once the course has commenced, allows most students to work for up to 40 hours per fortnight while their course is in session and for unlimited hours during course breaks. The limitation imposed by this visa condition reflects the purpose of a student visa; that it is to allow entry to Australia in order to study, not to work. Secondary visa holders are subject to a visa condition that limits them to 40 hours work per fortnight at any time.
Higher degree by research students on a subclass 574 (Postgraduate Research Sector) student visa may work unlimited hours once their Masters or PhD course has commenced. Dependants of students studying a Masters or PhD research course have no limitation on their work hours.
Assessment Levels
There are three Assessment Levels in the student visa program. They serve to align student visa evidentiary requirements to the immigration risk posed by applicants from a particular country applying for a particular student visa. Assessment Level 1 represents the lowest immigration risk and Assessment Level 3 the highest. The higher the Assessment Level, the greater the evidence an applicant is required to demonstrate to support their claims for the grant of a student visa.
Streamlined visa processing
The department assesses student visa applicants who lodge their applications on or after 24 March 2012, with a Confirmation of Enrolment (CoE) from a participating higher education provider in Australia at Bachelor, Masters or Doctoral degree level as though they were a lower migration risk (similar to the current Assessment Level 1), regardless of their country of origin. This is in response to recommendations 3, 5, 6, and 18 of the Hon Michael Knight AO's report, Strategic Review of the Student Visa Program 2011 (the Knight Review).
Financial requirements
Students and their families need to be aware of the costs involved in studying and living in Australia. In order to meet the financial requirements for the grant of a student visa, applicants must be able to demonstrate that they have access to sufficient funds to cover tuition fees, travel costs, educational costs for any accompanying school age children and living costs for the full study period.
Genuine Temporary Entrant (GTE) requirementThe GTE requirement was introduced on 5 November 2011 to enhance the integrity of the student visa program.
The GTE requirement explicitly addresses whether the individual circumstances of an applicant indicate that their intention is for a temporary stay in Australia.
Factors that the department may consider as part of the GTE requirement are set out in a Ministerial Direction available at www.immi.gov.au/gateways/agents/pdf/direction-53-assessing-gte.pdf and include:
· circumstances in the applicant’s home country;
· the applicant’s potential circumstances in Australia;
· the applicant’s immigration history;
· the value of the course to the applicant’s future; and/or
· any other matter relevant to the applicant’s intention to stay temporarily.
Overseas Student Health Cover (OSHC)
Overseas students must have health insurance for the duration of their stay in Australia. Overseas Student Health Cover (OSHC) is insurance to assist international students meet the costs of medical and hospital care that they may need while in Australia.
BR0109 Student visa and temporary graduate visa programme trends | 2015-16 | page 4 of 53
Background to the student visa programme - continued
Visa refusals
A decision to refuse a student visa application is made when the delegate of the Minister is not satisfied that the applicant meets the legal criteria for grant of a visa. When refusing a visa application, the department provides an applicant, or their agent, with a written decision record that sets out the reason for the decision.
Reasons for refusal of student visa applications may include:
· failure to meet financial requirements;
· failure to meet English language requirements;
· fraudulent documentation present in the application;
· failure to satisfy the department that the applicant is a genuine student; and/or
· failure to meet GTE requirements.
Processing Standards
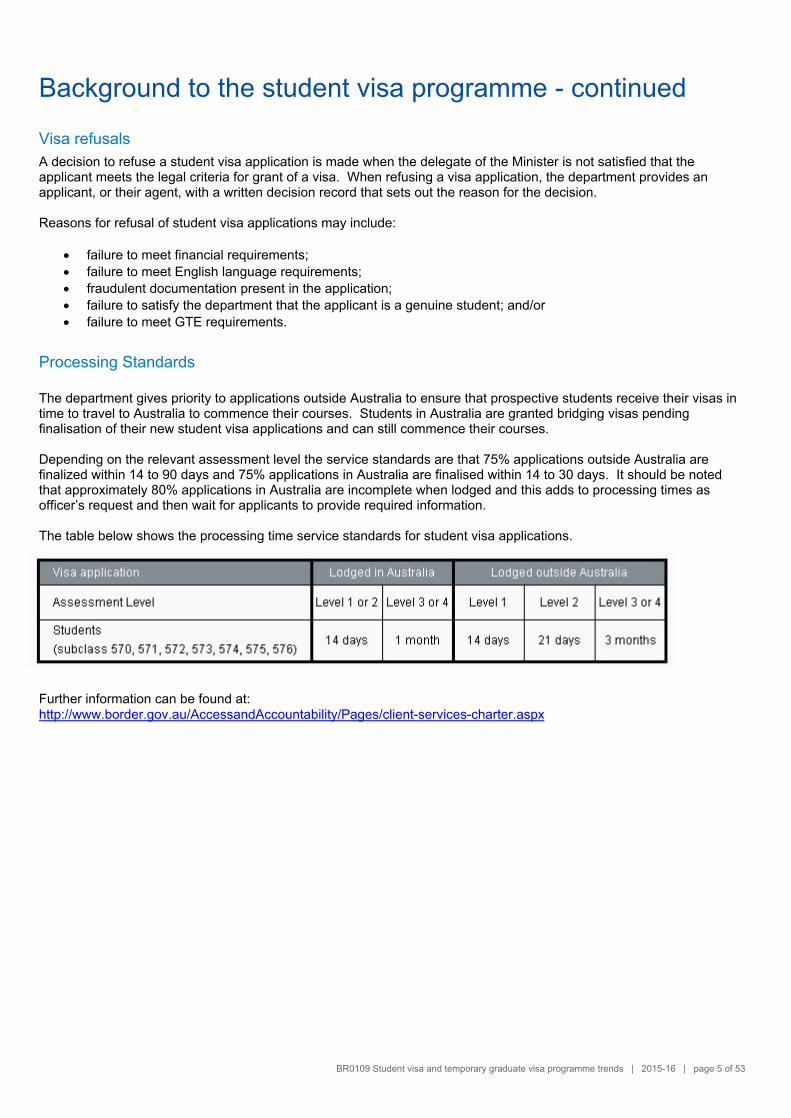
The department gives priority to applications outside Australia to ensure that prospective students receive their visas in time to travel to Australia to commence their courses. Students in Australia are granted bridging visas pending finalisation of their new student visa applications and can still commence their courses.
Depending on the relevant assessment level the service standards are that 75% applications outside Australia are finalized within 14 to 90 days and 75% applications in Australia are finalised within 14 to 30 days. It should be noted that approximately 80% applications in Australia are incomplete when lodged and this adds to processing times as officer’s request and then wait for applicants to provide required information.
The table below shows the processing time service standards for student visa applications.
Further information can be found at: http://www.border.gov.au/AccessandAccountability/Pages/client-services-charter.aspx
Background to the student visa programme - continued
BR0109 Student visa and temporary graduate visa programme trends | 2015-16 | page 5 of 53
Visa refusals
A decision to refuse a student visa application is made when the delegate of the Minister is not satisfied that the applicant meets the legal criteria for grant of a visa. When refusing a visa application, the department provides an applicant, or their agent, with a written decision record that sets out the reason for the decision.
Reasons for refusal of student visa applications may include:
· failure to meet financial requirements;
· failure to meet English language requirements;
· fraudulent documentation present in the application;
· failure to satisfy the department that the applicant is a genuine student; and/or
· failure to meet GTE requirements.
Processing Standards
The department gives priority to applications outside Australia to ensure that prospective students receive their visas in time to travel to Australia to commence their courses. Students in Australia are granted bridging visas pending finalisation of their new student visa applications and can still commence their courses.
Depending on the relevant assessment level the service standards are that 75% applications outside Australia are finalized within 14 to 90 days and 75% applications in Australia are finalised within 14 to 30 days. It should be noted that approximately 80% applications in Australia are incomplete when lodged and this adds to processing times as officer’s request and then wait for applicants to provide required information.
The table below shows the processing time service standards for student visa applications.
BR0109 Student visa and temporary graduate visa programme trends | 2015-16 | page 6 of 53
Background to the student visa programme - continued
The Skilled Graduate (Subclass 485) visa was renamed the Temporary Graduate (Subclass 485) visa on
23 March 2013, and has become a key component of the Temporary Visa Programme. Previously, the Subclass 485
visa was a component of the Skilled Migration Programme.
The Temporary Graduate visa has two streams, the Graduate Work stream and the Post-Study Work stream :
· Graduate Work stream - for international students who have recently graduated with the skills and qualifications
that relate to an occupation on the Skilled Occupations List. Applicants in this stream must have completed a
trade qualification, diploma or degree. Successful applicants are granted a visa of 18 months validity.
· Post-Study Work stream - for international students who have recently graduated with an Australian Bachelor
degree, Masters degree or Doctorate from an Australian educational institution. This stream is only available to
international students who applied for, and were granted, their first student visa on or after 5 November 2011.
Successful applicants are granted a visa of two, three or four years duration, depending on the highest
educational qualification they have obtained.
This visa provides eligible graduates with the opportunity to gain practical work experience in Australia following their studies. More information on the Temporary Graduate visa can be found on the department’s website at: http://www.border.gov.au/Trav/Visa-1/485-
Eligible visas
To be eligible for the Temporary Graduate visa, graduates must have completed their studies in Australia while on a
qualifying student visa which includes subclasses 572, 573 or 574.
Australian study requirement
The Australian study requirement is defined as study in Australia in a course registered on the Commonwealth Register
of Institutions and Courses for Overseas Students (CRICOS) for a period of at least two academic years (92 weeks).
The course should be conducted in English and should be completed in no less than 16 calendar months.
All Temporary Graduate visa applicants must meet the Australian study requirement in the six months immediately prior
to lodging their visa application.
Family members
Family members must meet legislative requirements and must provide evidence of their relationship to the Temporary
Graduate visa applicant. Additionally, family members can apply to join the Temporary Graduate visa holder in Australia
after the Temporary Graduate visa has been granted.
Ability to work and study
There are no restrictions on the type of work a Temporary Graduate visa holder can do. Temporary Graduate visa
holders may work or study in any field, regardless of their study and qualifications. Dependents and secondary
applicants are able to work and study on the Temporary Graduate visa.
Processing time service standards
The processing time service standard for the Temporary Graduate visa is 75% of applications should be finalised within 12 months, however, actual processing times may vary depending on a range of factors. Further information can be found at: www.immi.gov.au/about/charters/client-services-charter/visas/9.0.htm
BR0109 Student visa and temporary graduate visa programme trends | 2015-16 | page 7 of 53
Background to the Temporary Graduate visa programme
Executive Summary
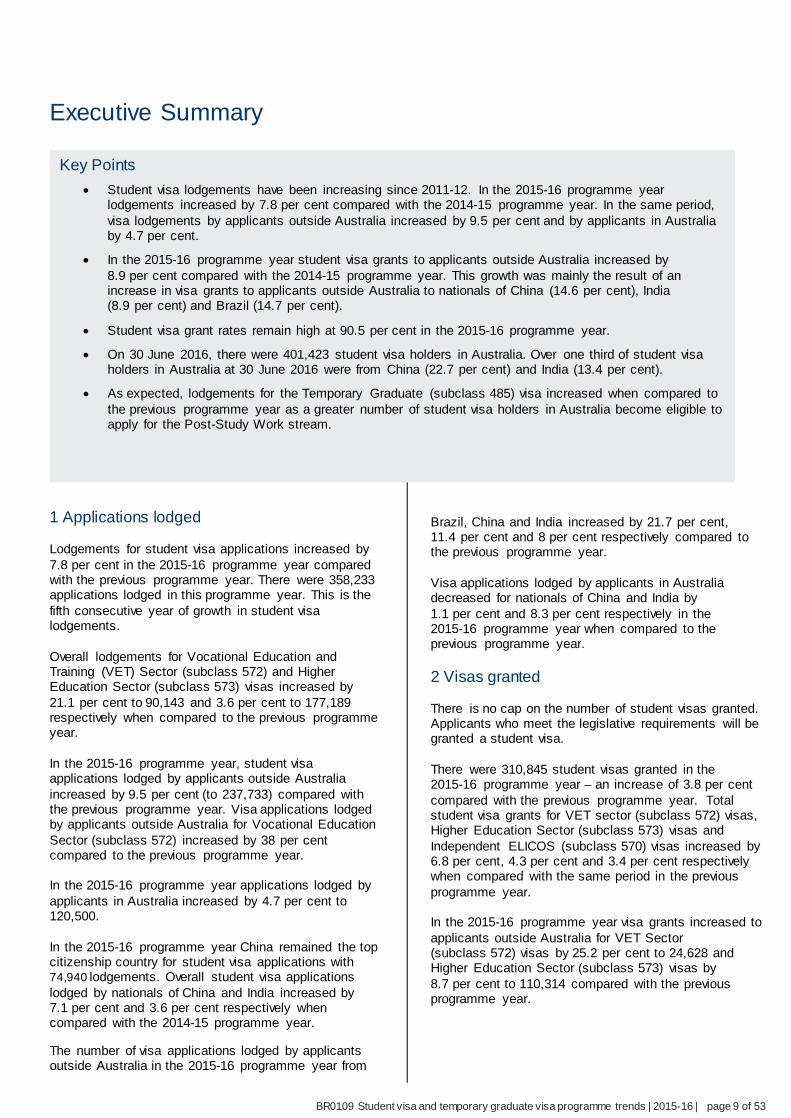
Key Points • Student visa lodgements have been increasing since 2011-12. In the 2015-16 programme year
lodgements increased by 7.8 per cent compared with the 2014-15 programme year. In the same period,visa lodgements by applicants outside Australia increased by 9.5 per cent and by applicants in Australiaby 4.7 per cent.
• In the 2015-16 programme year student visa grants to applicants outside Australia increased by8.9 per cent compared with the 2014-15 programme year. This growth was mainly the result of anincrease in visa grants to applicants outside Australia to nationals of China (14.6 per cent), India(8.9 per cent) and Brazil (14.7 per cent).
• Student visa grant rates remain high at 90.5 per cent in the 2015-16 programme year.
• On 30 June 2016, there were 401,423 student visa holders in Australia. Over one third of student visa holders in Australia at 30 June 2016 were from China (22.7 per cent) and India (13.4 per cent).
• As expected, lodgements for the Temporary Graduate (subclass 485) visa increased when compared tothe previous programme year as a greater number of student visa holders in Australia become eligible to apply for the Post-Study Work stream.
1 Applications lodged Brazil, China and India increased by 21.7 per cent, 11.4 per cent and 8 per cent respectively compared to
Lodgements for student visa applications increased by the previous programme year. 7.8 per cent in the 2015-16 programme year compared with the previous programme year. There were 358,233 Visa applications lodged by applicants in Australia applications lodged in this programme year. This is the decreased for nationals of China and India by fifth consecutive year of growth in student visa 1.1 per cent and 8.3 per cent respectively in the lodgements. 2015-16 programme year when compared to the
previous programme year. Overall lodgements for Vocational Education and Training (VET) Sector (subclass 572) and Higher 2 Visas granted Education Sector (subclass 573) visas increased by 21.1 per cent to 90,143 and 3.6 per cent to 177,189 There is no cap on the number of student visas granted. respectively when compared to the previous programme Applicants who meet the legislative requirements will be year. granted a student visa.
In the 2015-16 programme year, student visa There were 310,845 student visas granted in the applications lodged by applicants outside Australia 2015-16 programme year – an increase of 3.8 per cent increased by 9.5 per cent (to 237,733) compared with compared with the previous programme year. Total the previous programme year. Visa applications lodged student visa grants for VET sector (subclass 572) visas, by applicants outside Australia for Vocational Education Higher Education Sector (subclass 573) visas and Sector (subclass 572) increased by 38 per cent Independent ELICOS (subclass 570) visas increased by compared to the previous programme year. 6.8 per cent, 4.3 per cent and 3.4 per cent respectively
when compared with the same period in the previous In the 2015-16 programme year applications lodged by programme year. applicants in Australia increased by 4.7 per cent to 120,500. In the 2015-16 programme year visa grants increased to
applicants outside Australia for VET Sector In the 2015-16 programme year China remained the top (subclass 572) visas by 25.2 per cent to 24,628 and citizenship country for student visa applications with Higher Education Sector (subclass 573) visas by 74,940 lodgements. Overall student visa applications 8.7 per cent to 110,314 compared with the previous lodged by nationals of China and India increased by programme year. 7.1 per cent and 3.6 per cent respectively when compared with the 2014-15 programme year.
The number of visa applications lodged by applicants outside Australia in the 2015-16 programme year from
BR0109 Student visa and temporary graduate visa programme trends | 2015-16 | page 9 of 53
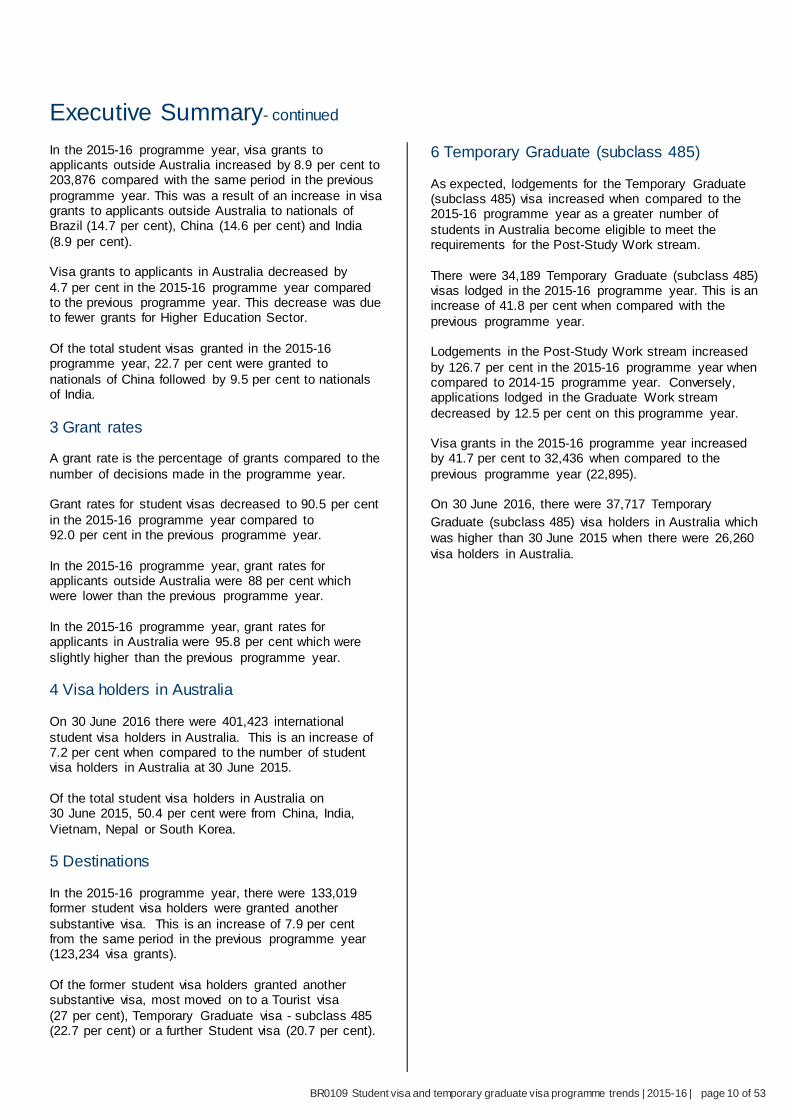
Executive Summary- continued
In the 2015-16 programme year, visa grants to 6 Temporary Graduate (subclass 485) applicants outside Australia increased by 8.9 per cent to 203,876 compared with the same period in the previous As expected, lodgements for the Temporary Graduate programme year. This was a result of an increase in visa (subclass 485) visa increased when compared to the grants to applicants outside Australia to nationals of 2015-16 programme year as a greater number of Brazil (14.7 per cent), China (14.6 per cent) and India students in Australia become eligible to meet the (8.9 per cent). requirements for the Post-Study Work stream.
Visa grants to applicants in Australia decreased by There were 34,189 Temporary Graduate (subclass 485) 4.7 per cent in the 2015-16 programme year compared visas lodged in the 2015-16 programme year. This is an to the previous programme year. This decrease was due increase of 41.8 per cent when compared with the to fewer grants for Higher Education Sector. previous programme year.
Of the total student visas granted in the 2015-16 Lodgements in the Post-Study Work stream increased programme year, 22.7 per cent were granted to by 126.7 per cent in the 2015-16 programme year when nationals of China followed by 9.5 per cent to nationals compared to 2014-15 programme year. Conversely, of India. applications lodged in the Graduate Work stream
decreased by 12.5 per cent on this programme year. 3 Grant rates
Visa grants in the 2015-16 programme year increased A grant rate is the percentage of grants compared to the by 41.7 per cent to 32,436 when compared to the number of decisions made in the programme year. previous programme year (22,895).
Grant rates for student visas decreased to 90.5 per cent On 30 June 2016, there were 37,717 Temporary in the 2015-16 programme year compared to Graduate (subclass 485) visa holders in Australia which 92.0 per cent in the previous programme year. was higher than 30 June 2015 when there were 26,260
visa holders in Australia. In the 2015-16 programme year, grant rates for applicants outside Australia were 88 per cent which were lower than the previous programme year.
In the 2015-16 programme year, grant rates for applicants in Australia were 95.8 per cent which were slightly higher than the previous programme year.
4 Visa holders in Australia
On 30 June 2016 there were 401,423 international student visa holders in Australia. This is an increase of 7.2 per cent when compared to the number of student visa holders in Australia at 30 June 2015.
Of the total student visa holders in Australia on 30 June 2015, 50.4 per cent were from China, India, Vietnam, Nepal or South Korea.
5 Destinations
In the 2015-16 programme year, there were 133,019 former student visa holders were granted another substantive visa. This is an increase of 7.9 per cent from the same period in the previous programme year (123,234 visa grants).
Of the former student visa holders granted another substantive visa, most moved on to a Tourist visa (27 per cent), Temporary Graduate visa - subclass 485 (22.7 per cent) or a further Student visa (20.7 per cent).
BR0109 Student visa and temporary graduate visa programme trends | 2015-16 | page 10 of 53

1 Lodged
BR0109 Student visa and temporary graduate visa programme trends | 2015-16 | page 11 of 53
1 Lodged
0
50,000
100,000
150,000
200,000
250,000
300,000
350,000
400,000
576 Foreign Affairs orDefence Sector
575 Non-Award Sector
574 PostgraduateResearch Sector
573 Higher EducationSector
572 VocationalEducation and TrainingSector
571 Schools Sector
570 IndependentELICOS Sector
2015-162014-152013-142012-132011-122010-112009-10
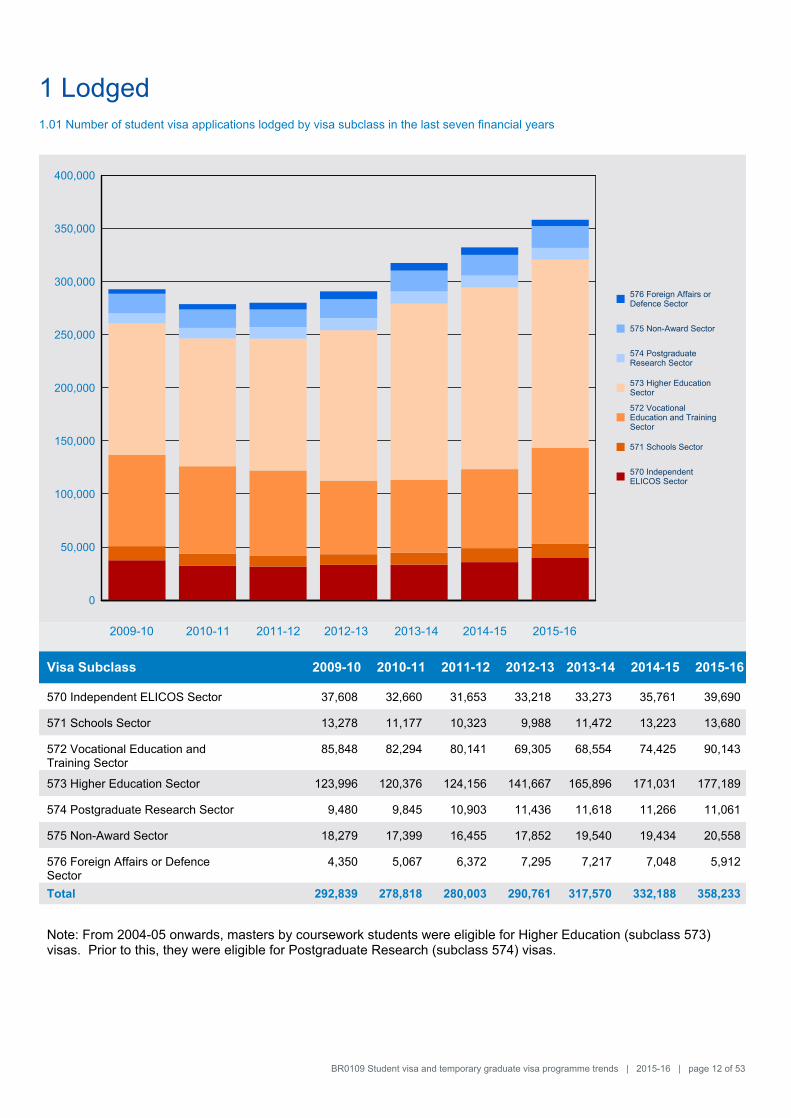
1.01 Number of student visa applications lodged by visa subclass in the last seven financial years
Visa Subclass 2009-10 2010-11 2011-12 2012-13 2013-14 2014-15 2015-16
570 Independent ELICOS Sector 37,608 32,660 31,653 33,218 33,273 35,761 39,690
571 Schools Sector 13,278 11,177 10,323 9,988 11,472 13,223 13,680
572 Vocational Education and 85,848 82,294 80,141 69,305 68,554 74,425 90,143 Training Sector
573 Higher Education Sector 123,996 120,376 124,156 141,667 165,896 171,031 177,189
574 Postgraduate Research Sector 9,480 9,845 10,903 11,436 11,618 11,266 11,061
575 Non-Award Sector 18,279 17,399 16,455 17,852 19,540 19,434 20,558
576 Foreign Affairs or Defence 4,350 5,067 6,372 7,295 7,217 7,048 5,912 Sector
Total 292,839 278,818 280,003 290,761 317,570 332,188 358,233
Note: From 2004-05 onwards, masters by coursework students were eligible for Higher Education (subclass 573) visas. Prior to this, they were eligible for Postgraduate Research (subclass 574) visas.
BR0109 Student visa and temporary graduate visa programme trends | 2015-16 | page 12 of 53
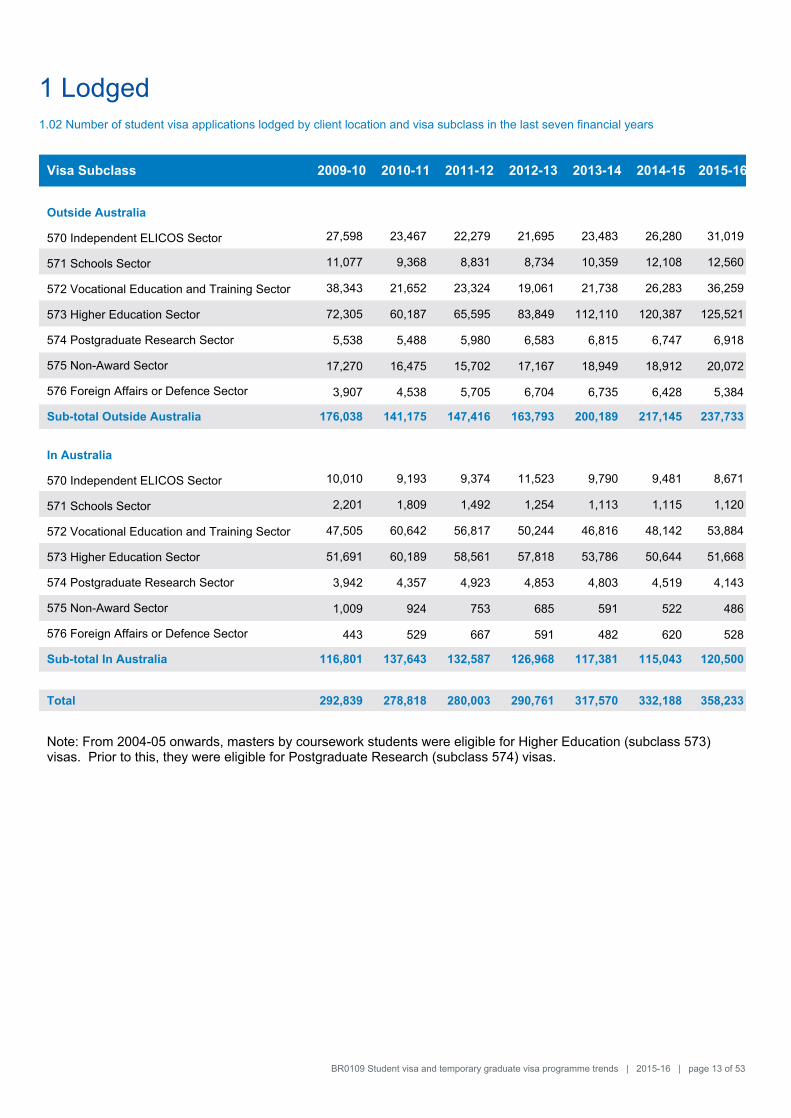
1 Lodged1.02 Number of student visa applications lodged by client location and visa subclass in the last seven financial years
Visa Subclass 2009-10 2010-11 2011-12 2012-13 2013-14 2014-15 2015-16
Outside Australia
570 Independent ELICOS Sector 27,598 23,467 22,279 21,695 23,483 26,280 31,019
571 Schools Sector 11,077 9,368 8,831 8,734 10,359 12,108 12,560
572 Vocational Education and Training Sector 38,343 21,652 23,324 19,061 21,738 26,283 36,259
573 Higher Education Sector 72,305 60,187 65,595 83,849 112,110 120,387 125,521
574 Postgraduate Research Sector 5,538 5,488 5,980 6,583 6,815 6,747 6,918
575 Non-Award Sector 17,270 16,475 15,702 17,167 18,949 18,912 20,072
576 Foreign Affairs or Defence Sector 3,907 4,538 5,705 6,704 6,735 6,428 5,384
Sub-total Outside Australia 176,038 141,175 147,416 163,793 200,189 217,145 237,733
In Australia
570 Independent ELICOS Sector 10,010 9,193 9,374 11,523 9,790 9,481 8,671
571 Schools Sector 2,201 1,809 1,492 1,254 1,113 1,115 1,120
572 Vocational Education and Training Sector 47,505 60,642 56,817 50,244 46,816 48,142 53,884
573 Higher Education Sector 51,691 60,189 58,561 57,818 53,786 50,644 51,668
574 Postgraduate Research Sector 3,942 4,357 4,923 4,853 4,803 4,519 4,143
575 Non-Award Sector 1,009 924 753 685 591 522 486
576 Foreign Affairs or Defence Sector 443 529 667 591 482 620 528
Sub-total In Australia 116,801 137,643 132,587 126,968 117,381 115,043 120,500
Total 292,839 278,818 280,003 290,761 317,570 332,188 358,233
Note: From 2004-05 onwards, masters by coursework students were eligible for Higher Education (subclass 573) visas. Prior to this, they were eligible for Postgraduate Research (subclass 574) visas.
BR0109 Student visa and temporary graduate visa programme trends | 2015-16 | page 13 of 53
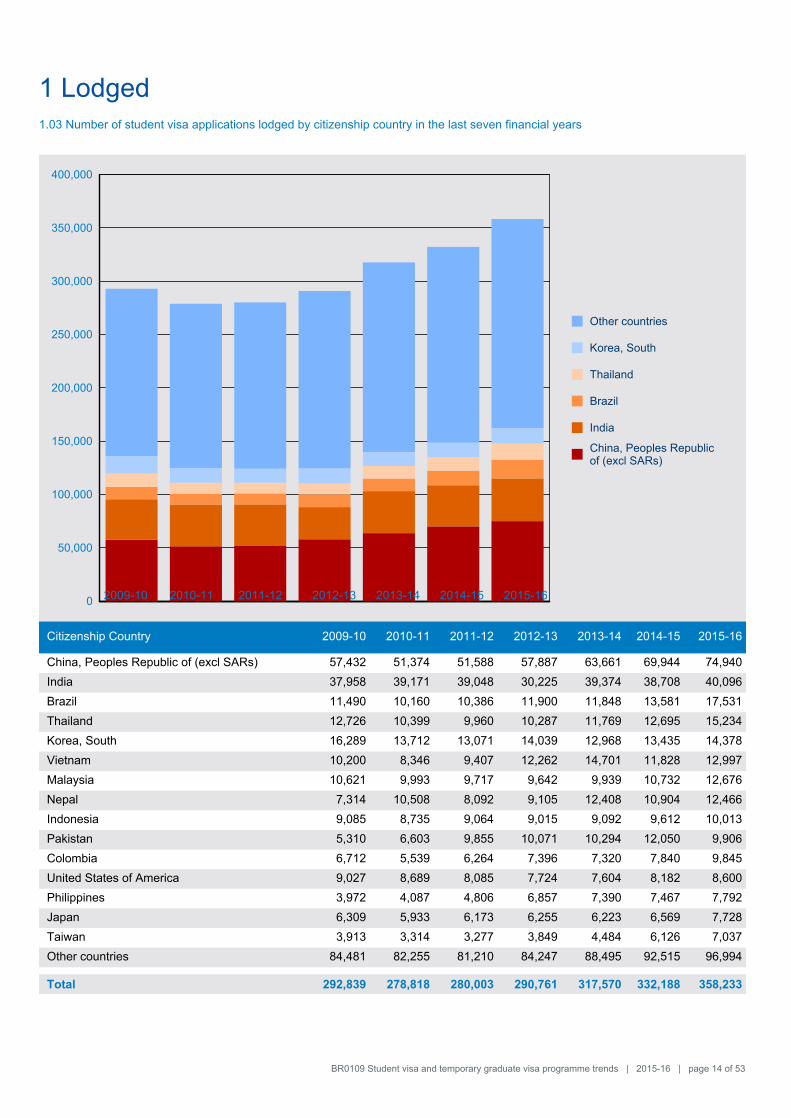
1 Lodged1.03 Number of student visa applications lodged by citizenship country in the last seven financial years
0
50,000
100,000
150,000
200,000
250,000
300,000
350,000
400,000
Other countries
Korea, South
Thailand
Brazil
India
China, Peoples Republicof (excl SARs)
2015-162009-10 2010-11 2011-12 2012-13 2013-14 2014-15
Citizenship Country 2009-10 2010-11 2011-12 2012-13 2013-14 2014-15 2015-16
China, Peoples Republic of (excl SARs) 57,432 51,374 51,588 57,887 63,661 69,944 74,940
India 37,958 39,171 39,048 30,225 39,374 38,708 40,096
Brazil 11,490 10,160 10,386 11,900 11,848 13,581 17,531
Thailand 12,726 10,399 9,960 10,287 11,769 12,695 15,234
Korea, South 16,289 13,712 13,071 14,039 12,968 13,435 14,378
Vietnam 10,200 8,346 9,407 12,262 14,701 11,828 12,997
Malaysia 10,621 9,993 9,717 9,642 9,939 10,732 12,676
Nepal 7,314 10,508 8,092 9,105 12,408 10,904 12,466
Indonesia 9,085 8,735 9,064 9,015 9,092 9,612 10,013
Pakistan 5,310 6,603 9,855 10,071 10,294 12,050 9,906
Colombia 6,712 5,539 6,264 7,396 7,320 7,840 9,845
United States of America 9,027 8,689 8,085 7,724 7,604 8,182 8,600
Philippines 3,972 4,087 4,806 6,857 7,390 7,467 7,792
Japan 6,309 5,933 6,173 6,255 6,223 6,569 7,728
Taiwan 3,913 3,314 3,277 3,849 4,484 6,126 7,037
Other countries 84,481 82,255 81,210 84,247 88,495 92,515 96,994
Total 292,839 278,818 280,003 290,761 317,570 332,188 358,233
BR0109 Student visa and temporary graduate visa programme trends | 2015-16 | page 14 of 53
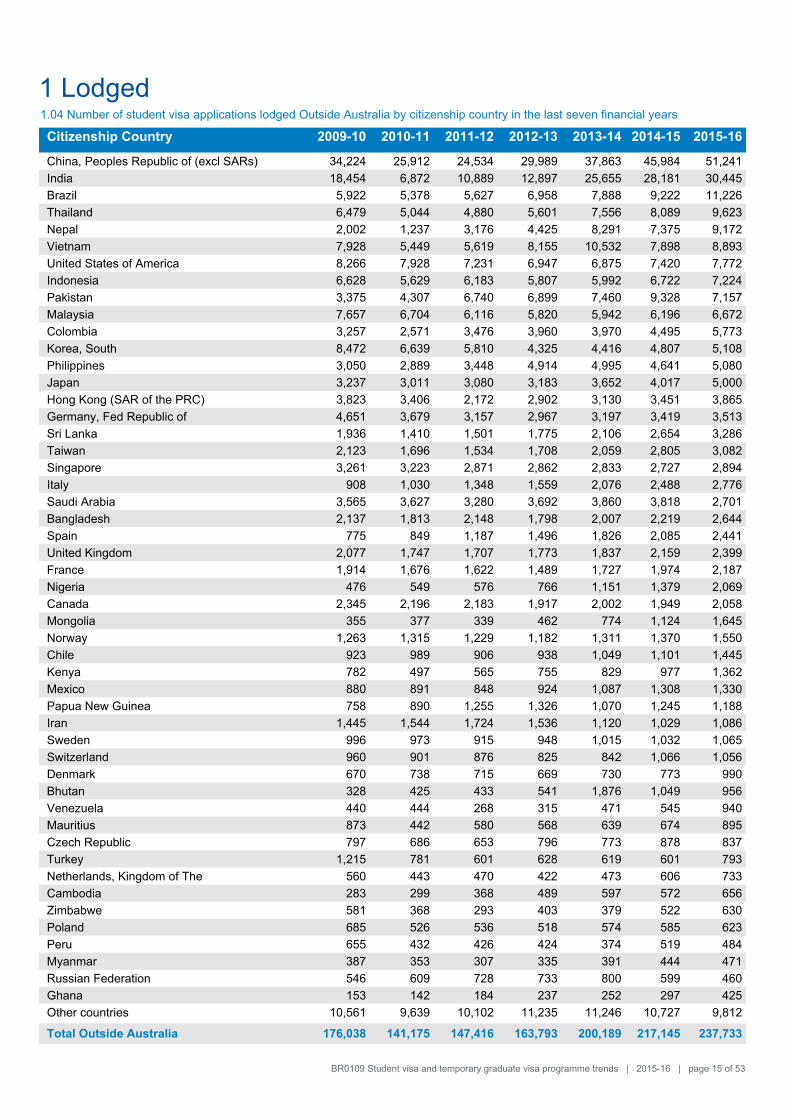
1 Lodged1.04 Number of student visa applications lodged Outside Australia by citizenship country in the last seven financial years
Citizenship Country 2009-10 2010-11 2011-12 2012-13 2013-14 2014-15 2015-16
China, Peoples Republic of (excl SARs) 34,224 25,912 24,534 29,989 37,863 45,984 51,241
India 18,454 6,872 10,889 12,897 25,655 28,181 30,445
Brazil 5,922 5,378 5,627 6,958 7,888 9,222 11,226
Thailand 6,479 5,044 4,880 5,601 7,556 8,089 9,623
Nepal 2,002 1,237 3,176 4,425 8,291 7,375 9,172
Vietnam 7,928 5,449 5,619 8,155 10,532 7,898 8,893
United States of America 8,266 7,928 7,231 6,947 6,875 7,420 7,772
Indonesia 6,628 5,629 6,183 5,807 5,992 6,722 7,224
Pakistan 3,375 4,307 6,740 6,899 7,460 9,328 7,157
Malaysia 7,657 6,704 6,116 5,820 5,942 6,196 6,672
Colombia 3,257 2,571 3,476 3,960 3,970 4,495 5,773
Korea, South 8,472 6,639 5,810 4,325 4,416 4,807 5,108
Philippines 3,050 2,889 3,448 4,914 4,995 4,641 5,080
Japan 3,237 3,011 3,080 3,183 3,652 4,017 5,000
Hong Kong (SAR of the PRC) 3,823 3,406 2,172 2,902 3,130 3,451 3,865
Germany, Fed Republic of 4,651 3,679 3,157 2,967 3,197 3,419 3,513
Sri Lanka 1,936 1,410 1,501 1,775 2,106 2,654 3,286
Taiwan 2,123 1,696 1,534 1,708 2,059 2,805 3,082
Singapore 3,261 3,223 2,871 2,862 2,833 2,727 2,894
Italy 908 1,030 1,348 1,559 2,076 2,488 2,776
Saudi Arabia 3,565 3,627 3,280 3,692 3,860 3,818 2,701
Bangladesh 2,137 1,813 2,148 1,798 2,007 2,219 2,644
Spain 775 849 1,187 1,496 1,826 2,085 2,441
United Kingdom 2,077 1,747 1,707 1,773 1,837 2,159 2,399
France 1,914 1,676 1,622 1,489 1,727 1,974 2,187
Nigeria 476 549 576 766 1,151 1,379 2,069
Canada 2,345 2,196 2,183 1,917 2,002 1,949 2,058
Mongolia 355 377 339 462 774 1,124 1,645
Norway 1,263 1,315 1,229 1,182 1,311 1,370 1,550
Chile 923 989 906 938 1,049 1,101 1,445
Kenya 782 497 565 755 829 977 1,362
Mexico 880 891 848 924 1,087 1,308 1,330
Papua New Guinea 758 890 1,255 1,326 1,070 1,245 1,188
Iran 1,445 1,544 1,724 1,536 1,120 1,029 1,086
Sweden 996 973 915 948 1,015 1,032 1,065
Switzerland 960 901 876 825 842 1,066 1,056
Denmark 670 738 715 669 730 773 990
Bhutan 328 425 433 541 1,876 1,049 956
Venezuela 440 444 268 315 471 545 940
Mauritius 873 442 580 568 639 674 895
Czech Republic 797 686 653 796 773 878 837
Turkey 1,215 781 601 628 619 601 793
Netherlands, Kingdom of The 560 443 470 422 473 606 733
Cambodia 283 299 368 489 597 572 656
Zimbabwe 581 368 293 403 379 522 630
Poland 685 526 536 518 574 585 623
Peru 655 432 426 424 374 519 484
Myanmar 387 353 307 335 391 444 471
Russian Federation 546 609 728 733 800 599 460
Ghana 153 142 184 237 252 297 425
Other countries 10,561 9,639 10,102 11,235 11,246 10,727 9,812
Total Outside Australia 176,038 141,175 147,416 163,793 200,189 217,145 237,733
BR0109 Student visa and temporary graduate visa programme trends | 2015-16 | page 15 of 53
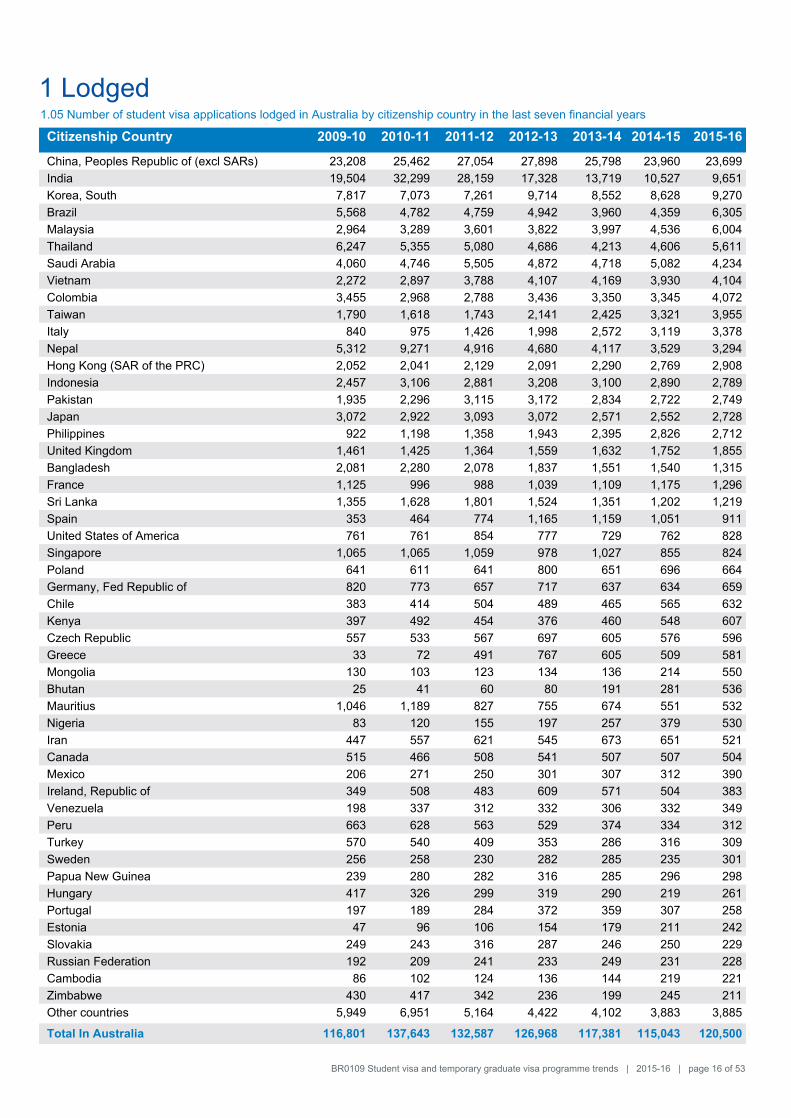
1 Lodged1.05 Number of student visa applications lodged in Australia by citizenship country in the last seven financial years
Citizenship Country 2009-10 2010-11 2011-12 2012-13 2013-14 2014-15 2015-16
China, Peoples Republic of (excl SARs) 23,208 25,462 27,054 27,898 25,798 23,960 23,699
India 19,504 32,299 28,159 17,328 13,719 10,527 9,651
Korea, South 7,817 7,073 7,261 9,714 8,552 8,628 9,270
Brazil 5,568 4,782 4,759 4,942 3,960 4,359 6,305
Malaysia 2,964 3,289 3,601 3,822 3,997 4,536 6,004
Thailand 6,247 5,355 5,080 4,686 4,213 4,606 5,611
Saudi Arabia 4,060 4,746 5,505 4,872 4,718 5,082 4,234
Vietnam 2,272 2,897 3,788 4,107 4,169 3,930 4,104
Colombia 3,455 2,968 2,788 3,436 3,350 3,345 4,072
Taiwan 1,790 1,618 1,743 2,141 2,425 3,321 3,955
Italy 840 975 1,426 1,998 2,572 3,119 3,378
Nepal 5,312 9,271 4,916 4,680 4,117 3,529 3,294
Hong Kong (SAR of the PRC) 2,052 2,041 2,129 2,091 2,290 2,769 2,908
Indonesia 2,457 3,106 2,881 3,208 3,100 2,890 2,789
Pakistan 1,935 2,296 3,115 3,172 2,834 2,722 2,749
Japan 3,072 2,922 3,093 3,072 2,571 2,552 2,728
Philippines 922 1,198 1,358 1,943 2,395 2,826 2,712
United Kingdom 1,461 1,425 1,364 1,559 1,632 1,752 1,855
Bangladesh 2,081 2,280 2,078 1,837 1,551 1,540 1,315
France 1,125 996 988 1,039 1,109 1,175 1,296
Sri Lanka 1,355 1,628 1,801 1,524 1,351 1,202 1,219
Spain 353 464 774 1,165 1,159 1,051 911
United States of America 761 761 854 777 729 762 828
Singapore 1,065 1,065 1,059 978 1,027 855 824
Poland 641 611 641 800 651 696 664
Germany, Fed Republic of 820 773 657 717 637 634 659
Chile 383 414 504 489 465 565 632
Kenya 397 492 454 376 460 548 607
Czech Republic 557 533 567 697 605 576 596
Greece 33 72 491 767 605 509 581
Mongolia 130 103 123 134 136 214 550
Bhutan 25 41 60 80 191 281 536
Mauritius 1,046 1,189 827 755 674 551 532
Nigeria 83 120 155 197 257 379 530
Iran 447 557 621 545 673 651 521
Canada 515 466 508 541 507 507 504
Mexico 206 271 250 301 307 312 390
Ireland, Republic of 349 508 483 609 571 504 383
Venezuela 198 337 312 332 306 332 349
Peru 663 628 563 529 374 334 312
Turkey 570 540 409 353 286 316 309
Sweden 256 258 230 282 285 235 301
Papua New Guinea 239 280 282 316 285 296 298
Hungary 417 326 299 319 290 219 261
Portugal 197 189 284 372 359 307 258
Estonia 47 96 106 154 179 211 242
Slovakia 249 243 316 287 246 250 229
Russian Federation 192 209 241 233 249 231 228
Cambodia 86 102 124 136 144 219 221
Zimbabwe 430 417 342 236 199 245 211
Other countries 5,949 6,951 5,164 4,422 4,102 3,883 3,885
Total In Australia 116,801 137,643 132,587 126,968 117,381 115,043 120,500
BR0109 Student visa and temporary graduate visa programme trends | 2015-16 | page 16 of 53

2 Granted
BR0109 Student visa and temporary graduate visa programme trends | 2015-16 | page 17 of 53
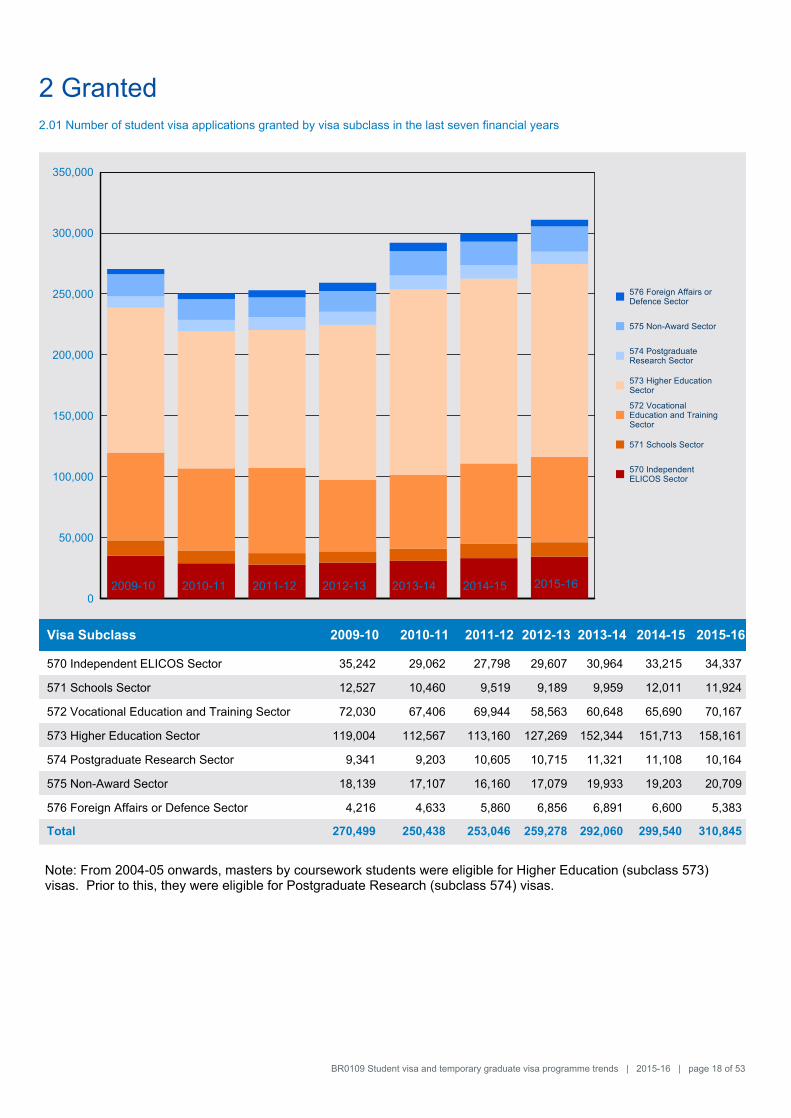
2 Granted2.01 Number of student visa applications granted by visa subclass in the last seven financial years
0
50,000
100,000
150,000
200,000
250,000
300,000
350,000
576 Foreign Affairs orDefence Sector
575 Non-Award Sector
574 PostgraduateResearch Sector
573 Higher EducationSector
572 VocationalEducation and TrainingSector
571 Schools Sector
570 IndependentELICOS Sector
2015-162009-10 2010-11 2011-12 2012-13 2013-14 2014-15
Visa Subclass 2009-10 2010-11 2011-12 2012-13 2013-14 2014-15 2015-16
570 Independent ELICOS Sector 35,242 29,062 27,798 29,607 30,964 33,215 34,337
571 Schools Sector 12,527 10,460 9,519 9,189 9,959 12,011 11,924
572 Vocational Education and Training Sector 72,030 67,406 69,944 58,563 60,648 65,690 70,167
573 Higher Education Sector 119,004 112,567 113,160 127,269 152,344 151,713 158,161
574 Postgraduate Research Sector 9,341 9,203 10,605 10,715 11,321 11,108 10,164
575 Non-Award Sector 18,139 17,107 16,160 17,079 19,933 19,203 20,709
576 Foreign Affairs or Defence Sector 4,216 4,633 5,860 6,856 6,891 6,600 5,383
Total 270,499 250,438 253,046 259,278 292,060 299,540 310,845
Note: From 2004-05 onwards, masters by coursework students were eligible for Higher Education (subclass 573) visas. Prior to this, they were eligible for Postgraduate Research (subclass 574) visas.
BR0109 Student visa and temporary graduate visa programme trends | 2015-16 | page 18 of 53
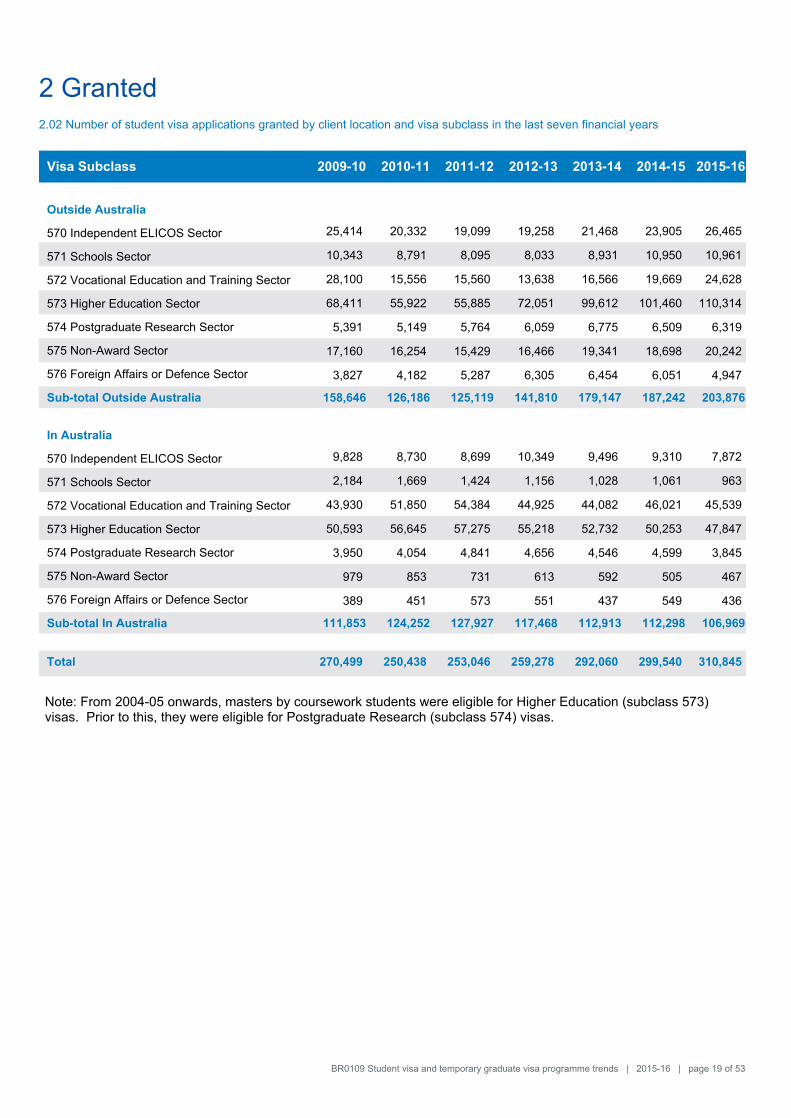
2 Granted2.02 Number of student visa applications granted by client location and visa subclass in the last seven financial years
Visa Subclass 2009-10 2010-11 2011-12 2012-13 2013-14 2014-15 2015-16
Outside Australia
570 Independent ELICOS Sector 25,414 20,332 19,099 19,258 21,468 23,905 26,465
571 Schools Sector 10,343 8,791 8,095 8,033 8,931 10,950 10,961
572 Vocational Education and Training Sector 28,100 15,556 15,560 13,638 16,566 19,669 24,628
573 Higher Education Sector 68,411 55,922 55,885 72,051 99,612 101,460 110,314
574 Postgraduate Research Sector 5,391 5,149 5,764 6,059 6,775 6,509 6,319
575 Non-Award Sector 17,160 16,254 15,429 16,466 19,341 18,698 20,242
576 Foreign Affairs or Defence Sector 3,827 4,182 5,287 6,305 6,454 6,051 4,947
Sub-total Outside Australia 158,646 126,186 125,119 141,810 179,147 187,242 203,876
In Australia
570 Independent ELICOS Sector 9,828 8,730 8,699 10,349 9,496 9,310 7,872
571 Schools Sector 2,184 1,669 1,424 1,156 1,028 1,061 963
572 Vocational Education and Training Sector 43,930 51,850 54,384 44,925 44,082 46,021 45,539
573 Higher Education Sector 50,593 56,645 57,275 55,218 52,732 50,253 47,847
574 Postgraduate Research Sector 3,950 4,054 4,841 4,656 4,546 4,599 3,845
575 Non-Award Sector 979 853 731 613 592 505 467
576 Foreign Affairs or Defence Sector 389 451 573 551 437 549 436
Sub-total In Australia 111,853 124,252 127,927 117,468 112,913 112,298 106,969
Total 270,499 250,438 253,046 259,278 292,060 299,540 310,845
Note: From 2004-05 onwards, masters by coursework students were eligible for Higher Education (subclass 573) visas. Prior to this, they were eligible for Postgraduate Research (subclass 574) visas.
BR0109 Student visa and temporary graduate visa programme trends | 2015-16 | page 19 of 53
2 Granted
0
50,000
100,000
150,000
200,000
250,000
300,000
350,000
Other countries
Malaysia
Korea, South
Brazil
India
China, Peoples Republicof (excl SARs)
2015-162009-10 2010-11 2011-12 2012-13 2013-14 2014-15
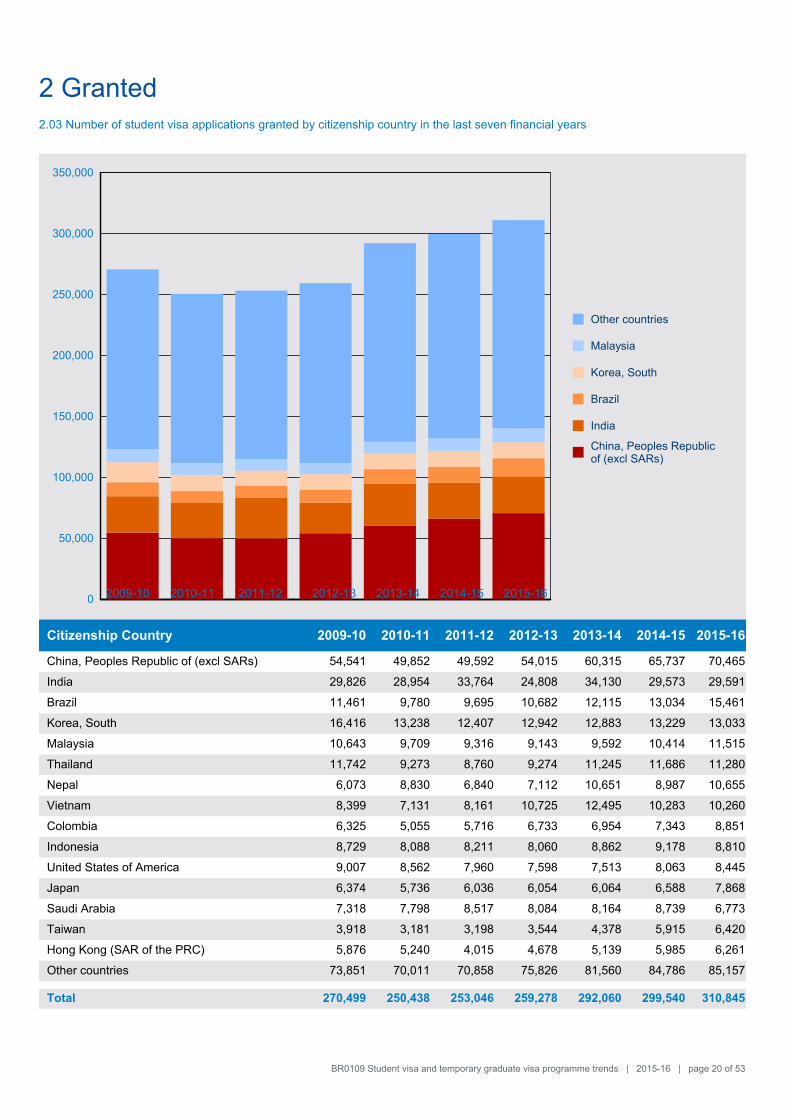
2.03 Number of student visa applications granted by citizenship country in the last seven financial years
Citizenship Country 2009-10 2010-11 2011-12 2012-13 2013-14 2014-15 2015-16
China, Peoples Republic of (excl SARs) 54,541 49,852 49,592 54,015 60,315 65,737 70,465
India 29,826 28,954 33,764 24,808 34,130 29,573 29,591
Brazil 11,461 9,780 9,695 10,682 12,115 13,034 15,461
Korea, South 16,416 13,238 12,407 12,942 12,883 13,229 13,033
Malaysia 10,643 9,709 9,316 9,143 9,592 10,414 11,515
Thailand 11,742 9,273 8,760 9,274 11,245 11,686 11,280
Nepal 6,073 8,830 6,840 7,112 10,651 8,987 10,655
Vietnam 8,399 7,131 8,161 10,725 12,495 10,283 10,260
Colombia 6,325 5,055 5,716 6,733 6,954 7,343 8,851
Indonesia 8,729 8,088 8,211 8,060 8,862 9,178 8,810
United States of America 9,007 8,562 7,960 7,598 7,513 8,063 8,445
Japan 6,374 5,736 6,036 6,054 6,064 6,588 7,868
Saudi Arabia 7,318 7,798 8,517 8,084 8,164 8,739 6,773
Taiwan 3,918 3,181 3,198 3,544 4,378 5,915 6,420
Hong Kong (SAR of the PRC) 5,876 5,240 4,015 4,678 5,139 5,985 6,261
Other countries 73,851 70,011 70,858 75,826 81,560 84,786 85,157
Total 270,499 250,438 253,046 259,278 292,060 299,540 310,845
BR0109 Student visa and temporary graduate visa programme trends | 2015-16 | page 20 of 53
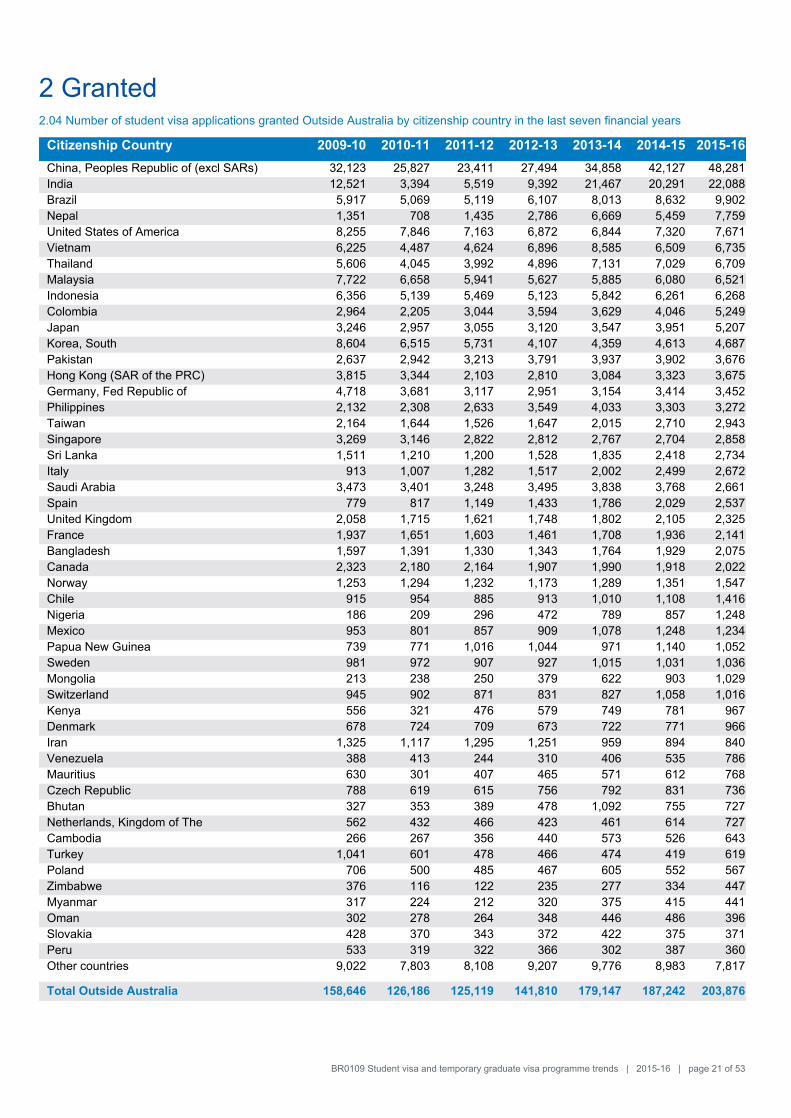
2 Granted2.04 Number of student visa applications granted Outside Australia by citizenship country in the last seven financial years
Citizenship Country 2009-10 2010-11 2011-12 2012-13 2013-14 2014-15 2015-16
China, Peoples Republic of (excl SARs) 32,123 25,827 23,411 27,494 34,858 42,127 48,281
India 12,521 3,394 5,519 9,392 21,467 20,291 22,088
Brazil 5,917 5,069 5,119 6,107 8,013 8,632 9,902
Nepal 1,351 708 1,435 2,786 6,669 5,459 7,759
United States of America 8,255 7,846 7,163 6,872 6,844 7,320 7,671
Vietnam 6,225 4,487 4,624 6,896 8,585 6,509 6,735
Thailand 5,606 4,045 3,992 4,896 7,131 7,029 6,709
Malaysia 7,722 6,658 5,941 5,627 5,885 6,080 6,521
Indonesia 6,356 5,139 5,469 5,123 5,842 6,261 6,268
Colombia 2,964 2,205 3,044 3,594 3,629 4,046 5,249
Japan 3,246 2,957 3,055 3,120 3,547 3,951 5,207
Korea, South 8,604 6,515 5,731 4,107 4,359 4,613 4,687
Pakistan 2,637 2,942 3,213 3,791 3,937 3,902 3,676
Hong Kong (SAR of the PRC) 3,815 3,344 2,103 2,810 3,084 3,323 3,675
Germany, Fed Republic of 4,718 3,681 3,117 2,951 3,154 3,414 3,452
Philippines 2,132 2,308 2,633 3,549 4,033 3,303 3,272
Taiwan 2,164 1,644 1,526 1,647 2,015 2,710 2,943
Singapore 3,269 3,146 2,822 2,812 2,767 2,704 2,858
Sri Lanka 1,511 1,210 1,200 1,528 1,835 2,418 2,734
Italy 913 1,007 1,282 1,517 2,002 2,499 2,672
Saudi Arabia 3,473 3,401 3,248 3,495 3,838 3,768 2,661
Spain 779 817 1,149 1,433 1,786 2,029 2,537
United Kingdom 2,058 1,715 1,621 1,748 1,802 2,105 2,325
France 1,937 1,651 1,603 1,461 1,708 1,936 2,141
Bangladesh 1,597 1,391 1,330 1,343 1,764 1,929 2,075
Canada 2,323 2,180 2,164 1,907 1,990 1,918 2,022
Norway 1,253 1,294 1,232 1,173 1,289 1,351 1,547
Chile 915 954 885 913 1,010 1,108 1,416
Nigeria 186 209 296 472 789 857 1,248
Mexico 953 801 857 909 1,078 1,248 1,234
Papua New Guinea 739 771 1,016 1,044 971 1,140 1,052
Sweden 981 972 907 927 1,015 1,031 1,036
Mongolia 213 238 250 379 622 903 1,029
Switzerland 945 902 871 831 827 1,058 1,016
Kenya 556 321 476 579 749 781 967
Denmark 678 724 709 673 722 771 966
Iran 1,325 1,117 1,295 1,251 959 894 840
Venezuela 388 413 244 310 406 535 786
Mauritius 630 301 407 465 571 612 768
Czech Republic 788 619 615 756 792 831 736
Bhutan 327 353 389 478 1,092 755 727
Netherlands, Kingdom of The 562 432 466 423 461 614 727
Cambodia 266 267 356 440 573 526 643
Turkey 1,041 601 478 466 474 419 619
Poland 706 500 485 467 605 552 567
Zimbabwe 376 116 122 235 277 334 447
Myanmar 317 224 212 320 375 415 441
Oman 302 278 264 348 446 486 396
Slovakia 428 370 343 372 422 375 371
Peru 533 319 322 366 302 387 360
Other countries 9,022 7,803 8,108 9,207 9,776 8,983 7,817
Total Outside Australia 158,646 126,186 125,119 141,810 179,147 187,242 203,876
BR0109 Student visa and temporary graduate visa programme trends | 2015-16 | page 21 of 53
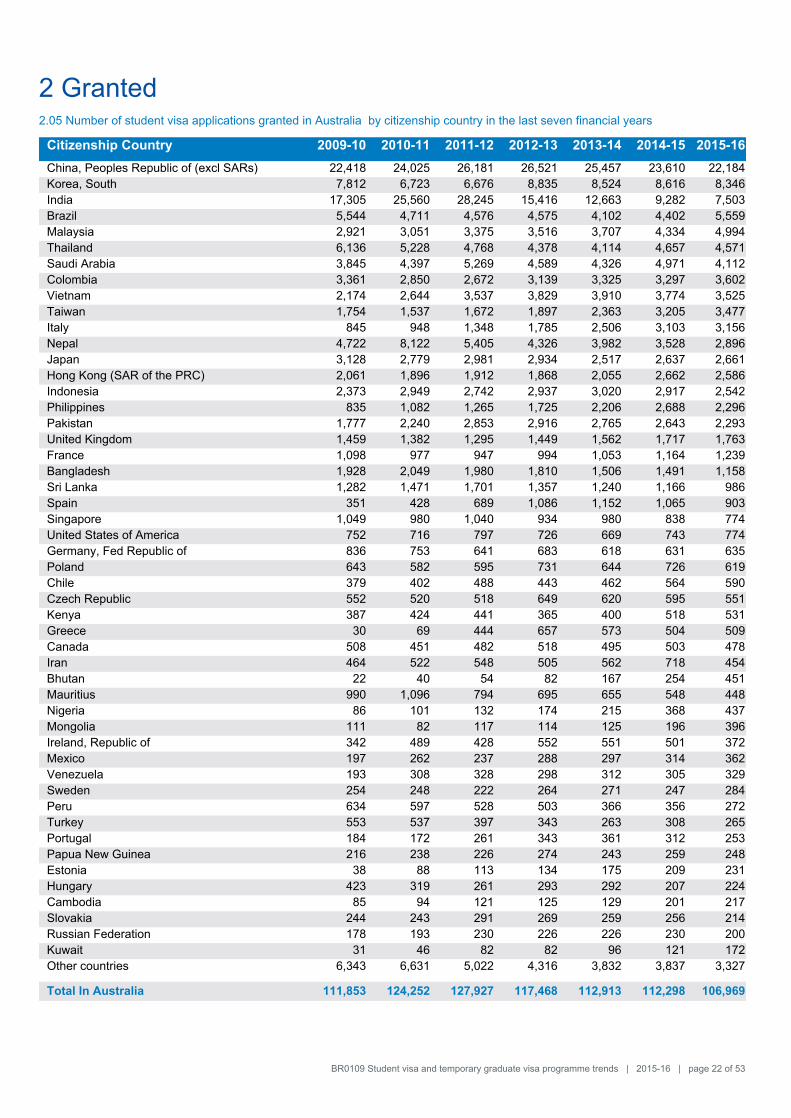
2 Granted2.05 Number of student visa applications granted in Australia by citizenship country in the last seven financial years
Citizenship Country 2009-10 2010-11 2011-12 2012-13 2013-14 2014-15 2015-16
China, Peoples Republic of (excl SARs) 22,418 24,025 26,181 26,521 25,457 23,610 22,184
Korea, South 7,812 6,723 6,676 8,835 8,524 8,616 8,346
India 17,305 25,560 28,245 15,416 12,663 9,282 7,503
Brazil 5,544 4,711 4,576 4,575 4,102 4,402 5,559
Malaysia 2,921 3,051 3,375 3,516 3,707 4,334 4,994
Thailand 6,136 5,228 4,768 4,378 4,114 4,657 4,571
Saudi Arabia 3,845 4,397 5,269 4,589 4,326 4,971 4,112
Colombia 3,361 2,850 2,672 3,139 3,325 3,297 3,602
Vietnam 2,174 2,644 3,537 3,829 3,910 3,774 3,525
Taiwan 1,754 1,537 1,672 1,897 2,363 3,205 3,477
Italy 845 948 1,348 1,785 2,506 3,103 3,156
Nepal 4,722 8,122 5,405 4,326 3,982 3,528 2,896
Japan 3,128 2,779 2,981 2,934 2,517 2,637 2,661
Hong Kong (SAR of the PRC) 2,061 1,896 1,912 1,868 2,055 2,662 2,586
Indonesia 2,373 2,949 2,742 2,937 3,020 2,917 2,542
Philippines 835 1,082 1,265 1,725 2,206 2,688 2,296
Pakistan 1,777 2,240 2,853 2,916 2,765 2,643 2,293
United Kingdom 1,459 1,382 1,295 1,449 1,562 1,717 1,763
France 1,098 977 947 994 1,053 1,164 1,239
Bangladesh 1,928 2,049 1,980 1,810 1,506 1,491 1,158
Sri Lanka 1,282 1,471 1,701 1,357 1,240 1,166 986
Spain 351 428 689 1,086 1,152 1,065 903
Singapore 1,049 980 1,040 934 980 838 774
United States of America 752 716 797 726 669 743 774
Germany, Fed Republic of 836 753 641 683 618 631 635
Poland 643 582 595 731 644 726 619
Chile 379 402 488 443 462 564 590
Czech Republic 552 520 518 649 620 595 551
Kenya 387 424 441 365 400 518 531
Greece 30 69 444 657 573 504 509
Canada 508 451 482 518 495 503 478
Iran 464 522 548 505 562 718 454
Bhutan 22 40 54 82 167 254 451
Mauritius 990 1,096 794 695 655 548 448
Nigeria 86 101 132 174 215 368 437
Mongolia 111 82 117 114 125 196 396
Ireland, Republic of 342 489 428 552 551 501 372
Mexico 197 262 237 288 297 314 362
Venezuela 193 308 328 298 312 305 329
Sweden 254 248 222 264 271 247 284
Peru 634 597 528 503 366 356 272
Turkey 553 537 397 343 263 308 265
Portugal 184 172 261 343 361 312 253
Papua New Guinea 216 238 226 274 243 259 248
Estonia 38 88 113 134 175 209 231
Hungary 423 319 261 293 292 207 224
Cambodia 85 94 121 125 129 201 217
Slovakia 244 243 291 269 259 256 214
Russian Federation 178 193 230 226 226 230 200
Kuwait 31 46 82 82 96 121 172
Other countries 6,343 6,631 5,022 4,316 3,832 3,837 3,327
Total In Australia 111,853 124,252 127,927 117,468 112,913 112,298 106,969
BR0109 Student visa and temporary graduate visa programme trends | 2015-16 | page 22 of 53
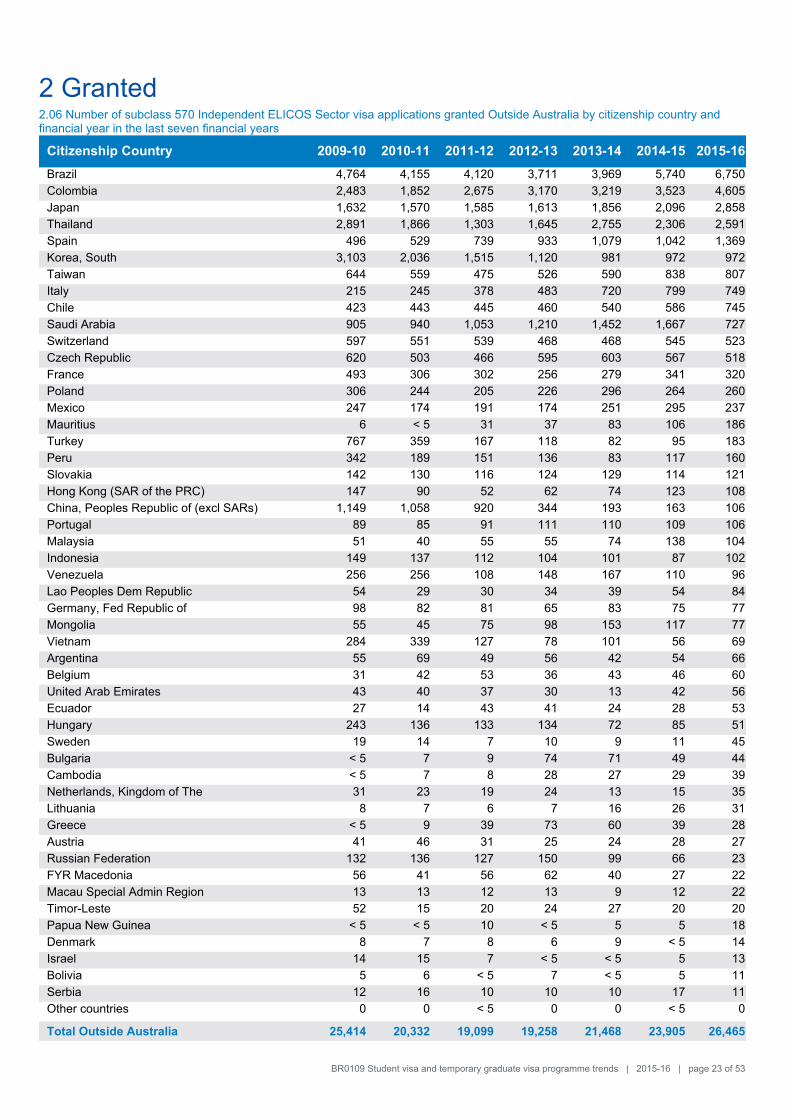
2 Granted2.06 Number of subclass 570 Independent ELICOS Sector visa applications granted Outside Australia by citizenship country and financial year in the last seven financial years
Citizenship Country 2009-10 2010-11 2011-12 2012-13 2013-14 2014-15 2015-16
Brazil 4,764 4,155 4,120 3,711 3,969 5,740 6,750
Colombia 2,483 1,852 2,675 3,170 3,219 3,523 4,605
Japan 1,632 1,570 1,585 1,613 1,856 2,096 2,858
Thailand 2,891 1,866 1,303 1,645 2,755 2,306 2,591
Spain 496 529 739 933 1,079 1,042 1,369
Korea, South 3,103 2,036 1,515 1,120 981 972 972
Taiwan 644 559 475 526 590 838 807
Italy 215 245 378 483 720 799 749
Chile 423 443 445 460 540 586 745
Saudi Arabia 905 940 1,053 1,210 1,452 1,667 727
Switzerland 597 551 539 468 468 545 523
Czech Republic 620 503 466 595 603 567 518
France 493 306 302 256 279 341 320
Poland 306 244 205 226 296 264 260
Mexico 247 174 191 174 251 295 237
Mauritius 6 < 5 31 37 83 106 186
Turkey 767 359 167 118 82 95 183
Peru 342 189 151 136 83 117 160
Slovakia 142 130 116 124 129 114 121
Hong Kong (SAR of the PRC) 147 90 52 62 74 123 108
China, Peoples Republic of (excl SARs) 1,149 1,058 920 344 193 163 106
Portugal 89 85 91 111 110 109 106
Malaysia 51 40 55 55 74 138 104
Indonesia 149 137 112 104 101 87 102
Venezuela 256 256 108 148 167 110 96
Lao Peoples Dem Republic 54 29 30 34 39 54 84
Germany, Fed Republic of 98 82 81 65 83 75 77
Mongolia 55 45 75 98 153 117 77
Vietnam 284 339 127 78 101 56 69
Argentina 55 69 49 56 42 54 66
Belgium 31 42 53 36 43 46 60
United Arab Emirates 43 40 37 30 13 42 56
Ecuador 27 14 43 41 24 28 53
Hungary 243 136 133 134 72 85 51
Sweden 19 14 7 10 9 11 45
Bulgaria < 5 7 9 74 71 49 44
Cambodia < 5 7 8 28 27 29 39
Netherlands, Kingdom of The 31 23 19 24 13 15 35
Lithuania 8 7 6 7 16 26 31
Greece < 5 9 39 73 60 39 28
Austria 41 46 31 25 24 28 27
Russian Federation 132 136 127 150 99 66 23
FYR Macedonia 56 41 56 62 40 27 22
Macau Special Admin Region 13 13 12 13 9 12 22
Timor-Leste 52 15 20 24 27 20 20
Papua New Guinea < 5 < 5 10 < 5 5 5 18
Denmark 8 7 8 6 9 < 5 14
Israel 14 15 7 < 5 < 5 5 13
Bolivia 5 6 < 5 7 < 5 5 11
Serbia 12 16 10 10 10 17 11
Other countries 0 0 < 5 0 0 < 5 0
Total Outside Australia 25,414 20,332 19,099 19,258 21,468 23,905 26,465
BR0109 Student visa and temporary graduate visa programme trends | 2015-16 | page 23 of 53
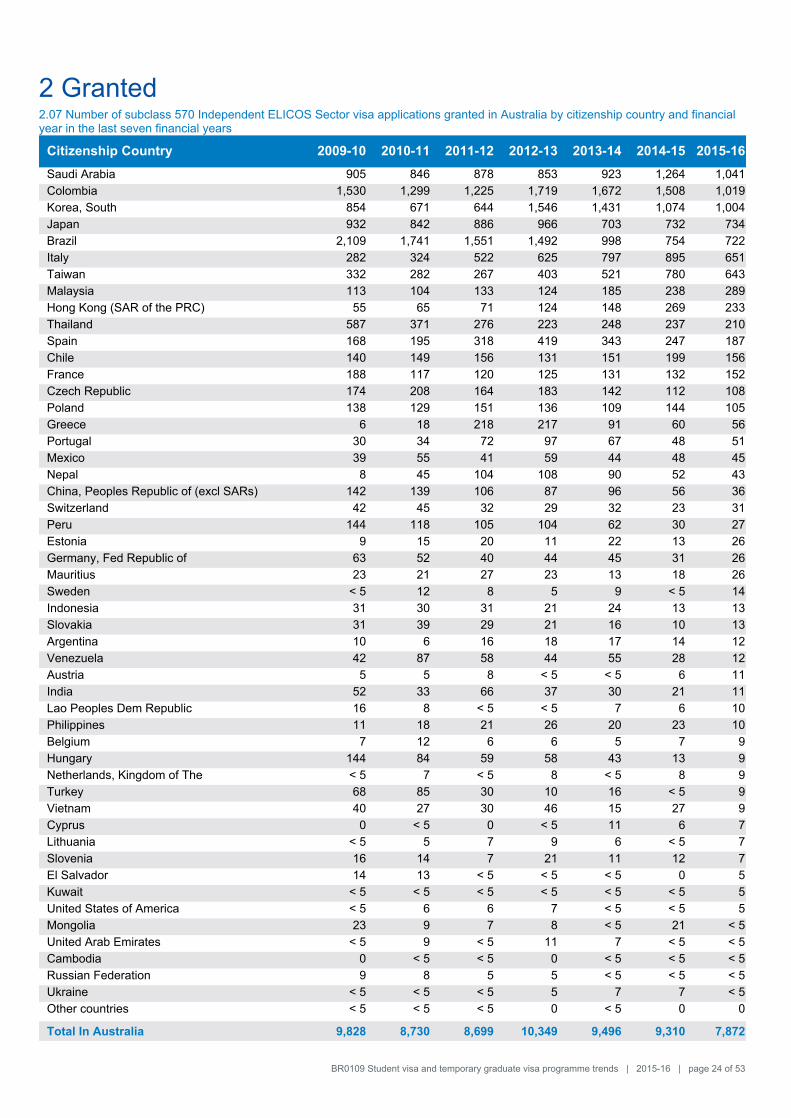
2 Granted2.07 Number of subclass 570 Independent ELICOS Sector visa applications granted in Australia by citizenship country and financial year in the last seven financial years
Citizenship Country 2009-10 2010-11 2011-12 2012-13 2013-14 2014-15 2015-16
Saudi Arabia 905 846 878 853 923 1,264 1,041
Colombia 1,530 1,299 1,225 1,719 1,672 1,508 1,019
Korea, South 854 671 644 1,546 1,431 1,074 1,004
Japan 932 842 886 966 703 732 734
Brazil 2,109 1,741 1,551 1,492 998 754 722
Italy 282 324 522 625 797 895 651
Taiwan 332 282 267 403 521 780 643
Malaysia 113 104 133 124 185 238 289
Hong Kong (SAR of the PRC) 55 65 71 124 148 269 233
Thailand 587 371 276 223 248 237 210
Spain 168 195 318 419 343 247 187
Chile 140 149 156 131 151 199 156
France 188 117 120 125 131 132 152
Czech Republic 174 208 164 183 142 112 108
Poland 138 129 151 136 109 144 105
Greece 6 18 218 217 91 60 56
Portugal 30 34 72 97 67 48 51
Mexico 39 55 41 59 44 48 45
Nepal 8 45 104 108 90 52 43
China, Peoples Republic of (excl SARs) 142 139 106 87 96 56 36
Switzerland 42 45 32 29 32 23 31
Peru 144 118 105 104 62 30 27
Estonia 9 15 20 11 22 13 26
Germany, Fed Republic of 63 52 40 44 45 31 26
Mauritius 23 21 27 23 13 18 26
Sweden < 5 12 8 5 9 < 5 14
Indonesia 31 30 31 21 24 13 13
Slovakia 31 39 29 21 16 10 13
Argentina 10 6 16 18 17 14 12
Venezuela 42 87 58 44 55 28 12
Austria 5 5 8 < 5 < 5 6 11
India 52 33 66 37 30 21 11
Lao Peoples Dem Republic 16 8 < 5 < 5 7 6 10
Philippines 11 18 21 26 20 23 10
Belgium 7 12 6 6 5 7 9
Hungary 144 84 59 58 43 13 9
Netherlands, Kingdom of The < 5 7 < 5 8 < 5 8 9
Turkey 68 85 30 10 16 < 5 9
Vietnam 40 27 30 46 15 27 9
Cyprus 0 < 5 0 < 5 11 6 7
Lithuania < 5 5 7 9 6 < 5 7
Slovenia 16 14 7 21 11 12 7
El Salvador 14 13 < 5 < 5 < 5 0 5
Kuwait < 5 < 5 < 5 < 5 < 5 < 5 5
United States of America < 5 6 6 7 < 5 < 5 5
Mongolia 23 9 7 8 < 5 21 < 5
United Arab Emirates < 5 9 < 5 11 7 < 5 < 5
Cambodia 0 < 5 < 5 0 < 5 < 5 < 5
Russian Federation 9 8 5 5 < 5 < 5 < 5
Ukraine < 5 < 5 < 5 5 7 7 < 5
Other countries < 5 < 5 < 5 0 < 5 0 0
Total In Australia 9,828 8,730 8,699 10,349 9,496 9,310 7,872
BR0109 Student visa and temporary graduate visa programme trends | 2015-16 | page 24 of 53
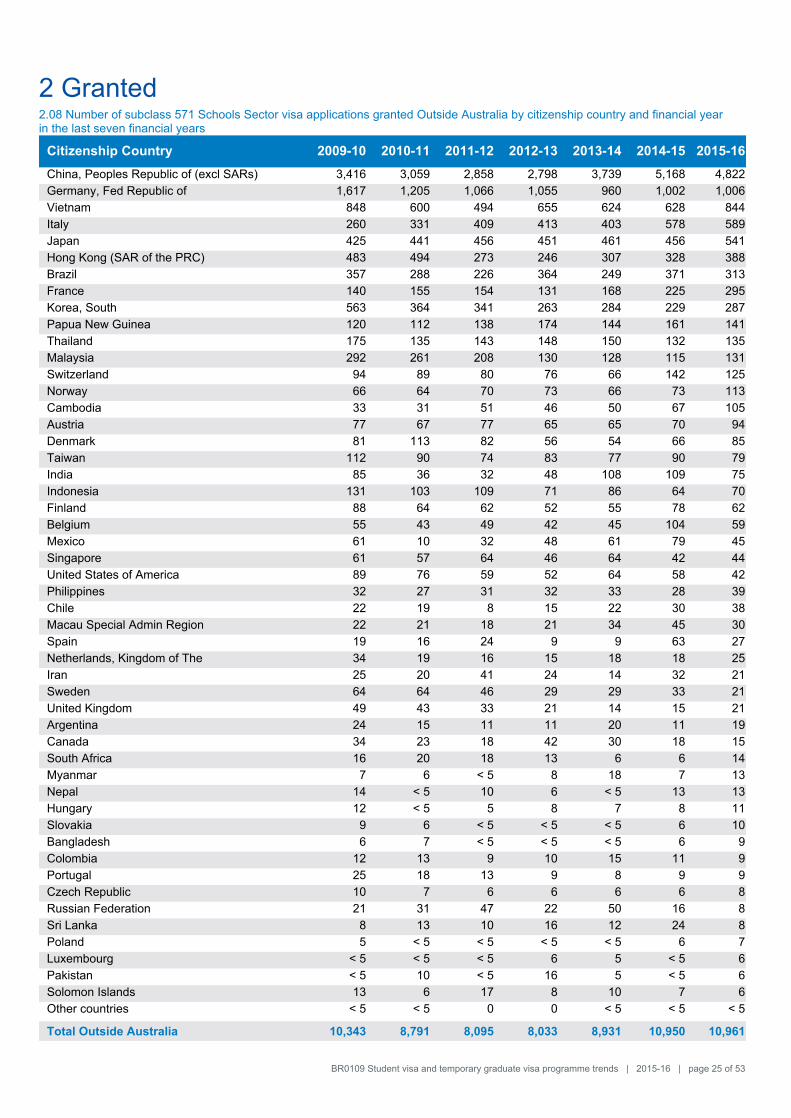
2 Granted2.08 Number of subclass 571 Schools Sector visa applications granted Outside Australia by citizenship country and financial year in the last seven financial years
Citizenship Country 2009-10 2010-11 2011-12 2012-13 2013-14 2014-15 2015-16
China, Peoples Republic of (excl SARs) 3,416 3,059 2,858 2,798 3,739 5,168 4,822
Germany, Fed Republic of 1,617 1,205 1,066 1,055 960 1,002 1,006
Vietnam 848 600 494 655 624 628 844
Italy 260 331 409 413 403 578 589
Japan 425 441 456 451 461 456 541
Hong Kong (SAR of the PRC) 483 494 273 246 307 328 388
Brazil 357 288 226 364 249 371 313
France 140 155 154 131 168 225 295
Korea, South 563 364 341 263 284 229 287
Papua New Guinea 120 112 138 174 144 161 141
Thailand 175 135 143 148 150 132 135
Malaysia 292 261 208 130 128 115 131
Switzerland 94 89 80 76 66 142 125
Norway 66 64 70 73 66 73 113
Cambodia 33 31 51 46 50 67 105
Austria 77 67 77 65 65 70 94
Denmark 81 113 82 56 54 66 85
Taiwan 112 90 74 83 77 90 79
India 85 36 32 48 108 109 75
Indonesia 131 103 109 71 86 64 70
Finland 88 64 62 52 55 78 62
Belgium 55 43 49 42 45 104 59
Mexico 61 10 32 48 61 79 45
Singapore 61 57 64 46 64 42 44
United States of America 89 76 59 52 64 58 42
Philippines 32 27 31 32 33 28 39
Chile 22 19 8 15 22 30 38
Macau Special Admin Region 22 21 18 21 34 45 30
Spain 19 16 24 9 9 63 27
Netherlands, Kingdom of The 34 19 16 15 18 18 25
Iran 25 20 41 24 14 32 21
Sweden 64 64 46 29 29 33 21
United Kingdom 49 43 33 21 14 15 21
Argentina 24 15 11 11 20 11 19
Canada 34 23 18 42 30 18 15
South Africa 16 20 18 13 6 6 14
Myanmar 7 6 < 5 8 18 7 13
Nepal 14 < 5 10 6 < 5 13 13
Hungary 12 < 5 5 8 7 8 11
Slovakia 9 6 < 5 < 5 < 5 6 10
Bangladesh 6 7 < 5 < 5 < 5 6 9
Colombia 12 13 9 10 15 11 9
Portugal 25 18 13 9 8 9 9
Czech Republic 10 7 6 6 6 6 8
Russian Federation 21 31 47 22 50 16 8
Sri Lanka 8 13 10 16 12 24 8
Poland 5 < 5 < 5 < 5 < 5 6 7
Luxembourg < 5 < 5 < 5 6 5 < 5 6
Pakistan < 5 10 < 5 16 5 < 5 6
Solomon Islands 13 6 17 8 10 7 6
Other countries < 5 < 5 0 0 < 5 < 5 < 5
Total Outside Australia 10,343 8,791 8,095 8,033 8,931 10,950 10,961
BR0109 Student visa and temporary graduate visa programme trends | 2015-16 | page 25 of 53
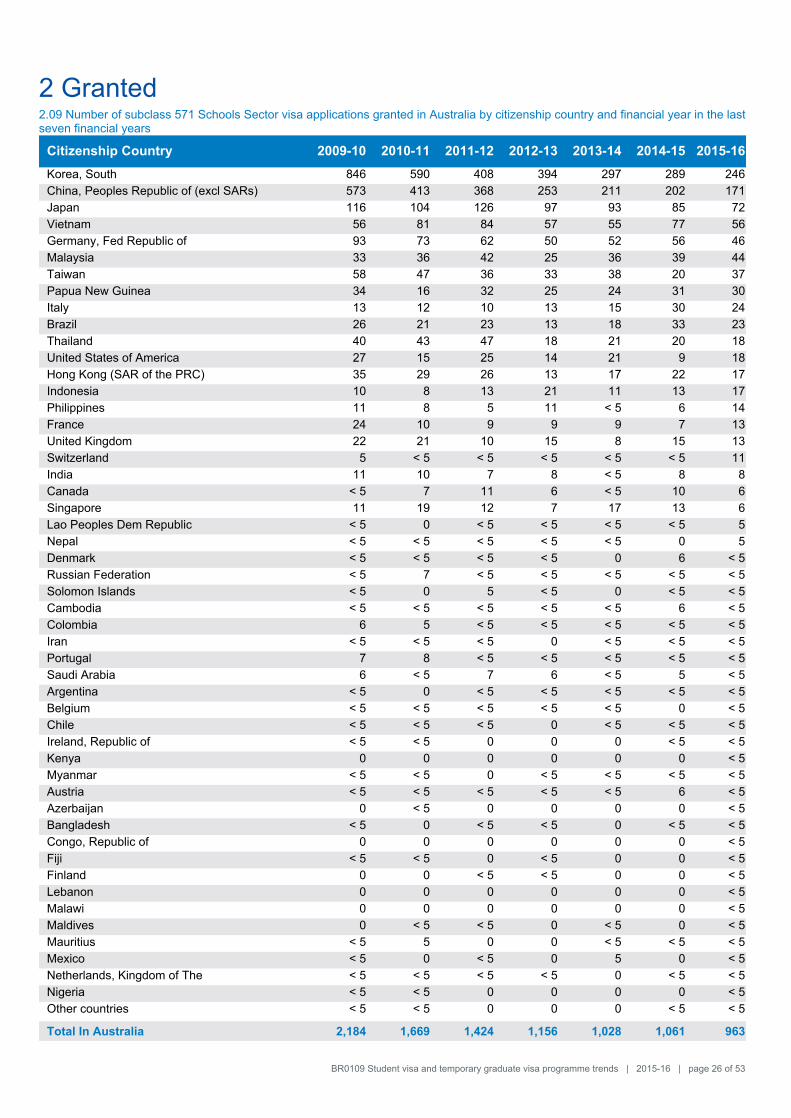
2 Granted2.09 Number of subclass 571 Schools Sector visa applications granted in Australia by citizenship country and financial year in the last seven financial years
Citizenship Country 2009-10 2010-11 2011-12 2012-13 2013-14 2014-15 2015-16
Korea, South 846 590 408 394 297 289 246
China, Peoples Republic of (excl SARs) 573 413 368 253 211 202 171
Japan 116 104 126 97 93 85 72
Vietnam 56 81 84 57 55 77 56
Germany, Fed Republic of 93 73 62 50 52 56 46
Malaysia 33 36 42 25 36 39 44
Taiwan 58 47 36 33 38 20 37
Papua New Guinea 34 16 32 25 24 31 30
Italy 13 12 10 13 15 30 24
Brazil 26 21 23 13 18 33 23
Thailand 40 43 47 18 21 20 18
United States of America 27 15 25 14 21 9 18
Hong Kong (SAR of the PRC) 35 29 26 13 17 22 17
Indonesia 10 8 13 21 11 13 17
Philippines 11 8 5 11 < 5 6 14
France 24 10 9 9 9 7 13
United Kingdom 22 21 10 15 8 15 13
Switzerland 5 < 5 < 5 < 5 < 5 < 5 11
India 11 10 7 8 < 5 8 8
Canada < 5 7 11 6 < 5 10 6
Singapore 11 19 12 7 17 13 6
Lao Peoples Dem Republic < 5 0 < 5 < 5 < 5 < 5 5
Nepal < 5 < 5 < 5 < 5 < 5 0 5
Denmark < 5 < 5 < 5 < 5 0 6 < 5
Russian Federation < 5 7 < 5 < 5 < 5 < 5 < 5
Solomon Islands < 5 0 5 < 5 0 < 5 < 5
Cambodia < 5 < 5 < 5 < 5 < 5 6 < 5
Colombia 6 5 < 5 < 5 < 5 < 5 < 5
Iran < 5 < 5 < 5 0 < 5 < 5 < 5
Portugal 7 8 < 5 < 5 < 5 < 5 < 5
Saudi Arabia 6 < 5 7 6 < 5 5 < 5
Argentina < 5 0 < 5 < 5 < 5 < 5 < 5
Belgium < 5 < 5 < 5 < 5 < 5 0 < 5
Chile < 5 < 5 < 5 0 < 5 < 5 < 5
Ireland, Republic of < 5 < 5 0 0 0 < 5 < 5
Kenya 0 0 0 0 0 0 < 5
Myanmar < 5 < 5 0 < 5 < 5 < 5 < 5
Austria < 5 < 5 < 5 < 5 < 5 6 < 5
Azerbaijan 0 < 5 0 0 0 0 < 5
Bangladesh < 5 0 < 5 < 5 0 < 5 < 5
Congo, Republic of 0 0 0 0 0 0 < 5
Fiji < 5 < 5 0 < 5 0 0 < 5
Finland 0 0 < 5 < 5 0 0 < 5
Lebanon 0 0 0 0 0 0 < 5
Malawi 0 0 0 0 0 0 < 5
Maldives 0 < 5 < 5 0 < 5 0 < 5
Mauritius < 5 5 0 0 < 5 < 5 < 5
Mexico < 5 0 < 5 0 5 0 < 5
Netherlands, Kingdom of The < 5 < 5 < 5 < 5 0 < 5 < 5
Nigeria < 5 < 5 0 0 0 0 < 5
Other countries < 5 < 5 0 0 0 < 5 < 5
Total In Australia 2,184 1,669 1,424 1,156 1,028 1,061 963
BR0109 Student visa and temporary graduate visa programme trends | 2015-16 | page 26 of 53
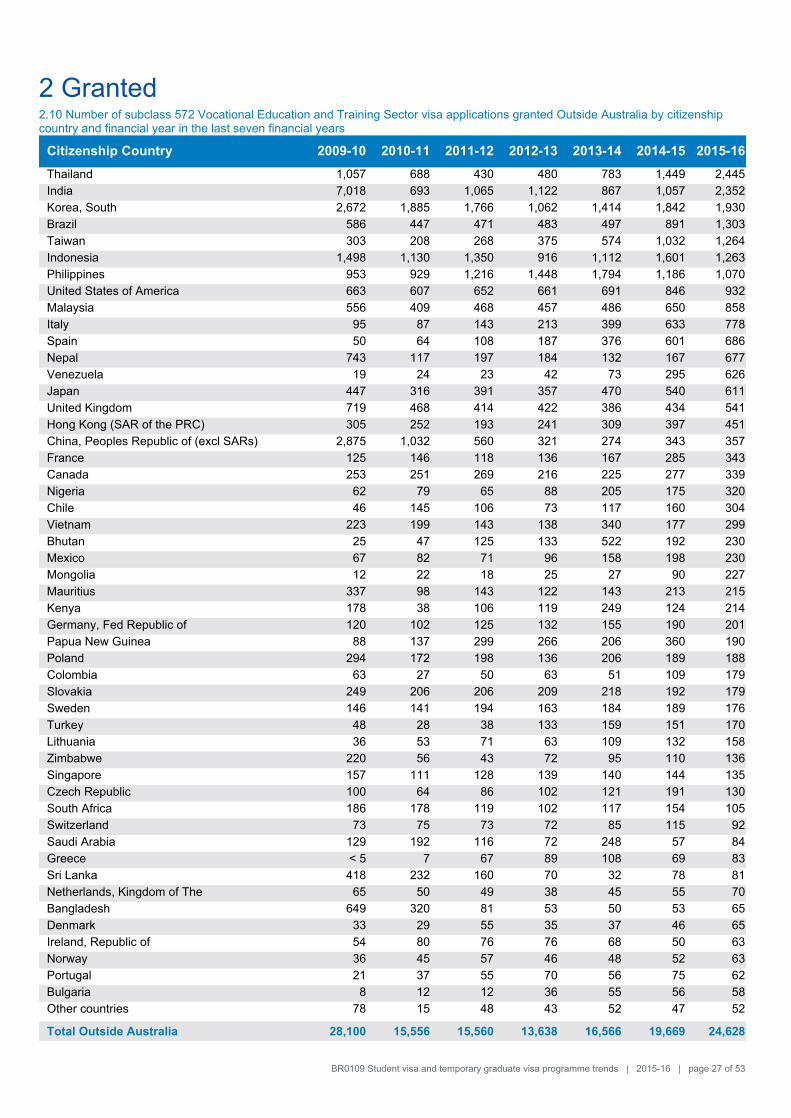
2 Granted2.10 Number of subclass 572 Vocational Education and Training Sector visa applications granted Outside Australia by citizenship country and financial year in the last seven financial years
Citizenship Country 2009-10 2010-11 2011-12 2012-13 2013-14 2014-15 2015-16
Thailand 1,057 688 430 480 783 1,449 2,445
India 7,018 693 1,065 1,122 867 1,057 2,352
Korea, South 2,672 1,885 1,766 1,062 1,414 1,842 1,930
Brazil 586 447 471 483 497 891 1,303
Taiwan 303 208 268 375 574 1,032 1,264
Indonesia 1,498 1,130 1,350 916 1,112 1,601 1,263
Philippines 953 929 1,216 1,448 1,794 1,186 1,070
United States of America 663 607 652 661 691 846 932
Malaysia 556 409 468 457 486 650 858
Italy 95 87 143 213 399 633 778
Spain 50 64 108 187 376 601 686
Nepal 743 117 197 184 132 167 677
Venezuela 19 24 23 42 73 295 626
Japan 447 316 391 357 470 540 611
United Kingdom 719 468 414 422 386 434 541
Hong Kong (SAR of the PRC) 305 252 193 241 309 397 451
China, Peoples Republic of (excl SARs) 2,875 1,032 560 321 274 343 357
France 125 146 118 136 167 285 343
Canada 253 251 269 216 225 277 339
Nigeria 62 79 65 88 205 175 320
Chile 46 145 106 73 117 160 304
Vietnam 223 199 143 138 340 177 299
Bhutan 25 47 125 133 522 192 230
Mexico 67 82 71 96 158 198 230
Mongolia 12 22 18 25 27 90 227
Mauritius 337 98 143 122 143 213 215
Kenya 178 38 106 119 249 124 214
Germany, Fed Republic of 120 102 125 132 155 190 201
Papua New Guinea 88 137 299 266 206 360 190
Poland 294 172 198 136 206 189 188
Colombia 63 27 50 63 51 109 179
Slovakia 249 206 206 209 218 192 179
Sweden 146 141 194 163 184 189 176
Turkey 48 28 38 133 159 151 170
Lithuania 36 53 71 63 109 132 158
Zimbabwe 220 56 43 72 95 110 136
Singapore 157 111 128 139 140 144 135
Czech Republic 100 64 86 102 121 191 130
South Africa 186 178 119 102 117 154 105
Switzerland 73 75 73 72 85 115 92
Saudi Arabia 129 192 116 72 248 57 84
Greece < 5 7 67 89 108 69 83
Sri Lanka 418 232 160 70 32 78 81
Netherlands, Kingdom of The 65 50 49 38 45 55 70
Bangladesh 649 320 81 53 50 53 65
Denmark 33 29 55 35 37 46 65
Ireland, Republic of 54 80 76 76 68 50 63
Norway 36 45 57 46 48 52 63
Portugal 21 37 55 70 56 75 62
Bulgaria 8 12 12 36 55 56 58
Other countries 78 15 48 43 52 47 52
Total Outside Australia 28,100 15,556 15,560 13,638 16,566 19,669 24,628
BR0109 Student visa and temporary graduate visa programme trends | 2015-16 | page 27 of 53
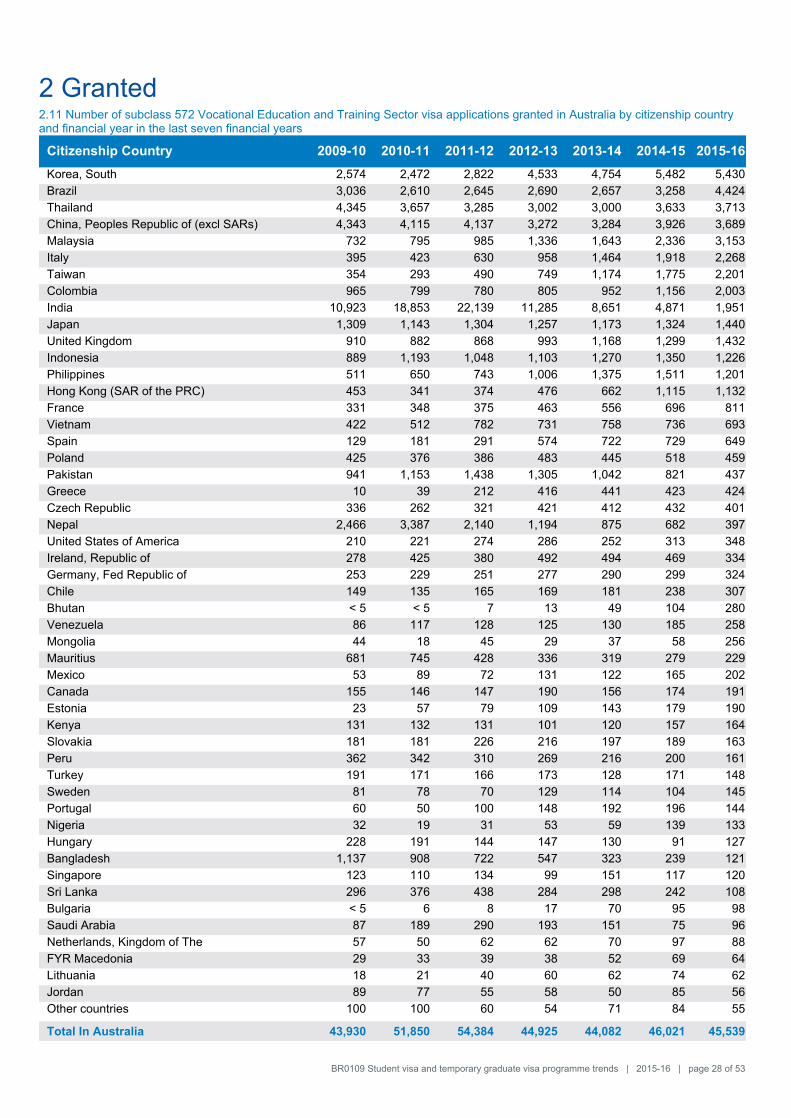
2 Granted2.11 Number of subclass 572 Vocational Education and Training Sector visa applications granted in Australia by citizenship country and financial year in the last seven financial years
Citizenship Country 2009-10 2010-11 2011-12 2012-13 2013-14 2014-15 2015-16
Korea, South 2,574 2,472 2,822 4,533 4,754 5,482 5,430
Brazil 3,036 2,610 2,645 2,690 2,657 3,258 4,424
Thailand 4,345 3,657 3,285 3,002 3,000 3,633 3,713
China, Peoples Republic of (excl SARs) 4,343 4,115 4,137 3,272 3,284 3,926 3,689
Malaysia 732 795 985 1,336 1,643 2,336 3,153
Italy 395 423 630 958 1,464 1,918 2,268
Taiwan 354 293 490 749 1,174 1,775 2,201
Colombia 965 799 780 805 952 1,156 2,003
India 10,923 18,853 22,139 11,285 8,651 4,871 1,951
Japan 1,309 1,143 1,304 1,257 1,173 1,324 1,440
United Kingdom 910 882 868 993 1,168 1,299 1,432
Indonesia 889 1,193 1,048 1,103 1,270 1,350 1,226
Philippines 511 650 743 1,006 1,375 1,511 1,201
Hong Kong (SAR of the PRC) 453 341 374 476 662 1,115 1,132
France 331 348 375 463 556 696 811
Vietnam 422 512 782 731 758 736 693
Spain 129 181 291 574 722 729 649
Poland 425 376 386 483 445 518 459
Pakistan 941 1,153 1,438 1,305 1,042 821 437
Greece 10 39 212 416 441 423 424
Czech Republic 336 262 321 421 412 432 401
Nepal 2,466 3,387 2,140 1,194 875 682 397
United States of America 210 221 274 286 252 313 348
Ireland, Republic of 278 425 380 492 494 469 334
Germany, Fed Republic of 253 229 251 277 290 299 324
Chile 149 135 165 169 181 238 307
Bhutan < 5 < 5 7 13 49 104 280
Venezuela 86 117 128 125 130 185 258
Mongolia 44 18 45 29 37 58 256
Mauritius 681 745 428 336 319 279 229
Mexico 53 89 72 131 122 165 202
Canada 155 146 147 190 156 174 191
Estonia 23 57 79 109 143 179 190
Kenya 131 132 131 101 120 157 164
Slovakia 181 181 226 216 197 189 163
Peru 362 342 310 269 216 200 161
Turkey 191 171 166 173 128 171 148
Sweden 81 78 70 129 114 104 145
Portugal 60 50 100 148 192 196 144
Nigeria 32 19 31 53 59 139 133
Hungary 228 191 144 147 130 91 127
Bangladesh 1,137 908 722 547 323 239 121
Singapore 123 110 134 99 151 117 120
Sri Lanka 296 376 438 284 298 242 108
Bulgaria < 5 6 8 17 70 95 98
Saudi Arabia 87 189 290 193 151 75 96
Netherlands, Kingdom of The 57 50 62 62 70 97 88
FYR Macedonia 29 33 39 38 52 69 64
Lithuania 18 21 40 60 62 74 62
Jordan 89 77 55 58 50 85 56
Other countries 100 100 60 54 71 84 55
Total In Australia 43,930 51,850 54,384 44,925 44,082 46,021 45,539
BR0109 Student visa and temporary graduate visa programme trends | 2015-16 | page 28 of 53
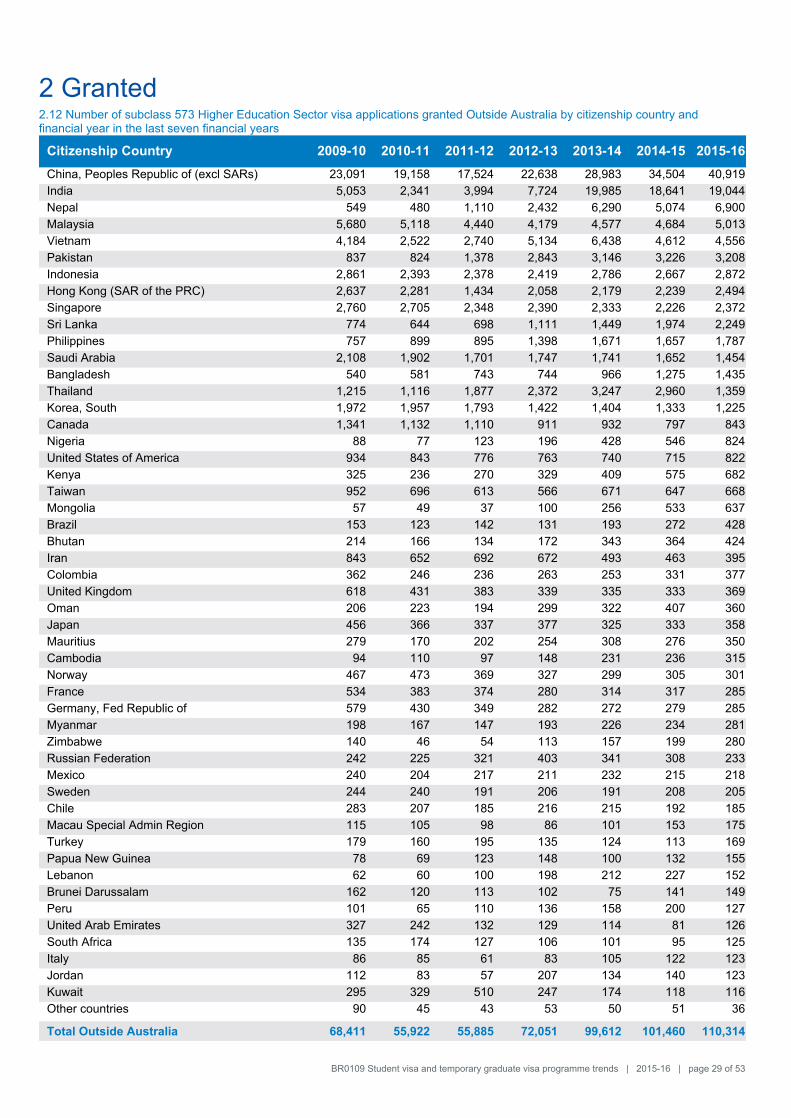
2 Granted2.12 Number of subclass 573 Higher Education Sector visa applications granted Outside Australia by citizenship country and financial year in the last seven financial years
Citizenship Country 2009-10 2010-11 2011-12 2012-13 2013-14 2014-15 2015-16
China, Peoples Republic of (excl SARs) 23,091 19,158 17,524 22,638 28,983 34,504 40,919
India 5,053 2,341 3,994 7,724 19,985 18,641 19,044
Nepal 549 480 1,110 2,432 6,290 5,074 6,900
Malaysia 5,680 5,118 4,440 4,179 4,577 4,684 5,013
Vietnam 4,184 2,522 2,740 5,134 6,438 4,612 4,556
Pakistan 837 824 1,378 2,843 3,146 3,226 3,208
Indonesia 2,861 2,393 2,378 2,419 2,786 2,667 2,872
Hong Kong (SAR of the PRC) 2,637 2,281 1,434 2,058 2,179 2,239 2,494
Singapore 2,760 2,705 2,348 2,390 2,333 2,226 2,372
Sri Lanka 774 644 698 1,111 1,449 1,974 2,249
Philippines 757 899 895 1,398 1,671 1,657 1,787
Saudi Arabia 2,108 1,902 1,701 1,747 1,741 1,652 1,454
Bangladesh 540 581 743 744 966 1,275 1,435
Thailand 1,215 1,116 1,877 2,372 3,247 2,960 1,359
Korea, South 1,972 1,957 1,793 1,422 1,404 1,333 1,225
Canada 1,341 1,132 1,110 911 932 797 843
Nigeria 88 77 123 196 428 546 824
United States of America 934 843 776 763 740 715 822
Kenya 325 236 270 329 409 575 682
Taiwan 952 696 613 566 671 647 668
Mongolia 57 49 37 100 256 533 637
Brazil 153 123 142 131 193 272 428
Bhutan 214 166 134 172 343 364 424
Iran 843 652 692 672 493 463 395
Colombia 362 246 236 263 253 331 377
United Kingdom 618 431 383 339 335 333 369
Oman 206 223 194 299 322 407 360
Japan 456 366 337 377 325 333 358
Mauritius 279 170 202 254 308 276 350
Cambodia 94 110 97 148 231 236 315
Norway 467 473 369 327 299 305 301
France 534 383 374 280 314 317 285
Germany, Fed Republic of 579 430 349 282 272 279 285
Myanmar 198 167 147 193 226 234 281
Zimbabwe 140 46 54 113 157 199 280
Russian Federation 242 225 321 403 341 308 233
Mexico 240 204 217 211 232 215 218
Sweden 244 240 191 206 191 208 205
Chile 283 207 185 216 215 192 185
Macau Special Admin Region 115 105 98 86 101 153 175
Turkey 179 160 195 135 124 113 169
Papua New Guinea 78 69 123 148 100 132 155
Lebanon 62 60 100 198 212 227 152
Brunei Darussalam 162 120 113 102 75 141 149
Peru 101 65 110 136 158 200 127
United Arab Emirates 327 242 132 129 114 81 126
South Africa 135 174 127 106 101 95 125
Italy 86 85 61 83 105 122 123
Jordan 112 83 57 207 134 140 123
Kuwait 295 329 510 247 174 118 116
Other countries 90 45 43 53 50 51 36
Total Outside Australia 68,411 55,922 55,885 72,051 99,612 101,460 110,314
BR0109 Student visa and temporary graduate visa programme trends | 2015-16 | page 29 of 53
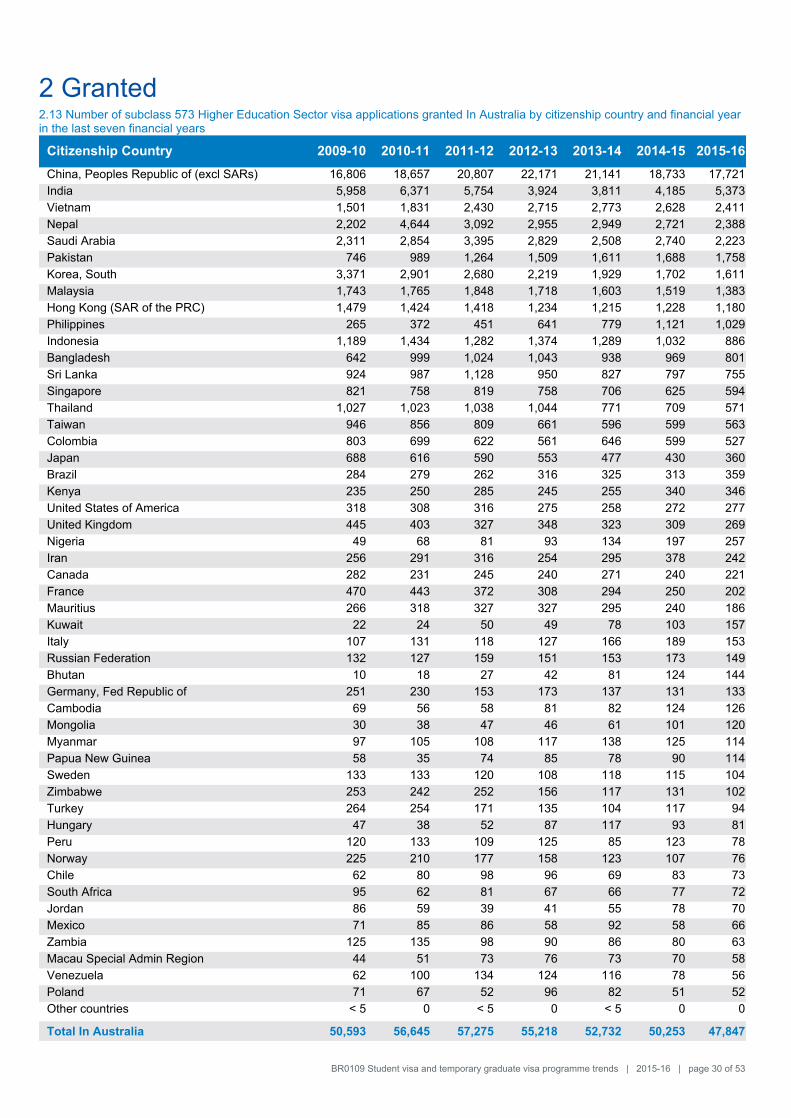
2 Granted2.13 Number of subclass 573 Higher Education Sector visa applications granted In Australia by citizenship country and financial year in the last seven financial years
Citizenship Country 2009-10 2010-11 2011-12 2012-13 2013-14 2014-15 2015-16
China, Peoples Republic of (excl SARs) 16,806 18,657 20,807 22,171 21,141 18,733 17,721
India 5,958 6,371 5,754 3,924 3,811 4,185 5,373
Vietnam 1,501 1,831 2,430 2,715 2,773 2,628 2,411
Nepal 2,202 4,644 3,092 2,955 2,949 2,721 2,388
Saudi Arabia 2,311 2,854 3,395 2,829 2,508 2,740 2,223
Pakistan 746 989 1,264 1,509 1,611 1,688 1,758
Korea, South 3,371 2,901 2,680 2,219 1,929 1,702 1,611
Malaysia 1,743 1,765 1,848 1,718 1,603 1,519 1,383
Hong Kong (SAR of the PRC) 1,479 1,424 1,418 1,234 1,215 1,228 1,180
Philippines 265 372 451 641 779 1,121 1,029
Indonesia 1,189 1,434 1,282 1,374 1,289 1,032 886
Bangladesh 642 999 1,024 1,043 938 969 801
Sri Lanka 924 987 1,128 950 827 797 755
Singapore 821 758 819 758 706 625 594
Thailand 1,027 1,023 1,038 1,044 771 709 571
Taiwan 946 856 809 661 596 599 563
Colombia 803 699 622 561 646 599 527
Japan 688 616 590 553 477 430 360
Brazil 284 279 262 316 325 313 359
Kenya 235 250 285 245 255 340 346
United States of America 318 308 316 275 258 272 277
United Kingdom 445 403 327 348 323 309 269
Nigeria 49 68 81 93 134 197 257
Iran 256 291 316 254 295 378 242
Canada 282 231 245 240 271 240 221
France 470 443 372 308 294 250 202
Mauritius 266 318 327 327 295 240 186
Kuwait 22 24 50 49 78 103 157
Italy 107 131 118 127 166 189 153
Russian Federation 132 127 159 151 153 173 149
Bhutan 10 18 27 42 81 124 144
Germany, Fed Republic of 251 230 153 173 137 131 133
Cambodia 69 56 58 81 82 124 126
Mongolia 30 38 47 46 61 101 120
Myanmar 97 105 108 117 138 125 114
Papua New Guinea 58 35 74 85 78 90 114
Sweden 133 133 120 108 118 115 104
Zimbabwe 253 242 252 156 117 131 102
Turkey 264 254 171 135 104 117 94
Hungary 47 38 52 87 117 93 81
Peru 120 133 109 125 85 123 78
Norway 225 210 177 158 123 107 76
Chile 62 80 98 96 69 83 73
South Africa 95 62 81 67 66 77 72
Jordan 86 59 39 41 55 78 70
Mexico 71 85 86 58 92 58 66
Zambia 125 135 98 90 86 80 63
Macau Special Admin Region 44 51 73 76 73 70 58
Venezuela 62 100 134 124 116 78 56
Poland 71 67 52 96 82 51 52
Other countries < 5 0 < 5 0 < 5 0 0
Total In Australia 50,593 56,645 57,275 55,218 52,732 50,253 47,847
BR0109 Student visa and temporary graduate visa programme trends | 2015-16 | page 30 of 53
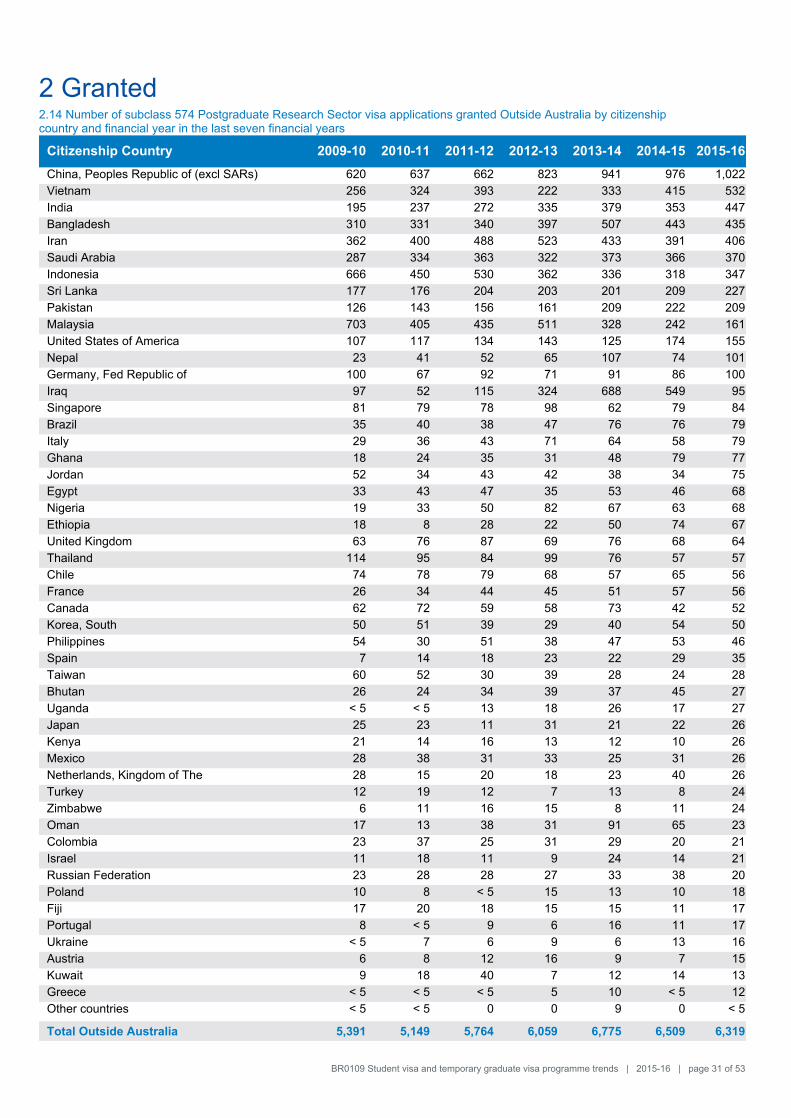
2 Granted2.14 Number of subclass 574 Postgraduate Research Sector visa applications granted Outside Australia by citizenship country and financial year in the last seven financial years
Citizenship Country 2009-10 2010-11 2011-12 2012-13 2013-14 2014-15 2015-16
China, Peoples Republic of (excl SARs) 620 637 662 823 941 976 1,022
Vietnam 256 324 393 222 333 415 532
India 195 237 272 335 379 353 447
Bangladesh 310 331 340 397 507 443 435
Iran 362 400 488 523 433 391 406
Saudi Arabia 287 334 363 322 373 366 370
Indonesia 666 450 530 362 336 318 347
Sri Lanka 177 176 204 203 201 209 227
Pakistan 126 143 156 161 209 222 209
Malaysia 703 405 435 511 328 242 161
United States of America 107 117 134 143 125 174 155
Nepal 23 41 52 65 107 74 101
Germany, Fed Republic of 100 67 92 71 91 86 100
Iraq 97 52 115 324 688 549 95
Singapore 81 79 78 98 62 79 84
Brazil 35 40 38 47 76 76 79
Italy 29 36 43 71 64 58 79
Ghana 18 24 35 31 48 79 77
Jordan 52 34 43 42 38 34 75
Egypt 33 43 47 35 53 46 68
Nigeria 19 33 50 82 67 63 68
Ethiopia 18 8 28 22 50 74 67
United Kingdom 63 76 87 69 76 68 64
Thailand 114 95 84 99 76 57 57
Chile 74 78 79 68 57 65 56
France 26 34 44 45 51 57 56
Canada 62 72 59 58 73 42 52
Korea, South 50 51 39 29 40 54 50
Philippines 54 30 51 38 47 53 46
Spain 7 14 18 23 22 29 35
Taiwan 60 52 30 39 28 24 28
Bhutan 26 24 34 39 37 45 27
Uganda < 5 < 5 13 18 26 17 27
Japan 25 23 11 31 21 22 26
Kenya 21 14 16 13 12 10 26
Mexico 28 38 31 33 25 31 26
Netherlands, Kingdom of The 28 15 20 18 23 40 26
Turkey 12 19 12 7 13 8 24
Zimbabwe 6 11 16 15 8 11 24
Oman 17 13 38 31 91 65 23
Colombia 23 37 25 31 29 20 21
Israel 11 18 11 9 24 14 21
Russian Federation 23 28 28 27 33 38 20
Poland 10 8 < 5 15 13 10 18
Fiji 17 20 18 15 15 11 17
Portugal 8 < 5 9 6 16 11 17
Ukraine < 5 7 6 9 6 13 16
Austria 6 8 12 16 9 7 15
Kuwait 9 18 40 7 12 14 13
Greece < 5 < 5 < 5 5 10 < 5 12
Other countries < 5 < 5 0 0 9 0 < 5
Total Outside Australia 5,391 5,149 5,764 6,059 6,775 6,509 6,319
BR0109 Student visa and temporary graduate visa programme trends | 2015-16 | page 31 of 53
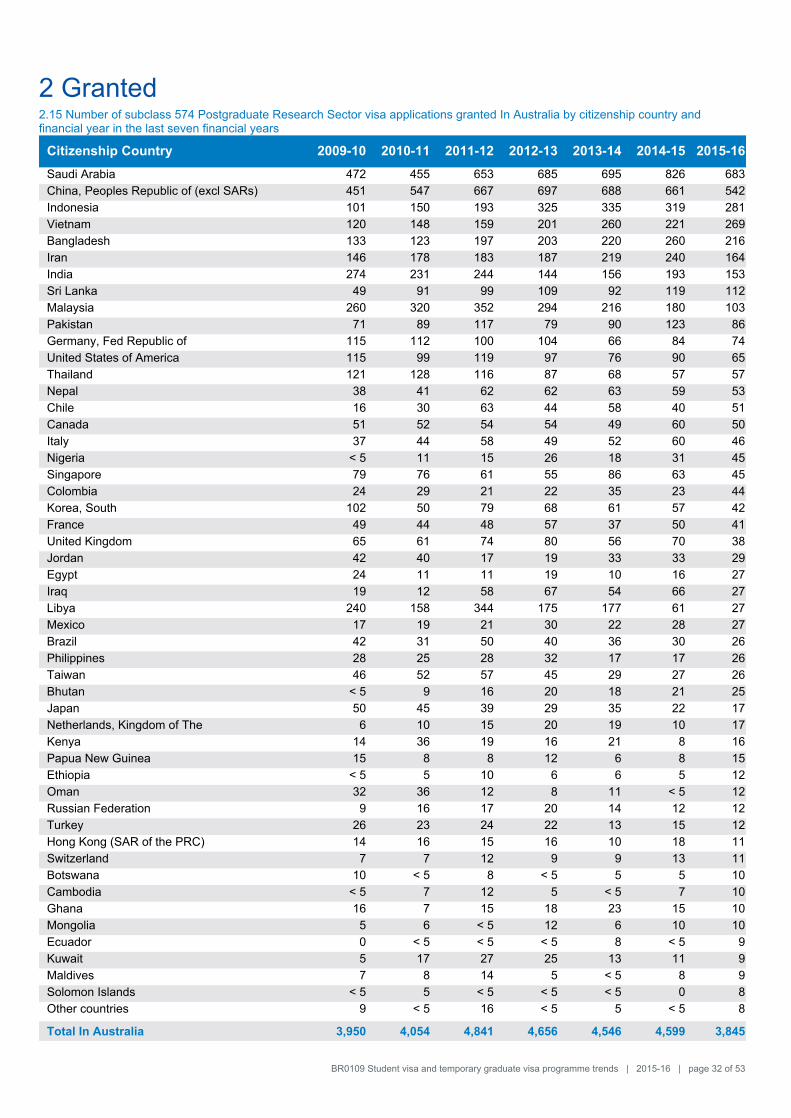
2 Granted2.15 Number of subclass 574 Postgraduate Research Sector visa applications granted In Australia by citizenship country and financial year in the last seven financial years
Citizenship Country 2009-10 2010-11 2011-12 2012-13 2013-14 2014-15 2015-16
Saudi Arabia 472 455 653 685 695 826 683
China, Peoples Republic of (excl SARs) 451 547 667 697 688 661 542
Indonesia 101 150 193 325 335 319 281
Vietnam 120 148 159 201 260 221 269
Bangladesh 133 123 197 203 220 260 216
Iran 146 178 183 187 219 240 164
India 274 231 244 144 156 193 153
Sri Lanka 49 91 99 109 92 119 112
Malaysia 260 320 352 294 216 180 103
Pakistan 71 89 117 79 90 123 86
Germany, Fed Republic of 115 112 100 104 66 84 74
United States of America 115 99 119 97 76 90 65
Thailand 121 128 116 87 68 57 57
Nepal 38 41 62 62 63 59 53
Chile 16 30 63 44 58 40 51
Canada 51 52 54 54 49 60 50
Italy 37 44 58 49 52 60 46
Nigeria < 5 11 15 26 18 31 45
Singapore 79 76 61 55 86 63 45
Colombia 24 29 21 22 35 23 44
Korea, South 102 50 79 68 61 57 42
France 49 44 48 57 37 50 41
United Kingdom 65 61 74 80 56 70 38
Jordan 42 40 17 19 33 33 29
Egypt 24 11 11 19 10 16 27
Iraq 19 12 58 67 54 66 27
Libya 240 158 344 175 177 61 27
Mexico 17 19 21 30 22 28 27
Brazil 42 31 50 40 36 30 26
Philippines 28 25 28 32 17 17 26
Taiwan 46 52 57 45 29 27 26
Bhutan < 5 9 16 20 18 21 25
Japan 50 45 39 29 35 22 17
Netherlands, Kingdom of The 6 10 15 20 19 10 17
Kenya 14 36 19 16 21 8 16
Papua New Guinea 15 8 8 12 6 8 15
Ethiopia < 5 5 10 6 6 5 12
Oman 32 36 12 8 11 < 5 12
Russian Federation 9 16 17 20 14 12 12
Turkey 26 23 24 22 13 15 12
Hong Kong (SAR of the PRC) 14 16 15 16 10 18 11
Switzerland 7 7 12 9 9 13 11
Botswana 10 < 5 8 < 5 5 5 10
Cambodia < 5 7 12 5 < 5 7 10
Ghana 16 7 15 18 23 15 10
Mongolia 5 6 < 5 12 6 10 10
Ecuador 0 < 5 < 5 < 5 8 < 5 9
Kuwait 5 17 27 25 13 11 9
Maldives 7 8 14 5 < 5 8 9
Solomon Islands < 5 5 < 5 < 5 < 5 0 8
Other countries 9 < 5 16 < 5 5 < 5 8
Total In Australia 3,950 4,054 4,841 4,656 4,546 4,599 3,845
BR0109 Student visa and temporary graduate visa programme trends | 2015-16 | page 32 of 53
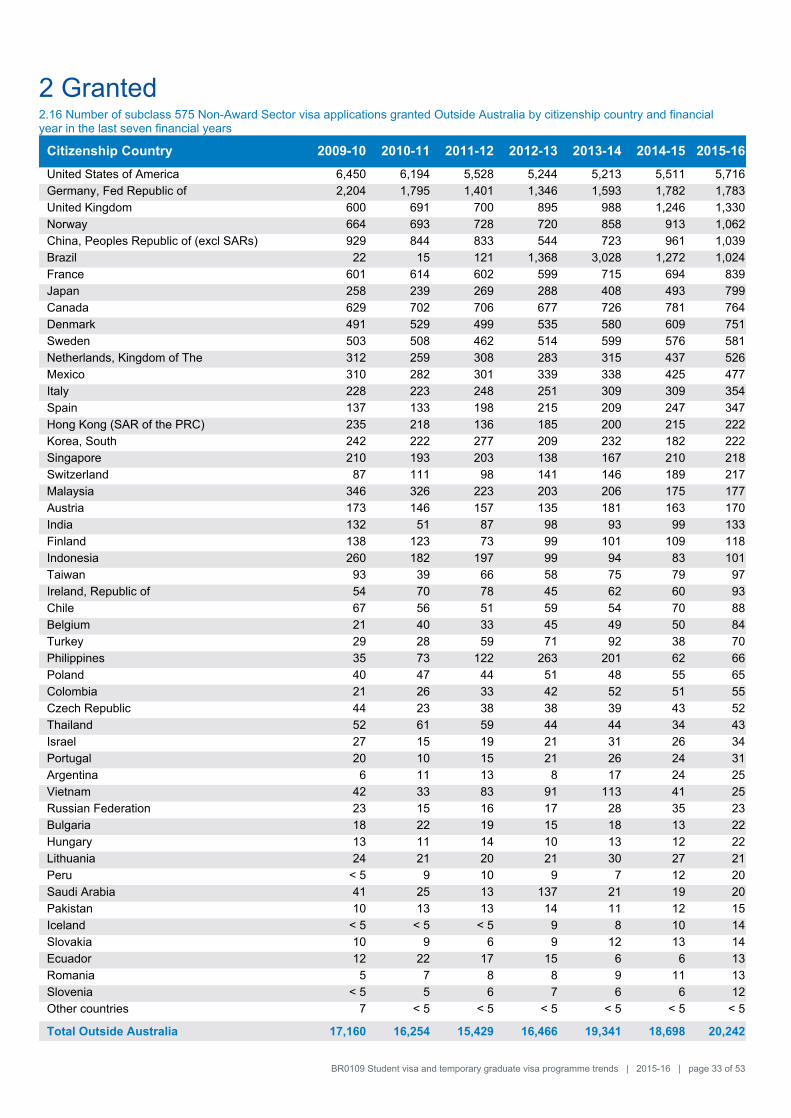
2 Granted2.16 Number of subclass 575 Non-Award Sector visa applications granted Outside Australia by citizenship country and financial year in the last seven financial years
Citizenship Country 2009-10 2010-11 2011-12 2012-13 2013-14 2014-15 2015-16
United States of America 6,450 6,194 5,528 5,244 5,213 5,511 5,716
Germany, Fed Republic of 2,204 1,795 1,401 1,346 1,593 1,782 1,783
United Kingdom 600 691 700 895 988 1,246 1,330
Norway 664 693 728 720 858 913 1,062
China, Peoples Republic of (excl SARs) 929 844 833 544 723 961 1,039
Brazil 22 15 121 1,368 3,028 1,272 1,024
France 601 614 602 599 715 694 839
Japan 258 239 269 288 408 493 799
Canada 629 702 706 677 726 781 764
Denmark 491 529 499 535 580 609 751
Sweden 503 508 462 514 599 576 581
Netherlands, Kingdom of The 312 259 308 283 315 437 526
Mexico 310 282 301 339 338 425 477
Italy 228 223 248 251 309 309 354
Spain 137 133 198 215 209 247 347
Hong Kong (SAR of the PRC) 235 218 136 185 200 215 222
Korea, South 242 222 277 209 232 182 222
Singapore 210 193 203 138 167 210 218
Switzerland 87 111 98 141 146 189 217
Malaysia 346 326 223 203 206 175 177
Austria 173 146 157 135 181 163 170
India 132 51 87 98 93 99 133
Finland 138 123 73 99 101 109 118
Indonesia 260 182 197 99 94 83 101
Taiwan 93 39 66 58 75 79 97
Ireland, Republic of 54 70 78 45 62 60 93
Chile 67 56 51 59 54 70 88
Belgium 21 40 33 45 49 50 84
Turkey 29 28 59 71 92 38 70
Philippines 35 73 122 263 201 62 66
Poland 40 47 44 51 48 55 65
Colombia 21 26 33 42 52 51 55
Czech Republic 44 23 38 38 39 43 52
Thailand 52 61 59 44 44 34 43
Israel 27 15 19 21 31 26 34
Portugal 20 10 15 21 26 24 31
Argentina 6 11 13 8 17 24 25
Vietnam 42 33 83 91 113 41 25
Russian Federation 23 15 16 17 28 35 23
Bulgaria 18 22 19 15 18 13 22
Hungary 13 11 14 10 13 12 22
Lithuania 24 21 20 21 30 27 21
Peru < 5 9 10 9 7 12 20
Saudi Arabia 41 25 13 137 21 19 20
Pakistan 10 13 13 14 11 12 15
Iceland < 5 < 5 < 5 9 8 10 14
Slovakia 10 9 6 9 12 13 14
Ecuador 12 22 17 15 6 6 13
Romania 5 7 8 8 9 11 13
Slovenia < 5 5 6 7 6 6 12
Other countries 7 < 5 < 5 < 5 < 5 < 5 < 5
Total Outside Australia 17,160 16,254 15,429 16,466 19,341 18,698 20,242
BR0109 Student visa and temporary graduate visa programme trends | 2015-16 | page 33 of 53
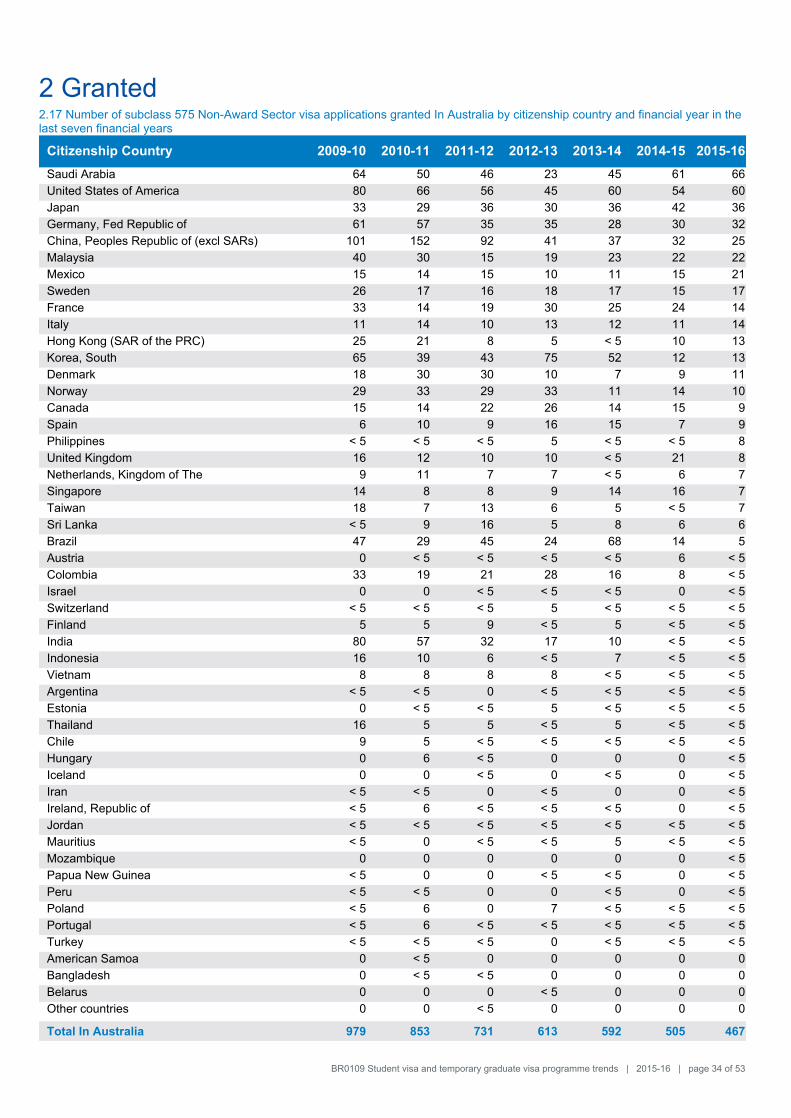
2 Granted2.17 Number of subclass 575 Non-Award Sector visa applications granted In Australia by citizenship country and financial year in the last seven financial years
Citizenship Country 2009-10 2010-11 2011-12 2012-13 2013-14 2014-15 2015-16
Saudi Arabia 64 50 46 23 45 61 66
United States of America 80 66 56 45 60 54 60
Japan 33 29 36 30 36 42 36
Germany, Fed Republic of 61 57 35 35 28 30 32
China, Peoples Republic of (excl SARs) 101 152 92 41 37 32 25
Malaysia 40 30 15 19 23 22 22
Mexico 15 14 15 10 11 15 21
Sweden 26 17 16 18 17 15 17
France 33 14 19 30 25 24 14
Italy 11 14 10 13 12 11 14
Hong Kong (SAR of the PRC) 25 21 8 5 < 5 10 13
Korea, South 65 39 43 75 52 12 13
Denmark 18 30 30 10 7 9 11
Norway 29 33 29 33 11 14 10
Canada 15 14 22 26 14 15 9
Spain 6 10 9 16 15 7 9
Philippines < 5 < 5 < 5 5 < 5 < 5 8
United Kingdom 16 12 10 10 < 5 21 8
Netherlands, Kingdom of The 9 11 7 7 < 5 6 7
Singapore 14 8 8 9 14 16 7
Taiwan 18 7 13 6 5 < 5 7
Sri Lanka < 5 9 16 5 8 6 6
Brazil 47 29 45 24 68 14 5
Austria 0 < 5 < 5 < 5 < 5 6 < 5
Colombia 33 19 21 28 16 8 < 5
Israel 0 0 < 5 < 5 < 5 0 < 5
Switzerland < 5 < 5 < 5 5 < 5 < 5 < 5
Finland 5 5 9 < 5 5 < 5 < 5
India 80 57 32 17 10 < 5 < 5
Indonesia 16 10 6 < 5 7 < 5 < 5
Vietnam 8 8 8 8 < 5 < 5 < 5
Argentina < 5 < 5 0 < 5 < 5 < 5 < 5
Estonia 0 < 5 < 5 5 < 5 < 5 < 5
Thailand 16 5 5 < 5 5 < 5 < 5
Chile 9 5 < 5 < 5 < 5 < 5 < 5
Hungary 0 6 < 5 0 0 0 < 5
Iceland 0 0 < 5 0 < 5 0 < 5
Iran < 5 < 5 0 < 5 0 0 < 5
Ireland, Republic of < 5 6 < 5 < 5 < 5 0 < 5
Jordan < 5 < 5 < 5 < 5 < 5 < 5 < 5
Mauritius < 5 0 < 5 < 5 5 < 5 < 5
Mozambique 0 0 0 0 0 0 < 5
Papua New Guinea < 5 0 0 < 5 < 5 0 < 5
Peru < 5 < 5 0 0 < 5 0 < 5
Poland < 5 6 0 7 < 5 < 5 < 5
Portugal < 5 6 < 5 < 5 < 5 < 5 < 5
Turkey < 5 < 5 < 5 0 < 5 < 5 < 5
American Samoa 0 < 5 0 0 0 0 0
Bangladesh 0 < 5 < 5 0 0 0 0
Belarus 0 0 0 < 5 0 0 0
Other countries 0 0 < 5 0 0 0 0
Total In Australia 979 853 731 613 592 505 467
BR0109 Student visa and temporary graduate visa programme trends | 2015-16 | page 34 of 53
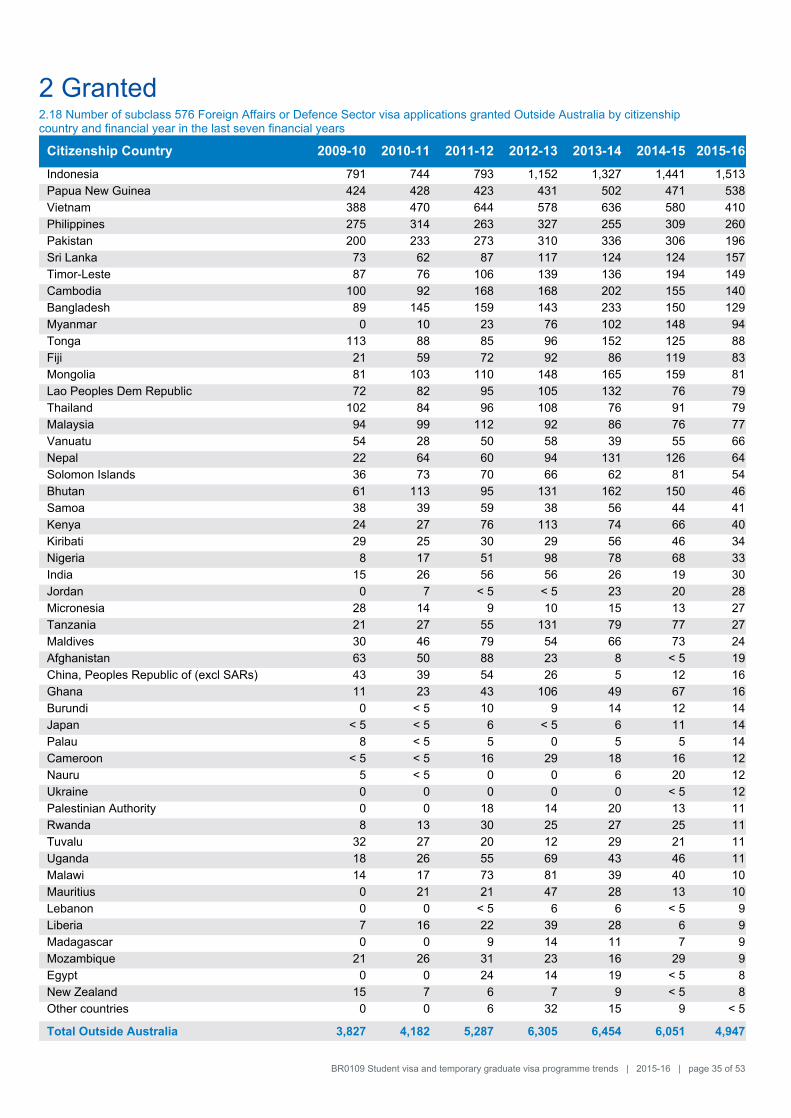
2 Granted2.18 Number of subclass 576 Foreign Affairs or Defence Sector visa applications granted Outside Australia by citizenship country and financial year in the last seven financial years
Citizenship Country 2009-10 2010-11 2011-12 2012-13 2013-14 2014-15 2015-16
Indonesia 791 744 793 1,152 1,327 1,441 1,513
Papua New Guinea 424 428 423 431 502 471 538
Vietnam 388 470 644 578 636 580 410
Philippines 275 314 263 327 255 309 260
Pakistan 200 233 273 310 336 306 196
Sri Lanka 73 62 87 117 124 124 157
Timor-Leste 87 76 106 139 136 194 149
Cambodia 100 92 168 168 202 155 140
Bangladesh 89 145 159 143 233 150 129
Myanmar 0 10 23 76 102 148 94
Tonga 113 88 85 96 152 125 88
Fiji 21 59 72 92 86 119 83
Mongolia 81 103 110 148 165 159 81
Lao Peoples Dem Republic 72 82 95 105 132 76 79
Thailand 102 84 96 108 76 91 79
Malaysia 94 99 112 92 86 76 77
Vanuatu 54 28 50 58 39 55 66
Nepal 22 64 60 94 131 126 64
Solomon Islands 36 73 70 66 62 81 54
Bhutan 61 113 95 131 162 150 46
Samoa 38 39 59 38 56 44 41
Kenya 24 27 76 113 74 66 40
Kiribati 29 25 30 29 56 46 34
Nigeria 8 17 51 98 78 68 33
India 15 26 56 56 26 19 30
Jordan 0 7 < 5 < 5 23 20 28
Micronesia 28 14 9 10 15 13 27
Tanzania 21 27 55 131 79 77 27
Maldives 30 46 79 54 66 73 24
Afghanistan 63 50 88 23 8 < 5 19
China, Peoples Republic of (excl SARs) 43 39 54 26 5 12 16
Ghana 11 23 43 106 49 67 16
Burundi 0 < 5 10 9 14 12 14
Japan < 5 < 5 6 < 5 6 11 14
Palau 8 < 5 5 0 5 5 14
Cameroon < 5 < 5 16 29 18 16 12
Nauru 5 < 5 0 0 6 20 12
Ukraine 0 0 0 0 0 < 5 12
Palestinian Authority 0 0 18 14 20 13 11
Rwanda 8 13 30 25 27 25 11
Tuvalu 32 27 20 12 29 21 11
Uganda 18 26 55 69 43 46 11
Malawi 14 17 73 81 39 40 10
Mauritius 0 21 21 47 28 13 10
Lebanon 0 0 < 5 6 6 < 5 9
Liberia 7 16 22 39 28 6 9
Madagascar 0 0 9 14 11 7 9
Mozambique 21 26 31 23 16 29 9
Egypt 0 0 24 14 19 < 5 8
New Zealand 15 7 6 7 9 < 5 8
Other countries 0 0 6 32 15 9 < 5
Total Outside Australia 3,827 4,182 5,287 6,305 6,454 6,051 4,947
BR0109 Student visa and temporary graduate visa programme trends | 2015-16 | page 35 of 53
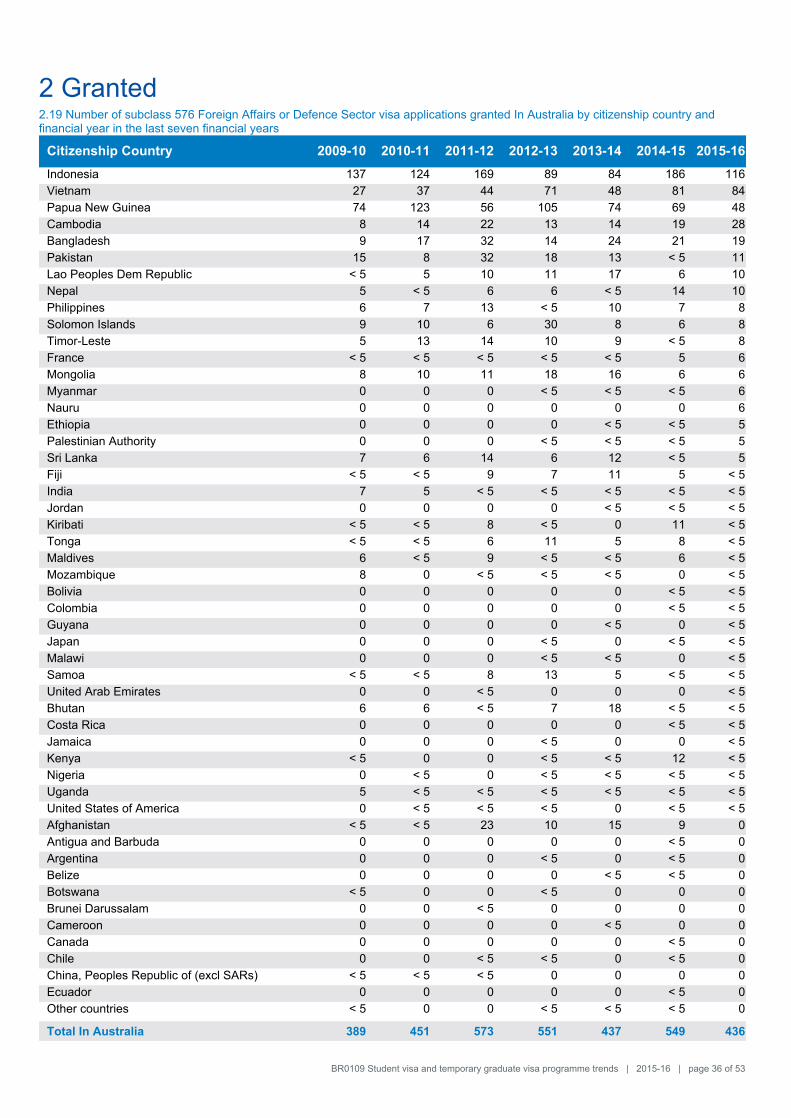
2 Granted2.19 Number of subclass 576 Foreign Affairs or Defence Sector visa applications granted In Australia by citizenship country and financial year in the last seven financial years
Citizenship Country 2009-10 2010-11 2011-12 2012-13 2013-14 2014-15 2015-16
Indonesia 137 124 169 89 84 186 116
Vietnam 27 37 44 71 48 81 84
Papua New Guinea 74 123 56 105 74 69 48
Cambodia 8 14 22 13 14 19 28
Bangladesh 9 17 32 14 24 21 19
Pakistan 15 8 32 18 13 < 5 11
Lao Peoples Dem Republic < 5 5 10 11 17 6 10
Nepal 5 < 5 6 6 < 5 14 10
Philippines 6 7 13 < 5 10 7 8
Solomon Islands 9 10 6 30 8 6 8
Timor-Leste 5 13 14 10 9 < 5 8
France < 5 < 5 < 5 < 5 < 5 5 6
Mongolia 8 10 11 18 16 6 6
Myanmar 0 0 0 < 5 < 5 < 5 6
Nauru 0 0 0 0 0 0 6
Ethiopia 0 0 0 0 < 5 < 5 5
Palestinian Authority 0 0 0 < 5 < 5 < 5 5
Sri Lanka 7 6 14 6 12 < 5 5
Fiji < 5 < 5 9 7 11 5 < 5
India 7 5 < 5 < 5 < 5 < 5 < 5
Jordan 0 0 0 0 < 5 < 5 < 5
Kiribati < 5 < 5 8 < 5 0 11 < 5
Tonga < 5 < 5 6 11 5 8 < 5
Maldives 6 < 5 9 < 5 < 5 6 < 5
Mozambique 8 0 < 5 < 5 < 5 0 < 5
Bolivia 0 0 0 0 0 < 5 < 5
Colombia 0 0 0 0 0 < 5 < 5
Guyana 0 0 0 0 < 5 0 < 5
Japan 0 0 0 < 5 0 < 5 < 5
Malawi 0 0 0 < 5 < 5 0 < 5
Samoa < 5 < 5 8 13 5 < 5 < 5
United Arab Emirates 0 0 < 5 0 0 0 < 5
Bhutan 6 6 < 5 7 18 < 5 < 5
Costa Rica 0 0 0 0 0 < 5 < 5
Jamaica 0 0 0 < 5 0 0 < 5
Kenya < 5 0 0 < 5 < 5 12 < 5
Nigeria 0 < 5 0 < 5 < 5 < 5 < 5
Uganda 5 < 5 < 5 < 5 < 5 < 5 < 5
United States of America 0 < 5 < 5 < 5 0 < 5 < 5
Afghanistan < 5 < 5 23 10 15 9 0
Antigua and Barbuda 0 0 0 0 0 < 5 0
Argentina 0 0 0 < 5 0 < 5 0
Belize 0 0 0 0 < 5 < 5 0
Botswana < 5 0 0 < 5 0 0 0
Brunei Darussalam 0 0 < 5 0 0 0 0
Cameroon 0 0 0 0 < 5 0 0
Canada 0 0 0 0 0 < 5 0
Chile 0 0 < 5 < 5 0 < 5 0
China, Peoples Republic of (excl SARs) < 5 < 5 < 5 0 0 0 0
Ecuador 0 0 0 0 0 < 5 0
Other countries < 5 0 0 < 5 < 5 < 5 0
Total In Australia 389 451 573 551 437 549 436
BR0109 Student visa and temporary graduate visa programme trends | 2015-16 | page 36 of 53

3 Grant rates
BR0109 Student visa and temporary graduate visa programme trends | 2015-16 | page 37 of 53
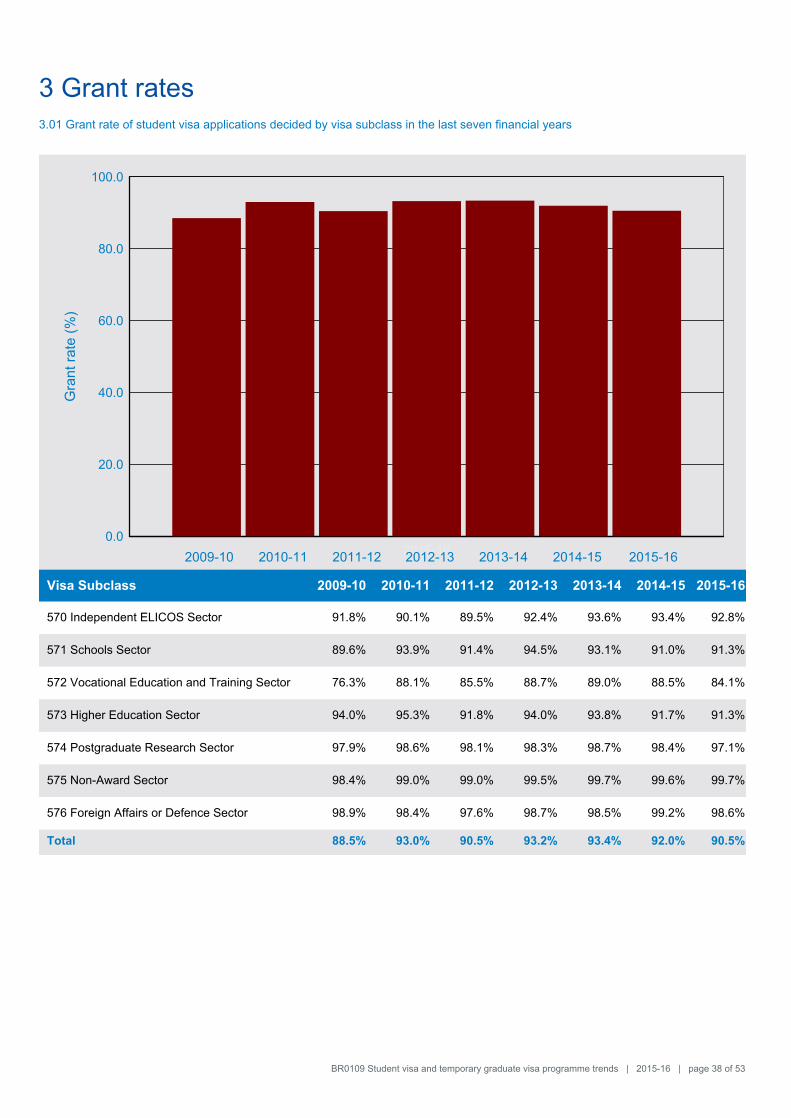
3 Grant rates
0.0
20.0
40.0
60.0
80.0
100.0
2015-16
Gra
nt ra
te (
%)
2015-162009-10 2010-11 2011-12 2012-13 2013-14 2014-15
3.01 Grant rate of student visa applications decided by visa subclass in the last seven financial years
Visa Subclass 2009-10 2010-11 2011-12 2012-13 2013-14 2014-15 2015-16
570 Independent ELICOS Sector 91.8% 90.1% 89.5% 92.4% 93.6% 93.4% 92.8%
571 Schools Sector 89.6% 93.9% 91.4% 94.5% 93.1% 91.0% 91.3%
572 Vocational Education and Training Sector 76.3% 88.1% 85.5% 88.7% 89.0% 88.5% 84.1%
573 Higher Education Sector 94.0% 95.3% 91.8% 94.0% 93.8% 91.7% 91.3%
574 Postgraduate Research Sector 97.9% 98.6% 98.1% 98.3% 98.7% 98.4% 97.1%
575 Non-Award Sector 98.4% 99.0% 99.0% 99.5% 99.7% 99.6% 99.7%
576 Foreign Affairs or Defence Sector 98.9% 98.4% 97.6% 98.7% 98.5% 99.2% 98.6%
Total 88.5% 93.0% 90.5% 93.2% 93.4% 92.0% 90.5%
BR0109 Student visa and temporary graduate visa programme trends | 2015-16 | page 38 of 53
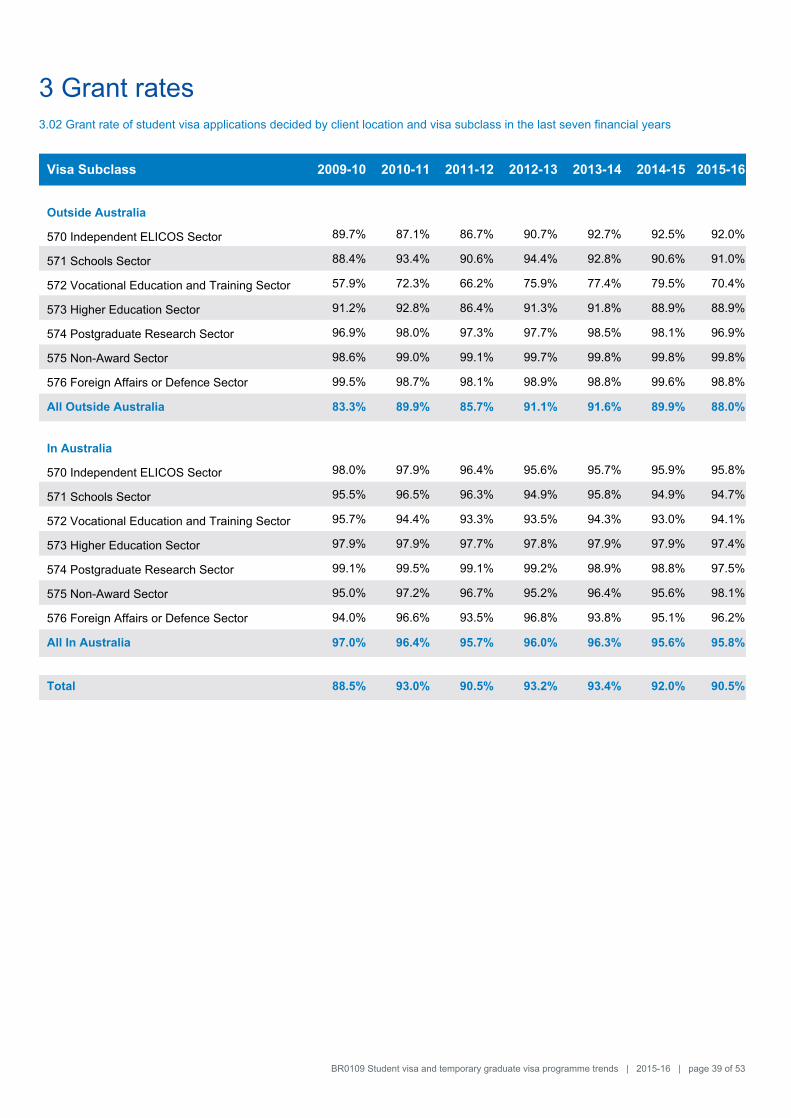
3 Grant rates3.02 Grant rate of student visa applications decided by client location and visa subclass in the last seven financial years
Visa Subclass 2009-10 2010-11 2011-12 2012-13 2013-14 2014-15 2015-16
Outside Australia
570 Independent ELICOS Sector 89.7% 87.1% 86.7% 90.7% 92.7% 92.5% 92.0%
571 Schools Sector 88.4% 93.4% 90.6% 94.4% 92.8% 90.6% 91.0%
572 Vocational Education and Training Sector 57.9% 72.3% 66.2% 75.9% 77.4% 79.5% 70.4%
573 Higher Education Sector 91.2% 92.8% 86.4% 91.3% 91.8% 88.9% 88.9%
574 Postgraduate Research Sector 96.9% 98.0% 97.3% 97.7% 98.5% 98.1% 96.9%
575 Non-Award Sector 98.6% 99.0% 99.1% 99.7% 99.8% 99.8% 99.8%
576 Foreign Affairs or Defence Sector 99.5% 98.7% 98.1% 98.9% 98.8% 99.6% 98.8%
All Outside Australia 83.3% 89.9% 85.7% 91.1% 91.6% 89.9% 88.0%
In Australia
570 Independent ELICOS Sector 98.0% 97.9% 96.4% 95.6% 95.7% 95.9% 95.8%
571 Schools Sector 95.5% 96.5% 96.3% 94.9% 95.8% 94.9% 94.7%
572 Vocational Education and Training Sector 95.7% 94.4% 93.3% 93.5% 94.3% 93.0% 94.1%
573 Higher Education Sector 97.9% 97.9% 97.7% 97.8% 97.9% 97.9% 97.4%
574 Postgraduate Research Sector 99.1% 99.5% 99.1% 99.2% 98.9% 98.8% 97.5%
575 Non-Award Sector 95.0% 97.2% 96.7% 95.2% 96.4% 95.6% 98.1%
576 Foreign Affairs or Defence Sector 94.0% 96.6% 93.5% 96.8% 93.8% 95.1% 96.2%
All In Australia 97.0% 96.4% 95.7% 96.0% 96.3% 95.6% 95.8%
Total 88.5% 93.0% 90.5% 93.2% 93.4% 92.0% 90.5%
BR0109 Student visa and temporary graduate visa programme trends | 2015-16 | page 39 of 53
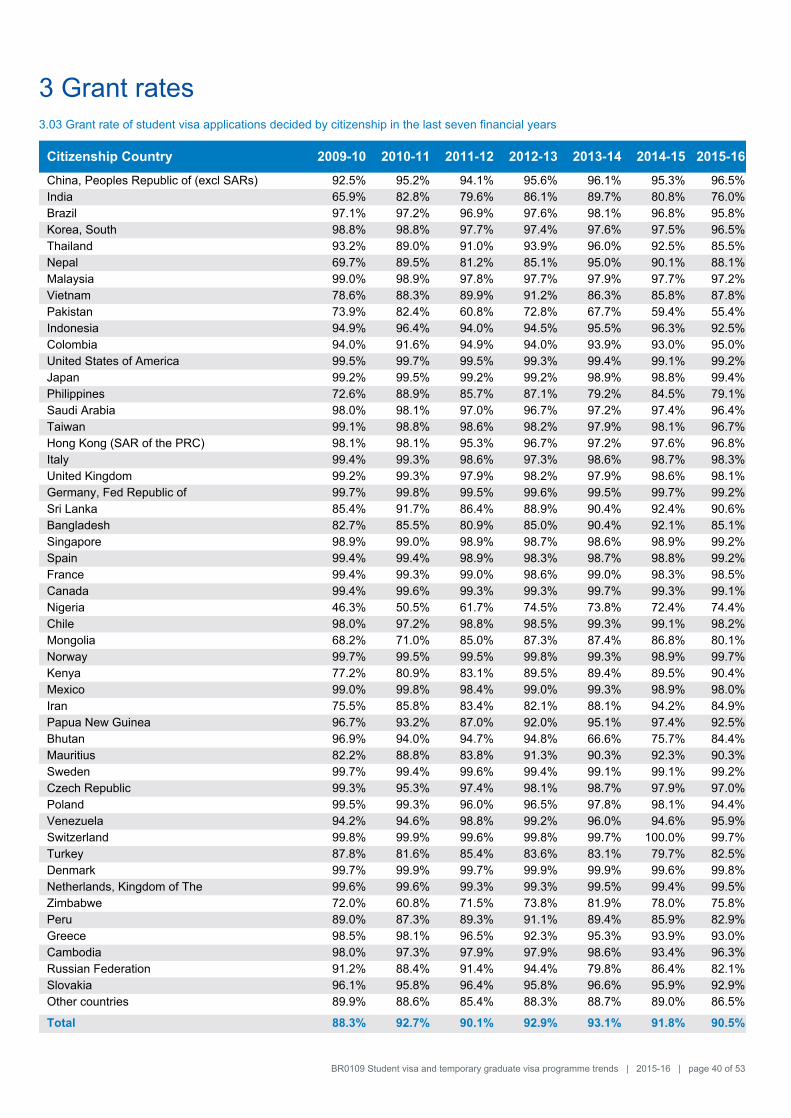
3 Grant rates3.03 Grant rate of student visa applications decided by citizenship in the last seven financial years
Citizenship Country 2009-10 2010-11 2011-12 2012-13 2013-14 2014-15 2015-16
China, Peoples Republic of (excl SARs) 92.5% 95.2% 94.1% 95.6% 96.1% 95.3% 96.5%
India 65.9% 82.8% 79.6% 86.1% 89.7% 80.8% 76.0%
Brazil 97.1% 97.2% 96.9% 97.6% 98.1% 96.8% 95.8%
Korea, South 98.8% 98.8% 97.7% 97.4% 97.6% 97.5% 96.5%
Thailand 93.2% 89.0% 91.0% 93.9% 96.0% 92.5% 85.5%
Nepal 69.7% 89.5% 81.2% 85.1% 95.0% 90.1% 88.1%
Malaysia 99.0% 98.9% 97.8% 97.7% 97.9% 97.7% 97.2%
Vietnam 78.6% 88.3% 89.9% 91.2% 86.3% 85.8% 87.8%
Pakistan 73.9% 82.4% 60.8% 72.8% 67.7% 59.4% 55.4%
Indonesia 94.9% 96.4% 94.0% 94.5% 95.5% 96.3% 92.5%
Colombia 94.0% 91.6% 94.9% 94.0% 93.9% 93.0% 95.0%
United States of America 99.5% 99.7% 99.5% 99.3% 99.4% 99.1% 99.2%
Japan 99.2% 99.5% 99.2% 99.2% 98.9% 98.8% 99.4%
Philippines 72.6% 88.9% 85.7% 87.1% 79.2% 84.5% 79.1%
Saudi Arabia 98.0% 98.1% 97.0% 96.7% 97.2% 97.4% 96.4%
Taiwan 99.1% 98.8% 98.6% 98.2% 97.9% 98.1% 96.7%
Hong Kong (SAR of the PRC) 98.1% 98.1% 95.3% 96.7% 97.2% 97.6% 96.8%
Italy 99.4% 99.3% 98.6% 97.3% 98.6% 98.7% 98.3%
United Kingdom 99.2% 99.3% 97.9% 98.2% 97.9% 98.6% 98.1%
Germany, Fed Republic of 99.7% 99.8% 99.5% 99.6% 99.5% 99.7% 99.2%
Sri Lanka 85.4% 91.7% 86.4% 88.9% 90.4% 92.4% 90.6%
Bangladesh 82.7% 85.5% 80.9% 85.0% 90.4% 92.1% 85.1%
Singapore 98.9% 99.0% 98.9% 98.7% 98.6% 98.9% 99.2%
Spain 99.4% 99.4% 98.9% 98.3% 98.7% 98.8% 99.2%
France 99.4% 99.3% 99.0% 98.6% 99.0% 98.3% 98.5%
Canada 99.4% 99.6% 99.3% 99.3% 99.7% 99.3% 99.1%
Nigeria 46.3% 50.5% 61.7% 74.5% 73.8% 72.4% 74.4%
Chile 98.0% 97.2% 98.8% 98.5% 99.3% 99.1% 98.2%
Mongolia 68.2% 71.0% 85.0% 87.3% 87.4% 86.8% 80.1%
Norway 99.7% 99.5% 99.5% 99.8% 99.3% 98.9% 99.7%
Kenya 77.2% 80.9% 83.1% 89.5% 89.4% 89.5% 90.4%
Mexico 99.0% 99.8% 98.4% 99.0% 99.3% 98.9% 98.0%
Iran 75.5% 85.8% 83.4% 82.1% 88.1% 94.2% 84.9%
Papua New Guinea 96.7% 93.2% 87.0% 92.0% 95.1% 97.4% 92.5%
Bhutan 96.9% 94.0% 94.7% 94.8% 66.6% 75.7% 84.4%
Mauritius 82.2% 88.8% 83.8% 91.3% 90.3% 92.3% 90.3%
Sweden 99.7% 99.4% 99.6% 99.4% 99.1% 99.1% 99.2%
Czech Republic 99.3% 95.3% 97.4% 98.1% 98.7% 97.9% 97.0%
Poland 99.5% 99.3% 96.0% 96.5% 97.8% 98.1% 94.4%
Venezuela 94.2% 94.6% 98.8% 99.2% 96.0% 94.6% 95.9%
Switzerland 99.8% 99.9% 99.6% 99.8% 99.7% 100.0% 99.7%
Turkey 87.8% 81.6% 85.4% 83.6% 83.1% 79.7% 82.5%
Denmark 99.7% 99.9% 99.7% 99.9% 99.9% 99.6% 99.8%
Netherlands, Kingdom of The 99.6% 99.6% 99.3% 99.3% 99.5% 99.4% 99.5%
Zimbabwe 72.0% 60.8% 71.5% 73.8% 81.9% 78.0% 75.8%
Peru 89.0% 87.3% 89.3% 91.1% 89.4% 85.9% 82.9%
Greece 98.5% 98.1% 96.5% 92.3% 95.3% 93.9% 93.0%
Cambodia 98.0% 97.3% 97.9% 97.9% 98.6% 93.4% 96.3%
Russian Federation 91.2% 88.4% 91.4% 94.4% 79.8% 86.4% 82.1%
Slovakia 96.1% 95.8% 96.4% 95.8% 96.6% 95.9% 92.9%
Other countries 89.9% 88.6% 85.4% 88.3% 88.7% 89.0% 86.5%
Total 88.3% 92.7% 90.1% 92.9% 93.1% 91.8% 90.5%
BR0109 Student visa and temporary graduate visa programme trends | 2015-16 | page 40 of 53
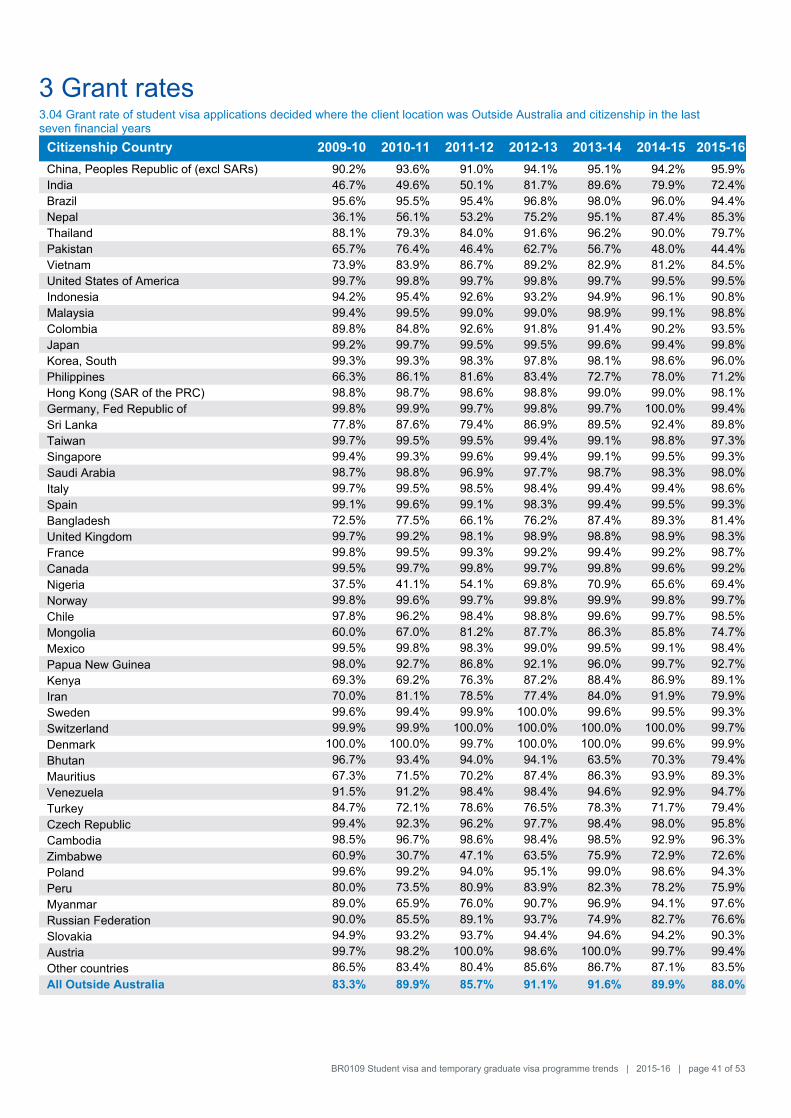
3 Grant rates3.04 Grant rate of student visa applications decided where the client location was Outside Australia and citizenship in the last seven financial years
Citizenship Country 2009-10 2010-11 2011-12 2012-13 2013-14 2014-15 2015-16
China, Peoples Republic of (excl SARs) 90.2% 93.6% 91.0% 94.1% 95.1% 94.2% 95.9%
India 46.7% 49.6% 50.1% 81.7% 89.6% 79.9% 72.4%
Brazil 95.6% 95.5% 95.4% 96.8% 98.0% 96.0% 94.4%
Nepal 36.1% 56.1% 53.2% 75.2% 95.1% 87.4% 85.3%
Thailand 88.1% 79.3% 84.0% 91.6% 96.2% 90.0% 79.7%
Pakistan 65.7% 76.4% 46.4% 62.7% 56.7% 48.0% 44.4%
Vietnam 73.9% 83.9% 86.7% 89.2% 82.9% 81.2% 84.5%
United States of America 99.7% 99.8% 99.7% 99.8% 99.7% 99.5% 99.5%
Indonesia 94.2% 95.4% 92.6% 93.2% 94.9% 96.1% 90.8%
Malaysia 99.4% 99.5% 99.0% 99.0% 98.9% 99.1% 98.8%
Colombia 89.8% 84.8% 92.6% 91.8% 91.4% 90.2% 93.5%
Japan 99.2% 99.7% 99.5% 99.5% 99.6% 99.4% 99.8%
Korea, South 99.3% 99.3% 98.3% 97.8% 98.1% 98.6% 96.0%
Philippines 66.3% 86.1% 81.6% 83.4% 72.7% 78.0% 71.2%
Hong Kong (SAR of the PRC) 98.8% 98.7% 98.6% 98.8% 99.0% 99.0% 98.1%
Germany, Fed Republic of 99.8% 99.9% 99.7% 99.8% 99.7% 100.0% 99.4%
Sri Lanka 77.8% 87.6% 79.4% 86.9% 89.5% 92.4% 89.8%
Taiwan 99.7% 99.5% 99.5% 99.4% 99.1% 98.8% 97.3%
Singapore 99.4% 99.3% 99.6% 99.4% 99.1% 99.5% 99.3%
Saudi Arabia 98.7% 98.8% 96.9% 97.7% 98.7% 98.3% 98.0%
Italy 99.7% 99.5% 98.5% 98.4% 99.4% 99.4% 98.6%
Spain 99.1% 99.6% 99.1% 98.3% 99.4% 99.5% 99.3%
Bangladesh 72.5% 77.5% 66.1% 76.2% 87.4% 89.3% 81.4%
United Kingdom 99.7% 99.2% 98.1% 98.9% 98.8% 98.9% 98.3%
France 99.8% 99.5% 99.3% 99.2% 99.4% 99.2% 98.7%
Canada 99.5% 99.7% 99.8% 99.7% 99.8% 99.6% 99.2%
Nigeria 37.5% 41.1% 54.1% 69.8% 70.9% 65.6% 69.4%
Norway 99.8% 99.6% 99.7% 99.8% 99.9% 99.8% 99.7%
Chile 97.8% 96.2% 98.4% 98.8% 99.6% 99.7% 98.5%
Mongolia 60.0% 67.0% 81.2% 87.7% 86.3% 85.8% 74.7%
Mexico 99.5% 99.8% 98.3% 99.0% 99.5% 99.1% 98.4%
Papua New Guinea 98.0% 92.7% 86.8% 92.1% 96.0% 99.7% 92.7%
Kenya 69.3% 69.2% 76.3% 87.2% 88.4% 86.9% 89.1%
Iran 70.0% 81.1% 78.5% 77.4% 84.0% 91.9% 79.9%
Sweden 99.6% 99.4% 99.9% 100.0% 99.6% 99.5% 99.3%
Switzerland 99.9% 99.9% 100.0% 100.0% 100.0% 100.0% 99.7%
Denmark 100.0% 100.0% 99.7% 100.0% 100.0% 99.6% 99.9%
Bhutan 96.7% 93.4% 94.0% 94.1% 63.5% 70.3% 79.4%
Mauritius 67.3% 71.5% 70.2% 87.4% 86.3% 93.9% 89.3%
Venezuela 91.5% 91.2% 98.4% 98.4% 94.6% 92.9% 94.7%
Turkey 84.7% 72.1% 78.6% 76.5% 78.3% 71.7% 79.4%
Czech Republic 99.4% 92.3% 96.2% 97.7% 98.4% 98.0% 95.8%
Cambodia 98.5% 96.7% 98.6% 98.4% 98.5% 92.9% 96.3%
Zimbabwe 60.9% 30.7% 47.1% 63.5% 75.9% 72.9% 72.6%
Poland 99.6% 99.2% 94.0% 95.1% 99.0% 98.6% 94.3%
Peru 80.0% 73.5% 80.9% 83.9% 82.3% 78.2% 75.9%
Myanmar 89.0% 65.9% 76.0% 90.7% 96.9% 94.1% 97.6%
Russian Federation 90.0% 85.5% 89.1% 93.7% 74.9% 82.7% 76.6%
Slovakia 94.9% 93.2% 93.7% 94.4% 94.6% 94.2% 90.3%
Austria 99.7% 98.2% 100.0% 98.6% 100.0% 99.7% 99.4%
Other countries 86.5% 83.4% 80.4% 85.6% 86.7% 87.1% 83.5%
All Outside Australia 83.3% 89.9% 85.7% 91.1% 91.6% 89.9% 88.0%
BR0109 Student visa and temporary graduate visa programme trends | 2015-16 | page 41 of 53
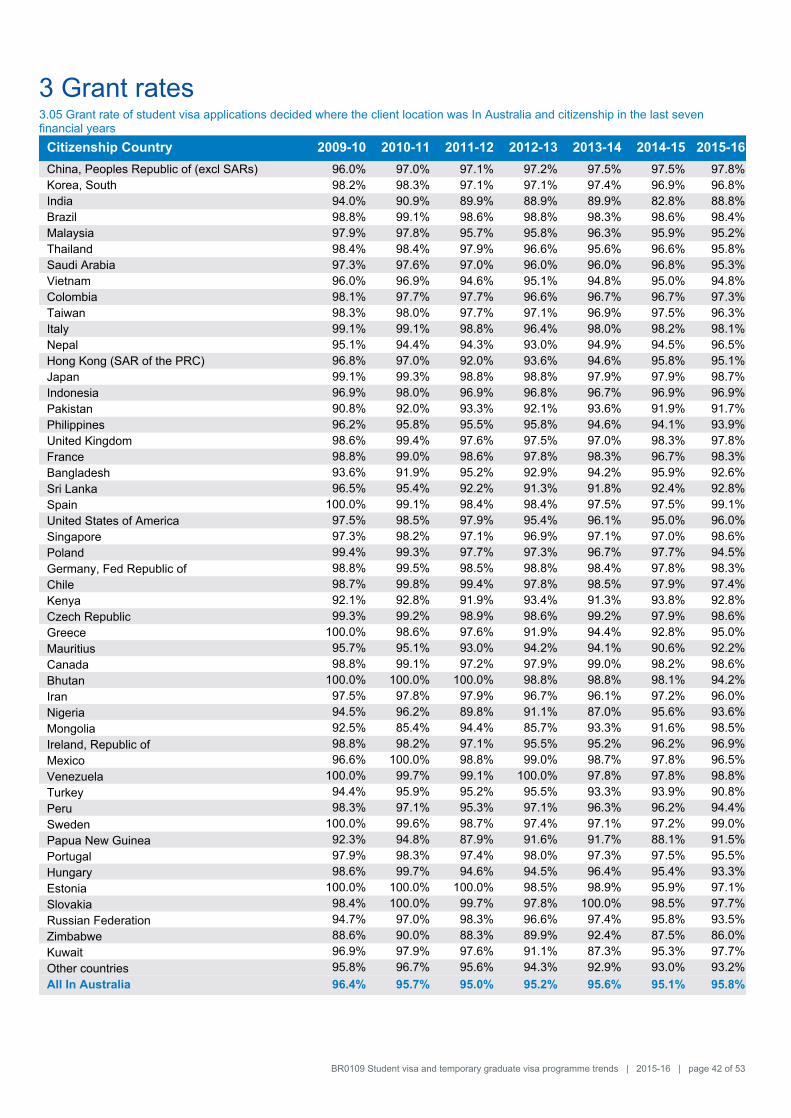
3 Grant rates3.05 Grant rate of student visa applications decided where the client location was In Australia and citizenship in the last seven financial years
Citizenship Country 2009-10 2010-11 2011-12 2012-13 2013-14 2014-15 2015-16
China, Peoples Republic of (excl SARs) 96.0% 97.0% 97.1% 97.2% 97.5% 97.5% 97.8%
Korea, South 98.2% 98.3% 97.1% 97.1% 97.4% 96.9% 96.8%
India 94.0% 90.9% 89.9% 88.9% 89.9% 82.8% 88.8%
Brazil 98.8% 99.1% 98.6% 98.8% 98.3% 98.6% 98.4%
Malaysia 97.9% 97.8% 95.7% 95.8% 96.3% 95.9% 95.2%
Thailand 98.4% 98.4% 97.9% 96.6% 95.6% 96.6% 95.8%
Saudi Arabia 97.3% 97.6% 97.0% 96.0% 96.0% 96.8% 95.3%
Vietnam 96.0% 96.9% 94.6% 95.1% 94.8% 95.0% 94.8%
Colombia 98.1% 97.7% 97.7% 96.6% 96.7% 96.7% 97.3%
Taiwan 98.3% 98.0% 97.7% 97.1% 96.9% 97.5% 96.3%
Italy 99.1% 99.1% 98.8% 96.4% 98.0% 98.2% 98.1%
Nepal 95.1% 94.4% 94.3% 93.0% 94.9% 94.5% 96.5%
Hong Kong (SAR of the PRC) 96.8% 97.0% 92.0% 93.6% 94.6% 95.8% 95.1%
Japan 99.1% 99.3% 98.8% 98.8% 97.9% 97.9% 98.7%
Indonesia 96.9% 98.0% 96.9% 96.8% 96.7% 96.9% 96.9%
Pakistan 90.8% 92.0% 93.3% 92.1% 93.6% 91.9% 91.7%
Philippines 96.2% 95.8% 95.5% 95.8% 94.6% 94.1% 93.9%
United Kingdom 98.6% 99.4% 97.6% 97.5% 97.0% 98.3% 97.8%
France 98.8% 99.0% 98.6% 97.8% 98.3% 96.7% 98.3%
Bangladesh 93.6% 91.9% 95.2% 92.9% 94.2% 95.9% 92.6%
Sri Lanka 96.5% 95.4% 92.2% 91.3% 91.8% 92.4% 92.8%
Spain 100.0% 99.1% 98.4% 98.4% 97.5% 97.5% 99.1%
United States of America 97.5% 98.5% 97.9% 95.4% 96.1% 95.0% 96.0%
Singapore 97.3% 98.2% 97.1% 96.9% 97.1% 97.0% 98.6%
Poland 99.4% 99.3% 97.7% 97.3% 96.7% 97.7% 94.5%
Germany, Fed Republic of 98.8% 99.5% 98.5% 98.8% 98.4% 97.8% 98.3%
Chile 98.7% 99.8% 99.4% 97.8% 98.5% 97.9% 97.4%
Kenya 92.1% 92.8% 91.9% 93.4% 91.3% 93.8% 92.8%
Czech Republic 99.3% 99.2% 98.9% 98.6% 99.2% 97.9% 98.6%
Greece 100.0% 98.6% 97.6% 91.9% 94.4% 92.8% 95.0%
Mauritius 95.7% 95.1% 93.0% 94.2% 94.1% 90.6% 92.2%
Canada 98.8% 99.1% 97.2% 97.9% 99.0% 98.2% 98.6%
Bhutan 100.0% 100.0% 100.0% 98.8% 98.8% 98.1% 94.2%
Iran 97.5% 97.8% 97.9% 96.7% 96.1% 97.2% 96.0%
Nigeria 94.5% 96.2% 89.8% 91.1% 87.0% 95.6% 93.6%
Mongolia 92.5% 85.4% 94.4% 85.7% 93.3% 91.6% 98.5%
Ireland, Republic of 98.8% 98.2% 97.1% 95.5% 95.2% 96.2% 96.9%
Mexico 96.6% 100.0% 98.8% 99.0% 98.7% 97.8% 96.5%
Venezuela 100.0% 99.7% 99.1% 100.0% 97.8% 97.8% 98.8%
Turkey 94.4% 95.9% 95.2% 95.5% 93.3% 93.9% 90.8%
Peru 98.3% 97.1% 95.3% 97.1% 96.3% 96.2% 94.4%
Sweden 100.0% 99.6% 98.7% 97.4% 97.1% 97.2% 99.0%
Papua New Guinea 92.3% 94.8% 87.9% 91.6% 91.7% 88.1% 91.5%
Portugal 97.9% 98.3% 97.4% 98.0% 97.3% 97.5% 95.5%
Hungary 98.6% 99.7% 94.6% 94.5% 96.4% 95.4% 93.3%
Estonia 100.0% 100.0% 100.0% 98.5% 98.9% 95.9% 97.1%
Slovakia 98.4% 100.0% 99.7% 97.8% 100.0% 98.5% 97.7%
Russian Federation 94.7% 97.0% 98.3% 96.6% 97.4% 95.8% 93.5%
Zimbabwe 88.6% 90.0% 88.3% 89.9% 92.4% 87.5% 86.0%
Kuwait 96.9% 97.9% 97.6% 91.1% 87.3% 95.3% 97.7%
Other countries 95.8% 96.7% 95.6% 94.3% 92.9% 93.0% 93.2%
All In Australia 96.4% 95.7% 95.0% 95.2% 95.6% 95.1% 95.8%
BR0109 Student visa and temporary graduate visa programme trends | 2015-16 | page 42 of 53

4 Visa holders inAustralia
BR0109 Student visa and temporary graduate visa programme trends | 2015-16 | page 43 of 53
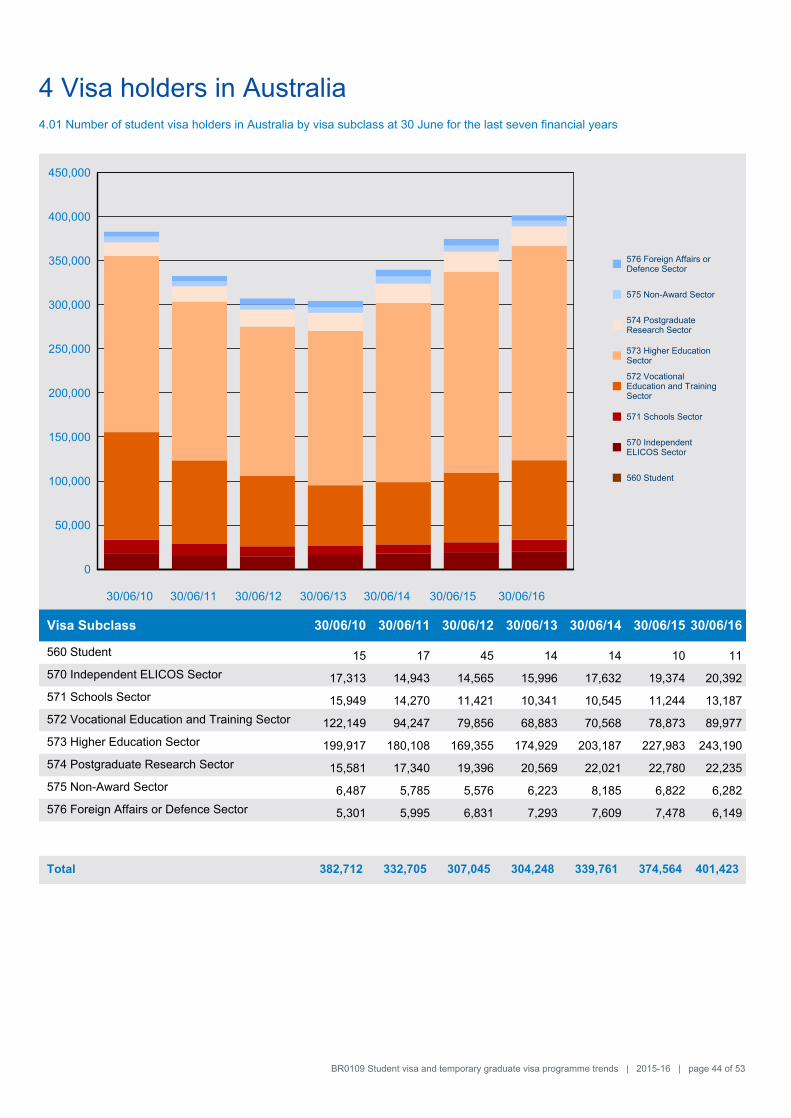
4 Visa holders in Australia4.01 Number of student visa holders in Australia by visa subclass at 30 June for the last seven financial years
0
50,000
100,000
150,000
200,000
250,000
300,000
350,000
400,000
450,000
576 Foreign Affairs orDefence Sector
575 Non-Award Sector
574 PostgraduateResearch Sector
573 Higher EducationSector
572 VocationalEducation and TrainingSector
571 Schools Sector
570 IndependentELICOS Sector
560 Student
30/06/1630/06/1530/06/1430/06/1330/06/1230/06/1130/06/10
Visa Subclass 30/06/10 30/06/11 30/06/12 30/06/13 30/06/14 30/06/15 30/06/16
560 Student 15 17 45 14 14 10 11
570 Independent ELICOS Sector 17,313 14,943 14,565 15,996 17,632 19,374 20,392
571 Schools Sector 15,949 14,270 11,421 10,341 10,545 11,244 13,187
572 Vocational Education and Training Sector 122,149 94,247 79,856 68,883 70,568 78,873 89,977
573 Higher Education Sector 199,917 180,108 169,355 174,929 203,187 227,983 243,190
574 Postgraduate Research Sector 15,581 17,340 19,396 20,569 22,021 22,780 22,235
575 Non-Award Sector 6,487 5,785 5,576 6,223 8,185 6,822 6,282
576 Foreign Affairs or Defence Sector 5,301 5,995 6,831 7,293 7,609 7,478 6,149
Total 382,712 332,705 307,045 304,248 339,761 374,564 401,423
BR0109 Student visa and temporary graduate visa programme trends | 2015-16 | page 44 of 53
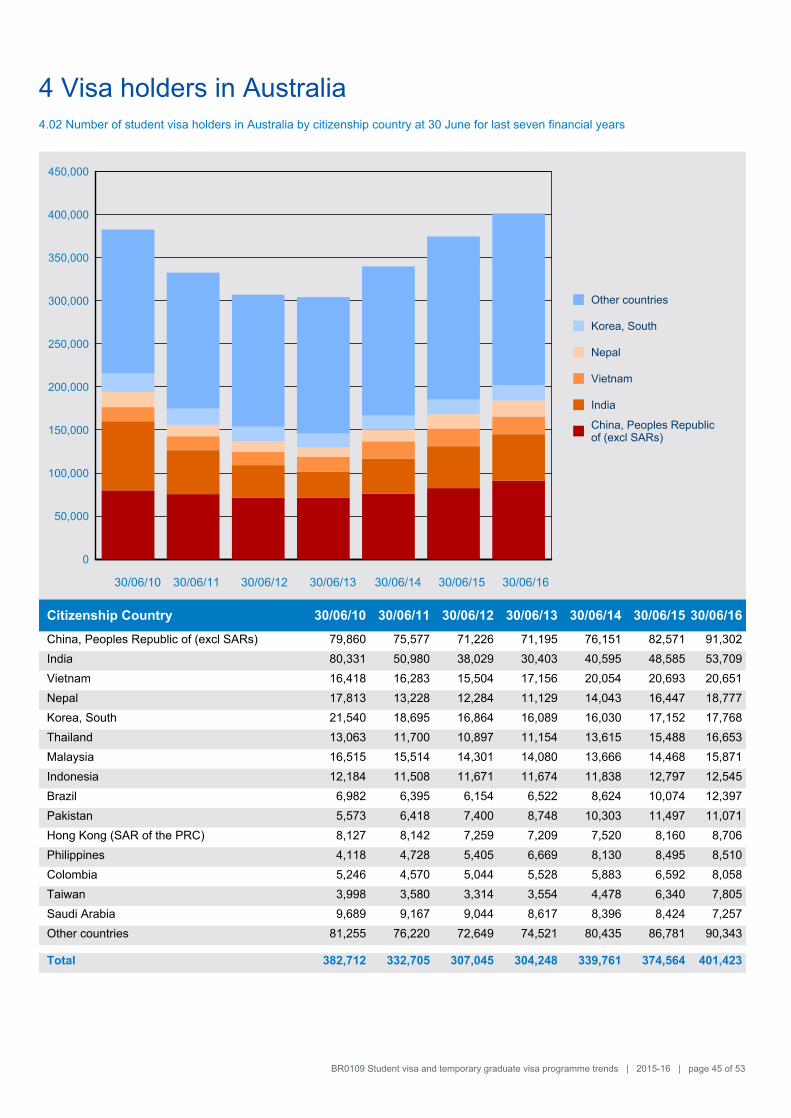
4 Visa holders in Australia4.02 Number of student visa holders in Australia by citizenship country at 30 June for last seven financial years
0
50,000
100,000
150,000
200,000
250,000
300,000
350,000
400,000
450,000
Other countries
Korea, South
Nepal
Vietnam
India
China, Peoples Republicof (excl SARs)
30/06/1330/06/1230/06/1130/06/10 30/06/1630/06/1530/06/14
Citizenship Country 30/06/10 30/06/11 30/06/12 30/06/13 30/06/14 30/06/15 30/06/16
China, Peoples Republic of (excl SARs) 79,860 75,577 71,226 71,195 76,151 82,571 91,302
India 80,331 50,980 38,029 30,403 40,595 48,585 53,709
Vietnam 16,418 16,283 15,504 17,156 20,054 20,693 20,651
Nepal 17,813 13,228 12,284 11,129 14,043 16,447 18,777
Korea, South 21,540 18,695 16,864 16,089 16,030 17,152 17,768
Thailand 13,063 11,700 10,897 11,154 13,615 15,488 16,653
Malaysia 16,515 15,514 14,301 14,080 13,666 14,468 15,871
Indonesia 12,184 11,508 11,671 11,674 11,838 12,797 12,545
Brazil 6,982 6,395 6,154 6,522 8,624 10,074 12,397
Pakistan 5,573 6,418 7,400 8,748 10,303 11,497 11,071
Hong Kong (SAR of the PRC) 8,127 8,142 7,259 7,209 7,520 8,160 8,706
Philippines 4,118 4,728 5,405 6,669 8,130 8,495 8,510
Colombia 5,246 4,570 5,044 5,528 5,883 6,592 8,058
Taiwan 3,998 3,580 3,314 3,554 4,478 6,340 7,805
Saudi Arabia 9,689 9,167 9,044 8,617 8,396 8,424 7,257
Other countries 81,255 76,220 72,649 74,521 80,435 86,781 90,343
Total 382,712 332,705 307,045 304,248 339,761 374,564 401,423
BR0109 Student visa and temporary graduate visa programme trends | 2015-16 | page 45 of 53

BR0109 Student visa and temporary graduate visa programme trends | 2015-16 | page 46 of 53

5 Destinations
BR0109 Student visa and temporary graduate visa programme trends | 2015-16 | page 47 of 53
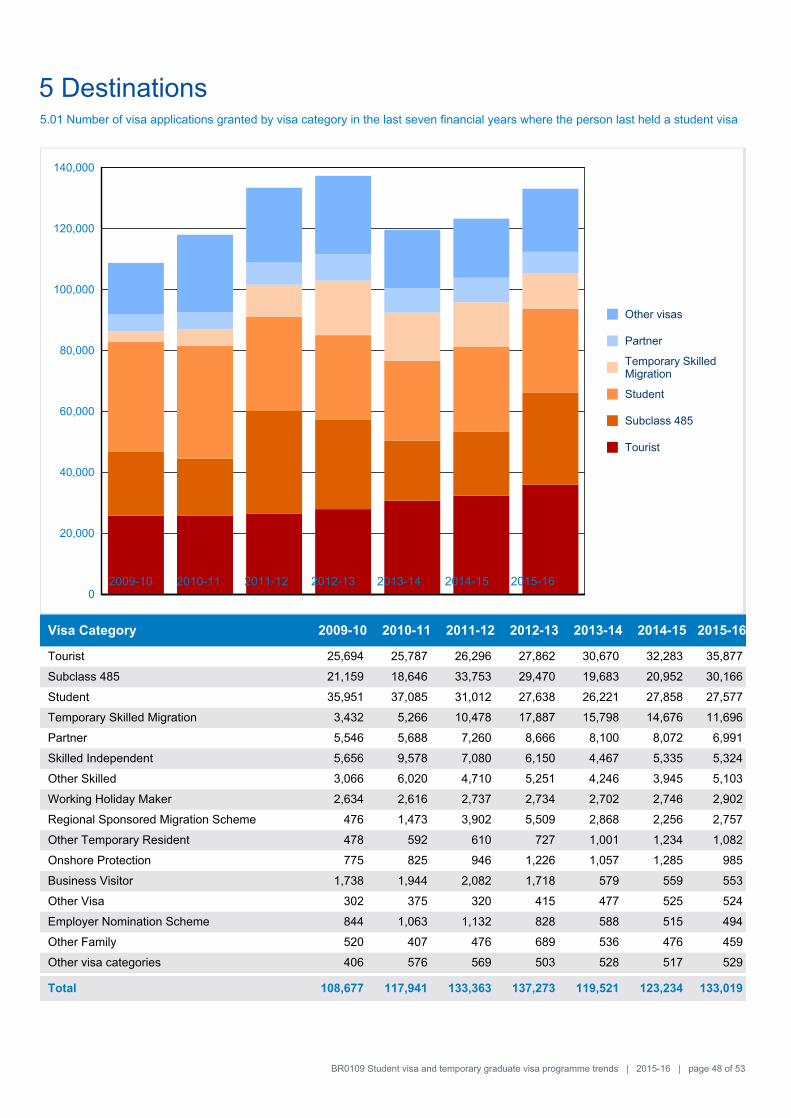
5.01 Number of visa applications granted by visa category in the last seven financial years where the person last held a student visa
0
20,000
40,000
60,000
80,000
100,000
120,000
140,000
Other visas
Partner
Temporary SkilledMigration
Student
Subclass 485
Tourist
2015-162009-10 2010-11 2011-12 2012-13 2013-14 2014-15
Visa Category 2009-10 2010-11 2011-12 2012-13 2013-14 2014-15 2015-16
Tourist 25,694 25,787 26,296 27,862 30,670 32,283 35,877
Subclass 485 21,159 18,646 33,753 29,470 19,683 20,952 30,166
Student 35,951 37,085 31,012 27,638 26,221 27,858 27,577
Temporary Skilled Migration 3,432 5,266 10,478 17,887 15,798 14,676 11,696
Partner 5,546 5,688 7,260 8,666 8,100 8,072 6,991
Skilled Independent 5,656 9,578 7,080 6,150 4,467 5,335 5,324
Other Skilled 3,066 6,020 4,710 5,251 4,246 3,945 5,103
Working Holiday Maker 2,634 2,616 2,737 2,734 2,702 2,746 2,902
Regional Sponsored Migration Scheme 476 1,473 3,902 5,509 2,868 2,256 2,757
Other Temporary Resident 478 592 610 727 1,001 1,234 1,082
Onshore Protection 775 825 946 1,226 1,057 1,285 985
Business Visitor 1,738 1,944 2,082 1,718 579 559 553
Other Visa 302 375 320 415 477 525 524
Employer Nomination Scheme 844 1,063 1,132 828 588 515 494
Other Family 520 407 476 689 536 476 459
Other visa categories 406 576 569 503 528 517 529
Total 108,677 117,941 133,363 137,273 119,521 123,234 133,019
BR0109 Student visa and temporary graduate visa programme trends | 2015-16 | page 48 of 53
5 Destinations

6 Subclass 485 visa
BR0109 Student visa and temporary graduate visa programme trends | 2015-16 | page 49 of 53
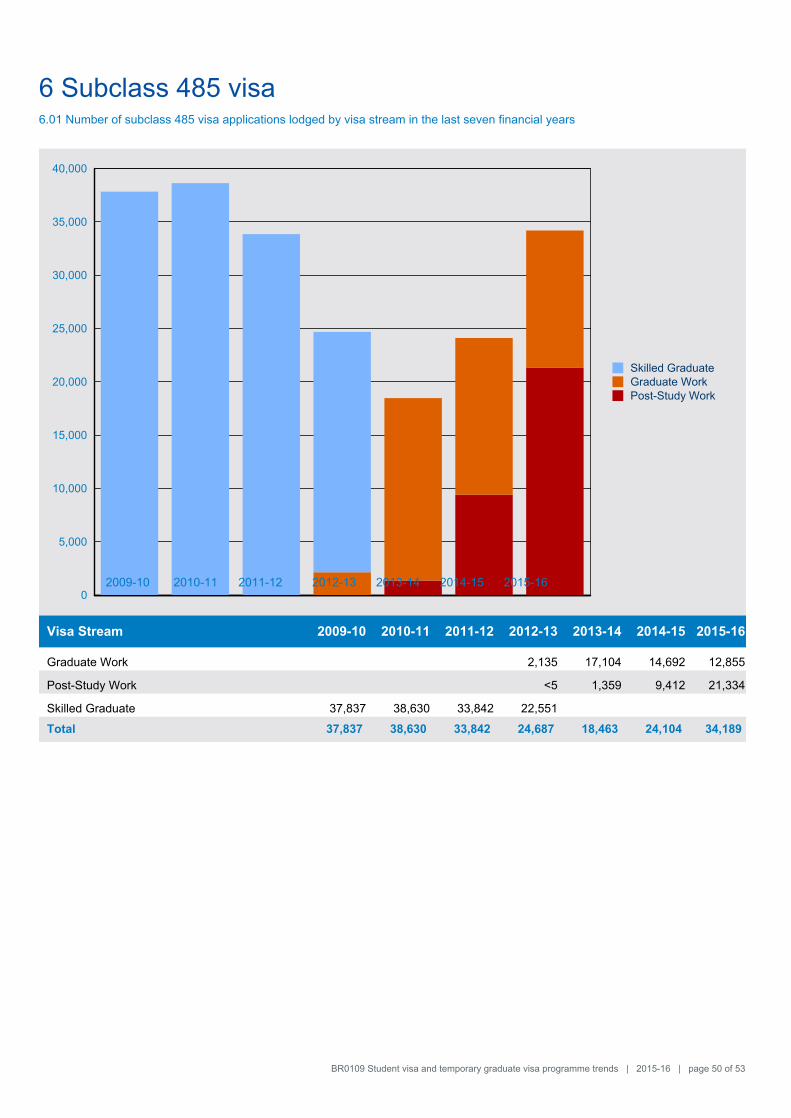
6 Subclass 485 visa
0
5,000
10,000
15,000
20,000
25,000
30,000
35,000
40,000
Skilled GraduateGraduate WorkPost-Study Work
2015-162009-10 2010-11 2011-12 2012-13 2013-14 2014-15
6.01 Number of subclass 485 visa applications lodged by visa stream in the last seven financial years
Visa Stream 2009-10 2010-11 2011-12 2012-13 2013-14 2014-15 2015-16
Graduate Work 2,135 17,104 14,692 12,855
Post-Study Work <5 1,359 9,412 21,334
Skilled Graduate 37,837 38,630 33,842 22,551
Total 37,837 38,630 33,842 24,687 18,463 24,104 34,189
BR0109 Student visa and temporary graduate visa programme trends | 2015-16 | page 50 of 53
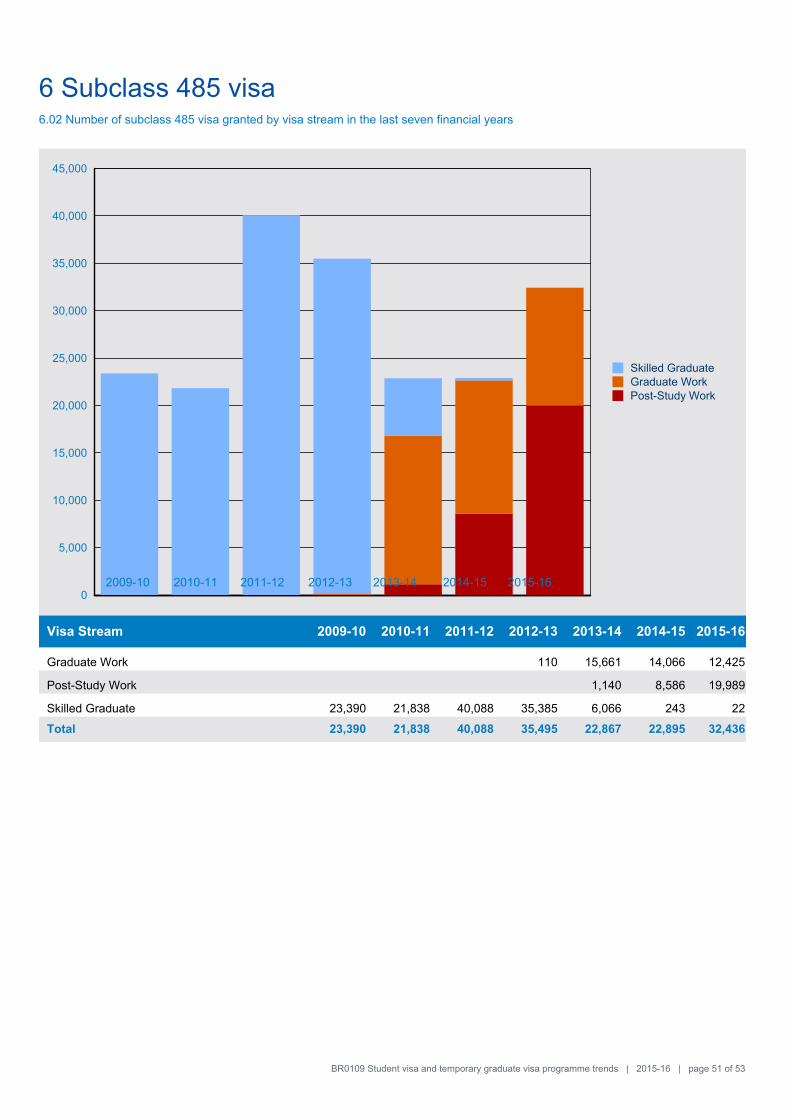
6.02 Number of subclass 485 visa granted by visa stream in the last seven financial years
0
5,000
10,000
15,000
20,000
25,000
30,000
35,000
40,000
45,000
Skilled GraduateGraduate WorkPost-Study Work
2015-162009-10 2010-11 2011-12 2012-13 2013-14 2014-15
Visa Stream 2009-10 2010-11 2011-12 2012-13 2013-14 2014-15 2015-16
Graduate Work 110 15,661 14,066 12,425
Post-Study Work 1,140 8,586 19,989
Skilled Graduate 23,390 21,838 40,088 35,385 6,066 243 22
Total 23,390 21,838 40,088 35,495 22,867 22,895 32,436
BR0109 Student visa and temporary graduate visa programme trends | 2015-16 | page 51 of 53
6 Subclass 485 visa
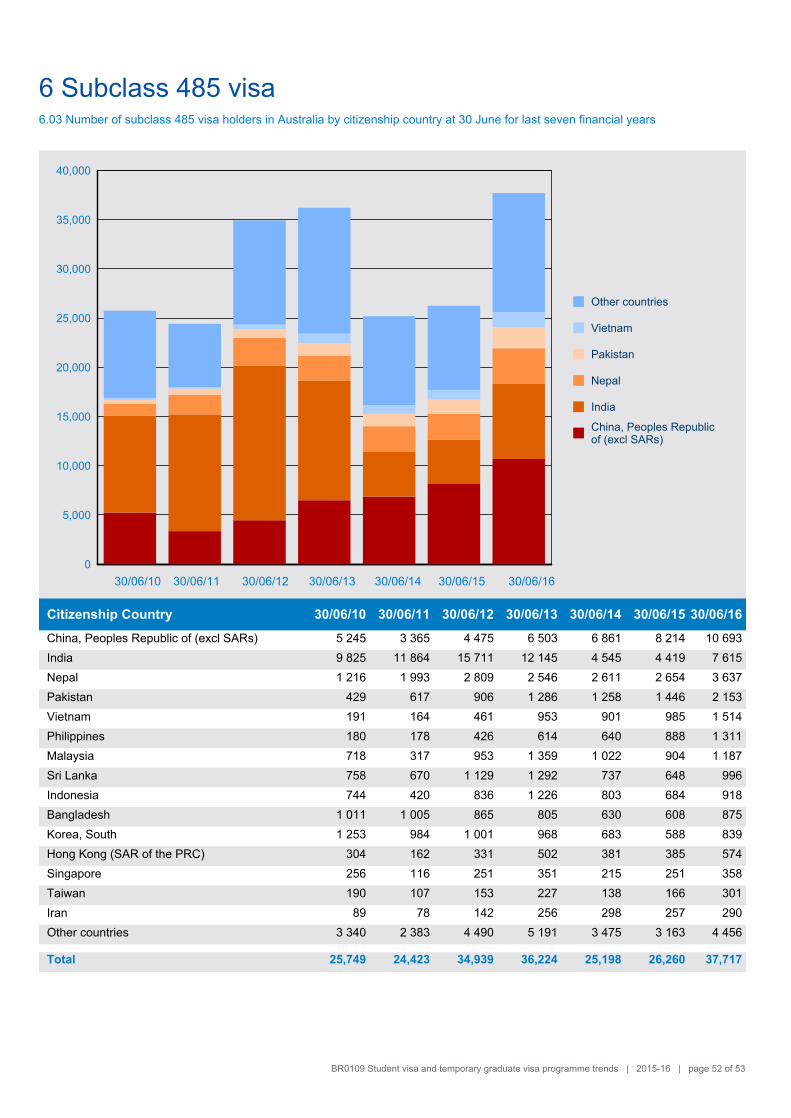
6 Subclass 485 visa6.03 Number of subclass 485 visa holders in Australia by citizenship country at 30 June for last seven financial years
0
5,000
10,000
15,000
20,000
25,000
30,000
35,000
40,000
Other countries
Vietnam
Pakistan
Nepal
India
China, Peoples Republicof (excl SARs)
30/06/1330/06/1230/06/1130/06/10 30/06/1630/06/1530/06/14
Citizenship Country 30/06/10 30/06/11 30/06/12 30/06/13 30/06/14 30/06/15 30/06/16
China, Peoples Republic of (excl SARs) 5 245 3 365 4 475 6 503 6 861 8 214 10 693
India 9 825 11 864 15 711 12 145 4 545 4 419 7 615
Nepal 1 216 1 993 2 809 2 546 2 611 2 654 3 637
Pakistan 429 617 906 1 286 1 258 1 446 2 153
Vietnam 191 164 461 953 901 985 1 514
Philippines 180 178 426 614 640 888 1 311
Malaysia 718 317 953 1 359 1 022 904 1 187
Sri Lanka 758 670 1 129 1 292 737 648 996
Indonesia 744 420 836 1 226 803 684 918
Bangladesh 1 011 1 005 865 805 630 608 875
Korea, South 1 253 984 1 001 968 683 588 839
Hong Kong (SAR of the PRC) 304 162 331 502 381 385 574
Singapore 256 116 251 351 215 251 358
Taiwan 190 107 153 227 138 166 301
Iran 89 78 142 256 298 257 290
Other countries 3 340 2 383 4 490 5 191 3 475 3 163 4 456
Total 25,749 24,423 34,939 36,224 25,198 26,260 37,717
BR0109 Student visa and temporary graduate visa programme trends | 2015-16 | page 52 of 53

BR0109 Student visa and temporary graduate visa programme trends | 2015-16 | page 53 of 53


![Application Process of Student Visa [F1 & M1 Visa]](https://img.pdfslide.us/doc/110x75/55cf8dd1550346703b8b8a20/application-process-of-student-visa-f1-m1-visa-56038a33b5dc1.jpg)