Embed Size (px)
Citation preview
BP Full Year 2006 Results and Strategy Update
6 February 2007

John Browne
Group Chief Executive
3
Cautionary StatementForward Looking Statements Cautionary StatementThis presentation and the associated slides and discussion contain forward looking statements, particularly those regarding capital expenditure, capital investments, spending on integrity management, annual charges, cost inflation, production and impact of delays in projects on production, expected return to capacity of projects, share buybacks and other distributions to shareholders, group costs, divestment proceeds and their use, effective tax rate, futureperformance, gearing, growth opportunities, global economic growth, global oil demand growth, oil and gas prices, performance, oil and gas production, production growth, refining margins, refining availability and capacity, outlook for refining environment, the timing of major projects and their contribution to BP net resources and the application of technology. By their nature, forward-looking statements involve risks and uncertainties because they relate to events and depend on circumstances that will or may occur in the future. Actual results may differ from those expressed in such statements, depending on a variety of factors, including the timing of bringing new fields on stream; future levels of industry product supply; demand and pricing; operational problems; general economic conditions; political stability and economic growth in relevant areas of the world; changes in laws and governmental regulations; exchange ratefluctuations; development and use of new technology; changes in public expectations and other changes in business conditions; the actions of competitors; natural disasters and adverse weather conditions; wars and acts of terrorism or sabotage; and other factors discussed elsewhere in this presentation.
Reconciliations to GAAP - This presentation also contains fi nancial information which is not presented in accordance with generally accepted accounting principles (GAAP). A quantitative reconciliation of this information to the most directly comparable financial me asure calculated and presented in accordance with GAAP can be fou nd on our website at www.bp.com
Cautionary Note to US Investors - The United States Securities and Exchange Commission permits oil and gas companies, in their filings with the SEC, to disclose only proved reserves that a company has demonstrated by actual production or formation tests to be economically and legally producible under existing economic and operating conditions. We use certain terms in this presentation, such as “resources” and “non-proved reserves”, that the SEC’s guidelines strictly prohibit us from including in our filings with the SEC. U.S. investors are urged to consider closely the disclosures in our Form 20-F/A, SEC File No. 1-06262, availabl e from us at 1 St James’s Square, London SW1Y 4PD. You can also obtain this form from the SEC by calling 1-800-SEC-0330.
February 2007
John Browne
Group Chief Executive
5
Agenda
• Review of 2006
Strategy and performance in context
Trading environment
2007 priorities
− Business updates
Financial framework
2007 guidance
Q&A
•
•
•
•
•
•

6
2006: Financial results
•
Replacement cost profit− $22.3bn, up 15%
Per share 111.1¢, up 22% − • Post tax operating cash flow $28.2bn, up 5%
Quarterly dividend per share 10.325¢• − Up 5% vs. last quarter
Up 10% vs. last year− • Distributed $23.2bn to shareholders: $15.5bn by share
buybacks
Divestment proceeds of $6.3bn Gearing at 20%, bottom of target range
•
•
7
2006: Incidents and responses
•
Texas City
− Implementing Baker Panel’s process safety recommendations
•
Prudhoe Bay and Thunder Horse
− Embedding learning across the company
•
Propane trading

8
2006: Milestones
• 2006 reserve replacement 113%
10 new discoveries including Kaskida, Titania, Urano and in Uvat area
New upstream access: Pakistan, India and Oman
Start-up of 9 new upstream projects
Re-commissioning of Texas City continues
Significant progress in Alternative Energy
$3bn Whiting refinery investment sanctioned
•
•
•
•
•
•
Byron Grote
Chief Financial Officer
10
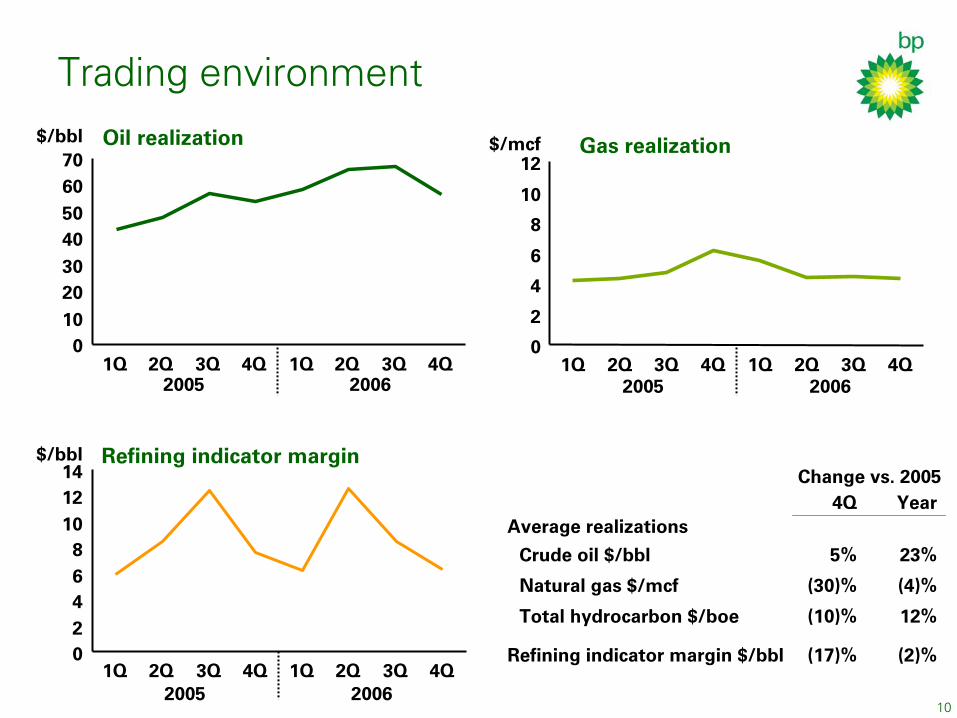
Trading environment
010203040506070
1Q 2Q 3Q 4Q 1Q 2Q 3Q 4Q
Oil realization$/bbl
2005 2006
02468
101214
1Q 2Q 3Q 4Q 1Q 2Q 3Q 4Q
Refining indicator margin$/bbl
2005 2006
0
2
4
6
8
10
12
1Q 2Q 3Q 4Q 1Q 2Q 3Q 4Q
Gas realization$/mcf
2005 2006
Change vs. 20054Q Year
Average realizations
Crude oil $/bbl 5% 23%
Natural gas $/mcf (30)% (4)%
Total hydrocarbon $/boe (10)% 12%
Refining indicator margin $/bbl (17)% (2)%
11
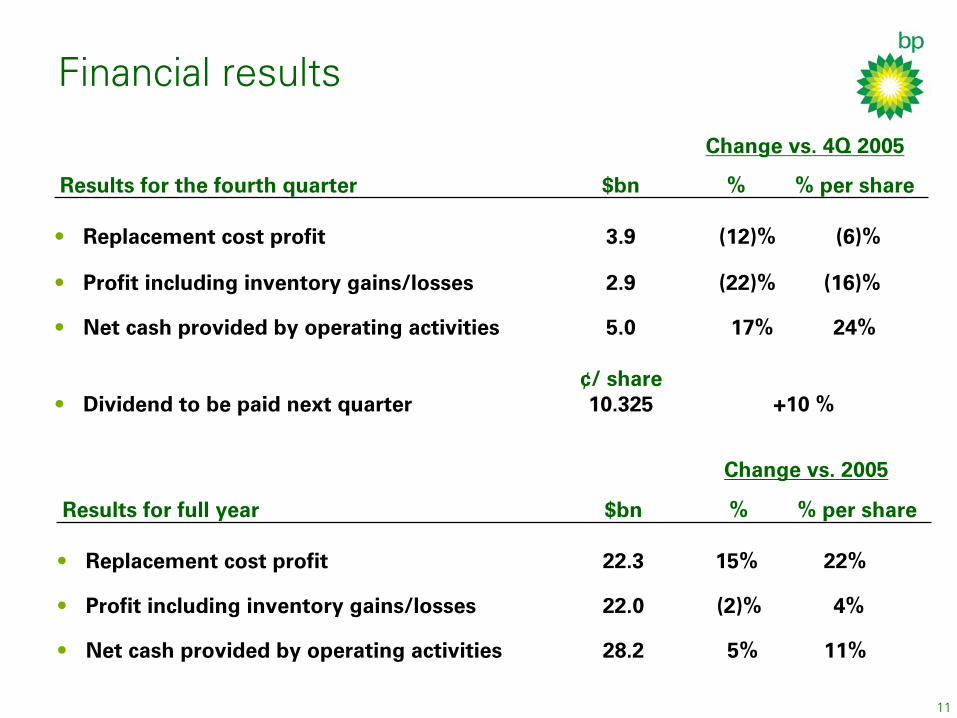
Financial results
Change vs. 4Q 2005
Results for the fourth quarter $bn % % per share
• Replacement cost profit 3.9 (12)% (6)%
Profit including inventory gains/losses 2.9 (22)% (16)%•
Net cash provided by operating activities 5.0 17% 24%•
¢/ share
•
Dividend to be paid next quarter 10.325 +10 %
Change vs. 2005
Results for full year $bn % % per share
• Replacement cost profit 22.3 15% 22%
Profit including inventory gains/losses 22.0 (2)% 4%•
Net cash provided by operating activities 28.2 5% 11%•
12
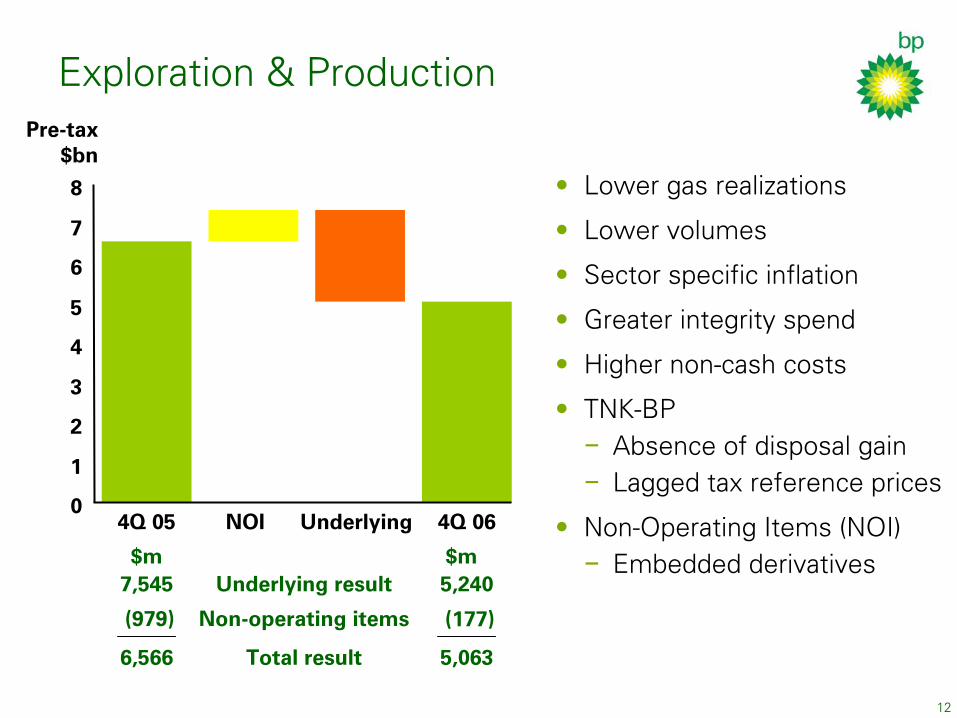
Exploration & Production
• Lower gas realizations Lower volumes Sector specific inflation Greater integrity spend Higher non-cash costs TNK-BP
•
•
•
•
• Absence of disposal gain
Lagged tax reference prices −−
• Non-Operating Items (NOI) Embedded derivatives−
Pre-tax $bn
0
1
2
3
4
5
6
7
8
NOI 4Q 064Q 05 Underlying
$m $m7,545 Underlying result 5,240
(979) Non-operating items (177)
6,566 Total result 5,063
13
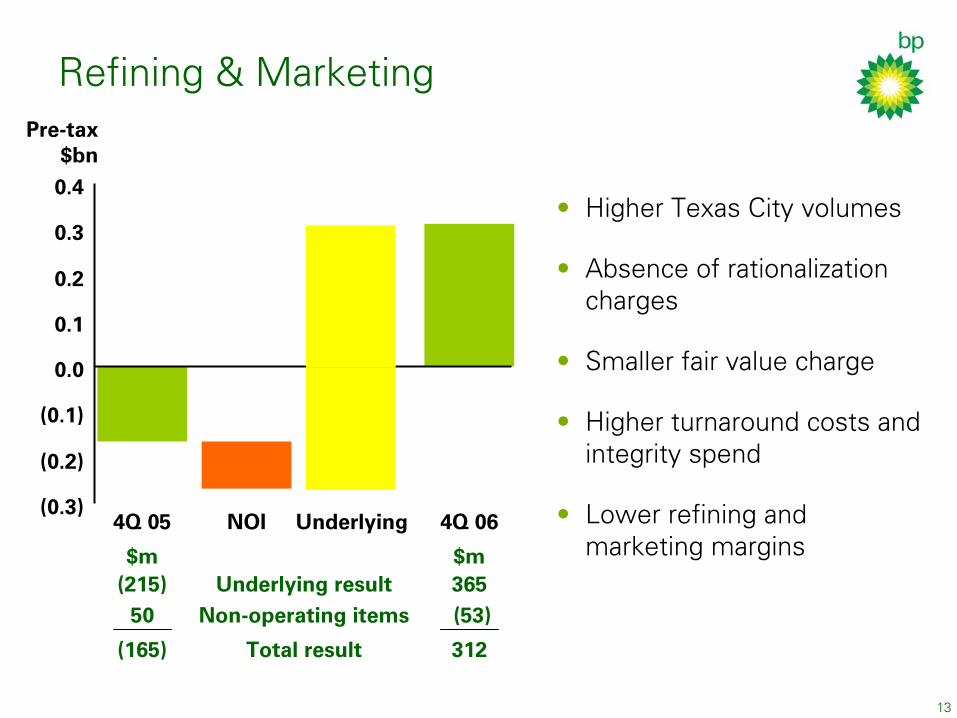
Refining & Marketing
• Higher Texas City volumes
Absence of rationalization charges
Smaller fair value charge
Higher turnaround costs and integrity spend
Lower refining and marketing margins
•
•
•
•(0.3)
(0.2)
(0.1)
0.0
0.1
0.2
0.3
0.4
NOI 4Q 064Q 05 Underlying
Pre-tax $bn
$m $m(215) Underlying result 365
50 Non-operating items (53)
(165) Total result 312
14
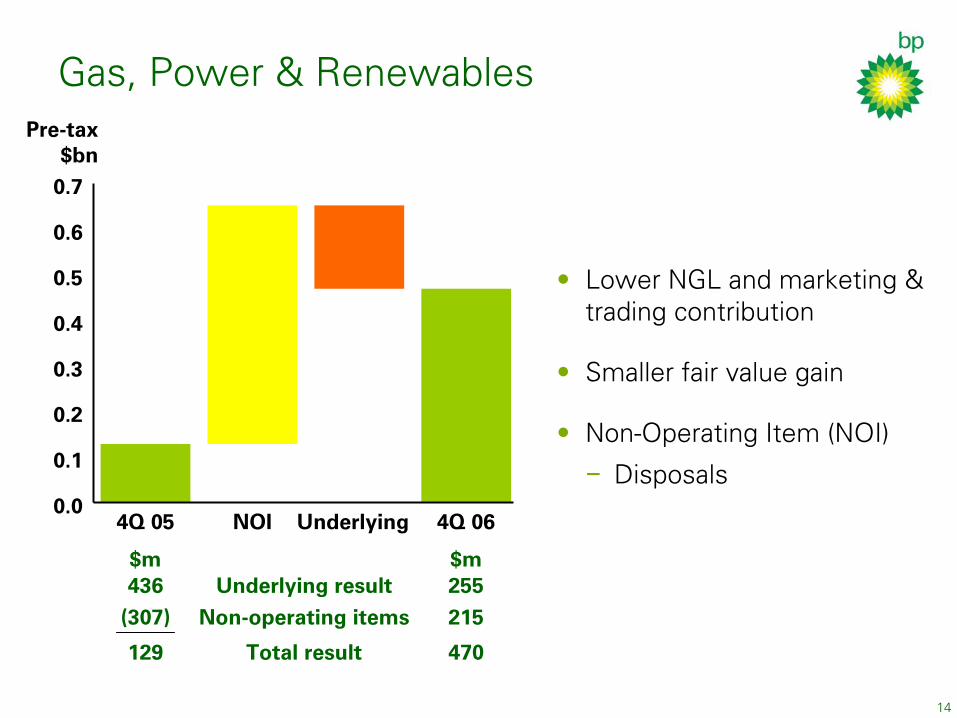
Gas, Power & Renewables
• Lower NGL and marketing & trading contribution
Smaller fair value gain
Non-Operating Item (NOI)
•
• Disposals
−
0.0
0.1
0.2
0.3
0.4
0.5
0.6
0.7
NOI 4Q 064Q 05 Underlying
Pre-tax $bn
$m $m436 Underlying result 255
(307) Non-operating items 215
129 Total result 470

15
Other business & corporate
• 2006 underlying charge consistent with prior
guidance
(0.5)
(0.4)
(0.3)
(0.2)
(0.1)
0.0
NOI 4Q 064Q 05 Underlying
Pre-tax $bn
$m $m(345) Underlying result (88)(64) Non-operating items (188)
(409) Total result (276)
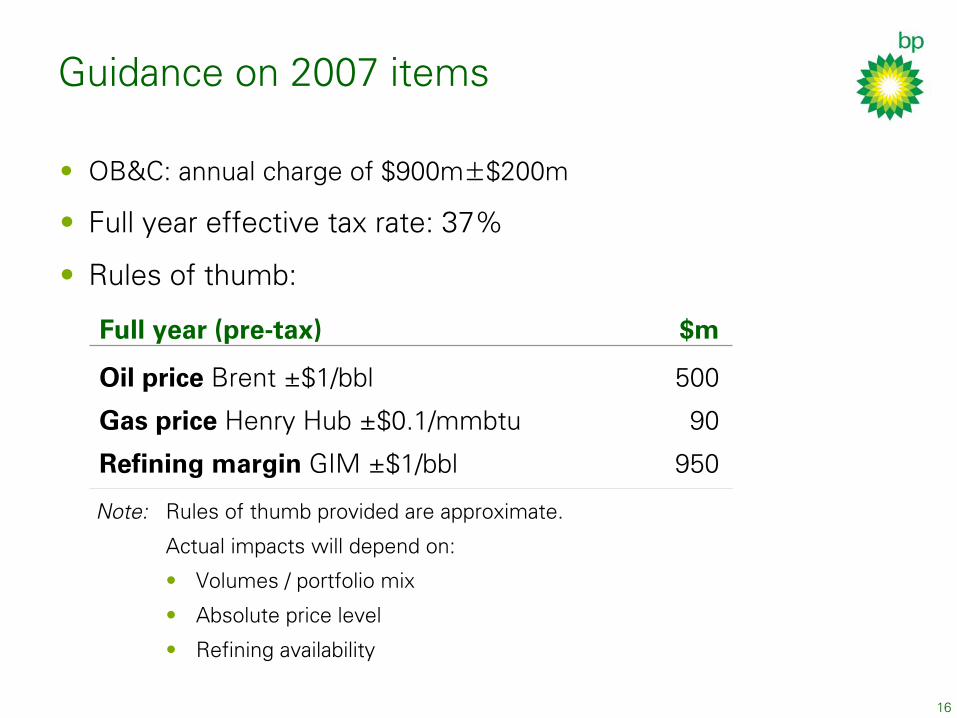
Guidance on 2007 items
• OB&C: annual charge of $900m±$200m Full year effective tax rate: 37% Rules of thumb:
•
•
Full year (pre-tax) $m Oil price Brent ±$1/bbl 500
Gas price Henry Hub ±$0.1/mmbtu 90
Refining margin GIM ±$1/bbl 950 Note: Rules of thumb provided are approximate.
Actual impacts will depend on:
• Volumes / portfolio mix
Absolute price level
Refining availability
•
•
16
17
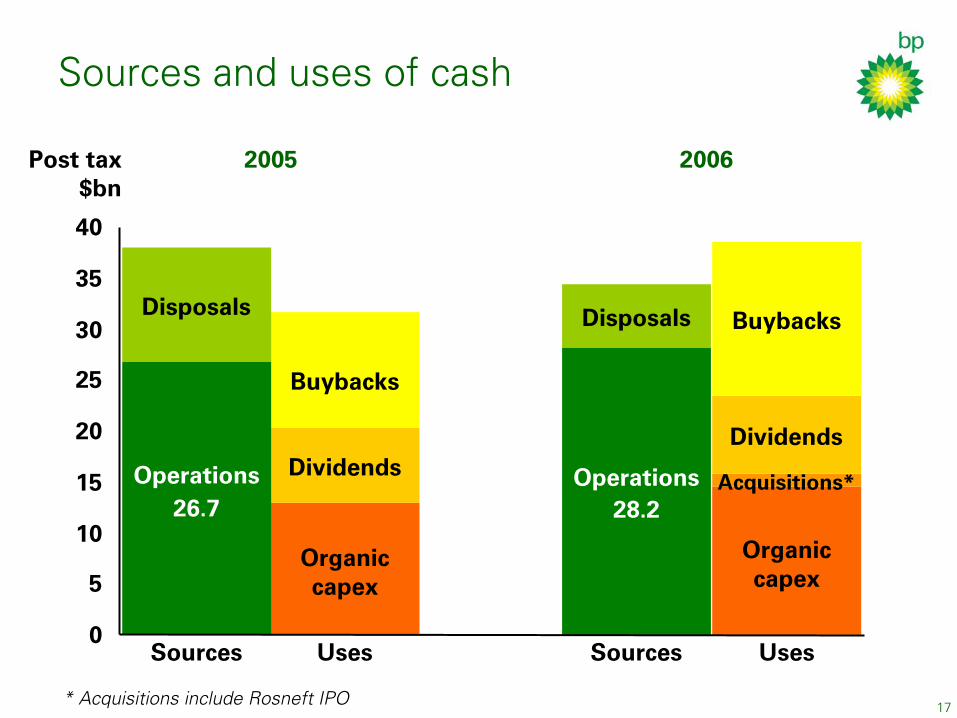
Sources and uses of cash
*
Post tax $bn
2005 2006
Disposals
Operations
Buybacks
Dividends
Organic capex
Disposals
Operations
Buybacks
Dividends
Organic capex
Acquisitions*26.7 28.2
0
5
10
15
20
25
30
35
40
Sources Uses Sources Uses
Acquisitions include Rosneft IPO
18
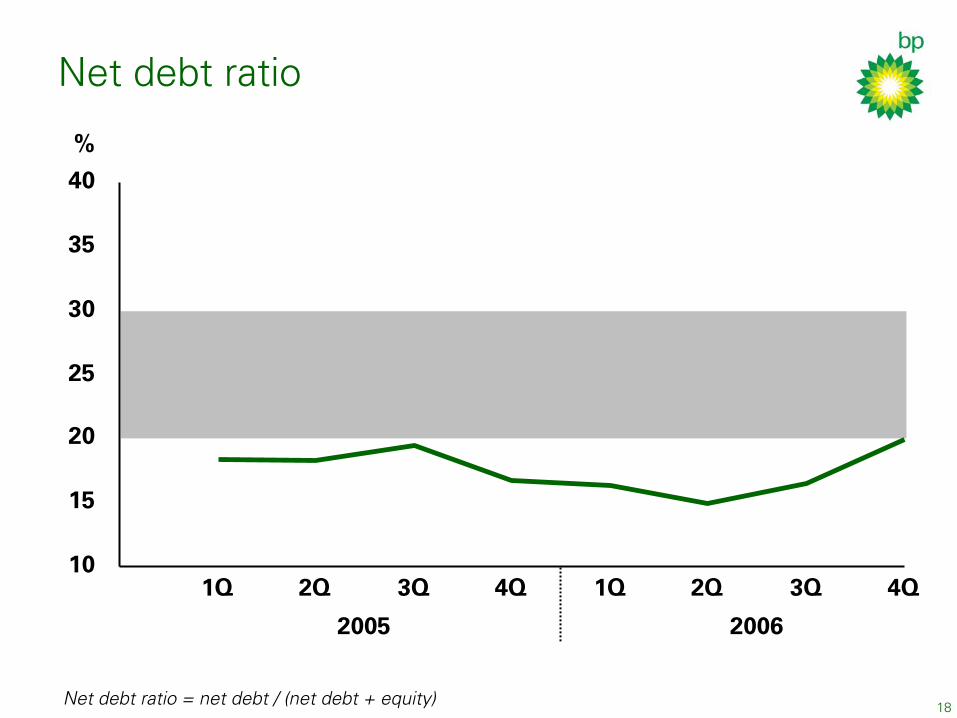
Net debt ratio
20062005
%
10
15
20
25
30
35
40
1Q 2Q 3Q 4Q 1Q 2Q 3Q 4Q
Net debt ratio = net debt / (net debt + equity)
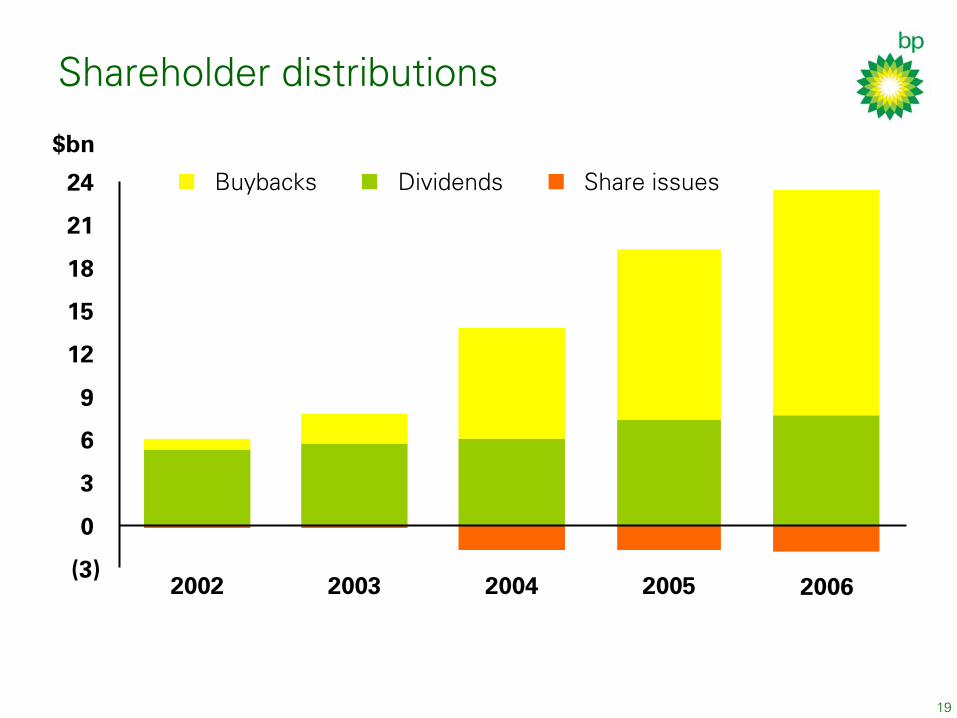
Shareholder distributions
Buybacks Dividends Share issues
2002 2003 2004 2005 2006(3)
0
3
6
9
12
15
18
21
24
$bn
19

John Browne
Group Chief Executive
21
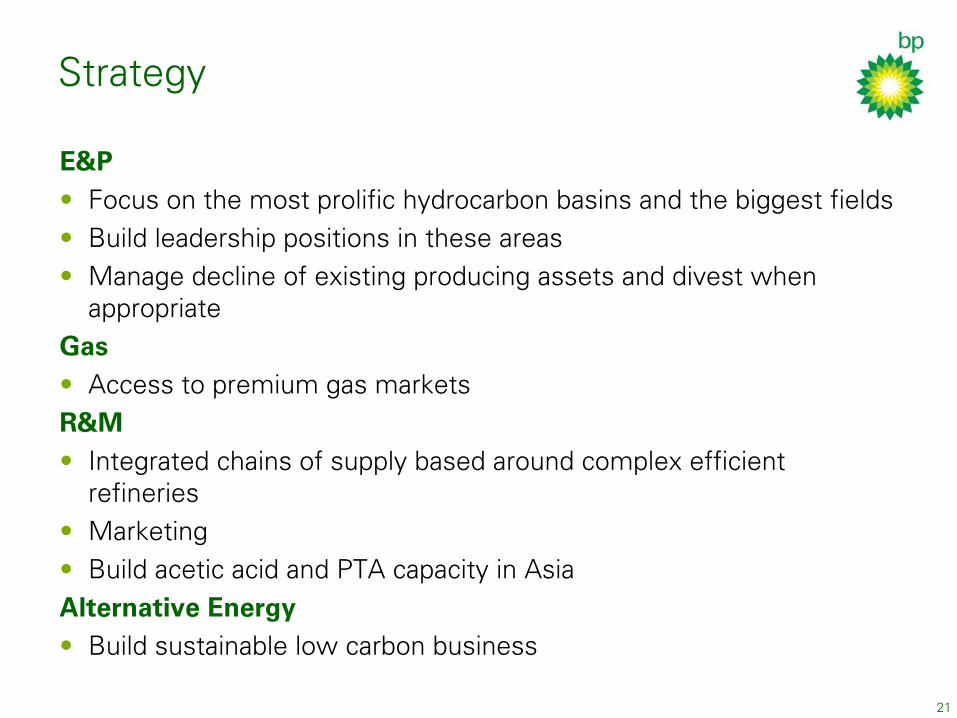
Strategy
E&P• Focus on the most prolific hydrocarbon basins and the biggest fields
Build leadership positions in these areas Manage decline of existing producing assets and divest when appropriate
••
Gas•
Access to premium gas markets
R&M• Integrated chains of supply based around complex efficient
refineriesMarketing
Build acetic acid and PTA capacity in Asia••
Alternative Energy•
Build sustainable low carbon business
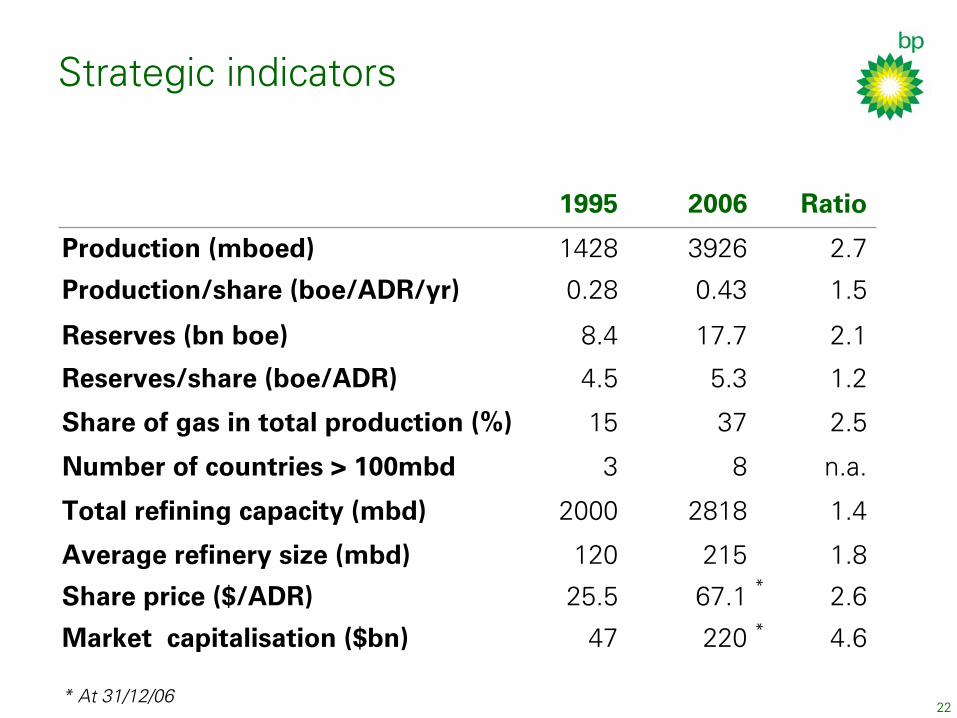
Strategic indicators
1995 2006 Ratio
Production (mboed) 1428 3926 2.7
Production/share (boe/ADR/yr) 0.28 0.43 1.5
Reserves (bn boe) 8.4 17.7 2.1
Reserves/share (boe/ADR) 4.5 5.3 1.2
Share of gas in total production (%) 15 37 2.5
Number of countries > 100mbd 3 8 n.a.
Total refining capacity (mbd) 2000 2818 1.4
Average refinery size (mbd) 120 215 1.8*
*
Share price ($/ADR) 25.5 67.1 2.6
Market capitalisation ($bn) 47 220 4.6
* At 31/12/0622
23
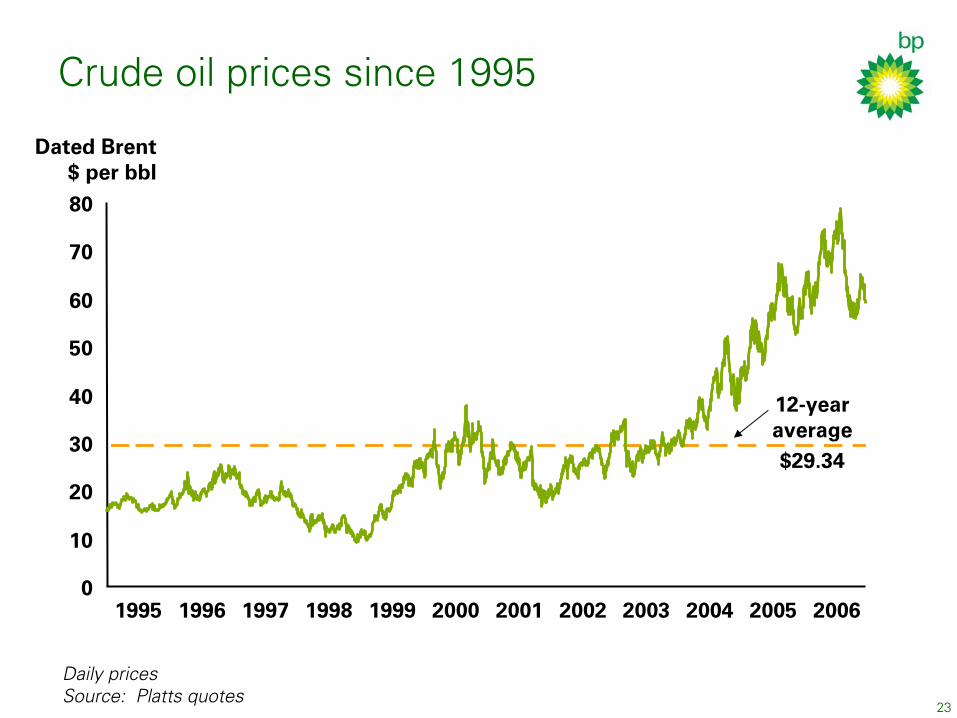
Crude oil prices since 1995
Dated Brent$ per bbl
12-year average$29.34
2006200520042003200220012000199919981997199619950
10
20
30
40
50
60
70
80
Daily pricesSource: Platts quotes

24
Oil demand and economic growth
Oil demand GDP
%
0
1
2
3
4
5
00 01 02 03 04 05 06
Source: oil demand, BP estimate; GDP, ’00 -’06 Oxford Economic Forecasting
25
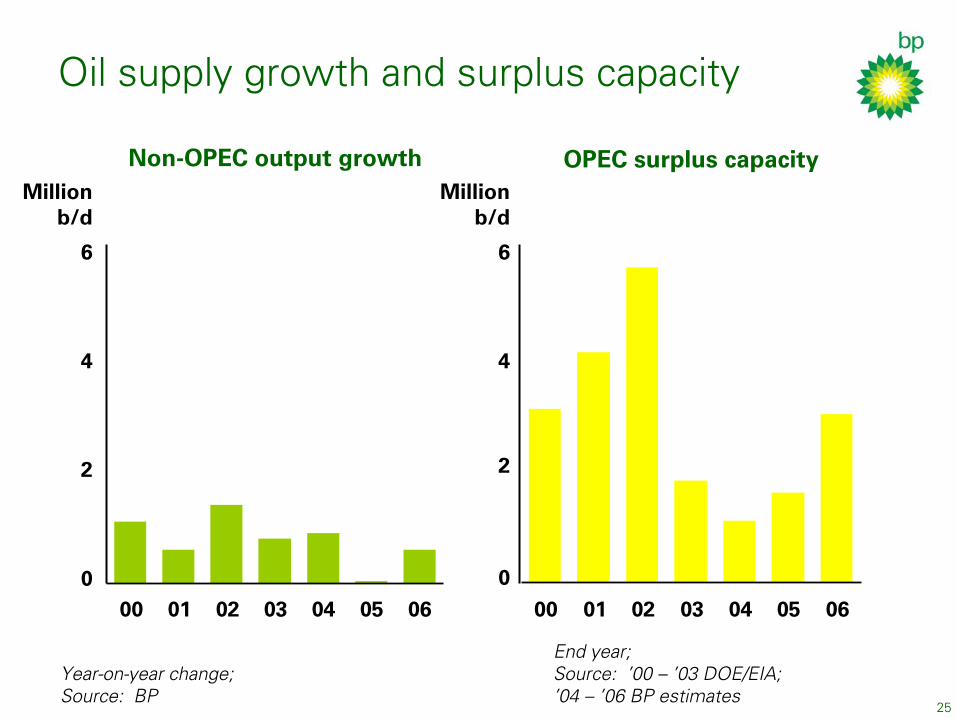
Oil supply growth and surplus capacity
Non-OPEC output growthMillion
b/d
0
2
4
6
00 01 02 03 04 05 06
Year-on-year change; Source: BP
OPEC surplus capacityillion
b/d
0
2
4
6
00 01 02 03 04 05 06
End year; Source: ’00 – ’03 DOE/EIA; ’04 – ’06 BP estimates
M

26
Crude oil prices 2000-07
+19%2005 Avg$54.52
2006 Avg$65.14
20062005200420032002200120000
10
20
30
40
50
60
70
80
Dated Brent$ per bbl
Daily pricesSource: Platts quotes
27
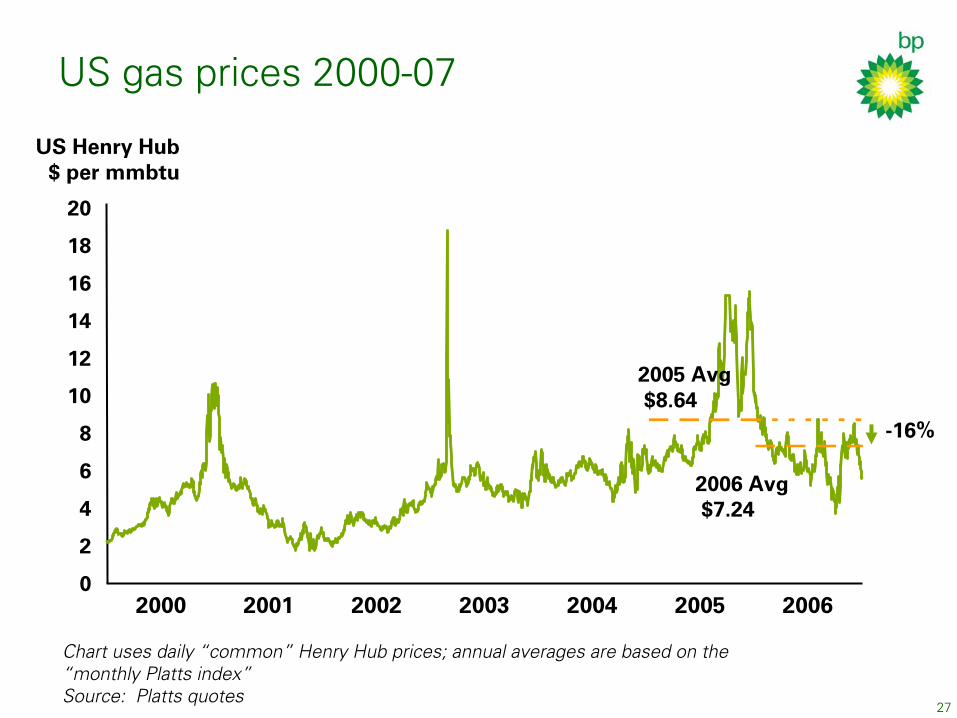
US gas prices 2000-07
-16%
2005 Avg$8.64
2006 Avg$7.24
20062005200420032002200120000
2
4
6
8
10
12
14
16
18
20
US Henry Hub$ per mmbtu
Chart uses daily “common” Henry Hub prices; annual averages are based on the “monthly Platts index”
Source: Platts quotes
28
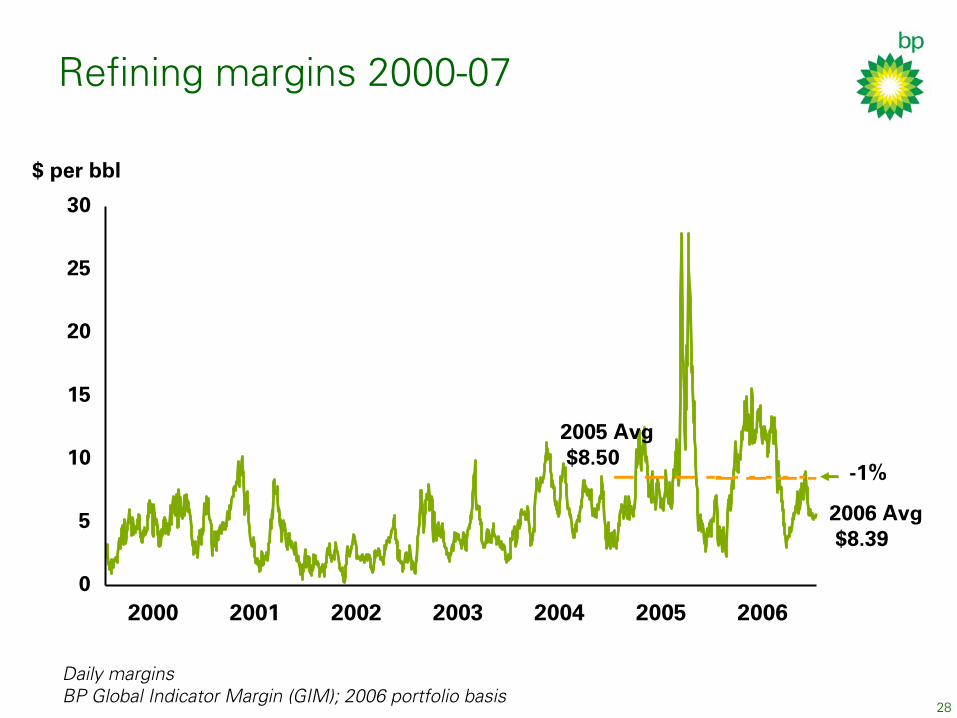
Refining margins 2000-07
-1%
2005 Avg$8.50
2006 Avg$8.39
20062005200420032002200120000
5
10
15
20
25
30
$ per bbl
Daily marginsBP Global Indicator Margin (GIM); 2006 portfolio basis
29
2007 priorities
•
Safety
− Personal safety Process safety Environment
−
−
•
Performance
30
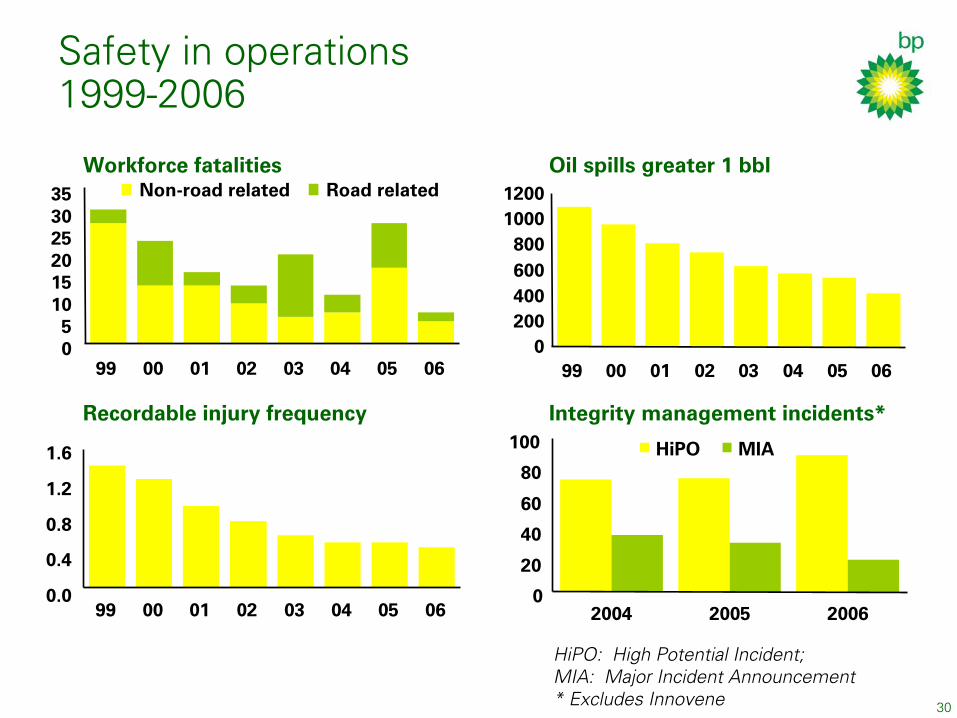
Safety in operations1999-2006
Workforce fatalities
05
101520253035
99 00 01 02 03 04 05 06
Non-road related Road related
Recordable injury frequency
0.0
0.4
0.8
1.2
1.6
99 00 01 02 03 04 05 06
Oil spills greater 1 bbl
0200400600800
10001200
99 00 01 02 03 04 05 06
Integrity management incidents*
0
20
40
60
80
100
2004 2005 2006
HiPO MIA
HiPO: High Potential Incident; MIA: Major Incident Announcement* Excludes Innovene
Focus on process safety
• Actions under way to improve integrity of plant and operations
− Implementing new standards Implementing new Operations Management System−
• Baker Panel recommendations accepted – provides further learning
Sustaining level of integrity management spending• − Around $1bn increase over 2006
31
2007 priorities
• Safety
Performance• − Deliver upstream projects
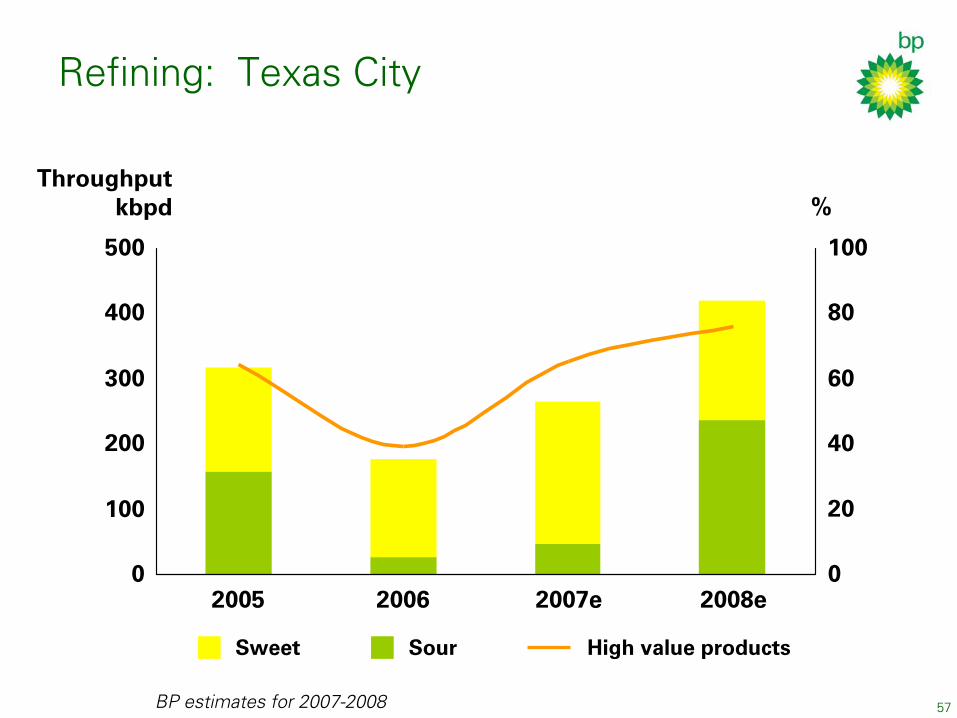
− Atlantis by end 2007 Thunder Horse by end 2008 − − Texas City
− Expected to be processing 400,000 bpd by end of 2007
32
Tony Hayward
Group Chief Executive Designate
34
Exploration & Access
Exploration•
KaskidaDeepwater Gulf of Mexico −
• Angola Titania and Urano−
• Uvat area
TNK-BP −
Access• Oman
PakistanIndia
Gulf of Mexico lease sale
•••
35
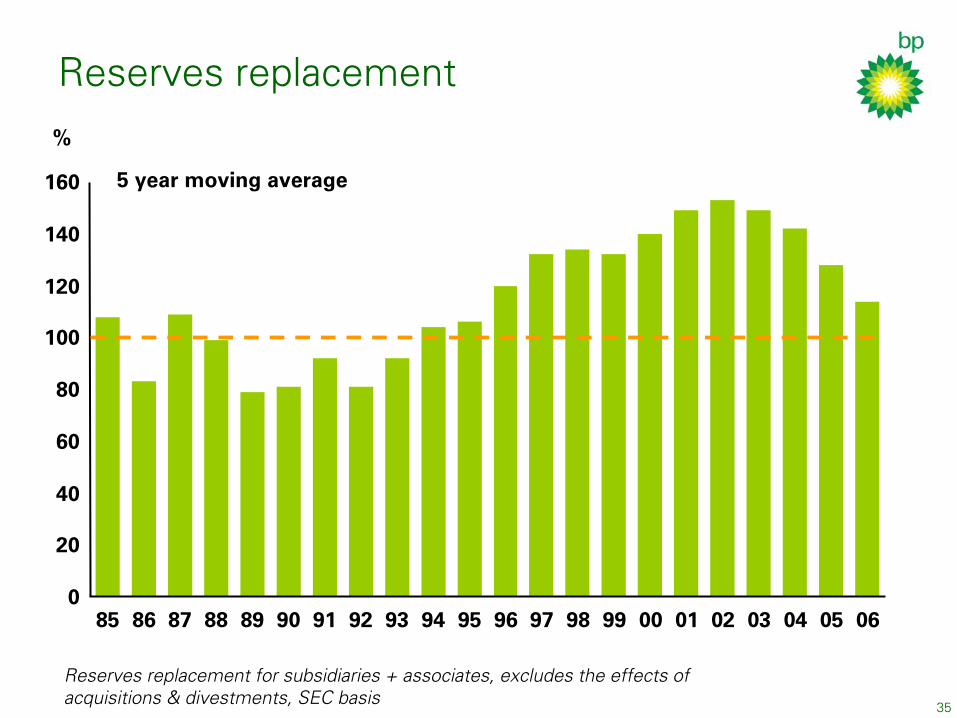
Reserves replacement
5 year moving average
0
20
40
60
80
100
120
140
160
85 86 87 88 89 90 91 92 93 94 95 96 97 98 99 00 01 02 03 04 05 06
%
Reserves replacement for subsidiaries + associates, excludes the effects of acquisitions & divestments, SEC basis
36
Major projects 2006 key start ups
• Azerbaijan BTC Pipeline / East Azeri−
•
In AmenasAlgeria−
•
CannonballTrinidad−
• Egypt
Temsah Redevelopment−
• Dalia
Angola−
37
Major projects 2007 key start ups
• Angola Greater Plutonio
Rosa Kizomba A Phase 2
−−−
•
Atlantis King Subsea
Gulf of Mexico−−
•
Red MangoTrinidad−
• North America Gas
San Juan Coal Bed Methane expansion−
38
Existing Profit Centres Alaska, North Sea, North America Gas, Latin America,
Egypt, Middle East
• Increased levels of downtime
Reduced operational efficiency Infill drilling activity slippage - tight supply chain
Production lower than forecast in Alaska and North Sea−−−
• Resource base strong - reservoirs performing as
expected
•
Other EPCs – strong performance − North America Gas
Pan American EnergyEgypt
−−
Bob Dudley
President and CEO TNK-BP
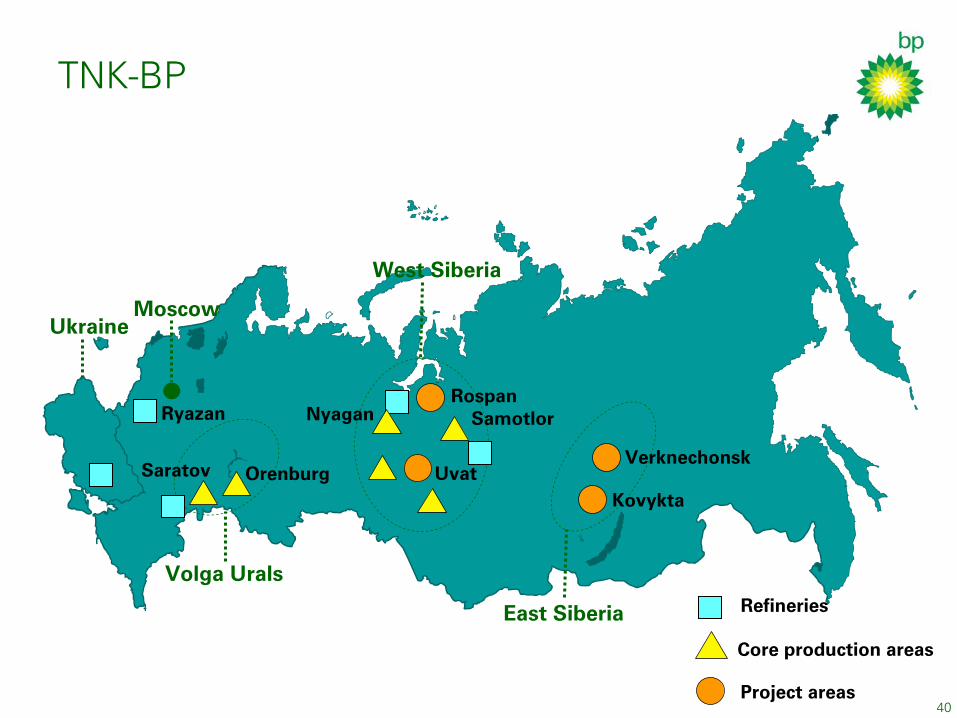
TNK-BP
40Project areas
Core production areas
Refineries
Volga Urals
West Siberia
Moscow
East Siberia
Samotlor
Saratov Orenburg
RospanNyagan
Kovykta
VerknechonskUvat
Ukraine
Ryazan

41
Strategy and performance highlights
The strategy remains unchanged
• Resources to Reserves to Production
Production growth of 30% since 2003
Licence extensions
New Resource Access of 5 Bn boe risked, 60% Exploration Success rate
−−−
• Margin Enhancement
$600m Ryazan Modernization, Increased Refining throughputs > 15%
Retail Expansion, TNK re-branding and BP Ultimate launch
Marketing business growth (Lubes, Bitumen)
−−−
• Gas
Associated Gas Utilization Programme
Foundation of major gas projects −−
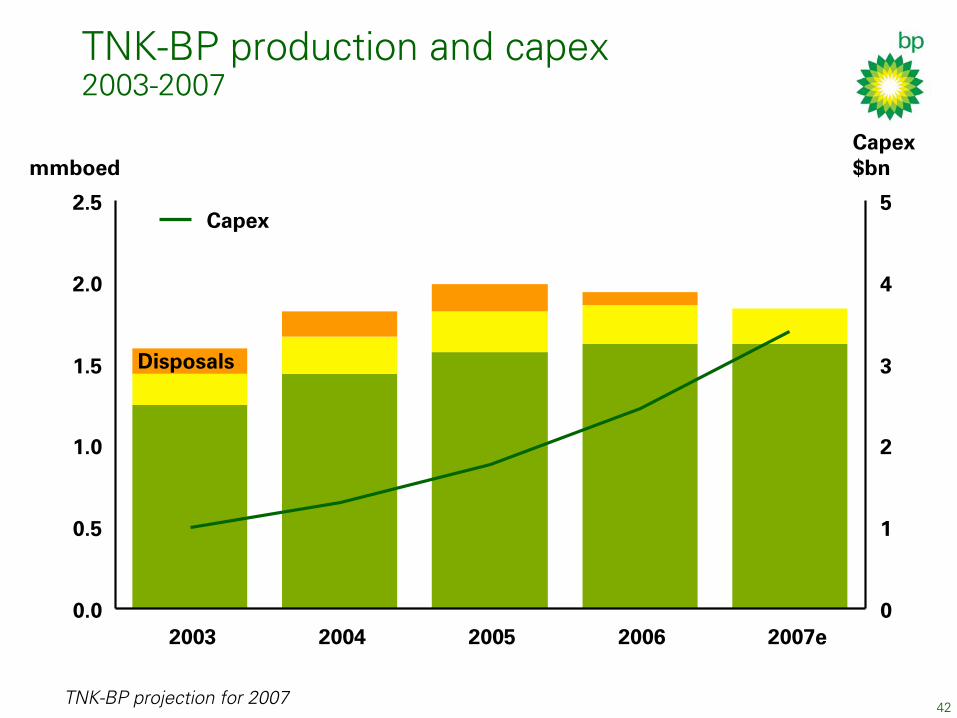
42
TNK-BP production and capex2003-2007
mmboedCapex $bn
Disposals
0.0
0.5
1.0
1.5
2.0
2.5
2003 2004 2005 2006 2007e0
1
2
3
4
5Capex
TNK-BP projection for 2007
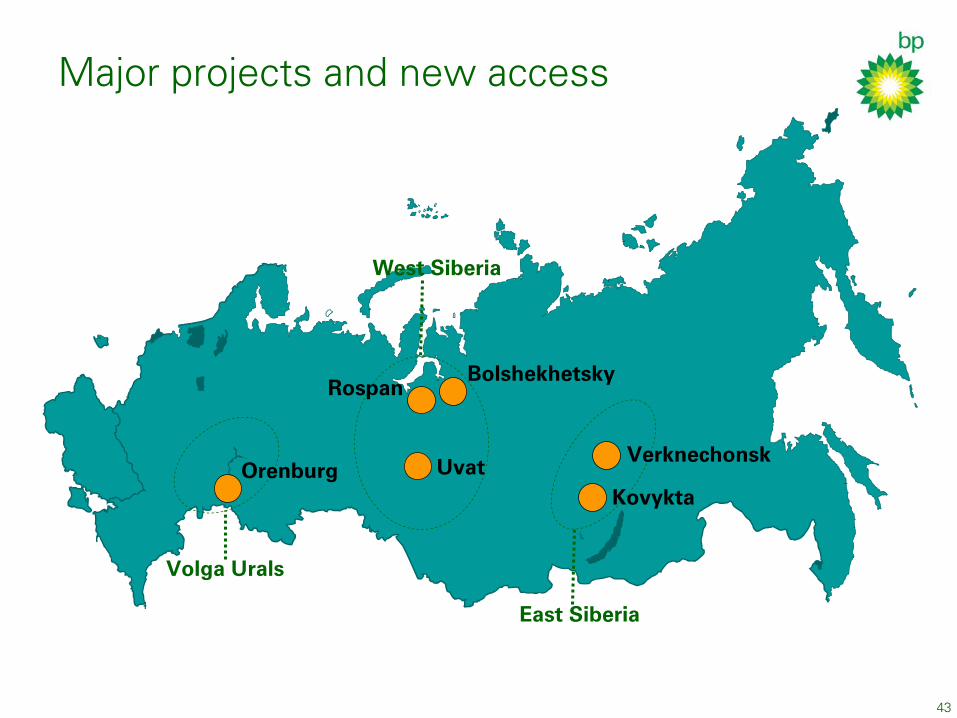
Major projects and new access
Volga Urals
West Siberia
East Siberia
Orenburg
Rospan
Kovykta
VerknechonskUvat
Bolshekhetsky
43
44
Underpinning the future
•
The four promises made in February 2003:
− Production Growth Technology Transfer Corporate Governance Good Corporate Citizen of Russia
−
−
− • Organisational Capability – building a world-class
company

Tony Hayward
Group Chief Executive Designate
46
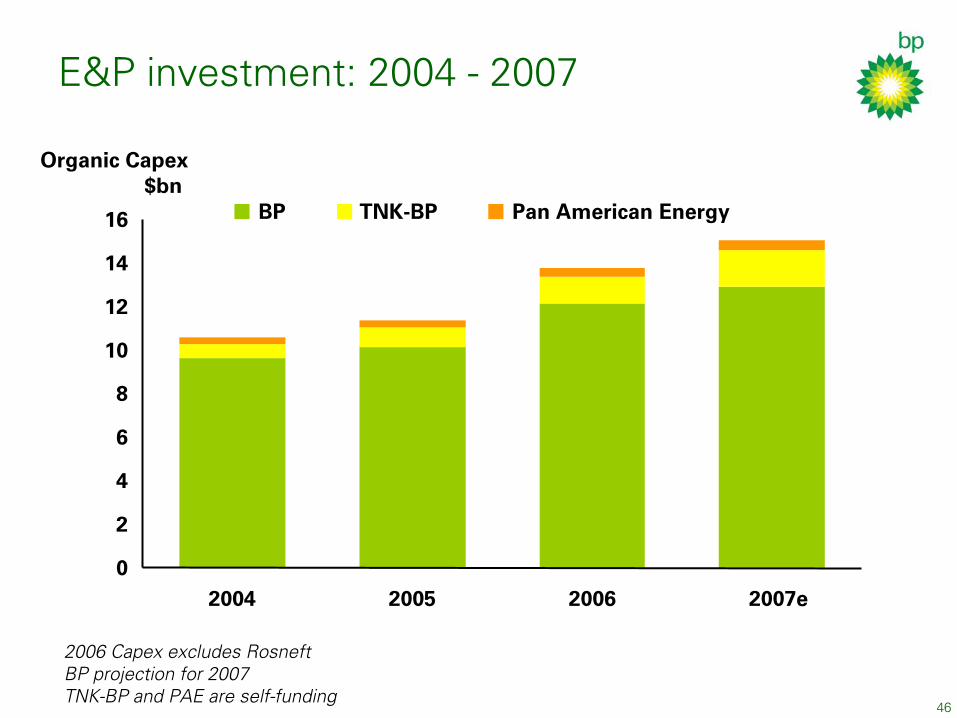
E&P investment: 2004 - 2007
0
2
4
6
8
10
12
14
16
2004 2005 2006 2007e
Organic Capex$bn
BP TNK-BP Pan American Energy
2006 Capex excludes RosneftBP projection for 2007TNK-BP and PAE are self-funding

47
Margin pressures
• Inflationary pressure on operating costs partly mitigated by
− Supply chain management Focussing activity on the most material opportunities−
• Government take increasing
Rising depreciation per barrel
•
48
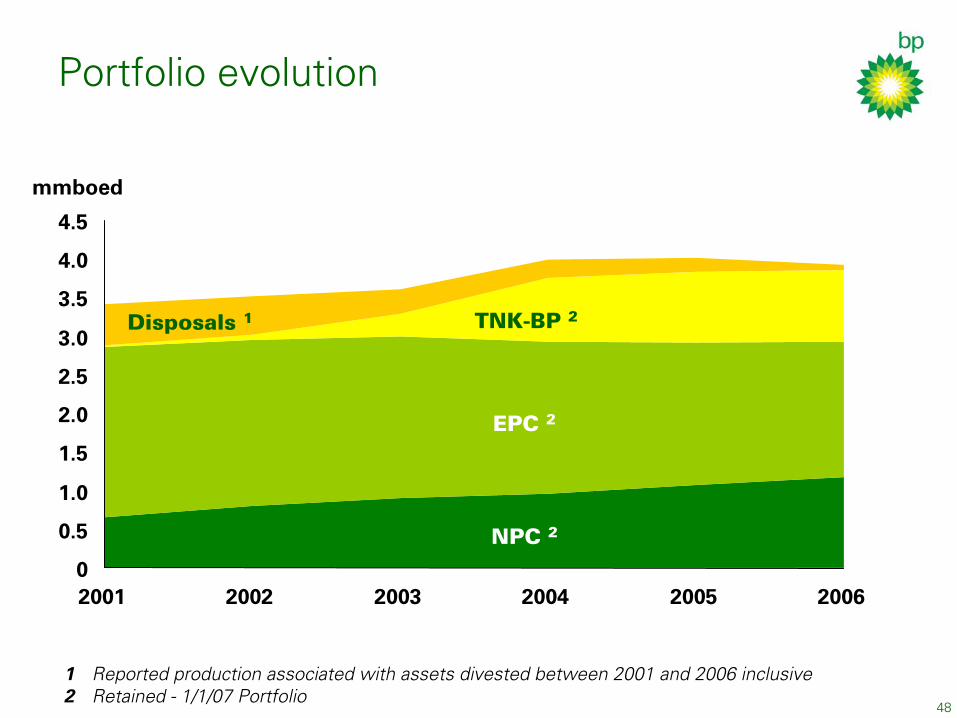
Portfolio evolution
mmboed
EPC 2
NPC 2
TNK-BP 2Disposals 1
0
0.5
1.0
1.5
2.0
2.5
3.0
3.5
4.0
4.5
2001 2002 2003 2004 2005 2006
1 Reported production associated with assets divested between 2001 and 2006 inclusiveRetained - 1/1/07 Portfolio
2
49
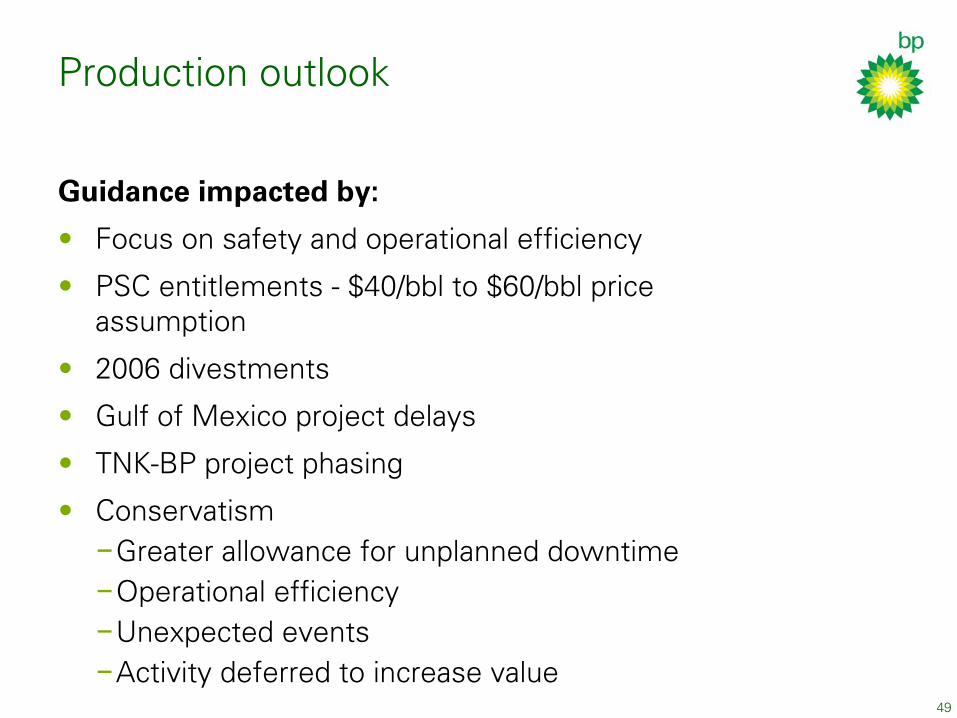
Production outlook
Guidance impacted by:
• Focus on safety and operational efficiency PSC entitlements - $40/bbl to $60/bbl price assumption
2006 divestments Gulf of Mexico project delays TNK-BP project phasing Conservatism
•
•
•
•
• Greater allowance for unplanned downtime
Operational efficiencyUnexpected eventsActivity deferred to increase value
−−−−
50
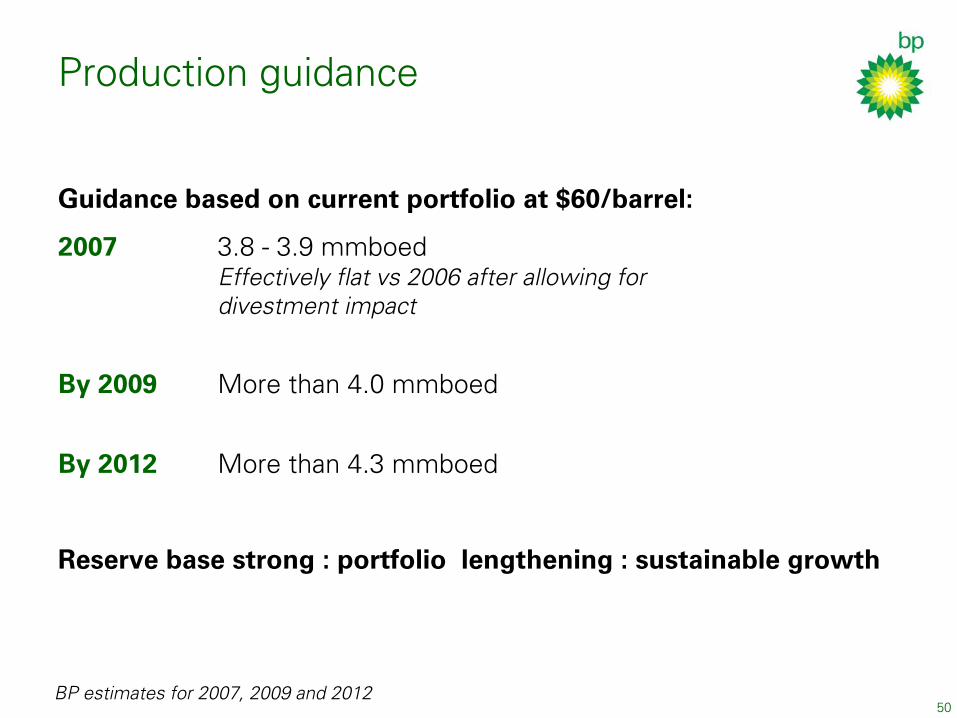
Production guidance
Guidance based on current portfolio at $60/barrel:
2007 3.8 - 3.9 mmboed Effectively flat vs 2006 after allowing for
divestment impact
By 2009 More than 4.0 mmboed
By 2012 More than 4.3 mmboed
Reserve base strong : portfolio lengthening : sustainable growth
BP estimates for 2007, 2009 and 2012
51
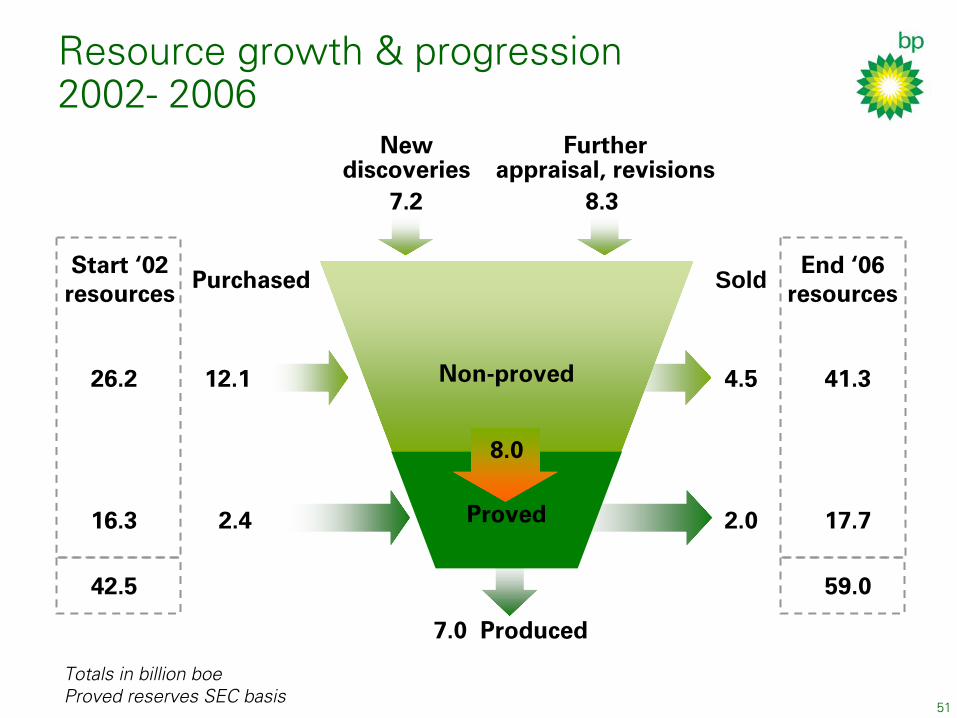
Resource growth & progression 2002- 2006
Non-proved
Proved
12.1
New
discoveries
2.4
7.0 Produced
8.37.2
Further
appraisal, revisions
PurchasedStart ‘02
resources
26.2
16.3
42.5
Sold
4.5
2.0
End ‘06 resources
41.3
17.7
59.0
8.0
Totals in billion boeProved reserves SEC basis
52
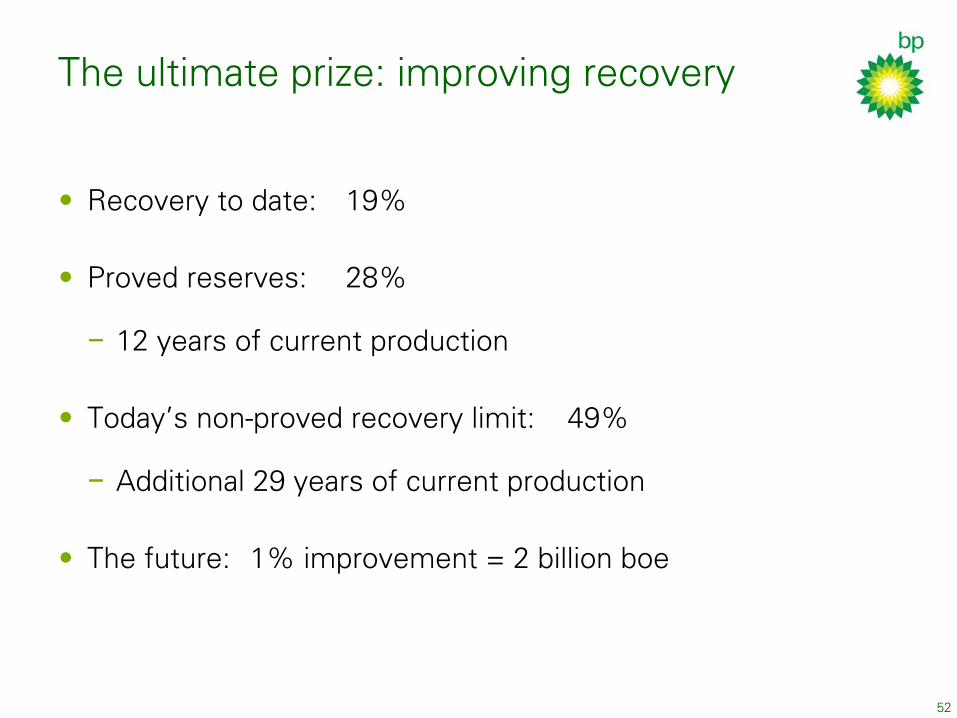
The ultimate prize: improving recovery
• Recovery to date: 19%
Proved reserves: 28%•
−
12 years of current production
•
Today’s non-proved recovery limit: 49%
−
Additional 29 years of current production
•
The future: 1% improvement = 2 billion boe
53
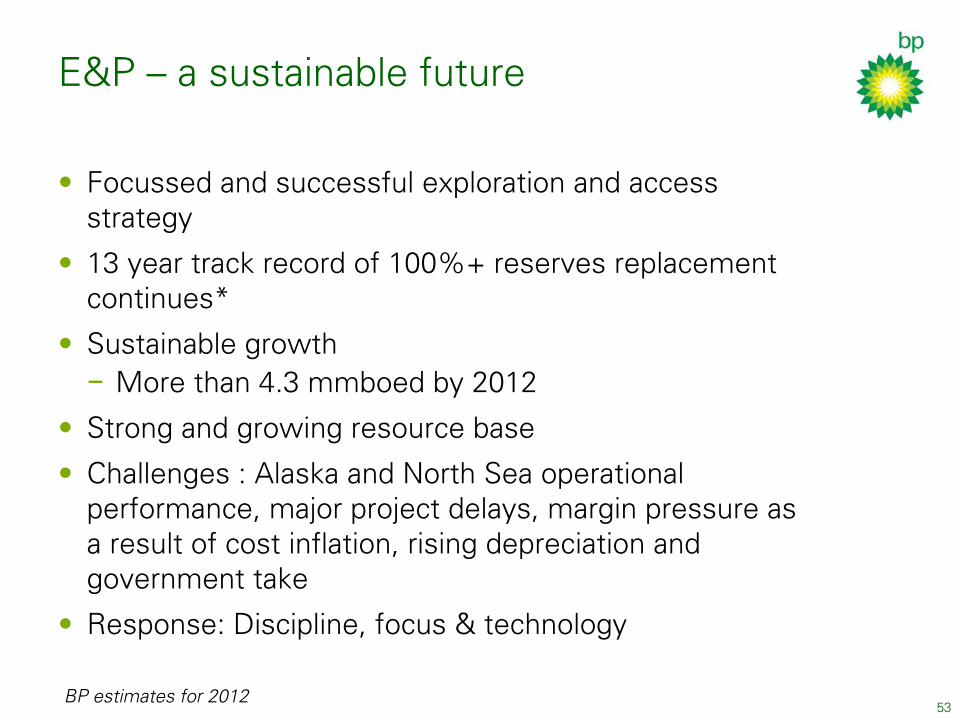
E&P – a sustainable future
• Focussed and successful exploration and access strategy
13 year track record of 100%+ reserves replacement continues*
Sustainable growth
•
• More than 4.3 mmboed by 2012−
• Strong and growing resource base Challenges : Alaska and North Sea operational performance, major project delays, margin pressure as
a result of cost inflation, rising depreciation and government take
Response: Discipline, focus & technology
•
• * SEC basis, 5 year moving average
BP estimates for 2012

John Manzoni
Chief Executive, Refining & Marketing
55
R&M: Key messages
• Focus on safety and integrity
Improvement from 2006
Disciplined execution of strategy
•
•

56
Baker Panel
• Implement panel recommendations
Recommendations in line with actions already underway; more to do
BP committed to becoming an industry leader in process safety
Integrity spend in US refineries increased from $1.2bn (2005) to $1.7bn per year (2007-10)
•
•
•
BP estimates for 2007-2010
57
Refining: Texas City
Throughputkbpd %
0
100
200
300
400
500
2005 2006 2007e 2008e0
20
40
60
80
100
Sweet Sour High value products
BP estimates for 2007-2008
58
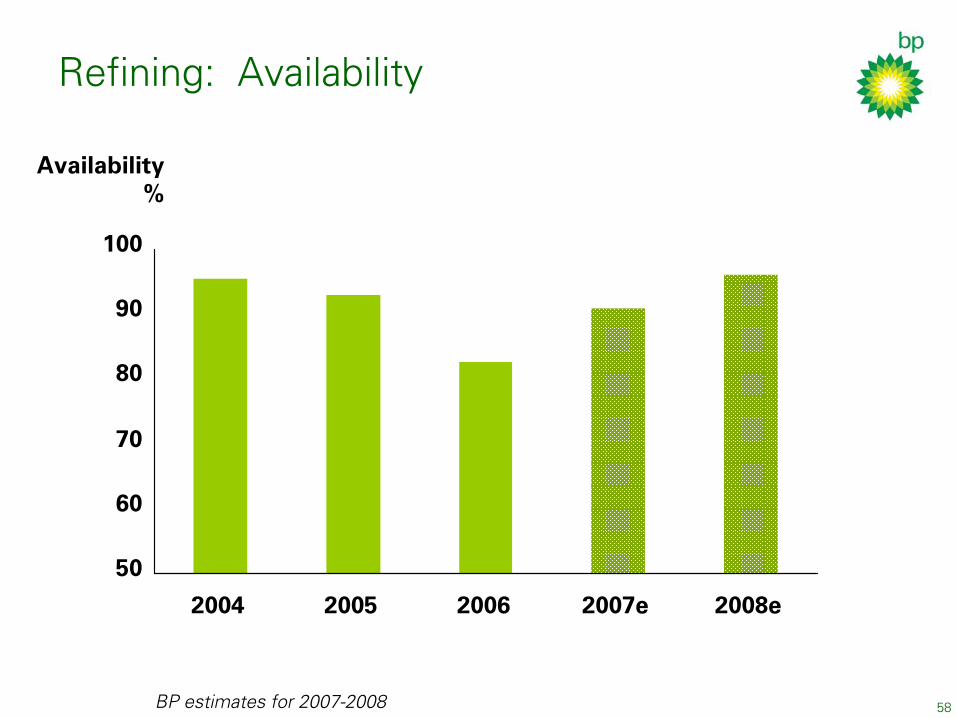
Refining: Availability
Availability%
50
60
70
80
90
100
2004 2005 2006 2007e 2008e
BP estimates for 2007-2008
59
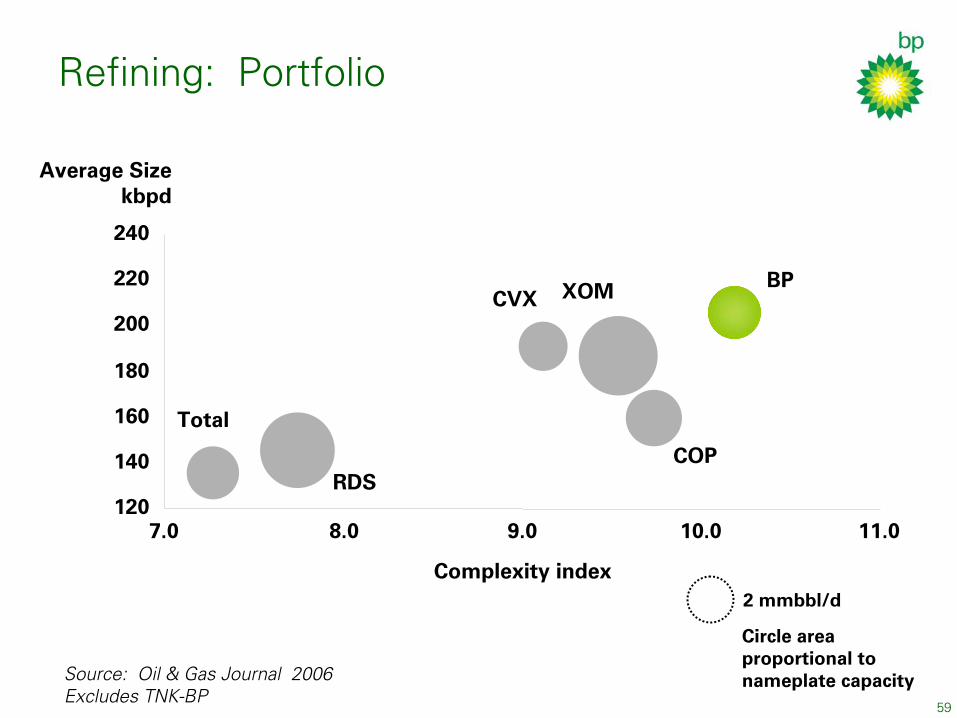
Circle area proportional to nameplate capacity
2 mmbbl/d
Refining: Portfolio
Average Size kbpd
Complexity index
CVX
RDS
XOM
COP
Total
BP
120
140
160
180
200
220
240
7.0 8.0 9.0 10.0 11.0
Source: Oil & Gas Journal 2006Excludes TNK-BP
60
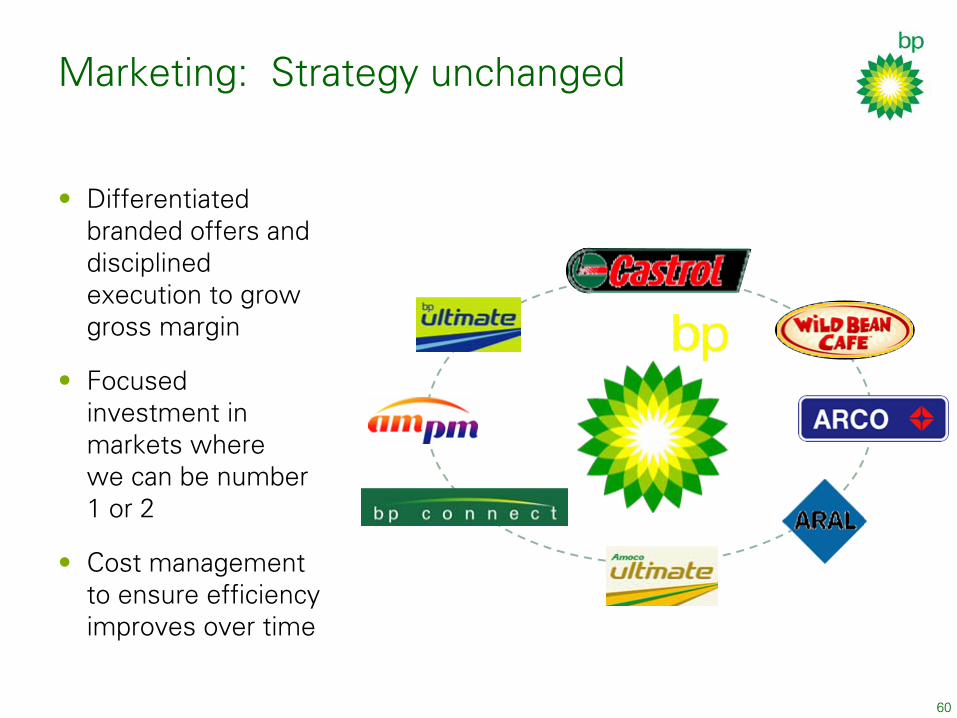
Marketing: Strategy unchanged
Differentiated branded offers and
disciplined execution to grow gross margin
Focused investment in
markets where we can be number 1 or 2
Cost management to ensure efficiency
improves over time
•
•
•
61
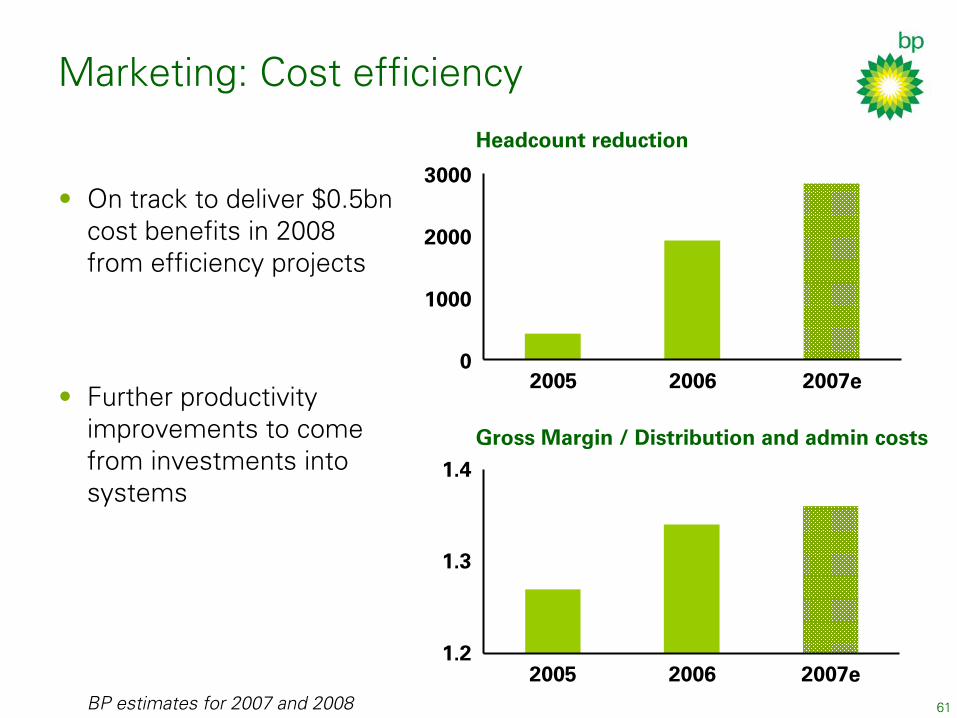
Marketing: Cost efficiency
• On track to deliver $0.5bn cost benefits in 2008
from efficiency projects
Further productivity improvements to come
from investments into systems
•
Headcount reduction
0
1000
2000
3000
2005 2006 2007e
Gross Margin / Distribution and admin costs
1.2
1.3
1.4
2005 2006 2007eBP estimates for 2007 and 2008
62
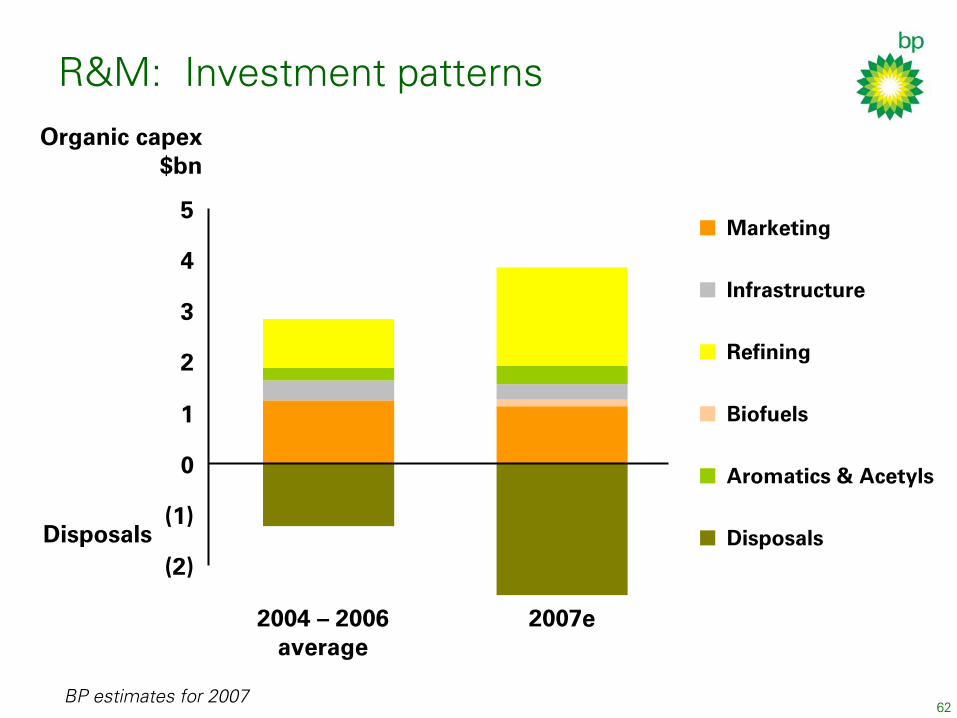
R&M: Investment patternsOrganic capex
$bn
Disposals
2004 –
2006
average
(2)
(1)
0
1
2
3
4
5Marketing
Biofuels
Infrastructure
Aromatics & Acetyls
Refining
Disposals
2007e
BP estimates for 2007

63
R&M: Key messages
• Focus on safety and integrity
Improvement from 2006
Disciplined execution of strategy
•
•

John Browne
Group Chief Executive
65
Gas, Power & Renewables
• Gas remains an important part of the portfolio
Growing LNG marketing and trading business
Second largest gas producers among IOCs
World’s largest marketer and trader among IOCs
Wind capacity 450 MW by end 2007
Solar capacity 300 MW by end 2007
•
•
•
•
•
BP estimates for 2007
66
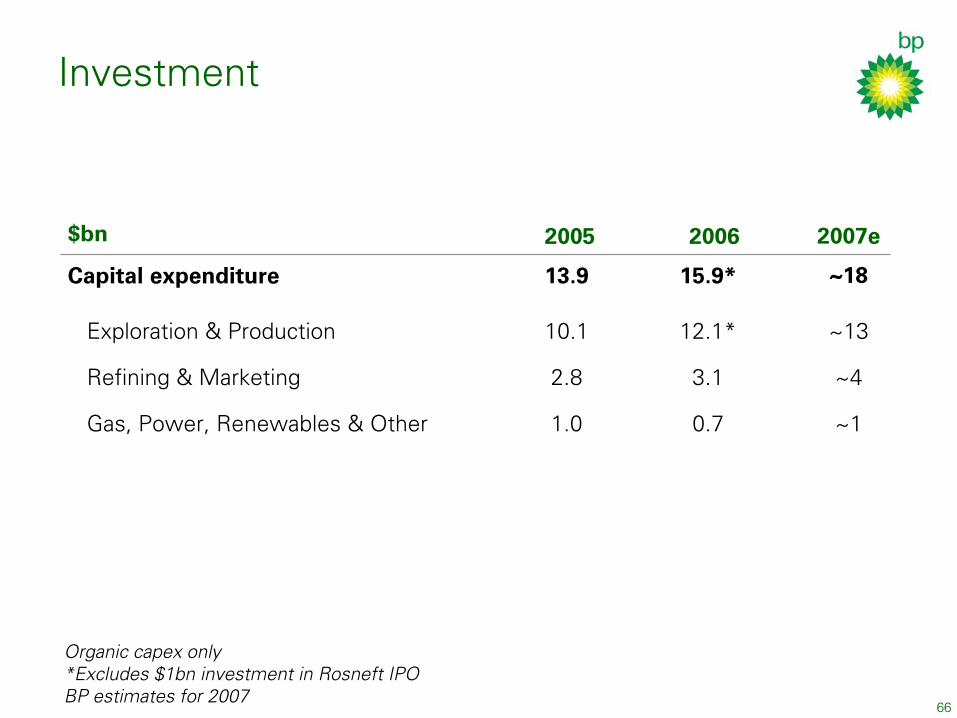
Investment
$bn 2005 2006 2007e
Capital expenditure 13.9 15.9* ~18
Exploration & Production 10.1 12.1* ~13
Refining & Marketing 2.8 3.1 ~4
Gas, Power, Renewables & Other 1.0 0.7 ~1
Organic capex only*Excludes $1bn investment in Rosneft IPOBP estimates for 2007
67
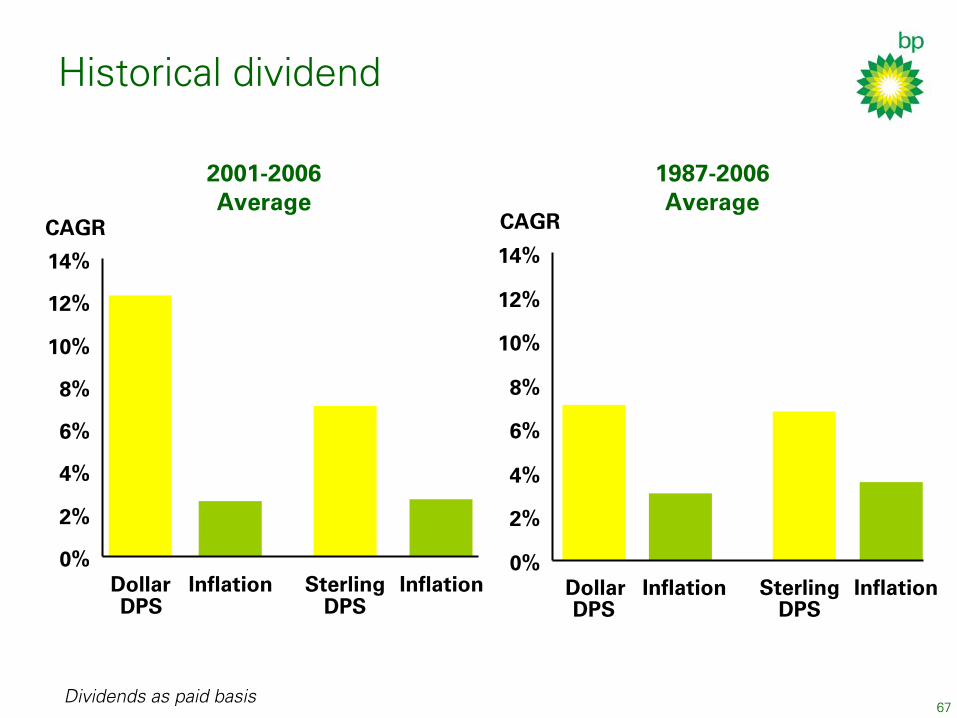
Historical dividend
2001-2006Average
0%
2%
4%
6%
8%
10%
12%
14%
DollarDPS
Inflation SterlingDPS
Inflation
CAGR
1987-2006Average
0%
2%
4%
6%
8%
10%
12%
14%
DollarDPS
Inflation SterlingDPS
Inflation
CAGR
Dividends as paid basis
68
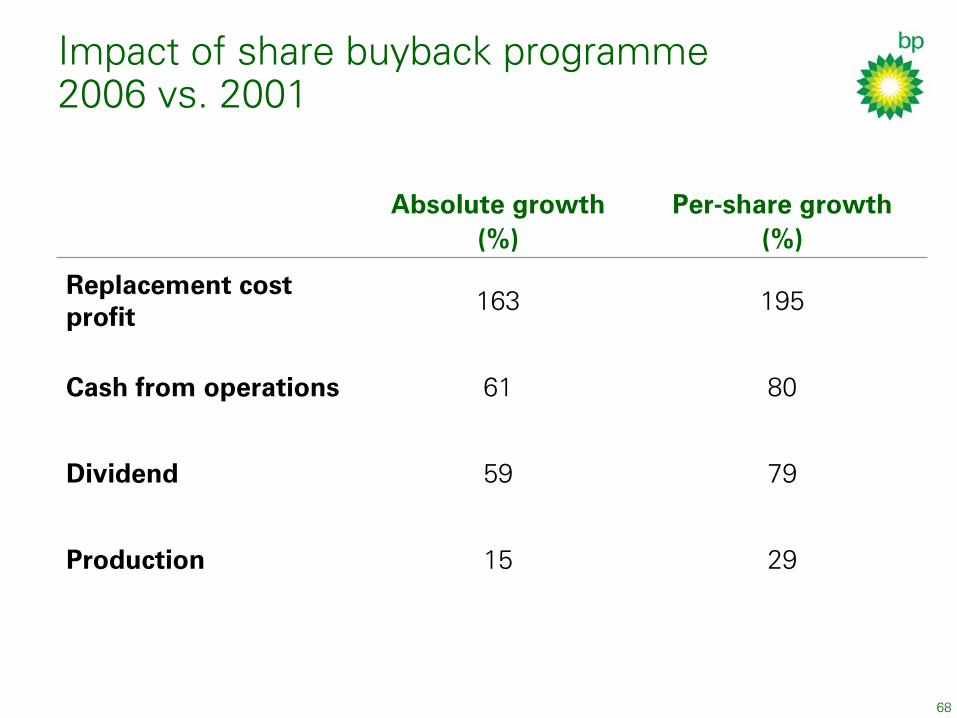
Impact of share buyback programme2006 vs. 2001
Absolute growth Per-share growth(%) (%)
Replacement cost 163 195profit
Cash from operations 61 80
Dividend 59 79
Production 15 29
69
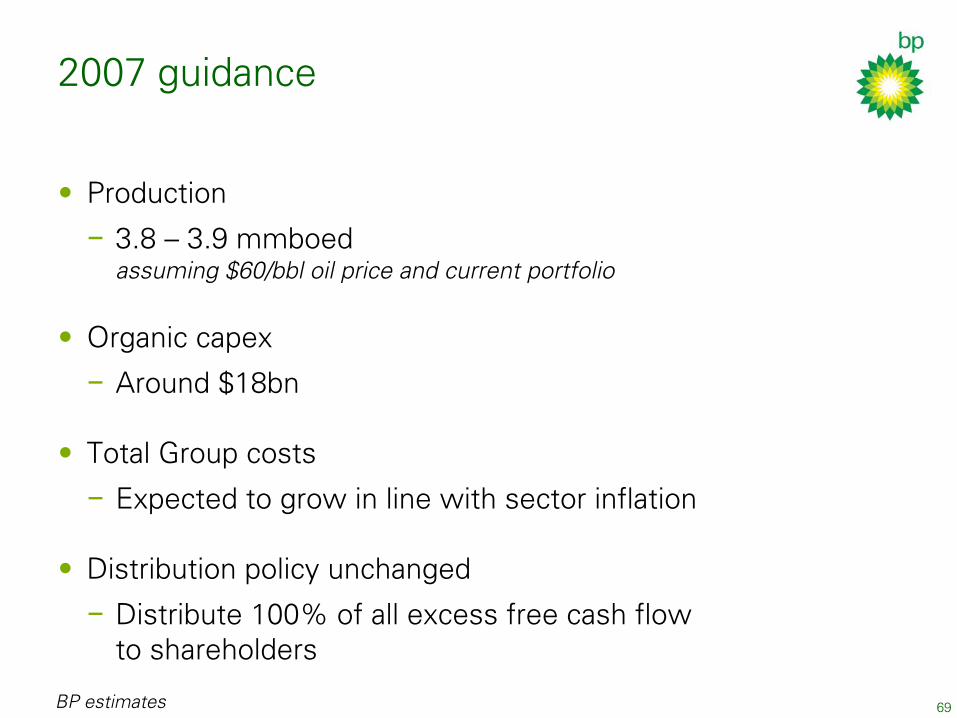
2007 guidance
• Production 3.8 – 3.9 mmboed
assuming $60/ bbl oil price and current portfolio−
• Around $18bn
Organic capex
−
•
Total Group costs
−
Expected to grow in line with sector inflation
•
Distribution policy unchanged
− Distribute 100% of all excess free cash flow to shareholders
BP estimates
70
Summary
• Priorities: safety and performance
High-quality asset base
Acting on lessons learned from 2005-06
Robust and unchanged financial framework
•
•
•
71
Questions & answers
LONDON
John BrowneGroup Chief Executive Byron GroteChief Financial Officer Tony Hayward
Group Chief Executive Designate
Bob DudleyChief Exec utive Officer TNK-BP
John ManzoniChief Executive R&M Vivienne CoxChief Executive GP&R
NEW YORK
Bob Malone Chairman & President, BP America Inc.
David Allen Group Managing Director & Chief of Staff
Iain Conn Group Managing Director
Andy InglisChief Executive E&P