Embed Size (px)
Citation preview
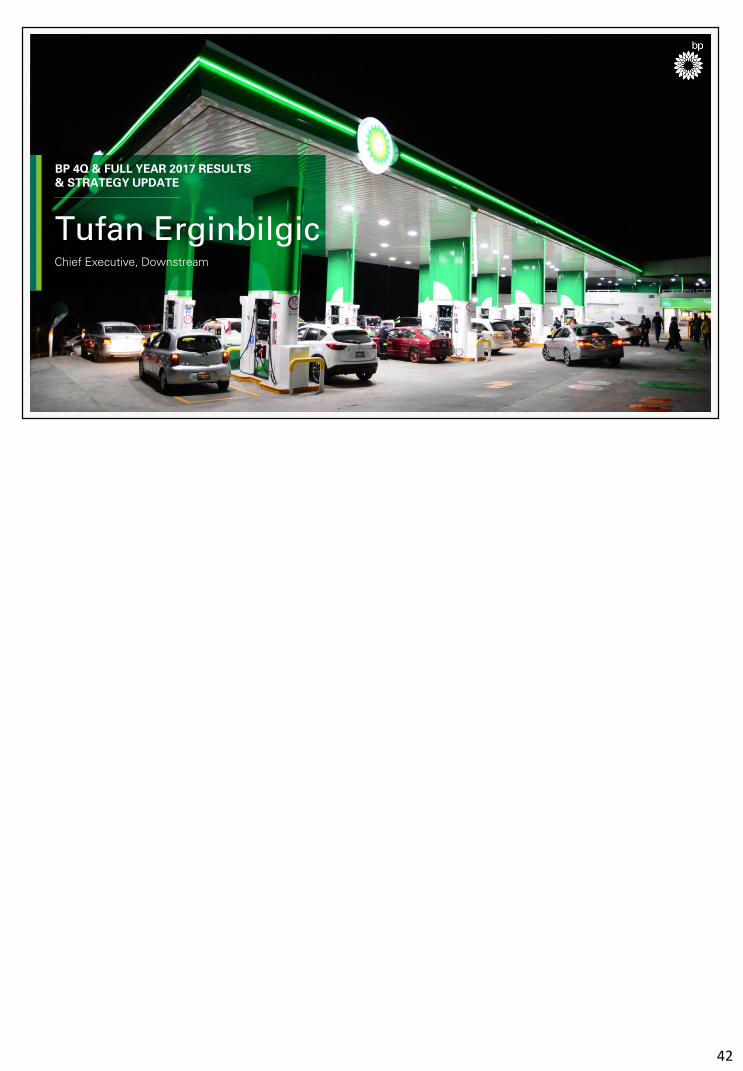
BP 4Q 2017 RESULTS 42BP 4Q & FULL YEAR 2017 RESULTS & STRATEGY UPDATE 42
BP 4Q & FULL YEAR 2017 RESULTS & STRATEGY UPDATE
Chief Executive, Downstream
Tufan Erginbilgic
42
BP 4Q 2017 RESULTS 43BP 4Q & FULL YEAR 2017 RESULTS & STRATEGY UPDATE 43
Downstream strategy
STRATEGIC PRIORITIESSAFETY
core value#1
$9-10bn ~20%>$3bn
underlyingearnings1 growthby 2016-21
free cash flow2 in2021
pre-taxreturns2
in 2021
KEY METRICS
LOWER CARBON AND DIGITALLY ENABLED FUTURE
PROFITABLE MARKETING GROWTH
ADVANTAGEDMANUFACTURING
EFFICIENCY AND SIMPLIFICATION
(1) Incremental underlying RCPBIT 2016-21, adjusted for refining and petrochemicals environment, forex, turnaround and portfolio impacts(2) Free cash flow proxy (FCF) = underlying RCPBIT+DD&A–organic capital expenditure. 2021 FCF and returns at $14/bbl RMM, $15/bbl WTI-WCS crude differential and
Brent $55/bbl 2017 real
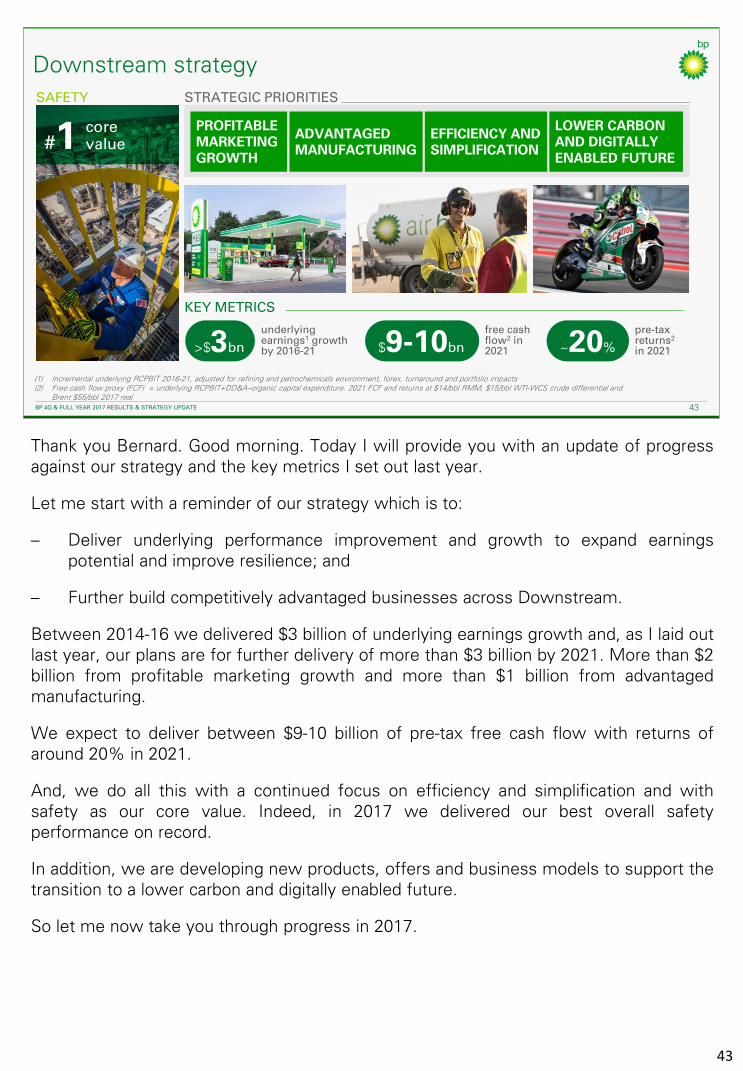
Thank you Bernard. Good morning. Today I will provide you with an update of progressagainst our strategy and the key metrics I set out last year.
Let me start with a reminder of our strategy which is to:
– Deliver underlying performance improvement and growth to expand earningspotential and improve resilience; and
– Further build competitively advantaged businesses across Downstream.
Between 2014-16 we delivered $3 billion of underlying earnings growth and, as I laid outlast year, our plans are for further delivery of more than $3 billion by 2021. More than $2billion from profitable marketing growth and more than $1 billion from advantagedmanufacturing.
We expect to deliver between $9-10 billion of pre-tax free cash flow with returns ofaround 20% in 2021.
And, we do all this with a continued focus on efficiency and simplification and withsafety as our core value. Indeed, in 2017 we delivered our best overall safetyperformance on record.
In addition, we are developing new products, offers and business models to support thetransition to a lower carbon and digitally enabled future.
So let me now take you through progress in 2017.
43
BP 4Q 2017 RESULTS 44BP 4Q & FULL YEAR 2017 RESULTS & STRATEGY UPDATE 44
Execution of strategy continues to deliver results
Pre-tax earnings1
$bnContinued underlying earnings3 growth
$bn
2
4
6
8
2014 Environment WTI-WCS Underlyinggrowth
2017
0.7 2017
3.0 delivered 2014-16 7.0
4.4
2
3.7
(1) Underlying RCPBIT (2) Includes refining marker margin, other local margin drivers (excluding WTI-WCS differential), petrochemicals environment, forex, turnaround and portfolio impacts(3) Adjusting for refining and petrochemicals environment, foreign exchange, turnaround and portfolio impacts
0
2
4
6
3.0
3.7
Marketing
Manufacturing2014-16 2014-17 2014-21
Supply & trading and other
>3.02016-211.0
3.0 delivered 2014-16
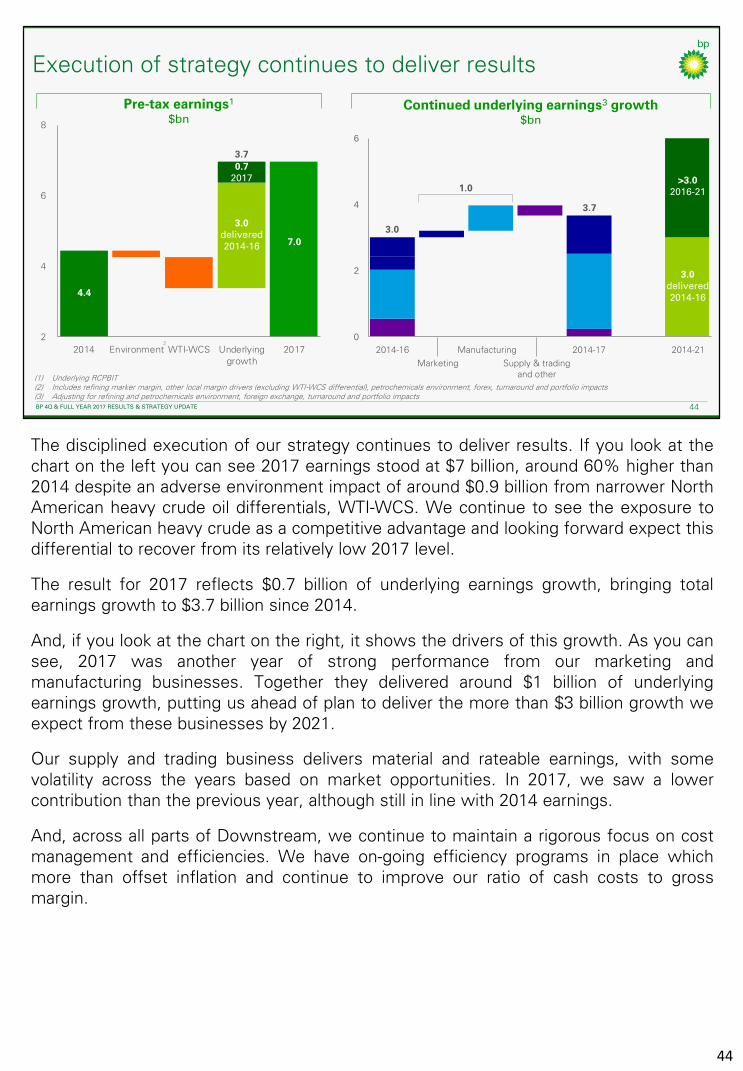
The disciplined execution of our strategy continues to deliver results. If you look at thechart on the left you can see 2017 earnings stood at $7 billion, around 60% higher than2014 despite an adverse environment impact of around $0.9 billion from narrower NorthAmerican heavy crude oil differentials, WTI-WCS. We continue to see the exposure toNorth American heavy crude as a competitive advantage and looking forward expect thisdifferential to recover from its relatively low 2017 level.
The result for 2017 reflects $0.7 billion of underlying earnings growth, bringing totalearnings growth to $3.7 billion since 2014.
And, if you look at the chart on the right, it shows the drivers of this growth. As you cansee, 2017 was another year of strong performance from our marketing andmanufacturing businesses. Together they delivered around $1 billion of underlyingearnings growth, putting us ahead of plan to deliver the more than $3 billion growth weexpect from these businesses by 2021.
Our supply and trading business delivers material and rateable earnings, with somevolatility across the years based on market opportunities. In 2017, we saw a lowercontribution than the previous year, although still in line with 2014 earnings.
And, across all parts of Downstream, we continue to maintain a rigorous focus on costmanagement and efficiencies. We have on-going efficiency programs in place whichmore than offset inflation and continue to improve our ratio of cash costs to grossmargin.
44
BP 4Q 2017 RESULTS 45BP 4Q & FULL YEAR 2017 RESULTS & STRATEGY UPDATE 45(1) Underlying RCPBIT at 2017 foreign exchange environment
Marketing – material and growing
in lubricants premium volumes and key growth countries earnings
$2.4bn
premium fuel volumes growth since Active fuels launch
20%
fuels marketingearnings
>10% growth vs 2016
sites opened in Mexico
>130
BP retail siteswith convenience partnerships
1,100
$1.5bnlubricants earnings
growth
Continued
0
2
4
6
2014 2015 2016 2017 2021
Fuels Marketing Lubricants
Pre-tax earnings1
$bn
3.9
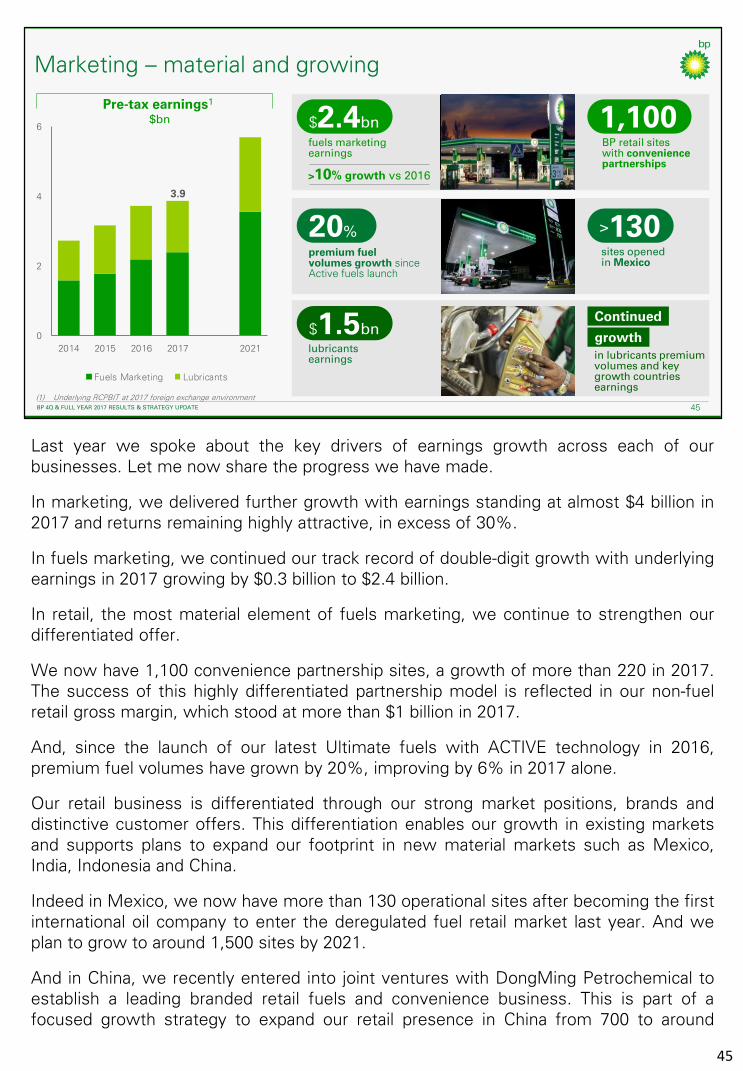
Last year we spoke about the key drivers of earnings growth across each of ourbusinesses. Let me now share the progress we have made.
In marketing, we delivered further growth with earnings standing at almost $4 billion in2017 and returns remaining highly attractive, in excess of 30%.
In fuels marketing, we continued our track record of double-digit growth with underlyingearnings in 2017 growing by $0.3 billion to $2.4 billion.
In retail, the most material element of fuels marketing, we continue to strengthen ourdifferentiated offer.
We now have 1,100 convenience partnership sites, a growth of more than 220 in 2017.The success of this highly differentiated partnership model is reflected in our non-fuelretail gross margin, which stood at more than $1 billion in 2017.
And, since the launch of our latest Ultimate fuels with ACTIVE technology in 2016,premium fuel volumes have grown by 20%, improving by 6% in 2017 alone.
Our retail business is differentiated through our strong market positions, brands anddistinctive customer offers. This differentiation enables our growth in existing marketsand supports plans to expand our footprint in new material markets such as Mexico,India, Indonesia and China.
Indeed in Mexico, we now have more than 130 operational sites after becoming the firstinternational oil company to enter the deregulated fuel retail market last year. And weplan to grow to around 1,500 sites by 2021.
And in China, we recently entered into joint ventures with DongMing Petrochemical toestablish a leading branded retail fuels and convenience business. This is part of afocused growth strategy to expand our retail presence in China from 700 to around
45
2,500 sites.
We also continue to grow our B2B fuels and Air BP businesses. In ourglobal Air BP business, which has strong market positions and goodexposure to growth markets, earnings grew by 5% in the year.
Our Lubricants business is also differentiated; it has some of the strongestbrands in the industry and has a brand presence in around 120 countries. In2017, we delivered earnings of $1.5 billion with highly competitive returnon sales of more than 20%.
Our Lubricants business has good exposure to growth markets and thegrowing premium segment, which delivered continued underlying earningsgrowth in 2017, although offset by the adverse lag impacts of increasingbase oil prices.
Indeed, premium lubricants volumes grew to 44%, more than apercentage point increase versus 2016. And in the fourth quarter we saw areturn to year-on-year earnings growth, with key growth markets earningsincreasing by 9%.
Through the strength of our BP Castrol brand we are also establishing aglobal partnership with Renault Nissan Alliance, the largest globalautomotive carmaker. In addition to the continuation of Renault Formula 1sponsorship and the supply of fuels and lubricants by BP the partnershipwill also include a strategic collaboration for advanced mobility solutions.
In addition, we renewed partnerships and supply arrangements with Ford,VW and Volvo. All of this further demonstrates the quality, sustainabilityand robustness of the growth opportunities in our lubricants business.
45
BP 4Q 2017 RESULTS 46BP 4Q & FULL YEAR 2017 RESULTS & STRATEGY UPDATE 46
2016-17 2016-21
Manufacturing – strong underlying earnings growth
Strong operationsUnderlying earnings growth1
$bn
now deployed at key PTA sites
refiningavailability and petrochemicals reliability
>95%
improvement in refining net cash margin3 vs. 2016
vs 37% in 2016
technology
Industry leading
reduction in petrochemicals cash breakeven4 2014-17
>40%
>15%43%
Strong operations
record levels ofadvantaged feedstock2
(1) Underlying RCPBIT at constant refining & petrochemicals environment, normalised turnaround and portfolio impacts (2) Advantaged feedstocks processed as a percentage of throughput. BP operated refineries. 2017 portfolio basis (3) Net cash margin per barrel = Gross product value less raw material costs and operating expenditure. At 2016 price set, 2017 portfolio basis and constant $15/bbl WTI-WCS crude differential(4) Breakeven cash contribution margin based on BP estimates ($/tonne)
Petrochemicals
Refining
~0.8
>1.0
Manufacturing
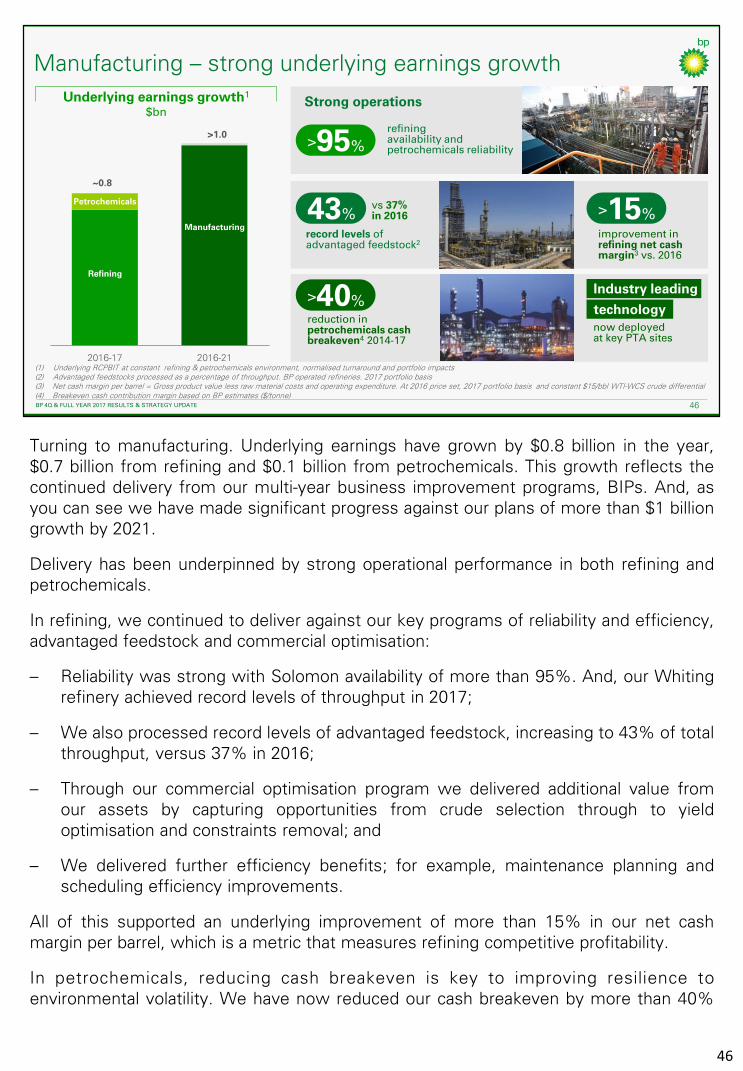
Turning to manufacturing. Underlying earnings have grown by $0.8 billion in the year,$0.7 billion from refining and $0.1 billion from petrochemicals. This growth reflects thecontinued delivery from our multi-year business improvement programs, BIPs. And, asyou can see we have made significant progress against our plans of more than $1 billiongrowth by 2021.
Delivery has been underpinned by strong operational performance in both refining andpetrochemicals.
In refining, we continued to deliver against our key programs of reliability and efficiency,advantaged feedstock and commercial optimisation:
– Reliability was strong with Solomon availability of more than 95%. And, our Whitingrefinery achieved record levels of throughput in 2017;
– We also processed record levels of advantaged feedstock, increasing to 43% of totalthroughput, versus 37% in 2016;
– Through our commercial optimisation program we delivered additional value fromour assets by capturing opportunities from crude selection through to yieldoptimisation and constraints removal; and
– We delivered further efficiency benefits; for example, maintenance planning andscheduling efficiency improvements.
All of this supported an underlying improvement of more than 15% in our net cashmargin per barrel, which is a metric that measures refining competitive profitability.
In petrochemicals, reducing cash breakeven is key to improving resilience toenvironmental volatility. We have now reduced our cash breakeven by more than 40%
46

versus 2014 through improved operational performance, industry leadingtechnology upgrades and efficiency gains. This improvement wascompleted a year ahead of the schedule that I previously shared with you.
This delivery of underlying earnings growth and double-digit returns inPetrochemicals positions us well to capture growth and investmentopportunities in an attractive and growing market.
46
BP 4Q 2017 RESULTS 47BP 4Q & FULL YEAR 2017 RESULTS & STRATEGY UPDATE 47
0
10
20
2014 2016 2017 2021
12.0 11.5
0
5
10
15
20
25
2014 20162017 2021
RMM to generate 15% pre-tax returns
Growing free cash flow1
$bnImproved resilience
refining marker margin $/bbl
Attractive pre-tax returns%
Cash flow growth, attractive returns, improving resilience
9-10
6-84
2006-16 RMM range3
9-10
Adjusted returns2
(1) Free cash flow proxy (FCF) = underlying RCPBIT + DD&A – organic capex; 2021 FCF at $14/bbl RMM , $15/bbl WTI-WCS crude differential and Brent $55/bbl 2017 real (2) Adjusted returns at $14/bbl RMM, $15/bbl WTI-WCS crude differential and Brent crude price of $55/bbl 2017 real (3) Excludes global financial crisis (2009 & 2010) (4) 2021 projection based on $15/bbl WTI-WCS crude differential and Brent $55/bbl 2017 real
1.1
0
5
10
2016 2017 2021
9-10~20
Reported returns
47
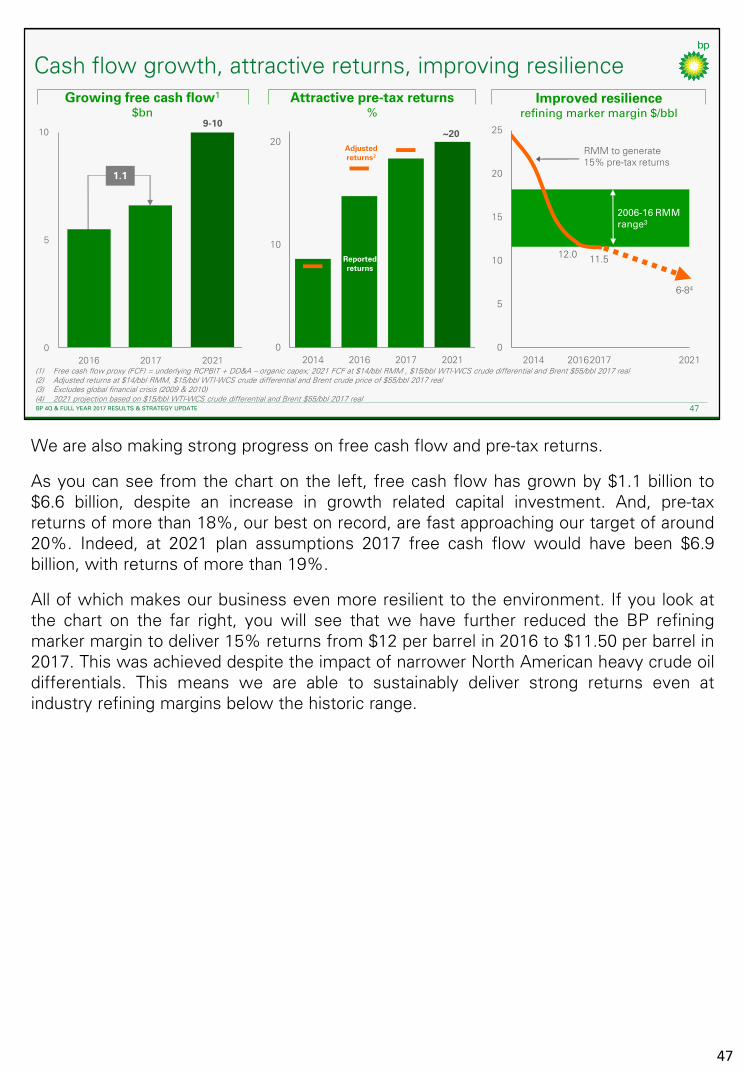
We are also making strong progress on free cash flow and pre-tax returns.
As you can see from the chart on the left, free cash flow has grown by $1.1 billion to$6.6 billion, despite an increase in growth related capital investment. And, pre-taxreturns of more than 18%, our best on record, are fast approaching our target of around20%. Indeed, at 2021 plan assumptions 2017 free cash flow would have been $6.9billion, with returns of more than 19%.
All of which makes our business even more resilient to the environment. If you look atthe chart on the far right, you will see that we have further reduced the BP refiningmarker margin to deliver 15% returns from $12 per barrel in 2016 to $11.50 per barrel in2017. This was achieved despite the impact of narrower North American heavy crude oildifferentials. This means we are able to sustainably deliver strong returns even atindustry refining margins below the historic range.
BP 4Q 2017 RESULTS 48BP 4Q & FULL YEAR 2017 RESULTS & STRATEGY UPDATE 48
Building on our strengths to create our future
Advanced mobility Bio and low carbon Digital
Electric, connected and autonomous vehicles
New fuels, gas, lubricants and plastics
Lead in digital innovation and consumer differentiation
FreewireMobile EV charging investment
Electric vehiclesNew forecourt chargers
Castrol OptigearCarbon-neutral lubricants for wind turbines
Fulcrum BioenergyBiojet from municipal solid waste
Data-enabledBusiness
New business models and ecosystems
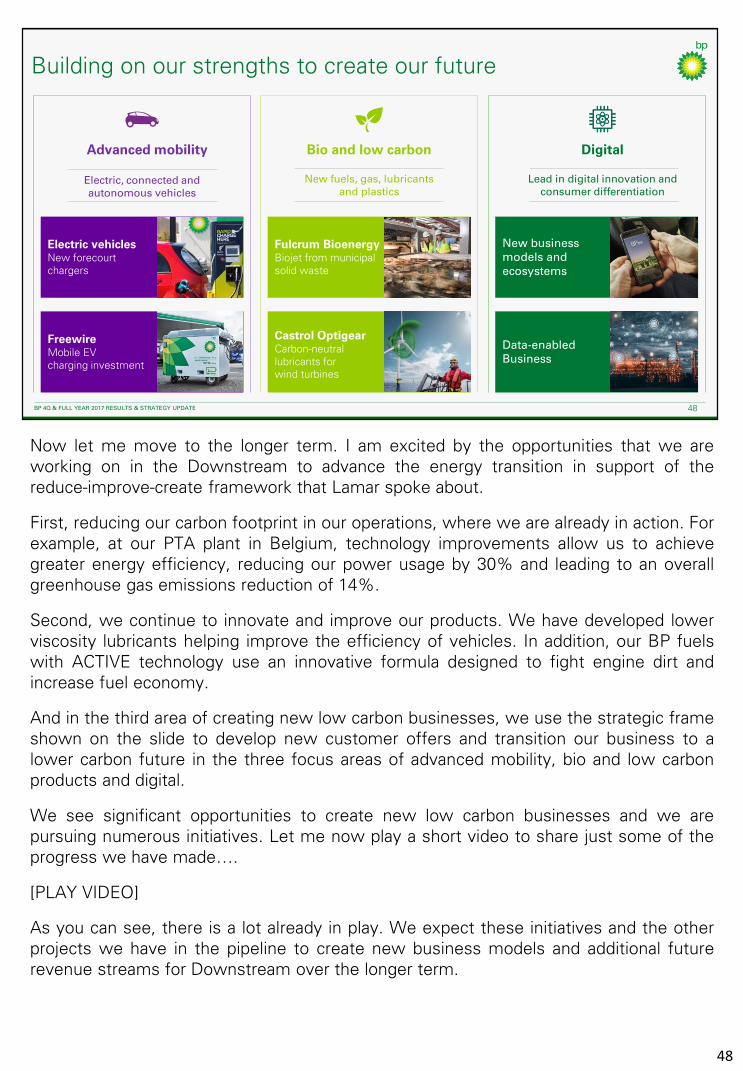
Now let me move to the longer term. I am excited by the opportunities that we areworking on in the Downstream to advance the energy transition in support of thereduce-improve-create framework that Lamar spoke about.
First, reducing our carbon footprint in our operations, where we are already in action. Forexample, at our PTA plant in Belgium, technology improvements allow us to achievegreater energy efficiency, reducing our power usage by 30% and leading to an overallgreenhouse gas emissions reduction of 14%.
Second, we continue to innovate and improve our products. We have developed lowerviscosity lubricants helping improve the efficiency of vehicles. In addition, our BP fuelswith ACTIVE technology use an innovative formula designed to fight engine dirt andincrease fuel economy.
And in the third area of creating new low carbon businesses, we use the strategic frameshown on the slide to develop new customer offers and transition our business to alower carbon future in the three focus areas of advanced mobility, bio and low carbonproducts and digital.
We see significant opportunities to create new low carbon businesses and we arepursuing numerous initiatives. Let me now play a short video to share just some of theprogress we have made….
[PLAY VIDEO]
As you can see, there is a lot already in play. We expect these initiatives and the otherprojects we have in the pipeline to create new business models and additional futurerevenue streams for Downstream over the longer term.
48
BP 4Q 2017 RESULTS 49BP 4Q & FULL YEAR 2017 RESULTS & STRATEGY UPDATE 49
SAFETY
Downstream key messages
core value#1
(1) Underlying RCPBIT adjusted for refining and petrochemicals environment, forex, turnaround and portfolio impacts
(2) Free cash flow proxy (FCF) = underlying RCPBIT+DD&A–organic capital expenditure. 2021 FCF and returns at $14/bbl RMM,$15/bbl WTI-WCS crude differential and Brent $55/bbl 2017 real
STRATEGIC PRIORITIES
$9-10bn ~20%>$3bn
underlyingearnings1 growthby 2016-21
free cash flow2 in2021
pre-taxreturns2
in 2021
KEY METRICS
$1.1bn >18%$1bn
underlying1 growth in marketing & manufacturing
free cashflow2 growth
pre-taxreturns
2017 DELIVERY
EFFICIENCYAND SIMPLIFICATION
PROFITABLE MARKETING GROWTH
ADVANTAGEDMANUFACTURING
LOWER CARBON AND DIGITALLY ENABLED FUTURE
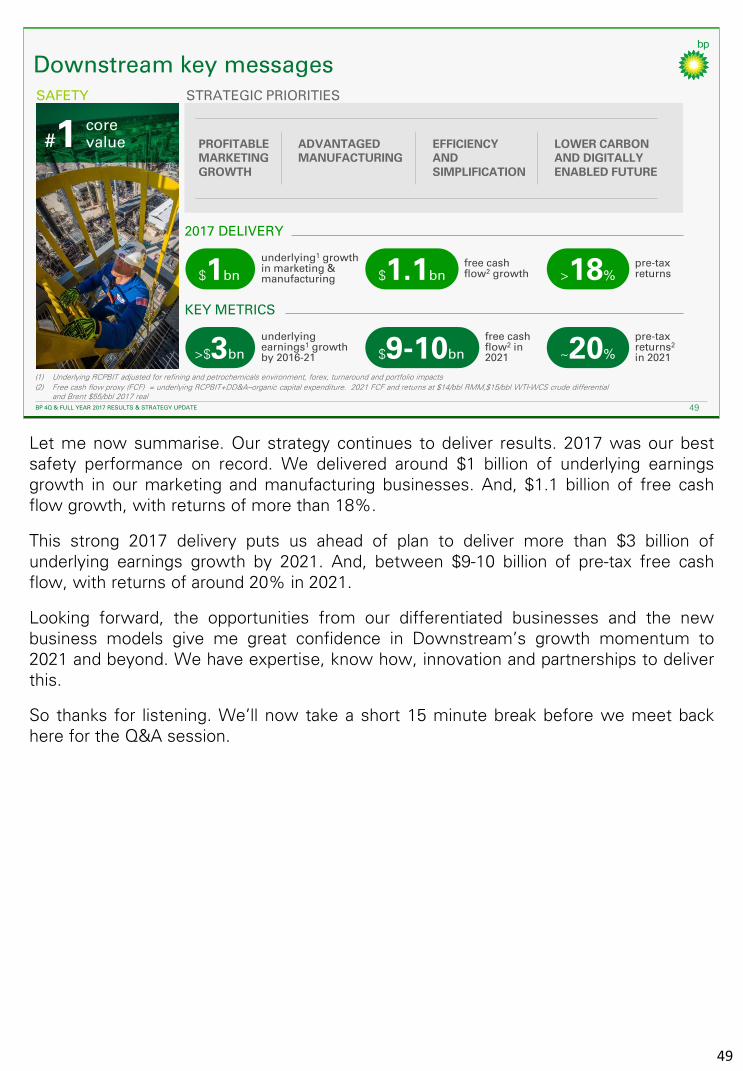
Let me now summarise. Our strategy continues to deliver results. 2017 was our bestsafety performance on record. We delivered around $1 billion of underlying earningsgrowth in our marketing and manufacturing businesses. And, $1.1 billion of free cashflow growth, with returns of more than 18%.
This strong 2017 delivery puts us ahead of plan to deliver more than $3 billion ofunderlying earnings growth by 2021. And, between $9-10 billion of pre-tax free cashflow, with returns of around 20% in 2021.
Looking forward, the opportunities from our differentiated businesses and the newbusiness models give me great confidence in Downstream’s growth momentum to2021 and beyond. We have expertise, know how, innovation and partnerships to deliverthis.
So thanks for listening. We’ll now take a short 15 minute break before we meet backhere for the Q&A session.
49