Embed Size (px)
Citation preview
www.gavi.org
UPDATE ON IMPLEMENTATION OF GAVI’S STRATEGY
Seth Berkley, MD29 November 2017, Vientiane, Lao PDR
GAVI BOARD29-30 NOVEMBER 2017
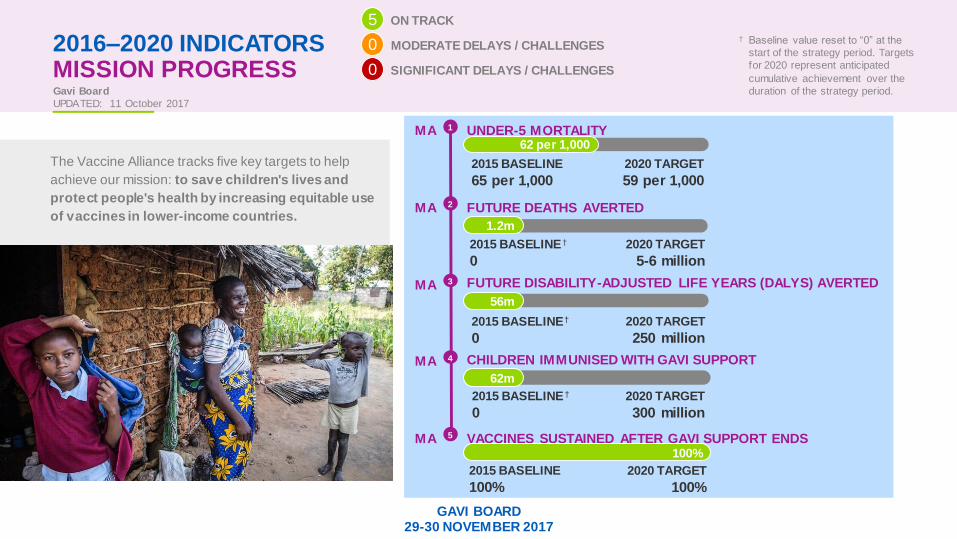
2016–2020 INDICATORSMISSION PROGRESSGavi Board
UPDATED: 11 October 2017
ON TRACK
MODERATE DELAYS / CHALLENGES
SIGNIFICANT DELAYS / CHALLENGES
5
0
0
The Vaccine Alliance tracks five key targets to help
achieve our mission: to save children's lives and
protect people's health by increasing equitable use
of vaccines in lower-income countries.
† Baseline value reset to “0” at the
start of the strategy period. Targets
for 2020 represent anticipated
cumulative achievement over the
duration of the strategy period.
MA
MA
MA
MA
MA
UNDER-5 MORTALITY
FUTURE DEATHS AVERTED
FUTURE DISABILITY-ADJUSTED LIFE YEARS (DALYS) AVERTED
CHILDREN IMMUNISED WITH GAVI SUPPORT
VACCINES SUSTAINED AFTER GAVI SUPPORT ENDS
2020 TARGET
59 per 1,000
2015 BASELINE
65 per 1,000
2020 TARGET
300 million
2015 BASELINE †
0
2020 TARGET
250 million
2015 BASELINE†
0
2020 TARGET
5-6 million
100%
2020 TARGET
100%
2015 BASELINE †
0
2015 BASELINE
100%
62m
1.2m
56m
62 per 1,000
1
2
3
4
5
2
3
Improve sustainability3 Market shaping4Accelerate vaccines1 Strengthen capacity2
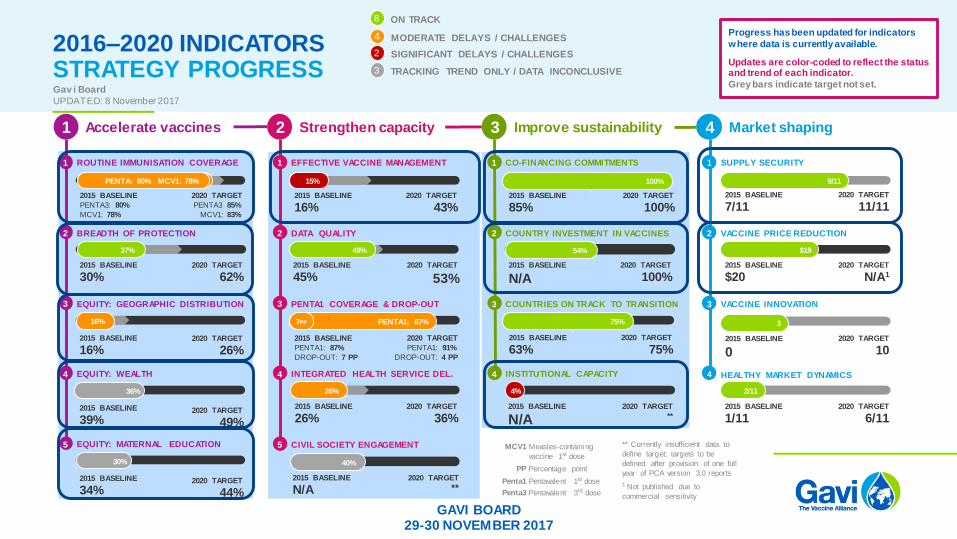
2016–2020 INDICATORSSTRATEGY PROGRESSGav i Board
UPDATED: 8 November 2017
1
EQUITY: GEOGRAPHIC DISTRIBUTION
ROUTINE IMMUNISATION COVERAGE 1
2
3
4
5
EFFECTIVE VACCINE MANAGEMENT
DATA QUALITY
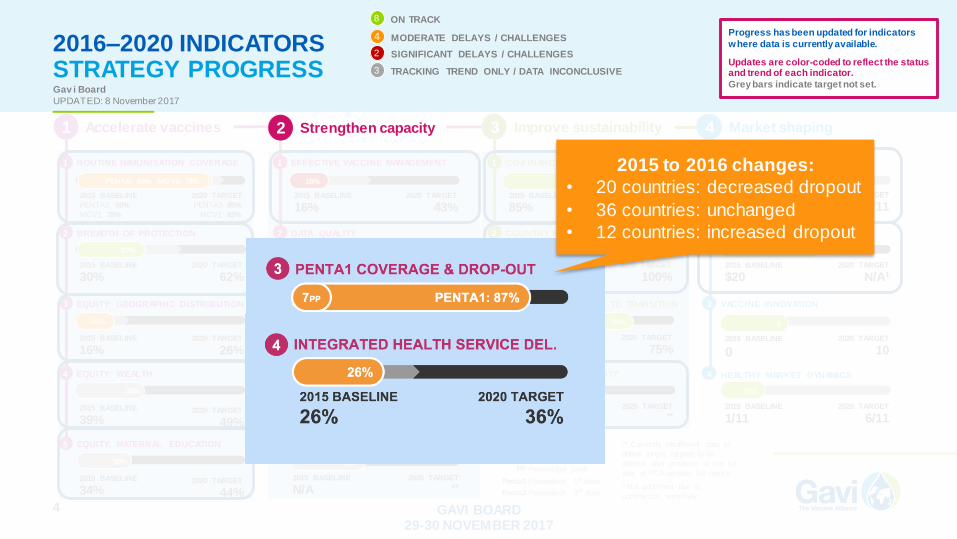
PENTA1 COVERAGE & DROP-OUT
INTEGRATED HEALTH SERVICE DEL.
CIVIL SOCIETY ENGAGEMENT
2
3
4
1
COUNTRY INVESTMENT IN VACCINES
COUNTRIES ON TRACK TO TRANSITION
INSTITUTIONAL CAPACITY
CO-FINANCING COMMITMENTS
2
3
4
1
VACCINE PRICE REDUCTION
VACCINE INNOVATION
HEALTHY MARKET DYNAMICS
SUPPLY SECURITY
Progress has been updated for indicators
where data is currently available.
Updates are color-coded to reflect the status and trend of each indicator.
Grey bars indicate target not set.
Measles-containi ng
vaccine 1st dose
Percentage point
Pentavalent 1st dose
Pentavalent 3rd dose
MCV1
PP
Penta1
Penta3
2020 TARGET
PENTA3 85%
MCV1: 83%
2015 BASELINE
PENTA3: 80%
MCV1: 78%
2020 TARGET
26%2015 BASELINE
16%
2020 TARGET
43%2015 BASELINE
16%
2020 TARGET
36%2015 BASELINE
26%
2020 TARGET
PENTA1: 91%
DROP-OUT: 4 PP
2015 BASELINE
PENTA1: 87%
DROP-OUT: 7 PP
2020 TARGET
100%2015 BASELINE
N/A
** Currently insufficient data to
define target; targets to be
defined after provision of one full
year of PCA version 3.0 reports
2020 TARGET
53%
100%
2020 TARGET
100%2020 TARGET
11/11
$19
2020 TARGET
N/A1
2020 TARGET
10
2020 TARGET
6/11
40%
2020 TARGET
**
2020 TARGET
**
2015 BASELINE
45%
2020 TARGET
75%2015 BASELINE
63%
2015 BASELINE
N/A
2015 BASELINE
N/A
2015 BASELINE
85% 2015 BASELINE
7/11
2015 BASELINE
$20
2015 BASELINE
0
2015 BASELINE
1/11
BREADTH OF PROTECTION
PENTA: 80% MCV1: 78%
2020 TARGET
62%2015 BASELINE
30%
37%
16%
15%PENTA: 80% MCV1: 78%
PENTA1: 87%7PP
26%
1 Not published due to
commercial sensitivity
49%
75%
4%
9/11
3
2/11
4 EQUITY: WEALTH
2020 TARGET
49%
2015 BASELINE
39%
5 EQUITY: MATERNAL EDUCATION
2020 TARGET
44%
2015 BASELINE
34%
GAVI BOARD29-30 NOVEMBER 2017
ON TRACK
MODERATE DELAYS / CHALLENGES
SIGNIFICANT DELAYS / CHALLENGES
8
TRACKING TREND ONLY / DATA INCONCLUSIVE
4
2
3
36%
30%
54%
GAVI BOARD29-30 NOVEMBER 2017
2
3
Improve sustainability3 Market shaping4Accelerate vaccines1 Strengthen capacity2
2016–2020 INDICATORSSTRATEGY PROGRESS
4
Gav i Board
UPDATED: 8 November 2017
1
EQUITY: GEOGRAPHIC DISTRIBUTION
ROUTINE IMMUNISATION COVERAGE 1
2
3
4
5
EFFECTIVE VACCINE MANAGEMENT
DATA QUALITY
PENTA1 COVERAGE & DROP-OUT
INTEGRATED HEALTH SERVICE DEL.
CIVIL SOCIETY ENGAGEMENT
2
3
4
1
COUNTRY INVESTMENT IN VACCINES
COUNTRIES ON TRACK TO TRANSITION
INSTITUTIONAL CAPACITY
CO-FINANCING COMMITMENTS
2
3
4
1
VACCINE PRICE REDUCTION
VACCINE INNOVATION
HEALTHY MARKET DYNAMICS
SUPPLY SECURITY
Progress has been updated for indicators
where data is currently available.
Updates are color-coded to reflect the status and trend of each indicator.
Grey bars indicate target not set.
Measles-containi ng
vaccine 1st dose
Percentage point
Pentavalent 1st dose
Pentavalent 3rd dose
MCV1
PP
Penta1
Penta3
2020 TARGET
PENTA3 85%
MCV1: 83%
2015 BASELINE
PENTA3: 80%
MCV1: 78%
2020 TARGET
26%2015 BASELINE
16%
2020 TARGET
43%2015 BASELINE
16%
2020 TARGET
36%2015 BASELINE
26%
2020 TARGET
PENTA1: 91%
DROP-OUT: 4 PP
2015 BASELINE
PENTA1: 87%
DROP-OUT: 7 PP
2020 TARGET
100%2015 BASELINE
N/A
** Currently insufficient data to
define target; targets to be
defined after provision of one full
year of PCA version 3.0 reports
2020 TARGET
53%
100%
2020 TARGET
100%2020 TARGET
11/11
$19
2020 TARGET
N/A1
2020 TARGET
10
2020 TARGET
6/11
40%
2020 TARGET
**
2020 TARGET
**
2015 BASELINE
45%
2020 TARGET
75%2015 BASELINE
63%
2015 BASELINE
N/A
2015 BASELINE
N/A
2015 BASELINE
85% 2015 BASELINE
7/11
2015 BASELINE
$20
2015 BASELINE
0
2015 BASELINE
1/11
BREADTH OF PROTECTION
PENTA: 80% MCV1: 78%
2020 TARGET
62%2015 BASELINE
30%
37%
16%
15%PENTA: 80% MCV1: 78%
PENTA1: 87%7PP
26%
1 Not published due to
commercial sensitivity
49%
75%
4%
9/11
3
2/11
4 EQUITY: WEALTH
2020 TARGET
49%
2015 BASELINE
39%
5 EQUITY: MATERNAL EDUCATION
2020 TARGET
44%
2015 BASELINE
34%
ON TRACK
MODERATE DELAYS / CHALLENGES
SIGNIFICANT DELAYS / CHALLENGES
8
TRACKING TREND ONLY / DATA INCONCLUSIVE
4
2
3
36%
30%
54%
Strengthen capacity2
2015 to 2016 changes:
• 20 countries: decreased dropout
• 36 countries: unchanged
• 12 countries: increased dropout
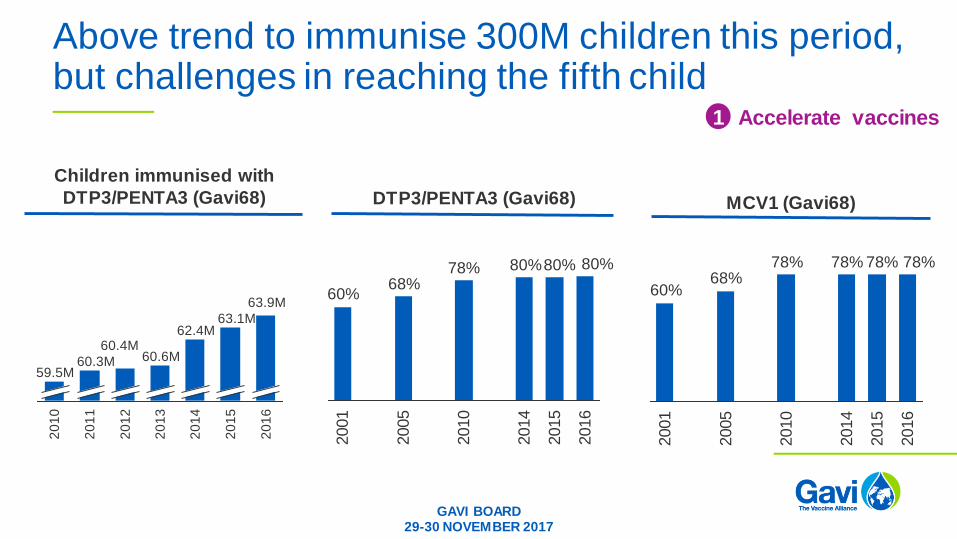
Above trend to immunise 300M children this period, but challenges in reaching the fifth child
Children immunised with
DTP3/PENTA3 (Gavi68) DTP3/PENTA3 (Gavi68)
80%80%80%78%68%
60%
2016
2001
2005
2015
2010
2014
MCV1 (Gavi68)
78%78%78%78%68%
60%
2016
2015
2001
2005
2014
2010
Accelerate vaccines12
01
2
60.4M
20
11
60.3M
20
14
62.4M
20
13
60.6M
20
10
59.5M
20
16
63.9M
20
15
63.1M
GAVI BOARD29-30 NOVEMBER 2017
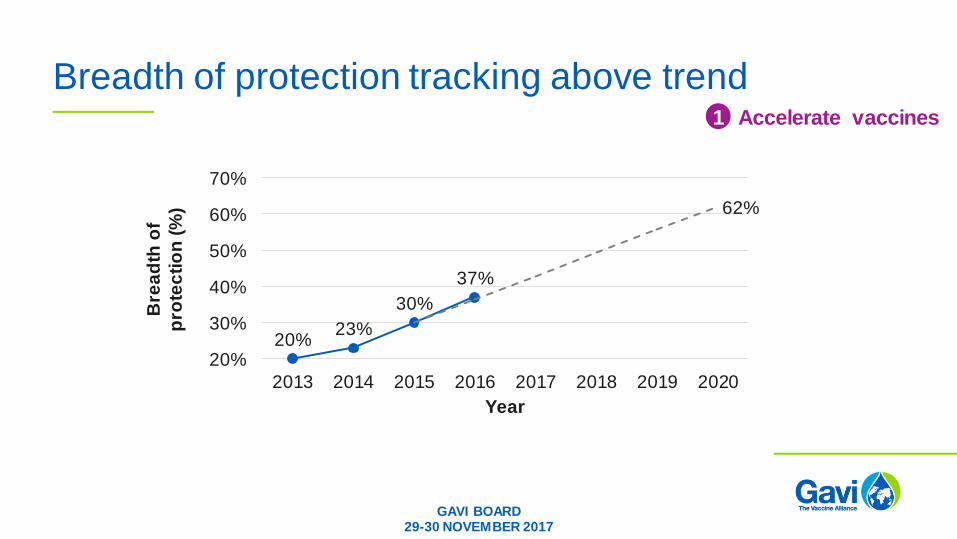
Breadth of protection tracking above trend
20%23%
30%
37%
62%
20%
30%
40%
50%
60%
70%
2013 2014 2015 2016 2017 2018 2019 2020
Bre
ad
th o
f
pro
tec
tio
n (
%)
Year
Accelerate vaccines1
GAVI BOARD29-30 NOVEMBER 2017
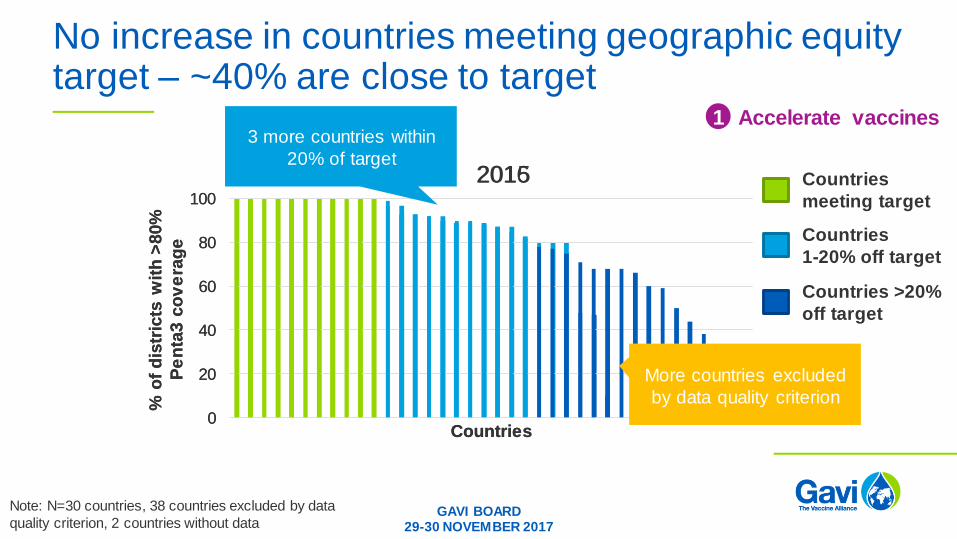
No increase in countries meeting geographic equity target – ~40% are close to target
Accelerate vaccines1
0
20
40
60
80
100
% o
f d
istr
icts
wit
h >
80%
Pe
nta
3 c
ov
era
ge
Countries
Note: N=30 countries, 38 countries excluded by data
quality criterion, 2 countries without data
Countries
meeting target
Countries
1-20% off target
Countries >20%
off target
GAVI BOARD29-30 NOVEMBER 2017
0
20
40
60
80
100
% o
f d
istr
icts
wit
h >
80%
Pe
nta
3 c
ov
era
ge
Countries
More countries excluded
by data quality criterion
3 more countries within
20% of target20152016
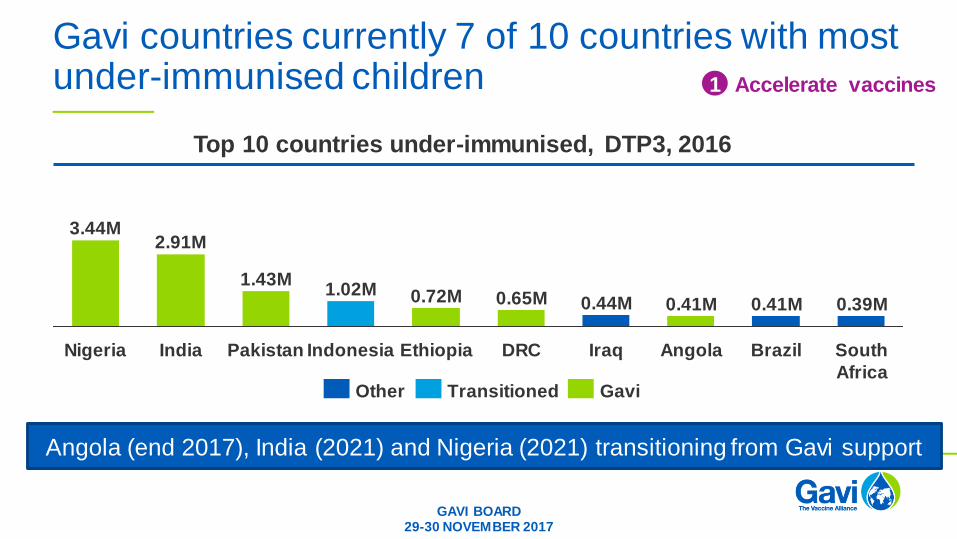
Gavi countries currently 7 of 10 countries with most under-immunised children
0.41M
Angola
0.41M
Iraq
0.44M
DRC
0.65M
Ethiopia
0.72M
Indonesia
1.02M
Pakistan
3.44M
South
Africa
0.39M
Brazil
1.43M
India
2.91M
Nigeria
Top 10 countries under-immunised, DTP3, 2016
GaviTransitionedOther
Angola (end 2017), India (2021) and Nigeria (2021) transitioning from Gavi support
Accelerate vaccines1
GAVI BOARD29-30 NOVEMBER 2017
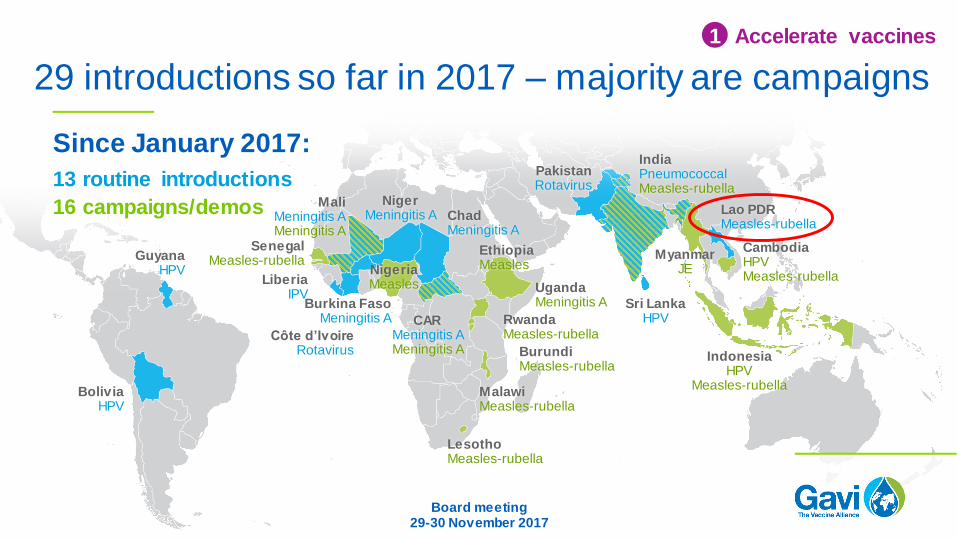
29 introductions so far in 2017 – majority are campaigns
Since January 2017:
Board meeting29-30 November 2017
LesothoMeasles-rubella
UgandaMeningitis A
CambodiaHPVMeasles-rubella
MaliMeningitis AMeningitis A
IndiaPneumococcalMeasles-rubella
Ethiopia Measles
LiberiaIPV
Burkina FasoMeningitis A CAR
Meningitis AMeningitis A Burundi
Measles-rubella
MalawiMeasles-rubella
Côte d’IvoireRotavirus
ChadMeningitis A
IndonesiaHPV
Measles-rubella
Sri LankaHPV
BoliviaHPV
GuyanaHPV
RwandaMeasles-rubella
NigerMeningitis A Lao PDR
Measles-rubella
SenegalMeasles-rubella Myanmar
JE
PakistanRotavirus
NigeriaMeasles
13 routine introductions
16 campaigns/demos
Accelerate vaccines1
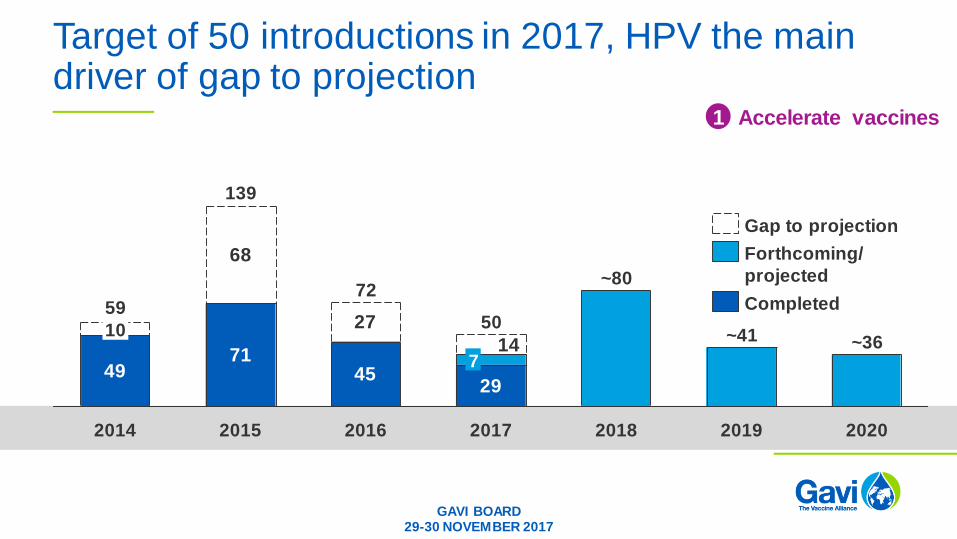
Target of 50 introductions in 2017, HPV the main driver of gap to projection
4971
4529
14
27
68
2017
50
7
2020
10
2016
72
2015
139
59
~36
2019
~41
2018
~80
2014
Completed
Gap to projection
Forthcoming/
projected
Accelerate vaccines1
GAVI BOARD29-30 NOVEMBER 2017
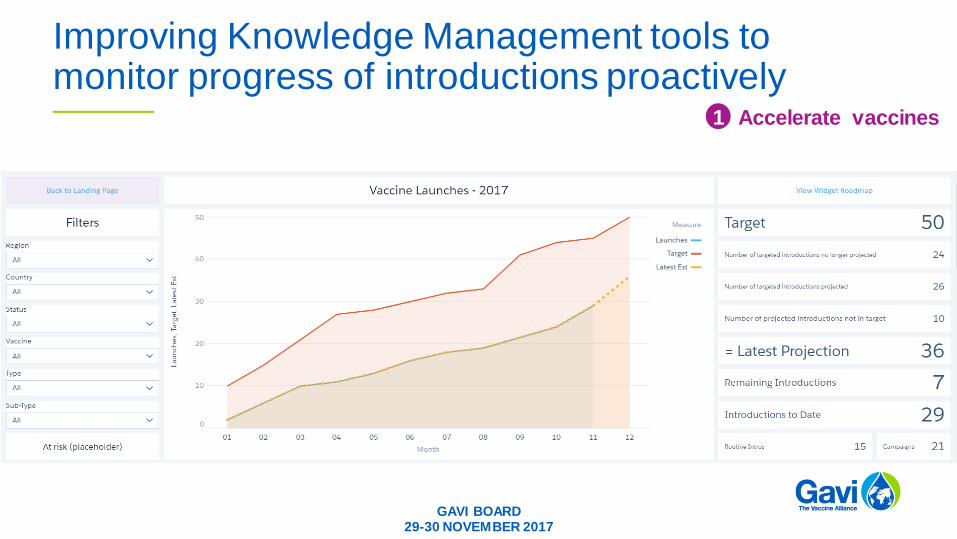
Improving Knowledge Management tools to monitor progress of introductions proactively
GAVI BOARD29-30 NOVEMBER 2017
Accelerate vaccines1
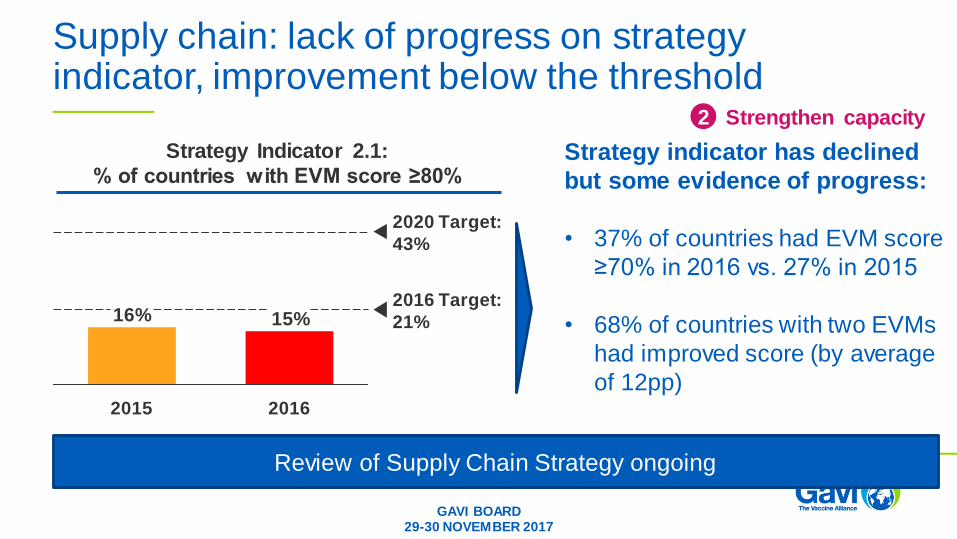
Supply chain: lack of progress on strategy indicator, improvement below the threshold
Strengthen capacity2
15%16%2016 Target:
21%
20162015
2020 Target:
43%
Strategy Indicator 2.1:
% of countries with EVM score ≥80%Strategy indicator has declined
but some evidence of progress:
• 37% of countries had EVM score
≥70% in 2016 vs. 27% in 2015
• 68% of countries with two EVMs
had improved score (by average
of 12pp)
Review of Supply Chain Strategy ongoing
GAVI BOARD29-30 NOVEMBER 2017
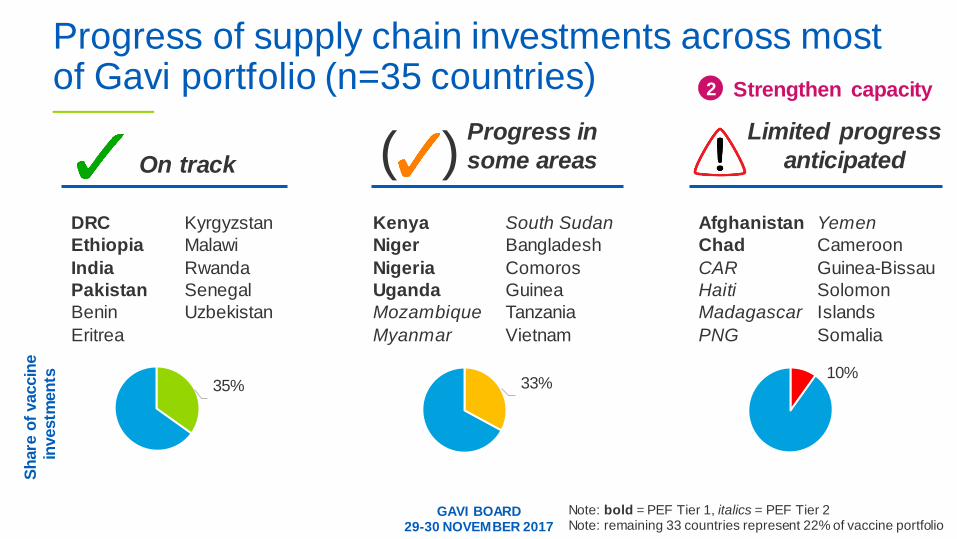
Progress of supply chain investments across most of Gavi portfolio (n=35 countries)
GAVI BOARD29-30 NOVEMBER 2017
( )Kyrgyzstan
Malawi
Rwanda
Senegal
Uzbekistan
DRC
Ethiopia
India
Pakistan
Benin
Eritrea
35% 33%10%
Kenya
Niger
Nigeria
Uganda
Mozambique
Myanmar
South Sudan
Bangladesh
Comoros
Guinea
Tanzania
Vietnam
Afghanistan
Chad
CAR
Haiti
Madagascar
PNG
Yemen
Cameroon
Guinea-Bissau
Solomon
Islands
Somalia
On track
Progress in
some areas
Limited progress
anticipated
Note: bold = PEF Tier 1, italics = PEF Tier 2Note: remaining 33 countries represent 22% of vaccine portfolio
Sh
are
of
vaccin
e
investm
en
ts
Strengthen capacity2
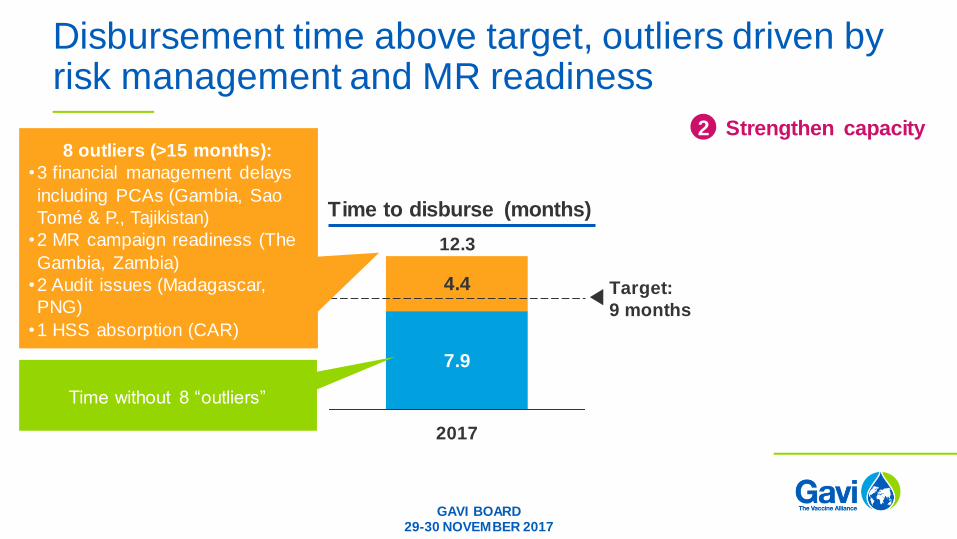
Disbursement time above target, outliers driven by risk management and MR readiness
7.9
4.4
2017
12.3
Target:
9 months
Time to disburse (months)
Time without 8 “outliers”
Strengthen capacity28 outliers (>15 months):
•3 financial management delays
including PCAs (Gambia, Sao
Tomé & P., Tajikistan)
•2 MR campaign readiness (The
Gambia, Zambia)
•2 Audit issues (Madagascar,
PNG)
•1 HSS absorption (CAR)
GAVI BOARD29-30 NOVEMBER 2017
GAVI BOARD29-30 NOVEMBER 2017
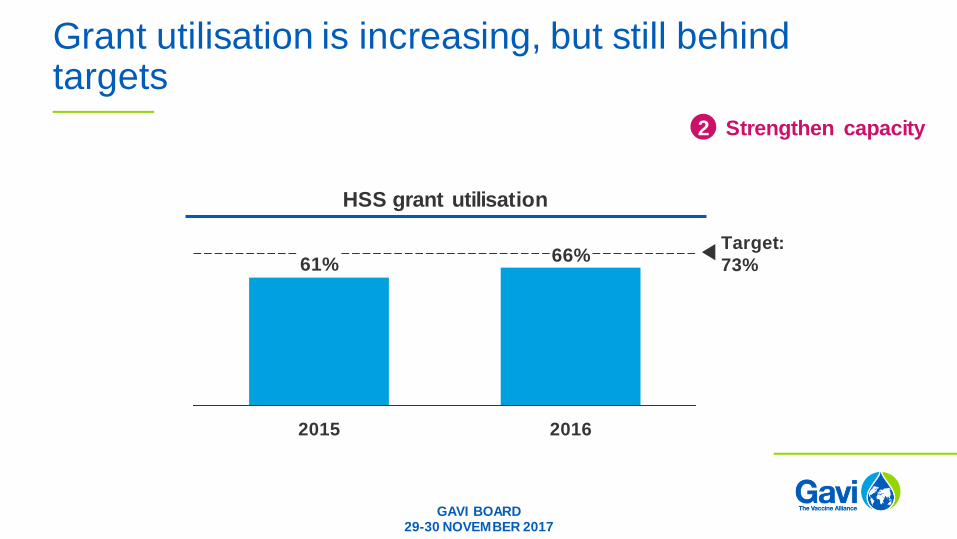
Grant utilisation is increasing, but still behind targets
66%61%
2015
Target:
73%
2016
HSS grant utilisation
Strengthen capacity2
GAVI BOARD29-30 NOVEMBER 2017
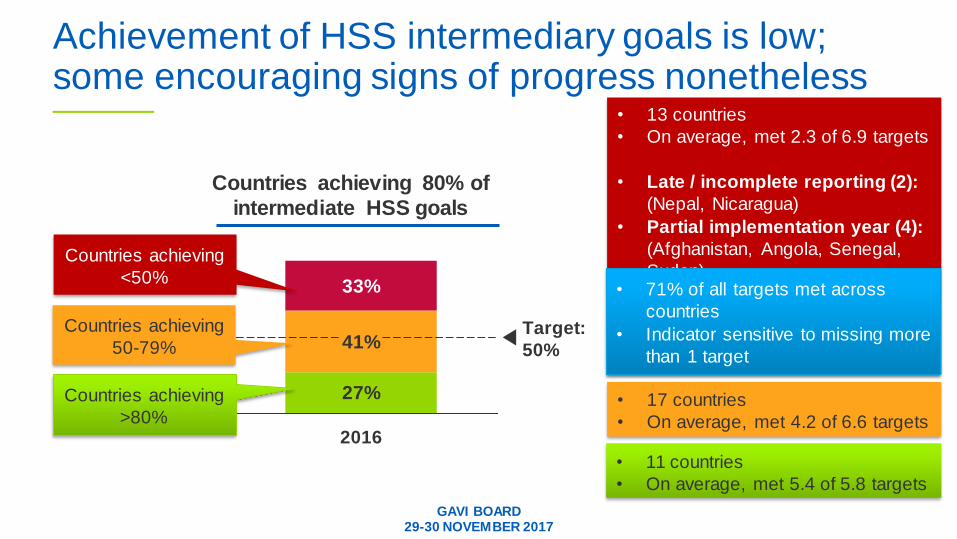
Achievement of HSS intermediary goals is low; some encouraging signs of progress nonetheless
27%
41%
33%
Target:
50%
2016
Countries achieving 80% of
intermediate HSS goals
Strengthen capacity2
Countries achieving
>80%
Countries achieving
50-79%
Countries achieving
<50%
• 11 countries
• On average, met 5.4 of 5.8 targets
• 17 countries
• On average, met 4.2 of 6.6 targets
• 13 countries
• On average, met 2.3 of 6.9 targets
• Late / incomplete reporting (2):
(Nepal, Nicaragua)
• Partial implementation year (4):
(Afghanistan, Angola, Senegal,
Sudan)
• Low cash absorption (4): CAR,
Honduras, Madagascar, Mali
• Low implementation rate (3):
Comoros, Congo, Guinea-Bissau
• 71% of all targets met across
countries
• Indicator sensitive to missing more
than 1 target
GAVI BOARD29-30 NOVEMBER 2017
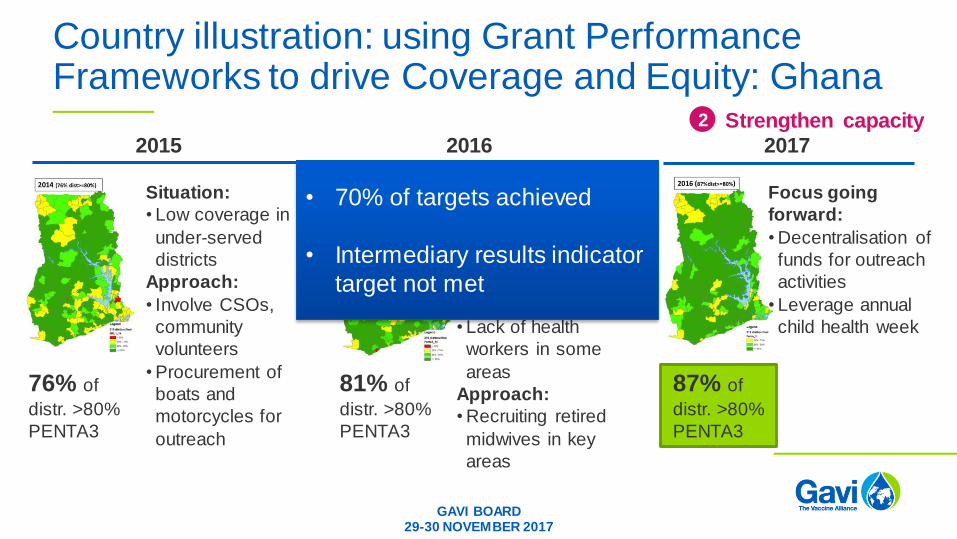
Country illustration: using Grant Performance Frameworks to drive Coverage and Equity: Ghana
Strengthen capacity2
2015 2017
Situation:
• Low coverage in
under-served
districts
Approach:
• Involve CSOs,
community
volunteers
• Procurement of
boats and
motorcycles for
outreach
2016
Progress:
• CSO involvement
• Volunteer recruitment
Challenges:
• Outreach below
target
• Lack of health
workers in some
areas
Approach:
• Recruiting retired
midwives in key
areas
76% of
distr. >80%
PENTA3
81% of
distr. >80%
PENTA3
Focus going
forward:
• Decentralisation of
funds for outreach
activities
• Leverage annual
child health week
87% of
distr. >80%
PENTA3
• 70% of targets achieved
• Intermediary results indicator
target not met
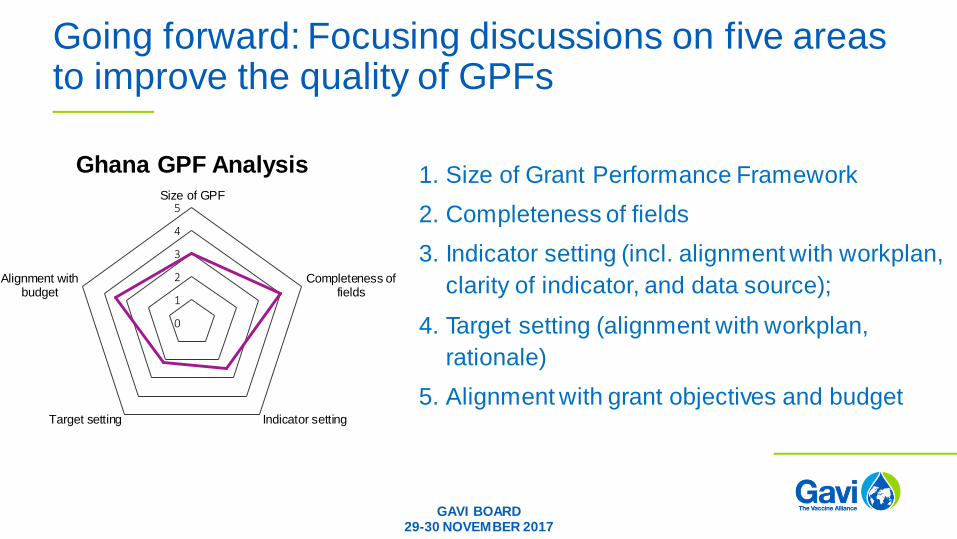
Going forward: Focusing discussions on five areas to improve the quality of GPFs
1. Size of Grant Performance Framework
2. Completeness of fields
3. Indicator setting (incl. alignment with workplan,
clarity of indicator, and data source);
4. Target setting (alignment with workplan,
rationale)
5. Alignment with grant objectives and budget
GAVI BOARD29-30 NOVEMBER 2017
0
1
2
3
4
5Size of GPF
Completeness offields
Indicator settingTarget setting
Alignment withbudget
Ghana GPF Analysis
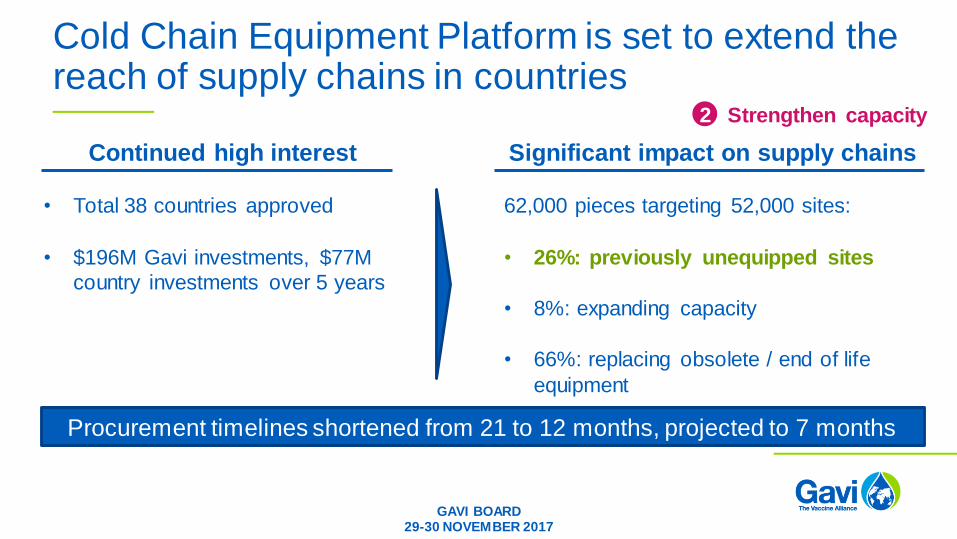
Cold Chain Equipment Platform is set to extend the reach of supply chains in countries
Continued high interest
• Total 38 countries approved
• $196M Gavi investments, $77M
country investments over 5 years
Significant impact on supply chains
62,000 pieces targeting 52,000 sites:
• 26%: previously unequipped sites
• 8%: expanding capacity
• 66%: replacing obsolete / end of life
equipment
Procurement timelines shortened from 21 to 12 months, projected to 7 months
Strengthen capacity2
GAVI BOARD29-30 NOVEMBER 2017
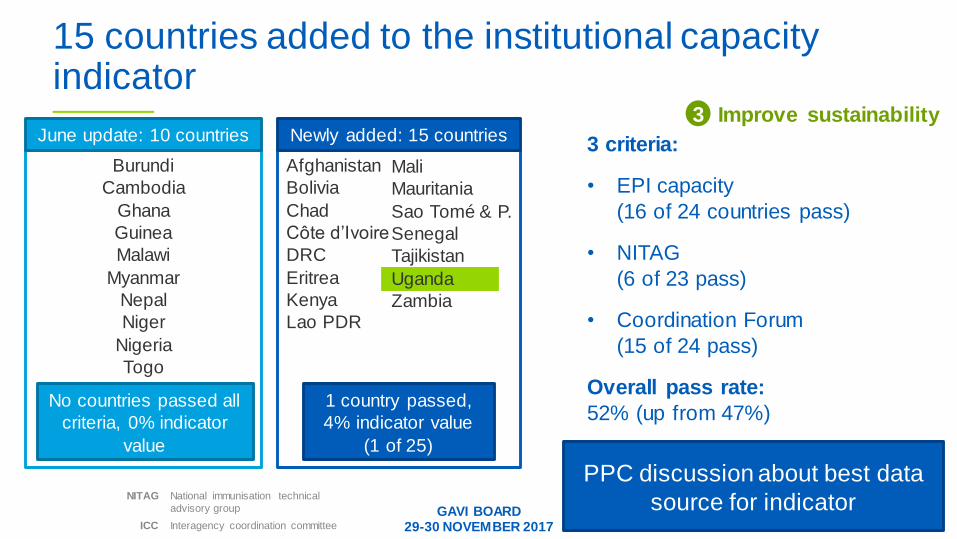
15 countries added to the institutional capacity indicator
3 criteria:
• EPI capacity
(16 of 24 countries pass)
• NITAG
(6 of 23 pass)
• Coordination Forum
(15 of 24 pass)
Overall pass rate:
52% (up from 47%)
National immunisation technical
advisory group
Interagency coordination committee
NITAG
ICC
Burundi
Cambodia
Ghana
Guinea
Malawi
Myanmar
Nepal
Niger
Nigeria
Togo
Afghanistan
Bolivia
Chad
Côte d’Ivoire
DRC
Eritrea
Kenya
Lao PDR
June update: 10 countries Newly added: 15 countries
GAVI BOARD29-30 NOVEMBER 2017
No countries passed all
criteria, 0% indicator
value
Mali
Mauritania
Sao Tomé & P.
Senegal
Tajikistan
Uganda
Zambia
1 country passed,
4% indicator value
(1 of 25)
PPC discussion about best data
source for indicator
Improve sustainability3
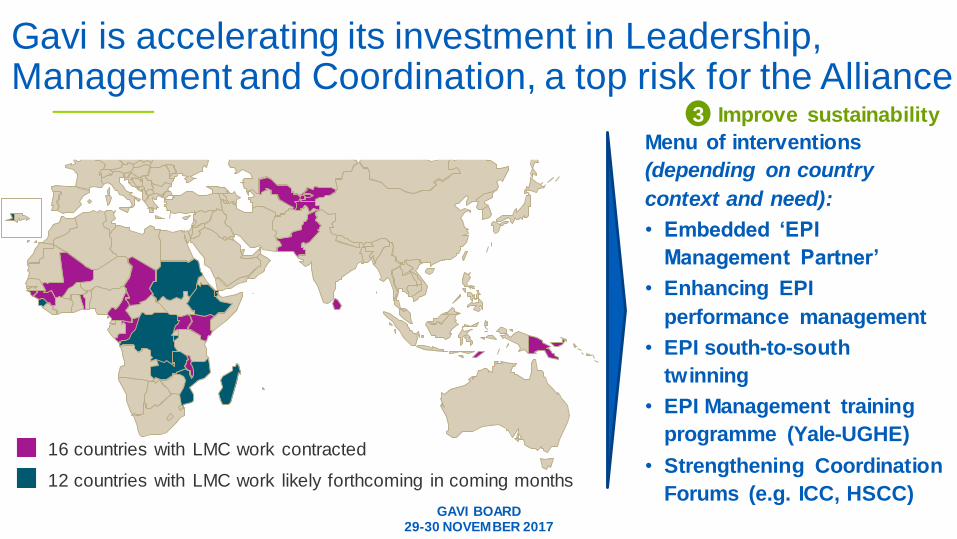
Gavi is accelerating its investment in Leadership, Management and Coordination, a top risk for the Alliance
Menu of interventions
(depending on country
context and need):
• Embedded ‘EPI
Management Partner’
• Enhancing EPI
performance management
• EPI south-to-south
twinning
• EPI Management training
programme (Yale-UGHE)
• Strengthening Coordination
Forums (e.g. ICC, HSCC)
16 countries with LMC work contracted
12 countries with LMC work likely forthcoming in coming months
GAVI BOARD29-30 NOVEMBER 2017
Improve sustainability3
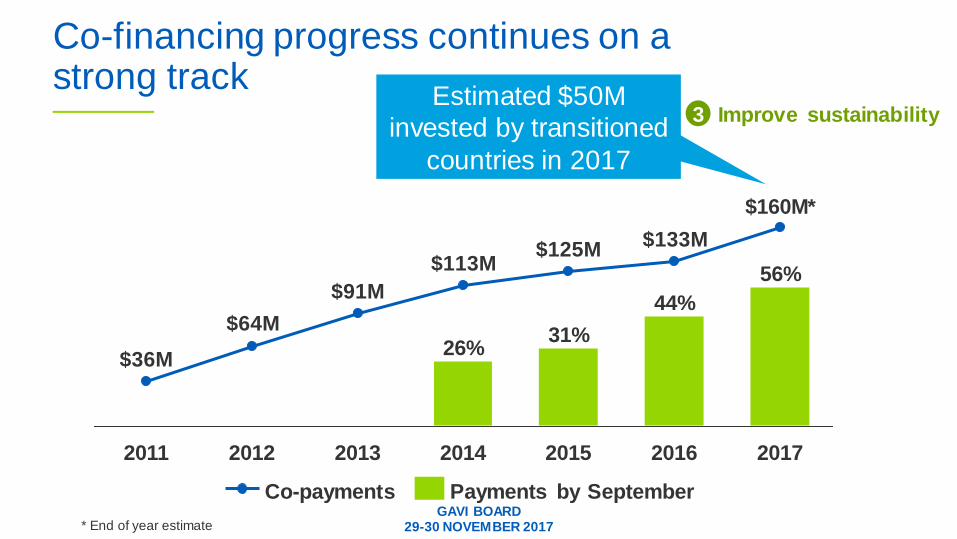
Co-financing progress continues on a strong track
* End of year estimate
Estimated $50M
invested by transitioned
countries in 2017
$133M$125M
$113M
$91M
$64M
$36M
44%
2014
56%
$160M*
2016
26%
2013 20172015
31%
2011 2012
Payments by SeptemberCo-paymentsGAVI BOARD
29-30 NOVEMBER 2017
Improve sustainability3
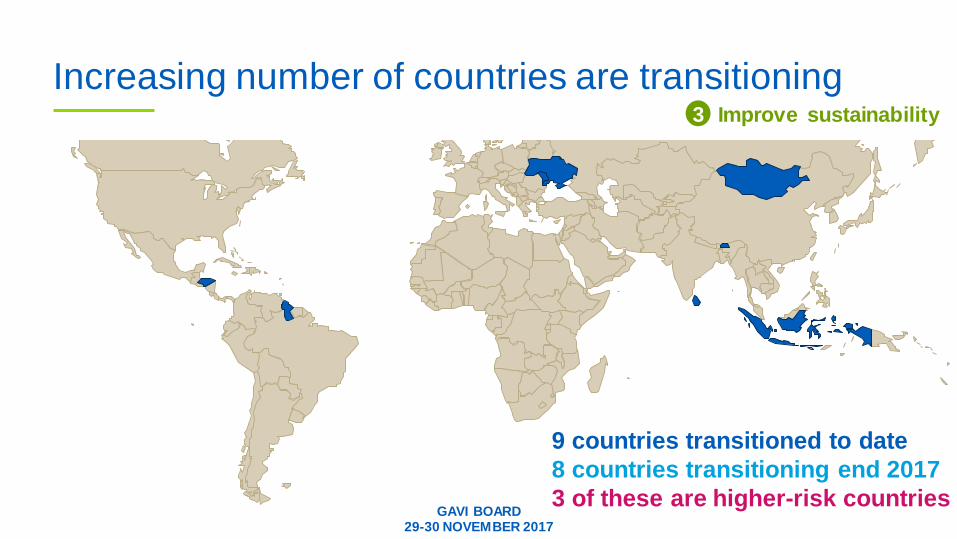
GAVI BOARD29-30 NOVEMBER 2017
Increasing number of countries are transitioning
9 countries transitioned to date
8 countries transitioning end 2017
3 of these are higher-risk countries
Improve sustainability3
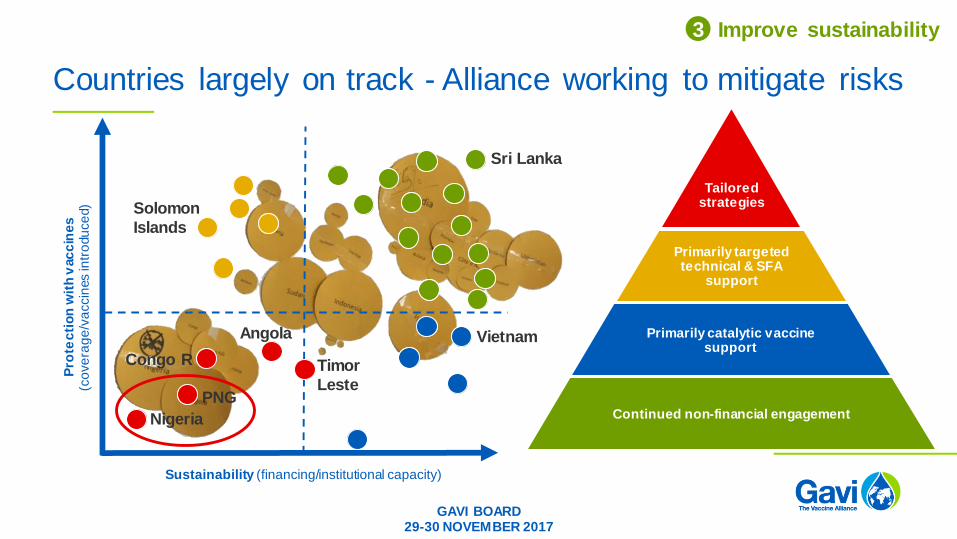
Countries largely on track - Alliance working to mitigate risks
Sustainability (financing/institutional capacity)
Pro
tec
tio
n w
ith
vac
cin
es
(co
ve
rag
e/v
accin
es in
tro
du
ce
d)
Primarily targeted technical & SFA
support
Primarily catalytic vaccine support
Continued non-financial engagement
Tailored strategies
Vietnam
Solomon
Islands
Nigeria
PNG
Congo R Timor
Leste
Angola
Sri Lanka
GAVI BOARD29-30 NOVEMBER 2017
Improve sustainability3
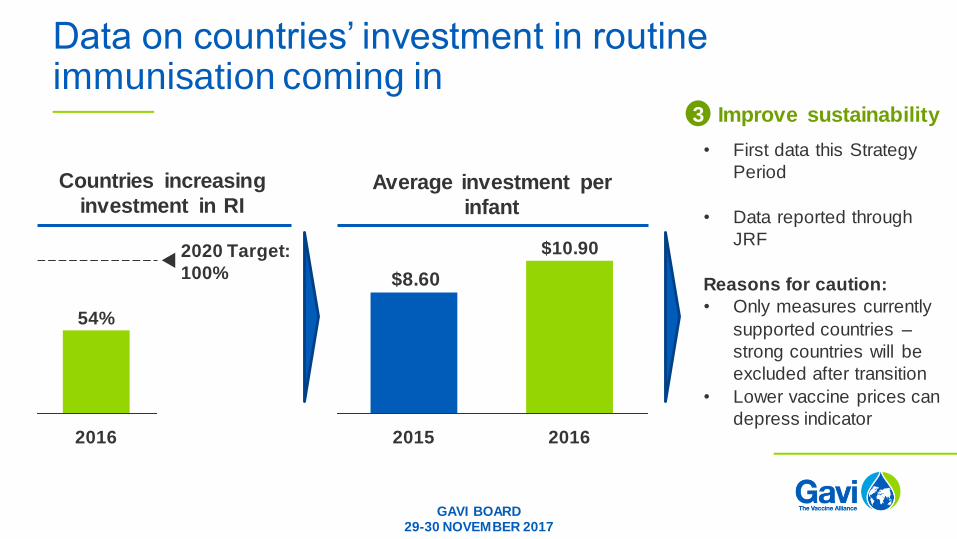
Data on countries’ investment in routine immunisation coming in
GAVI BOARD29-30 NOVEMBER 2017
$8.60
2016
$10.90
2015
Average investment per
infant
2016
54%
2020 Target:
100%
Countries increasing
investment in RI
• First data this Strategy
Period
• Data reported through
JRF
Reasons for caution:
• Only measures currently
supported countries –
strong countries will be
excluded after transition
• Lower vaccine prices can
depress indicator
Improve sustainability3
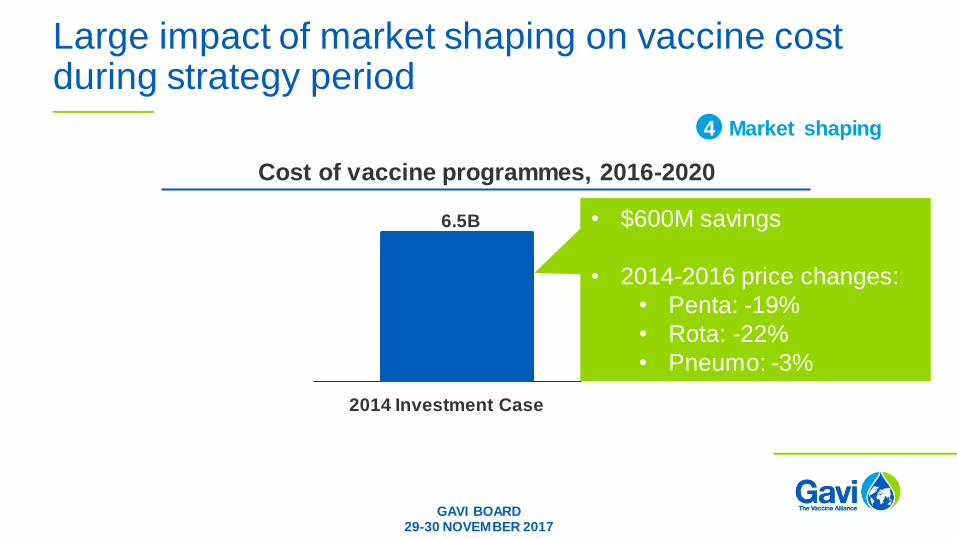
Large impact of market shaping on vaccine cost during strategy period
Cost of vaccine programmes, 2016-2020
Market shaping4
• $600M savings
• 2014-2016 price changes:
• Penta: -19%
• Rota: -22%
• Pneumo: -3%
GAVI BOARD29-30 NOVEMBER 2017
2014 Investment Case
6.5B
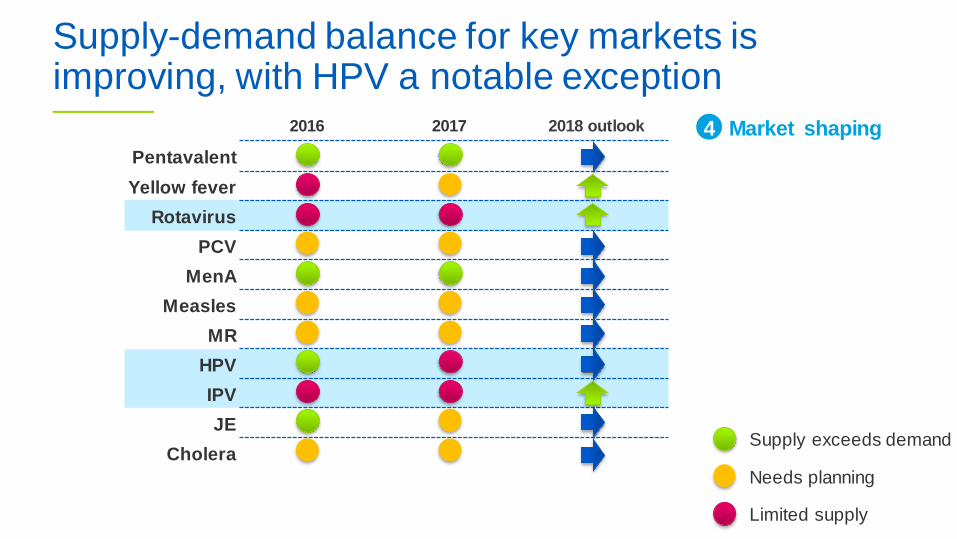
Supply-demand balance for key markets is improving, with HPV a notable exception
2016 2017 2018 outlook
Pentavalent
Yellow fever
Rotavirus
PCV
MenA
Measles
MR
HPV
IPV
JE
CholeraSupply exceeds demand
Needs planning
Limited supply
Market shaping4
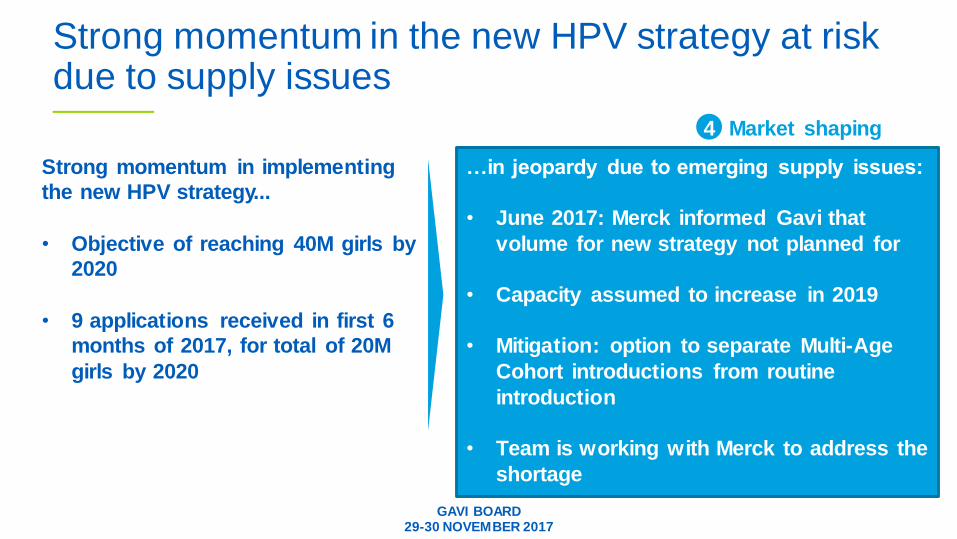
Strong momentum in the new HPV strategy at risk due to supply issues
Market shaping4
Strong momentum in implementing
the new HPV strategy...
• Objective of reaching 40M girls by
2020
• 9 applications received in first 6
months of 2017, for total of 20M
girls by 2020
…in jeopardy due to emerging supply issues:
• June 2017: Merck informed Gavi that
volume for new strategy not planned for
• Capacity assumed to increase in 2019
• Mitigation: option to separate Multi-Age
Cohort introductions from routine
introduction
• Team is working with Merck to address the
shortage
GAVI BOARD29-30 NOVEMBER 2017
GAVI BOARD29-30 NOVEMBER 2017
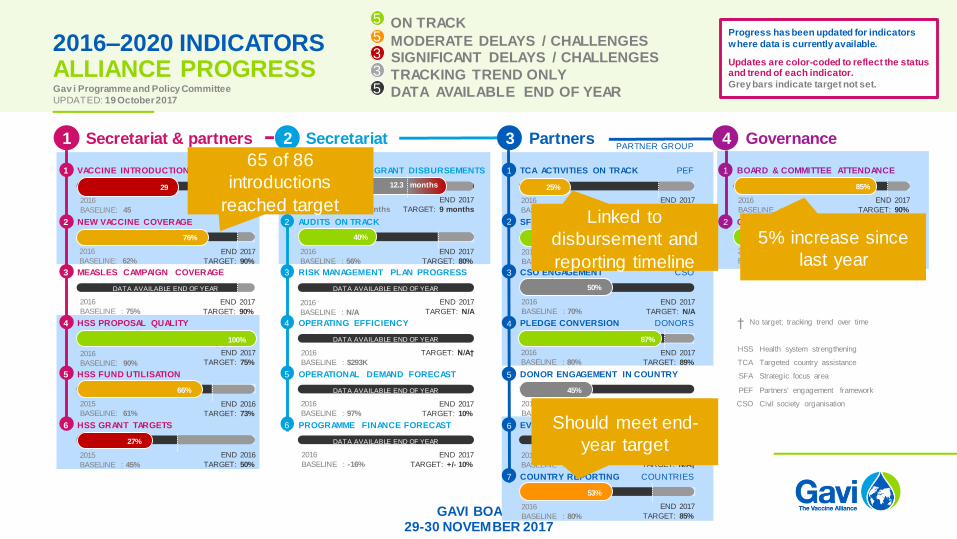
BOARD & COMMITTEE ATTENDANCE
GENDER BALANCE
No target; tracking trend over time†
Partners3
1
2
3
4
5
6
7
SFA/PEF ACHIEVEMENTS
NO MID-TERM DATA
CSO ENGAGEMENT
PLEDGE CONVERSION
DONOR ENGAGEMENT IN COUNTRY
END 2017
TARGET: N/A
EVALUATION ALIGNMENT
END 2017
TARGET: N/A†
COUNTRY REPORTING
END 2017
TARGET: 85%
50%
END 2017
TARGET: 80%
END 2017
TARGET: N/A
END 2017
TARGET: N/A
END 2017
TARGET: 89%
Governance4
1
Secretariat & partners1
2
3
4
5
6
VACCINE INTRODUCTIONS
END 2017
TARGET: 50
NEW VACCINE COVERAGE
END 2017
TARGET: 90%
MEASLES CAMPAIGN COVERAGE
END 2017
TARGET: 90%
DATA AVAILABLE END OF YEAR
HSS PROPOSAL QUALITY
END 2017
TARGET: 75%
HSS FUND UTILISATION
END 2016
TARGET: 73%
HSS GRANT TARGETS
END 2016
TARGET: 50%
27%
Secretariat2
1
2
3
4
5 OPERATIONAL DEMAND FORECAST
6 PROGRAMME FINANCE FORECAST
SPEED OF CASH GRANT DISBURSEMENTS
END 2017
TARGET: 9 months
AUDITS ON TRACK
END 2017
TARGET: 80%
RISK MANAGEMENT PLAN PROGRESS
END 2017
TARGET: N/A
DATA AVAILABLE END OF YEAR
OPERATING EFFICIENCY
TARGET: N/A†
DATA AVAILABLE END OF YEAR
END 2017
TARGET: 10%
DATA AVAILABLE END OF YEAR
40%
END 2017
TARGET: +/- 10%
DATA AVAILABLE END OF YEAR
1
2
2016–2020 INDICATORSALLIANCE PROGRESSGav i Programme and Policy Committee
UPDATED: 19 October 2017
PARTNER GROUP
PEF
PEF
CSO
DONORS
DONORS
COUNTRIES
TCA ACTIVITIES ON TRACK
7 EVALUATIONS
Health system strengthening
Targeted country assistance
Strategic focus area
Partners' engagement framework
Civil society organisation
HSS
TCA
SFA
PEF
CSO
END 2017
TARGET: 90%
85%
END 2017
TARGET: 40%
76%
100%
53%
12.3 months
2016
BASELINE: 45
2016
BASELINE: 62%
2016
BASELINE : 75%
2016
BASELINE: 90%
2015
BASELINE: 61%
2015
BASELINE : 45%
2016
BASELINE: 11.6 months
2016
BASELINE : 56%
2016
BASELINE : N/A
2016
BASELINE : $293K
2016
BASELINE : 97%
2016
BASELINE : -16%
2016
BASELINE: 15%
2016
BASELINE : 71%
2016
BASELINE : 70%
2016
BASELINE : 80%
2016
BASELINE : 20%
2016
BASELINE : 16
2016
BASELINE : 80%
2016
BASELINE : 81%
2016
BASELINE : 33%
29 25%
40%
Progress has been updated for indicators
where data is currently available.
Updates are color-coded to reflect the status and trend of each indicator.
Grey bars indicate target not set.
87%
72%
66% 45%
ON TRACK
MODERATE DELAYS / CHALLENGESSIGNIFICANT DELAYS / CHALLENGES
5
TRACKING TREND ONLY
5
3
3
5 DATA AVAILABLE END OF YEAR
65 of 86
introductions
reached targetLinked to
disbursement and
reporting timeline
Should meet end-
year target
5% increase since
last year

www.gavi.org
THANK YOU
GAVI BOARD29-30 NOVEMBER 2017