Embed Size (px)
Citation preview

Airports in Urban Networks 2014, Paris
BOOM OF AIRPORT CAPACITY BASED ON WAKE-VORTEX
HAZARDS MITIGATION SENSORS AND SYSTEMS
Frederic Barbarescoa, Philippe Juge
a, Mathieu Klein
a, David Canal
a, Yves Ricci
a, Jean-Yves
Schneidera, Jean-Francois Moneuse
b, Erwan Lavergne
b, Laurence Mutuel
c
aThales Air Systems, Limours, France bThales Air Systems, Rungis, France
cThales Avionics, Seattle, Washington, USA
Abstract
At airports, surface operation on the runway is the limiting factor for the overall throughput; specifically the fixed and overly conservative ICAO wake turbulence separation minima. The wake turbulence hazardous flows can dissipate quicker because of decay due to air turbulence or be transported out of the way on oncoming traffic by cross-wind, yet wake turbulence separation minima do not take into account wind conditions. Indeed, for safety reasons, most airports assume a worst-case scenario and use conservative separations; the interval between aircraft taking off or landing therefore often amounts to several minutes. However, with the aid of accurate wind data and precise measurements of wake vortex by radar sensors, more efficient intervals can be set, particularly when weather conditions are stable. Depending on traffic volume, these adjustments can generate capacity gains, which have major commercial benefits. This paper presents the developments of a wake turbulence system supporting increased throughput as part of the European ATM research program SESAR, and complementary technology study UFO (Ultra-Fast wind sensOrs for wake-vortex hazards mitigation) funded by European FP7 program. Keywords:wake-vortex hazards, airport capacity, airport safety, AMAN, point-merge, Runway Occupancy Time.
Résumé
Sur les aéroports, l’exploitation de la piste au décollage et à l’atterrissage est le facteur de limitation pour la capacité globale; spécifiquement à cause des séparations OACI relatives aux tourbillons de sillage, fixes et excessivement conservatrices. Les tourbillons de sillage peuvent habituellement se dissiper rapidement transportés par le vent de travers et détruits par la turbulence naturelle de l’atmosphère, mais les séparations actuelles sont fixes et ne prennent pas en compte ces conditions météorologiques. En effet, pour des raisons de sécurité, la plupart des aéroports utilise des séparations conservatrices; l'intervalle entre avionss’établissant souvent à plusieurs minutes. Cependant, dans les systèmes futurs, il est envisagé d’utiliser les données de vent précises et les mesures directes des tourbillons de sillage grâce à des senseurs radar et lidar, permettant de mettre en place des séparations réduites, en particulier quand les conditions atmosphériques sont stables et favorables. Selon le volume de trafic, ces ajustements peuvent produire des gains de capacité, qui ont un avantage économique important pour l’aéroport. Cet article présente les développements d'un système de gestion dynamique des séparations dans le cadre du programme de recherche ATM européen SESAR et de l’étude technologique complémentaire UFO (Ultra-FastwindsensOrs for wake-vortex hazards mitigation) financée parle programme européen FP7. Mots-clé:tourbillons de sillage, capacité des aéroports, sécurité des aéroports, AMAN, point de merge, temps d’occupation des pistes.

Author name / Airports in Urban Networks 2014, Paris 2
B
rf
er
rv 12
)( 0
ρ.V.s.B
M.gΓ 0
1. Introduction
All aircraft naturally generate wake vortices as soon as there is lift. Wake vortices can be considered as two
horizontal spiraling tubes trailing behind the aircraft and invisible to the human eye. A trailing aircraft exposed
to the wake vortices of a lead aircraft can experience an induced roll moment that is not easily corrected by the
pilot or the autopilot.
To avoid jeopardizing flight safety due to encountering wake vortices from the leading aircraft, time/distance
separations have been conservatively increased, therefore restricting runway capacity. The concern is higher
during the most critical phases of take-off and landing. The wake vortices typically dissipate quickly (e.g.,
through decay by turbulence or transport by cross-wind), but most airports operate for the safest scenario; this
means the interval between aircraft taking-off or landing often amounts to several minutes. To define more
efficient intervals, smart planning techniques are integrated in a decision aid tool for the air traffic controller
called Wake Vortex Decision Support System (WVDSS). This system relies on both the detection and
monitoring of wake vortices and the prediction of their transport by cross-winds, both driving factors to the
capacity limitations. Specifically, accurate wind data and precise measurements of wake vortex are required, as
well as an assessment of the stability in time of favorable conditions.
Depending on traffic volume, these adjustments can generate capacity gains, which have major commercial
benefits for both the airlines and the airport. In particular, the limitation of capacity from wake turbulence is
significantly accentuated with the arrival of new heavy aircrafts: Airbus A380, stretched version of Boeing
B747-8.
Radar and lidar sensors are low cost technologies with highly performing and complementary wake-vortex
detection capability to cover all weather conditions. Furthermore, the use of these sensors can be extended to
sense other types of atmospheric turbulence in the airport domain, such as wind-shear and micro-bursts. Their
complementarity provides operational coverage for varied weather conditions such as fog, rain, wind, and dry
air.
This paper initially paints the landscape for what constitutes wake-vortex hazards and why it is important to
mitigate it in the airport domain. Then the operational framework and its phased evolutions from today to about
2025 are depicted to support a parallel upgrade of the Wake-Vortex Decision Support System. The preliminary
system architecture is discussed as well as its main functions. Shifting to the validation exercises, supporting
tools such as simulators and models are described from both performance and input/output perspectives. The
results from the first validation campaign at Paris CDG airport are discussed in terms of achieved performance
and lessons learned, while areas for improvement are highlighted. Recommendations from these trials were
taken into account in the setup of the second validation campaign at CDG airport that focused on the evaluation
of wind sensors; achieved performances and recommendations for the sensor-suite selection are explicated.
Finally, the paper discusses further use of the WVDSS to optimize traffic flow in the terminal area and on the
runway.
2. Wake Vortex Hazards
Wake Vortices shed by an aircraft are a natural consequence of its lift. The wake flow behind an aircraft can be
described by near field and far field characteristics. In the near field, small vortices emerge from the vortex sheet
at the wing tips and at the edges of the landing flaps.
After roll-up the wake generally consists of two coherent counter-rotating swirling flows, mostly horizontal
and of about equal strength.
Empirical laws model the tangential speed in roll-up: the velocity profile or tangential speed at radius r, is
defined by:
(1)
where is called circulation. The wake vortex circulation strength (i.e., the root circulation in m2/s) is
proportional to aircraft mass M and gravity g, and inversely proportional to air density , wingspan B and aircraft
speed V with 4/s [1]:
(2)

Author name / Airports in Urban Networks 2014, Paris
There exist additional factors that impact the dynamic behavior of wake vortices, including wind-shear effect
(stratification of wind), ground effect (rebound), transport (by cross-wind), decay (by atmospheric turbulence)
and Crow instability.
Figure 1. Wake-Vortex Dynamics and Behaviors
3. Rationale for Wake-Vortex Hazards Mitigation at Airports
Encounters with wake vortices are a recognized source of aviation hazards. Most recent accidents where wake
was a contributing factor include AA Flight 587 in November 12, 2001 that crashed shortly after takeoff from
John F. Kennedy Airport, due to pilot error in the presence of wake-turbulence from a Boeing 747; Mexican
Government Learjet 45 in November 4, 2008 that crashed before turning for final approach at Mexico City
Airport while flying behind a Boeing 767-300 and above a heavy helicopter.
Figure 2.(at left) Location of Wake-Vortex Encounters, (at right) Severity of Wake-Vortex Encounters
In a study by NATS, critical areas for highest likelihood of wake-vortex encounters have been shown to occur at
touchdown (below 100 feet AGL) and at turn onto glideslope (between 3500-4500 feet AGL). Moreover, most
severe wake-vortex encounters mainly occur under 500 feet. The color coding is yellow for weak encounter
severity, orange for moderate encounter and red for severe. The impact of a wake vortex encounter at low
altitude is indeed more severe because of the induced roll angle generating loss of altitude and limited control
authority.
This low-altitude critical area is also characterized by a more complex behavior of the wake-vortex due to
ground effect (the wake is in ground effect or IGE). In higher altitudes (out of ground effect or OGE), the wake
vortex behavior is primarily affected by the wind, but it remains stable and can be numerically predicted via
dynamic model. At low altitude, ground effect can lead to unexpected wake vortex behavior very difficult to
predict and to model. In ground effect, wake vortices behaviors are driven by very instable causes: rebound of
vortices on the ground, strength enforcement of one vortex due to low level wind-shear induced by airport

Author name / Airports in Urban Networks 2014, Paris 4
infrastructure, generation of secondary vortices, and decay of wake-vortex due to low altitude atmosphere
stratification.
Figure 3.(at left) In Ground Effect Wake Behavior, (at rigt) In Ground Effect Wake Behavior
Based on the combination of risk level and complex behavior, low altitude wake-vortex requires monitoring
using in-situ sensor measurements in all weather conditions. The sensor suite of the WVDSS is designed to
answer this requirement.
4. Phases for Wake Vortex Decision Support System Development
Wake Vortex Decision Support System Architecture will evolve according to the development phases:
Phase 0
The preliminary system architecture includes wake vortex sensors and weather sensors. During this phase, a
theoretical study and a sensors benchmark campaign has been performed at Paris CDG airport (referred to as the
XP0 campaign) to select the needed sensors suite. The recommendations on sensor technology selection and
deployment delivered by this task were used to refine the system architecture in the following phases.
Phase 1: Time-Based Separation (TBS)
This is the current development phase, marking the evolution from distance based separation to time based
separation. The goal is to verify the position, strength and behavior of the wake vortices in arrival as a function
of headwind strength. A first release of the WVDSS prototype is developed to demonstrate this capability via an
in-situ verification campaign at CDG airport (called XP1 campaign). During the TBS phase, regulations evolve
under the RECAT initiative aiming at redefining aircraft separation categories. RECAT is also active in the US
with a first successful implementation at Memphis international airport.
Phase 2: Weather Dependent Separation (WDS)
The system will be updated with all the components related to weather now-cast and forecast, including real-time
prediction of micro-scale terrain-induced turbulence close to the airport. The goal is to assess in real-time the
position and strength of the wake vortices and to predict their behavior for both departures and arrivals. The
demonstration supports the transition from time based separation to weather dependent separation, as favorable
meteorological conditions (e.g. crosswind) are exploited. All building blocks regarding weather monitoring in
the WVDSS prototype will be developed and/or customized. The proof-of-concept will include an in-situ
verification campaign at CDG airport (called XP2 campaign).
Figure 4.(at right) Wake-Vortex hazards mitigation, (at right) WVDSS HMI for approach controler

Author name / Airports in Urban Networks 2014, Paris
Phase 3: Pair Wise Separation (PWS)
The system will be refined to reach two main goals. The first one is to perform a first demonstration of the pair
wise separation concept. With a partial aircraft wake vortex characteristics database, the WVDSS will
demonstrate the capability to determine a dynamic pair wise separation, taking in account the real-time weather
conditions as well as the aircraft sensitivity to wake vortex. The second objective is to demonstrate the system
adaptability to other runway layouts. These demonstrations will be performed in platform tests and verified in an
in-situ campaign at Frankfurt airport (called XP3 campaign).
5. Preliminary System Architecture
The system architecture development is based on SESAR requirements in term of safety and operational use,
ANSPs and EUROCONTROL recommendations and requirements are also taken into account.
The main inputs to the WVDSS include:
The information flow (from the ATC and airport centers) describing the current traffic and aircraft data. This
function provides the air traffic flow situation to the WVDSS.
The standard information related to weather conditions as provided by National Weather Forecast Services
(collected as meteorological center). The meteorological center provides data from the operational weather
forecast model “LM” of national Weather Services (e.g., Meteo France, DWD) covering most of Europe.
The system is in charge of elaborating decision aids to support the Supervisor, the Approach Controllers and the
Airport Tower Controllers.
Note that the Human Machine Interfaces for the Supervisor and controllers are considered out of scope of the
WVDSS Architecture.
Figure 5.(at left) System Overview, (at right) WVDSS Functional Architecture
The following sections describe in more details the components of the WVDSS.
Local Meteorological Sensors
A combination of sensors, which performance is typically weather dependent, are used for wind and air
turbulence monitoring. The local meteorological measurements are used for weather now-casting and
forecasting, based on the following parameters:
Mean wind: three wind components and wind variability,
Turbulence: measured as the Turbulent Kinetic Energy (TKE) or Eddy Dissipation Rate (EDR) level of the
atmosphere,
Virtual potential temperature: temperature stratification.
Wake Vortex Sensors function
The wake vortex measurements are performed with two complementary sensors: an X-band radar and a 1.5m
lidar. The lidar sensor performances are limited in higher humidity conditions such as rain or fog, while the radar
performances strive in these conditions; these strengths reverse in dry air.
Moreover, radar and lidar are good complementary sensors, which can be used for turbulence remote sensing as
well.
Local Weather Now-cast and Forecast function
The local weather now-cast and forecast functions predict atmospheric state variables within a coverage area of
about 100x100 km² centered on the airport with an increasing vertical spacing from about 25 to 50m throughout
the boundary layer. Output variables are vertical profiles of horizontal and vertical wind, virtual potential
temperature, Turbulent Kinetic Energy (TKE) and Eddy Dissipation Rate (EDR).

Author name / Airports in Urban Networks 2014, Paris 6
Wake Vortex Advisory System function
The Wake Vortex Advisory System (WVAS) is composed of:
o an input/output (I/O) module,
o a separation mode planner module,
o a wake vortex predictor module,
o a monitoring and alerting module.
The WVAS capability include:
o Proposing a separation mode to the supervisor (e.g., ICAO or reduced separation) and the time
applicability of that separation mode,
o Processing wind data including turbulence information and system track to provide spacing,
o Monitoring wake vortices (wake vortex predictor output) against system tracks and providing
encounter advisories to be displayed on the controller’s screen in case of actual or predicted
danger,
o Managing the wake vortex data (4D data) from the wake vortex sensors function. In case of
discrepancies between wake-vortex sensors and predictor, an alert is generated.
6. Simulators for Sensors
To investigate and assess optimum sensor parameters/modes tuning and best sensor deployment on the airport,
simulators are mandatory. A customized 1.5micronlidar wake-vortex simulator is being developed in
collaboration with the UniversiteCatholique de Louvain (UCL) in Belgium. The simulation of the wake-vortex
radar sensor is relatively new and ongoing in collaboration with UCL.
Figure 6.(at left) wake-vortex predictor, (center) Lidar Sensor Simulator Output, (at right) Radar Sensor Simulator Output
7. Weather and Atmospheric Turbulence Models
Meteo-France develops a new and advanced weather forecast model for airport applications, called
Meteorological High-Resolution Prediction System (MHRPS) that achieves a resolution of 500m.
Figure 7.(at left) Sensor Data Ingestion in MHRPS , (at right) TKE forecasted by NATMIG

Author name / Airports in Urban Networks 2014, Paris
The MHRPS development is based on the French non-hydrostatic AROME model. The MHRPS is implemented
on Meteo-France’s super-computer and assimilates not only dedicated airport sensors data but also all the routine
data coming from the European Meteorological Infrastructure. MHRPS requirements include:
Required parameters: horizontal and vertical wind (U, V, W), temperature (T), humidity (Hu), Eddy
Dissipation Rate (EDR), Surface Pressure (PS),
Required horizontal resolution: 500m,
Required coverage area: 100x100km² centered on the airport,
Required vertical resolution: 10m up to 100m, 100m up to 1000m, and 1000m above,
Required forecast horizon: 3h,
Required frequency of forecast outputs: 5’.
NATMIG developed a Turbulence Forecast Model (grid resolution: 100 m). A Reynolds averaged Navier-Stokes
model (SIMRA) has been developed by NATMIG member SINTEF in order to predict local wind and
turbulence around airports. The forecast EDR/TKE model will be adapted for airport infrastructure (e.g.,
buildings).
The MHPRS software from Meteo-France and the calculation of local turbulences from NATMIG update the
Local Weather Data Cube. The data stored in the cube contain all areas of interest for all CDG-based trials XP0,
XP1 and XP2:
Airspace allowed for landing (green color),
Airspace allowed for taking off (white color),
Airspace where dense traffic (arrival) is expected (blue color).
Within the volumes, the data are provided by the MHPRS for the grid points whose characteristics are:
Latitude: 48.6N to 49.4N with a quantum of 0.005° (160pts with an horizontal resolution of 550m),
Longitude: 2.08N to 2.98N with a quantum of 0.005° (180pts with a horizontal resolution of 360m).
8. De-risking 2008 Trials and SESAR XP0 Campaign at Paris CDG
In the de-risking phase in 2008 [2-5], THALES BOR-A radar was deployed at Paris CDG Airport, and co-
localized with a Eurocontrol-provided 2micronlidar. In a first step, the antenna was used in a staring mode for
vertical exploration by exploitation of 4° beam-width. Wake vortex detection is illustrated by Doppler entropy in
time/range coordinates axes in rainy weather. After each departure on the first nearer runways, wake vortex was
monitored.
Figure 8.(at left) Wake Rollups Tracking Scans, (at right) XP0 Sensor Campaign at CDG
In vertical scanning mode, individual roll-up of each wake vortex were tracked in range and elevation axes. In
the previous figure, above the first nearer runway, wake vortex generated by aircraft during departure can be
observed. These detections of wake vortex are coherent with classical behavior close to the ground. Each roll-up
from scan to scan (with one scan every 5 seconds) can be tracked as demonstrated by the trials. Close to the
ground, the trajectory of each roll-up can finely and accurately be followed and their strength be estimated by
circulation computation.
More recently, from mid-May to end of June 2011, the first XP0 campaign has been performed with the
following sensors:
Wake Vortex sensors:X-band radar BOR-A (THALES), Windcube 200S scanner Lidar (LEOSPHERE) [6-8],
Weather sensors:Windcube 70 wind profiler Lidar (LEOSPHERE), C-band weather radar (Meteo-France),
SODAR (Meteo-France), UHF Wind Profiler radar-PCL1300 (Meteo-France), UHF Wind Profiler radar-
PCL1300 (DEGREANE).
Author name / Airports in Urban Networks 2014, Paris 8
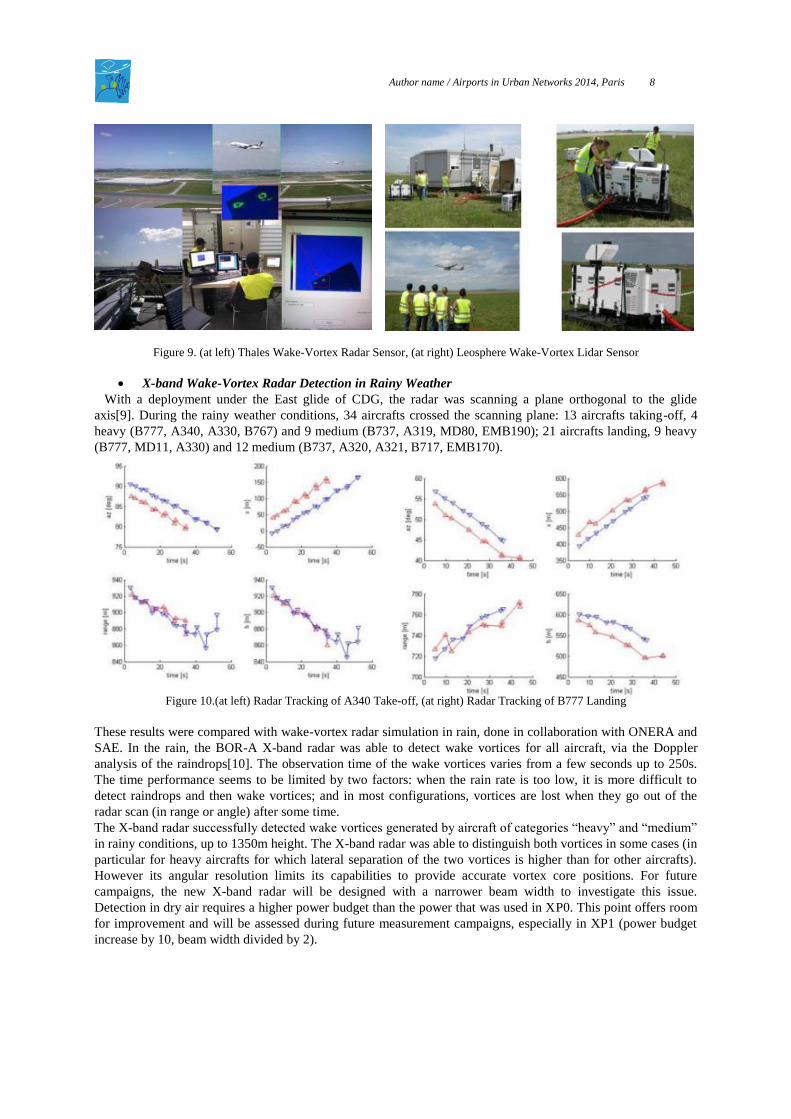
Figure 9. (at left) Thales Wake-Vortex Radar Sensor, (at right) Leosphere Wake-Vortex Lidar Sensor
X-band Wake-Vortex Radar Detection in Rainy Weather
With a deployment under the East glide of CDG, the radar was scanning a plane orthogonal to the glide
axis[9]. During the rainy weather conditions, 34 aircrafts crossed the scanning plane: 13 aircrafts taking-off, 4
heavy (B777, A340, A330, B767) and 9 medium (B737, A319, MD80, EMB190); 21 aircrafts landing, 9 heavy
(B777, MD11, A330) and 12 medium (B737, A320, A321, B717, EMB170).
Figure 10.(at left) Radar Tracking of A340 Take-off, (at right) Radar Tracking of B777 Landing
These results were compared with wake-vortex radar simulation in rain, done in collaboration with ONERA and
SAE. In the rain, the BOR-A X-band radar was able to detect wake vortices for all aircraft, via the Doppler
analysis of the raindrops[10]. The observation time of the wake vortices varies from a few seconds up to 250s.
The time performance seems to be limited by two factors: when the rain rate is too low, it is more difficult to
detect raindrops and then wake vortices; and in most configurations, vortices are lost when they go out of the
radar scan (in range or angle) after some time.
The X-band radar successfully detected wake vortices generated by aircraft of categories “heavy” and “medium”
in rainy conditions, up to 1350m height. The X-band radar was able to distinguish both vortices in some cases (in
particular for heavy aircrafts for which lateral separation of the two vortices is higher than for other aircrafts).
However its angular resolution limits its capabilities to provide accurate vortex core positions. For future
campaigns, the new X-band radar will be designed with a narrower beam width to investigate this issue.
Detection in dry air requires a higher power budget than the power that was used in XP0. This point offers room
for improvement and will be assessed during future measurement campaigns, especially in XP1 (power budget
increase by 10, beam width divided by 2).

Author name / Airports in Urban Networks 2014, Paris
Figure 11.(at left) Comparison of Wake Signatures, (at right) Lidar Wake-Vortex Tracking
Moreover, the ability of the wake vortex sensors to detect “aged” vortices depends on:
the time the vortices stay within the sensor scanning area and thus on the dimension of scanning sector
and crosswind,
rapid vortex decay (e.g. due to strong atmospheric turbulence) would also result in shorter vortex
detection times,
other parameters like wind-shear and atmospheric stability (also assumed to affect wake vortex decay
and transportation, but not included in this study).
With the X-band radar, wake vortices have been observed up to 250s after the airplane (wake vortices could be
observed in relation to the crosswind, which transported the vortices more or less quickly out of the scanning
domain). The relationship between EDR and wake vortex decay could not be finally analyzed. For the time
being, the algorithm to compute wake vortex circulation from a Doppler effect on raindrops is not yet available,
but will be developed based on multi-physic simulation: an algorithm of inversion should be developed and
calibrated on wake-vortex simulation based on fluid mechanical model coupled with electromagnetic model.
The results in terms of detection were deemed satisfactory. Most of wake vortices were detected in both critical
areas with detection ranges that have been demonstrated to be greater than the detection needs. Shows the
detection and tracking performance of the lidar. Wake vortex was detected as long as it was in the sensor’s
scanning domain, except for some cases for which the detection algorithms must be tuned.
To deploy the radar sensor, two primary options for the sensor locations were considered. The first option was
under the flight path because it allowed the two vortices to be separated thanks to the angular resolution.
However it required a large scan angle. The other option was to position the sensor sideways, with a vertical scan
perpendicular to the corridor axis. This setup was well suited to track vortices down to the ground and the two
vortices could be separated thanks to the range resolution. Both options have their specific strengths and
weaknesses. The optimum geometry should be chosen depending on the operational concept the sensor
information supports. The radar has more restrictive limits with respect to small scan angles to avoid ground
clutter, but this shortcoming can possibly be compensated by the radar’s longer range.
The results from the XP0 campaign demonstrated that, at higher altitudes, the wake vortex behavior, being
affected only by the wind, is predictable. Out of ground effect, wake vortex predictors are able to estimate their
behavior based on theoretical models and an accurate wind speed and direction as inputs. As a consequence of
the predictability, no wake vortex monitoring sensor is recommended for these higher altitude areas.
On the other hand, a wake vortex monitoring system is required closer to the ground where wake vortex behavior
is affected by ground effect and low-level wind-shear that can lead to unexpected behavior including complex
rebounds and enforcements, which cannot be accurately predicted or modeled. The sensor scanning domain must
be large enough to cover both landing and take-off. The best location for the sensors was assessed to be
sideways, a few hundred meters upstream from the touchdown area. Furthermore, based on the demonstrated
complementarity of radar and lidar, the recommendation for wake vortex monitoring is to deploy an X-band
radar with electronic scanning coupled with a 1.5µm lidar. The sensors monitor in a collaborative way as a meta-
sensor and are both located perpendicularly to the runways, according to the best recommended location.

Author name / Airports in Urban Networks 2014, Paris 10
Despite the very promising results, some improvements needed to be done on these sensors to reach the
performances needed by an operational system. For example, the target update rate to scan the wake-vortex 3D
volume should be around 10s; while the lidar technology can readily achieve the target performance, it needs to
be developed for the radar by electronic scanning. In addition, both lidar and radar were capable to evaluate the
circulation of wake-vortices, but the accurate assessment of the initial circulation and wake-vortex decay need
further development in the respective algorithms.
Regarding data availability, a gap was observed in particular weather conditions, such as after precipitation
when the air has been cleaned of aerosols. To correct for that gap, the radar power budget must be increased to
assure radar detection of wake vortices is completely supported in the domain where lidar data are not available.
This development was already planned in the project’s scope based on theoretical analysis; the campaign results
confirmed the analysis.
A new multifunction X-band Radar with electronic scanning capability was deployed in September/October
2012 at Paris CDG Airport for the XP1 campaign. This radar detects wake-vortex, weather, and traffic; it was
deployed to simultaneously monitor wake-vortex close to the runways and assess wind in the glide path and
around the airport. A multi-function 1.5 micronlidar 3D scanner was adjunct as its complement.
Figure 12.(at left) Radar Sensor Deployment for XP1, (at right) 3D Radar monitoring of wake-vortex
Figure 13.(at left) Lidar Sensor Deployment for XP1, (at right) 2D Lidar monitoring of wake-vortex
9. Wind Sensors Trials in XP1 Campaign
The sensor suite compliant with the recommendations from XP0 was deployed at CDG airport according to the
locations.
Achieved Performances
The overall availability of wind data from the UHF wind profiler radars is shown as a function of height above
the surface.
Author name / Airports in Urban Networks 2014, Paris
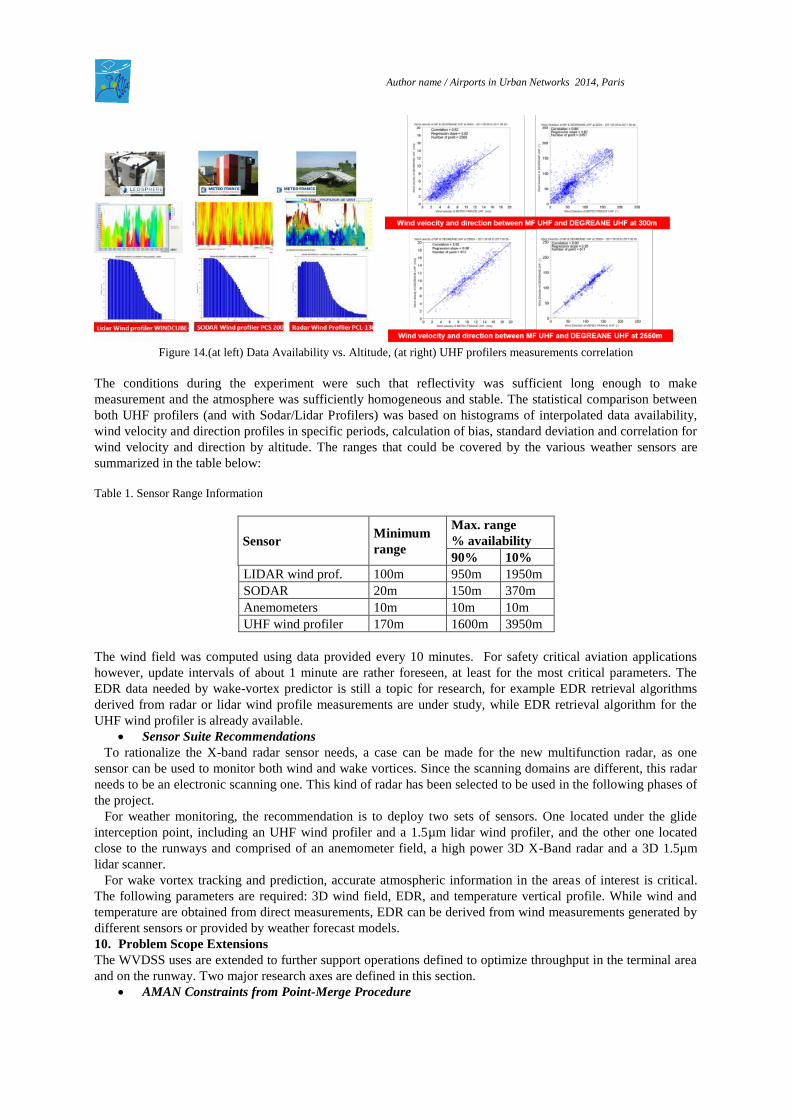
Figure 14.(at left) Data Availability vs. Altitude, (at right) UHF profilers measurements correlation
The conditions during the experiment were such that reflectivity was sufficient long enough to make
measurement and the atmosphere was sufficiently homogeneous and stable. The statistical comparison between
both UHF profilers (and with Sodar/Lidar Profilers) was based on histograms of interpolated data availability,
wind velocity and direction profiles in specific periods, calculation of bias, standard deviation and correlation for
wind velocity and direction by altitude. The ranges that could be covered by the various weather sensors are
summarized in the table below:
Table 1. Sensor Range Information
Sensor Minimum
range
Max. range
% availability
90% 10%
LIDAR wind prof. 100m 950m 1950m
SODAR 20m 150m 370m
Anemometers 10m 10m 10m
UHF wind profiler 170m 1600m 3950m
The wind field was computed using data provided every 10 minutes. For safety critical aviation applications
however, update intervals of about 1 minute are rather foreseen, at least for the most critical parameters. The
EDR data needed by wake-vortex predictor is still a topic for research, for example EDR retrieval algorithms
derived from radar or lidar wind profile measurements are under study, while EDR retrieval algorithm for the
UHF wind profiler is already available.
Sensor Suite Recommendations
To rationalize the X-band radar sensor needs, a case can be made for the new multifunction radar, as one
sensor can be used to monitor both wind and wake vortices. Since the scanning domains are different, this radar
needs to be an electronic scanning one. This kind of radar has been selected to be used in the following phases of
the project.
For weather monitoring, the recommendation is to deploy two sets of sensors. One located under the glide
interception point, including an UHF wind profiler and a 1.5µm lidar wind profiler, and the other one located
close to the runways and comprised of an anemometer field, a high power 3D X-Band radar and a 3D 1.5µm
lidar scanner.
For wake vortex tracking and prediction, accurate atmospheric information in the areas of interest is critical.
The following parameters are required: 3D wind field, EDR, and temperature vertical profile. While wind and
temperature are obtained from direct measurements, EDR can be derived from wind measurements generated by
different sensors or provided by weather forecast models.
10. Problem Scope Extensions
The WVDSS uses are extended to further support operations defined to optimize throughput in the terminal area
and on the runway. Two major research axes are defined in this section.
AMAN Constraints from Point-Merge Procedure

Author name / Airports in Urban Networks 2014, Paris 12
Point-merge is a procedure designed to replace radar vectoring and to enable extensive use of FMS lateral guidance and continuous descent, even during high traffic load. Point-merge is based on a specific P-RNAV route structure made of a merge point and sequencing legs equidistant from this point (and vertically separated). The sequencing is achieved using a direct-to instruction to the merge point at the appropriate time, the sequencing legs being used for path stretching (see
Figure 15).
Figure 15.(at left) Point-Merge Procedure, (at right) Aircraft AMAN sequencing in TMA
Wake Vortex could be a potential issue at the merge point in the establishment of the aircraft sequence. To
address this issue the WVDSS is interfaced with the arrival manager (AMAN) to establish the best possible
sequence, taking into account wake turbulence conditions. A non coordinated sequence could indeed greatly
perturb the airport capacity as shown in the examples below:
o Sequence 1: A380-A320-A380-A320 yields 17NM total length
o Sequence 2: A380-A380-A320-A320 yields 13NM total length.
Sequence 1 is an example of bad sequence in terms of capacity.
Runway Throughput and ROT Optimization
Addressing the capacity increase issue in the terminal area pushes the bottleneck to the runway. There are two
major aspects to be addressed: the reduction of the Runway Occupancy Time (ROT) and the regulation of
runway throughput. Several techniques both on ATC side and on aircraft side can be combined to optimize the
overall runway throughput.
When two aircraft are separated on final approach or on the runway prior to take-off, four criteria are being
considered: collision avoidance, ROT, wake-vortex separation and navigation performance. ROT and wake-
vortex separation are closely interdependent and both ROT time and safe vortex separations need be addressed
simultaneously.
Main factors contributing the ROT increase include runway contamination, wind conditions, visibility conditions
and insufficient look-ahead time to adapt to these factors. The first improvement is therefore to accurately and
timely report on these conditions to both ATC and aircraft.
Main factors affecting the runway throughput are related to the aircraft mix, in particular the presence of heavies
and super-heavies generating strong wakes, the presence of wind-shear, adverse meteorological conditions and
wake turbulence. The solution lies in monitoring these factors and developing the ability to mitigate the
performances through shared awareness and Collaborative Decision Making (CDM) between ATC and aircraft.
Emerging solutions are composed of aircraft-based elements, ground-based elements and procedures,
e.g.Runway Status information distribution amongst stakeholders, Airborne Brake-to-Vacate (BTV) or
Optimized-Runway-Exiting (ORE), AMAN with RECAT, and Dynamic wake-vortex hazard mitigation.
The AMAN will take into account the new wake vortex separations from RECAT to establish the arrival flow
and timing. The ROT will be optimized by taking into account the runway status (e.g., contamination) with a
30min look-ahead time as it impacts the aircraft braking efficiency and therefore the exit that is negotiated
between the aircraft and ATC.
The system is based on several weather sensors installed at the airport and measuring in real-time the conditions
to determine the contamination. The information is used onboard the aircraft to compute the braking efficiency
and on the ground to estimate the ROT. The ROT is then transmitted to both aircraft and AMAN. Based on
information sharing, a CDM-type negotiation on runway exit can be achieved.
Several methods for the exchange of information between ATC and the aircraft are being evaluated for aircraft
equipped or not with the Brake-To-Vacate (Airbus) or the Optimal Runway Exiting (Boeing) functions
In terms of performance, it is expected that ROT can be reduced by 30% with the BTV functionality,
corresponding to a throughput increase potential of 15%.

Author name / Airports in Urban Networks 2014, Paris
11. Conclusion and Perspectives
XP0 and XP1 campaigns confirmed the feasibility of a WVDSS prototype based on existing sensor technologies.
The operational needs should be met using both in-situ measurements from combinations of these sensors and
models. To achieve the required level of performance, it is recommended that, beyond the improvements already
planned (e.g., increase power for the radar), technological enhancements address the long-term to include the
verification of the overall reliability of the sensors, the maintenance aspects, and upgrading or replacement
strategies for “older” sensors with current R&D sub-systems.
In the future, WVDSS performances should take advantage of technology advances both on sensors and on
associated algorithms. For example, an EU-funded technology study will be conducted by THALES and 12 other
European partners to address low-cost 2D electronic-scanning radar antenna, high-power source lidar and
algorithm upgrades including wind and EDR monitoring in clear air[11]. This study called UFO, for UltraFast
wind sensOrs for wake-vortex hazards mitigation will include live-trials validation exercises at Munich and
Toulouse airports. The technologies investigated in UFO will support performance improvement of the WVDSS
for the monitoring capability of not only wake vortices but also severe cross-wind conditions, air turbulence and
wind shear.
Figure 16. UFO Project Proof of Concept, Toulouse Airport Trials
To answer the requirements for high update rate and accuracy on wind measurements, 2D electronic scanning
antenna technology based on low cost tile will be explored for the X-band radar through the development of a
tile mock-up. And regarding the lidar technology, a new high power 1.5m laser source will be investigated.
In addition, new design tools will be developed through simulators that are able to couple atmosphere models
with electromagnetic, radar and lidar models. In parallel, advanced Doppler signal processing algorithm will be
developed and tested for 3D wind field and EDR monitoring, including the algorithm for the management of
resources from the different sensors. A comparison with already existing sensors such as C-band meteorological
radar and S-band ATC radar, but also ADS-B Downlink will be performed. The calibration of the ground sensors
(lidar, X-band radar, and C-band radar with ADS-B data link) and the simulators will be achieved via
experimental trials at Munich and Toulouse airports. In Toulouse, an aircraft equipped with airborne probes will
enable comparison with in-situ measurements. These proof-of-concept validation exercises will be performed in
coordination with SESAR (through Eurocontrol) and with review from airports (as end-users).
Finally, the integration of wake vortex constraints in the optimization of arrival and departure flows via point-
merge procedure is planned in the roadmap of airborne separation applications. Similarly, the runway throughput
optimization will first address the exchange of runway status information amongst stakeholders to demonstrate
BTV/ORE in degraded conditions, before further integrating wake turbulence. Discussion on scoping this
longer-term R&D effort has started.
Acknowledgements
WVDSS development defined in Project 12.2.2. is funded under the European SESAR Program.
References
[1] F. Holzälpfel& al., (2003), Analysis of wake vortex decay mechanisms in the atmosphere, Aerospace Science
& Technology, n°7, pp.263-275
[2] F. Barbaresco & U. Meier, (2009), Wake Vortex X-band Radar Monitoring: Paris-CDG airport 2008
Campaign Results &Prospectives, International Radar Conference, Bordeaux

Author name / Airports in Urban Networks 2014, Paris 14
[3] F. Barbaresco, (2009), Interactions between Symmetric Cone and Information Geometries, LNCS, Springer,
vol.5416
[4] F. Barbaresco, (2010), Radar Monitoring of Wake Vortex: Electromagnetic reflection of Wake Turbulence in
clear air, Comptes-rendus Physique Académie des Sciences, Elsevier
http://www.wakenet.eu/fileadmin/user_upload/News%26Publications/CRPhys_article.pdf (preprint)
[5] F.Barbaresco, (2010), Airport Radar Monitoring of Wake Vortex in all Weather Conditions, EURAD’11,
EuMW
http://www.wakenet.eu/fileadmin/user_upload/News%26Publications/EURAD-Wake-Vortex-Barbaresco.pdf
[6] M. Steen, S. Schönhals, J. Polvinen, P. Drake, J.P. Cariou, A. Dolfi-Bouteyre, F. Barbaresco, (2010), Airport
Radar Monitoring of Wake Vortex in all Weather Conditions, 9th Innovative Research Workshop & Exhibition,
Eurocontrol EC
http://www.wakenet.eu/fileadmin/user_upload/News%26Publications/INO-WS2010_148_48085-1.pdf
[7] A. Dolfi-Bouteyre, B. Augere, M. Valla, D. Goular, D. Fleury, G. Canat, C. Planchat, T. Gaudo, C. Besson,
A. Gilliot, J.-P. Cariou, O. Petilon, J. Lawson-Daku, S. Brousmiche, S. Lugan, L. Bricteux, B. Macq, (2009),
Aircraft wake vortex study and characterization with 1.5μm fiber Doppler lidar, Journal of Aerospace Lab
[8] S. Schönhals, M. Steen, P. Hecker, (2009), Surveillance Systems On-Board Aircraft: Predicting, Detecting
and Tracking Wake Vortices, Proc. of 8th Innovative Research Workshop, pp.65
[9] Vanhoenacker-Janvier D., Djafri K., Barbaresco F., (2012), Model for the calculation of the radar cross
section of wake vortices of take-off and landing airplanes, EURAD’12 Conference, Amsterdam
[10] Liu Z., Jeannin N., Vincent F., Wang X., (2012), Modeling the Radar Signature of Raindrops in Aircraft
Wake Vortices, Journal of Atmospheric and Oceanic Technology.
[11] EU-funded FP7 call 5 UFO project website:
http://www.ufo-wind-sensors.eu/home
http://www.wakenet.eu/fileadmin/user_upload/News%26Publications/UFO-Official-Flyer-Sept-2013.pdf
http://www.transport-research.info/web/projects/project_details.cfm?ID=45116