Embed Size (px)
Citation preview
i
Lighting Market Intelligence Report
FEBRUARY 2017
A Bright Future for Efficiency
B O N N E V I L L E P O W E R A D M I N I S T R A T I O N

2 / HVAC Market Intelligence Report HVAC Market Intelligence Report / 3
2 3
Interviews With Key Market Actors The research team interviewed approximately 150 different lighting market actors including retailers, manufacturers, manufacturer representatives, lighting showroom staff, distributors, contractors, industrial lighting specialists, outdoor lighting specialists, and new construction builders. The team completed many of these interviews in person at the 2015 and 2016 Lightfair trade shows, as well as the 2015 ENERGY STAR® Partner Meeting.
Secondary Data Sources To keep pace with the dynamic lighting market, stakeholders in the Northwest and around the country have undertaken an increasing number of market and consumer tracking studies in recent years. To leverage these efforts, the research team reviewed over 30 different resources including publications by NEEA, the Northwest Power & Conservation Council (NWPCC), the U.S. Department of Energy (DOE), regional utilities, and manufacturers.
ABOUT THIS REPORTThe Bonneville Power Administration (BPA) recently completed research on the residential and non-residential lighting markets. This report highlights how both markets have evolved in response to rapid technology advancements and recent efficiency standards, and discusses what further changes are likely still to come.
WHO SHOULD READ THIS?This report provides information to support strategic decision-making for the full range of energy-efficiency program planners in the Northwest, including utilities, the Northwest Energy Efficiency Alliance (NEEA), the Energy Trust of Oregon (ETO), and BPA.
Data SourcesResearchers went straight to the best data sources available for the national and Northwest residential and non-residential lighting markets. This report reflects findings from:
Retailer Sales and Shelf Data The research team analyzed annual, full-category (i.e., both efficient and inefficient technologies) sales data for a subset of regional retailers. These retailers sell approximately a quarter of the lamps in the region. The team supplemented these sales data with shelf stocking data gathered by NEEA through its long-term monitoring and tracking of the retail lighting market.
Distributor Sales DataWorking in tandem with BPA staff and NEEA,the team collected full-category 2010-2015 salesdata from 34 electrical distributors serving thecommercial market in the Northwest. Depending on the product, the sales data collected accounts for 35% to 70% of regional non-residential lighting sales.
How large is the lighting market? Which technologies compete with each other for market share? This report begins by answering these foundational questions, for both the residential and non-residential lighting markets, providing the reader with the context necessary to interpret and apply the findings presented in the remainder of the report.
This report summarizes key research findings in the following areas, offering insights into the lighting market that program planners can use when deciding how best to direct program investments.
LEDs have gone from 1% of retail sales to 24% in only five years. LEDs have similarly transformed the mix of non-residential lighting products sold, accounting for over 15% of distributor sales today. This report details these recent sales trends and explores what these changes mean for a continually evolving lighting market.
Technology shifts have also meant shifts in the residential and non-residential supply chains. New market actors are playing key roles, while some traditional market actors find themselves needing to modify their value propositions to keep up with changing customer preferences.
In the midst of today’s increasingly efficient lighting market, both federal lighting standards and voluntary specifications, such as ENERGY STAR, are revisiting their current requirements to push the market further.
IN THIS REPORT
At a Glance
Sales Trends
Market Dynamics
Standards and Specifications
Planning for the Future
The Energy Independence and Security Act (EISA), which regulated the manufacture of specific incandescent lamps, also eliminated the least efficient and most common screw-in lamps from the lighting market. At the same time, advancements in LED technology are pushing lighting efficacy to new heights. However, these improvements do not mean the market is fully transformed; portions of both residential and non-residential lighting markets remain relatively inefficient.

4 / HVAC Market Intelligence Report HVAC Market Intelligence Report / 5
4 5
634,023,937 863,104
17% 9% 7%
23 35
Residential Lighting: At a Glance
40
5
5.25
2009 2011 2013 2015 2017
35
0
70
105
5.5
5.75
1406
14 543,730 21
10%
NORTHWESTHOMES
(of total installed residential lamps)
NORTHWEST UNITS
NORTHWESTHOMES
GENERAL PURPOSE SPECIALTY
DECO
RATI
VE
GLO
BE
3-W
AY
REFL
ECTO
R
LINEARTUBES
AVG # LAMPS
AVG # LAMPS
AVG #LAMPS
AVG # FIXTURES
AVG # FIXTURES
AVG # FIXTURES
57% 34% 9%
HO
USE
S (m
illio
ns)
LAM
P SA
LES
(mill
ions
)
FIGURE 1
SOURCE: BPA Residential Lighting ModelThe Impact of Longer Lamp Lives in Northwest Homes
67 million
Longer lifetime products mean fewer sales despite housing growth
Lamps Sold in 2015 (All Applications)
LAMPS SHIPPED
APPLICATIONS
74% 16%
TECHNOLOGIES
1%
MANUFACTUREDSINGLE-FAMILY MULTI-FAMILY
INSTALLED STOCK
INCANDESCENT, HALOGEN. CFL, LED T5, T8, T12, TLED
SOURCE: NEEA Residential Building Stock Assessment, 2011
SOURCE: BPA Residential Lighting Model
4
6 / HVAC Market Intelligence Report HVAC Market Intelligence Report / 7
6 7
,
3.2B SQ FT203,205 83,500 SQ FT
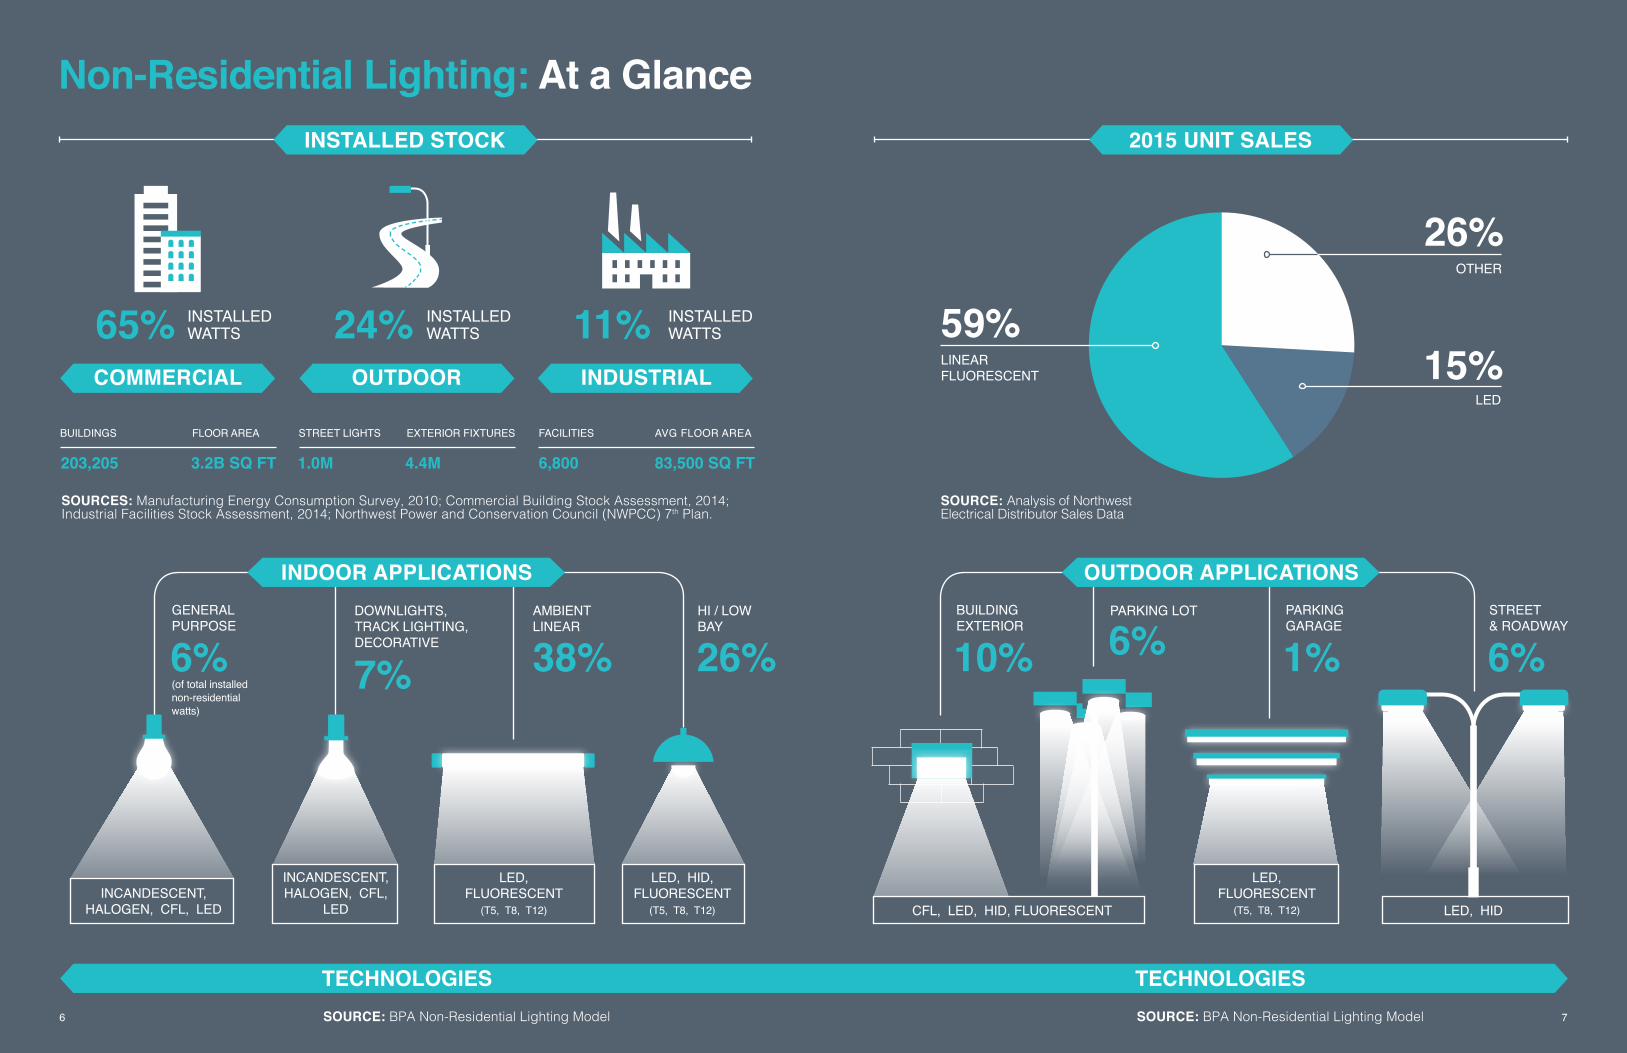
Non-Residential Lighting: At a Glance
6,8004.4M1.0M
65% 24%
26%
15%59%11%
BUILDINGS
GENERAL PURPOSE
INSTALLED WATTS
INSTALLED WATTS
INSTALLED WATTS
DOWNLIGHTS, TRACK LIGHTING, DECORATIVE
AMBIENT LINEAR
HI / LOW BAY
PARKING LOT
OTHER
LED
LINEAR FLUORESCENT
INCANDESCENT, HALOGEN, CFL, LED
INCANDESCENT, HALOGEN, CFL,
LED CFL, LED, HID, FLUORESCENT
LED, HID, FLUORESCENT
(T5, T8, T12)
LED, FLUORESCENT
(T5, T8, T12) LED, HID
LED, FLUORESCENT
(T5, T8, T12)
PARKING GARAGE
STREET & ROADWAY
BUILDING EXTERIOR
STREET LIGHTS EXTERIOR FIXTURES FACILITIES AVG FLOOR AREAFLOOR AREA
INDOOR APPLICATIONS OUTDOOR APPLICATIONS
INDUSTRIALCOMMERCIAL OUTDOOR
INSTALLED STOCK 2015 UNIT SALES
TECHNOLOGIES TECHNOLOGIESSOURCE: BPA Non-Residential Lighting ModelSOURCE: BPA Non-Residential Lighting Model6 7
SOURCES: Manufacturing Energy Consumption Survey, 2010; Commercial Building Stock Assessment, 2014; Industrial Facilities Stock Assessment, 2014; Northwest Power and Conservation Council (NWPCC) 7th Plan.
SOURCE: Analysis of Northwest Electrical Distributor Sales Data
6% 7% 38% 26% 10% 6% 1% 6%(of total installed non-residential watts)
8 / HVAC Market Intelligence Report HVAC Market Intelligence Report / 9
8 9
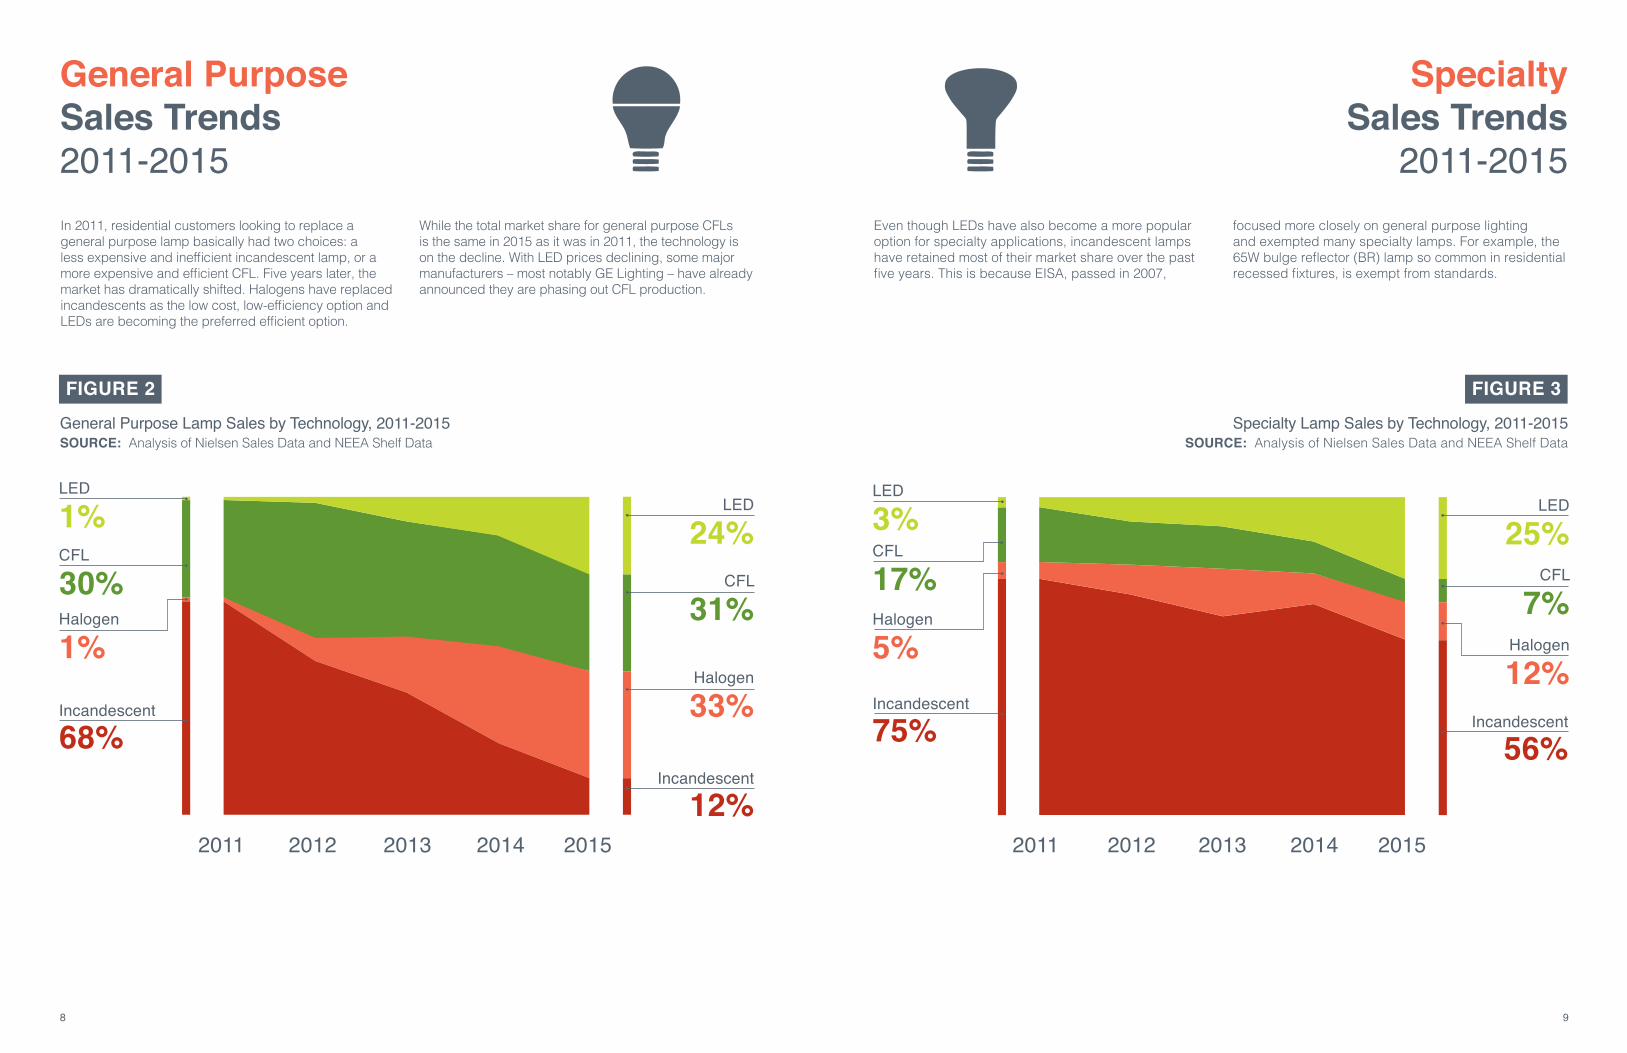
Even though LEDs have also become a more popular option for specialty applications, incandescent lamps have retained most of their market share over the past five years. This is because EISA, passed in 2007,
focused more closely on general purpose lightingand exempted many specialty lamps. For example, the 65W bulge reflector (BR) lamp so common in residential recessed fixtures, is exempt from standards.
In 2011, residential customers looking to replace a general purpose lamp basically had two choices: a less expensive and inefficient incandescent lamp, or a more expensive and efficient CFL. Five years later, the market has dramatically shifted. Halogens have replaced incandescents as the low cost, low-efficiency option and LEDs are becoming the preferred efficient option.
While the total market share for general purpose CFLs is the same in 2015 as it was in 2011, the technology is on the decline. With LED prices declining, some major manufacturers – most notably GE Lighting – have already announced they are phasing out CFL production.
FIGURE 2
General Purpose Sales Trends2011-2015
2011 2012 2013 2014 2015
Incandescent
Halogen
CFL
LED
12%
33%
31%
24%
SOURCE: Analysis of Nielsen Sales Data and NEEA Shelf Data
FIGURE 3
SOURCE: Analysis of Nielsen Sales Data and NEEA Shelf Data
2012 2013 20142011 2015
Specialty Sales Trends
2011-2015
Incandescent
Halogen
CFL
LED
56%
12%
7%
25%
Incandescent
Halogen
CFL
LED
75%
5%
17%
3%
Incandescent
Halogen
CFL
LED
68%
1%
30%
1%
General Purpose Lamp Sales by Technology, 2011-2015 Specialty Lamp Sales by Technology, 2011-2015

10 / HVAC Market Intelligence Report HVAC Market Intelligence Report / 11
10 11
Regional and RetailerVariation
FIGURE 4
SOURCE: Analysis of NEEA Shelf Data, 2015
Technology Mix Stocked at Major DIY Retailers
0% 20% 40% 60% 80% 100%
DIY
STO
RES
(n=3
5)
The Pacific Northwest is a composite of large urban centers and expansive rural areas. However, the region’s Do-It-Yourself (DIY) retailers stock a relatively homogenous mix of lamps on their shelves, regardless of location. A comparison of the share of each technology stocked at 35 randomly selected regional DIY retail locations clearly shows little store-by-store variation. The relative homogeneity of the technology mixes reflects that national retailers make stocking decisions at the corporate level.
Despite the variation of technologies stocked at hardware stores, there is a smaller impact on the overall lighting market because the small hardware channel accounts for less than 15% of total retail lamp sales.
All three of the primary retail lighting channels – mass merchandise, DIY, and small hardware – sell CFLs and LEDs. However, they sell ENERGY STAR qualified CFLs and LEDs – the seal of quality and long life – in varying amounts.
FIGURE 5
SOURCE: Analysis of NEEA Shelf Data, 2015
Technology Mix Stocked at Hardware Retailers
0% 20% 40% 60% 80% 100%
SMAL
L H
ARD
WAR
E ST
OR
ES (n
=18)
Incandescent Halogen CFL LED
Incandescent Halogen CFL LED
As shown in Figure 5, the small hardware retail channel exhibits significantly greater store-by-store variation. The variation in technology mixes across small hardware stores is likely due to multiple factors, including greater decentralized decision-making, catering to the specific interests of customers within a more limited geographic area, and less frequent utility program participation (these stores are often defined as hard-to-reach).
ENERGY STAR CFLs / LEDs
MASS MERCHANDISE
SMALL HARDWARE
DIY
Non-ENERGY STAR CFLs / LEDs
FIGURE 6
SOURCE: Analysis of NEEA Shelf Data, 2015
Share of General Purpose ENERGY STAR CFLs and LEDs by Store Type
81%72% 68%
19%28% 32%
12 / HVAC Market Intelligence Report HVAC Market Intelligence Report / 13
12 13
Then
Now
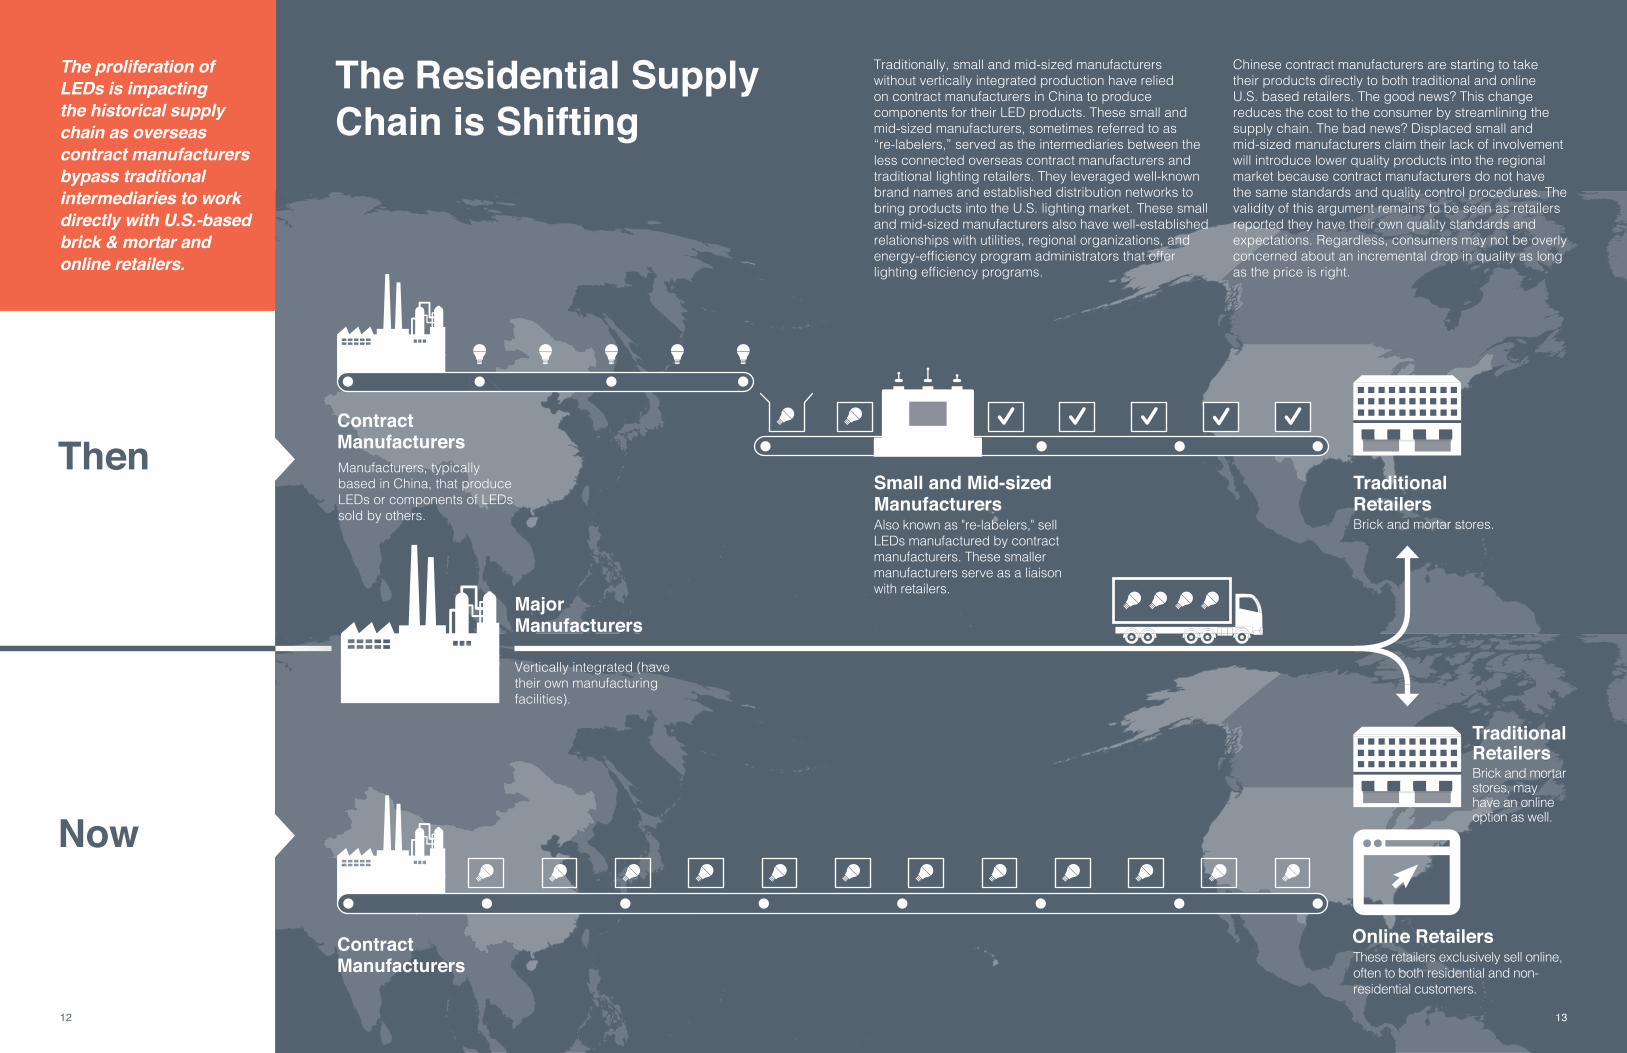
The Residential Supply Chain is Shifting
Contract Manufacturers
Contract Manufacturers
Small and Mid-sized Manufacturers
Traditional Retailers
Traditionally, small and mid-sized manufacturers without vertically integrated production have relied on contract manufacturers in China to produce components for their LED products. These small and mid-sized manufacturers, sometimes referred to as “re-labelers,” served as the intermediaries between the less connected overseas contract manufacturers and traditional lighting retailers. They leveraged well-known brand names and established distribution networks to bring products into the U.S. lighting market. These small and mid-sized manufacturers also have well-established relationships with utilities, regional organizations, and energy-efficiency program administrators that offer lighting efficiency programs.
Chinese contract manufacturers are starting to take their products directly to both traditional and online U.S. based retailers. The good news? This change reduces the cost to the consumer by streamlining the supply chain. The bad news? Displaced small and mid-sized manufacturers claim their lack of involvement will introduce lower quality products into the regional market because contract manufacturers do not have the same standards and quality control procedures. The validity of this argument remains to be seen as retailers reported they have their own quality standards and expectations. Regardless, consumers may not be overly concerned about an incremental drop in quality as long as the price is right.
The proliferation of LEDs is impacting the historical supply chain as overseas contract manufacturers bypass traditional intermediaries to work directly with U.S.-based brick & mortar and online retailers.
Traditional Retailers
Online Retailers
Also known as "re-labelers," sell LEDs manufactured by contract manufacturers. These smaller manufacturers serve as a liaison with retailers.
Brick and mortar stores.
Brick and mortar stores, may have an online option as well.
These retailers exclusively sell online, often to both residential and non-residential customers.
Major Manufacturers
Vertically integrated (have their own manufacturing facilities).
Manufacturers, typically based in China, that produce LEDs or components of LEDs sold by others.
13
14 / HVAC Market Intelligence Report HVAC Market Intelligence Report / 15
14 15
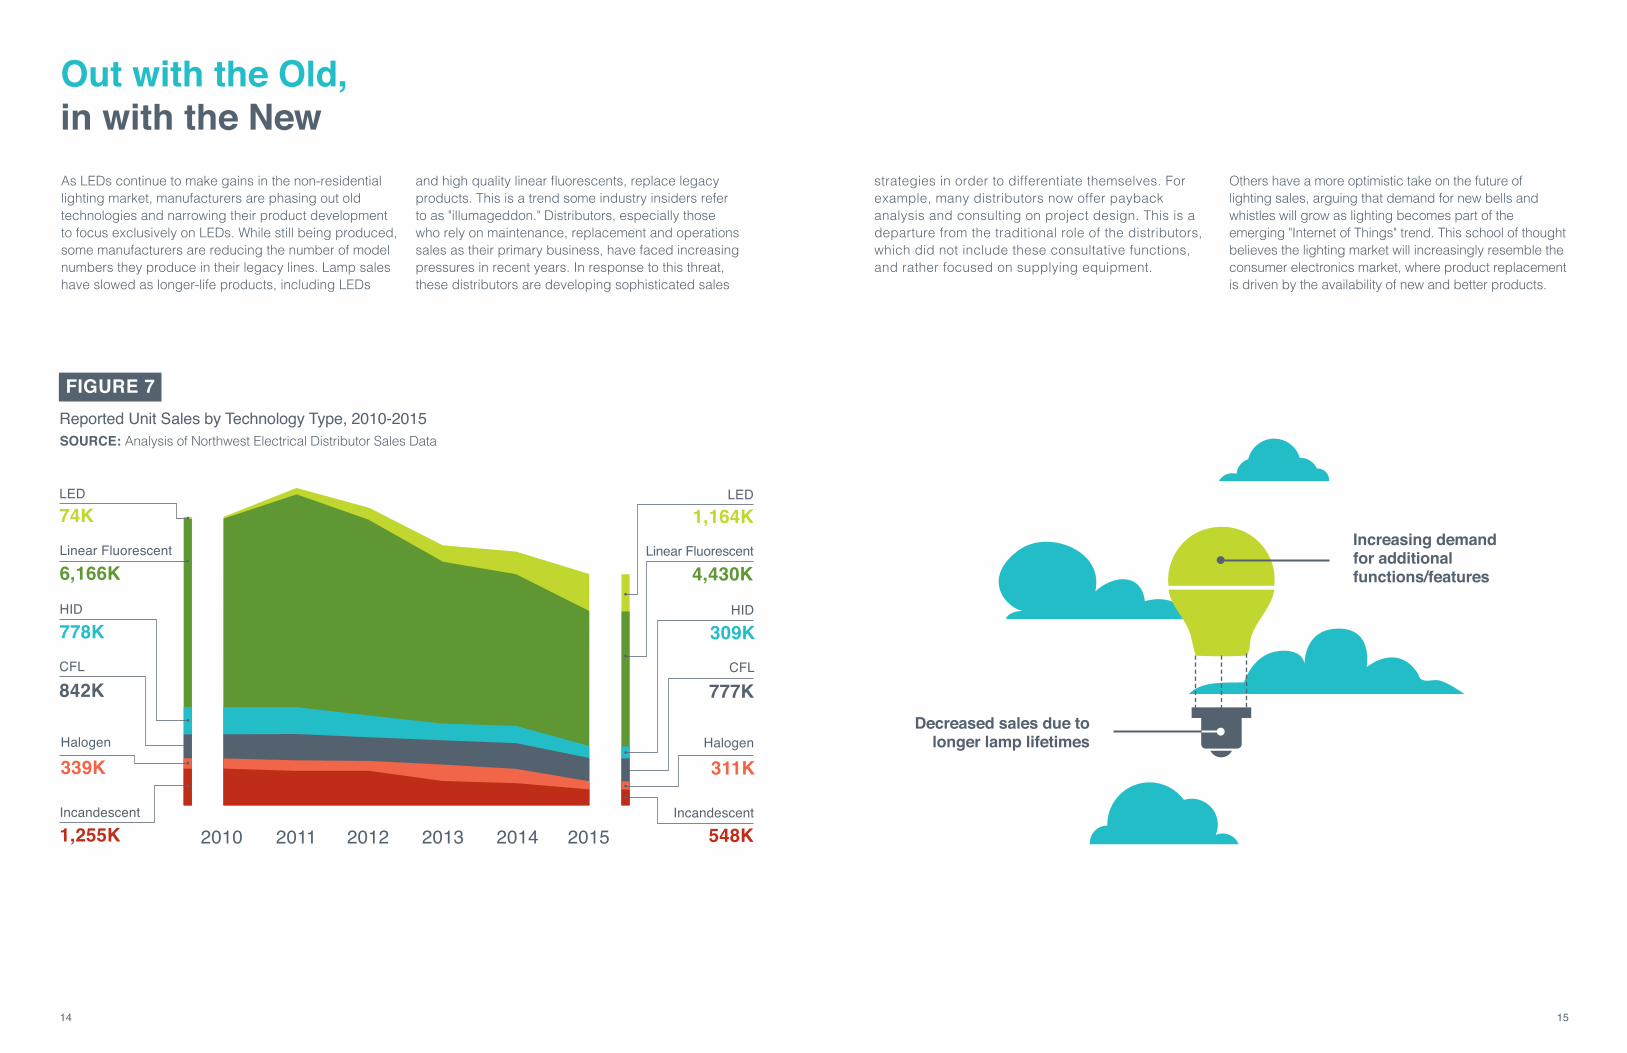
As LEDs continue to make gains in the non-residential lighting market, manufacturers are phasing out old technologies and narrowing their product development to focus exclusively on LEDs. While still being produced, some manufacturers are reducing the number of model numbers they produce in their legacy lines. Lamp sales have slowed as longer-life products, including LEDs
and high quality linear fluorescents, replace legacy products. This is a trend some industry insiders refer to as "illumageddon." Distributors, especially those who rely on maintenance, replacement and operations sales as their primary business, have faced increasing pressures in recent years. In response to this threat, these distributors are developing sophisticated sales
strategies in order to differentiate themselves. For example, many distributors now offer payback analysis and consulting on project design. This is a departure from the traditional role of the distributors, which did not include these consultative functions, and rather focused on supplying equipment.
Others have a more optimistic take on the future of lighting sales, arguing that demand for new bells and whistles will grow as lighting becomes part of the emerging "Internet of Things" trend. This school of thought believes the lighting market will increasingly resemble the consumer electronics market, where product replacement is driven by the availability of new and better products.
Out with the Old, in with the New
FIGURE 7
2010 2011 2012 2013 2014 2015
SOURCE: Analysis of Northwest Electrical Distributor Sales Data
CFL
777K
Halogen
311K
HID
309K
Incandescent
548K
LED1,164K
Linear Fluorescent
4,430K
CFL
842K
Halogen
339K
HID
778K
Incandescent
1,255K
LED74KLinear Fluorescent
6,166K
Reported Unit Sales by Technology Type, 2010-2015
Decreased sales due to longer lamp lifetimes
Increasing demand for additional functions/features

16 / HVAC Market Intelligence Report HVAC Market Intelligence Report / 17
16 17
Linear Fluorescent Lamps: Still #1
2010 2011 2012 2013 2014 2015
TLED
4FT T5
T8 Reduced Wattage
T8 800 Series
T8 700 Series
4FT T12
5%
11%
12%
54%
9%
6%
TLED
4FT T5
T8 Reduced Wattage
T8 800 Series
T8 700 Series
4FT T12
0%
9%
11%
38%
28%
14%
FIGURE 8
SOURCE: Analysis of Northwest Electrical Distributor Sales DataLinear Lamp Unit Sales, by Type 2010-2015
Linear fluorescent lamp sales make up two-thirds of non-residential lighting sales
YEAR 20112010 2012 2013 20152014
65%
FIGURE 9
SOURCE: Analysis of Northwest Electrical Distributor Sales Data
Linear Fluorescent Lamp Sales 2010-2015
6.2M
5.2M
7.0M
4.9M
6.3M
4.4M
Linear fluorescent lamps (LFLs) are ubiquitous, dominating commercial lighting from office buildings to grocery stores. They continue to represent the majority of lighting sales in the Northwest. In 2015, they made up 57% of distributors' reported sales in the region.
But the market for linear lamps is changing. As more and more long-lived products – including higher quality linear fluorescents and LEDs – take the place of legacy linear fluorescent lamps, LFL unit sales are decreasing. Reported sales in the Northwest decreased from 7 million in 2011 to less than 5 million
in 2015. While this does not represent the entire Northwest lighting market – only sales reported to the research team by distributors – it demonstrates a widely-reported trend of decreasing LFL sales.
Meanwhile, the mix of lamps within the linear category is also changing. The LFL market has shifted quite dramatically over the past five years, with the advent of the TLED and the decline of the 700-series T8. TLED sales, while still a small portion of total linear lamp sales, have grown dramatically since their introduction in 2013. In 2015, TLED sales nearly tripled 2014 levels.
Figure 7 shows total lighting unit sales by technology, demonstrating that despite a decrease in market share, linear fluorescents have persisted as the dominant technology. While linear fluorescent lamps have maintained dominance in terms of percent of unit sales, the number of linear fluorescent unit sales is swiftly decreasing (Figure 9).
4.4M
17
18 / HVAC Market Intelligence Report HVAC Market Intelligence Report / 19
18 19
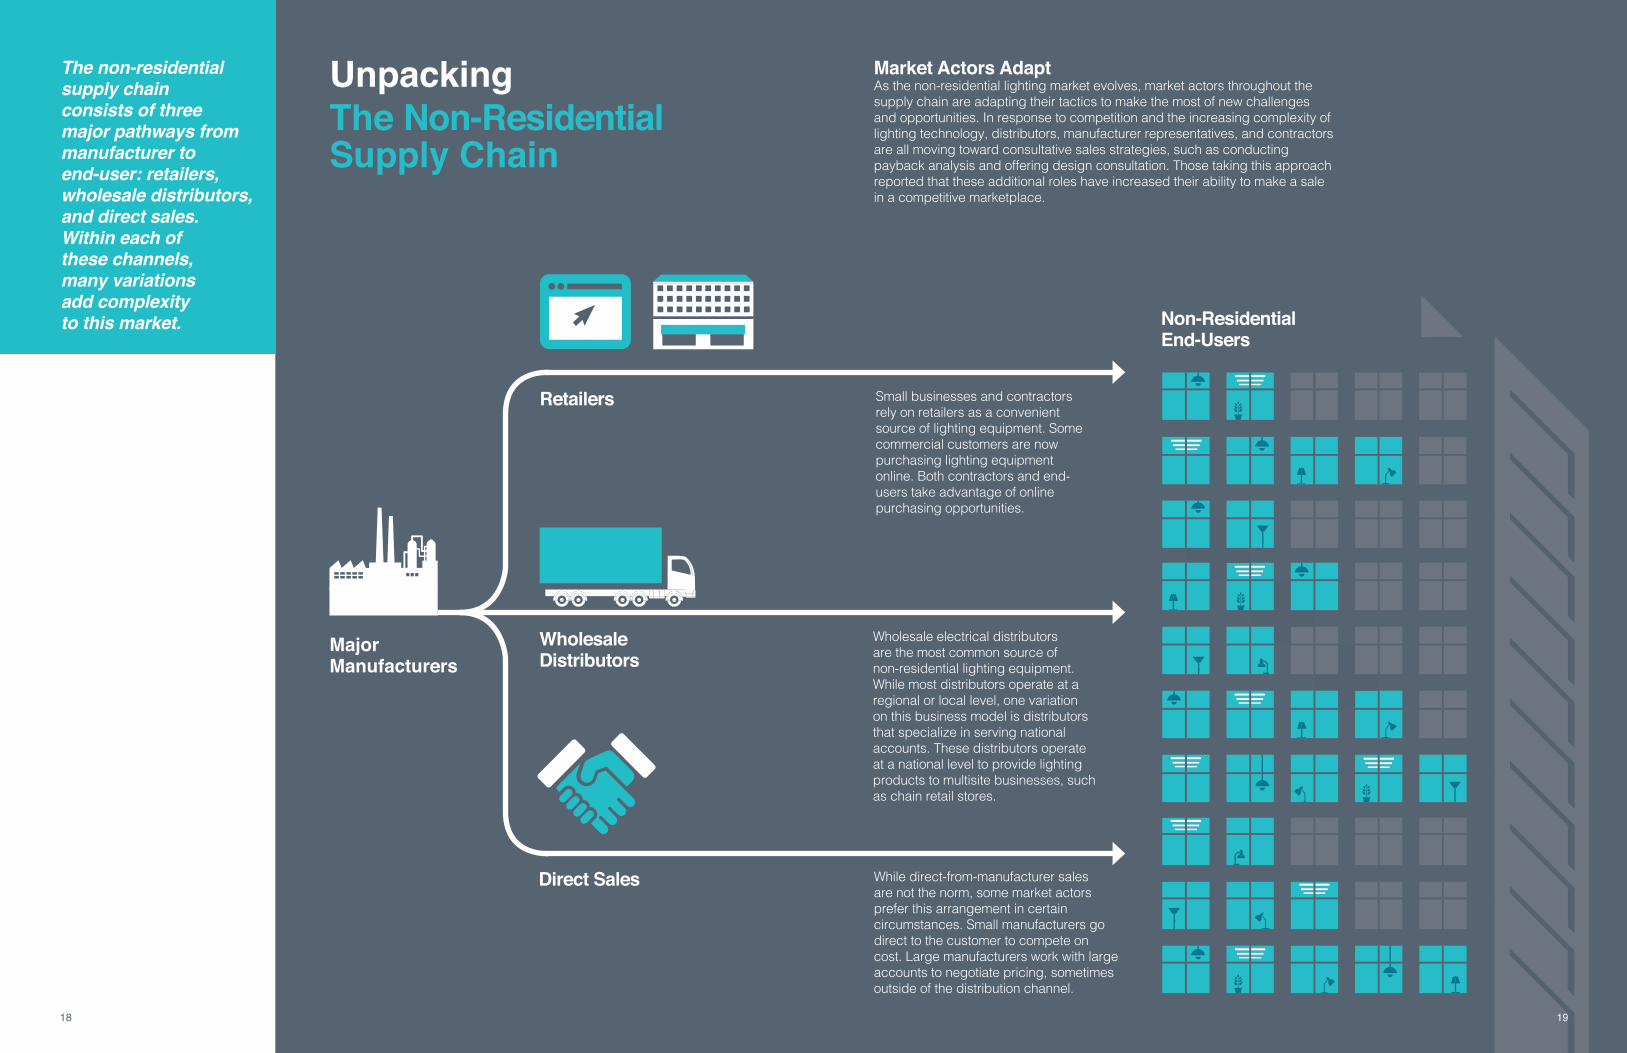
Unpacking The Non-Residential Supply Chain
The non-residential supply chain consists of three major pathways from manufacturer to end-user: retailers, wholesale distributors, and direct sales. Within each of these channels, many variations add complexity to this market.
Market Actors Adapt As the non-residential lighting market evolves, market actors throughout the supply chain are adapting their tactics to make the most of new challenges and opportunities. In response to competition and the increasing complexity of lighting technology, distributors, manufacturer representatives, and contractors are all moving toward consultative sales strategies, such as conducting payback analysis and offering design consultation. Those taking this approach reported that these additional roles have increased their ability to make a sale in a competitive marketplace.
Retailers
Wholesale Distributors
Non-Residential End-Users
Direct Sales
Major Manufacturers
19
Small businesses and contractors rely on retailers as a convenient source of lighting equipment. Some commercial customers are now purchasing lighting equipment online. Both contractors and end-users take advantage of online purchasing opportunities.
Wholesale electrical distributors are the most common source of non-residential lighting equipment. While most distributors operate at a regional or local level, one variation on this business model is distributors that specialize in serving national accounts. These distributors operate at a national level to provide lighting products to multisite businesses, such as chain retail stores.
While direct-from-manufacturer sales are not the norm, some market actors prefer this arrangement in certain circumstances. Small manufacturers go direct to the customer to compete on cost. Large manufacturers work with large accounts to negotiate pricing, sometimes outside of the distribution channel.
20 / HVAC Market Intelligence Report HVAC Market Intelligence Report / 21
20 21
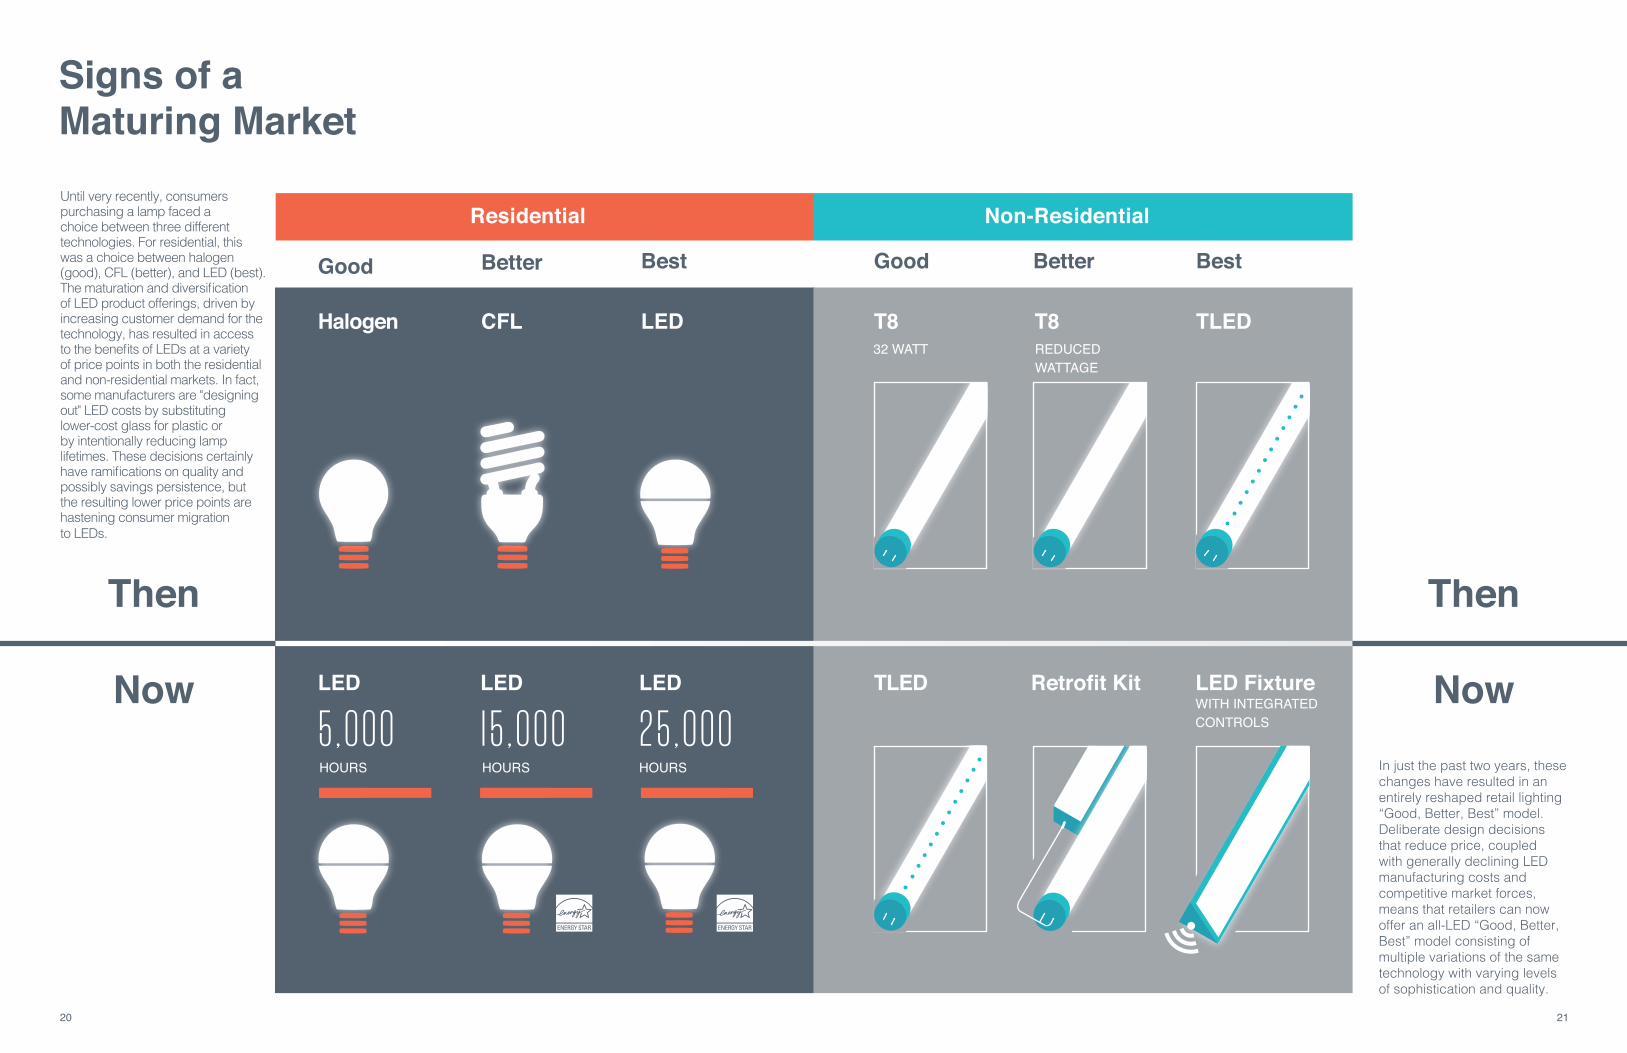
Signs of a Maturing Market
Until very recently, consumers purchasing a lamp faced a choice between three different technologies. For residential, this was a choice between halogen (good), CFL (better), and LED (best). The maturation and diversification of LED product offerings, driven by increasing customer demand for the technology, has resulted in access to the benefits of LEDs at a variety of price points in both the residential and non-residential markets. In fact, some manufacturers are "designing out" LED costs by substituting lower-cost glass for plastic or by intentionally reducing lamp lifetimes. These decisions certainly have ramifications on quality and possibly savings persistence, but the resulting lower price points are hastening consumer migration to LEDs.
Now
TLEDT8T8Halogen CFL LED
Then
Good GoodBetter BetterBest Best
REDUCED WATTAGE
32 WATT
In just the past two years, these changes have resulted in an entirely reshaped retail lighting “Good, Better, Best” model. Deliberate design decisions that reduce price, coupled with generally declining LED manufacturing costs and competitive market forces, means that retailers can now offer an all-LED “Good, Better, Best” model consisting of multiple variations of the same technology with varying levels of sophistication and quality.
Residential Non-Residential
Retrofit Kit LED Fixture
25,000LED TLEDLED LED
15,000HOURS
5,000HOURS HOURS
WITH INTEGRATED CONTROLS
Now
Then
22 / HVAC Market Intelligence Report HVAC Market Intelligence Report / 23
22 23
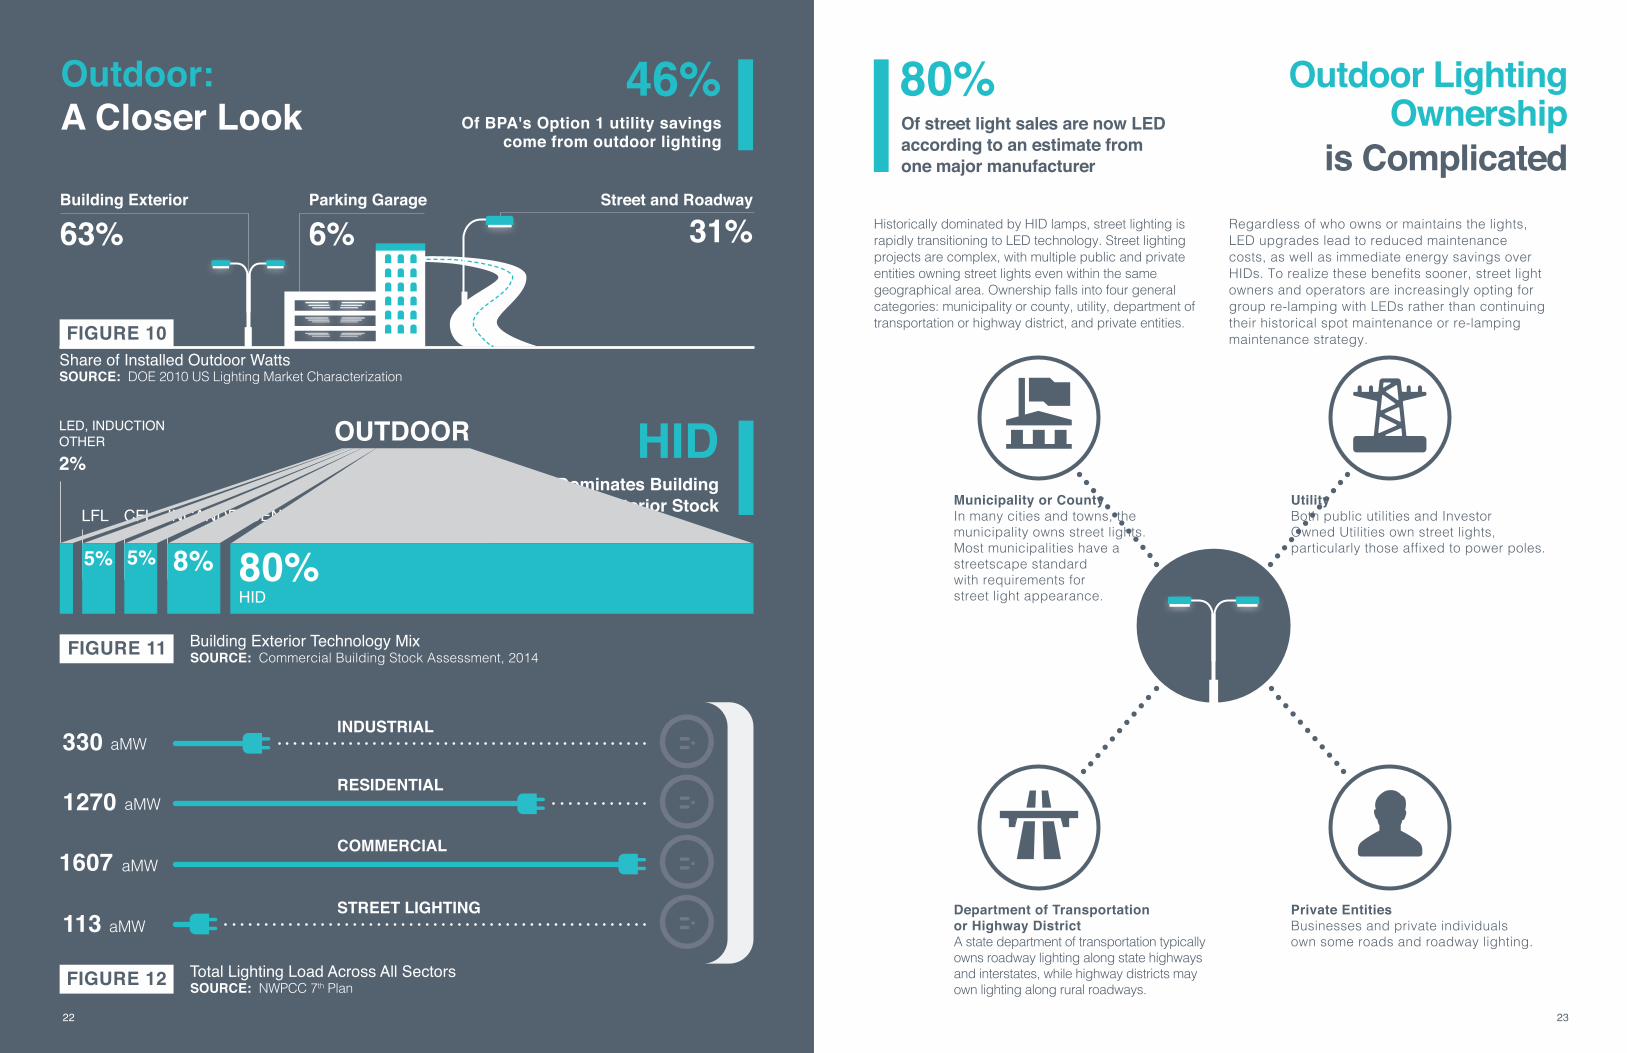
46% 80%
63% 31%6%
Of street light sales are now LED according to an estimate from one major manufacturer
Outdoor:A Closer Look
Outdoor Lighting Ownership
is ComplicatedBuilding Exterior Street and RoadwayParking Garage
Of BPA's Option 1 utility savings come from outdoor lighting
FIGURE 10
SOURCE: DOE 2010 US Lighting Market Characterization
Total Lighting Load Across All SectorsFIGURE 12 SOURCE: NWPCC 7th Plan
Municipality or County In many cities and towns, the municipality owns street lights. Most municipalities have a streetscape standardwith requirements for street light appearance.
Utility Both public utilities and Investor Owned Utilities own street lights, particularly those affixed to power poles.
Department of Transportation or Highway District A state department of transportation typically owns roadway lighting along state highways and interstates, while highway districts may own lighting along rural roadways.
Private Entities Businesses and private individuals own some roads and roadway lighting.
Historically dominated by HID lamps, street lighting is rapidly transitioning to LED technology. Street lighting projects are complex, with multiple public and private entities owning street lights even within the same geographical area. Ownership falls into four general categories: municipality or county, utility, department of transportation or highway district, and private entities.
Regardless of who owns or maintains the lights, LED upgrades lead to reduced maintenance costs, as well as immediate energy savings over HIDs. To realize these benefits sooner, street light owners and operators are increasingly opting for group re-lamping with LEDs rather than continuing their historical spot maintenance or re-lamping maintenance strategy.
Building Exterior Technology MixFIGURE 11 SOURCE: Commercial Building Stock Assessment, 2014
OUTDOOR
INCANDESCENTLFL CFL
LED, INDUCTIONOTHER2% HID
Dominates Building Exterior Stock
HID80%8%5% 5%
RESIDENTIAL
COMMERCIAL
INDUSTRIALaMW
aMW
aMW
aMWSTREET LIGHTING
330
113
1270
1607
22 7
Share of Installed Outdoor Watts
24 / HVAC Market Intelligence Report HVAC Market Intelligence Report / 25
24 25
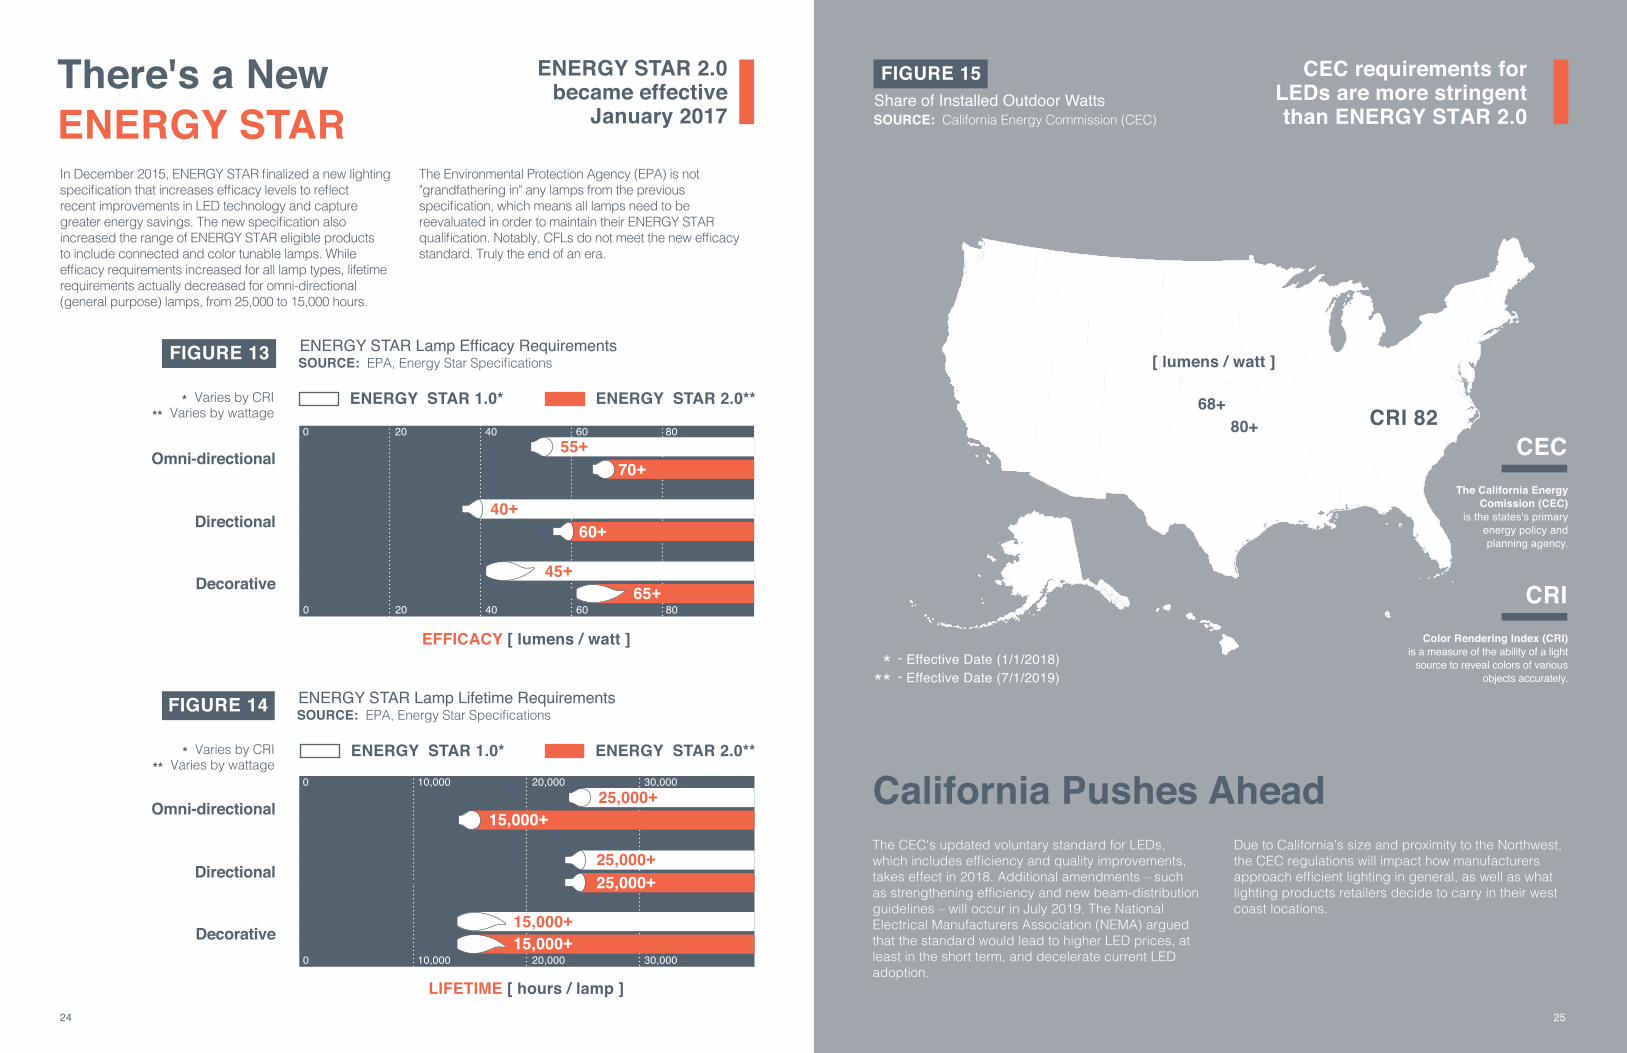
There's a New ENERGY STAR
Omni-directional
Omni-directional
Directional
Directional
Decorative
Decorative
ENERGY STAR 2.0**
ENERGY STAR 2.0
ENERGY STAR 1.0*
In December 2015, ENERGY STAR finalized a new lighting specification that increases efficacy levels to reflect recent improvements in LED technology and capture greater energy savings. The new specification also increased the range of ENERGY STAR eligible products to include connected and color tunable lamps. While efficacy requirements increased for all lamp types, lifetime requirements actually decreased for omni-directional (general purpose) lamps, from 25,000 to 15,000 hours.
The Environmental Protection Agency (EPA) is not "grandfathering in" any lamps from the previous specification, which means all lamps need to be reevaluated in order to maintain their ENERGY STAR qualification. Notably, CFLs do not meet the new efficacy standard. Truly the end of an era.While the EPA was updating the national ENERGY STAR specification, the California Energy Commission (CEC) established its own – even more stringent – state-specific lighting efficiency requirements. Given
EFFICACY [ lumens / watt ]
LIFETIME [ hours / lamp ]
CECThe California Energy
Comission (CEC) is the states's primary
energy policy and planning agency.
MIMIMUM OF
CRIColor Rendering Index (CRI)
is a measure of the ability of a light source to reveal colors of various
objects accurately.
CEC Tier 2**68+
80+
EFFICACY [ lumens / watt ]
CRI 82CEC Tier I*
ENERGY STAR 2.0 became effective
January 2017
ENERGY STAR 2.0**ENERGY STAR 1.0*
FIGURE 13 ENERGY STAR Lamp Efficacy RequirementsSOURCE: EPA, Energy Star Specifications
FIGURE 14 ENERGY STAR Lamp Lifetime RequirementsSOURCE: EPA, Energy Star Specifications
* Varies by CRI** Varies by wattage
* Varies by CRI** Varies by wattage
California Pushes Ahead
55+
40+
45+
70+
60+
65+
25,000+
25,000+25,000+
15,000+
15,000+15,000+
25
0
0
0
0
20
20
40
10,000
40
10,000
60
20,000
60
20,000
80
30,000
80
30,000
0 50 100 150+
FIGURE 15 CEC requirements forLEDs are more stringent than ENERGY STAR 2.0SOURCE: California Energy Commission (CEC)
Share of Installed Outdoor Watts
* - Effective Date (1/1/2018)
** - Effective Date (7/1/2019)
The CEC's updated voluntary standard for LEDs, which includes efficiency and quality improvements, takes effect in 2018. Additional amendments – such as strengthening efficiency and new beam-distribution guidelines – will occur in July 2019. The National Electrical Manufacturers Association (NEMA) argued that the standard would lead to higher LED prices, at least in the short term, and decelerate current LED adoption.
Due to California’s size and proximity to the Northwest, the CEC regulations will impact how manufacturers approach efficient lighting in general, as well as what lighting products retailers decide to carry in their west coast locations.

26 / HVAC Market Intelligence Report HVAC Market Intelligence Report / 27
26 27
As of January 1, 2020, newly manufactured 60W-equivalent bulbs must use 60% less power than current halogen lamps
More Changes are Coming – EISA 2020
Expansion of Scope
FIGURE 16
SOURCE: DOE, Energy Conservation Standards for General Service Lamps, Final Rule
The same EISA legislation that reshaped the residential lighting market between 2012 and 2014 (see Figures 2 and 3) also directed the DOE to revisit lighting standards by the end of 2016 and consider setting higher standards that would take effect in 2020. Commonly referred to as EISA 2020, this mandate contained an important backstop requirement: if the DOE did not further increase efficacy levels for general service lamps through a new rulemaking by the end of 2016, then the standards would automatically increase to 45 lumens per watt (lm/W) in 2020.
In February 2016, it seemed as though the DOE would set new standards between 70 and 105 lm/W, depending on the lamp’s lumen output. Such an efficacy level would have meant, for example, that a 60W incandescent equivalent could not consume more than 8.5W. Ultimately, however, the DOE opted not to adopt these or any new efficacy requirements. As a result, the 45 lm/W backstop
requirement included in the original EISA legislation—which equates to 18W for a traditional 60W incandescent lamp—will go into effect on January 1, 2020. However, the new administration and Congress may change or eliminate the backstop before it takes effect.
Though the backstop requirement sets a lower standard than what the DOE proposed in early 2016, the impact of the requirement on the market will likely be similar. This is because halogen lamps do not meet the requirement, and because several retailers and manufacturers have already decided to remove CFLs from their product lineups. As a result, LED lamps could be the only real option in the residential lighting market when the backstop requirement takes effect in 2020.
While the DOE decided not to issue higher efficacy standards in January 2017, it did expand the definition of general service lamps as part of the EISA 2020 rulemaking process. The revised definition subjects almost all previously exempted specialty lamps to efficiency standards. Many of these specialty lamps, particularly reflector and candelabra mini-base lamps, are common now, representing around 30% of the Pacific Northwest market.
This expanded definition also removes potential loopholes by discontinuing the exemption for rough service, shatter resistant, vibration service, and 3-way lamps. Only 15 specialty categories, such as appliance lamps, black lights, bug lights, and infrared lights, maintain exempted status.
All Signs Point to LED
Change in the wattage of 60W-equivalent incandescent lamps
Reflectorlamps
3-way lamps
Candelabra, Globe, and other niche base types
Rough service, vibration service, and shatter resistant
NOW COVERED STILL EXEMPT
71%
96% 4%
13%8%4%
FIGURE 17 New Coverage of Previously Exempt LampsSOURCE: EPA, Energy Star Specifications
60W43W
18WPRE-EISA EISA 2020
2014

28 / HVAC Market Intelligence Report HVAC Market Intelligence Report / 29
28 29
In 2018, new DOE efficiency standards for general service linear fluorescent lamps (GSFL) will take effect. The standards cover a dozen different GSFL product classes, but most of the lamps impacted are 4 ft 32W lamps, which represented 40% of all non-residential lighting sales in the Northwest in 2015. The impending standards will increase the efficacy requirement for GSFLs with a correlated color temperature (CCT) of ≤4,500 K by 3.8%. These lamps are the majority of GSFL sales as 3,500K and 4,100K are the two most common CCTs for linear fluorescent lamps. GSFLs that are >4,500 K and ≤7,000 K are also impacted by the updated standards, although the increase is more modest (0.8%).
FIGURE 19Certified Products that Currently Meet the 2018 GSFL StandardsSOURCE: DOE Compliance Certification Management System Database, 2016
2018 GSFL Standards
Efficient Products on the Rise
Meets 2018 GSFL Standards
25W 28W
32W
Does not Meet 2018 GSFL Standards
62%
38%
60%
40%
42%
58%
These standards will not have a dramatic effect on the market or manufacturers. In fact, approximately 40% of currently available 32W lamps already meet the standards. An even higher percentage – nearly two-thirds – of existing reduced wattage lamps (i.e., 25W or 28W LFLs) already meet the standards. Regardless, manufacturers have a clear path to bringing currently non-compliant 32W lamps into compliance without investing in research and development by increasing the concentration of rare-earth in the phosphor of the lamp.
With overall LFL sales decreasing, the standards are yet another reason for manufactures to continue focusing their attention and resources on TLEDs. Even modest increases in LFL prices, which will likely occur as a result of the standards, coupled with rapidly decreasing TLED prices, will make TLEDs an increasingly compelling option in the non-residential maintenance market.
FIGURE 184-Foot Medium Bi-pin GSFL Standards for Lamps ≤4,500KSOURCE: DOE 2015 Final Rule for GSFL Standards & July 2012 Standards for GSFL
The Design Lights Consortium, or DLC, maintains Qualified Product Lists that utilities rely on to vet lighting products for non-residential energy efficiency programs. Similar to the ENERGY STAR label for consumer products, the DLC label indicates that a product meets a set of specifications for quality and performance. In 2015, the DLC introduced a new classification for high-performance luminaires and retrofit kits: DLC Premium. To achieve the
DLC Premium classification, a product must meet more stringent requirements for efficacy as well as essential reliability measurements, such as lumen maintenance. The creation of DLC Premium leverages manufacturers’ desire to differentiate themselves in a maturing and increasingly saturated LED market. Figure 20 shows how the number of DLC qualified products has skyrocketed since 2010, and how the DLC Premium classification took off in its first year.
DLC Premium
0Minimum Efficacy
20182012
92.4
The impending standards are expected to have only a modest impact on the 4 ft T8 lighting market
29
92.489
[lumen / watt]
1K8K 12K
36K
72K
120K
2010 2011 2012 2013 2014 2015 2016
STANDARD
PREMIUM
DLC Qualifying Product Sales 2010-2016
FIGURE 20
SOURCE: DLC Qualified Products List
7K
28K

30 / HVAC Market Intelligence Report
30 31
A closer look at decorative and mini-base lamps shows just how dominant incandescent technology is in this category. As the incumbent technology, incandescent decorative and mini-base lamps have a narrow efficacy range, reflecting the standardized lamp options for incandescent (e.g. 25W, 40W) lamps. Decorative and mini-base CFLs and LEDs, on the other hand, fall anywhere from 40 to 90 lumens per watt.
The preponderance of incandescent lamps, coupled with their high wattages relative to LEDs, mean that mini-base and decorative lamps - second in saturation to only general purpose lamps - continue to present a savings opportunity for utility lighting programs.
More than half of the lamps sold in 2015 in the Pacific Northwest were inefficient (54%). While continuing current program market intervention strategies resulting in CFL or LED sales result in short-term savings, the EISA 2020 backstop requirement means it will be illegal to manufacture most incandescent and halogen lamps beginning in in 2020. In other words, federal lighting standards will ensure the technological transition to more efficient lighting happens in the medium-term with or without programmatic intervention.
Planning for the Future: Residential
Decorative and Mini-Base: A Closer Look
Catalyzing HVAC Market Change: Investing for Maximum Impact / 31
FIGURE 22Decorative and Mini-Base Lamps Sold by Technology and EfficacySOURCE: Analysis of Nielsen Sales Data and NEEA Shelf Data, 2015
AVERAGE EFFICACY23W
0
1.0M
1.2M
0.8M
0.6M
0.4M
0.2M
5 4525 65 9510 5030 70 10015 55 8535 75 10520 60 9040 80
EFFICACY [lumens / watt]
LED
INCANDESCENT
CFL
HALOGEN
However, the legislation, including the expanded general service lamps definition, will be subject to review by the new administration and Congress. It is also possible that manufacturers will litigate the ruling, although many have already retooled their operations to focus on producing LEDs and may not be interested in changing course regardless of what becomes of the current EISA 2020 legislation.Programs will need to be nimble in their planning over the next few years to react to legislative and market changes and capitalize on any remaining efficiency gaps.
FIGURE 21Remaining Inefficient Share By ApplicationSOURCE: Analysis of Nielsen Sales data and NEEA Shelf Data, 2015
Inefficient
General PurposeDecorative + Mini-BaseReflectorsGlobe3-
WAY
Efficient54%
27%11%9%5%2%
46%
HALOGEN
INCANDESCENT
88%
32 / HVAC Market Intelligence Report HVAC Market Intelligence Report / 33
32 33
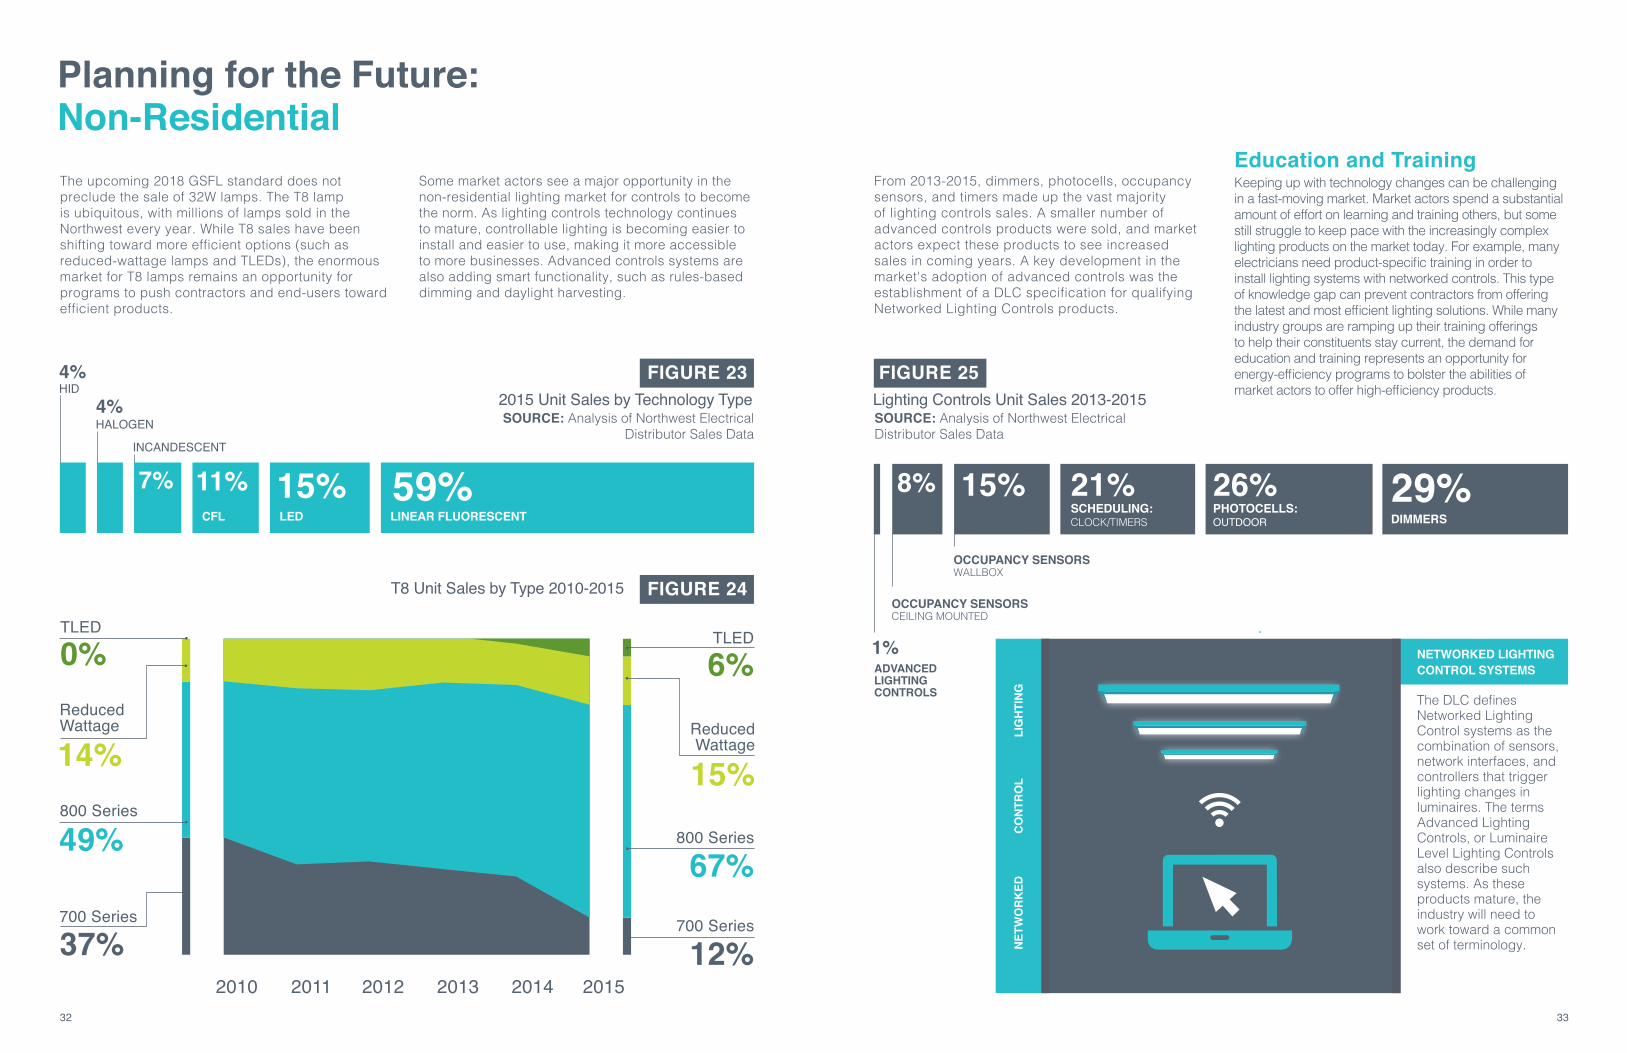
The upcoming 2018 GSFL standard does not preclude the sale of 32W lamps. The T8 lamp is ubiquitous, with millions of lamps sold in the Northwest every year. While T8 sales have been shifting toward more efficient options (such as reduced-wattage lamps and TLEDs), the enormous market for T8 lamps remains an opportunity for programs to push contractors and end-users toward efficient products.
Some market actors see a major opportunity in the non-residential lighting market for controls to become the norm. As lighting controls technology continues to mature, controllable lighting is becoming easier to install and easier to use, making it more accessible to more businesses. Advanced controls systems are also adding smart functionality, such as rules-based dimming and daylight harvesting.
PHOTOCELLS: OUTDOOR
SCHEDULING: CLOCK/TIMERS
ADVANCED LIGHTING CONTROLS
NETW
ORK
EDCO
NTRO
LLI
GHT
ING
OCCUPANCY SENSORSCEILING MOUNTED
OCCUPANCY SENSORSWALLBOX
DIMMERS
26% 29%21%15%8%
1%
Lighting Controls Unit Sales 2013-2015FIGURE 25
SOURCE: Analysis of Northwest Electrical Distributor Sales Data
2010 2011 2012 2013 2014 2015
FIGURE 24
TLED
Reduced Wattage
Reduced Wattage
800 Series800 Series
700 Series
6%
15%
67%
12%700 Series
14%
49%
37%
LINEAR FLUORESCENTLEDCFL
HID
HALOGEN
INCANDESCENT
59%15%11%7%
4%
4% FIGURE 232015 Unit Sales by Technology Type
T8 Unit Sales by Type 2010-2015
TLED
0%
SOURCE: Analysis of Northwest Electrical Distributor Sales Data
From 2013-2015, dimmers, photocells, occupancy sensors, and timers made up the vast majority of lighting controls sales. A smaller number of advanced controls products were sold, and market actors expect these products to see increased sales in coming years. A key development in the market's adoption of advanced controls was the establishment of a DLC specification for qualifying Networked Lighting Controls products.
Education and TrainingKeeping up with technology changes can be challenging in a fast-moving market. Market actors spend a substantial amount of effort on learning and training others, but some still struggle to keep pace with the increasingly complex lighting products on the market today. For example, many electricians need product-specific training in order to install lighting systems with networked controls. This type of knowledge gap can prevent contractors from offering the latest and most efficient lighting solutions. While many industry groups are ramping up their training offerings to help their constituents stay current, the demand for education and training represents an opportunity for energy-efficiency programs to bolster the abilities of market actors to offer high-efficiency products.
Planning for the Future: Non-Residential
NETWORKED LIGHTING CONTROL SYSTEMS
The DLC defines Networked Lighting Control systems as the combination of sensors, network interfaces, and controllers that trigger lighting changes in luminaires. The terms Advanced Lighting Controls, or Luminaire Level Lighting Controls also describe such systems. As these products mature, the industry will need to work toward a common set of terminology.

34 / HVAC Market Intelligence Report
34 35
Catalyzing HVAC Market Change: Investing for Maximum Impact / 35
Acknowledgments References
BPA would like to recognize the following people who provided their expertise, insights and support:
Northwest Energy Efficiency AllianceElaine MillerRyan BrownAmy Webb-CabreraKathryn Bae Debbie Driscoll
Evergreen Consulting Dave BackenEric WilsonNick Jones Andy Gerde Jeff Anderson Mike Hughes
Utility Program ManagersRoger Peery, Tacoma PowerShelley Martin, Idaho PowerZach Bates, Puget Sound EnergySheri Miller, Snohomish County Public Utility District
Northwest Power & Conservation CouncilCharlie GristTina Jayaweera
Regional Technical ForumJennifer LightRyan FirestoneChristian Douglass
Bonneville Power AdministrationJohn WilsonRyan LeBaronSarah MooreDave MurphyJennifer Driskill
The following individuals contributed to the creation of this report: NavigantLaura TaborAriel EspositoJames MilfordJulie Penning
CadeoDoug Bruchs Rob Carmichael Fiona Skinner Kate Bushman
ArtisanAndriy Nemchenko Bonneville Power AdministrationJessica AionaCarrie CobbEthan Manthey
2011 Residential Building Stock Assessment NEEA, September 18, 2012.
2014 Commercial Building Stock Assessment NEEA, December 16, 2014.
2014 Industrial Facilities Stock Assessment NEEA, December 29, 2014.
BPA Residential Lighting Model
BPA Non-Residential Lighting Model (DRAFT)
2011-2016 NEEA Shelf Stocking Data
2011-2015 Lighting Sales Data provided by Nielsen.
Annual Lighting Survey of Northwest Electrical Distributors, 2015. BPA and NEEA, September 2016.
ENERGY STAR Lamps Specifications Environmental Protection Agency, https://www.energystar.gov/products/spec/lamps_specification_version_1_0_pd.
California Energy Commission News Release January 2016, http://www.energy.ca.gov/releases/2016_releases/2016-01-27_adoption_of_lighting_standards_nr.html.
Energy Conservation Standards for General Service Lamps Notice of Proposed Rulemaking U.S. Department of Energy, February 2016.
Energy Conservation Standards for General Service Lamps Final Rule U.S. Department of Energy, January 2017.
Compliance Certification Management System Database U.S. Department of Energy. https://www.regulations.doe.gov/ccms.
Qualified Products List Design Lights Consortium, 2010-2016.
Manufacturing Energy Consumption Survey U.S. Energy Information Administration, 2010.
7th Plan Supply Curve Files Northwest Power and Conservation Council.
Lighting Market Characterization U.S. Department of Energy, 2010.
Final Rule for General Service Fluorescent Lamps and Incandescent Reflector Lamps U.S. Department of Energy, https://www.regulations.gov/document?D=EERE-2011-BT-STD-0006-0067.
.

Developed for the Bonneville Power Administration, www.bpa.gov Please refer questions to Jessica Aiona, Project Manager, [email protected], 503-230-3601
DOE/BP-4790 • February 2017