Embed Size (px)
Citation preview

1
BONITO WATERSHED PROJECT
HYDROLOGY AND SOILS SPECIALIST REPORT
Smokey Bear Ranger District, Lincoln National Forest
Lincoln County, New Mexico
Mike McConnell, Forest Hydrologist
Bob Dancker, Soils Scientist
May 2009
INTRODUCTION
This report is an analysis of existing conditions and effects related to hydrology and soils
in the major portion of the Upper Rio Bonito watershed and parts of Middle Rio Bonito
and Magado watersheds. This report will summarize information about soils and
hydrologic conditions along with with effects analysis on alternatives as they relate to the
planned upcoming Bonito Watershed Project on the Lincoln National.
The Bonito Watershed Project is a planned hazardous fuels reduction project covering
28,488 acres across three 6th
level Hydrologic Unit Code (HUC) watersheds, the Upper
Rio Bonito (HUC #130600080201), Middle Rio Bonito (#130600080207) and Magado
Canyon (#130600080202). These smaller watersheds are part of the larger 5th
level HUC
Rio Bonito watershed (189,455 acres). The 28,488 acre (44.5 mi2) Bonito project area
lies in the upper portion of the Rio Bonito watershed with the majority of the project
above Lake Bonito or the Upper Rio Bonito watershed which includes the 16,029 acres
of the White Mountain Wilderness. Mechanized travel is not allowed in the White
Mountain Wilderness and there are no roads there. Roads in the non-wilderness area are
primarily the Class 1, 2 and 3 roads. The majority of the Bonito project lies within the
Upper Rio Bonito watershed (25,847 acres or 40.39 mi2) where 82 percent of it (21,254
acres or 33.2 mi2) feeds into Bonito Lake.
The Upper Rio Bonito watershed serves as the municipal supply watershed for Holloman
Air Force Base, the City of Alamogordo and the towns of Nogal, Carrizozo, and Fort
Stanton where Lake Bonito is located.
Purpose and Need
The project goal is to improve forest health and reduce the threat of catastrophic wildfire
through strategies that utilize ecosystem restoration principles, best available science, and
technical expertise of interdisciplinary team.
2
1. Existing Condition
Climate
Climate data was derived from NOAA’s “Precipitation-Frequency Atlas of the United
States” and Western Regional Climate Center. The nearest climate data center near the
project area would be Ruidoso (elevation approximately at 6920 feet) located 7 miles to
the south with similar elevation level as the lower end of the Bonito project area which
starts at 7000 feet. The upper end of the Rio Bonito watershed rises to an elevation of
11,300 feet, an elevation gain of over 4,000 feet.
Ruidoso’s average annual rainfall for Ruidoso is 21.5 inches. Annual rainfall runoff is
approximately 2.5 inches. A 2-year rainfall return interval (50% chance of occurring in a
given year) produces a 1.1 inch/hour rainfall intensity storm for the Ruidoso area.
Precipitation occurs primarily as high intensity short duration summer thunderstorms and
winter snowfall. Summer season is regarded as the wet season (monsoon) with most of
its precipitation occurring from June to August with moisture coming off from the Gulf
of Mexico from the southeast direction. Average annual precipitation varies from about
32 inches at the highest elevations and near 20 inches near Angus. Spring and fall are the
driest season is typically when most wildfires occur on the forest. Winter precipitation
falls as mostly in the frozen form and Ruidoso gets about 39 inches of snowfall a year.
Snow accumulation is most significant in the upper headwater portions and ridges with
annual snowfall anywhere between 70 to 90 inches. Temperatures vary from 70s - 90s
degree Fahrenheit in the summer to sub-zero levels in the winter. Strong southwesterly
winds prevail during the spring and early summer
Perennial streams
There are approximately 26.5 miles of perennial streams throughout the Bonito planning
area on Forest Service lands only. For the entire Upper Rio Bonito watershed, which
includes the planning area, White Mountain Wilderness and non-Forest Service lands,
there are approximately 31 miles of perennial streams. Kraut Canyon, Philadelphia
Canyon, and the South Fork Rio Bonito all flow into the Rio Bonito creek. Philadelphia
Canyon is located below the Bonito Lake reservoir and is tributary to the Rio Bonito.
Most major streams are mostly perennial with some having perennial-interrupted stream
characteristics either due to geology or limited moisture (or both). Kraut canyon is mostly
an intermittent channel. The main stem of Rio Bonito Creek within the Bonito watershed
above the reservoir is approximately 9.1 miles. Below the reservoir the creek becomes
the Rio Bonito and flows some 2.5 miles where it meets the tributary channel
Philadelphia creek outside of the Bonito watershed.
Flood plains
Identified areas of flood plain areas are mostly located along stream reaches of the main
stem of the Rio Bonito above the reservoir due to its lower gradient and depositional
alluvial and colluvial soils consisting of gravel, sand, silt, and clay. These “active” flood
3
plains may flood approximately at least once every 20 years (i.e. 5 year storm) along
some stretches of the stream channels where flood plain terraces can be seen. Along these
areas have the most recreational use due to convenient nearby access to streams (e.g. road
crossings and camp grounds) and nearby popular hiking trails. As a result, some of these
areas are currently eroded although light and continue to contribute sediment into the Rio
Bonito which ends up in the Bonito Reservoir
Stream Type (Rosgen)
Rosgen Classification stream type varies from A1 in the upper reaches of the headwaters
to B4 the project area. In the upper elevation stream channels are fairly straight
containing bedrock and large boulders. In the lower elevation channels become more
sinuous and progress to a B4 or B5 Rosgen channel type containing more gravel and sand
with less cobble. Stream channels containing boulder or bedrock components contribute
greatly to channel structure and stability.
Riparian areas
Data on riparian vegetation comes from on-the-ground observations, survey team photo
monitoring efforts, infra-red aerial photo interpretation, corporate GIS database layers,
and the Land Resource Management Plan for the Lincoln National Forest (Forest Plan).
Direction for managing riparian areas on the Forest is found in the Forest Service Manual
2526 (USDA 2000), and the Forest Plan (USDA 1986).
Much of the entire stream channels within the project boundary are identified as having
riparian features or the potential to contain riparian features based on 1982 infrared aerial
photos. Photos showed riparian and potential riparian areas that are dependent on
moisture availability to maintain their ecosystem. These riparian features are seen mostly
along perennial water sources.
Most of the riparian areas along stream channels exist anywhere from a few feet to small,
open valley-like areas where the water table is near the surface conducive for riparian
plant species growth. Riparian areas are delineable areas as distinct riparian ecosystems
separate from the upper terrestrial ecosystem. Riparian features are identified by certain
soil characteristics and distinctive vegetative communities that have access to free and
unbound water. Healthy riparian zones along stream banks help stabilize stream channels
against unnecessary erosion, provide sediment storage, source of nutrient sinks, shades
water to help control water temperature, reduce “flashy” flows, and improve water
quality.
In a July 2007 field survey three team members collected riparian data at numerous
locations on tributary streams that enter the main stem of the Rio Bonito creek. A total of
10 separate stream drainages were surveyed over a total of 24 miles to document existing
riparian conditions along 292 transects or 12.2 transects per mile. Several hundred photos
were taken along with riparian and morphological data, and amount of large woody
debris with logs 20 inches or greater in diameter to help determine general riparian health
4
in 10 major drainages (Tanbark, Big Bear, Little Bear, Anan, Turkey, George
Washington, Iron, Littleton, Philadelphia, and Argentina Canyon). The current overall
health of existing riparian corridors is satisfactory with some areas experiencing minor
impact from sedimentation from gravel or dirt roads or at crossing locations.
Lakes or Open Body of Water
Bonito Lake is the only open body of water within the project boundary of the Upper Rio
Bonito watershed. It is a 44 acre lake (surface area at average storage) and serves as a
municipal water supply for the City of Alamogordo, Holloman Air Force Base, Fort
Stanton, Eagle Creek, Nogal Canyon, and Carrizozo. This reservoir is located on private
land within the Lincoln National Forest boundary and was first built in 1931. It’s
drainage area is 21,254 acres.
Water from Bonito Lake is superior in chemical quality at 300 mg/L TDS where water is
mixed with the spring and ground water at the La Luz’ Water Treatment Plant to increase
the overall water supply and improve water quality.
There is a relatively unknown volume of sediment settled at the bottom of the reservoir
over the past 78 years and that no dredging of sediment ever took place. Although in
1992 the City of Alamogordo Engineering Department explored a dredging possibility
and estimated that 400,000 cubic yards of sediment material have been deposited since
1961 from several major storm events resulting in a 25% decrease in volume capacity (80
million gallons) of water for the reservoir. The figure was obtained after taking partial
measurements of the lake bottom and compared to the original lake topography map.
These measurements were based on preliminary soundings of the lake bottom in various
places.
This would mean on average of about 13,000 cubic yards of sediment material (about
1,300 truckloads) is deposited annually on the lake bottom. This number may be large
and it is only expressed by taking into consideration large storm events that may take
place once every 5 or 10 years pushing large amount of sediment materials downstream.
To date the estimated amount of sediment material at the bottom of the lake could be an
additional 200,000 cubic yards of sediment materials totaling to about perhaps 600,000
cubic yards. This would be an equivalent of a 1 ½ acre plot filled with sediment 420 feet
high. But the stored sediment may contain measurable heavy metals such as mercury,
arsenic, lead, and cadmium along with trace metals such as zinc, iron, gold and silver that
may have been leached from surrounding abandoned mining areas that began in the late
1800s to early 1900s. Today, there may include traces of cyanide (which was used as part
of the leaching process to extract valuable metals from crushed ore) deposited at the lake
bottom from past mining activities from the late 1800s to early 1900s in residual amount
into surrounding areas. Minor leaching of metals into surrounding streams and into
Bonito Lake well after the dam was built in 1930 may be presently occurring. Although
there has been no chemical analysis of the lake bottom sediment to determine the amount
of trace metals and chemicals currently.
5
Wetlands
Wetlands found are usually small (<150 ft2), few in numbers and are sometimes seen
along trails where an active seep or spring feeds it year round with small patches of grass
sedges or rushes growing out of hydric soils, and in some instances cattails may be found.
They are usually found deeper in the forest of White Mountain Wilderness in the upper
elevation areas.
Wild and Scenic River
The South Fork Bonito creek (5.7 miles) has been selected as an eligible stream for
designation as a “Wild and Scenic River” suitable to be considered by Congress for the
National Wild and Scenic River System. No designation by Congress for this creek as a
“Wild and Scenic River” as of March 2009.
Impaired water bodies
In New Mexico Environment Department’s “2008 – 2010 Integrated Clean Water Act
303(d)/305(b) Report” on impaired water bodies (Category 5) there were streams or open
bodies of water found within the Bonito project area that were identified in the report.
Rio Bonito:
From highway NM 48 near Angus to the headwaters of the Rio Bonito watershed the
stream is currently categorized (under “IR Category”) as “5/5C.” The “5C” is defined as
“water bodies that are suspected of being impaired due solely to natural causes, but lack
sufficient data to make this determination.”
(Note: This IR Category rating is for a particular stream reach below the Bonito reservoir
dam whose rating is believed to be the result of low flow alteration.)
Probable Causes of Impairment for Rio Bonito.
Benthic-Macroinvertebrate Bioassessments (streams)
Fecal Coliform
Low flow alterations
South Fork Rio Bonito:
IR Category: 2 (Attaining some of the designated or existing uses based on numeric and
narrative parameters that were tested, and no reliable monitored data is available to
determine if the remaining uses are attained or threatened.)
Bonito Lake:
IR Category: 1 (Attaining the water quality standards for all designated and existing uses)
Geology
The mountains contain tertiary-aged volcanic rocks, Sierra Blanca Volcanics, generally
consist of andesite, rhyolite, trachyte, monzonite, syenite, diorite and latite. The Sierra
Blanca Volcanics overlay sedimentary rocks of Cretaceous age and younger. Large
6
intruding stocks, dikes and sills of basaltic andesite flows can be seen throughout the
Upper Rio Bonito watershed. Outcrop of dioritic facies along the eastern end of Bonito
Lake. The Bonito Lake stock outcrops of altered basaltic andesite with occasional
mononite dikes and sills can be easily seen near the dam spillway area.
The Sierra Blanca Volcanics also contain monzonite, porphyry with some andesite flows
and tuffs. The ore in the area occurs as lodes or stringers in the porphyry and in some
veins of the andesite. Mineralized veins consist of simple fissure fillings of calcite,
dolomite, and quartz. The chief ore product for mining has been gold along with some
silver, lead and copper.
Mines
There are many abandoned mines within the project area. Many of them are small,
insignificant with adits that have long since caved in or buried. Some of these were
probably exploratory mines or failed mine attempts (e.g. adits abandoned due to seeping
water) where exposed adits and shafts can still be seen. Several of these mines are located
away from stream channels and off of the main trails. The more notable mines are few in
numbers and may require closer inspection. Most of these mines were once operational
from the late 1800s to early 1900s and became largely abandoned sometime around the
1920s such as the well known Parson’s Mine in Tanbark Canyon where gold was once
mined from a breccia pipe during the early 1900s.
The project area is partially within the Nogal Mining District and some historic mines are
located in within the Upper Rio Bonito watershed. Mines like Great Western Mines sits
at the top of the Dark Betsy Canyon drainage to the southwest above Bonito Lake. Bear
Skull mine near Skull Canyon which is tributary to Tanbark Canyon, George Washington
mine, Anan Mine on Anan Creek (tributary to Iron Canyon which is tributary to Kraut
Canyon that flows into the north end of Bonito Lake) whose adit is visibly exposed which
poses a safety hazard for recreational users who may discover this. Silver Spoon Mine
(inside of White Mountain Wilderness adjacent to Rio Bonito creek) whose adit has
caved in with materials but still obviously poses some potential safety hazards to curious
recreational users. The few adits that are currently exposed may pose some safety hazards
to recreational users who may want to come closer.
Roads
Approximately 31.7 miles of “existing roads” that lie within the Bonito project boundary
of 12,458 acres (non-Wilderness only). Most of the roads identified are restricted to
vehicle use and are identified as Class 1 or 2 roads (unimproved roads). Approximately
17 miles of roads are Class 1 roads, 8.3 miles of Class 2 roads and 4 miles of Class 3
roads all using native surface materials that may be contributing source of sedimentation
during rainfall runoff events. A good number of these roads run alongside near stream
channels. There are also 2. 4 miles of class 4 and 5 roads with bituminous surface
treatment and are mostly located on the eastern end of the project area.

7
Current road density value for the Upper Rio Bonito watershed is 1.18 mi/mi2 which
includes the White Mountain wilderness though it contains no roads which gives the
Upper Rio Bonito a lower road density value. Magado Canyon has a road density of 2.46
mi/mi2. And Middle Rio Bonito with a road density value of 1.44 mi/mi
2.
Native surface roads account for many of the sediment movements in watersheds because
they are a link between sediment source areas and stream channels. They can directly
affect the channel morphology of streams by accelerating erosion and sediment delivery
and by increasing the magnitude of peak flows.
Other factors that influence sediment movements include road gradient, road design (i.e.
out-sloped versus in-sloped, broad based dips), site conditions, age of road, fill slope
length, cut slope exposures, amount of vegetative cover or encroachment (on little used
roads) and amount of fill slope used on maintained roads.
Sediment impact to streams is primarily related to road density, proximity to stream and
road types such as paved versus unpaved roads. The greater the road density, the greater
the influence roads have on increasing sediment into streams such as culverts needed to
direct water and sediment off of roads, road stream crossings as well the increased
propensity for public vehicle traffic such as ATV users.
Current road density values for the Bonito project planning fall below road density range
of 1.7 - 4.7 mi/mi² which is considered to be “functioning inappropriately and at-risk” if
it’s in the upper density range. The Bonito project area’s road density values are well
within the desired range of road density values.
A road proximity or distance to an active stream channel is one of the major sources of
direct sediment input into a stream channel where factors such as surface materials,
amount of travel use, road density, and the number of stream crossings help contribute to
the amount of sediment entering stream channels. Approximately 26.2 miles of roads are
within 200 feet of a nearby stream channel. Many notable roads seen in Bear Canyon,
Tanbark Canyon, Philadelphia Canyon and Kraut Canyon are often much closer to stream
channels under 100 feet.
Grazing Allotments
There are 5 allotments within the Bonito Project area. The Loma Grande allotment on the
northeastern end and the Lower Bonito allotment on the eastern end of the project area
make up the bulk of the allotments. Wilderness, Dry Gulch and Alto allotments fringe the
project area on the north and south end. Grazing remains limited in those areas and are
not extensive as it once were in the past. The Loma Grande allotment was heavily grazed
up into the late 1990s in the Anan creek area (tributary to Iron creek which is tributary to
Kraut Canyon) eating plants and grasses down to one inch high. And Philadelphia
Canyon in the Lower Bonito allotment was recently grazed heavily until around 2004 or
2005 (per phone call with Larry Cordova, District Wildlife Biologist, March 20, 2008). Based from
recent field surveys done in July 2007 both Anan and Philadelphia shows marked
improvements as seen in photographs taken along the drainages.
8
Municipal Watersheds
Municipal watersheds are managed under multiple use prescriptions in land and resource
management plans.
The watershed of Upper Rio Bonito above the Bonito reservoir is defined as a “Municipal
Supply Watershed” according to the Washington Office Forest Service Manual 2542.05.
The definition of a Municipal Supply Watershed states:
“A municipal supply watershed is one that serves a public water system as defined in
Public Law 93-523 (Safe Drinking Water Act); or as defined in State safe drinking water
regulations. The definition does not include communities served by a well or confined
ground water unaffected by Forest Service activities.”
Air Quality
The Bonito project area is within the White Mountain Wilderness Class I airshed. It is
one of the 156 mandatory Class I federal areas in the United States. A Class I area, as
defined by the Clean Air Act, includes national parks greater than 6,000 acres, wilderness
areas and national memorial parks greater than 5,000 acres, and international parks that
existed as of August 1977. White Mountain Wilderness Class I airshed covers 31,171
acres.
Desired Conditions from Forest Plan:
The Lincoln National Forest Plan, as amended (Forest Plan), has many goals and
objectives (USDA 1986). The Forest Plan Standards and Guidelines for the soil and
water resources, which are applicable to all areas of the Forest, especially in management
areas related to this project (see Table 1.0), include:
Page 12 “Provide direction and support to all resource management activities
with emphasis on maintaining water quality and quantity.
Page 12 "Secure and provide an adequate supply of water for the protection and
management of the Forest.
Page 13 "Manage for a favorable flow of water for users by improving or
maintaining all watersheds to a satisfactory or higher condition.
Page 13 "Secure and provide an adequate supply of water for the protection and
management of the Forest.
Page 13 "Maintain on-site soil loss within established tolerance levels.
Page 13 "Manage riparian areas to provide optimum vegetation and ecological
diversity.
Page 41 "Through the use of best management practices, the adverse effect of
planned activities will be mitigated and site productivity maintained.

9
Table 1.0 Management Area Guidelines for the Bonito Project Area
Management
Area
Emphasis Notes
1F – White
Mountain
Wilderness
Wilderness
Management
Maintain high quality visual conditions in the Class I air
quality areas.
Provide maintenance activities in conformance with the
Wilderness Act.
1G – Rio
Bonito
Dispersed and
developed recreation,
and wildlife
management
1H – South
Fork Rio
Bonito
Maintain developed
recreation.
1H-RNA
William G.
Telfer
Research
Natural Area
Provide conditions
suitable for research on
natural ecosystems
Management Direction for Water and Soils
-Provide direction and support to all resource management activities with emphasis
on maintaining water quality and quantity.
-Secure and provide an adequate supply of water for the protection and management of
the Forest.
-Manage for a favorable flow of water for users by improving or maintaining all
watersheds to a satisfactory or higher condition.
-Maintain water quality to meet or exceed appropriate standards.
-Maintain on-site soil loss within established tolerance levels.
-Manage riparian areas to provide optimum vegetation and ecological diversity.
-Specific standards and guidelines are found in the Regional Guide; Region 3 Threatened
and Endangered Note 23 and Hydrology Notes 11 and 14; individual management area
prescriptions, and Forest-wide Standards & Guidelines under Activities F01-F05, K01,
K03-K06.
For soil resources, satisfactory soil condition is the goal. Therefore, areas listed as either
having impaired soil condition or unsatisfactory soil conditions are not meeting Forest
Plan goals. All map units are rated as being in satisfactory soil condition.

10
For hydrology resources, satisfactory watershed condition is the goal while striving
toward and or maintain with an upward trend from a Watershed Condition Class II
category in the non-wilderness portion of the watersheds. And strive for a Watershed
Condition Class I for the wilderness area. Areas where sedimentation may be a concern
or negative impact to riparian corridors would not be meeting Forest Plan goals and that
BMPs would be required to help mitigate negative impacts.
Past, Present and Future Activities:
Table 2.0 Past, Present and Future Activities
Resource
Past Activities
Present Activities
Reasonably
Foreseeable Future
Activities HydrologySoils Timber
HydrologySoils Recreation - Horseback,
OHV, fishing, hiking
and scenic viewing.
Recreational uses remain
popular on the forest.
Expect to see continued
but small and steady
growth on recreational
uses of the forest as
nearby population
centers continue to grow.
Hydrology/Soils Grazing was active in
the past which have
impacted various
riparian areas.
Grazing is limited or
under control.
Continued but limited
use of grazing in
watersheds in the non-
wilderness portion of
LNF

11
2. Laws, Regulations and Policies
Table 3.0 Laws, Regulations and Policies
Authority Level
(Federal, State, County,
Forest, Regional)
Law, Regulation, Policy
How Applicable to
Project Federal Organic Administration Act of
June 4, 1897, as amended
Authority of watershed
management on USFS lands.
Federal Multiple-Use Sustained- Yield
Act of 1960 National forests are
established and shall be used
for outdoor recreation, range,
timber, watershed, and
wildlife and fish purposes.
Federal National Environmental Policy
Act of January 1, 1970 Requires an environmental
assessment, including an
evaluation of impacts on
water resources, for all major
Federal actions.
Federal National Forest Management Act
of 1976 Emphasizes maintenance of
productivity, protect
and improve the quality of soil
and water resources; avoid
lasting impairments of land
productivity on Forest Service
lands.
Federal Federal Land Policy and
Management Act of October 21,
1976
“…the public lands be
managed in a manner that
will protect the quality of
scientific, scenic, historical,
ecological,
environmental, air and
atmospheric, water resource,
and archeological values.”
And that “Terms and
conditions must minimize
damage to scenic and

12
aesthetic values and fish and
wildlife habitat and otherwise
protect the environment.”
Federal The Clean Water Act of 1977 Section 313 of the act states
that Federal agencies must
comply with Federal, State,
and local requirements
related to the control and
reduction of pollution to the
same level and extent as
required of non-governmental
entities. Section 404 of the
Clean Water Act regulates
the discharge of dredged,
excavated, and/or fill material
in wetlands, streams, rivers,
and other U.S. waters.
Federal Clean Air Act 1977 & 1990 The 1977 amendments to the
Clean Air Act established a goal
for the “prevention of any future,
and remedying of any existing
impairment of visibility in
mandatory Federal Class 1 areas
which impairment results from
manmade air pollution.”
The 1990 amendments to the
Clean Air Act focused attention
on regional haze which has been
defined as visibility impairment
caused by the cumulative air
pollution emissions from
numerous sources over a wide
geographic area.
Executive Executive Order 11752 This EO mandates that
Federal agencies provide
national leadership in order to
protect and enhance the
quality of air, water, and land
resources through
13
compliance with applicable
Federal, State, interstate, and
local pollution standards.
Executive Executive Order 11990 Requires Federal agencies
take action in order to
minimize the
destruction, loss, or
degradation of wetlands; and
to preserve and enhance the
natural and beneficial values
of wetlands.
Executive Executive Order 11988 This order requires the Forest
Service to provide leadership
and to take action to (1)
minimize adverse impacts
associated with occupancy and
modification of floodplains and
reduce risks of flood loss, (2)
minimize impacts of floods on
human safety, health, and
welfare, and (3) restore and
preserve the natural and
beneficial values served by
floodplains.
3. Consistency with Forest Plan
Table 4.0 Consistency with Forest Plan
4. Environmental Analysis
HYDROLOGY: AFFECTED ENVIRONMENT
Watershed Condition
Per the FSM 2521.03 condition of watersheds are evaluated and given a rating based on a
variety of criteria and a watershed is assigned with one of the following three classes:
1. Class I Condition. Watersheds exhibit high geomorphic, hydrologic, and
biotic integrity relative to their natural potential condition. The drainage network is
Forest Wide
Standard and Guideline/Pg(s).
Management
Area Standards and Guides/
Pg(s).
Recovery/
Maintenance Plan Pg(s).
Chapter 4, pg 3 Chapter 4, pg 68 - 77 Chapter 5, pg 162, 163
14
generally stable. Physical, chemical, and biologic conditions suggest that soil, aquatic,
and riparian systems are predominantly functional in terms of supporting beneficial uses.
2. Class II Condition. Watersheds exhibit moderate geomorphic, hydrologic, and
biotic integrity relative to their natural potential condition. Portions of the watershed may
exhibit an unstable drainage network. Physical, chemical, and biologic conditions
suggest that soil, aquatic, and riparian systems are at risk in being able to support
beneficial uses.
3. Class III Condition. Watersheds exhibit low geomorphic, hydrologic, and
biotic integrity relative to their natural potential condition. A majority of the drainage
network may be unstable. Physical, chemical, and biologic conditions suggest that soil,
riparian, and aquatic systems do not support beneficial uses.
Watershed condition assessments provide basic information about soil and water
processes and conditions which are fundamental to ecosystem management. Based on a
CEO document (see Appendix C) on “Watershed Condition Class” ratings for 5th
HUC
watersheds across the Lincoln National Forest, a WCC rating of “II” was given for the
Rio Bonito watershed (189,455 acres) as a general description of the overall condition.
This assessment was done around the mid-1990s at the watershed scale. Currently there is
no updated version of the WCC for 5th
level HUC watersheds and that there are no WCC
for smaller sized watershed such as the 6th
level HUC watershed. We can infer from past
WCC values to what we see today and get a general estimate whether watershed
conditions have improved, degraded or primarily unchanged.
Watershed condition assessments provide basic information about soil and water
processes and conditions which are fundamental to ecosystem management. Assessments
will help identify management needs (via alternatives) in a watershed and will measure
accomplishment in terms of protecting or enhancing the health and function of
ecosystems in a watershed.
Assessments will require the diagnosis of land and water attributes that respond to natural
and human disturbances and indicate current conditions of soil productivity, hydrologic
function, with comparison to some reference conditions. These land and water attributes
include:
(1) Geology and landform; and soil and hillslope processes (such as surface and gully
erosion, compacted soils, and connected disturbed areas).
(2) Vegetation conditions which affect runoff (such as cover type, density, and age)
and hillslope stability.
(3) Stream flow regimes, patterns and temporal distribution.
(4) Water quality and quantity.
(5) Channel types and conditions such as bed sediments, turbidity and bank stability.
Currently, watershed conditions are believed to be satisfactory in terms of hydrologic
responses to rainfall and snowmelt, and overall water quality issues due to erosion and/or
soil conditions whether from the protection or lack of vegetation cover and road density.
15
The Upper Rio Bonito is a 6th
level HUC watershed where the “Watershed Condition
Class” is believed to be at a “WWC II” overall, and in areas of the White Mountain
wilderness watershed condition there is considerably better than the non-wilderness
portion of the project area. Portions of the 6th
HUC Magado Canyon and Middle Rio
Bonito watersheds are believed to be WWC II watersheds using the same criteria done
for 5th
level HUC WCC.
SOILS: AFFECTED ENVIRONMENT
Vegetation
The Climatic Vegetation Communities represented in the Bonito Watershed are as
follows:
TABLE 5. Vegetation Climatic Communities Percent of the Bonito Watershed
Vegetation Communities ACRES Percent of WS
Pinon Juniper Woodland 2,059 7.2%
Ponderosa Pine Forest 4,570 16.0
Mixed Conifer Forest 13,644 47.9
Spruce Forest 8,215 28.8
Terrestrial Ecosystem Survey
A Terrestrial Ecosystem Survey (TES) was completed by the Forest Service in 1984 and
covers the entire Smokey Bear District (USDA, 1984). The descriptions of the soils from
this report were used in determining reference conditions for the soils observed. The
average annual precipitation south of the project area at Ruidoso is about 21.8 inches.
(Western Regional Climate Center http://www.wrcc.dri.edu/index.html ). The
interpolated average annual precipitation on the watershed is about 22-26 inches.
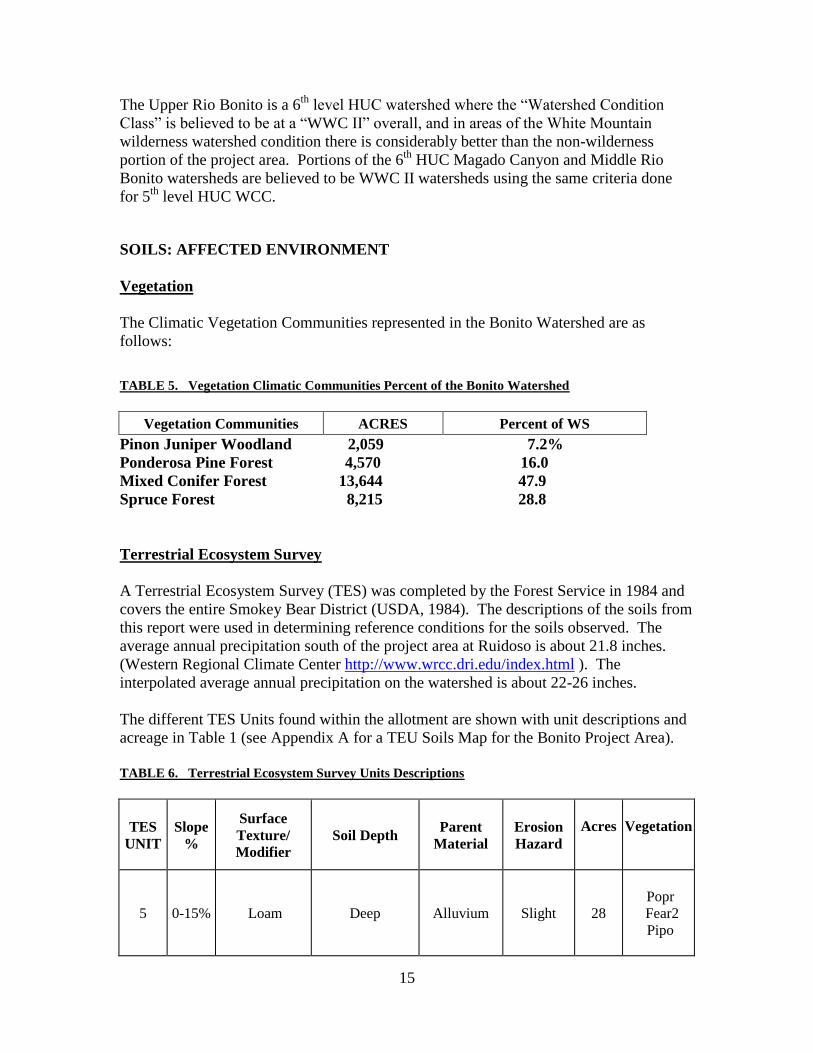
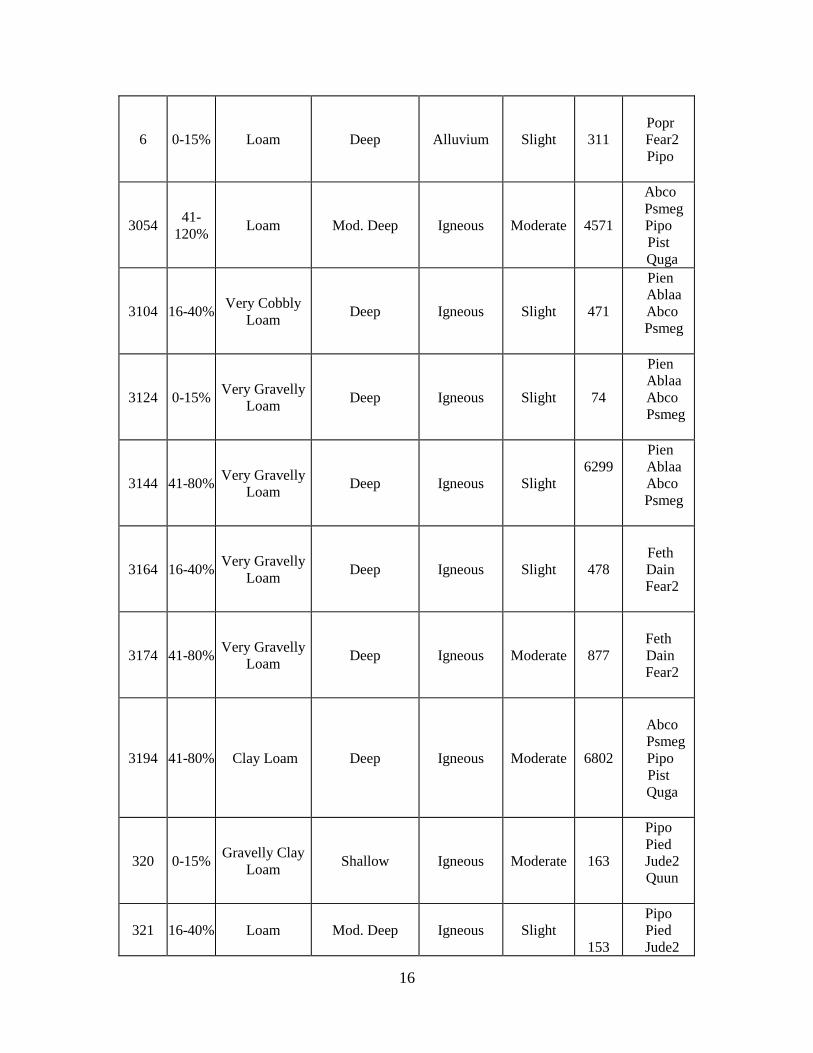
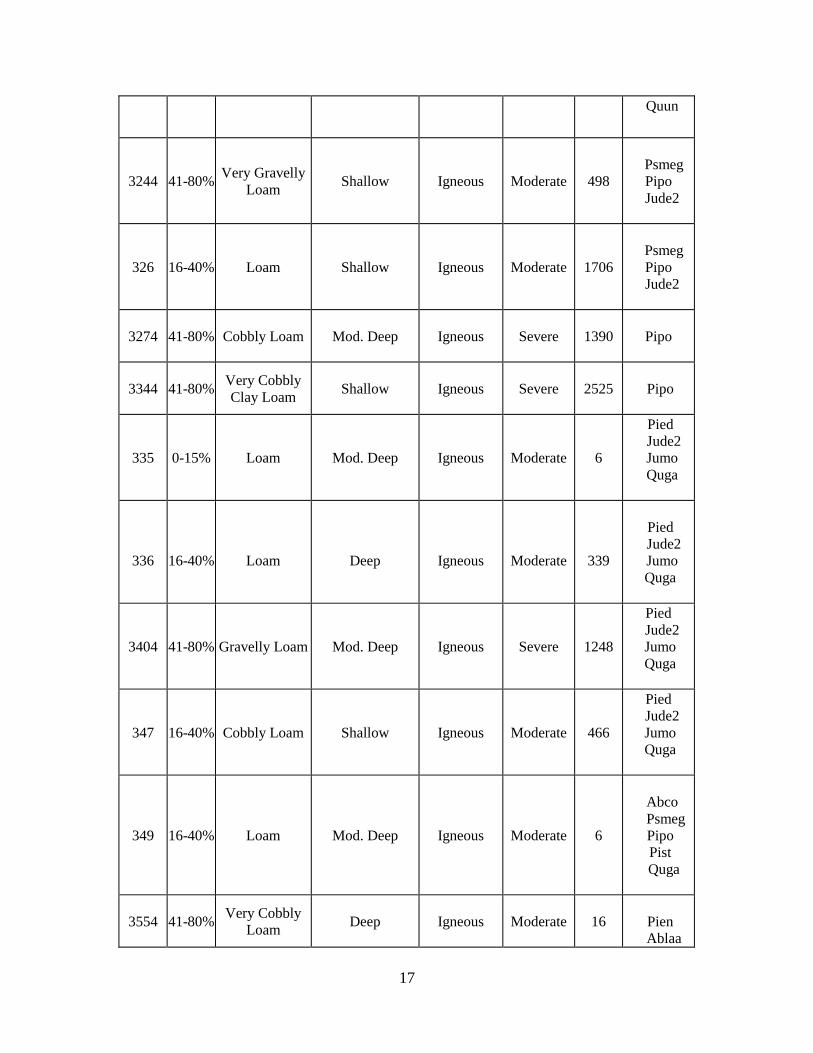
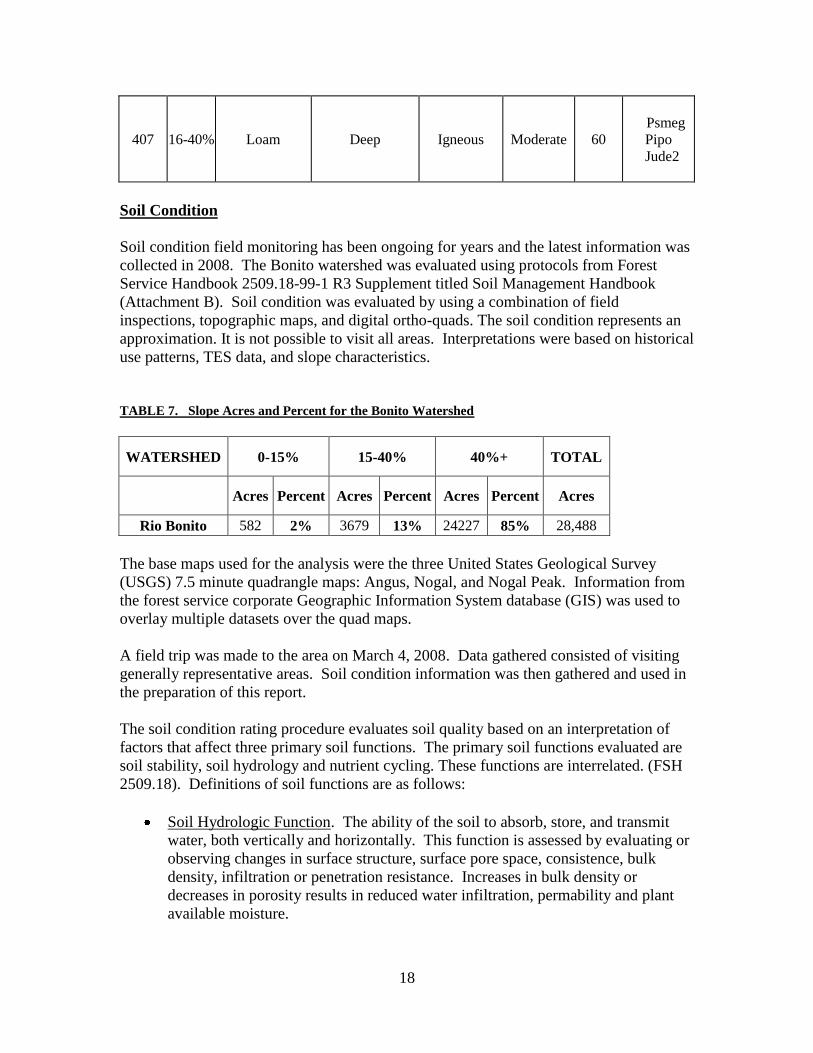
The different TES Units found within the allotment are shown with unit descriptions and
acreage in Table 1 (see Appendix A for a TEU Soils Map for the Bonito Project Area).
TABLE 6. Terrestrial Ecosystem Survey Units Descriptions
TES
UNIT
Slope
%
Surface
Texture/
Modifier
Soil Depth Parent
Material
Erosion
Hazard
Acres
Vegetation
5 0-15% Loam Deep Alluvium Slight
28
Popr
Fear2
Pipo
16
6 0-15% Loam Deep Alluvium Slight
311
Popr
Fear2
Pipo
3054 41-
120% Loam Mod. Deep Igneous Moderate
4571
Abco
Psmeg
Pipo
Pist
Quga
3104 16-40% Very Cobbly
Loam Deep Igneous Slight
471
Pien
Ablaa
Abco
Psmeg
3124 0-15% Very Gravelly
Loam Deep Igneous Slight
74
Pien
Ablaa
Abco
Psmeg
3144 41-80% Very Gravelly
Loam Deep Igneous Slight
6299
Pien
Ablaa
Abco
Psmeg
3164 16-40% Very Gravelly
Loam Deep Igneous Slight
478
Feth
Dain
Fear2
3174 41-80% Very Gravelly
Loam Deep Igneous Moderate
877
Feth
Dain
Fear2
3194 41-80% Clay Loam Deep Igneous Moderate
6802
Abco
Psmeg
Pipo
Pist
Quga
320 0-15% Gravelly Clay
Loam Shallow Igneous Moderate
163
Pipo
Pied
Jude2
Quun
321 16-40% Loam Mod. Deep Igneous Slight
153
Pipo
Pied
Jude2
17
Quun
3244 41-80% Very Gravelly
Loam Shallow Igneous Moderate
498
Psmeg
Pipo
Jude2
326 16-40% Loam Shallow Igneous Moderate
1706
Psmeg
Pipo
Jude2
3274 41-80% Cobbly Loam Mod. Deep Igneous Severe
1390
Pipo
3344 41-80% Very Cobbly
Clay Loam Shallow Igneous Severe
2525
Pipo
335 0-15% Loam Mod. Deep Igneous Moderate
6
Pied
Jude2
Jumo
Quga
336
16-40%
Loam
Deep
Igneous
Moderate
339
Pied
Jude2
Jumo
Quga
3404 41-80% Gravelly Loam Mod. Deep Igneous Severe
1248
Pied
Jude2
Jumo
Quga
347 16-40% Cobbly Loam Shallow Igneous Moderate
466
Pied
Jude2
Jumo
Quga
349 16-40% Loam Mod. Deep Igneous Moderate
6
Abco
Psmeg
Pipo
Pist
Quga
3554 41-80% Very Cobbly
Loam Deep Igneous Moderate
16
Pien
Ablaa
18
407 16-40% Loam Deep Igneous Moderate
60
Psmeg
Pipo
Jude2
Soil Condition
Soil condition field monitoring has been ongoing for years and the latest information was
collected in 2008. The Bonito watershed was evaluated using protocols from Forest
Service Handbook 2509.18-99-1 R3 Supplement titled Soil Management Handbook
(Attachment B). Soil condition was evaluated by using a combination of field
inspections, topographic maps, and digital ortho-quads. The soil condition represents an
approximation. It is not possible to visit all areas. Interpretations were based on historical
use patterns, TES data, and slope characteristics.
TABLE 7. Slope Acres and Percent for the Bonito Watershed
WATERSHED 0-15% 15-40% 40%+ TOTAL
Acres Percent Acres Percent Acres Percent Acres
Rio Bonito 582 2% 3679 13% 24227 85% 28,488
The base maps used for the analysis were the three United States Geological Survey
(USGS) 7.5 minute quadrangle maps: Angus, Nogal, and Nogal Peak. Information from
the forest service corporate Geographic Information System database (GIS) was used to
overlay multiple datasets over the quad maps.
A field trip was made to the area on March 4, 2008. Data gathered consisted of visiting
generally representative areas. Soil condition information was then gathered and used in
the preparation of this report.
The soil condition rating procedure evaluates soil quality based on an interpretation of
factors that affect three primary soil functions. The primary soil functions evaluated are
soil stability, soil hydrology and nutrient cycling. These functions are interrelated. (FSH
2509.18). Definitions of soil functions are as follows:
Soil Hydrologic Function. The ability of the soil to absorb, store, and transmit
water, both vertically and horizontally. This function is assessed by evaluating or
observing changes in surface structure, surface pore space, consistence, bulk
density, infiltration or penetration resistance. Increases in bulk density or
decreases in porosity results in reduced water infiltration, permability and plant
available moisture.
19
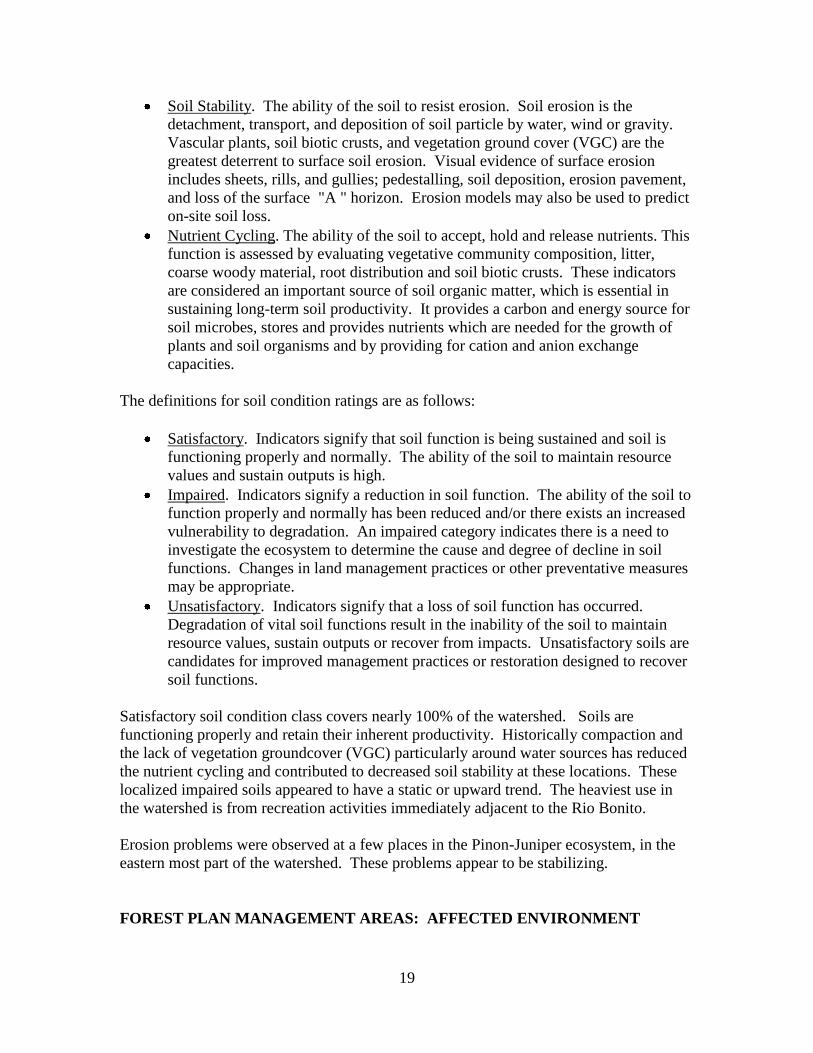
Soil Stability. The ability of the soil to resist erosion. Soil erosion is the
detachment, transport, and deposition of soil particle by water, wind or gravity.
Vascular plants, soil biotic crusts, and vegetation ground cover (VGC) are the
greatest deterrent to surface soil erosion. Visual evidence of surface erosion
includes sheets, rills, and gullies; pedestalling, soil deposition, erosion pavement,
and loss of the surface "A " horizon. Erosion models may also be used to predict
on-site soil loss.
Nutrient Cycling. The ability of the soil to accept, hold and release nutrients. This
function is assessed by evaluating vegetative community composition, litter,
coarse woody material, root distribution and soil biotic crusts. These indicators
are considered an important source of soil organic matter, which is essential in
sustaining long-term soil productivity. It provides a carbon and energy source for
soil microbes, stores and provides nutrients which are needed for the growth of
plants and soil organisms and by providing for cation and anion exchange
capacities.
The definitions for soil condition ratings are as follows:
Satisfactory. Indicators signify that soil function is being sustained and soil is
functioning properly and normally. The ability of the soil to maintain resource
values and sustain outputs is high.
Impaired. Indicators signify a reduction in soil function. The ability of the soil to
function properly and normally has been reduced and/or there exists an increased
vulnerability to degradation. An impaired category indicates there is a need to
investigate the ecosystem to determine the cause and degree of decline in soil
functions. Changes in land management practices or other preventative measures
may be appropriate.
Unsatisfactory. Indicators signify that a loss of soil function has occurred.
Degradation of vital soil functions result in the inability of the soil to maintain
resource values, sustain outputs or recover from impacts. Unsatisfactory soils are
candidates for improved management practices or restoration designed to recover
soil functions.
Satisfactory soil condition class covers nearly 100% of the watershed. Soils are
functioning properly and retain their inherent productivity. Historically compaction and
the lack of vegetation groundcover (VGC) particularly around water sources has reduced
the nutrient cycling and contributed to decreased soil stability at these locations. These
localized impaired soils appeared to have a static or upward trend. The heaviest use in
the watershed is from recreation activities immediately adjacent to the Rio Bonito.
Erosion problems were observed at a few places in the Pinon-Juniper ecosystem, in the
eastern most part of the watershed. These problems appear to be stabilizing.
FOREST PLAN MANAGEMENT AREAS: AFFECTED ENVIRONMENT
20
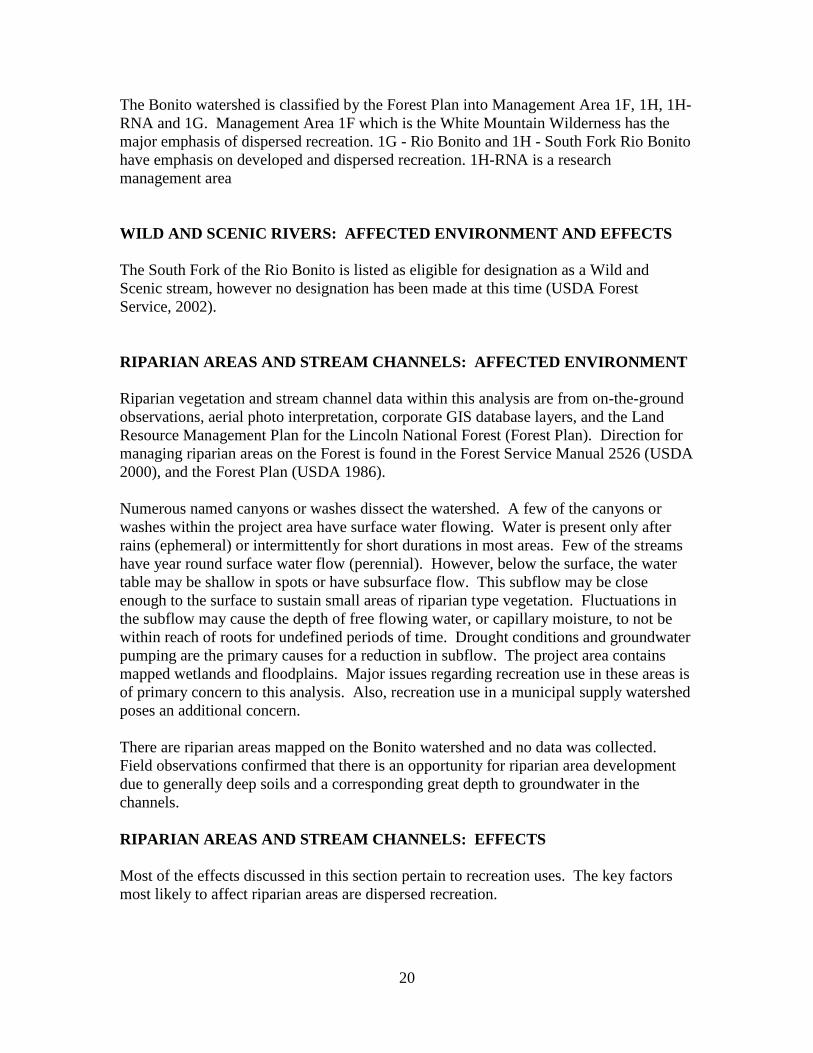
The Bonito watershed is classified by the Forest Plan into Management Area 1F, 1H, 1H-
RNA and 1G. Management Area 1F which is the White Mountain Wilderness has the
major emphasis of dispersed recreation. 1G - Rio Bonito and 1H - South Fork Rio Bonito
have emphasis on developed and dispersed recreation. 1H-RNA is a research
management area
WILD AND SCENIC RIVERS: AFFECTED ENVIRONMENT AND EFFECTS
The South Fork of the Rio Bonito is listed as eligible for designation as a Wild and
Scenic stream, however no designation has been made at this time (USDA Forest
Service, 2002).
RIPARIAN AREAS AND STREAM CHANNELS: AFFECTED ENVIRONMENT
Riparian vegetation and stream channel data within this analysis are from on-the-ground
observations, aerial photo interpretation, corporate GIS database layers, and the Land
Resource Management Plan for the Lincoln National Forest (Forest Plan). Direction for
managing riparian areas on the Forest is found in the Forest Service Manual 2526 (USDA
2000), and the Forest Plan (USDA 1986).
Numerous named canyons or washes dissect the watershed. A few of the canyons or
washes within the project area have surface water flowing. Water is present only after
rains (ephemeral) or intermittently for short durations in most areas. Few of the streams
have year round surface water flow (perennial). However, below the surface, the water
table may be shallow in spots or have subsurface flow. This subflow may be close
enough to the surface to sustain small areas of riparian type vegetation. Fluctuations in
the subflow may cause the depth of free flowing water, or capillary moisture, to not be
within reach of roots for undefined periods of time. Drought conditions and groundwater
pumping are the primary causes for a reduction in subflow. The project area contains
mapped wetlands and floodplains. Major issues regarding recreation use in these areas is
of primary concern to this analysis. Also, recreation use in a municipal supply watershed
poses an additional concern.
There are riparian areas mapped on the Bonito watershed and no data was collected.
Field observations confirmed that there is an opportunity for riparian area development
due to generally deep soils and a corresponding great depth to groundwater in the
channels.
RIPARIAN AREAS AND STREAM CHANNELS: EFFECTS
Most of the effects discussed in this section pertain to recreation uses. The key factors
most likely to affect riparian areas are dispersed recreation.
21
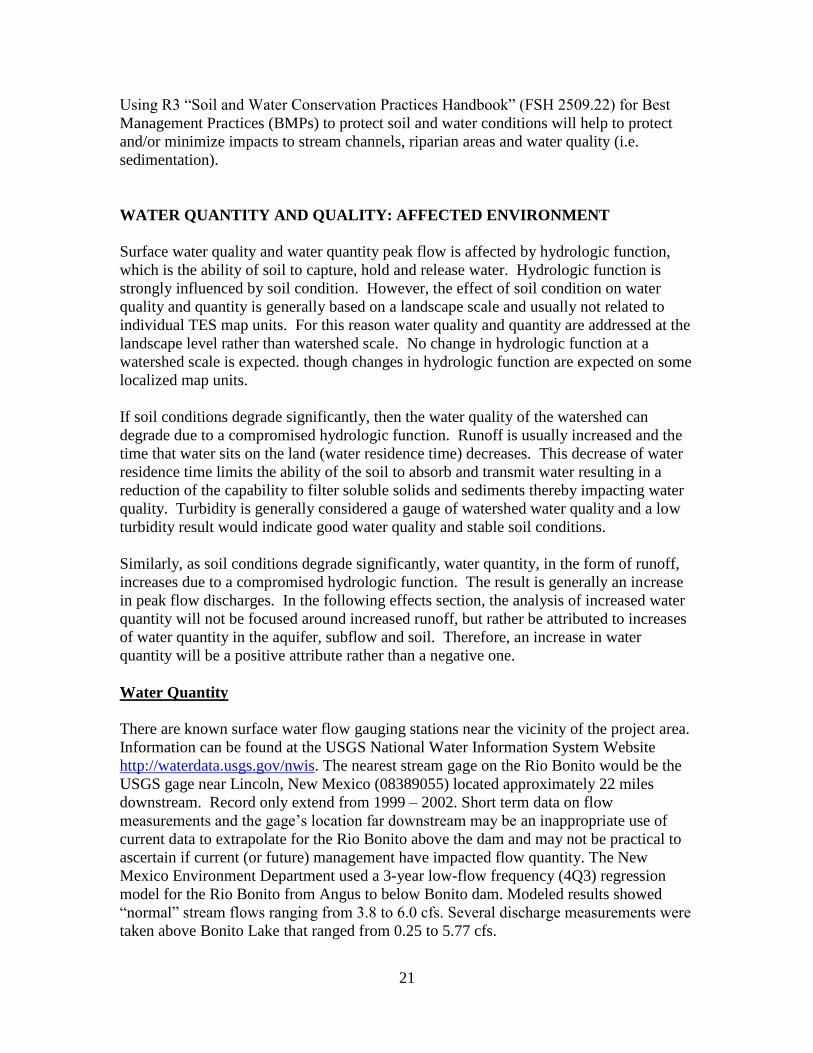
Using R3 “Soil and Water Conservation Practices Handbook” (FSH 2509.22) for Best
Management Practices (BMPs) to protect soil and water conditions will help to protect
and/or minimize impacts to stream channels, riparian areas and water quality (i.e.
sedimentation).
WATER QUANTITY AND QUALITY: AFFECTED ENVIRONMENT
Surface water quality and water quantity peak flow is affected by hydrologic function,
which is the ability of soil to capture, hold and release water. Hydrologic function is
strongly influenced by soil condition. However, the effect of soil condition on water
quality and quantity is generally based on a landscape scale and usually not related to
individual TES map units. For this reason water quality and quantity are addressed at the
landscape level rather than watershed scale. No change in hydrologic function at a
watershed scale is expected. though changes in hydrologic function are expected on some
localized map units.
If soil conditions degrade significantly, then the water quality of the watershed can
degrade due to a compromised hydrologic function. Runoff is usually increased and the
time that water sits on the land (water residence time) decreases. This decrease of water
residence time limits the ability of the soil to absorb and transmit water resulting in a
reduction of the capability to filter soluble solids and sediments thereby impacting water
quality. Turbidity is generally considered a gauge of watershed water quality and a low
turbidity result would indicate good water quality and stable soil conditions.
Similarly, as soil conditions degrade significantly, water quantity, in the form of runoff,
increases due to a compromised hydrologic function. The result is generally an increase
in peak flow discharges. In the following effects section, the analysis of increased water
quantity will not be focused around increased runoff, but rather be attributed to increases
of water quantity in the aquifer, subflow and soil. Therefore, an increase in water
quantity will be a positive attribute rather than a negative one.
Water Quantity
There are known surface water flow gauging stations near the vicinity of the project area.
Information can be found at the USGS National Water Information System Website
http://waterdata.usgs.gov/nwis. The nearest stream gage on the Rio Bonito would be the
USGS gage near Lincoln, New Mexico (08389055) located approximately 22 miles
downstream. Record only extend from 1999 – 2002. Short term data on flow
measurements and the gage’s location far downstream may be an inappropriate use of
current data to extrapolate for the Rio Bonito above the dam and may not be practical to
ascertain if current (or future) management have impacted flow quantity. The New
Mexico Environment Department used a 3-year low-flow frequency (4Q3) regression
model for the Rio Bonito from Angus to below Bonito dam. Modeled results showed
“normal” stream flows ranging from 3.8 to 6.0 cfs. Several discharge measurements were
taken above Bonito Lake that ranged from 0.25 to 5.77 cfs.
22
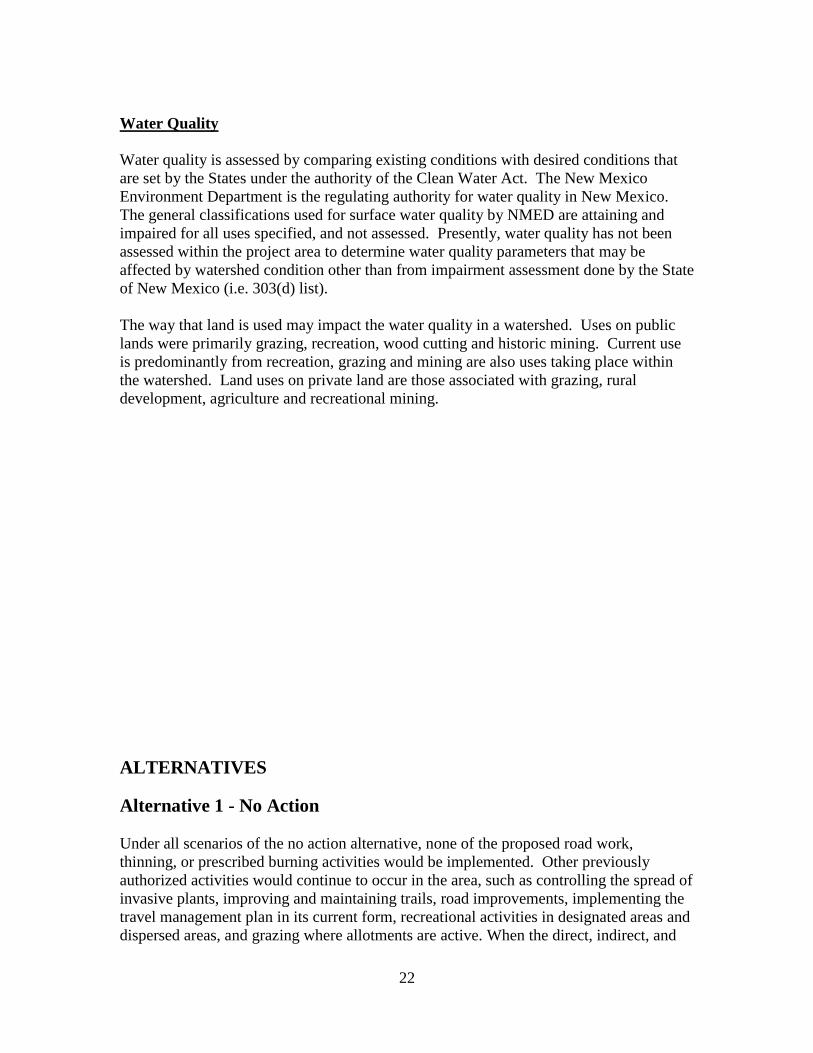
Water Quality
Water quality is assessed by comparing existing conditions with desired conditions that
are set by the States under the authority of the Clean Water Act. The New Mexico
Environment Department is the regulating authority for water quality in New Mexico.
The general classifications used for surface water quality by NMED are attaining and
impaired for all uses specified, and not assessed. Presently, water quality has not been
assessed within the project area to determine water quality parameters that may be
affected by watershed condition other than from impairment assessment done by the State
of New Mexico (i.e. 303(d) list).
The way that land is used may impact the water quality in a watershed. Uses on public
lands were primarily grazing, recreation, wood cutting and historic mining. Current use
is predominantly from recreation, grazing and mining are also uses taking place within
the watershed. Land uses on private land are those associated with grazing, rural
development, agriculture and recreational mining.
ALTERNATIVES
Alternative 1 - No Action
Under all scenarios of the no action alternative, none of the proposed road work,
thinning, or prescribed burning activities would be implemented. Other previously
authorized activities would continue to occur in the area, such as controlling the spread of
invasive plants, improving and maintaining trails, road improvements, implementing the
travel management plan in its current form, recreational activities in designated areas and
dispersed areas, and grazing where allotments are active. When the direct, indirect, and
23
cumulative effects of the alternatives on hydrology and soils are considered, the No
Action Alternative has the greatest potential for negatively impacting water and soil
resources should a catastrophic wildfire occur.
Direct and Indirect Effects:
Based on erosion modeling scenarios using the WEPP FuMe model (see Appendix A –
Table 11.0. Output Summary Result) background erosion rate result -- the rate that will
occur with no action (i.e. “undisturbed forest”) – would be from 6.4 to 32 yd3/mi
2/yr. If
existing low access road network is included with the background erosion rate then it
would be from 6.8 to 38.4 yd3/mi
2/yr. For existing high access road network erosion rate
would be from 7.1 to 48.9 yd3/mi
2/yr. This is dependent on the percentage of road
network that crosses live water during runoff events and the relative proximity to stream
channels where cross drains can redirect runoff water into channels. These estimates do
not include the amount or intensity of road use by the public. Also, increased
sedimentation is also dependent on rainfall duration, amount and intensity versus drier
seasons.
By allowing vegetation density and fuels to increase there is the increased likelihood of a
catastrophic wildfire happening. In a catastrophic wildfire scenario using the WEPP
FuMe model erosion sedimentation rate would be anywhere from 1292 to 4429
yd3/mi
2/yr. With the combined background sedimentation rate, road access and wildfire
effects, the estimated erosion rate would be from 1298.4 to 4819 yd3/mi
2/yr in the first
year after a wildfire. Amount, duration and rainfall intensity will be the determining
factors on the severity and amount sediment released downstream. Sediment rate would
be expected to attenuate over the next 3 years while the regrowth of plants (e.g. grasses,
forbs, trees) help stabilize the surrounding soils and reduce soil movement and erosion.
Post wildfire impact will produce a massive influx of sediment into drainages of the
Upper Rio Bonito above Bonito Reservoir which will impact Bonito Reservoir, and
Magado and Middle Rio Bonito. The City of Alamogordo’s (and other communities)
water supply in terms of quantity of water may not be available due to the displacement
of water from sediment. And that the quality of water would see unacceptable turbidity
and sediment levels along with ash contamination. This scenario will also have a major
impact on a Category 5 impaired stream channel Rio Bonito below the dam by
introducing excessive sediment and ash.
Cumulative Effects:
Past, present and foreseeable future projects or actions that have affected or will affect
the project area include historic heavy grazing, prescribed and natural fires, wildfire
suppression, invasive exotic plants, dispersed recreation and water development. These
occurrences have contributed incrementally to effects that have changed ecological
conditions of the area. Other activities being conducted over the watersheds include
recreation, mining, farming, wildlife management, and activities associated with rural
residential communities.
24
Historic heavy livestock grazing throughout the watersheds around the turn of the 19th
to
the 20th
century resulted in a reduction in native grasses and an increase in shrubs. In
addition, the introduction of African grasses, most obviously Lehmann lovegrass
(Eragrostis lehmanniana), 50 to 60 years ago has resulted in displacement of native
grasses in the most disturbed areas. In some areas, removal of vegetation by grazing
resulted in soil loss followed by site occupation by exotic grasses. Best Management
Practices (BMPs) to mitigate grazing effects have since been implemented on Federal
lands, with a general improvement in conditions. Soil loss, however, is most likely
irretrievable in human time frames (100 years), and methods to reverse site occupation by
exotic grasses in a wildland situation have not been developed.
Historic fuel wood harvesting in the project area was conducted prior to BMPs. This has
also contributed to historic soil loss and increase in shrubs.
Wildfire suppression activities since the establishment of the National Forest is
contributing to the trend of increased shrubs and tree density with associated decreases in
grasses on National Forest land.
Recreation impacts are primarily from vehicle use on roads (both un-surfaced and gravel)
and trails. Continued uses of these activities have the potential to increase sediment in
drainage channels, and in the case of off-road use, severely disturb vegetation and soils.
Presently, OHV use is significant in this area and as this outdoor recreation activity
grows in popularity with Bonito Lake area as being the prime recreational area on the
Lincoln National Forest. Unregulated use has the potential to some times create wildcat
roads and undesignated stream crossings which can pose an impact to the watershed.
Mining activity have occurred within and adjacent to the project area since the mid
1800’s. Historic surface and underground mining is a ground disturbing activity by
definition and causes numerous effects, some irreversible, to the environment. Historic
mining activity can have adverse effects to soil and water quality caused by excess
sediment and pollutants from areas of waste rock dumps or processed ore. Vegetation
can be impacted due to the need for large volumes of fuel wood to process ore. Water
quantities may also be impacted since water is generally necessary for present day
commercial mining activities. Currently, there is no planned commercial mining activity
reported within the project area. However, since the area is a mining district with historic
mineral production, there is a potential, that within the next century, renewed exploration
and extraction could occur should mining becoming viable again.
Farming is not a significant use in the upper portion of the watersheds. Presently,
farming does not take place on Forest land within the watershed. However, farming is
significant in the lower portions of the watersheds off Forest lands. Farming can impact
water quantity since irrigation uses groundwater and diverted surface water. Farming can
also impact water quality since agricultural chemicals can pollute surface and
groundwater. Sedimentation from the farm fields can impact the streams down stream
from farms.

25
Rural and urban development (all off Forest) in the watersheds has resulted in loss of
vegetation, increased polluted runoff from roads and disturbed areas, and increased
groundwater and surface water use.
Livestock grazing may impact soil, water and riparian function in a number of ways
including compacting the soil surface (hydrologic function), removing plant material
(stability), or changing the plant community composition (nutrient cycling). All soils on
these allotments must be managed to maintain or improve long-term productivity (Forest
Plan goals and objectives). This can be accomplished by implementing Best
Management Practices (BMP's) such as, but not limited to:
(1) annually prepare an operating plan with the permittee to allow for current allotment
conditions;
(2) make periodic field checks to identify needed adjustments in season and livestock
numbers including stock counts, forage utilization, assessment of rangeland to verify soil
and vegetative condition and trend;
(3) and use necessary techniques to achieve proper distribution, or lessen the impact on
areas which are sensitive or which would naturally be overused including riding and
herding to shift livestock locations, using salt or supplement feed, range improvements,
prescribed burning, trail construction, seeding, or prevention of intensive livestock
grazing or concentrated livestock use on soils that have low bearing strength and are wet
Alternative 2 - Proposed Action
Alternative 2 proposes treatments to occur on approximately 27,000 acres of national
forest land, including 15,339 of the White Mountain Wilderness to reduce tree densities
in an effort to restore natural ecosystem processes. Thinning would be utilized on
approximately 12,192 acres of non-wilderness; and prescribed fire would implemented
on the 27,000 acres of both wilderness and non-wilderness national forest land. The “no
treatment” acres which comprise approximately 6.5 percent of the project consist of
Mexican Spotted Owl Protected Activity Center core nest areas where ground-disturbing
management activities are not allowed.
The Proposed Action would include 4.0 miles of road construction or reconstruction with
road decommissioning activities occurring on those same 4.0 miles upon project
completion. Road construction would allow for 2,842 acres of removal of woody
material to enhance economic opportunities in the form of small diameter utilization
including biomass utilization, compost production, conventional lumber, and other wood
product opportunities.
The following methods could be utilized for timber stand improvement in non-wilderness
areas:
▪Manual felling
▪Mechanical felling
26
▪Mechanical grinding
▪Mechanical pushing
▪Mechanical extraction
▪Ground-based log removal
▪Cable log removal
▪Skyline log removal
▪Felling with no removal
Direct and Indirect Effects:
All activities described in the proposed action have the potential to disturb soils
encouraging additional erosion and sedimentation to occur. Little or no impact to a
Category 5 impaired stream channel, Rio Bonito, below the dam. Activities through
mechanical thinning and/or prescription burns will result in a temporary increase in
sediment movement from exposed areas, increased activity on roads and other ground
disturbances in areas undergoing treatments. Soil erosion is directly related to the amount
of cover that is left intact to reduce the impact of rainfall. Logs, litter, duff, needle cast
and rock are effective in reducing soil displacement from raindrop impact.
The proposed construction of 4.0 miles of road will not adversely change the modeling
results when road density value changes little. Planned road locations are mostly away
from drainages well beyond 200 feet.
The proposed action may see a reduction in soil productivity and development on sites
where soils have become compacted, displaced, or burned. Improve watershed and soil
conditions will be likely over the long term when fuels are reduced and that the potential
threat to catastrophic wildfire become less of a risk. With the reduction of trees and
shrubs (ie. fuels) will reduce the amount of surface area for rain and snow to collect on
allowing moisture to fall on the ground. In some areas this will help improve soil
moisture and the retention of water.
Based on erosion modeling scenarios using the WEPP FuMe model (see Appendix A –
Table 11.0 Output Summary Result) background erosion rate result in an undisturbed
forest would be about 6.4 to 32 yd3/mi
2/yr. If existing low access road network is
included with background erosion rate then it would be from 6.8 to 38.4 yd3/mi
2/yr. For
existing high access road network it would be from 7.1 to 48.9 yd3/mi
2/yr. This is
dependent on the percentage of road network that crosses live water during major runoff
events and relative proximity to stream channels where cross drains can redirect runoff
water into channels. Also, increased sedimentation is also dependent on rainfall duration,
amount and intensity versus drier seasons. For prescribed burn results erosion rate would
be from 51 to 326 yd3/mi
2/yr depending on soil texture and slope. And for thinning
results erosion rate would be from 6.4 to 185 yd3/mi
2/yr whether it’s commercial or pre-
commercial thinning. Combination of prescribed burn, low access road network, and
thinning would produce an erosion rate of 64.2 to 549.4 yd3/mi
2/yr. For prescribed burn,
high access road network and thinning operations you would see an erosion rate from
64.2 to 559.9 yd3/mi
2/yr.
27
Cumulative Effects:
Past, present and foreseeable future projects or actions that have affected or will affect
the project area include historic heavy grazing, prescribed and natural fires, wildfire
suppression, invasive exotic plants, dispersed recreation and water development. These
occurrences have contributed incrementally to effects that have changed ecological
conditions of the area. Other activities being conducted over the watersheds include
recreation, mining, farming, wildlife management, and activities associated with rural
residential communities.
Historic heavy livestock grazing throughout the watersheds around the turn of the 19th
to
the 20th
century resulted in a reduction in native grasses and an increase in shrubs. In
addition, the introduction of African grasses, most obviously Lehmann lovegrass
(Eragrostis lehmanniana), 50 to 60 years ago has resulted in displacement of native
grasses in the most disturbed areas. In some areas, removal of vegetation by grazing
resulted in soil loss followed by site occupation by exotic grasses. Best Management
Practices (BMPs) to mitigate grazing effects have since been implemented on Federal
lands, with a general improvement in conditions. Soil loss, however, is most likely
irretrievable in human time frames (100 years), and methods to reverse site occupation by
exotic grasses in a wildland situation have not been developed.
Historic fuel wood harvesting in the project area was conducted prior to BMPs. This has
also contributed to historic soil loss and increase in shrubs.
Wildfire suppression activities since the establishment of the National Forest is
contributing to the trend of increased shrubs and tree density with associated decreases in
grasses on National Forest land.
Recreation impacts are primarily from vehicle use on roads (both un-surfaced and gravel)
and trails. Continued use of these activities have the potential to increase sediment in
drainage channels, and in the case of off-road use, severely disturb vegetation and soils.
Presently, OHV use is significant in this area and as this outdoor recreation activity
grows in popularity with Bonito Lake area as being the prime recreational area on the
Lincoln National Forest. Unregulated use has the potential to some times create wildcat
roads and undesignated stream crossings which can pose an impact to the watershed.
Mining activity have occurred within and adjacent to the project area since the mid
1800’s. Historic surface and underground mining is a ground disturbing activity by
definition and causes numerous effects, some irreversible, to the environment. Historic
mining activity can have adverse effects to soil and water quality caused by excess
sediment and pollutants from areas of waste rock dumps or processed ore. Vegetation
can be impacted due to the need for large volumes of fuel wood to process ore. Water
quantities may also be impacted since water is generally necessary for present day
commercial mining activities. Currently, there is no planned commercial mining activity
reported within the project area. However, since the area is a mining district with historic
28
mineral production, there is a potential, that within the next century, renewed exploration
and extraction could occur should mining becoming viable again.
Farming is not a significant use in the upper portion of the watersheds. Presently,
farming does not take place on Forest land within the watershed. However, farming is
significant in the lower portions of the watersheds off Forest lands. Farming can impact
water quantity since irrigation uses groundwater and diverted surface water. Farming can
also impact water quality since agricultural chemicals can pollute surface and
groundwater. Sedimentation from the farm fields can impact the streams down stream
from farms.
Rural and urban development (all off Forest) in the watersheds has resulted in loss of
vegetation, increased polluted runoff from roads and disturbed areas, and increased
groundwater and surface water use.
Livestock grazing may impact soil, water and riparian function in a number of ways
including compacting the soil surface (hydrologic function), removing plant material
(stability), or changing the plant community composition (nutrient cycling). All soils on
these allotments must be managed to maintain or improve long-term productivity (Forest
Plan goals and objectives). This can be accomplished by implementing Best
Management Practices (BMP's) such as, but not limited to:
(1) annually prepare an operating plan with the permittee to allow for current allotment
conditions;
(2) make periodic field checks to identify needed adjustments in season and livestock
numbers including stock counts, forage utilization, assessment of rangeland to verify soil
and vegetative condition and trend;
(3) and use necessary techniques to achieve proper distribution, or lessen the impact on
areas which are sensitive or which would naturally be overused including riding and
herding to shift livestock locations, using salt or supplement feed, range improvements,
prescribed burning, trail construction, seeding, or prevention of intensive livestock
grazing or concentrated livestock use on soils that have low bearing strength and are wet
Effects Relative to Significant Issues:
There are certain resource conditions that need to be considered before determining
whether extraordinary circumstances related to the proposed action would require further
analysis and documentation into an EA or an EIS format as listed in FSH Interim
Directive No. 1909.15-2004-1, approved June 29, 2004.
Floodplains, Wetlands, or Municipal Watersheds -
Floodplains: Executive Order 11988 directs agencies to avoid adverse impacts
associated with the occupancy and modification of floodplains. Floodplains are defined
by this order as “. . . the lowland and relatively flat areas adjoining inland and coastal

29
waters including flood prone areas of offshore islands, including at a minimum, that area
subject to a one percent (100-year recurrence)or greater chance of flooding in any one
year.
Proposed action would not alter or have adverse impacts to any floodplains within the
Bonito project area.
Wetlands: Executive Order 11990 is to avoid adverse impacts associated with destruction
or modification of wetlands. Wetlands are defined by this order as, “….areas inundated
by surface or ground water with a frequency sufficient to support and under normal
circumstances does or would support a prevalence of vegetative or aquatic life that
requires saturated or seasonally saturated soil conditions for growth and reproduction.
Wetlands generally include swamps, marshes, bogs, and similar areas such as sloughs,
potholes, wet meadows, river overflows, mud flats, and natural ponds.”
There are no mapable wetlands found within this project area on National Forest Service
lands. The definition of “mapable wetlands” according to FSM 2527.05 on definitions:
“Mapable Wetlands. A 1:24,000 scale map area of at least 0.05 square inches (a square
0.22 inches per side or a circle with a diameter of 0.25 inches). Include smaller wetlands
providing habitat for threatened, endangered or sensitive species.”
Two hundred feet equals 0.1 inch at a map scale of 1:24,000. A mapable area of 0.05
square inches is approximately 4.5 acres. According to FSM 2527.1 directive there is no
“mapable wetlands” located within the Bonito project area on Forest Service lands.
There are three requirements for a wetland:
1. Hydric Soils
2. Hydrophytic Vegetation (Emergent Vegetation)
3. Wetland Vegetation
There are small pockets of wetlands that exist in various parts of the sub-watersheds
within the Bonito project area. . This alternative will not have any adverse impact to
those wetlands.
Municipal Watersheds: Municipal watersheds are managed under multiple use
prescriptions in land and resource management plans.
The watershed of the Upper Rio Bonito (above the dam) is defined as a “Municipal
Supply Watershed” area according to the Washington Office Forest Service Manual
2542.05. The definition of a Municipal Supply Watershed states:
“A municipal supply watershed is one that serves a public water system as defined in
Public Law 93-523 (Safe Drinking Water Act); or as defined in State safe drinking water
30
regulations. The definition does not include communities served by a well or confined
ground water unaffected by Forest Service activities.”
From Forest Service Manual 2542.1 on Municipal Supply Watershed Planning:
1. Existing water resource conditions as determined by a hydrologic investigation (FSM
2530).
2. Current uses, values, and management requirements for other National Forest
resources.
3. Projection of use in the watershed under multiple-use management practices.
4. Current and proposed handling and treatment of water by the municipality, or other
water user, after water is diverted from the municipal supply watershed.
A major portion of the Upper Rio Bonito watershed feeds into Bonito Reservoir and is a
Municipal Supply Watershed. This alternative action will likely see some sedimentation
introduced into this reservoir.
Conclusion for Alternative 2
Results from this alternative will help reduce the risk of catastrophic wildfire by reducing
potential sediment amount by 800% to 2000% (depending on soil texture and slope)
when compared to a post-wildfire scenario as seen in the No Action alternative result.
The greatest potential sediment loss comes out of the Bear Creek/Rio Bonito and
Wilderness (see Appendix A – “WEPP FuMe Output Summary Result for Bonito with
dominant soil texture description”) area due to the progressively steeper slopes towards
the western end of the Upper Rio Bonito. This is matched well with a wildfire model that
was produced by a fuels specialist to determine the potential fire severity. The fire
severity map showed that the Bear Creek/Rio Bonito and Wilderness portions would
sustain the greater percentages of high and moderate severity burns under this alternative
in a post-wildfire scenario.
Alternative 3– Same as Alternative 2 but with no additional roads
Alternative 3 will treat 27,000 acres, the same number of acres as alternative 2, for both
wilderness and non-wilderness areas utilizing the same prescriptions as alternative 2;
however, tree removal will occur on a much smaller area in an effort to address issues
related to road construction effects including sediment movement. Under alternative 3,
no new road construction or reconstruction will occur.
Direct and Indirect Effects:
All activities described in the proposed action have the potential to disturb soils
encouraging additional erosion and sedimentation to occur. Little or no impact to a
Category 5 impaired stream channel, Rio Bonito, below the dam. Activities through
31
mechanical thinning and/or prescription burns will result in a temporary increase in
sediment movement from exposed areas, increased activity on roads and other ground
disturbances in areas undergoing treatments. Soil erosion is directly related to the amount
of cover that is left intact to reduce the impact of rainfall. Logs, litter, duff, needle cast
and rock are effective in reducing soil displacement from raindrop impact.
With no new road construction it will not be significantly different from Alternative 2 in
terms of road density and that erosion modeling results are similar.
The proposed action may see a reduction in soil productivity and development on sites
where soils have become compacted, displaced, or burned. Improve watershed and soil
conditions will be likely over the long term when fuels are reduced and that the potential
threat to catastrophic wildfire become less of a risk. With the reduction of trees and
shrubs (ie. fuels) will reduce the amount of surface area for rain and snow to collect on
allowing moisture to fall on the ground. In some areas this will help improve soil
moisture and the retention of water.
Based on erosion modeling scenarios using the WEPP FuMe model (see Appendix A –
Table 11.0 Output Summary Result) background erosion rate result in an undisturbed
forest would be about 6.4 to 32 yd3/mi
2/yr. If existing low access road network is
included with background erosion rate then it would be from 6.8 to 38.4 yd3/mi
2/yr. For
existing high access road network it would be from 7.1 to 48.9 yd3/mi
2/yr. This is
dependent on the percentage of road network that crosses live water during major runoff
events and relative proximity to stream channels where cross drains can redirect runoff
water into channels. Also, increased sedimentation is also dependent on rainfall duration,
amount and intensity versus drier seasons. For prescribed burn results erosion rate would
be from 51 to 326 yd3/mi
2/yr depending on soil texture and slope. And for thinning
results erosion rate would be from 6.4 to 185 yd3/mi
2/yr whether it’s commercial or pre-
commercial thinning. Combination of prescribed burn, low access road network, and
thinning would produce an erosion rate of 64.2 to 549.4 yd3/mi
2/yr. For prescribed burn,
high access road network and thinning operations you would see an erosion rate from
64.2 to 559.9 yd3/mi
2/yr.
Cumulative Effects:
Past, present and foreseeable future projects or actions that have affected or will affect
the project area include historic heavy grazing, prescribed and natural fires, wildfire
suppression, invasive exotic plants, dispersed recreation and water development. These
occurrences have contributed incrementally to effects that have changed ecological
conditions of the area. Other activities being conducted over the watersheds include
recreation, mining, farming, wildlife management, and activities associated with rural
residential communities.
Historic heavy livestock grazing throughout the watersheds around the turn of the 19th
to
the 20th
century resulted in a reduction in native grasses and an increase in shrubs. In
addition, the introduction of African grasses, most obviously Lehmann lovegrass
32
(Eragrostis lehmanniana), 50 to 60 years ago has resulted in displacement of native
grasses in the most disturbed areas. In some areas, removal of vegetation by grazing
resulted in soil loss followed by site occupation by exotic grasses. Best Management
Practices (BMPs) to mitigate grazing effects have since been implemented on Federal
lands, with a general improvement in conditions. Soil loss, however, is most likely
irretrievable in human time frames (100 years), and methods to reverse site occupation by
exotic grasses in a wildland situation have not been developed.
Historic fuel wood harvesting in the project area was conducted prior to BMPs. This has
also contributed to historic soil loss and increase in shrubs.
Wildfire suppression activities since the establishment of the National Forest is
contributing to the trend of increased shrubs and tree density with associated decreases in
grasses on National Forest land.
Recreation impacts are primarily from vehicle use on roads (both un-surfaced and gravel)
and trails. Continued use of these activities have the potential to increase sediment in
drainage channels, and in the case of off-road use, severely disturb vegetation and soils.
Presently, OHV use is significant in this area and as this outdoor recreation activity
grows in popularity with Bonito Lake area as being the prime recreational area on the
Lincoln National Forest. Unregulated use has the potential to some times create wildcat
roads and undesignated stream crossings which can pose an impact to the watershed.
Mining activity have occurred within and adjacent to the project area since the mid
1800’s. Historic surface and underground mining is a ground disturbing activity by
definition and causes numerous effects, some irreversible, to the environment. Historic
mining activity can have adverse effects to soil and water quality caused by excess
sediment and pollutants from areas of waste rock dumps or processed ore. Vegetation
can be impacted due to the need for large volumes of fuel wood to process ore. Water
quantities may also be impacted since water is generally necessary for present day
commercial mining activities. Currently, there is no planned commercial mining activity
reported within the project area. However, since the area is a mining district with historic
mineral production, there is a potential, that within the next century, renewed exploration
and extraction could occur should mining becoming viable again.
Farming is not a significant use in the upper portion of the watersheds. Presently,
farming does not take place on Forest land within the watershed. However, farming is
significant in the lower portions of the watersheds off Forest lands. Farming can impact
water quantity since irrigation uses groundwater and diverted surface water. Farming can
also impact water quality since agricultural chemicals can pollute surface and
groundwater. Sedimentation from the farm fields can impact the streams down stream
from farms.
Rural and urban development (all off Forest) in the watersheds has resulted in loss of
vegetation, increased polluted runoff from roads and disturbed areas, and increased
groundwater and surface water use.
33
Livestock grazing may impact soil, water and riparian function in a number of ways
including compacting the soil surface (hydrologic function), removing plant material
(stability), or changing the plant community composition (nutrient cycling). All soils on
these allotments must be managed to maintain or improve long-term productivity (Forest
Plan goals and objectives). This can be accomplished by implementing Best
Management Practices (BMP's) such as, but not limited to:
(1) annually prepare an operating plan with the permittee to allow for current allotment
conditions;
(2) make periodic field checks to identify needed adjustments in season and livestock
numbers including stock counts, forage utilization, assessment of rangeland to verify soil
and vegetative condition and trend;
(3) and use necessary techniques to achieve proper distribution, or lessen the impact on
areas which are sensitive or which would naturally be overused including riding and
herding to shift livestock locations, using salt or supplement feed, range improvements,
prescribed burning, trail construction, seeding, or prevention of intensive livestock
grazing or concentrated livestock use on soils that have low bearing strength and are wet
Effects Relative to Significant Issues:
There are certain resource conditions that need to be considered before determining
whether extraordinary circumstances related to this alternative action (should it be
chosen) would require further analysis and documentation into an EA or an EIS format as
listed in FSH Interim Directive No. 1909.15-2004-1, approved June 29, 2004.
Floodplains, Wetlands, or Municipal Watersheds -
Floodplains: Executive Order 11988 directs agencies to avoid adverse impacts
associated with the occupancy and modification of floodplains. Floodplains are defined
by this order as “. . . the lowland and relatively flat areas adjoining inland and coastal
waters including flood prone areas of offshore islands, including at a minimum, that area
subject to a one percent (100-year recurrence)or greater chance of flooding in any one
year.
This alternative action will not alter or have adverse impacts to any floodplains within the
Bonito project area.
Wetlands: Executive Order 11990 is to avoid adverse impacts associated with destruction
or modification of wetlands. Wetlands are defined by this order as, “….areas inundated
by surface or ground water with a frequency sufficient to support and under normal
circumstances does or would support a prevalence of vegetative or aquatic life that
requires saturated or seasonally saturated soil conditions for growth and reproduction.
Wetlands generally include swamps, marshes, bogs, and similar areas such as sloughs,
potholes, wet meadows, river overflows, mud flats, and natural ponds.”
34
There are no mapable wetlands found within this project area on National Forest Service
lands. The definition of “mapable wetlands” according to FSM 2527.05 on definitions:
“Mapable Wetlands. A 1:24,000 scale map area of at least 0.05 square inches (a square
0.22 inches per side or a circle with a diameter of 0.25 inches). Include smaller wetlands
providing habitat for threatened, endangered or sensitive species.”
Two hundred feet equals 0.1 inch at a map scale of 1:24,000. A mapable area of 0.05
square inches is approximately 4.5 acres. According to FSM 2527.1 directive there is no
“mapable wetlands” located within the Bonito project area on Forest Service lands.
There are three requirements for a wetland:
1. Hydric Soils
2. Hydrophytic Vegetation (Emergent Vegetation)
3. Wetland Vegetation
There are small pockets of wetlands that exist in various parts of the sub-watersheds
within the Bonito project area. This alternative will not have any adverse impact to those
wetlands.
Municipal Watersheds: Municipal watersheds are managed under multiple use
prescriptions in land and resource management plans.
The watershed of the Upper Rio Bonito (above the dam) is defined as a “Municipal
Supply Watershed” area according to the Washington Office Forest Service Manual
2542.05. The definition of a Municipal Supply Watershed states:
“A municipal supply watershed is one that serves a public water system as defined in
Public Law 93-523 (Safe Drinking Water Act); or as defined in State safe drinking water
regulations. The definition does not include communities served by a well or confined
ground water unaffected by Forest Service activities.”
From Forest Service Manual 2542.1 on Municipal Supply Watershed Planning:
1. Existing water resource conditions as determined by a hydrologic investigation (FSM
2530).
2. Current uses, values, and management requirements for other National Forest
resources.
3. Projection of use in the watershed under multiple-use management practices.
4. Current and proposed handling and treatment of water by the municipality, or other
water user, after water is diverted from the municipal supply watershed.
35
A major portion of the Upper Rio Bonito watershed feeds into Bonito Reservoir and is a
Municipal Supply Watershed. This alternative action will likely see some sedimentation
introduced into this reservoir.
Conclusion for Alternative 3
Results from this alternative will help reduce the risk of catastrophic wildfire by reducing
potential sediment amount by 800% to 2000% (depending on soil texture and slope)
when compared to a post-wildfire scenario as seen in the No Action alternative result.
The greatest potential sediment loss comes out of the Bear Creek/Rio Bonito and
Wilderness (see Appendix A – “WEPP FuMe Output Summary Result for Bonito with
dominant soil texture description”) area due to the progressively steeper slopes towards
the western end of the Upper Rio Bonito. This is matched well with a wildfire model that
was produced by a fuels specialist to determine the potential fire severity. The fire
severity map showed that the Bear Creek/Rio Bonito and Wilderness portions would
sustain the greater percentages of high and moderate severity burns under this alternative
in a post-wildfire scenario.
Alternative 4 – Wilderness Supplemental Alternative
Alternative 4 is proposed as a supplement to any of the above alternatives. This
supplement would allow for the use of chainsaws in the White Mountain Wilderness to
selectively thin up to 300 acres which would act as fuel breaks. Fuel breaks will be
located in the southeast portion of the project along critical boundaries which border
private lands and subdivisions. Fuel break areas lie within the CWPP for the Greater
Ruidoso Area and are adjacent to urban populations. Chainsaws would also be used to
construct fireline in areas within the White Mountain Wilderness.
Direct and Indirect Effects:
All activities described in the proposed action have the potential to disturb soils
encouraging additional erosion and sedimentation to occur. Little or no impact to a
Category 5 impaired stream channel, Rio Bonito, below the dam. Activities through
mechanical thinning and/or prescription burns will result in a temporary increase in
sediment movement from exposed areas, increased activity on roads and other ground
disturbances in areas undergoing treatments. Soil erosion is directly related to the amount
of cover that is left intact to reduce the impact of rainfall. Logs, litter, duff, needle cast
and rock are effective in reducing soil displacement from raindrop impact.
The proposed action may see a reduction in soil productivity and development on sites
where soils have become compacted, displaced, or burned. Improve watershed and soil
conditions will be likely over the long term when fuels are reduced and that the potential

36
threat to catastrophic wildfire become less of a risk. With the reduction of trees and
shrubs (ie. fuels) will reduce the amount of surface area for rain and snow to collect on
allowing moisture to fall on the ground. In some areas this will help improve soil
moisture and the retention of water.
The wilderness supplemental inclusion of 300 acres to any of the two alternatives will
add to the additional sedimentation.
Based on erosion modeling scenarios using the WEPP FuMe model (see Appendix A –
Output Summary Result) background erosion rate result in an undisturbed forest would
be about 6.4 to 32 yd3/mi
2/yr. If existing low access road network is included with
background erosion rate then it would be from 6.8 to 38.4 yd3/mi
2/yr. For existing high
access road network it would be from 7.1 to 48.9 yd3/mi
2/yr. This is dependent on the
percentage of road network that crosses live water during major runoff events and
relative proximity to stream channels where cross drains can redirect runoff water into
channels. Also, increased sedimentation is also dependent on rainfall duration, amount
and intensity versus drier seasons. For prescribed burn results erosion rate would be from
51 to 326 yd3/mi
2/yr depending on soil texture and slope. And for thinning results erosion
rate would be from 6.4 to 185 yd3/mi
2/yr whether it’s commercial or pre-commercial
thinning. Combination of prescribed burn, low access road network, and thinning would
produce an erosion rate of 64.2 to 549.4 yd3/mi
2/yr. For prescribed burn, high access road
network and thinning operations you would see an erosion rate from 64.2 to 559.9
yd3/mi
2/yr.
Cumulative Effects:
Past, present and foreseeable future projects or actions that have affected or will affect
the project area include historic heavy grazing, prescribed and natural fires, wildfire
suppression, invasive exotic plants, dispersed recreation and water development. These
occurrences have contributed incrementally to effects that have changed ecological
conditions of the area. Other activities being conducted over the watersheds include
recreation, mining, farming, wildlife management, and activities associated with rural
residential communities.
Historic heavy livestock grazing throughout the watersheds around the turn of the 19th
to
the 20th
century resulted in a reduction in native grasses and an increase in shrubs. In
addition, the introduction of African grasses, most obviously Lehmann lovegrass
(Eragrostis lehmanniana), 50 to 60 years ago has resulted in displacement of native
grasses in the most disturbed areas. In some areas, removal of vegetation by grazing
resulted in soil loss followed by site occupation by exotic grasses. Best Management
Practices (BMPs) to mitigate grazing effects have since been implemented on Federal
lands, with a general improvement in conditions. Soil loss, however, is most likely
irretrievable in human time frames (100 years), and methods to reverse site occupation by
exotic grasses in a wildland situation have not been developed.
37
Historic fuel wood harvesting in the project area was conducted prior to BMPs. This has
also contributed to historic soil loss and increase in shrubs.
Wildfire suppression activities since the establishment of the National Forest is
contributing to the trend of increased shrubs and tree density with associated decreases in
grasses on National Forest land.
Recreation impacts are primarily from vehicle use on roads (both un-surfaced and gravel)
and trails. Continued use of these activities have the potential to increase sediment in
drainage channels, and in the case of off-road use, severely disturb vegetation and soils.
Presently, OHV use is significant in this area and as this outdoor recreation activity
grows in popularity with Bonito Lake area as being the prime recreational area on the
Lincoln National Forest. Unregulated use has the potential to some times create wildcat
roads and undesignated stream crossings which can pose an impact to the watershed.
Mining activity have occurred within and adjacent to the project area since the mid
1800’s. Historic surface and underground mining is a ground disturbing activity by
definition and causes numerous effects, some irreversible, to the environment. Historic
mining activity can have adverse effects to soil and water quality caused by excess
sediment and pollutants from areas of waste rock dumps or processed ore. Vegetation
can be impacted due to the need for large volumes of fuel wood to process ore. Water
quantities may also be impacted since water is generally necessary for present day
commercial mining activities. Currently, there is no planned commercial mining activity
reported within the project area. However, since the area is a mining district with historic
mineral production, there is a potential, that within the next century, renewed exploration
and extraction could occur should mining becoming viable again.
Farming is not a significant use in the upper portion of the watersheds. Presently,
farming does not take place on Forest land within the watershed. However, farming is
significant in the lower portions of the watersheds off Forest lands. Farming can impact
water quantity since irrigation uses groundwater and diverted surface water. Farming can
also impact water quality since agricultural chemicals can pollute surface and
groundwater. Sedimentation from the farm fields can impact the streams down stream
from farms.
Rural and urban development (all off Forest) in the watersheds has resulted in loss of
vegetation, increased polluted runoff from roads and disturbed areas, and increased
groundwater and surface water use.
Livestock grazing may impact soil, water and riparian function in a number of ways
including compacting the soil surface (hydrologic function), removing plant material
(stability), or changing the plant community composition (nutrient cycling). All soils on
these allotments must be managed to maintain or improve long-term productivity (Forest
Plan goals and objectives). This can be accomplished by implementing Best
Management Practices (BMP's) such as, but not limited to:
38
(1) annually prepare an operating plan with the permittee to allow for current allotment
conditions;
(2) make periodic field checks to identify needed adjustments in season and livestock
numbers including stock counts, forage utilization, assessment of rangeland to verify soil
and vegetative condition and trend;
(3) and use necessary techniques to achieve proper distribution, or lessen the impact on
areas which are sensitive or which would naturally be overused including riding and
herding to shift livestock locations, using salt or supplement feed, range improvements,
prescribed burning, trail construction, seeding, or prevention of intensive livestock
grazing or concentrated livestock use on soils that have low bearing strength and are wet
(see BMP’s descriptions.and guidelines).
Effects Relative to Significant Issues:
There are certain resource conditions that need to be considered before determining
whether extraordinary circumstances related to this alternative action (should it be
chosen) would require further analysis and documentation into an EA or an EIS format as
listed in FSH Interim Directive No. 1909.15-2004-1, approved June 29, 2004.
Floodplains, Wetlands, or Municipal Watersheds -
Floodplains: Executive Order 11988 directs agencies to avoid adverse impacts
associated with the occupancy and modification of floodplains. Floodplains are defined
by this order as “. . . the lowland and relatively flat areas adjoining inland and coastal
waters including flood prone areas of offshore islands, including at a minimum, that area
subject to a one percent (100-year recurrence)or greater chance of flooding in any one
year.
This alternative action will not alter or have adverse impacts to any floodplains within the
Bonito project area.
Wetlands: Executive Order 11990 is to avoid adverse impacts associated with destruction
or modification of wetlands. Wetlands are defined by this order as, “….areas inundated
by surface or ground water with a frequency sufficient to support and under normal
circumstances does or would support a prevalence of vegetative or aquatic life that
requires saturated or seasonally saturated soil conditions for growth and reproduction.
Wetlands generally include swamps, marshes, bogs, and similar areas such as sloughs,
potholes, wet meadows, river overflows, mud flats, and natural ponds.”
There are no mapable wetlands found within this project area on National Forest Service
lands. The definition of “mapable wetlands” according to FSM 2527.05 on definitions:
“Mapable Wetlands. A 1:24,000 scale map area of at least 0.05 square inches (a square
0.22 inches per side or a circle with a diameter of 0.25 inches). Include smaller wetlands
providing habitat for threatened, endangered or sensitive species.”
39
Two hundred feet equals 0.1 inch at a map scale of 1:24,000. A mapable area of 0.05
square inches is approximately 4.5 acres. According to FSM 2527.1 directive there is no
“mapable wetlands” located within the Bonito project area on Forest Service lands.
There are three requirements for a wetland:
1. Hydric Soils
2. Hydrophytic Vegetation (Emergent Vegetation)
3. Wetland Vegetation
There are no wetlands in this area.
Municipal Watersheds: Municipal watersheds are managed under multiple use
prescriptions in land and resource management plans.
The watershed of the Upper Rio Bonito (above the dam) is defined as a “Municipal
Supply Watershed” area according to the Washington Office Forest Service Manual
2542.05. The definition of a Municipal Supply Watershed states:
“A municipal supply watershed is one that serves a public water system as defined in
Public Law 93-523 (Safe Drinking Water Act); or as defined in State safe drinking water
regulations. The definition does not include communities served by a well or confined
ground water unaffected by Forest Service activities.”
From Forest Service Manual 2542.1 on Municipal Supply Watershed Planning:
1. Existing water resource conditions as determined by a hydrologic investigation (FSM
2530).
2. Current uses, values, and management requirements for other National Forest
resources.
3. Projection of use in the watershed under multiple-use management practices.
4. Current and proposed handling and treatment of water by the municipality, or other
water user, after water is diverted from the municipal supply watershed.
This area is below Bonito Reservoir and is not considered as part of the Municipal
Supply Watershed.
Conclusion for Alternative 4
Results from this alternative will help reduce the risk of catastrophic wildfire by reducing
potential sediment amount by 1350% to 1850% in this area alone when compared to a
post-wildfire scenario as seen in the No Action alternative result. With the lesser slopes
on the eastern end of the project area the erosion rate is expected to be less (see Appendix

40
A – Table 10.0. Output Summary Result for the Philadelphia Canyon area where the said
wilderness area is to the south of it).
Table 8. Comparison of Alternatives
Item of
Comparison
No Action
Alternative
Proposed
Action
Alternative
(with road)
Alternative 3
(no road)
Alternative 4
(chainsaw in
wilderness)
Improve
watershed
condition
x
x
x
Reduce risk of
wildfire x x x
Improve
hydrologic
function
x
x
x
Minimal x

41
sedimentation
or erosion Significant
increase in
sedimentation
and erosion
from wildfire
x
(significantly
reduced)
(significantly
reduced)
(significantly
reduced)
Additional
increase in
potential
sedimentation
x (additional 4 miles
of temporary road,
slight increase in
sedimentation
potential)
x (additional 300 acres
will see additional
increase in potential
sedimentation)
Impact to
Category 5
impaired
stream below
dam
x (significant
impact, post-
wildfire)
x (little or no impact)
x (little or no impact)
x (little or no impact)
5. Mitigation/Environmental Protection Measures
Table 9.0 Mitigation/Environmental Protection Measures
Mitigation Measure Description
Purpose
(Avoid, minimize,
reduce, eliminate,
compensate)
Applicable
Alternative
(All, 1,2,3,4)
Best Management Practices. Refer
to R3 Soil and Water Conservation
Practices Handbook when
applying treatments to project area
to minimize impact and apply
erosion prevention measures on
disturbed lands.
Reduce negative impact to
soils and hydrology.
2, 3, and 4
100 feet buffer zone from active Minimize negative impact to 2, 3, and 4

42
streamside (i.e. perennial) and
active wet area (springs, seeps,
wetlands).
live waters from project
activities.
50 feet buffer zone from
ephemeral and intermittent
channels
Reduce travel pathways
opportunities for loose
sediment materials during
precipitation events.
2, 3, and 4
6. Monitoring Recommendations
Table 10.0 Monitoring Recommendations
Monitoring Description
Applicable
Alternative
(All, 1,2,3,4)
Type Of Monitoring
(Implementation,
Effectiveness,
Validation)
Monitor and confirm buffer zone
restriction as seen in #5
Mitigation/Environmental
Protection Measures
2, 3 and 4 During and after
project work
43
7. LITERATURE CITED
Brady, Nyle C. 1990. The Nature and Properties of Soils. Tenth Edition. Macmillian
Publishing Company.
Burroughs, E.R., Jr.; King, J. G. 1989. Reduction of soil erosion on forest roads. General
Technical Report INT-GTR-264. Ogden, UT: U.S. Forest Service Intermountain
Research Station. 24 p.
City of Alamogordo Engineering Department. Preliminary Water Resource and Site
Improvement Plan. April 1992.
DeBano, L. F. and Schmidt, L. J. Improving Riparian Areas Through Watershed
Management. General Technical Report RM-182. Fort Collins, CO: USDA Forest
Service, Rocky Mountain Forest and Range Experiment Station.
Dynamic Corporation. Site Characterization Report. Parsons Mine Tract. Smokey Bear
Ranger District. September 4, 1998.
Elliot, William J., Robichaud, Peter R, Miller, Sue I. 2007. Erosion Rates from Forests
and Rangelands Following Fuel Management. Soil and Water Engr Research Work Unit,
US Forest Service Rocky Mountain Research Station.
Furniss, M.J., T.D. Roeloffs, and C.S. Lee. 1991. Road construction and maintenance.
Pages 297-323 in W.R. Meehan, editor. Influences of forest and rangeland management
on salmonid fishes and their habitats. Special publication 19. American Fisheries Society,
Bethesda, Maryland.
Geology and Aggregate Resources District II, New Mexico State Highway Department,
Santa Fe New Mexico, 1972.
John Shomaker and Associates, Inc., 2002. City of Alamogordo 40 Year Water
Development Plan 2005 - 2045, Executive Summary
Keys to Soil Taxonomy, Soil Survey Staff, United States Department of Agriculture,
Natural Resources Conservation Service, Tenth Edition 2006
Memo from Richard W. Koehler. 1990. “Abandoned Mine Land Burea. Mining Division
“Report on Ruidoso Area Meeting Concerning Hazards identified by USFS Near Bonito
Lake.”
New Mexico Environment Department, 2008. Procedures for Assessing Use Attainment
for the State of New Mexico Integrated Clean Water Act 303(d)/305(b) Water Quality
Monitoring and Assessment Report: Assessment Protocol
44
New Mexico Environment Department, 2003. Total Maximum Daily Load for the Rio
Hondo Watershed, Appendix H.
NOAA Precipitation-Frequency Atlas of the United States. Atlas 14, Volume 1, Version
3. RUIDOSO 2 NNE , NEW MEXICO (29-7649) 33.3833 N 105.6167 W 2193 meters.
Ronnie, Rappmund, 1989. Bonito Lake Area report. Bureau of Reclamation, Denver
Office. Ground Water Branch, Geohydraulics Section.
Soil Survey Manual, Soil Survey Division Staff, United States Department of
Agriculture, Handbook No. 18, October 1993
Terrestrial Ecosystem Survey Handbook, FSH 2509.14 R-3 United States Department of
Agriculture, Forest Service Region 3, Albuquerque, New Mexico
Tularosa Basin and Salt Basin. Regional Water Plan 2000 - 2040. Vol. 1. South Central
Mountain RC&D Council, Inc.
USDA Forest Service, Southwestern Region, 1986. Lincoln National Forest Plan as
amended.
USDA Forest Service, Southwestern Region, 1989, Riparian Area Survey and Evaluation
System (RASES).
USDA Forest Service, 1999, Forest Service Handbook 2509.18, Soil Management
Handbook, R3 Supplement No. 2509.18-99-1.
USDA Forest Service, 2000, Forest Service Manual 2526, Riparian Area Management.
Wallace, G., and Komives, B., 1989. U.S. Bureau of Reclamation Study of the Bonito
Watershed Area. City of Alamogordo, New Mexico.
Western Regional Climate Center. Online at http://www.wrcc.dri.edu/index.html
45
8. Appendix
Appendix A - Model Run for Bonito Project Area using WEPP FuMe
The Bonito project area is located within three different 6th
HUC watersheds (Upper and
Middle Rio Bonito, and Magado Canyon) on the Lincoln National Forest. The majority
of the project area lies within the Upper Rio Bonito watershed. An USDA approved
modeling program called “Fuel Management Erosion Analysis (FuME) was used to
analyze potential erosion from site disturbances such as prescribed fire or mechanical
thinning. This online software program can be found on the Forest Service WEPP
website (http://forest.moscowfsl.wsu.edu/fswepp/).
This modeling program helps provide baseline potential sediment loss (under the “No
Action” scenario) using the unit “tons per acre per year” (t/ac/yr) or “tons per square
miles per year” (t/mi2/yr). Results are compared with the Proposed Action and other
alternatives including the no action alternative.
MODELING PROGRAM: Water Erosion Prediction Project (WEPP) Fuel Management
(FuMe) Tool Application for fuel treatment. The WEPP FuME model used for this EA
project.
PURPOSE OF THE MODEL: WEPP FuMe estimates sediment generated by fuel
management activities.
METHODOLOGY: WEPP FuMe estimates background erosion rates and compares
sediment loads and erosion from wildfire, thinning, prescribed fire, and low- and high-
use road networks for a given topography. Soil and water databases are the same as those
used for WEPP. It requires input as a series of representative hillslopes from a watershed.
It is intended to be used as a planning tool for NEPA analysis and similar documentation.
ASSUMPTIONS: WEPP FuME is an application of the WEPP model with a series of
standard assumptions built in regarding the management of forests for hazardous fuels
reduction. The built-in assumptions allow rapid comparison of numerous common fuel
management practices without explicitly producing a WEPP model.
LIMITATIONS: Small sub-watershed scale of 640 acres or less. Horizontal slope length
is limited up to 1500 feet. WEPP FuMe only models hillslope surface erosion processes.
It does not model channel processes such as sediment transport and gullying. The
interface does not model landslides on disturbed hillslopes or on road networks. It
provides only 4 soil textures to choose from and that clay loam and loam are the
dominant soil textures found on the Bonito project. Other short-comings or limitations
include the under or over-predicting sediment amount. A range of numbers is provided to
cover the potential amount in the loss of sediment.
46
OUTPUT: Twelve output runs with long-term averages based on time between
disturbances. A narrative is then presented that aids the user in interpreting and reporting
the results. The model results are based on seven forest conditions.
1. Undisturbed mature forest
2. Wildfire
3. Prescribed fire
4. Thinning
5. No traffic roads
6. Low traffic roads
7. High traffic roads
All model outputs are computed as tons of sediment per square mile (tons/mi2/yr) of
contributing area for the year of disturbance. The WEPP FuME model will compute
average sediment yield per year if a value is entered for disturbance return period. The
climate, soil texture, topography, road density, wildfire return interval, prescribed fire
cycle and thinning cycle are specified by the user. The three road runs are summarized
on a low access range (for no traffic and low traffic) and a high access range (for low
traffic and high traffic with gravel). Road erosion is assumed to occur every year.
More information about the WEPP FuME on output can be found at:
http://forest.moscowfsl.wsu.edu/fswepp/docs/fume/WEPP_FuME.pdf
Disturbance Return Period for WEPP FuME input:
- Wildfire: 5 to 15 years (Mixed Con); 3 to 10 years (Ponderosa) ; 10 to 25 years (Pinyon-
Juniper). Average return interval is 26 years for WEPP FuME input.
- Prescribed Fire: 1 to 5 years: average is 3 years for WEPP FuME input.
- Thinning: return interval for thinning, for pre-commercial will be 20 - 30 years, for
commercial will be 40-50 years.
- Road Density: Upper Rio Bonito (1.18); Magado Canyon (2.46); Middle Rio Bonito
(1.44). Upper Rio Bonito watershed’s low road density value is due to the lack of roads in
the White Mountain Wilderness.
For wilderness thinning and prescribed burning, chainsaw use is proposed for work at
boundary line near the southeastern end of the project boundary adjacent to the non-
wilderness portion of the forest. Average mechanical thinning is done every 25 years.
Wilderness contain mostly of the mixed conifer variety (approx 21,564 acres for entire
project area in elevation ranging from 7400 to11200 feet). Average wildfire return
interval is 26 years according to fuel specialist.
Typical hillslope profiles from various sub-watersheds within the project area were used
for this modeling exercise. In higher elevation sub-watersheds gradients become
increasingly steeper in mixed conifers and to some extent in the ponderosa pines. In
lower elevation near the eastern end of the project area slopes become increasingly less.
Slope values chosen for this modeling exercise ranged from 5 to 40 percent. For the
wilderness portion of the modeling slopes in the Tanbark and Bear Creek/Rio Bonito area
47
cover this as they are adjacent to the wilderness and share many of the same soil textures
and steeper slopes.
Soil textures were identified using the Terrestrial Ecosystem Unit (TEU) Data to
determine areas containing either predominantly loam, clay loam, sandy loam or silt loam
for the model program. Dominant soils within the Bonito project are either loam or clay
loam characteristics. Relative soil erodibility values are built into the WEPP FuME
program based on one of the four soil textures chosen. For the Bonito project area
dominant soil textures are either clay loam or loam.
Climate data for the Ruidoso area was manually constructed using one available climate
data built into the WEPP FuME program. Using Ruidoso climate data from the Western
Regional Climate Center data was modified for input the WEPP model.
Modeling runs were based on 50 years of possible weather events.
All results can be seen in the summary analysis in Appendix A. Summary analysis
includes 1) Background sedimentation erosion rate for “Undisturbed Forest” pre and post
wildfire results. 2) Thinning effects on erosion rate and from wildfire effects. 3)
Prescribed fire effects and from wildfire results. 4) Combination from thinning and
prescribed fire. 5) Road impacts due to design and road density effects.
Analyst requirement:
WEPP FuMe is an online interface that can be run with any recent Web browser.
Data inputs
Climate
Soil texture
Road density
Length(s) of treated hillslope(s)
Length(s) of untreated buffers(s)
Hillslope gradient
Time between disturbances
Linkage to other models/tools:
WEPP FuMe is part of a set of tools online at http://forest.moscowfsl.wsu.edu/fuels.
Developers (partners) USDA Forest Service, Rocky Mountain, Pacific Northwest, North
Central, and Pacific Southwest Research Stations.
A WEPP FuME Caveat:
As with any software modeling runs there are certain inherent uncertainties that go with
the WEPP FuMe software program. In some reports on the use of this model the stated
accuracy of WEPP FuME was that the true erosion rate could come within plus or minus
50 percent of the predicted value according to some observed values that fell within the
predicted range. This online software is used as part of our NEPA planning tool for our
erosion prediction efforts and it is the best available science to use for our NEPA
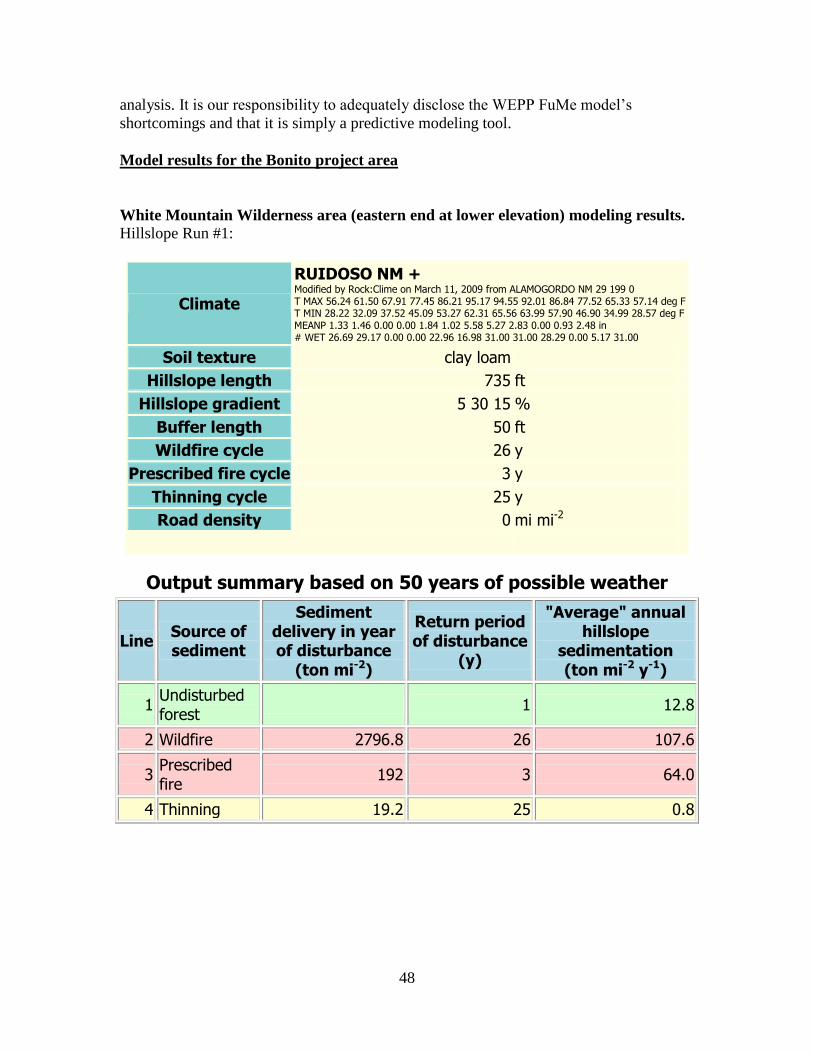
48
analysis. It is our responsibility to adequately disclose the WEPP FuMe model’s
shortcomings and that it is simply a predictive modeling tool.
Model results for the Bonito project area
White Mountain Wilderness area (eastern end at lower elevation) modeling results.
Hillslope Run #1:
Climate
RUIDOSO NM + Modified by Rock:Clime on March 11, 2009 from ALAMOGORDO NM 29 199 0 T MAX 56.24 61.50 67.91 77.45 86.21 95.17 94.55 92.01 86.84 77.52 65.33 57.14 deg F T MIN 28.22 32.09 37.52 45.09 53.27 62.31 65.56 63.99 57.90 46.90 34.99 28.57 deg F MEANP 1.33 1.46 0.00 0.00 1.84 1.02 5.58 5.27 2.83 0.00 0.93 2.48 in # WET 26.69 29.17 0.00 0.00 22.96 16.98 31.00 31.00 28.29 0.00 5.17 31.00
Soil texture clay loam
Hillslope length 735 ft
Hillslope gradient 5 30 15 %
Buffer length 50 ft
Wildfire cycle 26 y
Prescribed fire cycle 3 y
Thinning cycle 25 y
Road density 0 mi mi-2
Output summary based on 50 years of possible weather
Line Source of sediment
Sediment delivery in year of disturbance
(ton mi-2)
Return period of disturbance
(y)
"Average" annual hillslope
sedimentation (ton mi-2 y-1)
1 Undisturbed forest
1 12.8
2 Wildfire 2796.8 26 107.6
3 Prescribed fire
192 3 64.0
4 Thinning 19.2 25 0.8

49
Hillslope Run #2:
Climate
RUIDOSO NM + Modified by Rock:Clime on March 11, 2009 from ALAMOGORDO NM 29 199 0 T MAX 56.24 61.50 67.91 77.45 86.21 95.17 94.55 92.01 86.84 77.52 65.33 57.14 deg F T MIN 28.22 32.09 37.52 45.09 53.27 62.31 65.56 63.99 57.90 46.90 34.99 28.57 deg F MEANP 1.33 1.46 0.00 0.00 1.84 1.02 5.58 5.27 2.83 0.00 0.93 2.48 in # WET 26.69 29.17 0.00 0.00 22.96 16.98 31.00 31.00 28.29 0.00 5.17 31.00
Soil texture clay loam
Hillslope length 940 ft
Hillslope gradient 5 38 10 %
Buffer length 50 ft
Wildfire cycle 26 y
Prescribed fire cycle 3 y
Thinning cycle 25 y
Road density 0 mi mi-2
Output summary based on 50 years of possible weather
Line Source of sediment
Sediment delivery in year of disturbance
(ton mi-2)
Return period of disturbance
(y)
"Average" annual hillslope
sedimentation (ton mi-2 y-1)
1 Undisturbed forest
1 25.6
2 Wildfire 3795.2 26 146.0
3 Prescribed fire
268.8 3 89.6
4 Thinning 32 25 1.3
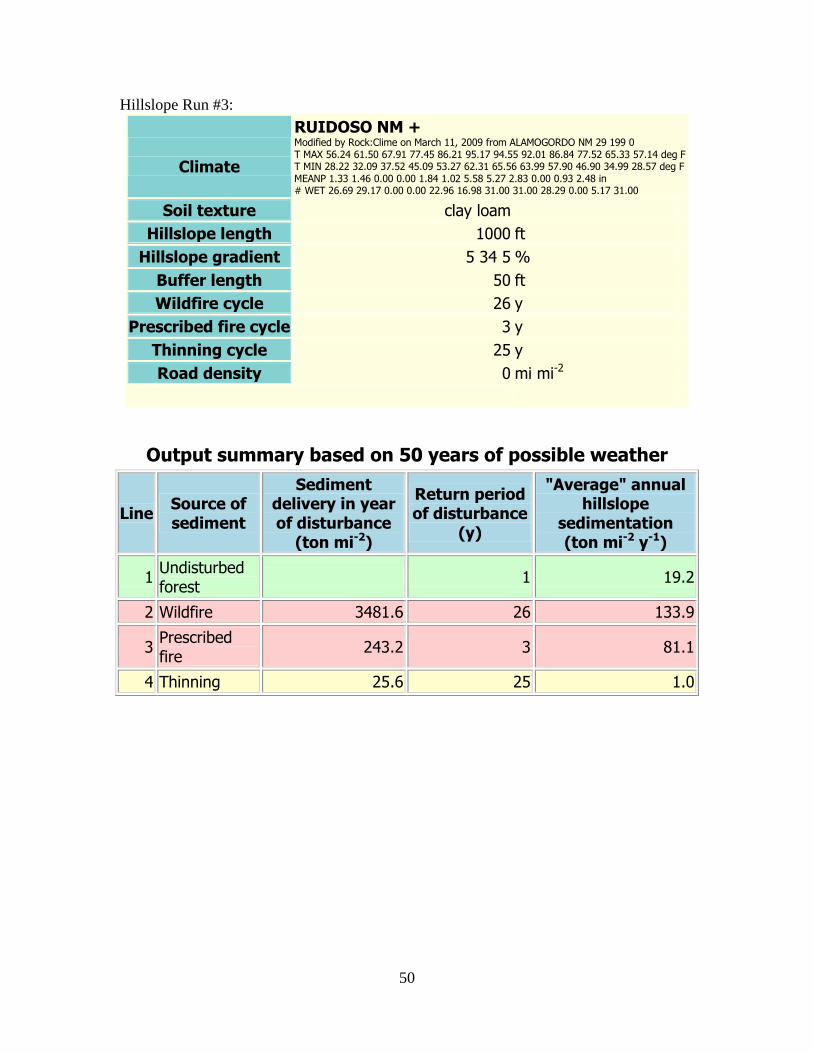
50
Hillslope Run #3:
Climate
RUIDOSO NM + Modified by Rock:Clime on March 11, 2009 from ALAMOGORDO NM 29 199 0 T MAX 56.24 61.50 67.91 77.45 86.21 95.17 94.55 92.01 86.84 77.52 65.33 57.14 deg F T MIN 28.22 32.09 37.52 45.09 53.27 62.31 65.56 63.99 57.90 46.90 34.99 28.57 deg F MEANP 1.33 1.46 0.00 0.00 1.84 1.02 5.58 5.27 2.83 0.00 0.93 2.48 in # WET 26.69 29.17 0.00 0.00 22.96 16.98 31.00 31.00 28.29 0.00 5.17 31.00
Soil texture clay loam
Hillslope length 1000 ft
Hillslope gradient 5 34 5 %
Buffer length 50 ft
Wildfire cycle 26 y
Prescribed fire cycle 3 y
Thinning cycle 25 y
Road density 0 mi mi-2
Output summary based on 50 years of possible weather
Line Source of sediment
Sediment delivery in year of disturbance
(ton mi-2)
Return period of disturbance
(y)
"Average" annual hillslope
sedimentation (ton mi-2 y-1)
1 Undisturbed forest
1 19.2
2 Wildfire 3481.6 26 133.9
3 Prescribed fire
243.2 3 81.1
4 Thinning 25.6 25 1.0

51
Philadelphia Canyon area modeling results.
Hillslope Run #1 for commercial thinning
Climate
RUIDOSO NM + Modified by Rock:Clime on March 11, 2009 from ALAMOGORDO NM 29 199 0 T MAX 56.24 61.50 67.91 77.45 86.21 95.17 94.55 92.01 86.84 77.52 65.33 57.14 deg F T MIN 28.22 32.09 37.52 45.09 53.27 62.31 65.56 63.99 57.90 46.90 34.99 28.57 deg F MEANP 1.33 1.46 0.00 0.00 1.84 1.02 5.58 5.27 2.83 0.00 0.93 2.48 in # WET 26.69 29.17 0.00 0.00 22.96 16.98 31.00 31.00 28.29 0.00 5.17 31.00
Soil texture clay loam
Hillslope length 820 ft
Hillslope gradient 10 28 5 %
Buffer length 50 ft
Wildfire cycle 26 y
Prescribed fire cycle 3 y
Thinning cycle 45 y
Road density 1.18 mi mi-2
Output summary based on 50 years of possible weather
Line Source of sediment
Sediment delivery in year of disturbance
(ton mi-2)
Return period of disturbance
(y)
"Average" annual hillslope
sedimentation (ton mi-2 y-1)
1 Undisturbed forest
1 12.8
2 Wildfire 2809.6 26 108.1
3 Prescribed fire
185.6 3 61.9
4 Thinning 19.2 45 0.4
5 Low access roads
1.3 to 45.3 1 1.3 to 45.3
6 High access roads
4.7 to 45.3 1 4.7 to 45.3

52
Hillslope Run #2 for commercial thinning
Climate
RUIDOSO NM + Modified by Rock:Clime on March 11, 2009 from ALAMOGORDO NM 29 199 0 T MAX 56.24 61.50 67.91 77.45 86.21 95.17 94.55 92.01 86.84 77.52 65.33 57.14 deg F T MIN 28.22 32.09 37.52 45.09 53.27 62.31 65.56 63.99 57.90 46.90 34.99 28.57 deg F MEANP 1.33 1.46 0.00 0.00 1.84 1.02 5.58 5.27 2.83 0.00 0.93 2.48 in # WET 26.69 29.17 0.00 0.00 22.96 16.98 31.00 31.00 28.29 0.00 5.17 31.00
Soil texture clay loam
Hillslope length 1050 ft
Hillslope gradient 5 30 10 %
Buffer length 50 ft
Wildfire cycle 26 y
Prescribed fire cycle 3 y
Thinning cycle 45 y
Road density 1.18 mi mi-2
Output summary based on 50 years of possible weather
Line Source of sediment
Sediment delivery in year of disturbance
(ton mi-2)
Return period of disturbance
(y)
"Average" annual hillslope
sedimentation (ton mi-2 y-1)
1 Undisturbed forest
1 19.2
2 Wildfire 3123.2 26 120.1
3 Prescribed fire
230.4 3 76.8
4 Thinning 25.6 45 0.6
5 Low access roads
1.7 to 46.9 1 1.7 to 46.9
6 High access roads
6.5 to 46.9 1 6.5 to 46.9

53
Hillslope Run #3 for commercial thinning
Climate
RUIDOSO NM + Modified by Rock:Clime on March 11, 2009 from ALAMOGORDO NM 29 199 0 T MAX 56.24 61.50 67.91 77.45 86.21 95.17 94.55 92.01 86.84 77.52 65.33 57.14 deg F T MIN 28.22 32.09 37.52 45.09 53.27 62.31 65.56 63.99 57.90 46.90 34.99 28.57 deg F MEANP 1.33 1.46 0.00 0.00 1.84 1.02 5.58 5.27 2.83 0.00 0.93 2.48 in # WET 26.69 29.17 0.00 0.00 22.96 16.98 31.00 31.00 28.29 0.00 5.17 31.00
Soil texture clay loam
Hillslope length 550 ft
Hillslope gradient 5 15 5 %
Buffer length 50 ft
Wildfire cycle 26 y
Prescribed fire cycle 3 y
Thinning cycle 45 y
Road density 1.18 mi mi-2
Output summary based on 50 years of possible weather
Line Source of sediment
Sediment delivery in year of disturbance
(ton mi-2)
Return period of disturbance
(y)
"Average" annual hillslope
sedimentation (ton mi-2 y-1)
1 Undisturbed forest
1 6.4
2 Wildfire 1292.8 26 49.7
3 Prescribed fire
70.4 3 23.5
4 Thinning 6.4 45 0.1
5 Low access roads
0.9 to 24.3 1 0.9 to 24.3
6 High access roads
2.9 to 24.3 1 2.9 to 24.3

54
Philadelphia Canyon area modeling results.
Hillslope Run #1 for pre-commercial thinning
Climate
RUIDOSO NM + Modified by Rock:Clime on March 11, 2009 from ALAMOGORDO NM 29 199 0 T MAX 56.24 61.50 67.91 77.45 86.21 95.17 94.55 92.01 86.84 77.52 65.33 57.14 deg F T MIN 28.22 32.09 37.52 45.09 53.27 62.31 65.56 63.99 57.90 46.90 34.99 28.57 deg F MEANP 1.33 1.46 0.00 0.00 1.84 1.02 5.58 5.27 2.83 0.00 0.93 2.48 in # WET 26.69 29.17 0.00 0.00 22.96 16.98 31.00 31.00 28.29 0.00 5.17 31.00
Soil texture clay loam
Hillslope length 820 ft
Hillslope gradient 10 28 5 %
Buffer length 50 ft
Wildfire cycle 26 y
Prescribed fire cycle 3 y
Thinning cycle 25 y
Road density 1.18 mi mi-2
Output summary based on 50 years of possible weather
Line Source of sediment
Sediment delivery in year of disturbance
(ton mi-2)
Return period of disturbance
(y)
"Average" annual hillslope
sedimentation (ton mi-2 y-1)
1 Undisturbed forest
1 12.8
2 Wildfire 2809.6 26 108.1
3 Prescribed fire
185.6 3 61.9
4 Thinning 19.2 25 0.8
5 Low access roads
1.3 to 45.3 1 1.3 to 45.3
6 High access roads
4.7 to 45.3 1 4.7 to 45.3
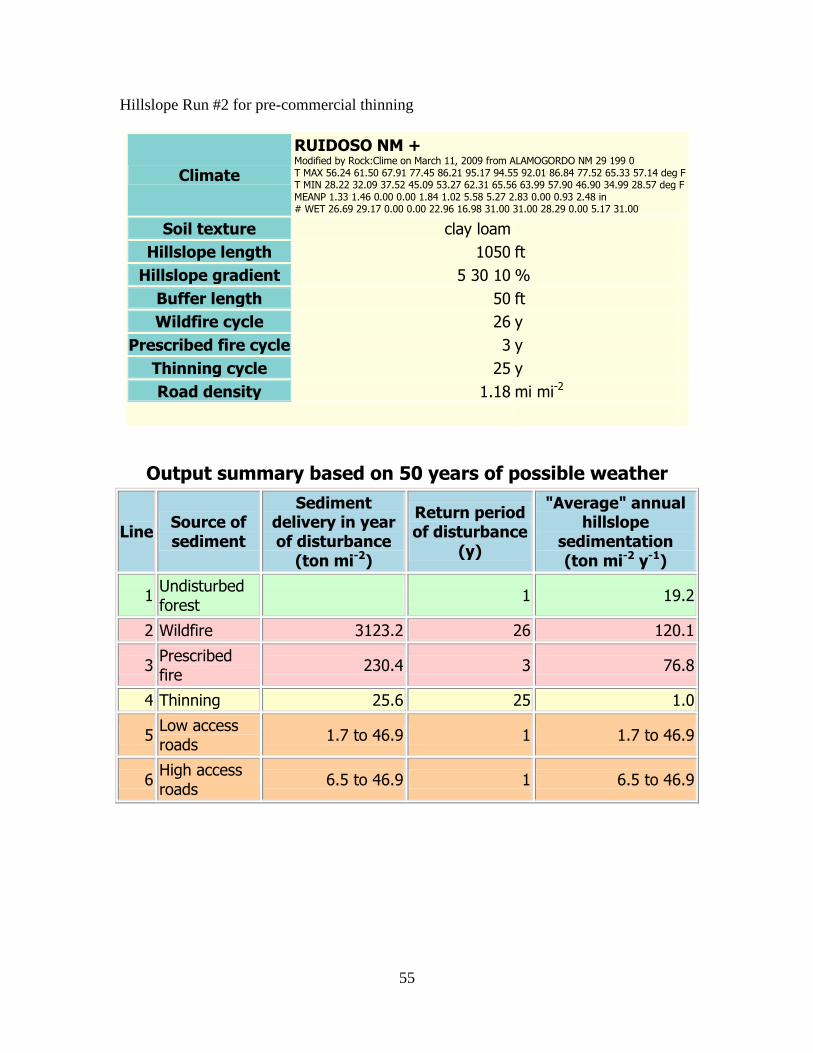
55
Hillslope Run #2 for pre-commercial thinning
Climate
RUIDOSO NM + Modified by Rock:Clime on March 11, 2009 from ALAMOGORDO NM 29 199 0 T MAX 56.24 61.50 67.91 77.45 86.21 95.17 94.55 92.01 86.84 77.52 65.33 57.14 deg F T MIN 28.22 32.09 37.52 45.09 53.27 62.31 65.56 63.99 57.90 46.90 34.99 28.57 deg F MEANP 1.33 1.46 0.00 0.00 1.84 1.02 5.58 5.27 2.83 0.00 0.93 2.48 in # WET 26.69 29.17 0.00 0.00 22.96 16.98 31.00 31.00 28.29 0.00 5.17 31.00
Soil texture clay loam
Hillslope length 1050 ft
Hillslope gradient 5 30 10 %
Buffer length 50 ft
Wildfire cycle 26 y
Prescribed fire cycle 3 y
Thinning cycle 25 y
Road density 1.18 mi mi-2
Output summary based on 50 years of possible weather
Line Source of sediment
Sediment delivery in year of disturbance
(ton mi-2)
Return period of disturbance
(y)
"Average" annual hillslope
sedimentation (ton mi-2 y-1)
1 Undisturbed forest
1 19.2
2 Wildfire 3123.2 26 120.1
3 Prescribed fire
230.4 3 76.8
4 Thinning 25.6 25 1.0
5 Low access roads
1.7 to 46.9 1 1.7 to 46.9
6 High access roads
6.5 to 46.9 1 6.5 to 46.9

56
Hillslope Run #3 for pre-commercial thinning
Climate
RUIDOSO NM + Modified by Rock:Clime on March 11, 2009 from ALAMOGORDO NM 29 199 0 T MAX 56.24 61.50 67.91 77.45 86.21 95.17 94.55 92.01 86.84 77.52 65.33 57.14 deg F T MIN 28.22 32.09 37.52 45.09 53.27 62.31 65.56 63.99 57.90 46.90 34.99 28.57 deg F MEANP 1.33 1.46 0.00 0.00 1.84 1.02 5.58 5.27 2.83 0.00 0.93 2.48 in # WET 26.69 29.17 0.00 0.00 22.96 16.98 31.00 31.00 28.29 0.00 5.17 31.00
Soil texture clay loam
Hillslope length 550 ft
Hillslope gradient 5 15 5 %
Buffer length 50 ft
Wildfire cycle 26 y
Prescribed fire cycle 3 y
Thinning cycle 25 y
Road density 1.18 mi mi-2
Output summary based on 50 years of possible weather
Line Source of sediment
Sediment delivery in year of disturbance
(ton mi-2)
Return period of disturbance
(y)
"Average" annual hillslope
sedimentation (ton mi-2 y-1)
1 Undisturbed forest
1 6.4
2 Wildfire 1292.8 26 49.7
3 Prescribed fire
70.4 3 23.5
4 Thinning 6.4 25 0.3
5 Low access roads
0.9 to 24.3 1 0.9 to 24.3
6 High access roads
2.9 to 24.3 1 2.9 to 24.3
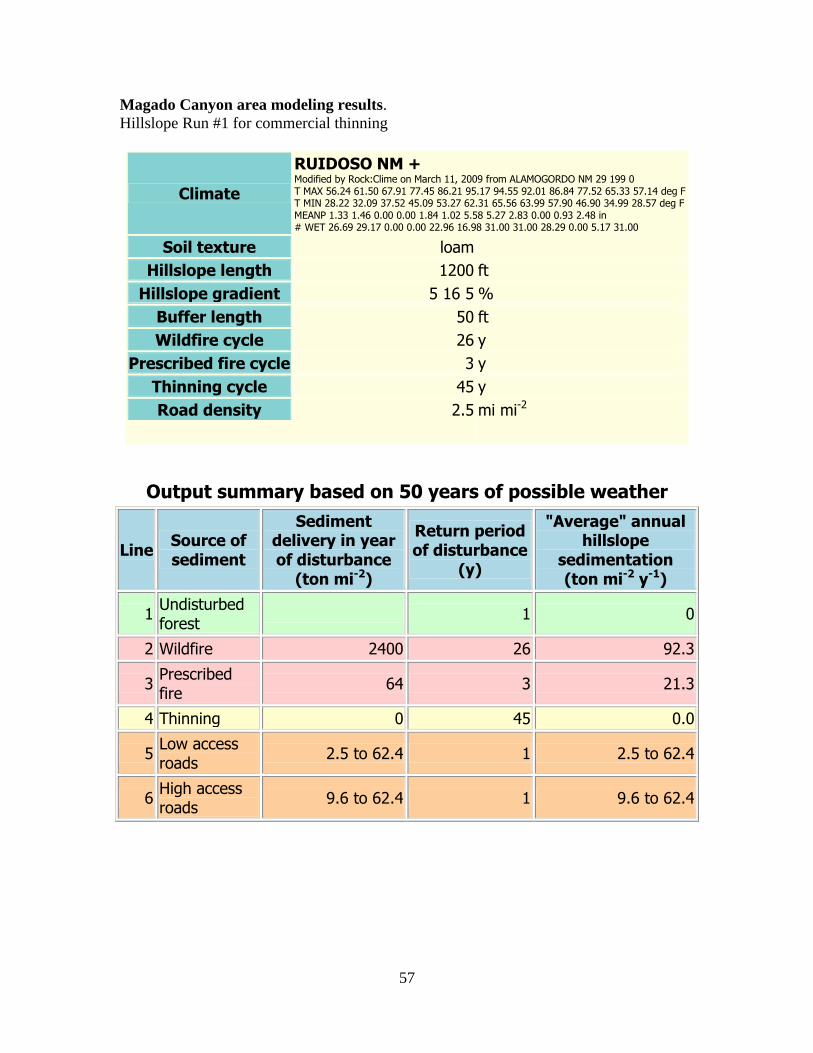
57
Magado Canyon area modeling results.
Hillslope Run #1 for commercial thinning
Climate
RUIDOSO NM + Modified by Rock:Clime on March 11, 2009 from ALAMOGORDO NM 29 199 0 T MAX 56.24 61.50 67.91 77.45 86.21 95.17 94.55 92.01 86.84 77.52 65.33 57.14 deg F T MIN 28.22 32.09 37.52 45.09 53.27 62.31 65.56 63.99 57.90 46.90 34.99 28.57 deg F MEANP 1.33 1.46 0.00 0.00 1.84 1.02 5.58 5.27 2.83 0.00 0.93 2.48 in # WET 26.69 29.17 0.00 0.00 22.96 16.98 31.00 31.00 28.29 0.00 5.17 31.00
Soil texture loam
Hillslope length 1200 ft
Hillslope gradient 5 16 5 %
Buffer length 50 ft
Wildfire cycle 26 y
Prescribed fire cycle 3 y
Thinning cycle 45 y
Road density 2.5 mi mi-2
Output summary based on 50 years of possible weather
Line Source of sediment
Sediment delivery in year of disturbance
(ton mi-2)
Return period of disturbance
(y)
"Average" annual hillslope
sedimentation (ton mi-2 y-1)
1 Undisturbed forest
1 0
2 Wildfire 2400 26 92.3
3 Prescribed fire
64 3 21.3
4 Thinning 0 45 0.0
5 Low access roads
2.5 to 62.4 1 2.5 to 62.4
6 High access roads
9.6 to 62.4 1 9.6 to 62.4

58
Hillslope Run #2 for commercial thinning
Climate
RUIDOSO NM + Modified by Rock:Clime on March 11, 2009 from ALAMOGORDO NM 29 199 0 T MAX 56.24 61.50 67.91 77.45 86.21 95.17 94.55 92.01 86.84 77.52 65.33 57.14 deg F T MIN 28.22 32.09 37.52 45.09 53.27 62.31 65.56 63.99 57.90 46.90 34.99 28.57 deg F MEANP 1.33 1.46 0.00 0.00 1.84 1.02 5.58 5.27 2.83 0.00 0.93 2.48 in # WET 26.69 29.17 0.00 0.00 22.96 16.98 31.00 31.00 28.29 0.00 5.17 31.00
Soil texture loam
Hillslope length 400 ft
Hillslope gradient 10 34 10 %
Buffer length 50 ft
Wildfire cycle 26 y
Prescribed fire cycle 3 y
Thinning cycle 45 y
Road density 2.5 mi mi-2
Output summary based on 50 years of possible weather
Line Source of sediment
Sediment delivery in year of disturbance
(ton mi-2)
Return period of disturbance
(y)
"Average" annual hillslope
sedimentation (ton mi-2 y-1)
1 Undisturbed forest
1 6.4
2 Wildfire 3680 26 141.5
3 Prescribed fire
204.8 3 68.3
4 Thinning 6.4 45 0.1
5 Low access roads
4.6 to 113.8 1 4.6 to 113.8
6 High access roads
18.4 to 113.8 1 18.4 to 113.8

59
Hillslope Run #3 for commercial thinning
Climate
RUIDOSO NM + Modified by Rock:Clime on March 11, 2009 from ALAMOGORDO NM 29 199 0 T MAX 56.24 61.50 67.91 77.45 86.21 95.17 94.55 92.01 86.84 77.52 65.33 57.14 deg F T MIN 28.22 32.09 37.52 45.09 53.27 62.31 65.56 63.99 57.90 46.90 34.99 28.57 deg F MEANP 1.33 1.46 0.00 0.00 1.84 1.02 5.58 5.27 2.83 0.00 0.93 2.48 in # WET 26.69 29.17 0.00 0.00 22.96 16.98 31.00 31.00 28.29 0.00 5.17 31.00
Soil texture loam
Hillslope length 1200 ft
Hillslope gradient 5 14 5 %
Buffer length 50 ft
Wildfire cycle 26 y
Prescribed fire cycle 3 y
Thinning cycle 45 y
Road density 2.5 mi mi-2
Output summary based on 50 years of possible weather
Line Source of sediment
Sediment delivery in year of disturbance
(ton mi-2)
Return period of disturbance
(y)
"Average" annual hillslope
sedimentation (ton mi-2 y-1)
1 Undisturbed forest
1 0
2 Wildfire 2054.4 26 79.0
3 Prescribed fire
51.2 3 17.1
4 Thinning 0 45 0.0
5 Low access roads
2.2 to 52.8 1 2.2 to 52.8
6 High access roads
7.3 to 52.8 1 7.3 to 52.8

60
Magado Canyon area modeling results Hillslope Run #1 for pre-commercial thinning
Climate
RUIDOSO NM + Modified by Rock:Clime on March 11, 2009 from ALAMOGORDO NM 29 199 0 T MAX 56.24 61.50 67.91 77.45 86.21 95.17 94.55 92.01 86.84 77.52 65.33 57.14 deg F T MIN 28.22 32.09 37.52 45.09 53.27 62.31 65.56 63.99 57.90 46.90 34.99 28.57 deg F MEANP 1.33 1.46 0.00 0.00 1.84 1.02 5.58 5.27 2.83 0.00 0.93 2.48 in # WET 26.69 29.17 0.00 0.00 22.96 16.98 31.00 31.00 28.29 0.00 5.17 31.00
Soil texture loam
Hillslope length 1200 ft
Hillslope gradient 5 16 5 %
Buffer length 50 ft
Wildfire cycle 26 y
Prescribed fire cycle 3 y
Thinning cycle 25 y
Road density 2.5 mi mi-2
Output summary based on 50 years of possible weather
Line Source of sediment
Sediment delivery in year of disturbance
(ton mi-2)
Return period of disturbance
(y)
"Average" annual hillslope
sedimentation (ton mi-2 y-1)
1 Undisturbed forest
1 0
2 Wildfire 2400 26 92.3
3 Prescribed fire
64 3 21.3
4 Thinning 0 25 0.0
5 Low access roads
2.5 to 62.4 1 2.5 to 62.4
6 High access roads
9.6 to 62.4 1 9.6 to 62.4

61
Hillslope Run #2 for pre-commercial thinning
Climate
RUIDOSO NM + Modified by Rock:Clime on March 11, 2009 from ALAMOGORDO NM 29 199 0 T MAX 56.24 61.50 67.91 77.45 86.21 95.17 94.55 92.01 86.84 77.52 65.33 57.14 deg F T MIN 28.22 32.09 37.52 45.09 53.27 62.31 65.56 63.99 57.90 46.90 34.99 28.57 deg F MEANP 1.33 1.46 0.00 0.00 1.84 1.02 5.58 5.27 2.83 0.00 0.93 2.48 in # WET 26.69 29.17 0.00 0.00 22.96 16.98 31.00 31.00 28.29 0.00 5.17 31.00
Soil texture loam
Hillslope length 400 ft
Hillslope gradient 10 34 10 %
Buffer length 50 ft
Wildfire cycle 26 y
Prescribed fire cycle 3 y
Thinning cycle 25 y
Road density 2.5 mi mi-2
Output summary based on 50 years of possible weather
Line Source of sediment
Sediment delivery in year of disturbance
(ton mi-2)
Return period of disturbance
(y)
"Average" annual hillslope
sedimentation (ton mi-2 y-1)
1 Undisturbed forest
1 6.4
2 Wildfire 3680 26 141.5
3 Prescribed fire
204.8 3 68.3
4 Thinning 6.4 25 0.3
5 Low access roads
4.6 to 113.8 1 4.6 to 113.8
6 High access roads
18.4 to 113.8 1 18.4 to 113.8
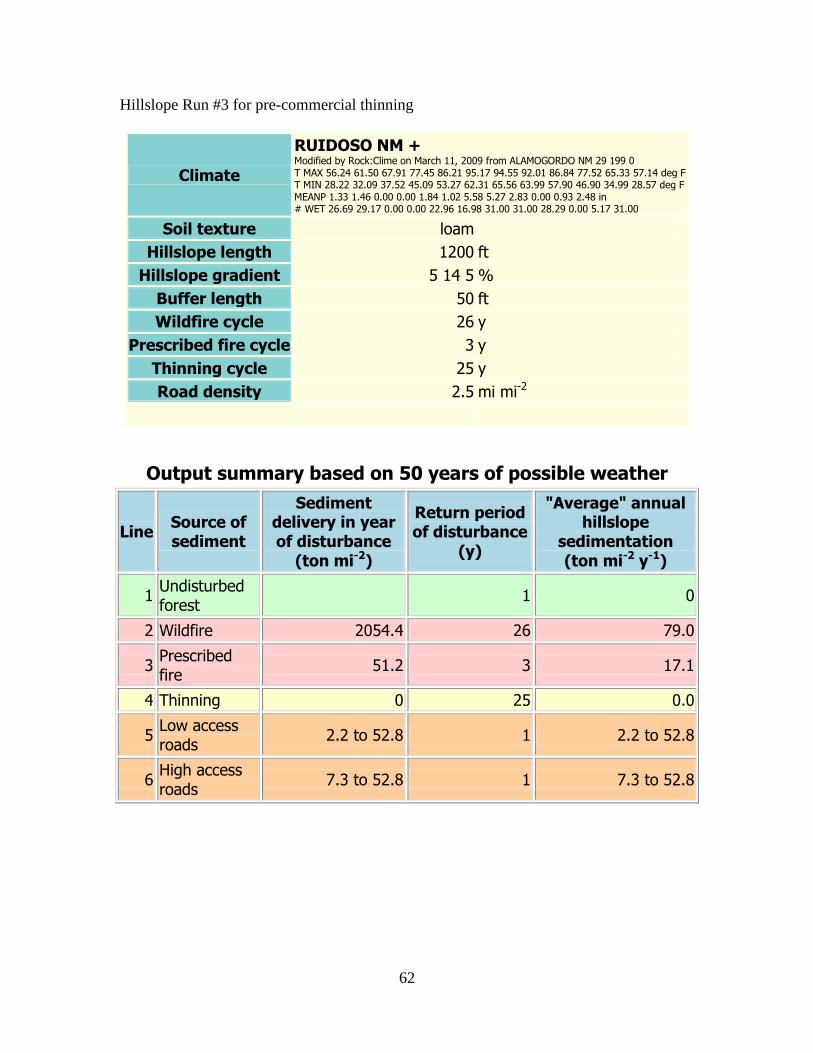
62
Hillslope Run #3 for pre-commercial thinning
Climate
RUIDOSO NM + Modified by Rock:Clime on March 11, 2009 from ALAMOGORDO NM 29 199 0 T MAX 56.24 61.50 67.91 77.45 86.21 95.17 94.55 92.01 86.84 77.52 65.33 57.14 deg F T MIN 28.22 32.09 37.52 45.09 53.27 62.31 65.56 63.99 57.90 46.90 34.99 28.57 deg F MEANP 1.33 1.46 0.00 0.00 1.84 1.02 5.58 5.27 2.83 0.00 0.93 2.48 in # WET 26.69 29.17 0.00 0.00 22.96 16.98 31.00 31.00 28.29 0.00 5.17 31.00
Soil texture loam
Hillslope length 1200 ft
Hillslope gradient 5 14 5 %
Buffer length 50 ft
Wildfire cycle 26 y
Prescribed fire cycle 3 y
Thinning cycle 25 y
Road density 2.5 mi mi-2
Output summary based on 50 years of possible weather
Line Source of sediment
Sediment delivery in year of disturbance
(ton mi-2)
Return period of disturbance
(y)
"Average" annual hillslope
sedimentation (ton mi-2 y-1)
1 Undisturbed forest
1 0
2 Wildfire 2054.4 26 79.0
3 Prescribed fire
51.2 3 17.1
4 Thinning 0 25 0.0
5 Low access roads
2.2 to 52.8 1 2.2 to 52.8
6 High access roads
7.3 to 52.8 1 7.3 to 52.8
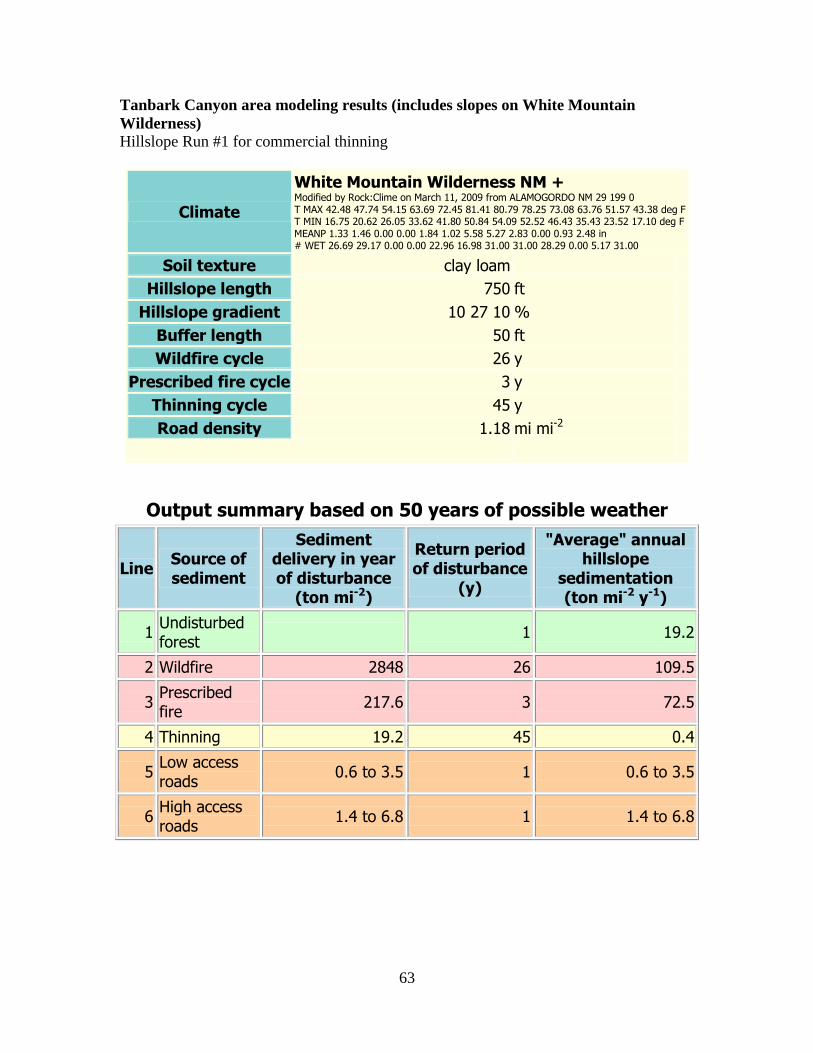
63
Tanbark Canyon area modeling results (includes slopes on White Mountain
Wilderness)
Hillslope Run #1 for commercial thinning
Climate
White Mountain Wilderness NM + Modified by Rock:Clime on March 11, 2009 from ALAMOGORDO NM 29 199 0 T MAX 42.48 47.74 54.15 63.69 72.45 81.41 80.79 78.25 73.08 63.76 51.57 43.38 deg F T MIN 16.75 20.62 26.05 33.62 41.80 50.84 54.09 52.52 46.43 35.43 23.52 17.10 deg F MEANP 1.33 1.46 0.00 0.00 1.84 1.02 5.58 5.27 2.83 0.00 0.93 2.48 in # WET 26.69 29.17 0.00 0.00 22.96 16.98 31.00 31.00 28.29 0.00 5.17 31.00
Soil texture clay loam
Hillslope length 750 ft
Hillslope gradient 10 27 10 %
Buffer length 50 ft
Wildfire cycle 26 y
Prescribed fire cycle 3 y
Thinning cycle 45 y
Road density 1.18 mi mi-2
Output summary based on 50 years of possible weather
Line Source of sediment
Sediment delivery in year of disturbance
(ton mi-2)
Return period of disturbance
(y)
"Average" annual hillslope
sedimentation (ton mi-2 y-1)
1 Undisturbed forest
1 19.2
2 Wildfire 2848 26 109.5
3 Prescribed fire
217.6 3 72.5
4 Thinning 19.2 45 0.4
5 Low access roads
0.6 to 3.5 1 0.6 to 3.5
6 High access roads
1.4 to 6.8 1 1.4 to 6.8

64
Hillslope Run #2 for commercial thinning
Climate
White Mountain Wilderness NM + Modified by Rock:Clime on March 11, 2009 from ALAMOGORDO NM 29 199 0 T MAX 42.48 47.74 54.15 63.69 72.45 81.41 80.79 78.25 73.08 63.76 51.57 43.38 deg F T MIN 16.75 20.62 26.05 33.62 41.80 50.84 54.09 52.52 46.43 35.43 23.52 17.10 deg F MEANP 1.33 1.46 0.00 0.00 1.84 1.02 5.58 5.27 2.83 0.00 0.93 2.48 in # WET 26.69 29.17 0.00 0.00 22.96 16.98 31.00 31.00 28.29 0.00 5.17 31.00
Soil texture clay loam
Hillslope length 450 ft
Hillslope gradient 5 16 5 %
Buffer length 50 ft
Wildfire cycle 26 y
Prescribed fire cycle 3 y
Thinning cycle 45 y
Road density 1.18 mi mi-2
Output summary based on 50 years of possible weather
Line Source of sediment
Sediment delivery in year of disturbance
(ton mi-2)
Return period of disturbance
(y)
"Average" annual hillslope
sedimentation (ton mi-2 y-1)
1 Undisturbed forest
1 6.4
2 Wildfire 1356.8 26 52.2
3 Prescribed fire
89.6 3 29.9
4 Thinning 6.4 45 0.1
5 Low access roads
0.4 to 2.0 1 0.4 to 2.0
6 High access roads
0.7 to 4.7 1 0.7 to 4.7
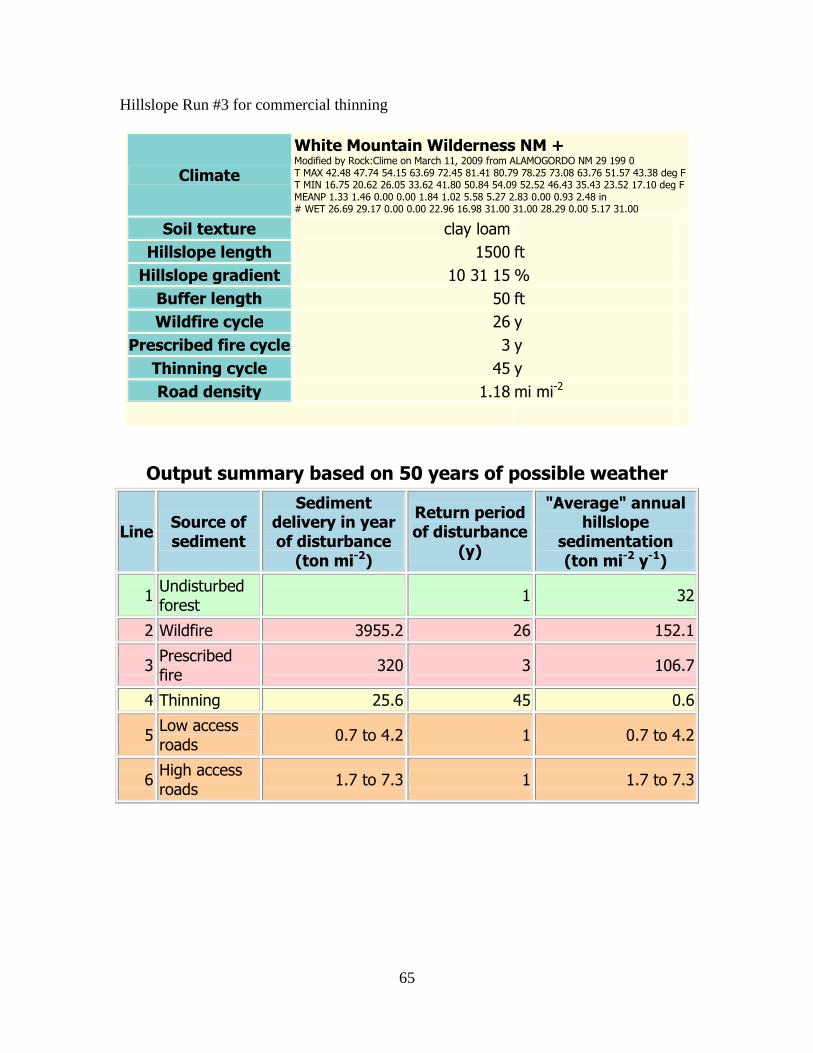
65
Hillslope Run #3 for commercial thinning
Climate
White Mountain Wilderness NM + Modified by Rock:Clime on March 11, 2009 from ALAMOGORDO NM 29 199 0 T MAX 42.48 47.74 54.15 63.69 72.45 81.41 80.79 78.25 73.08 63.76 51.57 43.38 deg F T MIN 16.75 20.62 26.05 33.62 41.80 50.84 54.09 52.52 46.43 35.43 23.52 17.10 deg F MEANP 1.33 1.46 0.00 0.00 1.84 1.02 5.58 5.27 2.83 0.00 0.93 2.48 in # WET 26.69 29.17 0.00 0.00 22.96 16.98 31.00 31.00 28.29 0.00 5.17 31.00
Soil texture clay loam
Hillslope length 1500 ft
Hillslope gradient 10 31 15 %
Buffer length 50 ft
Wildfire cycle 26 y
Prescribed fire cycle 3 y
Thinning cycle 45 y
Road density 1.18 mi mi-2
Output summary based on 50 years of possible weather
Line Source of sediment
Sediment delivery in year of disturbance
(ton mi-2)
Return period of disturbance
(y)
"Average" annual hillslope
sedimentation (ton mi-2 y-1)
1 Undisturbed forest
1 32
2 Wildfire 3955.2 26 152.1
3 Prescribed fire
320 3 106.7
4 Thinning 25.6 45 0.6
5 Low access roads
0.7 to 4.2 1 0.7 to 4.2
6 High access roads
1.7 to 7.3 1 1.7 to 7.3

66
Tanbark Canyon area modeling results
Hillslope Run #1 for pre-commercial thinning
Climate
White Mountain Wilderness NM + Modified by Rock:Clime on March 11, 2009 from ALAMOGORDO NM 29 199 0 T MAX 42.48 47.74 54.15 63.69 72.45 81.41 80.79 78.25 73.08 63.76 51.57 43.38 deg F T MIN 16.75 20.62 26.05 33.62 41.80 50.84 54.09 52.52 46.43 35.43 23.52 17.10 deg F MEANP 1.33 1.46 0.00 0.00 1.84 1.02 5.58 5.27 2.83 0.00 0.93 2.48 in # WET 26.69 29.17 0.00 0.00 22.96 16.98 31.00 31.00 28.29 0.00 5.17 31.00
Soil texture clay loam
Hillslope length 750 ft
Hillslope gradient 10 27 10 %
Buffer length 50 ft
Wildfire cycle 26 y
Prescribed fire cycle 3 y
Thinning cycle 25 y
Road density 1.18 mi mi-2
Output summary based on 50 years of possible weather
Line Source of sediment
Sediment delivery in year of disturbance
(ton mi-2)
Return period of disturbance
(y)
"Average" annual hillslope
sedimentation (ton mi-2 y-1)
1 Undisturbed forest
1 19.2
2 Wildfire 2848 26 109.5
3 Prescribed fire
217.6 3 72.5
4 Thinning 19.2 25 0.8
5 Low access roads
0.6 to 3.5 1 0.6 to 3.5
6 High access roads
1.4 to 6.8 1 1.4 to 6.8

67
Hillslope Run #2 for pre-commercial thinning
Climate
White Mountain Wilderness NM + Modified by Rock:Clime on March 11, 2009 from ALAMOGORDO NM 29 199 0 T MAX 42.48 47.74 54.15 63.69 72.45 81.41 80.79 78.25 73.08 63.76 51.57 43.38 deg F T MIN 16.75 20.62 26.05 33.62 41.80 50.84 54.09 52.52 46.43 35.43 23.52 17.10 deg F MEANP 1.33 1.46 0.00 0.00 1.84 1.02 5.58 5.27 2.83 0.00 0.93 2.48 in # WET 26.69 29.17 0.00 0.00 22.96 16.98 31.00 31.00 28.29 0.00 5.17 31.00
Soil texture clay loam
Hillslope length 450 ft
Hillslope gradient 5 16 5 %
Buffer length 50 ft
Wildfire cycle 26 y
Prescribed fire cycle 3 y
Thinning cycle 25 y
Road density 1.18 mi mi-2
Output summary based on 50 years of possible weather
Line Source of sediment
Sediment delivery in year of disturbance
(ton mi-2)
Return period of disturbance
(y)
"Average" annual hillslope
sedimentation (ton mi-2 y-1)
1 Undisturbed forest
1 6.4
2 Wildfire 1356.8 26 52.2
3 Prescribed fire
89.6 3 29.9
4 Thinning 6.4 25 0.3
5 Low access roads
0.4 to 2.0 1 0.4 to 2.0
6 High access roads
0.7 to 4.7 1 0.7 to 4.7

68
Hillslope Run #3 for pre-commercial thinning
Climate
White Mountain Wilderness NM + Modified by Rock:Clime on March 11, 2009 from ALAMOGORDO NM 29 199 0 T MAX 42.48 47.74 54.15 63.69 72.45 81.41 80.79 78.25 73.08 63.76 51.57 43.38 deg F T MIN 16.75 20.62 26.05 33.62 41.80 50.84 54.09 52.52 46.43 35.43 23.52 17.10 deg F MEANP 1.33 1.46 0.00 0.00 1.84 1.02 5.58 5.27 2.83 0.00 0.93 2.48 in # WET 26.69 29.17 0.00 0.00 22.96 16.98 31.00 31.00 28.29 0.00 5.17 31.00
Soil texture clay loam
Hillslope length 1500 ft
Hillslope gradient 10 31 15 %
Buffer length 50 ft
Wildfire cycle 26 y
Prescribed fire cycle 3 y
Thinning cycle 25 y
Road density 1.18 mi mi-2
Output summary based on 50 years of possible weather
Line Source of sediment
Sediment delivery in year of disturbance
(ton mi-2)
Return period of disturbance
(y)
"Average" annual hillslope
sedimentation (ton mi-2 y-1)
1 Undisturbed forest
1 32
2 Wildfire 3955.2 26 152.1
3 Prescribed fire
320 3 106.7
4 Thinning 25.6 25 1.0
5 Low access roads
0.7 to 4.2 1 0.7 to 4.2
6 High access roads
1.7 to 7.3 1 1.7 to 7.3

69
Bear Creek/Rio Bonito area modeling results.
Hillslope Run #1 for commercial thinning
Climate
White Mountain Wilderness NM + Modified by Rock:Clime on March 11, 2009 from ALAMOGORDO NM 29 199 0 T MAX 42.48 47.74 54.15 63.69 72.45 81.41 80.79 78.25 73.08 63.76 51.57 43.38 deg F T MIN 16.75 20.62 26.05 33.62 41.80 50.84 54.09 52.52 46.43 35.43 23.52 17.10 deg F MEANP 1.33 1.46 0.00 0.00 1.84 1.02 5.58 5.27 2.83 0.00 0.93 2.48 in # WET 26.69 29.17 0.00 0.00 22.96 16.98 31.00 31.00 28.29 0.00 5.17 31.00
Soil texture loam
Hillslope length 400 ft
Hillslope gradient 15 40 20 %
Buffer length 50 ft
Wildfire cycle 26 y
Prescribed fire cycle 3 y
Thinning cycle 45 y
Road density 1.18 mi mi-2
Output summary based on 50 years of possible weather
Line Source of sediment
Sediment delivery in year of disturbance
(ton mi-2)
Return period of disturbance
(y)
"Average" annual hillslope
sedimentation (ton mi-2 y-1)
1 Undisturbed forest
1 6.4
2 Wildfire 4428.8 26 170.3
3 Prescribed fire
268.8 3 89.6
4 Thinning 12.8 45 0.3
5 Low access roads
1.2 to 6.4 1 1.2 to 6.4
6 High access roads
3.0 to 12.7 1 3.0 to 12.7
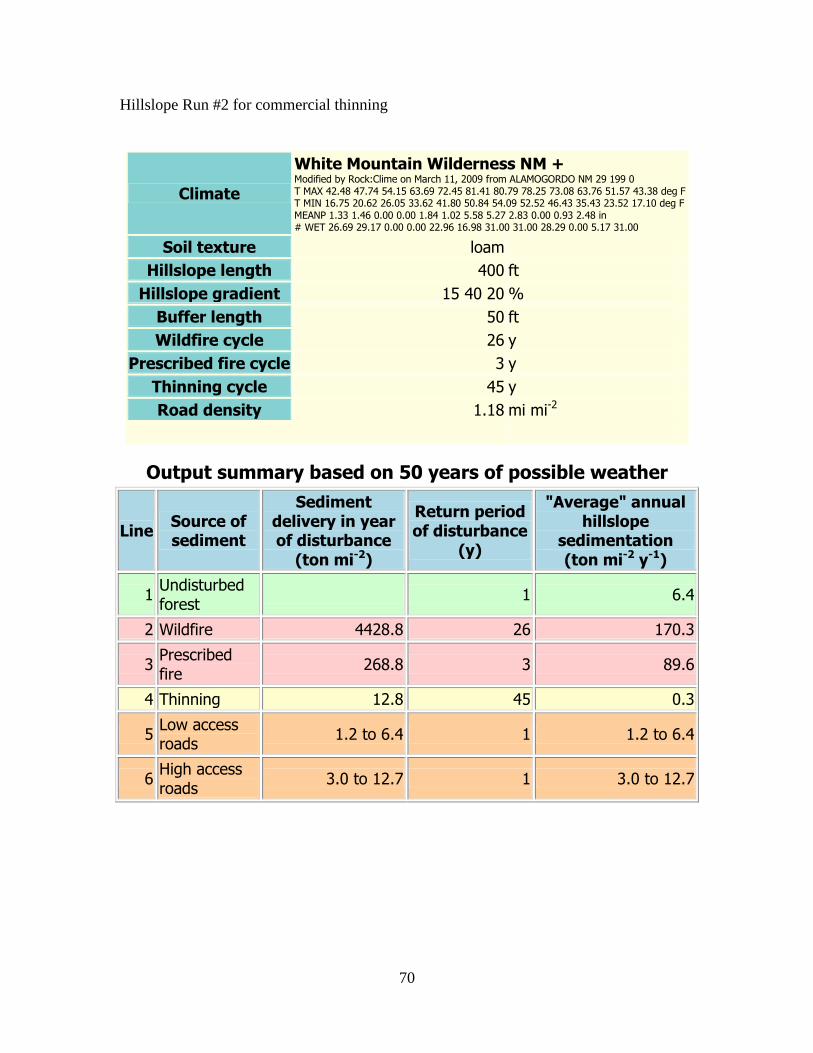
70
Hillslope Run #2 for commercial thinning
Climate
White Mountain Wilderness NM + Modified by Rock:Clime on March 11, 2009 from ALAMOGORDO NM 29 199 0 T MAX 42.48 47.74 54.15 63.69 72.45 81.41 80.79 78.25 73.08 63.76 51.57 43.38 deg F T MIN 16.75 20.62 26.05 33.62 41.80 50.84 54.09 52.52 46.43 35.43 23.52 17.10 deg F MEANP 1.33 1.46 0.00 0.00 1.84 1.02 5.58 5.27 2.83 0.00 0.93 2.48 in # WET 26.69 29.17 0.00 0.00 22.96 16.98 31.00 31.00 28.29 0.00 5.17 31.00
Soil texture loam
Hillslope length 400 ft
Hillslope gradient 15 40 20 %
Buffer length 50 ft
Wildfire cycle 26 y
Prescribed fire cycle 3 y
Thinning cycle 45 y
Road density 1.18 mi mi-2
Output summary based on 50 years of possible weather
Line Source of sediment
Sediment delivery in year of disturbance
(ton mi-2)
Return period of disturbance
(y)
"Average" annual hillslope
sedimentation (ton mi-2 y-1)
1 Undisturbed forest
1 6.4
2 Wildfire 4428.8 26 170.3
3 Prescribed fire
268.8 3 89.6
4 Thinning 12.8 45 0.3
5 Low access roads
1.2 to 6.4 1 1.2 to 6.4
6 High access roads
3.0 to 12.7 1 3.0 to 12.7

71
Hillslope Run #3 for commercial thinning
Climate
White Mountain Wilderness NM + Modified by Rock:Clime on March 11, 2009 from ALAMOGORDO NM 29 199 0 T MAX 42.48 47.74 54.15 63.69 72.45 81.41 80.79 78.25 73.08 63.76 51.57 43.38 deg F T MIN 16.75 20.62 26.05 33.62 41.80 50.84 54.09 52.52 46.43 35.43 23.52 17.10 deg F MEANP 1.33 1.46 0.00 0.00 1.84 1.02 5.58 5.27 2.83 0.00 0.93 2.48 in # WET 26.69 29.17 0.00 0.00 22.96 16.98 31.00 31.00 28.29 0.00 5.17 31.00
Soil texture loam
Hillslope length 520 ft
Hillslope gradient 10 23 10 %
Buffer length 50 ft
Wildfire cycle 26 y
Prescribed fire cycle 3 y
Thinning cycle 45 y
Road density 1.18 mi mi-2
Output summary based on 50 years of possible weather
Line Source of sediment
Sediment delivery in year of disturbance
(ton mi-2)
Return period of disturbance
(y)
"Average" annual hillslope
sedimentation (ton mi-2 y-1)
1 Undisturbed forest
1 0
2 Wildfire 3264 26 125.5
3 Prescribed fire
134.4 3 44.8
4 Thinning 6.4 45 0.1
5 Low access roads
0.6 to 3.3 1 0.6 to 3.3
6 High access roads
1.3 to 5.6 1 1.3 to 5.6
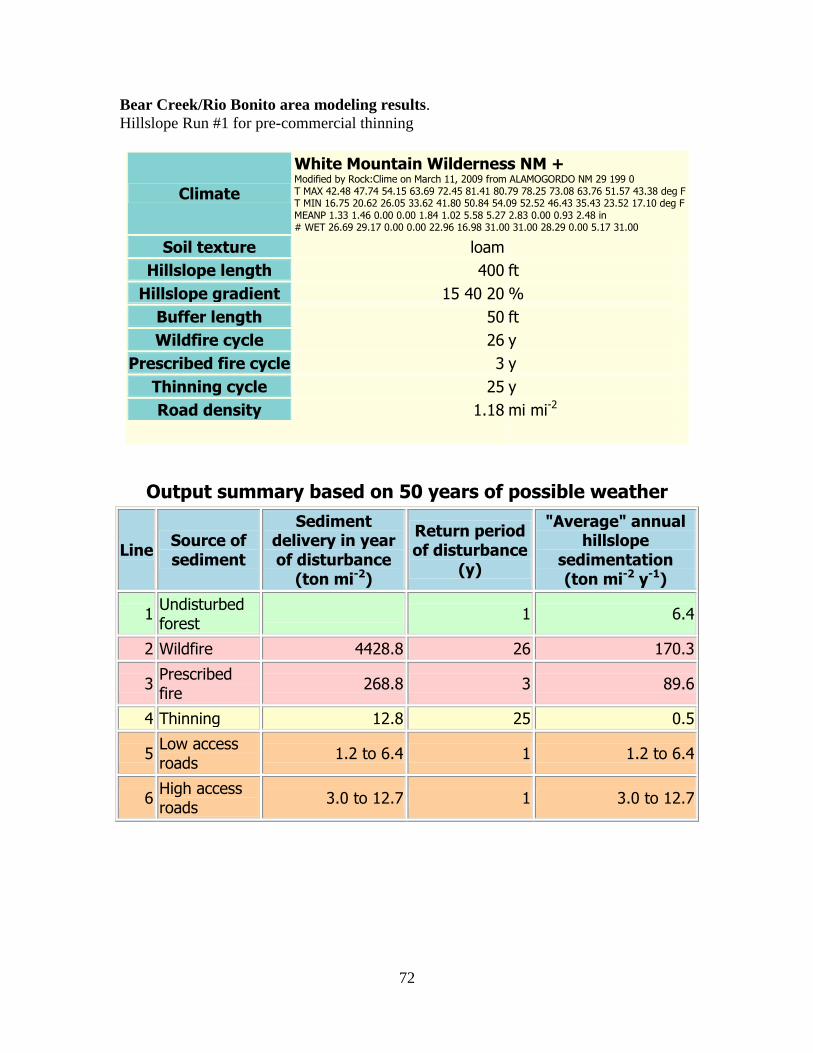
72
Bear Creek/Rio Bonito area modeling results.
Hillslope Run #1 for pre-commercial thinning
Climate
White Mountain Wilderness NM + Modified by Rock:Clime on March 11, 2009 from ALAMOGORDO NM 29 199 0 T MAX 42.48 47.74 54.15 63.69 72.45 81.41 80.79 78.25 73.08 63.76 51.57 43.38 deg F T MIN 16.75 20.62 26.05 33.62 41.80 50.84 54.09 52.52 46.43 35.43 23.52 17.10 deg F MEANP 1.33 1.46 0.00 0.00 1.84 1.02 5.58 5.27 2.83 0.00 0.93 2.48 in # WET 26.69 29.17 0.00 0.00 22.96 16.98 31.00 31.00 28.29 0.00 5.17 31.00
Soil texture loam
Hillslope length 400 ft
Hillslope gradient 15 40 20 %
Buffer length 50 ft
Wildfire cycle 26 y
Prescribed fire cycle 3 y
Thinning cycle 25 y
Road density 1.18 mi mi-2
Output summary based on 50 years of possible weather
Line Source of sediment
Sediment delivery in year of disturbance
(ton mi-2)
Return period of disturbance
(y)
"Average" annual hillslope
sedimentation (ton mi-2 y-1)
1 Undisturbed forest
1 6.4
2 Wildfire 4428.8 26 170.3
3 Prescribed fire
268.8 3 89.6
4 Thinning 12.8 25 0.5
5 Low access roads
1.2 to 6.4 1 1.2 to 6.4
6 High access roads
3.0 to 12.7 1 3.0 to 12.7

73
Hillslope Run #2 for pre-commercial thinning
Climate
White Mountain Wilderness NM + Modified by Rock:Clime on March 11, 2009 from ALAMOGORDO NM 29 199 0 T MAX 42.48 47.74 54.15 63.69 72.45 81.41 80.79 78.25 73.08 63.76 51.57 43.38 deg F T MIN 16.75 20.62 26.05 33.62 41.80 50.84 54.09 52.52 46.43 35.43 23.52 17.10 deg F MEANP 1.33 1.46 0.00 0.00 1.84 1.02 5.58 5.27 2.83 0.00 0.93 2.48 in # WET 26.69 29.17 0.00 0.00 22.96 16.98 31.00 31.00 28.29 0.00 5.17 31.00
Soil texture loam
Hillslope length 520 ft
Hillslope gradient 10 23 10 %
Buffer length 50 ft
Wildfire cycle 26 y
Prescribed fire cycle 3 y
Thinning cycle 25 y
Road density 1.18 mi mi-2
Output summary based on 50 years of possible weather
Line Source of sediment
Sediment delivery in year of disturbance
(ton mi-2)
Return period of disturbance
(y)
"Average" annual hillslope
sedimentation (ton mi-2 y-1)
1 Undisturbed forest
1 0
2 Wildfire 3264 26 125.5
3 Prescribed fire
134.4 3 44.8
4 Thinning 6.4 25 0.3
5 Low access roads
0.6 to 3.3 1 0.6 to 3.3
6 High access roads
1.3 to 5.6 1 1.3 to 5.6

74
Hillslope Run #3 for pre-commercial thinning
Climate
White Mountain Wilderness NM + Modified by Rock:Clime on March 11, 2009 from ALAMOGORDO NM 29 199 0 T MAX 42.48 47.74 54.15 63.69 72.45 81.41 80.79 78.25 73.08 63.76 51.57 43.38 deg F T MIN 16.75 20.62 26.05 33.62 41.80 50.84 54.09 52.52 46.43 35.43 23.52 17.10 deg F MEANP 1.33 1.46 0.00 0.00 1.84 1.02 5.58 5.27 2.83 0.00 0.93 2.48 in # WET 26.69 29.17 0.00 0.00 22.96 16.98 31.00 31.00 28.29 0.00 5.17 31.00
Soil texture loam
Hillslope length 470 ft
Hillslope gradient 10 36 5 %
Buffer length 50 ft
Wildfire cycle 26 y
Prescribed fire cycle 3 y
Thinning cycle 25 y
Road density 1.18 mi mi-2
Output summary based on 50 years of possible weather
Line Source of sediment
Sediment delivery in year of disturbance
(ton mi-2)
Return period of disturbance
(y)
"Average" annual hillslope
sedimentation (ton mi-2 y-1)
1 Undisturbed forest
1 6.4
2 Wildfire 4435.2 26 170.6
3 Prescribed fire
230.4 3 76.8
4 Thinning 12.8 25 0.5
5 Low access roads
0.8 to 5.9 1 0.8 to 5.9
6 High access roads
1.9 to 11.8 1 1.9 to 11.8
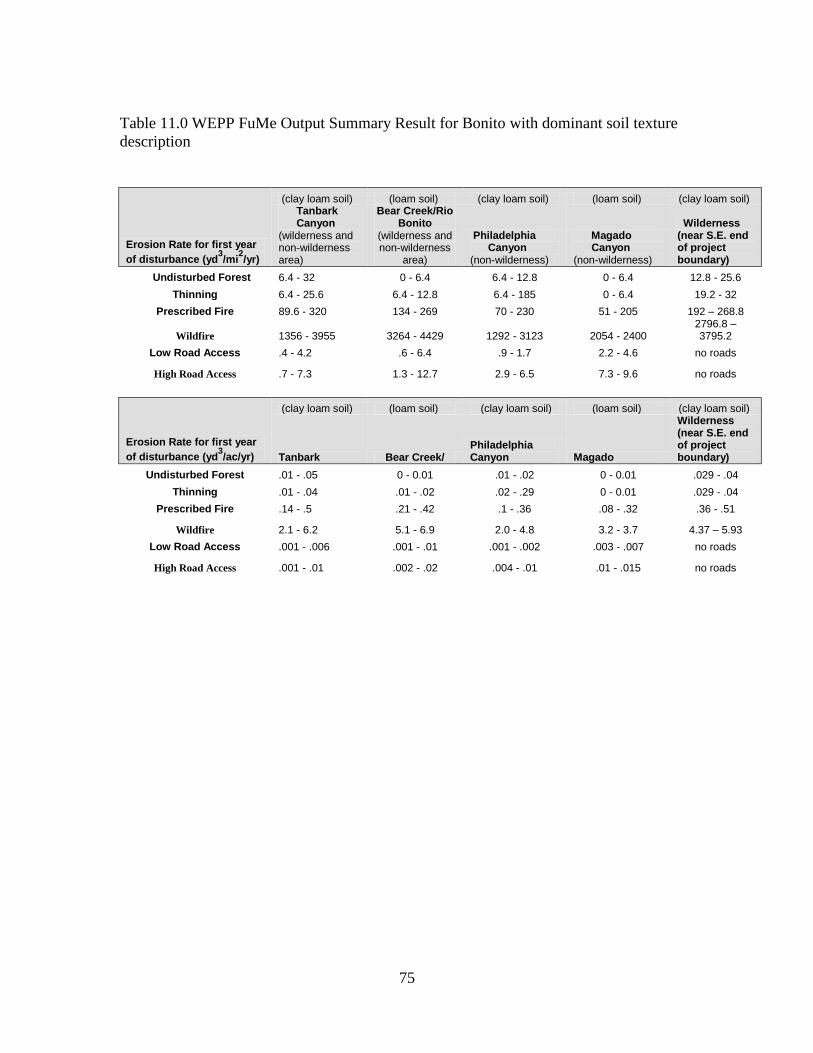
75
Table 11.0 WEPP FuMe Output Summary Result for Bonito with dominant soil texture
description
Erosion Rate for first year
of disturbance (yd3/mi
2/yr)
(clay loam soil) (loam soil) (clay loam soil) (loam soil) (clay loam soil) Tanbark Canyon (wilderness and non-wilderness area)
Bear Creek/Rio Bonito
(wilderness and non-wilderness
area)
Philadelphia Canyon (non-wilderness)
Magado Canyon (non-wilderness)
Wilderness (near S.E. end of project boundary)
Undisturbed Forest 6.4 - 32 0 - 6.4 6.4 - 12.8 0 - 6.4 12.8 - 25.6
Thinning 6.4 - 25.6 6.4 - 12.8 6.4 - 185 0 - 6.4 19.2 - 32
Prescribed Fire 89.6 - 320 134 - 269 70 - 230 51 - 205 192 – 268.8
Wildfire 1356 - 3955 3264 - 4429 1292 - 3123 2054 - 2400 2796.8 – 3795.2
Low Road Access .4 - 4.2 .6 - 6.4 .9 - 1.7 2.2 - 4.6 no roads
High Road Access .7 - 7.3 1.3 - 12.7 2.9 - 6.5 7.3 - 9.6 no roads
Erosion Rate for first year
of disturbance (yd3/ac/yr)
(clay loam soil) (loam soil) (clay loam soil) (loam soil) (clay loam soil)
Tanbark Bear Creek/ Philadelphia Canyon Magado
Wilderness (near S.E. end of project boundary)
Undisturbed Forest .01 - .05 0 - 0.01 .01 - .02 0 - 0.01 .029 - .04
Thinning .01 - .04 .01 - .02 .02 - .29 0 - 0.01 .029 - .04
Prescribed Fire .14 - .5 .21 - .42 .1 - .36 .08 - .32 .36 - .51
Wildfire 2.1 - 6.2 5.1 - 6.9 2.0 - 4.8 3.2 - 3.7 4.37 – 5.93
Low Road Access .001 - .006 .001 - .01 .001 - .002 .003 - .007 no roads
High Road Access .001 - .01 .002 - .02 .004 - .01 .01 - .015 no roads

76
Appendix B - Maps, Tables, Figures, and Charts
ATTACHMENT A: FIGURES
LIST OF FIGURES
1. Terrestrial Ecosystem Survey (TES) Map of the Bonito watershed
2. Soil Condition Rating Guide
3. Index of TEU Map Units for the Bonito watershed TES
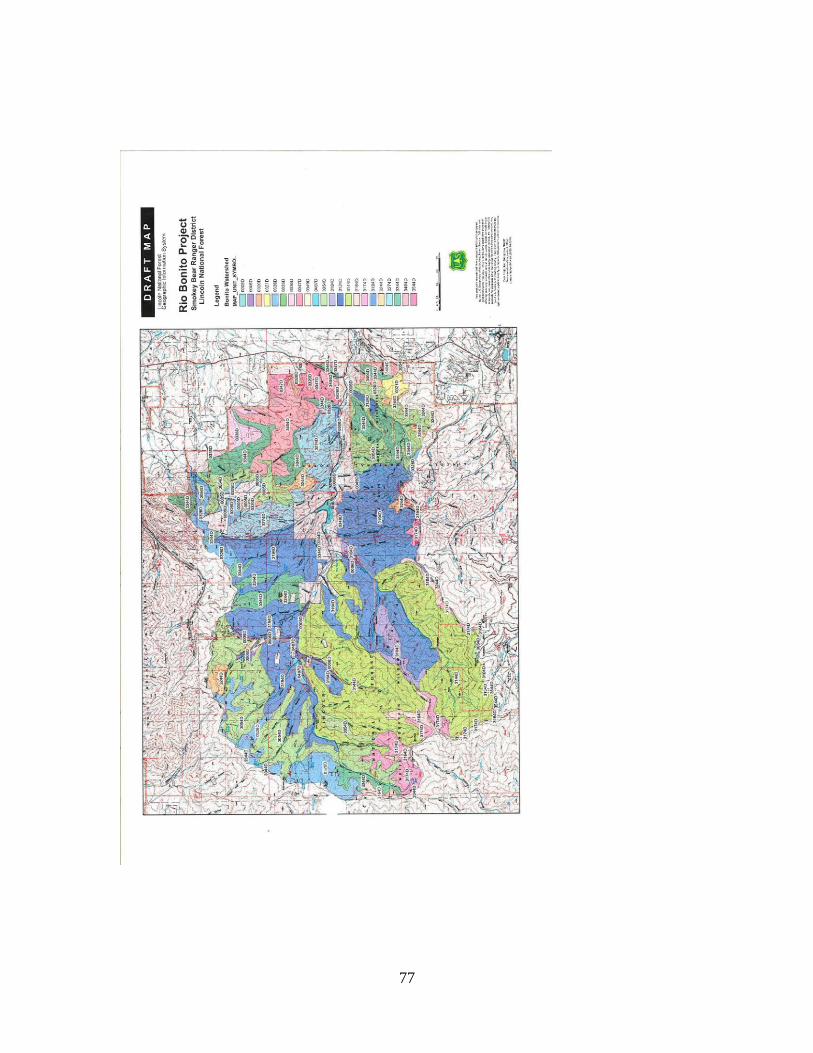
77
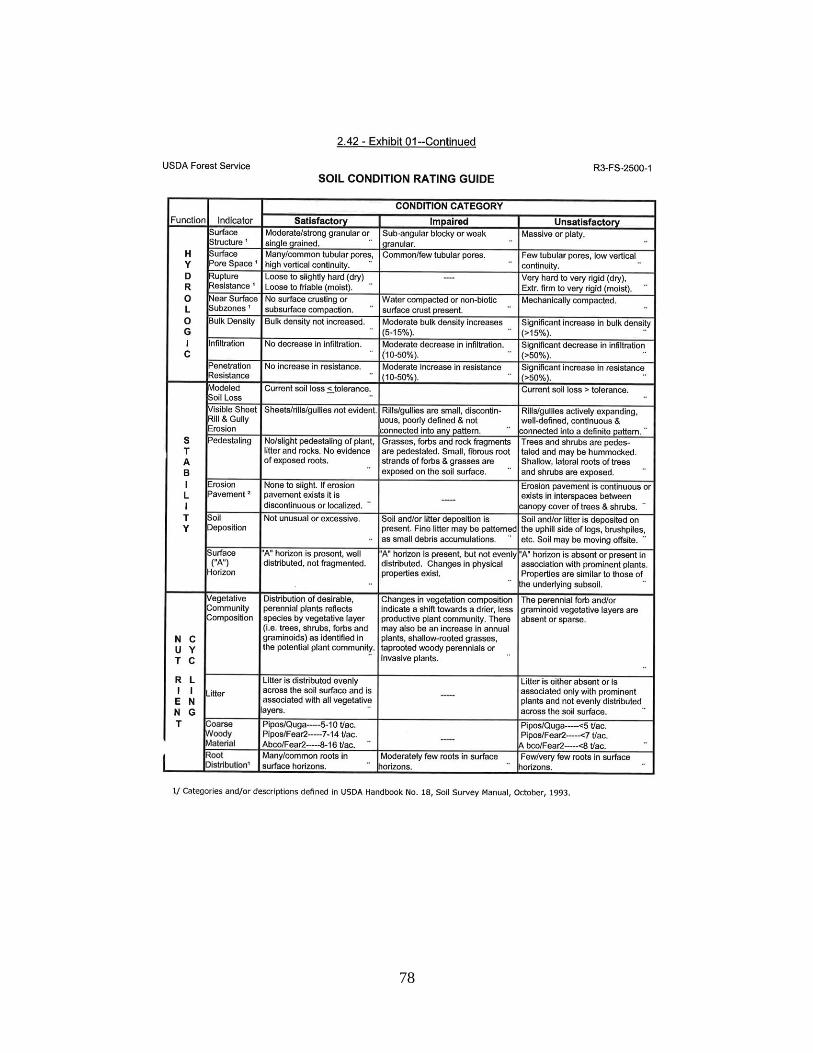
78
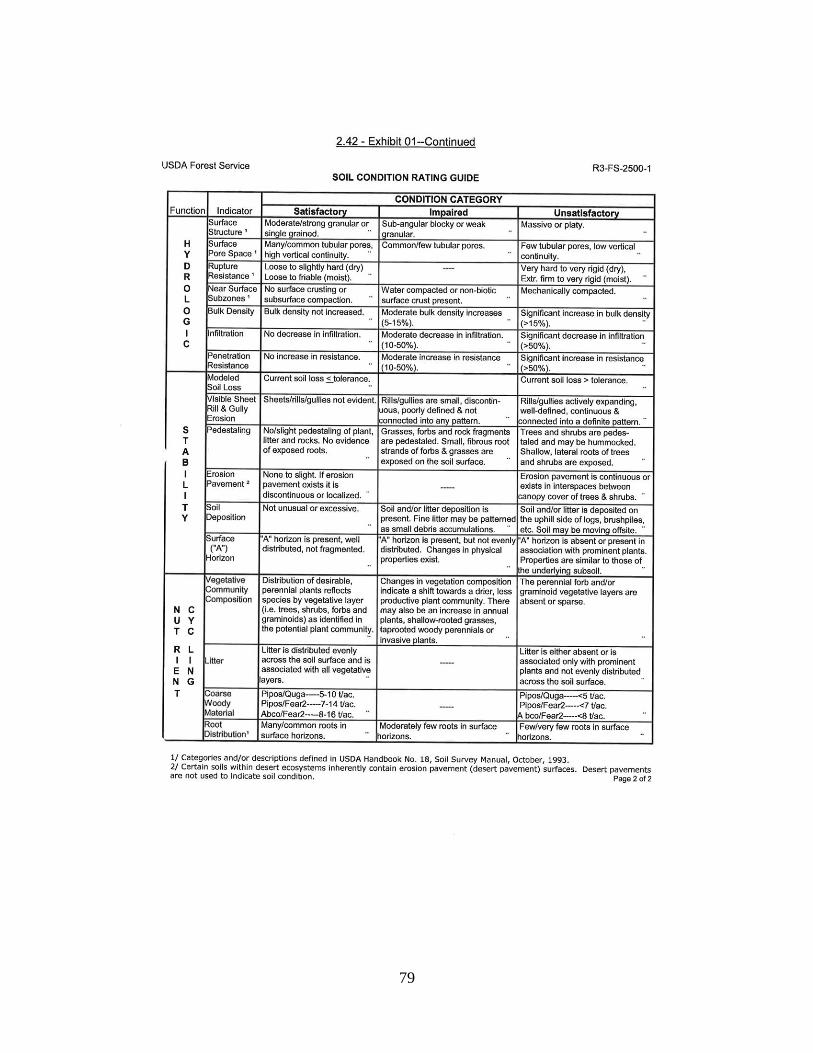
79
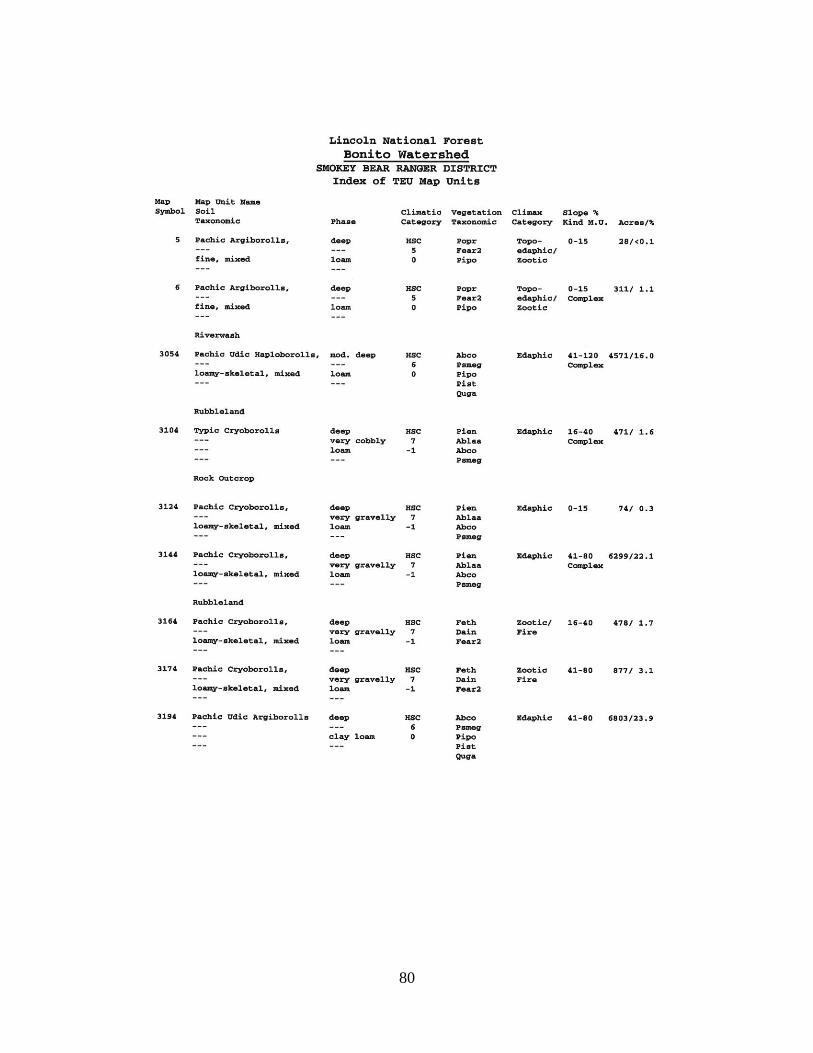
80

81
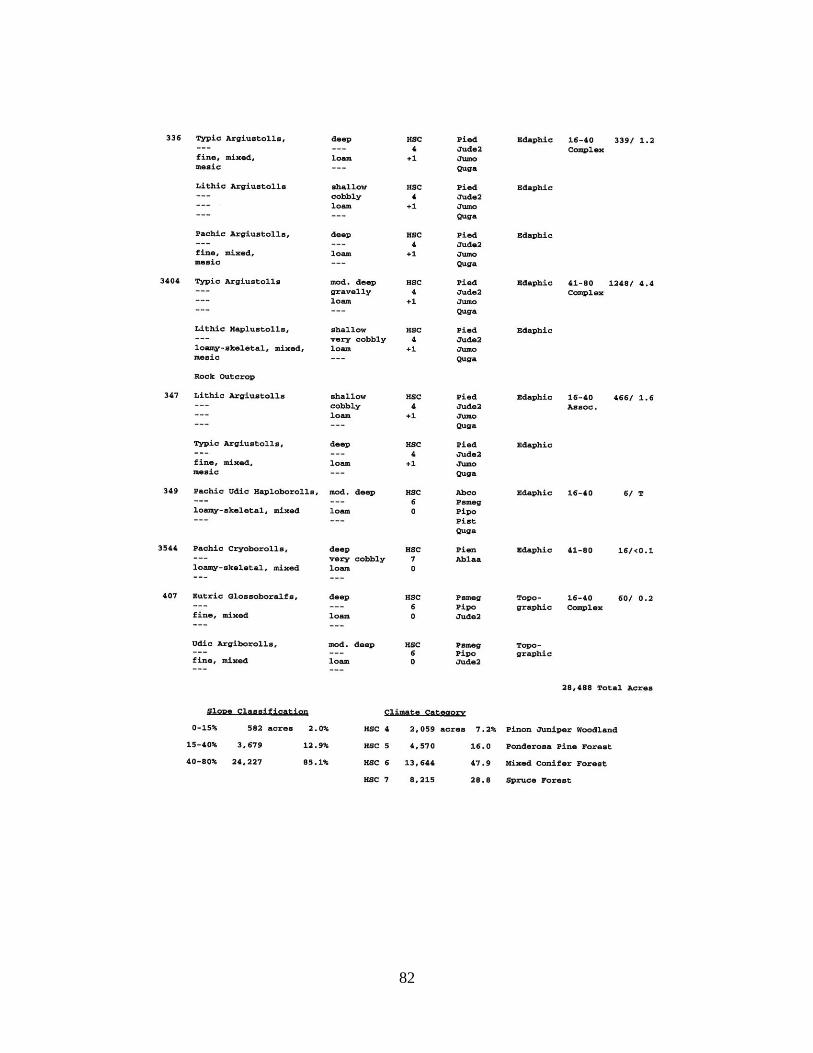
82
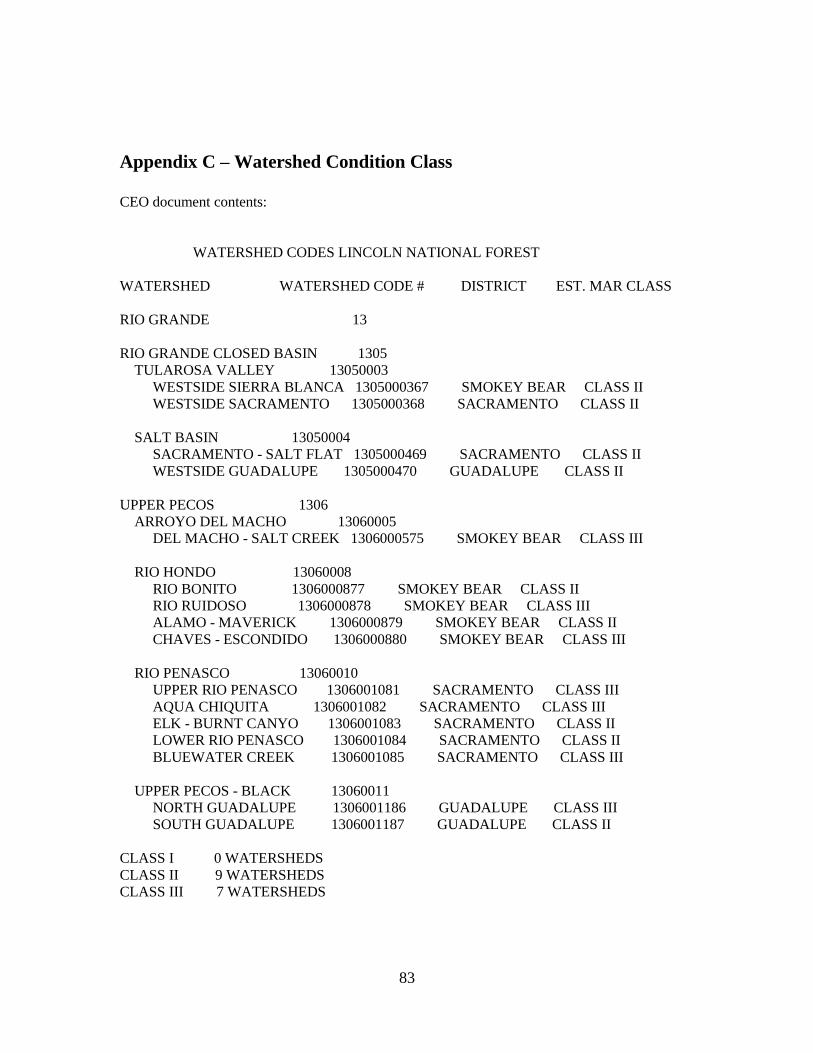
83
Appendix C – Watershed Condition Class
CEO document contents:
WATERSHED CODES LINCOLN NATIONAL FOREST
WATERSHED WATERSHED CODE # DISTRICT EST. MAR CLASS
RIO GRANDE 13
RIO GRANDE CLOSED BASIN 1305
TULAROSA VALLEY 13050003
WESTSIDE SIERRA BLANCA 1305000367 SMOKEY BEAR CLASS II
WESTSIDE SACRAMENTO 1305000368 SACRAMENTO CLASS II
SALT BASIN 13050004
SACRAMENTO - SALT FLAT 1305000469 SACRAMENTO CLASS II
WESTSIDE GUADALUPE 1305000470 GUADALUPE CLASS II
UPPER PECOS 1306
ARROYO DEL MACHO 13060005
DEL MACHO - SALT CREEK 1306000575 SMOKEY BEAR CLASS III
RIO HONDO 13060008
RIO BONITO 1306000877 SMOKEY BEAR CLASS II
RIO RUIDOSO 1306000878 SMOKEY BEAR CLASS III
ALAMO - MAVERICK 1306000879 SMOKEY BEAR CLASS II
CHAVES - ESCONDIDO 1306000880 SMOKEY BEAR CLASS III
RIO PENASCO 13060010
UPPER RIO PENASCO 1306001081 SACRAMENTO CLASS III
AQUA CHIQUITA 1306001082 SACRAMENTO CLASS III
ELK - BURNT CANYO 1306001083 SACRAMENTO CLASS II
LOWER RIO PENASCO 1306001084 SACRAMENTO CLASS II
BLUEWATER CREEK 1306001085 SACRAMENTO CLASS III
UPPER PECOS - BLACK 13060011
NORTH GUADALUPE 1306001186 GUADALUPE CLASS III
SOUTH GUADALUPE 1306001187 GUADALUPE CLASS II
CLASS I 0 WATERSHEDS
CLASS II 9 WATERSHEDS
CLASS III 7 WATERSHEDS
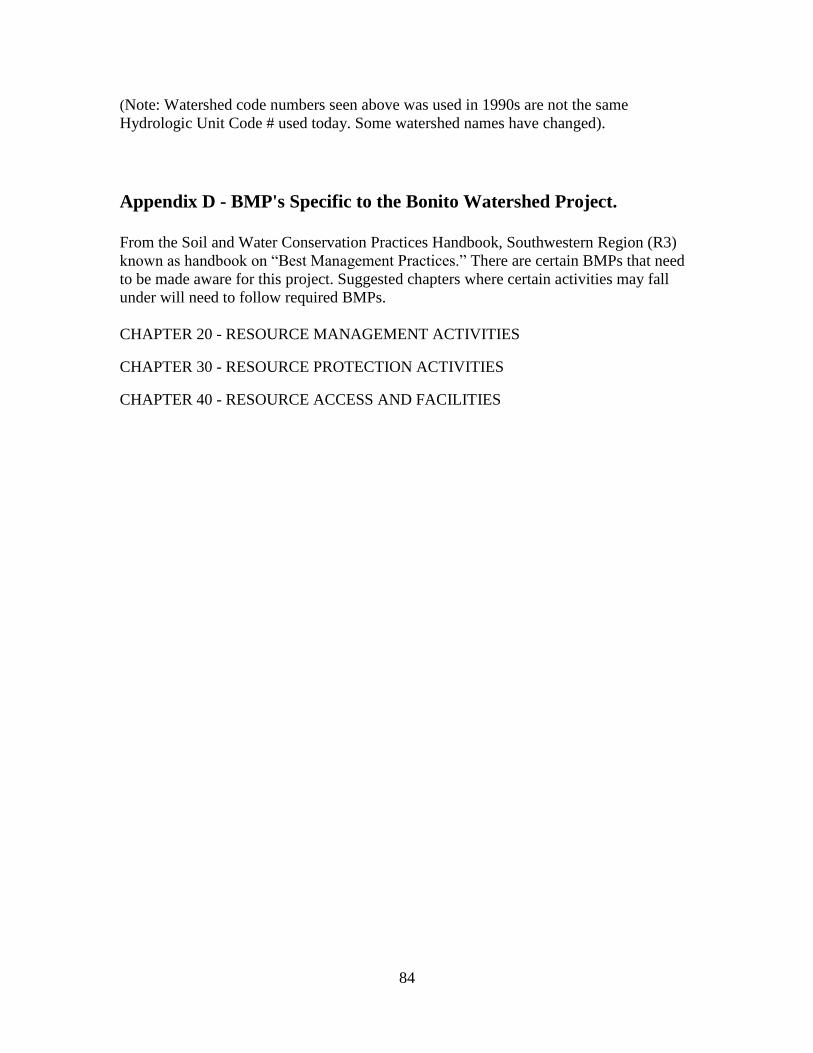
84
(Note: Watershed code numbers seen above was used in 1990s are not the same
Hydrologic Unit Code # used today. Some watershed names have changed).
Appendix D - BMP's Specific to the Bonito Watershed Project.
From the Soil and Water Conservation Practices Handbook, Southwestern Region (R3)
known as handbook on “Best Management Practices.” There are certain BMPs that need
to be made aware for this project. Suggested chapters where certain activities may fall
under will need to follow required BMPs.
CHAPTER 20 - RESOURCE MANAGEMENT ACTIVITIES
CHAPTER 30 - RESOURCE PROTECTION ACTIVITIES
CHAPTER 40 - RESOURCE ACCESS AND FACILITIES
85
Supplement to Hydrology and Soils Report
For
The Bonito Forest Restoration Project
Authors: April Banks, Lincoln National Forest Hydrologist
Jennifer Hill, Lincoln National Forest Soils Scientist
Date: June 21, 2011
86
Watershed Report Supplement
/s/ Jennifer Hill
Jennifer Hill
Forest Soils Scientist
/s/ April Banks
April Banks
Forest Hydrologist
June 25, 2011
87
Watershed Condition- The project area watersheds has been re-evaluated since the Bonito
Soil and Hydrology report was completed. In 2010 the Lincoln National Forest conducted
a forest wide watershed assessment at the HUC 6 level. The watershed condition has
changed in the project area. It is also important to note that there are differences in how
the watershed condition was rated when the Bonito Watershed project area was originally
rated based on a HUC 5 watershed which is larger than a HUC 6 watershed. The
watersheds were also rated based on a different method that met the same objective in
defining condition.
The Upper Bonito Watershed is now rated as an impaired watershed Class III. Most of
the project area is in the Upper Bonito Watershed. Middle Rio Bonito and Magado
Canyon watersheds are functioning at risk, Class II. The watershed condition in the
Bonito project area was classified as a Class II watershed, a watershed functioning at risk.
The watershed experienced a severe flood in July 26-27th
of 2008 which impacted the
watershed condition.
Twelve indicators were used to evaluate the watersheds that were divided into four
attribute scores: Aquatic physical, aquatic biological, terrestrial physical and terrestrial
biological. Differences in condition based on changes in the watershed will be discussed
below. Changes have occurred in the riparian vegetation indicator and water quantity
indicator.
The riparian vegetation condition is part of the aquatic biological score. The riparian
vegetation indicator addresses the function and condition of riparian vegetation along
streams, water bodies, and wetlands. The riparian condition has changed in the project
area since the 2007 riparian survey. The current riparian condition is impaired in the Upper
Rio Bonito, and Magado Canyon. The Middle Rio Bonito riparian condition is functioning at
risk. The flood in 2008 caused by Hurricane Dolly removed many riparian plants and the site
is recovering.
Water Quantity is part of the aquatic physical score. The Water quantity indicator addresses
changes to the natural flow regime with respect to the magnitude, duration, or timing of the
natural stream flow hydrograph. The rating is based on conditions to historic conditions and
reference conditions. The natural hydrograph baseline is stream flows unaltered by
anthropogenic actions. Emphasis is on the permanent, long-term effects of water diversions
and water control features rather than flow changes due to vegetation management.
This score is impaired due to the dam at Bonito Lake and historical activities in the Bonito
Project Area that impact current conditions. Streams that feed into the project area such as
Littleton were straightened to accommodate historical mining and agricultural activities.
Many of these channels lack connectivity to the floodplain and sinuosity. This means that the
channels flow faster and do not store water in wetlands. Streams that lack connectivity to the
floodplain or sinuosity do not accommodate floods as well as those streams that are
connected to the floodplain. Floodplain connectivity allows flows to overtop the channel and
lower velocity of flow and decrease height of the water and this allows water to be absorbed
into soils which retain the water. The decrease in the water quantity score is a reflection of
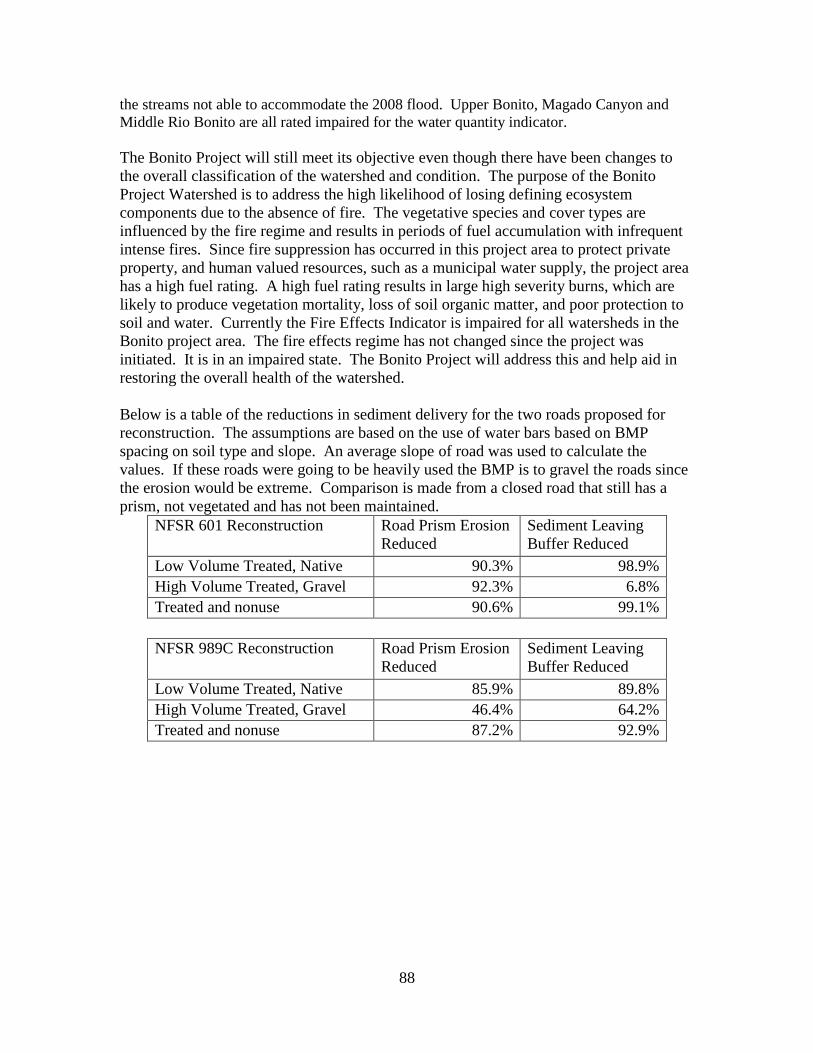
88
the streams not able to accommodate the 2008 flood. Upper Bonito, Magado Canyon and
Middle Rio Bonito are all rated impaired for the water quantity indicator.
The Bonito Project will still meet its objective even though there have been changes to
the overall classification of the watershed and condition. The purpose of the Bonito
Project Watershed is to address the high likelihood of losing defining ecosystem
components due to the absence of fire. The vegetative species and cover types are
influenced by the fire regime and results in periods of fuel accumulation with infrequent
intense fires. Since fire suppression has occurred in this project area to protect private
property, and human valued resources, such as a municipal water supply, the project area
has a high fuel rating. A high fuel rating results in large high severity burns, which are
likely to produce vegetation mortality, loss of soil organic matter, and poor protection to
soil and water. Currently the Fire Effects Indicator is impaired for all watersheds in the
Bonito project area. The fire effects regime has not changed since the project was
initiated. It is in an impaired state. The Bonito Project will address this and help aid in
restoring the overall health of the watershed.
Below is a table of the reductions in sediment delivery for the two roads proposed for
reconstruction. The assumptions are based on the use of water bars based on BMP
spacing on soil type and slope. An average slope of road was used to calculate the
values. If these roads were going to be heavily used the BMP is to gravel the roads since
the erosion would be extreme. Comparison is made from a closed road that still has a
prism, not vegetated and has not been maintained.
NFSR 601 Reconstruction Road Prism Erosion
Reduced
Sediment Leaving
Buffer Reduced
Low Volume Treated, Native 90.3% 98.9%
High Volume Treated, Gravel 92.3% 6.8%
Treated and nonuse 90.6% 99.1%
NFSR 989C Reconstruction Road Prism Erosion
Reduced
Sediment Leaving
Buffer Reduced
Low Volume Treated, Native 85.9% 89.8%
High Volume Treated, Gravel 46.4% 64.2%
Treated and nonuse 87.2% 92.9%
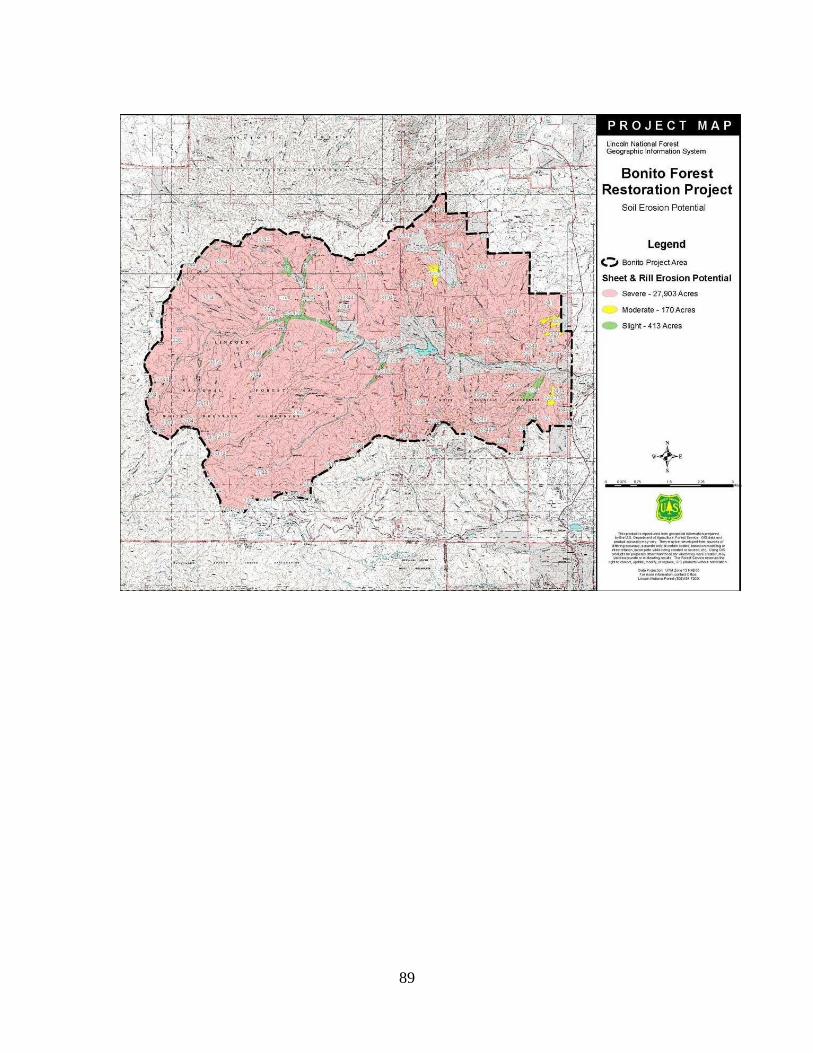
89

90
Corrected soil erosion potential for the project area for table 6.