Embed Size (px)
Citation preview

Proc. Natl. Acad. Sci. USAVol. 90, pp. 4087-4091, May 1993Evolution
Body size, metabolic rate, generation time, and the molecular clock(mitochondrial DNA/mutation/substitution rates/molecular evolution/oxidative damage)
ANDREW P. MARTIN* AND STEPHEN R. PALUMBItDepartment of Zoology and Kewalo Marine Laboratory, University of Hawaii, Honolulu, HI 96822
Communicated by John C. Avise, December 11, 1992 (receivedfor review October 15, 1992)
ABSTRACT There is increasing evidence for variation inrates of nucleotide substitution among divergent taxonomicgroups. Here, we summarize published rate data and show astrong relationship between substitution rate and body size.For instance, rates of nuclear and mtDNA evolution are slowin whales, intermediate in primates, and fast in rodents. Asimilar relationship exists for poikilothermic vertebrates. How-ever, these taxa have slower mtDNA substitution rates overallthan do homeotherms ofsimilar size. A number of physiologicaland life history variables are highly correlated with body size.Of these, generation time and metabolic rate explain somepatterns of rate heterogeneity equally well. In many cases,however, differences in metabolic rate explain important ex-ceptions to the generation time model. Correlation betweenmetabolic rate and nucleotide substitution may be mediated by(i) the mutagenic effects of oxygen radicals that are abundantby-products of aerobic respiration, and (it) increased rates ofDNA synthesis and nucleotide replacement in organisms withhigher metabolic rates. Both of these factors increase mutationrate by decreasing the "nucleotide generation time," theaverage length of time before a nucleotide is copied eitherthrough replication or repair. Reconsideration of the genera-tion time hypothesis to include physiological effects such asmetabolic rate improves the theoretical underpinnings of mo-lecular evolution.
reproduction, intrinsic rate of population increase, popula-tion size, and weight-specific metabolic rate (15). Tradition-ally, these variables have been related to a single, easilymeasurable biological attribute: body size (15). In the fol-lowing, we show that when there are differences in rate ofDNA substitution between taxa, high rates ofDNA evolutionoften are associated with small body size.Body size probably does not control the rate of DNA
substitution directly but serves as a convenient guidepost forunderstanding the biological correlates of molecular rateheterogeneity. We attempt to illuminate the underlyingcauses of the body size effect by separating the influence onevolutionary rate of some of the attributes correlated withbody size. We primarily focus on generation time and met-abolic rate because the effects of both on mutation have asound mechanistic basis, have been suggested to play im-portant roles in determining rates of molecular evolution, andrepresent factors for which large comparative data basesexist (6, 11, 13, 14). Finally, we present an explanation for theinfluence of metabolic rate on silent substitutions that showshow generation-time effects should theoretically be affectedby metabolic rate in just the fashion that we observe.
Experimental Evidence for Body Size Effects
Understanding the factors that affect nucleotide substitutionin DNA is central to evolutionary biology, population genet-ics, and mutation research. To explore such factors evolu-tionary rates are generally determined with reference toabsolute or relative divergence time between taxa (1). Ratesof evolution estimated in this way often differ among diver-gent taxonomic groups (2-10), and explanations for this ratevariation represent important hypotheses about the factorsthat determine DNA evolution (11-14).Many hypotheses have been proposed to account for
differences in rates ofDNA evolution, including DNA repairefficiency (3), rate of cell division (5), generation time (5, 6),and weight-specific metabolic rate (14). Often, very few dataare available to support associations between molecular rateand cellular attributes. For example, DNA repair efficienciesor rates ofgerm-cell division are poorly known for many taxa,and direct tests of the relationships between these variablesand DNA substitution rate have never been performed. Thus,it has been difficult to partition the observed variance in DNAsubstitution rates in biologically meaningful ways or to esti-mate the contribution made by cellular, physiological, or lifehistory differences to variation in rates of molecular evolu-tion.The search for factors that influence molecular evolution is
made more difficult because many physiological and lifehistory variables are correlated with one another. Suchvariables include generation time, life span, age at first
Minimum-evolution analysis of mutations in a globin pseu-dogene has shown that there is marked heterogeneity in thesilent rate among different primates (16). When publishedmeasurements of average adult body size are compared tothese rates (Fig. 1A; Table 1) we see that much of thisvariation is explained by smaller body size in taxa with higherrates. Analysis of cytochrome b evolution in mammalianmtDNA shows a similar pattern. Evolution along terminalbranches leading to a variety of different mammalian ordersis markedly heterogeneous. Silent rates calculated from thefossil data available show a decrease with increasing bodysize (Fig. 1B). Transversion differences in the cytochrome bdata of Martin et al. (14) also show higher substitution ratesin smaller elasmobranchs than in genera with larger individ-uals (21). Analysis of other data sets shows similar patterns(e.g., refs. 21, 23, 24).
Larger mtDNA data sets with broader taxonomic breadthare available from restriction fragment studies rather thanfrom sequence comparisons. A summary ofpublished geneticdistances and fossil dates (Table 2; Fig. 2) shows the samegeneral trend as in Fig. 1; rate ofmtDNA evolution decreaseswith increasing body size. However, in the larger analysis,two groups are evident that separate with regard to energymetabolism: the homeotherms and the poikilotherms. Ingeneral, for a given body size, rate of mtDNA divergence isgreater for homeotherms than for poikilotherms.
*Present address: Smithsonian Tropical Research Institute, NaosMarine Laboratory, Unit 0948, APO AA 34002-0948 Balboa, Pan-ama.tTo whom reprint requests should be addressed.
4087
The publication costs of this article were defrayed in part by page chargepayment. This article must therefore be hereby marked "advertisement"in accordance with 18 U.S.C. §1734 solely to indicate this fact.

4088 Evolution: Martin and Palumbi
A
0%
cn
o
0
globin data
Body size (grams)B
-1 '1 '24 '5 6 '~7
10 10 10 10 10 10 10 10
Body size (grams)
0%
a-
0
0
0
FIG. 1. (A) Relationship between the logarithm of substitutionrate (in number of substitutions per 1000 bp) at synonymous sites andbody size for lineages of primates. Rates were obtained by dividingbranch lengths from neighbor-joining trees by published fossil datesfor origination times. Data are from Table 1 and refs. 16, 17-20. Dotsare best estimates; vertical boxes represent ranges. Boxes are dottedfor spider and owl monkeys, whose minimum divergence times are
poorly known. (B) Relationship between the logarithm of silenttransversion rate in the cytochrome b gene and body size formammals. 1, Rat; 2, mouse; 3, sheep; 4, pig; 5, dolphin; 6, goat; 7,cow, 8, elephant; 9, whale. Rates are from refs. 21 and 22. Body sizesare from Wootton (17).
Within the homeotherms, the most extreme results are theslow rates recorded for whales and the fast rates for rodents(Table 2; Fig. 2). How robust are these data? For whales,previous reports have suggested that the rate of molecularevolution is slow (ref. 10; C. S. Baker and S.R.P., unpub-lished data). Comparison ofmtDNA fragment patterns basedon 15 restriction enzymes shows that humpback and finwhale mtDNAs are 6%o different, even though the genera
represented by these species diverged by the late Miocene,between 6 and 15 million years ago (35). These fossil andmolecular data show that overall mtDNA divergence isbetween 0.4% and 1.0% per million years in whales.For rodents, previously published divergence times be-
tween rat and mouse range from 5 to 30 million years (36).This 6-fold difference in timing has meant the differencebetween conclusions of substitution rate constancy or vari-ation (6, 36, 37). Recent detailed studies provide strongevidence for a 10- to 12-million year divergence time betweenRattus and Mus (38) and have established divergence timesamong species ofMus (25, 38, 39). Use of these data suggeststhat the rodent rate is high (see also refs. 7, 9, 39-41).The general inverse relationship between rate of DNA
evolution and body size shows several intriguing exceptions.
Table 1. Estimates of silent substitution rate (substitutions per siteper billion years) for nuclear DNA (from ref. 16), measurements orestimates of specific metabolic rate (ml of 02/kg per hr), andgeneration time (days) for species of primates
Substitution Metabolic GenerationSpecies rate rate time*
Owl monkey 2.1 450t 880Spider monkey 1.9 415t 1700Macaque 1.8 430t 1095Gibbon 1.7 370* 3410Orangutan 1.2 230t 4290Gorilla 1.2 200t 3438Chimpanzee 1.2 220t 3190Human 1.1 210t 6200
Kendall's correlationcoefficient 0.75§ -0.75§
*Listed as age at first reproduction in Wootton (17).tFrom McKnabb (19) and Altman and Dittmer (20).tCalculated from the relationship between metabolic rate and bodysize (15) using body sizes from Harvey and Clutton-Brock (18).§p < 0.01.
Geese have a slower substitution rate than predicted for theirsize (box 6 in Fig. 2). Whether this is true of all birds iscurrently unknown, but Kessler and Avise (42) suggested thatbirds have a slower rate ofmtDNA evolution than mammals.In addition, rat appears to have a faster silent mtDNAsubstitution rate than mouse (Fig. 1B), even though mice areless than half the size of rats.
Competing Explanations for Body Size Effects
Our results indicate that DNA substitutions accumulate at aslower rate in large animals than in small animals. In the past,similar results have been ascribed to generation time effectson rates of molecular evolution (5, 6, 16). As a result, thegeneration time hypothesis has gained widespread accept-ance among evolutionary biologists. Theoretically, an asso-ciation between generation time and the accumulation ofnucleotide substitutions is to be expected if most substitu-tions are the result of errors during replication and if mostspecies have broadly similar numbers of cell divisions pergeneration. In essence, species with a short generation timewill experience similar numbers of cell replications and thesame degree of DNA substitution per generation as dolong-generation time species but will accumulate a greaternumber of DNA changes per year (11). This rationale doesnot necessarily apply to mutations under weak selection (11).However, recent evidence from analysis of nucleotide
substitution rates ofmtDNA (12-14) and nuclearDNA (8, 10)challenges the exclusivity of the generation time hypothesis.In these cases, mammals, reptiles, and fish with relativelyshort generation times have unexpectedly slow rates ofDNAevolution. Departure from the predictions of the generationtime hypothesis provides the basis to investigate the role thatother variables play in setting the pace of nucleotide substi-tution.As noted above, the association between rates ofmolecular
evolution and generation time is confounded by tight corre-lations between body size, generation time, metabolic rate,and other physiological and life history variables. In thiscontext, a correlation between variables does not prove acausative relationship between them. Multiple regressions ofvarious factors against silent rate in principle could teaseapart the relationships between causative and correlatedvariables as long as silent rates for each lineage are calculatedindependently.For comparisons among simian primates (monkeys and
apes), generation time and specific metabolic rate data are
Proc. Natl. Acad. Sci. USA 90 (1993)

Proc. Natl. Acad. Sci. USA 90 (1993) 4089
Table 2. Estimates of percent sequence divergence, time of divergence from the fossil record, divergence rate, and average adult bodysize for a variety of vertebrates
% sequence Divergence Divergence Body size, GenerationTaxon difference time, Mya rate, %/Myr kg time, yr Ref(s).
HomeothermRodentsMus musculus-M. spretus 11.3 1-3 3.8-11.3 0.020 0.2-0.3 25
DogsCanis latrans-C. lupus 2.7-4.2 1-2 1.8-3.5 10-55 2-3 26
Horses 7.8 3-5 1.5-2.6 100-400 3-4 27Bears
Ursus arctos-U. maritimus 0.8-1.2 0.5 1.6-2.4 150-300 4-5 28U. arctos-U. americanus 6.9-7.1 3.5 1.9-2.0 150-300 4-5 28U. maritimus-U. americanus 7.6-7.7 4.4 1.7-1.8 150-300 4-5 28
PrimatesHomo sapiens-Pan troglodytes 10.5 5 2.1 33-55 8-15 29
WhalesMegaptera novanglieae-Baleanoptera physalus 6.0 6-15 1.0-0.4 40,000 5-10 *
GeeseBranta-Anser 9.0 4-5 1.8-2.3 1-2 2-3 30
PoikilothermTortoise
East vs. west Gopherus 5.3 5.5 0.95 0.5-3 17-20 31Gopherus-Xerobates 11.2 15-23 0.48-0.75 0.5-3 17-20 31
Sea turtlesGeminate Chelonia 0.6 1.5-3.0 0.2-0.40 50-70 >20 13, 32Kemp and Ridley's 1.2 3-4 0.30-0.40 30-50 >20 13, 33
AmphibiansNewts 8.0 8-12 0.67-1.0 0.020 2-3 34Frogs 8.3 11-12 0.69-0.75 0.050 2-3 34
SharksSphyrna-Galeocerdo 17 55 0.31 60-100 10-15 14, 21
Teleost fishSalmon 5.2 6-10 0.9-0.5 1-4 1-4 21
Percent sequence divergence is estimated from restriction fragment length polymorphism (RFLP) analysis ofmtDNA. Mya, million years ago;Myr, million years.*C. S. Baker and S.R.P., unpublished data.
available. Regression analyses show that both are highlycorrelated with the silent rate. However, in a multiple re-gression of the silent rate versus generation time and meta-bolic rate, only the latter had a significant 13 coefficient (P =
1-.
a
0
8cn
101
100
10,-2 -.1 0 1 2 3 4
10 10 10 10 10 10 10
Mass (k)
FIG. 2. Relationship between rate of mtDNA sequence diver-gence (% change per million years) and body size (in kg) for variousvertebrates. Data are from Table 2. 1, Mice; 2, dogs; 3, human-chimpanzee; 4, horses; 5, bears; 6, geese; 7, whales; 8, newts; 9,frogs; 10, tortoise; 11, salmon; 12, sea turtles; 13, sharks. Boxesrepresent the range of rates and body sizes for a given taxon. Solidlines are drawn to pass through the boxes. Dashed line represents thehypothesis of rate constancy.
0.009 for metabolic rate versus P = 0.349 for generationtime). Although multiple regression can be a weak tool whenvariables are highly correlated, the analysis suggests that theapparent relationship of silent rate to generation time may bean artifact.For the cytochrome b data in Fig. 1B, neither generation
time nor metabolic rate shows a significant correlation withsilent rate by either parametric or nonparametric tests. How-ever, generation time and metabolic rate together yield asignificant multiple regression analysis (R2 = 0.673, F =6.187, P = 0.035), indicating that both factors may be playingimportant roles in a synergistic fashion.
In other cases, inspections of molecular rate data do notfollow the predictions of the generation time hypothesis. Forexample, whales have a slow rate of nuclear DNA evolutionrelative to primates despite their shorter generation time (10).Rates of single-copy DNA evolution are slower in marsupialsthan in placental mammals independant of generation time(ref. 8; but see ref. 43). Substitution rates in nuclear ribo-somal genes are 8-fold slower in salamanders than in mam-mals (44), despite their shorter generation times.For mtDNA rates, Hasegawa and Kishino (12) failed to fmd
an association between generation time and mtDNA substi-tution rate. Furthermore, the silent rate in shark mtDNAs is5-7 times slower than in primates or ungulates despite broadlysimilar ranges of generation times for the three groups (14).Similarly, mtDNA divergence rates ofnewts and frogs, whosegeneration times are on the order of 3-5 years (44), are slowerthan those of primates (34). Rates of mtDNA evolution are
Evolution: Martin and Palumbi
4090 Evolution: Martin and Palumbi
higher in honey bees than in Drosophila, even though gener-ation times for honey bees are longer than Drosophila (45).
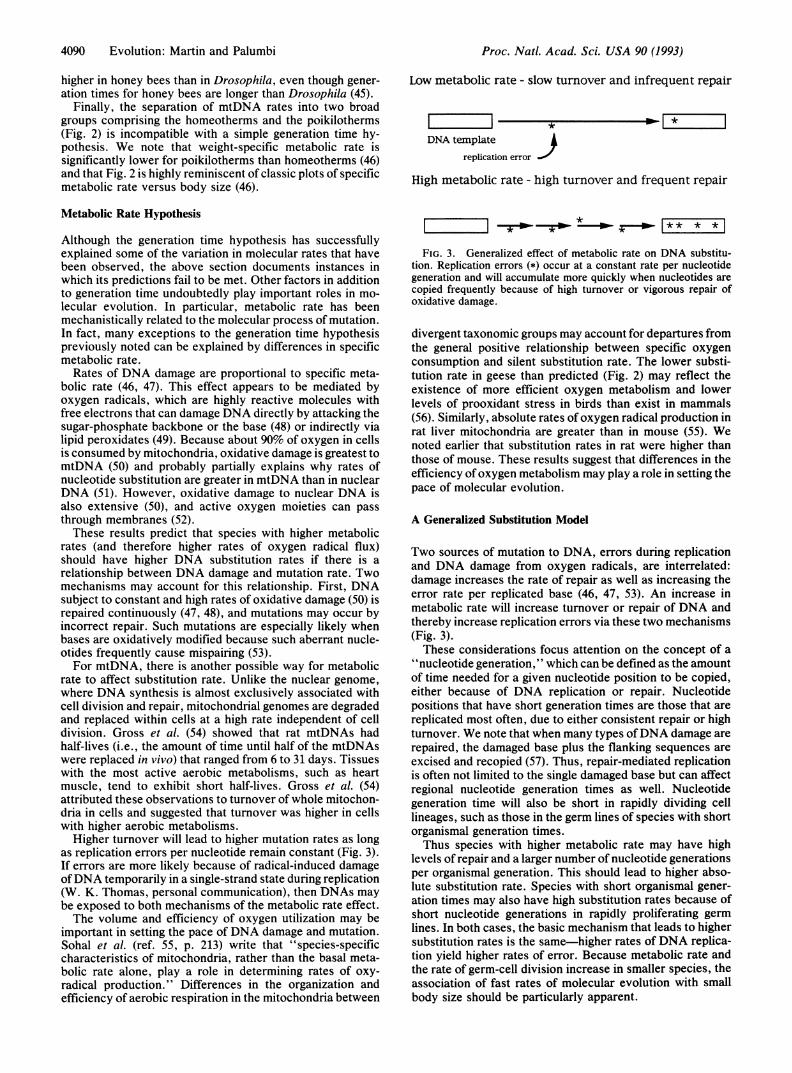
Finally, the separation of mtDNA rates into two broadgroups comprising the homeotherms and the poikilotherms(Fig. 2) is incompatible with a simple generation time hy-pothesis. We note that weight-specific metabolic rate issignificantly lower for poikilotherms than homeotherms (46)and that Fig. 2 is highly reminiscent of classic plots of specificmetabolic rate versus body size (46).
Low metabolic rate - slow turnover and infrequent repair
I I *DNA template 4
replication error
High metabolic rate - high turnover and frequent repair
Metabolic Rate Hypothesis
Although the generation time hypothesis has successfullyexplained some of the variation in molecular rates that havebeen observed, the above section documents instances inwhich its predictions fail to be met. Other factors in additionto generation time undoubtedly play important roles in mo-lecular evolution. In particular, metabolic rate has beenmechanistically related to the molecular process of mutation.In fact, many exceptions to the generation time hypothesispreviously noted can be explained by differences in specificmetabolic rate.
Rates of DNA damage are proportional to specific meta-bolic rate (46, 47). This effect appears to be mediated byoxygen radicals, which are highly reactive molecules withfree electrons that can damage DNA directly by attacking thesugar-phosphate backbone or the base (48) or indirectly vialipid peroxidates (49). Because about 90% of oxygen in cellsis consumed by mitochondria, oxidative damage is greatest tomtDNA (50) and probably partially explains why rates ofnucleotide substitution are greater in mtDNA than in nuclearDNA (51). However, oxidative damage to nuclear DNA isalso extensive (50), and active oxygen moieties can passthrough membranes (52).These results predict that species with higher metabolic
rates (and therefore higher rates of oxygen radical flux)should have higher DNA substitution rates if there is arelationship between DNA damage and mutation rate. Twomechanisms may account for this relationship. First, DNAsubject to constant and high rates of oxidative damage (50) isrepaired continuously (47, 48), and mutations may occur byincorrect repair. Such mutations are especially likely whenbases are oxidatively modified because such aberrant nucle-otides frequently cause mispairing (53).
For mtDNA, there is another possible way for metabolicrate to affect substitution rate. Unlike the nuclear genome,where DNA synthesis is almost exclusively associated withcell division and repair, mitochondrial genomes are degradedand replaced within cells at a high rate independent of celldivision. Gross et al. (54) showed that rat mtDNAs hadhalf-lives (i.e., the amount of time until half of the mtDNAswere replaced in vivo) that ranged from 6 to 31 days. Tissueswith the most active aerobic metabolisms, such as heartmuscle, tend to exhibit short half-lives. Gross et al. (54)attributed these observations to turnover of whole mitochon-dria in cells and suggested that turnover was higher in cellswith higher aerobic metabolisms.Higher turnover will lead to higher mutation rates as long
as replication errors per nucleotide remain constant (Fig. 3).If errors are more likely because of radical-induced damageofDNA temporarily in a single-strand state during replication(W. K. Thomas, personal communication), then DNAs maybe exposed to both mechanisms of the metabolic rate effect.The volume and efficiency of oxygen utilization may be
important in setting the pace of DNA damage and mutation.Sohal et al. (ref. 55, p. 213) write that "species-specificcharacteristics of mitochondria, rather than the basal meta-bolic rate alone, play a role in determining rates of oxy-radical production." Differences in the organization andefficiency of aerobic respiration in the mitochondria between
FIG. 3. Generalized effect of metabolic rate on DNA substitu-tion. Replication errors (*) occur at a constant rate per nucleotidegeneration and will accumulate more quickly when nucleotides arecopied frequently because of high turnover or vigorous repair ofoxidative damage.
divergent taxonomic groups may account for departures fromthe general positive relationship between specific oxygenconsumption and silent substitution rate. The lower substi-tution rate in geese than predicted (Fig. 2) may reflect theexistence of more efficient oxygen metabolism and lowerlevels of prooxidant stress in birds than exist in mammals(56). Similarly, absolute rates of oxygen radical production inrat liver mitochondria are greater than in mouse (55). Wenoted earlier that substitution rates in rat were higher thanthose of mouse. These results suggest that differences in theefficiency of oxygen metabolism may play a role in setting thepace of molecular evolution.
A Generalized Substitution Model
Two sources of mutation to DNA, errors during replicationand DNA damage from oxygen radicals, are interrelated:damage increases the rate of repair as well as increasing theerror rate per replicated base (46, 47, 53). An increase inmetabolic rate will increase turnover or repair of DNA andthereby increase replication errors via these two mechanisms(Fig. 3).These considerations focus attention on the concept of a
"nucleotide generation," which can be defined as the amountof time needed for a given nucleotide position to be copied,either because of DNA replication or repair. Nucleotidepositions that have short generation times are those that arereplicated most often, due to either consistent repair or highturnover. We note that when many types ofDNA damage arerepaired, the damaged base plus the flanking sequences areexcised and recopied (57). Thus, repair-mediated replicationis often not limited to the single damaged base but can affectregional nucleotide generation times as well. Nucleotidegeneration time will also be short in rapidly dividing celllineages, such as those in the germ lines of species with shortorganismal generation times.Thus species with higher metabolic rate may have high
levels of repair and a larger number of nucleotide generationsper organismal generation. This should lead to higher abso-lute substitution rate. Species with short organismal gener-ation times may also have high substitution rates because ofshort nucleotide generations in rapidly proliferating germlines. In both cases, the basic mechanism that leads to highersubstitution rates is the same-higher rates of DNA replica-tion yield higher rates of error. Because metabolic rate andthe rate of germ-cell division increase in smaller species, theassociation of fast rates of molecular evolution with smallbody size should be particularly apparent.
Proc. Natl. Acad Sci. USA 90 (1993)
'{*I

Proc. Natl. Acad. Sci. USA 90 (1993) 4091
Exceptions
No single factor is likely to completely explain variation inrates ofDNA evolution, and it comes as no surprise that notall previous empirical studies follow the predictions of themetabolic rate or the generation time hypotheses. Probablythe most interesting finding has been that not all DNAsequences show identical rate heterogeneity in the samegroup of species (6). Among primates, for example, not allgenes show a rate decrease along the human lineage (24).
In addition, there is evidence that the silent rate fordifferent genes in the same genome can be different. Wolfe etal. (58) showed higher substitution rates in genes with inter-mediate G+C contents at silent sites. This discovery suggeststhat differences in nucleotide composition among genes mayaccount for substitution rate heterogeneity (however, see ref.9).
Differences in the degree of rate heterogeneity betweendifferent genes among taxa and differences in the rate ofsubstitution among genes within taxa suggest that any or-ganism-wide physiological factor like metabolic rate or gen-eration time is likely to have complex effects on DNAevolution. It is reasonable to assume that some regions ofDNA are less susceptible to DNA damage than othersbecause of secondary structure, presence of proteins com-plexed with DNA, or differences in nucleotide composition.Perhaps some parts of the genome have shorter nucleotidegeneration times due to differential repair.
Despite this complexity, physiological and life historydifferences often correlate with rates ofDNA evolution. Wehave argued that metabolic rate and generation time effectsmight ultimately rely on a common molecular mechanism andthat the heart of this mechanism is the concept of nucleotidegeneration time. Other factors may also be at work withincomplex genomes, and, in all probability, there is a hierarchyof mechanisms that impinge on DNA evolution. Futureresearch should focus on multiple causes of rate heteroge-neity.
C. S. Baker generously provided access to unpublished restrictionfragment length polymorphism data on whale mtDNA. We thankC. S. Baker, W. 0. McMillan, E. Metz, A. Perry, J. Quattro, S.Romano, and A. Taylor and two careful anonymous reviewers forcomments and criticism. This work was supported by NationalScience Foundation grants to S.R.P. and a University of HawaiiResearch Corporation graduate fellowship to A.P.M.
1. Wilson, A. C., Carlson, S. S. & White, T. J. (1977) Annu. Rev.Biochem. 46, 473-539.
2. Bonner, T. I., Heinemann, R. & Todara, G. J. (1980) Nature(London) 286, 341-346.
3. Britten, R. J. (1986) Science 231, 1393-1398.4. Vawter, L. & Brown, W. M. (1986) Science 234, 194-1%.5. Wu, C.-I. & Li, W.-H. (1985) Proc. Natl. Acad. Sci. USA 82,
1741-1745.6. Li, W.-H., Tanimura, M. & Sharp, P. M. (1987) J. Mol. Evol. 25,
330-342.7. Li, W.-H., Manolo, G., Sharp, P. M., O'Uhigin, C. & Yang, Y.-W.
(1990) Proc. Nat!. Acad. Sci. USA 87, 6703-6707.8. Springer, M. S. & Kirsch, J. A. W. (1989) Mol. Biol. Evol. 6,
331-341.9. Bulmer, M., Wolfe, K. H. & Sharp, P. M. (1991) Proc. Natl. Acad.
Sci. USA 88, 5974-5978.10. Schlotterer, C., Amos, B. & Tautz, D. (1991) Nature (London) 354,
63-65.11. Kimura, M. (1979) Proc. Natl. Acad. Sci. USA 76, 3440-3444.12. Hasegawa, M. & Kishino, H. (1989) Jpn. J. Genet. 64, 243-258.13. Avise, J. C., Bowen, B. W., Lamb, T. A., Meylan, B. & Berming-
ham, E. (1992) Mol. Biol. Evol. 9, 457-473.
14. Martin, A. P., Naylor, G. J. P. & Palumbi, S. R. (1992) Nature(London) 357, 153-155.
15. Calder, W. A., III (1984) Size, Function, and Life History (HarvardUniv. Press, Cambridge, MA).
16. Bailey, W. J., Fitch, D. H. A., Tagle, D. A., Czelusniak, J., Sligh-tom, J. L. & Goodman, M. (1991) Mol. Biol. Evol. 8, 155-184.
17. Wootton, J. T. (1987) Evolution 41, 732-749.18. Harvey, P. & Clutton-Brock, T. H. (1985) Evolution 39, 559-581.19. McKnabb, B. K. (1988) Q. Rev. Biol. 63, 25-54.20. Altman, P. L. & Dittmer, D. S. (1972) Biology Data Book (Fed. Am.
Soc. Exp. Biol.), 2nd Ed., Bethesda, MD Vol. 3.21. Martin, A. P. (1992) Ph.D. dissertation (University of Hawaii,
Honolulu).22. Irwin, D. M., Kocher, T. D. & Wilson, A. C. (1991) J. Mol. Evol.
32, 128-144.23. Hayasaka, K., Gojobori, T. & Horai, S. (1988) Mol. Biol. Evol. 5,
626-644.24. Easteal, S. (1991) Mol. Biol. Evol. 8, 115-127.25. Auffray, J. C., Vanlerberghe, F. & Britton-Davidson, J. (1990) Biol.
J. Linn. Soc. 41, 13-25.26. Lehman, N., Eisenhawer, A., Hansen, K., Mech, L. D., Peterson,
R. O., Gogan, P. J. P. & Wayne, R. K. (1991) Evolution 45, 104-119.
27. George, M., Jr., & Ryder, 0. A. (1986) Mol. Biol. Evol. 3, 535-546.28. Shields, G. F. & Kocher, T. D. (1991) Evolution 45, 218-221.29. Brown, W. M., George, M., Jr., & Wilson, A. C. (1979) Proc. Natl.
Acad. Sci. USA 76,1967-1971.30. Shields, G. F. & Wilson, A. C. (1987) J. Mol. Evol. 24, 212-217.31. Lamb, T., Avise, J. C. & Gibbons, J. W. (1989) Evolution 43,
76-87.32. Bowen, B. W., Meylan, A. B., Ross, J. P., Limpus, C. J., Balazs,
G. H. & Avise, J. C. (1992) Evolution 46, 865-881.33. Bowen, B. W., Meylan, A. B. & Avise, J. C. (1991) Nature (Lon-
don) 352, 709-711.34. Wallis, G. P. & Arntzen, J. W. (1989) Evolution 43, 8-104.35. Barnes, L. G., Domning, D. P. & Ray, C. E. (1976) Marine Mam-
mal Sci. 1, 15-53.36. Wilson, A. C., Cann, R. L., Carr, S. M., George, M., Gyllensten,
U., Helm-Bychowski, K., Higuchi, R. G., Palumbi, S. R., Prager,E. M., Sage, R. D. & Stoneking, M. (1985) Biol. J. Linn. Soc. 26,375-400.
37. Lanave, C., Preparata, G., Saccone, C. & Serio, G. (1984) J. Mol.Evol. 20, 86-93.
38. Catzeflis, F. M., Aguilar, J.-P. & Jaeger, J.-J. (1992) Trends Ecol.Evol. 7, 122-126.
39. She, J. X., Bonhommer, F., Bourrot, P., Thaler, L. & Catzeflis, F.(1990) Biol. J. Linn. Soc. 41, 83-103.
40. Holmes, E. C. (1991) J. Mol. Evol. 33, 209-215.41. Smith, M. (1993) Biol. J. Linn. Soc., in press.42. Kessler, L. G. & Avise, J. C. (1985) Mol. Biol. Evol. 2, 109-125.43. Cockburn, A., Mansergh, I. M., Broome, L. S. & Ward, S. (1990)
Mol. Biol. Evol. 7, 283-285.44. Larson, A. & Wilson, A. C. (1989) Mol. Biol. Evol. 6, 131-154.45. Crozier, R. H., Crozier, Y. C. & Mackinlay, A. G. (1989) Mol. Biol.
Evol. 6, 399-411.46. Schimdt-Nielsen, K. (1986) Scaling: Why Is Animal Size So Impor-
tant? (Cambridge Univ. Press, New York).47. Shigenaga, M. K., Gimeno, C. J. & Ames, B. N. (1989) Proc. Natl.
Acad. Sci. USA 86, 9697-9701.48. Joenje, H. (1989) Mutat. Res. 219, 193-208.49. Hruszkewycz, A. M. (1988) Biochem. Biophy. Res. Commun. 153,
191-197.50. Richter, C., Park, J.-W. & Ames, B. N. (1988) Proc. Natl. Acad.
Sci. USA 85, 6465-6467.51. Brown, W. M., Prager, E. M., Wang, A. & Wilson, A. C. (1982) J.
Mol. Evol. 18, 225-239.52. Dutton, D. R. & Bowden, G. T. (1985) Carcinogenesis 6, 1279-
1284.53. Cheng, K. C., Cahill, D. S., Kasai, H., Nishimura, S. & Loeb,
L. A. (1992) J. Biol. Chem. 267, 166-172.54. Gross, N. J., Getz, G. S. & Rabinowitz, M. (1969) J. Biol. Chem.
244, 1552-1562.55. Sohal, R. S., Svensson, I. & Brunk, U. T. (1990) Mech. Ageing
Dev. 53, 209-215.56. Suarez, R. K., Lighton, J. R. B., Brown, G. S. & Mathieu-Cos-
tello, 0. (1991) Proc. Natl. Acad. Sci. USA 88, 4870-4873.57. Kornberg, A. (1990) DNA Replication (Freeman, San Francisco).58. Wolfe, K. H., Sharp, P. M. & Li, W.-H. (1989) Nature (London)
337, 283-285.
Evolution: Martin and Palumbi