Embed Size (px)
Citation preview


Board of Directors - 2005 Mayor Jim Dailey Ward 1 Johnnie Pugh Ward 2 Willie Hinton Ward 3 Stacy Hurst Ward 4 Brad Cazort Ward 5 Michael Keck Ward 6 Genevieve Stewart Ward 7 B.J. Wyrick Position 8 Dean Kumpuris Position 9 Barbara Graves Position 10 Joan Adcock Board of Adjustment – 2005 Andrew Francis – Chairman Terry Burruss – Vice Chair Fletcher Henson Debra Harris David Wilbourn City Beautiful Commission - 2005 Karol Zoeller – Chairperson Jan Baker John Beneke Cita Cobb Jan Barlett Hicks Amy Ivey Troy Laha Ross Piazza Lynn Mittelstaedt Warren Midtown Advisory Board - 2005 Bill Rector – Chairperson Craig Berry – Vice Chair Alicia Cooper John Kincaid Baker Kurrus Melinda Martin Scott Mosley
Planning Commission - 2005 Mizan Rahman – Chairperson Robert Stebbins – Vice Chairperson Pam Adcock Fred Allen, Jr. Norm Floyd Gary Langlais Jerry Meyer Bill Rector Chauncey Taylor Darrin Williams Jeff Yates River Market Design Review Committee - 2005 Tim Heiple -Chairman Shannon Jeffery-Light Frank Porbeck Ann Wait Millie Ward Construction Board of Adjustment and Appeal -2005 Terry Burruss – Chairperson Danny Bennett Doug Bown H. James Enstrom Robert Merriott Issac Ross Clyde Smith Historic District Commission -2005 Carolyn Newbern – Chairperson Marshall Peters Joe Serebrov Kay Tatum Wesley Walls


Table of Contents Zoning and Subdivision Summary . . . . . . . . . . . . . . . . . . . . . . . . . . . . . . . . . . . . . . . . . . 1 Building Codes Division Summary . . . . . . . . . . . . . . . . . . . . . . . . . . . . . . . . . . . . . . . . . . 5 Planning Division Summary . . . . . . . . . . . . . . . . . . . . . . . . . . . . . . . . . . . . . . . . . . 9 Urban Development Data Development Activity Summary . . . . . . . . . . . . . . . . . . . . . . . . . . . . . . . . . . . . . . . 15 Population Estimates . . . . . . . . . . . . . . . . . . . . . . . . . . . . . . . . . . . . . . . . . .16
Construction Activity . . . . . . . . . . . . . . . . . . . . . . . . . . . . . . . . . . . . . . . . . .17 Residential Activity . . . . . . . . . . . . . . . . . . . . . . . . . . . . . . . . . . . . . . . . . .20 Housing Construction Values . . . . . . . . . . . . . . . . . . . . . . . . . . . . . . . . . . . . . . . . . .22 Affordable Housing . . . . . . . . . . . . . . . . . . . . . . . . . . . . . . . . . . . . . . . . . .24 Residential Additions and Renovation Activity. . . . . . . . . . . . . . . . . . . . . . . . . . . . 25 Demolition Activity . . . . . . . . . . . . . . . . . . . . . . . . . . . . . . . . . . . . . . . . . .28 Office Activity . . . . . . . . . . . . . . . . . . . . . . . . . . . . . . . . . . . . . . . . . .30 Commercial Activity . . . . . . . . . . . . . . . . . . . . . . . . . . . . . . . . . . . . . . . . . .33 Industrial Activity . . . . . . . . . . . . . . . . . . . . . . . . . . . . . . . . . . . . . . . . . .36 Annexation Activity . . . . . . . . . . . . . . . . . . . . . . . . . . . . . . . . . . . . . . . . . .39 Subdivision Activity . . . . . . . . . . . . . . . . . . . . . . . . . . . . . . . . . . . . . . . . . .40 Zoning Activity . . . . . . . . . . . . . . . . . . . . . . . . . . . . . . . . . . . . . . . . . .43
Zoning and Subdivision Division
1
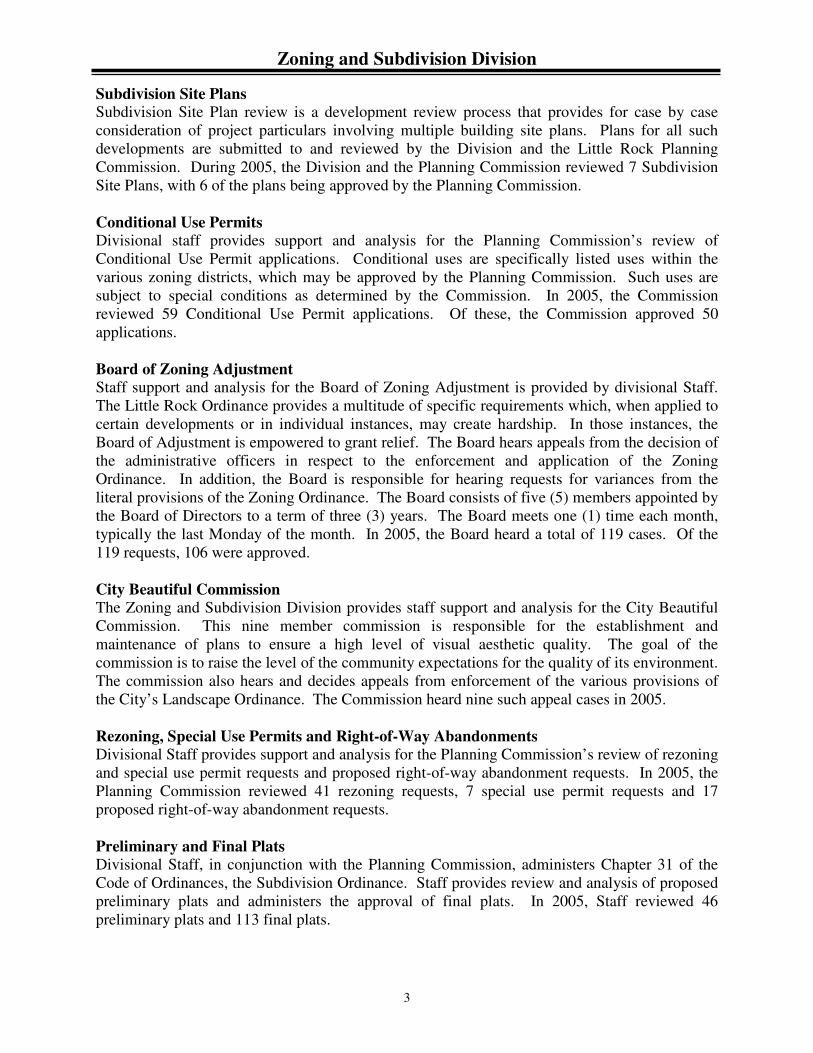
Zoning and Subdivision Regulations are the principal tools employed by the City of Little Rock in guiding the city objectives and plans to specify goals. They assure compatibility of uses while directing the placement of infrastructure and public services. Platting, rezoning and site development ordinances are administered by this Division. Additionally, use permits, variances and enforcement are dealt with daily. The Division also acts as a resource agency for developers, realtors and other citizens when presented with requests for current zoning, plat status, development standards or statistical information. Limited involvement in maintaining a neighborhood contact list for purposes of monitoring development activities has been continued by the division. The list is monitored for updates and expansions, within a computer master list. This record offers several notice formats for contacts. This Division has encouraged local developers to provide early contact with staff to assure that development proposals are filed in a timely manner, and with involvement of interested persons or organizations. Staff from the Division continues their involvement in neighborhood meetings with developers and area residents. These meetings are held in the neighborhood normally during the evening hours to facilitate attendance by interested neighbors. These meetings usually concern an active application for development. 2005 Sign Code Statistics Sign permits brought in $30,830 in fees for the year. In addition, the Division administered the scenic corridor provisions on billboards. 688 Sign Permits Issued 6299 Sign Inspections and Re-inspections In 2006, the Division will continue to monitor and enforce the Sign Ordinance. The staff anticipates no significant changes in the coming year. Commercial Plan Review The Division provides for a detailed review of all commercial permits for purposes of assuring that all developments comply with Zoning, Subdivision and Landscape Ordinance standards. Additionally, reviews of the landscape and buffer requirements for developments going before the Planning Commission are provided. These reviews not only aid the City Beautiful Commission in its efforts to create a more livable city, but assist in providing a five (5) day “turnaround” on all commercial building permits.

Zoning and Subdivision Division
2
2005 Plans Review for Zoning, Subdivision and Landscape Requirements 210 Commercial Plans/New or Additions 286 Commercial Landscape Plans
2005 Other Activities 4 Franchise Request 652 Site Inspections 113 Certificates of Occupancy 16 Temporary Structure Permits
Enforcement The Division performs a key role in maintaining the effect and values of land use regulation by enforcing the Zoning, Subdivision and Landscape Ordinances. Over 3,000 inspections and re-inspections were performed.
2005 Plan Reviews for Permits 1488 Residential Plans – New or Additions
2005 Privileges Licenses 1580 Retail, Commercial, Office, Industrial and Home Occupation Reviews
2005 Information Inquiries 5552 Request for Sign, Zoning, Enforcement or Licenses
2005 Court Cases 46 Cases – All Types
2005 Citations Issued 8 Cases – All Types
Wireless Communication Facilities The Division continued to administer Article 12 of the City Ordinances, passed January 1998, which regulates wireless communication facilities. During 2004, 39 locations were approved administratively. The number of WCF applications increased in 2005 as a new wireless provider came into the Little Rock market. Staff shall continue to encourage collocation of WCF facilities. Zoning Site Plan Zoning Site Plan review is a development review process that provides for case-by-case consideration of project particulars involving site development plans within certain zoning districts in the City of Little Rock. Plans for all such developments are submitted to and reviewed by the Division and the Little Rock Planning Commission. During 2005, the Division and the Planning Commission reviewed 4 zoning site plans, all of which were approved by the Planning Commission.
Zoning and Subdivision Division
3
Subdivision Site Plans Subdivision Site Plan review is a development review process that provides for case by case consideration of project particulars involving multiple building site plans. Plans for all such developments are submitted to and reviewed by the Division and the Little Rock Planning Commission. During 2005, the Division and the Planning Commission reviewed 7 Subdivision Site Plans, with 6 of the plans being approved by the Planning Commission. Conditional Use Permits Divisional staff provides support and analysis for the Planning Commission’s review of Conditional Use Permit applications. Conditional uses are specifically listed uses within the various zoning districts, which may be approved by the Planning Commission. Such uses are subject to special conditions as determined by the Commission. In 2005, the Commission reviewed 59 Conditional Use Permit applications. Of these, the Commission approved 50 applications. Board of Zoning Adjustment Staff support and analysis for the Board of Zoning Adjustment is provided by divisional Staff. The Little Rock Ordinance provides a multitude of specific requirements which, when applied to certain developments or in individual instances, may create hardship. In those instances, the Board of Adjustment is empowered to grant relief. The Board hears appeals from the decision of the administrative officers in respect to the enforcement and application of the Zoning Ordinance. In addition, the Board is responsible for hearing requests for variances from the literal provisions of the Zoning Ordinance. The Board consists of five (5) members appointed by the Board of Directors to a term of three (3) years. The Board meets one (1) time each month, typically the last Monday of the month. In 2005, the Board heard a total of 119 cases. Of the 119 requests, 106 were approved. City Beautiful Commission The Zoning and Subdivision Division provides staff support and analysis for the City Beautiful Commission. This nine member commission is responsible for the establishment and maintenance of plans to ensure a high level of visual aesthetic quality. The goal of the commission is to raise the level of the community expectations for the quality of its environment. The commission also hears and decides appeals from enforcement of the various provisions of the City’s Landscape Ordinance. The Commission heard nine such appeal cases in 2005. Rezoning, Special Use Permits and Right-of-Way Abandonments Divisional Staff provides support and analysis for the Planning Commission’s review of rezoning and special use permit requests and proposed right-of-way abandonment requests. In 2005, the Planning Commission reviewed 41 rezoning requests, 7 special use permit requests and 17 proposed right-of-way abandonment requests. Preliminary and Final Plats Divisional Staff, in conjunction with the Planning Commission, administers Chapter 31 of the Code of Ordinances, the Subdivision Ordinance. Staff provides review and analysis of proposed preliminary plats and administers the approval of final plats. In 2005, Staff reviewed 46 preliminary plats and 113 final plats.

Zoning and Subdivision Division
4
Planned Zoning District Divisional Staff provides support and analysis for the Planning Commission and Board of Directors’ review of Planned Zoning District applications. The Planned Zoning District is a combined subdivision and zoning review in one process in order that all aspects of a proposed development can be reviewed and acted upon simultaneously. In 2005, 113 Planned Zoning District applications were reviewed.
Conditional Use Permits

Building Codes Division
5
The Building Codes Division issues construction related permits and provides plan review and inspection services with regard to building, plumbing, electrical and mechanical construction in the city. The primary goal of the Division is to protect the public health and safety through the administration and enforcement of these codes. Within the Building Codes Division there are six sections. The Building Inspection Section, Electrical Inspection Section, Permit Section, Plan Review Section, Plumbing and Gas Inspection Section and Mechanical Inspection Section. Building Inspection The Building Inspection Section is responsible for the inspection of all permitted commercial and residential construction jobs for code compliance through the full construction process, from foundation to the completion of construction. Inspections are also performed on dilapidated commercial structures and follow-up action is taken to have the structure repaired or removed.
Code Compliance Building
2005 2004 2003 2002 Permits Issued 5,330 5,032 4,432 4,561 Inspections 6,481 5,969 5,462 5,572 Violations 1,408 1,473 1,083 1,005 Fees $1,263750 $1,098,920 $1,034,294 $1,044,848
Plumbing 2005 2004 2003 2002 Permits Issued 4,137 3,767 3,692 3,443 Inspections 7,202 6,528 6,322 5,823 Violations 804 862 930 867 Fees $465,530 $415,008 $358,360 $307,173
Electrical 2005 2004 2003 2002 Permits Issued 3,993 3,189 2,972 2,834 Inspections 9,547 7,770 6,851 6,147 Violations 2,006 1,540 1,211 1,044 Fees $570,173 $382,012 $389,049 $315,153
Mechanical 2005 2004 2003 2002 Permits Issued 2,258 1,789 1,690 1,534 Inspections 4,179 3,825 3,460 2,997 Violations 795 636 536 501 Fees $393,981 $346,653 $347,904 $266,909

Building Codes Division
6
Inspectors in this section also answer complaints involving illegal and unpermitted building projects. This section is responsible for review of building codes and proposes any changes and additions to keep “up-to-date”. Electrical Inspection The Electrical Inspection Section is responsible for inspection of permitted projects for code compliance. This section reviews all new electrical construction as well as electrical repairs. This section also reviews electrical drawings involving commercial buildings and outdoor electrical signs. Inspectors handle complaints involving illegal and unpermitted work and check electrical contractors’ licenses and update the city electrical codes. Plumbing and Gas Inspection The Plumbing and Gas Inspection Section reviews all permitted plumbing and natural gas projects for code compliance. The City of Little Rock also has jurisdiction over such work outside the city limits (if connecting to the city water supply). Inspections include water meter, yard sprinklers, installations involving plumbing and natural gas. Inspectors in this section also handle complaints involving illegal and unpermitted projects. Inspectors review plumbing contractors’ licenses and privilege licenses. Plumbing construction drawings are reviewed for proposed commercial projects and this section also proposes changes and additions to the plumbing codes as necessary. Mechanical Inspection The Mechanical Inspection Section is responsible for inspection of permitted projects for code compliance. These inspections include all heating and air installations. Inspectors in this section also handle complaints involving illegal and unpermitted projects and check contractors for proper licensing. Mechanical construction drawings are reviewed for proposed commercial projects and this section also proposes changes and additions to the mechanical codes as necessary. Plan Review Section The Plan Review Section is responsible for the review of all proposed commercial building plans for code compliance. This review involves all phases of building from foundation to structural, electrical, plumbing and mechanical and qualifies all requirements of Wastewater, Water Works, Civil Engineering, Traffic Engineering, Fire and Landscaping code requirements. This section works closely with other city agencies as well as contractors, architects and developers. Permit Section All construction permits involving building, electrical, plumbing, and mechanical work are issued in this section as well as permits for garages and tents. Records and building plans are maintained on all jobs for which permits have been issued. The permit section also maintains all other general records of the Division.

Building Codes Division
7
Building Codes Highlights During 2005 the Building Codes Division collected over $2,600,000 in fees including permits, licenses and other miscellaneous charges and performed over 20,000 inspections. Ten major unsafe structures were demolished. All information brochures on commercial construction permitting, plumbing, mechanical, and electrical procedures were updated and made available to the public as well as two issues of the Codes Roundup. All inspection personnel attended some type of training seminar during the year and several members were nominated to policy level positions within their respective organizations. Mark Whitaker was selected to serve on several key committees with national code organizations. Jerry Spence was elected president of the International Association of Electrical Inspectors, Western Section, Arkansas Chapter. The State and City hosted the International Association of Electrical Inspectors Conference in 2005. The Division also celebrated National Building Safety and Customer Appreciation week during April. A program, which provides for an increased flow of information and communication between the Division and the Arkansas General Contractors Association and The Home Builders Association of Greater Little Rock has produced good results. The debit system for contractors has been a great success and allows contractors to obtain permits via fax or mail. This service allows the contractor the convenience of not having to come to the office to purchase permits and decreases downtime and saves money. The Division was very instrumental with regard to inspections and consultation in conjunction with the Heifer International Project grand opening in December 2005. The 2005 National Electrical Code, 2004 AR Energy Code and 2003 Int. Energy Conservation Code were adopted. The Division also participated in the Criminal Abatement Program, which targets commercial and residential properties where criminal activity is present and building life safety are issues. The Building Codes Division has had great success with the following programs and plans to upgrade and enhance them for better service.
• All inspectors are equipped with radios and cell phones for faster service. • We provide quick response to all complaints. • Five-day plan reviews insure prompt attention to commercial building applications. • Same-day review is given to residential applications. • Same-day inspections are made on all inspection requests made before 9:00 a.m.
2005 2004 2003 2002 2001 2000
Building Plans Reviewed 1368 1495 1366 1533 1536 1773 Construction B.O.A. 0 0 0 1 1 1 Electrical Exams 6 12 21 54 11 21 Franchise Permits 26 31 34 22 26 28
Building Codes Division
8
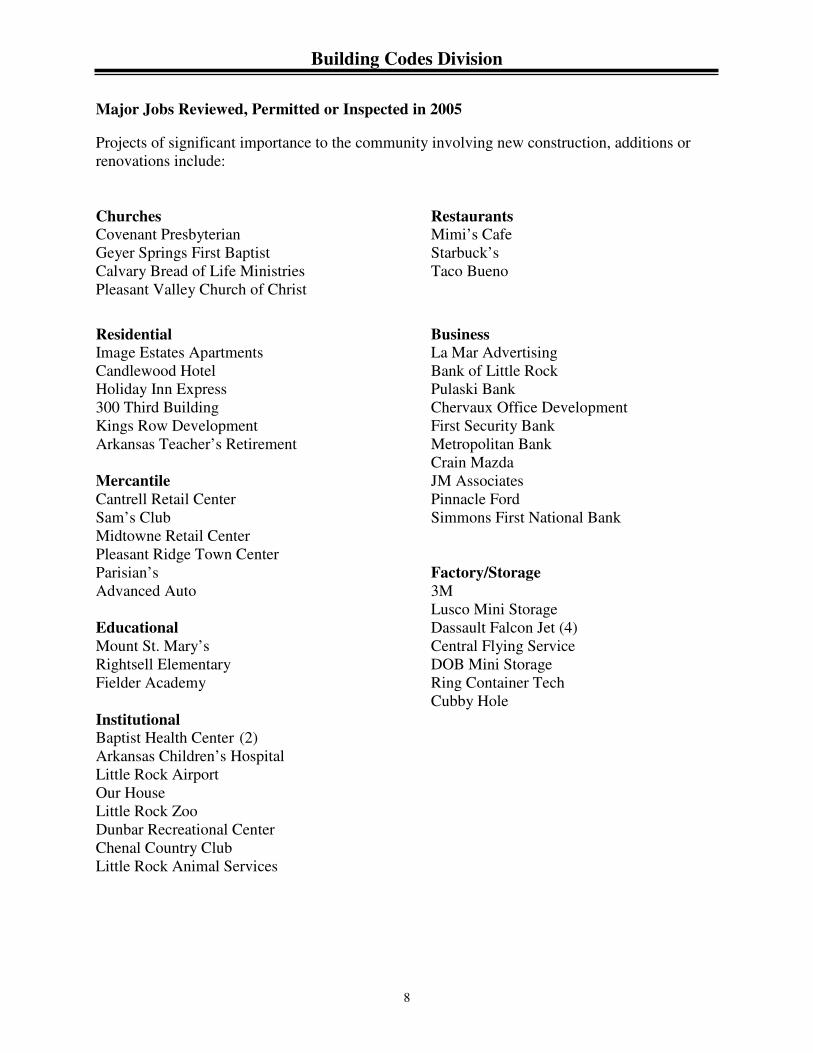
Major Jobs Reviewed, Permitted or Inspected in 2005 Projects of significant importance to the community involving new construction, additions or renovations include: Churches Restaurants Covenant Presbyterian Mimi’s Cafe Geyer Springs First Baptist Starbuck’s Calvary Bread of Life Ministries Taco Bueno Pleasant Valley Church of Christ
Residential Business Image Estates Apartments La Mar Advertising Candlewood Hotel Bank of Little Rock Holiday Inn Express Pulaski Bank 300 Third Building Chervaux Office Development Kings Row Development First Security Bank Arkansas Teacher’s Retirement Metropolitan Bank Crain Mazda Mercantile JM Associates Cantrell Retail Center Pinnacle Ford Sam’s Club Simmons First National Bank Midtowne Retail Center Pleasant Ridge Town Center Parisian’s Factory/Storage Advanced Auto 3M Lusco Mini Storage Educational Dassault Falcon Jet (4) Mount St. Mary’s Central Flying Service Rightsell Elementary DOB Mini Storage Fielder Academy Ring Container Tech Cubby Hole Institutional Baptist Health Center (2) Arkansas Children’s Hospital Little Rock Airport Our House Little Rock Zoo Dunbar Recreational Center Chenal Country Club Little Rock Animal Services

Planning Division
9
The Planning Division provides mid and long range planning as well as technical support to the City. The division prepares neighborhood plans and reviews draft amendments to the existing plans. In 2005, the Planning Division became the staff support for the Little Rock Historic Commission. This includes reviewing reclassification requests and development of staff reports for Land Use Plan amendments requested by various groups. The staff of the Planning Division responds to requests for statistics, graphics, and GIS products. This Annual Report is one example of the products produced by the division. The division monitors the Website for updates and assists with all computer needs of the department. In addition, at the request of the Board of Directors and/or the Planning Commission, the division staff may work on special studies. A few of the major work efforts from 2005 are described below. Review of Land Use Plan Issues The Planning staff reviews all rezoning (including PZD) requests for conformance with the adopted Land Use Plan and any Neighborhood Plan in effect for the area. If non-conformance with the Land Use Plan is discovered, a Plan amendment for the area is developed and processed. For all cases a written review of both the Land Use Plan and any Neighborhood Plan is prepared. In those cases where an amendment is determined to be necessary a full staff report (conditions, changes, recommendations) is generated. Planning staff reviewed 30 requests for Plan changes in 2005. Of these, the Planning Commission forwarded nine to the Board of Directors. Special Planning Efforts The Division Planners worked on several special efforts. Staff completed a Land Use review of the Highway 10 corridor from Panky west to Highway 300. Several mailings to organizations in the area as well as residents were completed, with recommending changes developed for presentation to the Little Rock Planning Commission. A second Land Use review for the Central High area was undertaken and a package of Land Use changes were presented to the Little Rock Planning Commission. Boards and Commissions Supported The Planning Division provides staff and meeting support for the Little Rock Historic Commission, Midtown Redevelopment District Advisory Board and the River Market Design Review Committee. Each of these Boards or Commissions meet on a monthly basis. The Little Rock Historic Commission has been working on the development of a new set of ‘Design Guidelines’. The guidelines will provide interested individuals the information they need to successfully complete certificate of appropriateness applications within the historic district. In 2005, the Commission reviewed 17 applications for Certificates of Appropriateness (COA). After review and in some cases with modifications the Historic Commission approved seventeen COAs within the McArthur Park Historic District. The Midtown Redevelopment Advisory Board continues to meet and discuss issues within the improvement district. They have also worked with the City Manager’s Office to ‘bring-in’ an

Planning Division
10
expert needed to help develop a process to be used in the district and with other redevelopment districts. The River Market Design Review Committee met through the year to review and discuss applications for exterior changes within the River Market Overlay District. Staff and the Committee reviewed a total of nine requests. GIS & Graphics Activities GIS continues to be the source of sketch and base maps as well as statistics for neighborhood plans and special studies. Members of the division staff represent the City on various PAgis committees dealing with maintenance and development of the regional GIS. Maintenance of data related to future land use, zoning and structure changes (addition or removal) continues. As the PAgis organization took on parcel development, the City has undertaken an effort to construct a zoning layer consistent with the new parcel coverage. GIS has become a support function of the division for both graphics and statistical reports with use of ArcMap software. The graphics section continues to maintain the Zoning Base Maps and provide graphic support for the department and other agencies. The graphics section produced brochures, sketch maps, business cards, graphics for special studies and neighborhood plans. The graphics staff also performs GIS maintenance. Neighborhood Plans The Planning Division has continued the Neighborhood Plan process with work on the updates (review) for the Downtown Neighborhoods Plan and Upper Baseline Neighborhood Plan.
Other Major Activities Staff provided assistance on the Mayor’s efforts for the 12th Street Corridor redevelopment and beautification effort with area churches sponsored by the Cultural and Diversity Commission. In addition Planning Staff is serving on committees working on a Hazard Mitigation Plan for the City and a review of the Little Maumelle Watershed protection effort.

Planning Division
11
Future Land Use Plan Amendments

12
2005
Urban Development
Report Data

Urban Development Report
13
This Urban Development Report is designed to describe and monitor growth and present a comprehensive overview of significant demographic, economic and development conditions, which exist in the City of Little Rock during the 2005 reporting period. Sources of the data are the official records of the Department of Planning and Development, MetroPlan and Arkansas Business. Building permits were used to quantify the numbers, locations and magnitude of the various residential and nonresidential developments. The data reflected by building permits is only the authorization for construction and the possibility exists that a small number of construction projects were not initiated before the end of 2005. Thirty Planning Districts have been designated for both land use and statistical purposes. The districts follow physical features and include not only the area within the corporate limits but also area beyond. For reporting purposes four sub-areas have been designated. Both the Planning Districts and sub-areas form the framework for presentation of data in this report. The preceding map indicates the area of each Planning District while the following chart provides the Planning District names and corresponding sub-area.
Planning District Sub - Area 1 River Mountain West 2 Rodney Parham West 3 West Little Rock Central 4 Height/Hillcrest Central 5 Downtown East 6 East Little Rock East 7 I-30 East 8 Central City East 9 I-630 East/Central 10 Boyle Park Central 11 I-430 West 12 65th Street West Southwest 13 65th Street East Southwest 14 Geyer Springs East Southwest 15 Geyer Springs West Southwest 16 Otter Creek Southwest 17 Crystal Valley Southwest 18 Ellis Mountain West 19 Chenal West 20 Pinnacle West 21 Burlingame Valley West 22 West Fourche West 23 Arch Street Pike East 24 College Station East 25 Port East 26 Port South East 27 Fish Creek East 28 Arch Street South East 29 Barrett West 30 Buzzard Mountain West

Urban Development Report
14
Planning Districts
Sub - Areas

Development Activity Summary
15
Population Estimate 189,220 persons 2005 population estimate
New Construction
1080 permits; up 12.1% from 949 in 2004
Single-Family Housing 967 units; up 21.3% from 797 units in 2004
$257,993 avg.; down 1.4% from $261,633 in 2004
Multi-Family Housing 300 units; down 72.7% from 1100 units in 2004
Residential Renovations/Additions
1151 permits; up 11.1% from 1036 in 2004 $33,641,683 construction dollars; up 5.7% from $31,830,790 in 2004
Demolitions
139 residential units; up 35% from 103 in 2004
Office 281,541 square feet; up 3.7% from 271,496 in 2004
$27,203,217 construction dollars; down 40% from $45,341,699 in 2004
Commercial 677,554 square feet; up 28% from 529,251 in 2004
$71,665,809 construction dollars; up 109% from $34,259,001 in 2004
Industrial 128,585 square feet; up 13.6% from 113,142 in 2004
$12,591,006 construction dollars; up 376% from $2,642,000 in 2004
Annexations Five annexations for 47.49 acres, compared to three annexations totaling 377.24 acres in 2004
Preliminary Plats
2328 residential lots; up 190 % from 803 lots in 2004 1262.5 total acres; up 103.3 % from 621.09 acres in 2004
Final Plats
113 cases; up 24.2% from 91 cases in 2004 824.69 acres; up 29.8% from 635.71 acres in 2004
Rezoning
15 cases; down 48.3 % from 29 cases in 2004 87.71 acres; down 61.3 % from 226.99 acres in 2004
PZD’s
76 cases; up 7 % from 71 cases in 2004 567.4 acres; up 23.2 % from 460.57 acres in 2004

Population Growth and Projections
16
The population change recorded by the Census has consistently been positive. During the latter part of the 1900s, annexations of already developed areas help inflate the numbers. This slowed in the 1990s to almost no population gained due to annexation. Thus the large growth shown for the 1960s, 1970s and 1980s is an over representation of the actual urban growth. Little Rock continues to experience a slow growth rate. Most of the growth has been in the west and southwest parts of the City. The east, central and southwest sections of Little Rock experienced most of the population loss. Though it should be noted that there were some areas of growth in all sections of the City. There were even small areas of loss in the high growth areas. The trend for the first decade of the twenty-first century is a growth rate, which would result in approximately 5% growth by 2010.
Little Rock Population
Year Population Annual % change
1900 38,307 - 1910 45,941 19.93% 1920 65,142 41.79% 1930 81,679 25.39% 1940 88,039 7.79% 1950 102,213 16.10% 1960 107,813 5.48% 1970 132,483 22.88% 1980 159,024 20.03% 1990 175,795 10.55% 2000 183,133 4.17% 2001 183,923 0.43% 2002 184,354 0.23% 2003 185,835 0.80% 2004 187,748 1.03% 2005 189,220 0.78%
Construction Activity
17
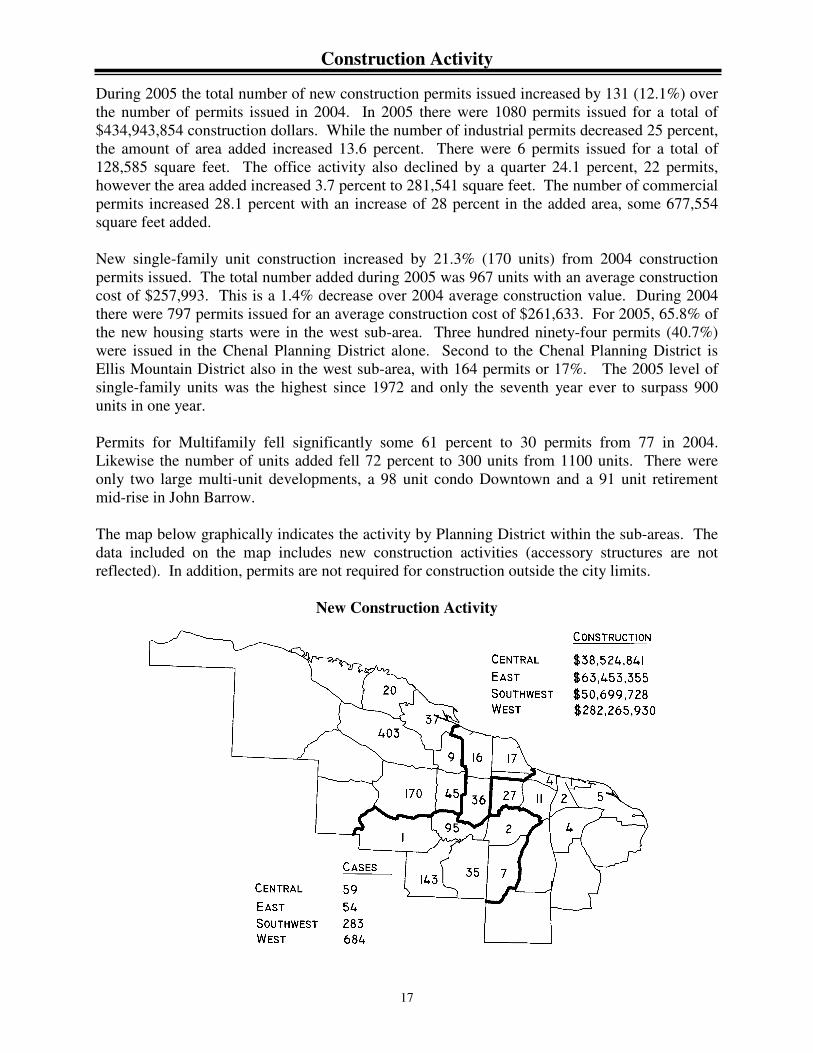
During 2005 the total number of new construction permits issued increased by 131 (12.1%) over the number of permits issued in 2004. In 2005 there were 1080 permits issued for a total of $434,943,854 construction dollars. While the number of industrial permits decreased 25 percent, the amount of area added increased 13.6 percent. There were 6 permits issued for a total of 128,585 square feet. The office activity also declined by a quarter 24.1 percent, 22 permits, however the area added increased 3.7 percent to 281,541 square feet. The number of commercial permits increased 28.1 percent with an increase of 28 percent in the added area, some 677,554 square feet added. New single-family unit construction increased by 21.3% (170 units) from 2004 construction permits issued. The total number added during 2005 was 967 units with an average construction cost of $257,993. This is a 1.4% decrease over 2004 average construction value. During 2004 there were 797 permits issued for an average construction cost of $261,633. For 2005, 65.8% of the new housing starts were in the west sub-area. Three hundred ninety-four permits (40.7%) were issued in the Chenal Planning District alone. Second to the Chenal Planning District is Ellis Mountain District also in the west sub-area, with 164 permits or 17%. The 2005 level of single-family units was the highest since 1972 and only the seventh year ever to surpass 900 units in one year. Permits for Multifamily fell significantly some 61 percent to 30 permits from 77 in 2004. Likewise the number of units added fell 72 percent to 300 units from 1100 units. There were only two large multi-unit developments, a 98 unit condo Downtown and a 91 unit retirement mid-rise in John Barrow. The map below graphically indicates the activity by Planning District within the sub-areas. The data included on the map includes new construction activities (accessory structures are not reflected). In addition, permits are not required for construction outside the city limits.
New Construction Activity

Construction Activity
18
Residential Construction Activity Planning Single-Family Multi-Family Total District Permits Avg. Cost Permits Units Units
1 21 $278,495 1 3 24 2 1 $95,000 0 0 1 3 10 $481,000 4 10 20 4 13 $464,231 1 3 16 5 2 $222,315 1 98 100 6 0 $0 0 0 0 7 0 $0 0 0 0 8 9 $123,278 0 0 9 9 14 $74,354 9 61 75
10 26 $93,078 4 97 123 11 39 $120,451 1 2 41 12 87 $138,795 0 0 87 13 1 $75,000 0 0 1 14 1 $106,650 0 0 1 15 34 $113,817 0 0 34 16 129 $150,054 4 16 145 17 0 $0 0 0 0 18 164 $224,739 0 0 164
19.1 273 $401,973 0 0 273 19.2 121 $281,012 5 10 131 20 17 $380,471 0 0 17 21 0 $0 0 0 0 22 0 $0 0 0 0 23 0 $0 0 0 0 24 4 $87,875 0 0 4 25 1 $76,500 0 0 1 26 0 $0 0 0 0 967 $257,993 30 300 1267

Construction Activity
19
Non-Residential Construction Activity
Planning Commercial Office Industrial PQP District Permits Sq. ft. Permits Sq. ft. Permits Sq. Ft. Permits
1 13 371,373 2 7114 0 0 0 2 3 47,195 4 28,068 0 0 1 3 0 0 1 321 0 0 1 4 2 7489 1 1729 0 0 1 5 0 0 0 0 0 0 0 6 0 0 0 0 0 0 1 7 0 0 1 720 1 12,000 0 8 0 0 1 114,250 0 0 0 9 1 3200 0 0 1 7680 1
10 2 11,200 1 11,161 0 0 3 11 2 14,670 1 30,210 0 0 2 12 6 122,253 1 672 0 0 1 13 0 0 0 0 0 0 1 14 4 13,200 0 0 0 0 2 15 1 2557 0 0 0 0 0 16 5 41,548 3 24,608 0 0 1 17 0 0 1 6830 0 0 0 18 1 5856 1 4078 0 0 4 19 1 37,013 2 25,812 0 0 1 20 0 0 2 25,968 0 0 0 21 0 0 0 0 0 0 0 22 0 0 0 0 0 0 0 23 0 0 0 0 0 0 0 24 0 0 0 0 0 0 0 25 0 0 0 0 4 108,905 0 26 0 0 0 0 0 0 0 41 677,554 22 281,541 6 128,585 20

Residential Activity
20
The number of single-family units permitted reached its highest level since 1972 with a 170 unit increase during 2005. There were 967 units permitted for a 21.3% increase in the number of single-family units added over 2004. Single-family unit construction continued its robust growth from 2004. This level (over 900 units) has only been achieved in Little Rock seven previous times and not since 1972 with 980 units. As in previous years, the majority of the new units added are in the west sub-area. The Chenal Planning District, generally south of Hinson Road/Taylor Loop Road, west of Napa Valley Drive/Mara Lynn Road and north of Chenal Parkway continues to have a majority of the single-family unit permits issued. For 2005, 40.7% of the permits issued were located in this area. Of the permits issued in the Chenal Planning District, 273 units were located west of Rahling Road (over 28%), and 121 units were permitted for the area east of Rahling Road. The next most active planning district is the Ellis Mountain Planning District (16.9 percent), an area bounded by Chenal Parkway to the north, Bowman Road to the east, the city limits to the west and Colonel Glenn Road to the south. The Woodlands Edge Subdivision accounts for almost all the activity in the planning district. This subdivision is south of Panther Creek (south of Kanis Road) and west of Bowman Road. Approximately eight percent of the new single-family construction permits were issued in the central and east sub-areas. The number of permits issued during 2005 increased 41 percent from 56 to 79 units. Most of this increase was in the Boyle Park and I-620 Planning Districts with ‘in-fill’ homes. New multi-family unit construction returned to a rate of a few hundred units, similar to most years over the last decade. The number of units permitted declined during 2005 from 1100 units in 2004 to 300 units. These 300 units were the result of 30 permits. The dollar value of the permits remained high increasing 11 percent, while the number of units fell over 72 % or 800 units. Most of the permits were in two multifamily developments, a condo downtown and a retirement mid-rise midtown.
Residential Activity Single Family Multi-family
Year Permit Cost Avg. Cost Year Permit Units Cost 1995 477 $77,990,869 $163,503 1995 7 240 $7,842,000 1996 482 $78,089,899 $162,012 1996 7 191 $7,031,180 1997 448 $71,510,751 $159,622 1997 11 1240 $41,462,210 1998 495 $89,757,916 $181,329 1998 6 790 $19,635,381 1999 555 $102,062,168 $183,896 1999 44 537 $20,309,000 2000 468 $92,378,933 $197,391 2000 56 236 $12,084,472 2001 483 $105,179,005 $217,762 2001 36 95 $13,081,744 2002 581 $136,231,640 $234,075 2002 26 238 $12,158,550 2003 729 $176,509,112 $242,125 2003 25 436 $16,841,397 2004 797 $208,521,990 $261,633 2004 77 1100 $49,089,845 2005 967 $249,478,968 $257,993 2005 30 300 $54,908,813

Residential Activity
21
Single Family Construction
Single Family Units Sub-area East Central S-west West
2005 Permits 30 49 252 636 2004 Permits 15 41 194 547 2003 Permits 16 41 209 463 2002 Permits 24 32 156 369 2001 Permits 13 31 89 350 2000 Permits 13 31 78 346
East Central S-west West
2005 % 3.1% 5.1% 26% 65.8% 2004 % 1.9% 5.1% 24.3% 68.6% 2003 % 2.2% 5.6% 28.7% 63.5% 2002 % 4.1% 5.5% 26.8% 63.6% 2001 % 2.7% 6.4% 18.4% 72.5% 2000 % 2.8% 6.6% 16.7% 73.9%

Housing Construction Values
22
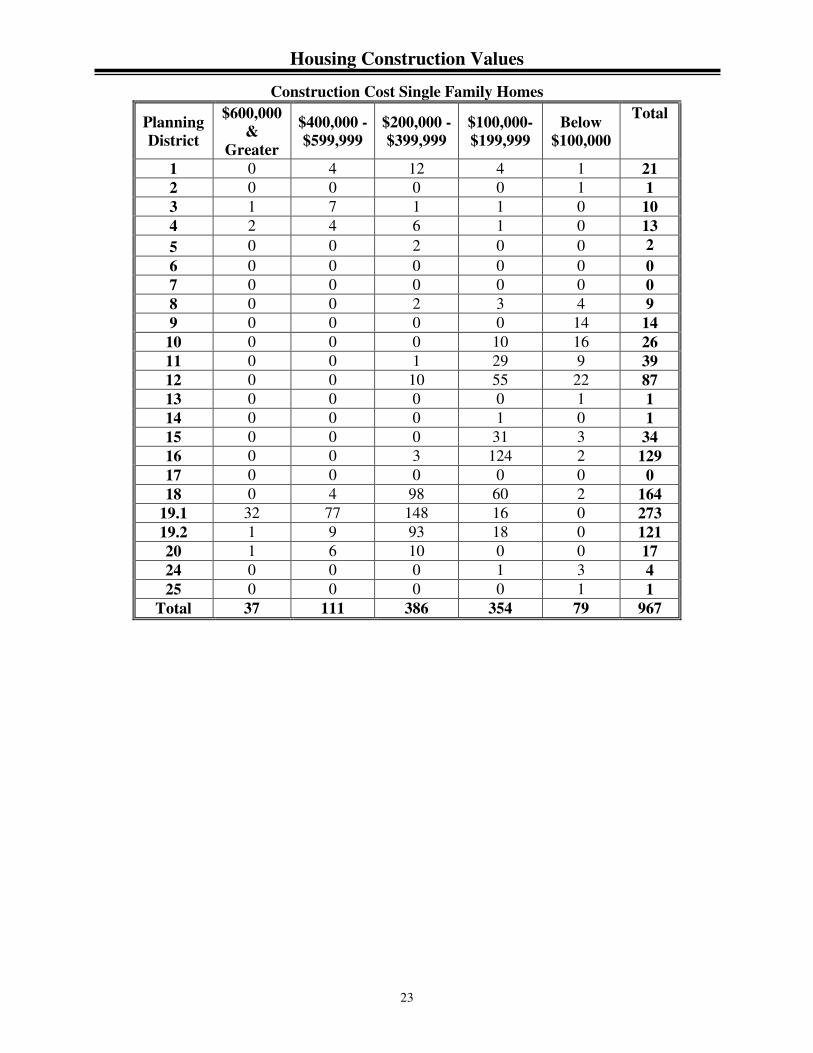
The average construction cost of a new single-family home decreased by 1.4% or $3640 from that in 2004. The average unit value in 2005 was $257,993 compared with $261,633 in 2004. Interest rates while gradually increasing continue to be relatively low, which is making housing more affordable in real terms. Housing values are represented below in five distribution categories: less than $100,000, less than $200,000, less than $400,000, less than $600,000 and $600,000 and above. There were 79 units constructed below $100,000, 354 units constructed in the range of $100,000 to $199,999, 386 units constructed in the range of $200,000 to $399,999, 111 units constructed in the range of $400,000 to $599,999 and 37 units above $600,000. During 2005, 55% of the single-family units constructed cost $200,000 or more. The majority of these homes (92.9% or 496 homes) were built in the west sub-area of the city. The west sub-area has construction cost ranging from $70,000 to $2,100,000. The central sub-area, next highest, had a significantly lower construction cost range from $62,500 to $2,000,000. The east sub-area construction cost ranges from $60,000 to $500,000, and the southwest sub-area construction cost range from $71,000 to $257,920. Of the total dollars expended on construction of single-family units the west sub-area accounted for 79.2% ($197,707,377) of the construction dollars and the southwest sub-area accounted for 14.2% ($35,554,490) of all construction dollars expended. The central sub-area, 5.1% ($12,765,021) and the east sub-area, 1.4% ($3,452,080) completes the construction dollars expended for single-family construction for 2005. Of the single-family units added citywide, 40% were valued between $200,000 and $400,000, 26.3% were valued between $100,000 and $200,000, 11.5% were valued between $400,000 to $600,000, 3.8% were valued above $600,000 and 8.2% were valued below $100,000. High-end construction for the most part is taking place in the Chenal Valley, west part of Chenal District, Pinnacle, West Little Rock and Heights Hillcrest Planning Districts. Of the units valued over $400,000, 87.8% or 130 units, were permitted in one of these districts. While in these same districts, 0% or 0 units of the less than $100,000 value units can be found. While the average construction value fell 1.2 percent for the City, each of the sub-areas experienced increases in average value. The increases were less than inflation, with the west and east sub-areas increasing at less than 0.3 percent, and the southwest sub-area increasing 0.08%. Only the central sub-area had a health 9.6 percent increase in value or $23,315. The actual dollar increases for the west and east sub-areas were $786 and $378 respectively. The southwest increase was a hundred dollars.
Sub-area 1999 2000 2001 2002 2003 2004 2005 West $203,664 $216,225 $243,844 $285,620 $301,125 $310,075 $310,861 Central $278,351 $211,875 $266,315 $265,331 $185,713 $242,623 $265,938 Southwest $107,852 $107,394 $121,220 $130,317 $134,121 $140,425 $140,532 East $73,606 $99,405 $80,352 $83,953 $90,159 $114,691 $115,069
Housing Construction Values
23
Construction Cost Single Family Homes
Planning District
$600,000 &
Greater
$400,000 - $599,999
$200,000 - $399,999
$100,000-$199,999
Below $100,000
Total
1 0 4 12 4 1 21 2 0 0 0 0 1 1 3 1 7 1 1 0 10 4 2 4 6 1 0 13 5 0 0 2 0 0 2 6 0 0 0 0 0 0 7 0 0 0 0 0 0 8 0 0 2 3 4 9 9 0 0 0 0 14 14
10 0 0 0 10 16 26 11 0 0 1 29 9 39 12 0 0 10 55 22 87 13 0 0 0 0 1 1 14 0 0 0 1 0 1 15 0 0 0 31 3 34 16 0 0 3 124 2 129 17 0 0 0 0 0 0 18 0 4 98 60 2 164
19.1 32 77 148 16 0 273 19.2 1 9 93 18 0 121 20 1 6 10 0 0 17 24 0 0 0 1 3 4 25 0 0 0 0 1 1
Total 37 111 386 354 79 967

Affordable Housing
24
When determining the ‘affordability’ of new housing, land cost must be added to the figures provided in this report. All values represented in this report are construction costs only. The National Association of Home Builders, (NAHB) estimates the cost of land to be about twenty-five percent of the final cost of construction. The HUD Home Program Rules for Little Rock set a maximum sales price of $160,128. It should be noted that the City of Little Rock has an additional requirement that the monthly payment for the home be not more than thirty percent of the household income. Based on NAHB and the City (HUD) assumptions, a unit reported here as $120,096 would be considered the cap for new construction of a unit that is considered ‘affordable’ housing. Based on this information 15.9% or 154 units constructed during 2005 are potential ‘affordable’. This is an increase from 2004 in both the number of units, an increase in 48, and the percentage of total number of units, increase of 2.6 percentage points. A higher number and percentage of Little Rock’s new housing has been within the ‘affordable’ range in each of the last several years. It should be noted that some in the housing community feel that new housing is built at the upper end and older existing housing stock provides the ‘affordable’ units for more moderate-income households.
Affordable Housing
Year % units below
Affordable value
# units below
Total Units
2002 0.5% $54,000 3 581 2003 1.4% $66,000 9 729 2004 13.3% $116,200 106 797 2005 15.9% $120,096 154 967

Residential Renovations/Additions
25
Reinvestment in Little Rock neighborhoods can be illustrated by the amount of renovation and addition activity within the neighborhoods. During 2005 reinvestment totaled almost of $27.1 million dollars. The east sub-area had the greatest number of permitted projects issued in 2005 with 374 (37.7% of all the projects for 2005). The central and east sub-areas accounted for 69.5% of the permits were issued. With approximately $18.7 million of the $27.1 million dollars (or 69.1%) spent for reinvestment occurring in these sub-areas, they are the dominant part of the reinvestment market. It is worth noting that 52% of all reinvestment occurred in the central sub-area. The east sub-area accounts for 46.7% of the permits for renovations and 38.6% of the dollars were spent. While it is a positive sign to see this reinvestment, it can be only to ‘bring the housing up to code’. Renovations are both making needed repairs and upgrading the structure. It does not include added living space. The second highest level of permits was in the central sub-area with 27.1%, however this sub-area had the greatest number of dollars spent (38.6 % or $5.8 million). The southwest and west sub-areas permit levels were 12.7% and 13.6% respectively. The west sub-area accounted for over a quarter of the dollars ($3.9 million), almost as much as in the east sub-area with $4 million. The renovation figures also include single-family homes re-permitted. That is, a home which gets a new (second) building permit before the structure is built. In 2004, there were less than a dozen of these. In the Downtown Planning District permits to ‘finish-out’ condominiums are included with the multifamily renovation figure for the third year. Multi-Family Renovations The area, which experienced the largest number of permitted projects and dollars spent was the west sub-area, 45% of the permits (72) and 64% of the dollars ($4.2 million). Just under two million dollars was spent in the east sub-area, $1.7 million with 28.8% of the permits. The central sub-area had the least permits 10 percent (16) with a value of $463,080. The least number of dollars was spent in the southwest sub-area, $137,385 with 16 permits. Single-Family Additions Single-family additions were concentrated in the central sub-area. Citywide 241 permits were issued for a total of $11,979,656. The central sub-area accounted for 68.8% ($8,246,109) of the dollars permitted. The majority of the central sub-area permits and dollars were expended in the Heights/Hillcrest Planning District (67 permits and $6,232,252). In the west sub-area 75 permits were issued for $2,639,388. The Chenal Districts accounted for 25 with the River Mountain and Rodney Parham Districts accounting for 18 and 17 respectively. The values were $136,976 in the Chenal District and $1,128,276 and $461,046 respectively for the River Mountain and Rodney Parham Districts. Overall the average value of permits issued for additions decreased by 20% or $12,315.

Residential Renovations/Additions
26
*123 Condos permitted with $0 value
Planning Single-Family Single-Family Multi-Family District Additions Renovations Renovations
Permits Avg. Value Permits Avg. Value Permits Avg. Value 1 18 $62,682 25 $35,895 2 $67,491 2 17 $27,120 23 $16,104 18 $40,450 3 37 $48,692 56 $20,676 2 $12,750 4 67 $93,019 103 $38,032 5 $27,100 5 0 $0 4 $12,875 19 $58,641 6 0 $0 1 $1,500 0 $0 7 1 $2,000 6 $12,583 0 $0 8 10 $22,250 143 $123,216 20 $17,395 9 10 $31,157 188 $9,682 12 $25,761
10 8 $22,698 44 $9,849 4 $14,750 11 7 $8,841 23 $11,228 51 $63,908 12 6 $32,308 18 $9,649 0 $0 13 3 $6,400 21 $12,608 0 $0 14 4 $17,000 19 $12,522 3 $16,667 15 10 $13,384 35 $14,377 23 $3,799 16 7 $13,873 2 $47,815 0 $0 17 0 $0 0 $0 0 $0 18 5 $12,300 4 $12,056 0 $0
19.1 10 $41,540 11 $117,718 0 $0 19.2 17 $18,916 16 $65,519 1 $7,000 20 1 $185,000 0 $0 0 $0 21 0 $0 0 $0 0 $0 22 0 $0 0 $0 0 $0 23 0 $0 0 $0 0 $0 24 2 $33,230 5 $9,914 0 $0 25 1 $15,000 3 $14,167 0 $0 241 $49,017 750 $20,191 160 $39,751

Residential Renovations/Additions
27
Single Family Renovations
Single Family Additions
Demolition Activity
28
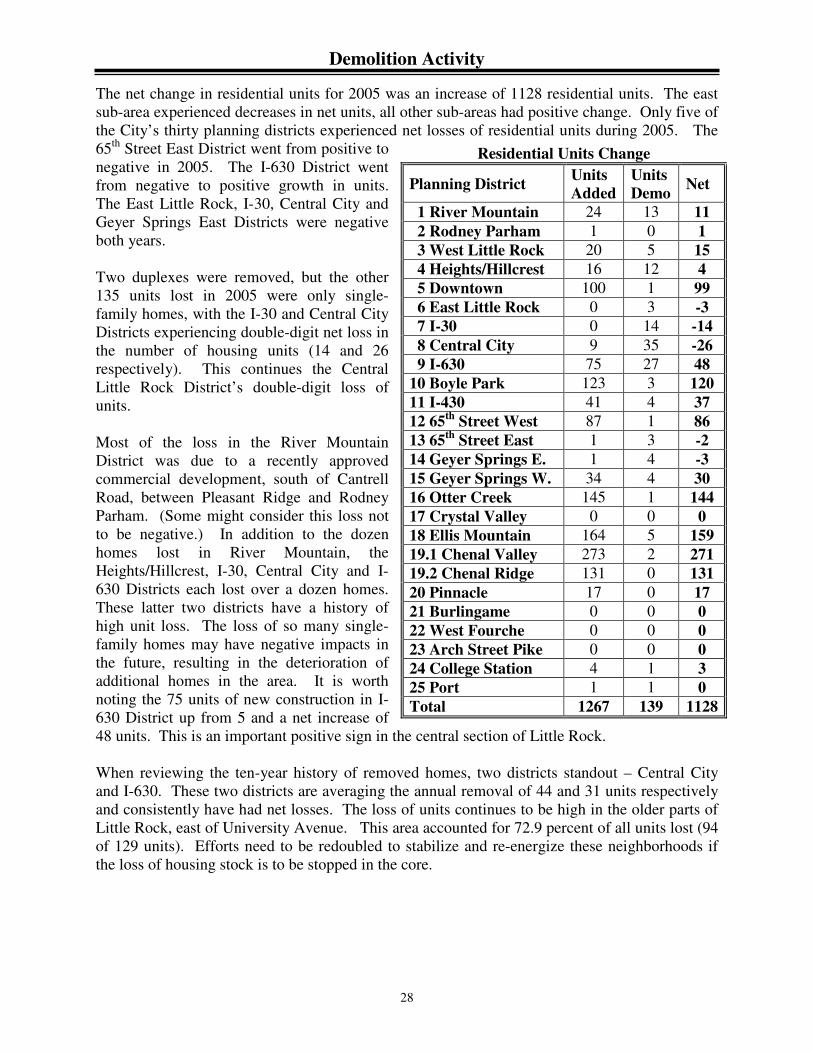
The net change in residential units for 2005 was an increase of 1128 residential units. The east sub-area experienced decreases in net units, all other sub-areas had positive change. Only five of the City’s thirty planning districts experienced net losses of residential units during 2005. The 65th Street East District went from positive to negative in 2005. The I-630 District went from negative to positive growth in units. The East Little Rock, I-30, Central City and Geyer Springs East Districts were negative both years. Two duplexes were removed, but the other 135 units lost in 2005 were only single-family homes, with the I-30 and Central City Districts experiencing double-digit net loss in the number of housing units (14 and 26 respectively). This continues the Central Little Rock District’s double-digit loss of units. Most of the loss in the River Mountain District was due to a recently approved commercial development, south of Cantrell Road, between Pleasant Ridge and Rodney Parham. (Some might consider this loss not to be negative.) In addition to the dozen homes lost in River Mountain, the Heights/Hillcrest, I-30, Central City and I-630 Districts each lost over a dozen homes. These latter two districts have a history of high unit loss. The loss of so many single-family homes may have negative impacts in the future, resulting in the deterioration of additional homes in the area. It is worth noting the 75 units of new construction in I-630 District up from 5 and a net increase of 48 units. This is an important positive sign in the central section of Little Rock. When reviewing the ten-year history of removed homes, two districts standout – Central City and I-630. These two districts are averaging the annual removal of 44 and 31 units respectively and consistently have had net losses. The loss of units continues to be high in the older parts of Little Rock, east of University Avenue. This area accounted for 72.9 percent of all units lost (94 of 129 units). Efforts need to be redoubled to stabilize and re-energize these neighborhoods if the loss of housing stock is to be stopped in the core.
Residential Units Change
Planning District Units Added
Units Demo Net
1 River Mountain 24 13 11 2 Rodney Parham 1 0 1 3 West Little Rock 20 5 15 4 Heights/Hillcrest 16 12 4 5 Downtown 100 1 99 6 East Little Rock 0 3 -3 7 I-30 0 14 -14 8 Central City 9 35 -26 9 I-630 75 27 48 10 Boyle Park 123 3 120 11 I-430 41 4 37 12 65th Street West 87 1 86 13 65th Street East 1 3 -2 14 Geyer Springs E. 1 4 -3 15 Geyer Springs W. 34 4 30 16 Otter Creek 145 1 144 17 Crystal Valley 0 0 0 18 Ellis Mountain 164 5 159 19.1 Chenal Valley 273 2 271 19.2 Chenal Ridge 131 0 131 20 Pinnacle 17 0 17 21 Burlingame 0 0 0 22 West Fourche 0 0 0 23 Arch Street Pike 0 0 0 24 College Station 4 1 3 25 Port 1 1 0 Total 1267 139 1128

Demolition Activity
29
Single-Family Units Removed
Single Family Unit Change
Sub-Area Units Added
Units Demo Net
West 636 24 612 Central 49 20 29 Southwest 252 11 241 East 30 80 -50
Plan
ning
D
istr
ict
1995
1996
1997
1998
1999
2000
2001
2002
2003
2004
2005
Tot
al
1 1 1 0 2 1 2 1 2 0 3 13 26 2 0 0 3 0 1 0 0 0 0 1 0 5 3 3 0 3 1 2 1 0 0 0 4 5 19 4 2 4 12 8 11 10 13 6 20 12 12 110 5 2 4 3 7 20 5 0 1 1 2 1 46 6 7 14 5 5 3 25 21 8 3 8 3 102 7 8 6 6 5 3 17 1 3 0 3 14 66 8 52 49 38 34 62 61 27 33 32 23 33 444 9 27 31 46 28 24 30 29 23 27 23 27 315
10 5 5 1 2 5 8 5 3 3 6 3 46 11 0 8 1 1 0 2 1 2 2 1 4 22 12 4 2 0 0 3 0 3 1 1 2 1 17 13 0 1 2 2 1 2 0 0 0 1 3 12 14 3 2 2 1 1 10 3 2 0 4 2 30 15 11 1 3 1 3 0 2 3 2 4 4 34 16 2 2 1 0 1 0 1 4 1 1 1 14 17 0 0 0 0 0 0 0 0 0 0 0 0 18 1 0 1 0 0 0 0 1 1 2 5 11 19 3 0 2 1 0 2 0 0 0 3 2 13 22 0 0 0 0 0 0 0 0 0 0 0 0 23 0 0 0 1 0 0 0 0 0 0 0 1 24 1 1 2 0 0 1 2 1 2 0 1 11 25 0 1 3 2 1 2 0 0 1 0 1 11
Total 132 132 134 101 142 178 109 93 96 103 135 1349

Office Activity
30
During 2005, the square footage of new office space added increased by 3.7% from 2004. The total square footage permitted in 2005 was 281,541. The number of permits issued decreased 24.1% (29 permits in 2004, 22 permits in 2005). In 2005, the total construction cost ($27,203,217) a decrease of 40%. This is a more typical level for new office construction in Little Rock. The west sub-area accounted for most of office area added with 128,080 square feet or 45.5 percent. The west sub-area had the greatest number of permits with 13 (81.8%) and seconded highest value $10497244. The other sub-areas had two to four permits each. The east sub-area had by far the next highest added area (40.8% of the area added in 2005) and the highest value added with 45.6% of the office dollars for new office space spent in the sub-area. The central and southwest sub-areas added 13,211 square feet and 25,280 square feet respectively. The value of new office space was just over $3 million spent in the southwest and one million in the central sub-area. Only two buildings were permitted with over 25,000 square feet. The largest, a new office ‘medical arts’ building for Arkansas Children’s Hospital, has a total of 114,250 SF or 40 percent of all the added space. The second largest was a building was a new ‘shell’ office structure for offices on Autumn Road just north of Kanis Road.
Building Permits – Office Year Permits Sq. Ft. Cost 1992 6 249,216 $12,660,000 1993 6 158,206 $8,327,700 1994 12 594,340 $30,625,838 1995 14 286,923 $10,576,200 1996 15 1,204,450 $37,458,666 1997 15 903,984 $10,906,990 1998 29 454,250 $29,764,837 1999 26 371,382 $21,483,887 2000 24 1,710,683 $116,819,784 2001 20 399,011 $22,173,454 2002 11 99,759 $9,229,585 2003 22 384,965 $35,711,284 2004 29 271,496 $45,341,699 2005 22 281,541 $27,203,217
Office Projects Permitted in excess of 25,000 square feet Project Location Sub-area Sq. Ft.
Ark. Children’s Hospital 1900 Maryland Avenue east 114,250 ‘shell’ office building 1100 Autumn Road west 30,210

Office Activity
31
New Office Activity
New Office Activity

Office Activity
32
Vacancy Rates are based on 2005 data furnished by Arkansas Business – 2005 Guide to Central Arkansas Commercial Real Estate. It is important to note that the occupancy rates should not be used as a direct comparison from year to year and comparisons must remain general. The survey is a self-selecting non-verified questionnaire. This information is supplied to give an overview of the occupancy rates within the City. The 2005 Lease Guide includes listings on 218 office properties within Little Rock. This is a decrease of eighteen from last years report. Arkansas Business made no effort to validate the survey responses. For more information contact Gwen Mortiz, Editor-In-Chief – Arkansas Business at 501-372-1443. Arkansas Business found that the metropolitan occupancy rate fell slightly in 2005, declining from 83.2% to 83.1%. After improving 1.1 percentage points in the occupancy rate for the region, this returns to the 2003 level. The annualized occupancy rates for the Little Rock sectors (shown below) have experienced varying changes.
The occupancy rate for the central sub-area remained the same 88.6 to 88.7 percent, though the area reporting fell 600,000 square feet or 25 percent. The east sub-area showed a two percentage point increase to 80.4%, with slightly more area, 80,000 square feet or 1.5%. this sub-area remains the dominate force in the market. The west sub-area reported slightly less area, two percent or 80,000 square feet, with an occupancy rate fall of over three percentage points to 83.7%. There was a 10% drop in the area reporting for the southwest sub-area and a large occupancy rate drop to 78.5%. The central and west sub-areas continue to have occupancy rates at or above the regional rates. The east sub-area rate though below the regional, improved relative to that rate. A few new office projects came on-line in 2005 with several more to be completed over the next year or two. Most of these new office buildings are in the west or east (near Downtown) sub-areas. Some of this new construction has been current lessees building their own building, which resulted in vacant space in existing buildings. At the same time the new building often has additional space, the owner hopes to lease to help increase their income.
Office Market
Sub-area Total
Leasable Space
Average Occupancy
Rate East 5,165,586 80.4% Central 1,689,007 88.7% Southwest 451,817 78.5% West 3,354,401 83.7%

Commercial Activity
33
The total of new commercial construction added in 2005 amounted to 677,554 square feet of commercial space. This represents an increase of 28% in square footage added from that in 2004. Construction values more than doubled from 2004. In 2004, $34,259,001 construction dollars were permitted compared to $71,665,809 in 2005. The number of projects permitted increased 40.6% from that in 2004 (45 projects versus 32 projects in 2004). These figures indicate an overall increase in 2005, not only more commercial projects but larger in size and significantly higher in construction value. There was one permit over 100,000 square feet – Parisians at 120,192. However three other permits are part of this same development on Cantrell at Pleasant Ridge, for a total of 206, 588 square feet of retail space. Four of the remaining permits (over 20,000) for a total of 116,105 square feet are for new retail centers (shell space). Three of these four are in the west sub-area near the Pinnacle Valley-Cantrell Road intersection. Of the remaining four large projects, three are motels. Two are at the Colonel Glenn Road – I-430 interchange and the other is on Markham at I-430. The final large project is a ford dealership, which is moving from Markham and Shackleford Drive to Chenal Parkway and Wellington Hills Road.
Building Permits – Commercial Year Permits Sq. Ft. Cost 1994 56 582,508 $24,223,325 1995 50 744,336 $25,061,532 1996 53 3,321,000 $68,384,102 1997 38 2,100,340 $32,916,260 1998 29 419,669 $21,048,399 1999 26 348,112 $12,695,827 2000 20 315,873 $15,983,521 2001 22 336,692 $17,434,611 2002 20 231,895 $17,981,631 2003 26 962,519 $35,555,179 2004 32 529,251 $34,259,001 2005 45 677,554 $71,665,809
Commercial Projects Permitted in excess of 20,000 square feet Project Location Sub-area Sq. Ft.
Parisians 11525 Cantrell Road west 120,192 Holiday Inn Express 4900 Talley Road southwest 52,038 Candlewood Hotel 10520 W. Markham west 46,408 Value Place (motel) 21 Remington Drive southwest 42,690 retail ‘shell building’ 11415 Cantrell Road west 39,400 W J Smith Motors 15400 Chenal Parkway west 37,013 Dennis properties 11521 Stagecoach Road southwest 35,688 retail ‘shell building’ 14300 Cantrell Road west 30,000 retail ‘shell building’ 11415 Cantrell Road west 26,171 Pinnacle Creek 14810 Cantrell Road west 25,663 Pinnacle Station 14524 Cantrell Road west 24,754 The Fresh Market 11415 Cantrell Road west 20,825

Commercial Activity
34
New Commercial Activity
New Commercial Activity

Commercial Vacancy Rate
35
The occupancy rate information provided is based on 2005 data furnished by Arkansas Business Lease Guide 2005. It is important to note that the occupancy rates should not be used as a direct comparison from year to year and comparisons should remain general. The information is provided to give an overview of the occupancy rates within the City. The survey is a self-selecting survey, i.e. only those who respond are counted and there is no effort to validate the responses. The regional occupancy rate improved to 88.5% in 2005 from 85.5% in 2004. For more information contact Gwen Mortiz, Editor-In-Chief - Arkansas Business at 501-372-1443.
The southwest sub-area had a major increase in square feet reporting, with a health occupancy rate of 84.7% rather than 57.8%. Together this is a very positive improvement for the sub-area. In addition the southwest sub-area had the highest occupancy rate. The east sub-area reported less area (only three-quarters) with an occupancy rate falling four percentage points. The east sub-area had the worst occupancy rate. The central sub-area reported slightly less area (3.7%) with a one percentage point decrease in occupancy. The central sub-area basically had a no change condition with rates just under 80%. The west sub-area reported more that 25 percent more area in 2005. However the occupancy rate fell six percentage points to 81.6%. The east sub-area continues to be weak with 74 to 78 percent occupancy rates. With rates only in the low eighty percentile for the other sub-areas. The central and west sub-areas continue to have most of the retail – approximately 82.4 percent. Therefore, the changes in these two sub-areas will guide the numbers for the City as a whole. The most interesting change reported by this year's figures is the vast improvement in the southwest sub-area while significantly increasing the area reported. The east sub-area appears to be weakening after several years of increases.
Commercial Market
Sub-area Total
Leasable Space
Average Occupancy
Rate East 730,284 74.3% Central 2,082,469 78.6% Southwest 450,324 84.7% West 3,441,679 81.6%

Industrial Activity
36
A total of 128,585 square feet of industrial projects was permitted during 2005 in the city. This represents a 13.6% increase over the square feet permitted during 2004. The total number of projects decreased by two projects from 2004 levels. The value of new construction had a more than three-fold increase from $2,642,000 in 2004 to $12,591,006 in 2005. While the number of projects remained at a moderate level, the square footage added remained low, less than 140,000 square feet. This is in large part due to the fact that the industrial structures added in 2005 were generally accessory uses in larger developments. During 2005, the east sub-area permitted all of the industrial projects. Four of the six permits were in the Port District near either the National Airport or the Little Rock River Port. Three of the six and the two largest were at the airport. These were a hanger for Central Flying Service and two facilities for Dassault Falcon Jet.
Building Permits – Industrial Year Permits Sq. Ft. Cost 1994 6 91,288 $2,042,624 1995 4 108,750 $2,511,400 1996 3 43,250 $2,221,000 1997 7 513,346 $6,968,001 1998 13 308,464 $26,782,784 1999 18 395,022 $7,622,214 2000 19 382,138 $8,714,609 2001 7 87,502 $1,482,000 2002 9 150,235 $6,353,680 2003 6 138,255 $10,650,090 2004 8 113,142 $2,642,000 2005 6 128,585 $12,591,006
Industrial Projects Permitted in excess of 25,000 square feet Project Location Sub-area Sq. Ft.
Dassault Falcon Jet 3801 East 10th Street east 52,645 Central Flying Service 2301 Crisp east 45,000

Industrial Activity
37
New Industrial Activity
New Industrial Activity

Warehouse Vacancy Rate
38
Due to the nature of industrial/warehouse properties, some fully occupied properties are often not reported. The vacancy rate may trend high as a result of this characteristic. In the 2005 Arkansas Business Lease Guide, the amount of space reported is similar for all sub-areas except the central sub-area. Occupancy rates declined for all sub-areas. As in pervious years construction of new structures really does not relate to the changes reported here.
The only sub-area to report less area in 2005 was the southwest sub-area. This reduction was a five percent reduction in reporting area with approximately a 1.5 percentage point reduction in occupancy. The central sub-area had the largest increase in reporting area, almost three-fold. The occupancy rate for the sub-area fell 2.5 percentage points though still the highest. The east and southwest sub-areas are the locations of the largest industrial parks in Little Rock. And they continue to report the worst occupancy rates, with the 2005 rates worse than those reported in 2004 for each of these sub-areas. Most new construction of industrial or warehouse structures is by a particular company for their needs. It is important to note that the occupancy rates should not be used as a direct comparison from year to year and comparisons must remain general. This information is supplied to give an overview of the occupancy rates within the City. The 2005 Lease Guide includes listings on 59 warehouse properties up from 47 in the 2004 guide. Arkansas Business made no effort to validate the survey responses. For more information contact Gwen Moritz, Editor-In-Chief- Arkansas Business at (501)-372-1443.
Warehouse Market
Sub-area Total
Leasable Space
Average Occupancy
Rate East 1,033,394 56.7% Central 938,554 82.8% Southwest 1,911,126 62% West 400,305 79.4%

Annexation Activity
39
The City accepted five annexations, totaling 47.49 acres in 2005. Two of the annexations were just over 19 acres in size. The Diamond Annexation is two vacant tracts along Crystal Valley Road, just north of Stagecoach Road in the Crystal Valley Planning District. Some 78 single-family home sites have been proposed for this land. The second is the Meuwly Annexation along Highway 10 in the Pinnacle Planning District. This partially closed an existing ‘island’. The annexation area is not developed. The applicant proposes to expand the private school just east of the site on the land. The Rock Haven Annexation includes just less than 6 acres. It is in the Ellis Mountain Planning District, located west of Kirby Road just north of Kanis Road. The property is currently undeveloped. Planning Commission has approved a proposal to construct 22 zero lot-line homes on this land. The remaining two annexations were between one and two acres in size. The Little Rock Wastewater Utility Pump Station is a developed piece of land used by the Wastewater Utility to pump sewage for treatment. The Hughes Annexation is a single home annexed to provide sewer service, when their existing septic system failed. This home is part of an ‘island’, thus reducing the size of one of the four ‘islands’ currently within the City. With the acceptance of these areas, the current city limits of Little Rock expanded to 119.55 square miles. This is an increase of approximately 0.06% from 2004, 1.32% from 2000 and 11.86% from 1990 in total square miles of the City. Areas presented in the table are based on the area generated using legal descriptions for each area. When reviewing the historical record of Little Rock growth, large expansions occurred in the mid-1950s and again in the late 1970s. It is a second surge in the early to mid-1980s that makes the growth change noticeable to people today. The period of aggressive annexation activity experienced from 1979 through 1985 appears to be over. Since the middle 1980s, except for ‘island annexations, all annexations have been at the request of property owners to get some city service.
Year Cases Annexed Acres
City Limits
Sq. Miles 1980 10 1951.289 82.633 1981 9 608.971 83.585 1982 7 367.945 84.159 1984 10 364.905 84.730 1985 4 8746.251 98.396 1986 1 21.244 98.429 1987 5 446.156 99.126 1989 1 2176.691 102.527 1990 2 2781.279 106.873 1991 1 686.131 107.945 1993 5 1093.291 109.653 1994 3 1942.767 112.689 1995 1 72.482 112.802 1996 8 695.018 113.888 1997 2 820.152 115.169 1998 3 247.644 115.556 1999 1 1229.616 117.478 2000 2 328.057 117.990 2001 2 566.858 118.876 2002 1 5.34 118.884 2003 1 2.77 118.888 2004 3 377.24 119.477 2005 5 47.49 119.55

Subdivision Activity
40
A review of subdivision plat activity is a good measure of likely development over the next year. The maps and table show the locations of Planning Commission approved preliminary plats. The most activity was in the west sub-area with 26 cases. The west sub-area had over three times the activity of the next sub-area with over 855.4 acres in 26 plats (67.8 percent and 61.9 percent respectively). The southwest and central sub-areas had similar numbers of cases with eight and seven respectively. These sub-areas account for 35.7 percent of the cases compared with the west sub-area at 61.9 percent. The area included in subdivisions from the southwest sub-area was about double that in the central sub-area (265.87 acres to 140.7 acres). Though the area was still less than a third that of the west sub-area. Most of the central and east sub-areas were developed and platted more than four decades ago. Thus the small amount of activity in the east sub-area should not be a surprise. Only one case and less than half an acre was subdivided in 2005. The number of approved preliminary plats decreased from 44 in 2004 to 42 in 2005. The total acreage in 2005 doubled from 621.1 acres to 1262.5 acres. Non-residential activity as measured by cases fell 31.6 percent from 19 to 13 cases. The total non-single family acreage platted went from 338.8 acres to 245.4 acres (a 27.6 percent decrease). All types nonresidential acreage platted increased markedly: commercial acreage increased 81.2 percent from 77 to 139.5 acres, with office falling to a third of the 2004 level and industrial decreasing 40 percent. However, residential platting activity saw a slight increase from 25 plats to 29 plats, a 16 percent increase. There were no multifamily subdivisions after having one each during the last two years. Single-family acreage increased fourfold from 282.2 acres to 1017.14 acres. Residential lots increased threefold from 803 residential lots in 2004 to 2328 residential lots in 2005. The majority of the single-family residential approved preliminary plat cases were located in the west sub-area (17 cases) and 68.4 percent of the acreage was located in the west sub-area. Both the central and southwest sub-areas accounted for 6 cases. The southwest sub-area accounted for the second highest area included in the plats at 181 acres (17.8% of the residential acreage). The central sub-area accounted for 140.4 acres (13.8%). The east sub-area had no residential subdivision activity. As with single-family plat activity, the west (at 65.1% of the area) sub-area accounted for most of the non-residential plat activity. The southwest sub-area was the next most active with 34.6 percent of the area. Both the east and central sub-areas had only one case each, with areas of less than half an acre. Most of the commercial plats, 62.5 percent (5 cases) and 77.5 percent of the area (108.16 acres) was in the west sub-area. Most of the office activity was in the west sub-area with 3 of the 4 cases and over 45.24 of the 51.54 acres. The only industrial plat was in the southwest sub-area. This plat activity shows continued interest in the west and southwest sub-areas for developable areas.

Subdivision Activity
41
*platted twice, second plat added more area and lots
Approved Preliminary Plats
Plan Commercial Office Industrial Multi-Family Single Family Res. Dist. cases acres cases acres cases acres cases acres cases acres Lots
1 1 6.3 3 23.2 18 3 1 0.3 1 38 35 5 1 0.49
10 5 102.4 307 11 2 28.49 107 12 1 30.57 2 * 71.67 227 15 2 41.71 90 16 1 54.3 2 67.62 231 18 1 12.55 1 13.9 2 427.43 857 19 3 72.2 1 3.22 7 204.71 450 20 1 23.41 1 28.12 21 1 4.54 2 22 1 3.91 2 29 1 3.46 2
Total 8 139.52 4 51.54 1 54.3 0 0 29 1017.14 2328

Final Plat Activity
42
The number of final plats and acreage increased during 2005. In 2005, 113 cases for a total of 824.69 acres were final platted. This is compared to 91 cases and 635.7 acres in 2004 representing a 24.2% increase in cases and a 29.8% increase in acreage. The area within signed final plats has been concentrated in the west sub-area with 582.54 acres (70%). The central and southwest sub-areas each had 21 and 22 cases, respectively. The acreage platted in the central sub-area was 17.8 acres while 164.75 acres was final platted in the southwest sub-area. The west sub-area represented 61% of the cases and 70.6% of the area final platted in 2005. The table and maps indicate more specifically the Planning Districts where the strongest activity is occurring. Activity in the west sub-area increased in cases from 48 to 61, and increased 17.9% to 582.54 acres in area. The southwest sub-area expressed a declined in activity to 22 cases, a drop of 12% and an increase of 112% to 164.7 acres in area. The central sub-area had an 40% increase in the number of cases and 66.2% drop in area. The east sub-area saw a three-fold increase in the number of cases to 9 and fourfold in area to 59.8 acres.
Approved Final Plats
Plan Final Plat Dist. cases acres
1 12 124.22 2 1 1.89 3 7 8.93 4 9 4.44 5 3 2.31
10 5 4.42 11 5 13.76 12 6 33.48 13 1 0.85 15 5 19.01 16 10 110.67 18 11 109.68 19 25 315.53 20 5 9.02 21 1 5.04 22 1 3.91 25 5 53.42 26 1 4.11
Total 113 824.69
Zoning Activity
43
In 2005, twenty-two rezoning cases were filed with the City. Of these, fifteen cases were approved for reclassification. The approval rate was 68 percent. This is a 48.3 percent drop in the number of approved cases from 2004. The number of cases declined from 29 to 15, with an area reduction of 61.3 percent from 226.99 acres in 2004. There was a slight concentration of cases in the west sub-area with 40 percent of the cases. The other three sub-areas experienced two to four cases each. The majority of the cases (66.7%) were reclassifications to either commercial or office. Ten of the fifteen cases were either commercial or office. Only three of the ten cases were in the west sub-area, tough 40% of all the cases were in this sub-area. Over half the area reclassified land was in just two cases. Both of which were in the I-430 Planning District. These rezonings were to multifamily and account for 57.8 percent of all the land reclassified in 2005. As a result of the two multifamily cases, the west sub-area accounts for 61.3 percent of the acreage reclassified in 2005. And multifamily use accounts for 53.1% of the land reclassified. Planned Zoning District (PZD) activity remained steady with a slight increase from 2004, increasing 5 approved cases (71 to 76 cases). During 2004, 71 cases were approved as PZD’s for a total of 460.6 acres. During 2005 there were 76 cases and 567.4 acres approved. This is an increase of seven percent in the number of cases and 23.2% in the area involved. The west sub-area each captured 52.6% of the approved PZD cases of the City. The other three sub-areas had between 11 and 13 cases. This represents 17.1% of the cases in the central sub-area, 15.8% in the east and 14.5% in the southwest. While the southwest sub-area accounted for the least cases, it had over a quarter of all the area reclassified using the PZD process. Acreage distribution by percentage indicates the west sub-area accounted for almost 67.6%, southwest sub-area 27.9%, the east sub-area 3% and the central sub-area 1.5%. To get a complete view of the zoning activity, one needs to look at both PZD and regular reclassification. For 2005 there was a slight decline (excluding the two city rezoning initiatives) in both cases and area reclassified. Figures show a decrease of nine percent in cases from 100 to 91 and a 4.7% decrease in area reclassified from 687.56 to 655.11 acres. The table and map of rezoning and PZD approved cases show the areas most likely to develop in 2006 or soon then after. Because of the nature of PZD request, these are projects likely to be developed in the near term. Based on the information provided by the graphic and the table, the majority of growth should take place in the west sub-area where 50.5% of the cases occurred and 66.8% of the area was located in 2005. Based on reclassification activity some future growth or redevelopment is likely in each of the other sub-areas but none close to the intensity of the west sub-area.

Zoning Activity
44
Approved Rezonings
Commercial Office Multi-Family Single-Family Industrial Planning District cases acres cases acres cases acres cases acres cases acres
4 1 1.65
9 1 0.32 1 13
10 1 3.0
11 1 3.48 2 37.03
12 1 8.63
13 1 0.52
15 1 0.96
16 1 1.84
19 1 1.88 1 9.6
20 1 1.91
25 1 3.89
Total 6 15.31 4 8.88 3 46.63 0 0 2 16.89

Zoning Activity
45
Approved PZD’s
PZD Activity
Planning Commercial Office Industrial Residential District cases acres cases acres cases acres cases acres
1 4 6.44 4 15.71 3 32.48 3 1 0.64 1 0.25 3 2.07 4 3 2.00 3 2.21 5 1 3.58 2 1.40 8 1 0.17 5 1.23 9 1 5.01 1 4.58 1 0.83
10 2 1.58 11 4 110.24 1 0.19 12 2 11.88 15 3 36.24 1 0.25 1 2.1 16 4 107.57 18 5 34.66 3 39.92 4 42.36 19 4 13.06 1 3.4 2 6.35 20 2 39.7 1 33 29 1 5.1 1 1.16
Total 29 358.66 22 84.67 0 0 25 124.03

46
Planning and Development Staff - 2005 Tony Bozynski, Director
Venita Young, Administrative Assistant
Planning Division Walter Malone – Mgr. Alice Anderson Charles Bloom Quenton Burge Brian Minyard Dennis Webb Tom Wiles
Zoning and Subdivision Division Dana Carney – Mgr. Bob Brown Alice Chalk Jan Giggar Darrell Holladay Donna James Kenneth Jones Janet Lampkin Christy Marvel Monte Moore Bob Muehlhausen Kenny Scott Kelly Smith David Stowe
Building Codes Division Chuck Givens – Mgr. Ronnie Campbell Arnold Coleman Kyron Doucette Charles Fulmer Dennis Johnson Rex Lyons Richard Maddox David McClymont Jerry Nash Ronyha O’Neal-Champ Ed Osborn Britt Palmer Ward Reese Maynard Smith Jerry Spence Terry Steele Gerard Walsh Mark Whitaker Paul Whitten