Embed Size (px)
Citation preview


Board of Directors - 2003 Mayor Jim Dailey Vice Mayor Willie Hinton Ward 1 Johnnie Pugh Ward 2 Willie Hinton Ward 3 Stacy Hurst Ward 4 Brad Cazort Ward 5 Michael Keck Ward 6 Genevieve Stewart Ward 7 B.J. Wyrick Position 8 Dean Kumpuris Position 9 Barbara Graves Position 10 Joan Adcock River Market Design Review Committee - 2003 Greg Hart – Chairman Tim Heiple Jim Schimmer Melissa Tanner Patty Wingfield
Board of Adjustment – 2003 William Ruck – Chairman Fred Gray – Vice Chairman Andrew Francis Terry Burruss Scott Richburg
Planning Commission - 2003 Obray Nunnley, Jr. – Chairperson Mizan Rahman – Vice Chairperson Fred Allen, Jr. Judith Faust Norm Floyd Gary Langlais Bob Lowry Jerry Meyer Rohn Muse Bill Rector Robert Stebbins City Beautiful Commission - 2003 Nash Abrams -- Chairperson Tim Heipe – Vice Chairperson John Beneke Jan Barlett Hicks Amy Ivey Troy Laha Sharon Tallach Vogelpohl Lynn Mittelstaedt Warren Karol Zoeller Construction Board of Adjustment and Appeal -2003 Joe Hilliard – Chairman Danny Bennett Doug Bown Emery Crossland Robert Merriott James Mitchell Clyde Smith

January 17, 2003 Dear Citizen, The year was extremely productive for the Department in terms of strategic long-range planning efforts. As with all of our planning endeavors it has been the great support from the Mayor and Board of Directors, Planning Commission and residents that made the plans become reality. Much of the 2002 work program was completed within the fiscal year. While we along with the rest of America traversed difficult times, we have not lost focus of our goal – preserving the quality of life that initially attracted us, our neighbors and the existing businesses to the community that we continue to call home. Our continued involvement with the efforts to bring the City operations closer to the people of the community has assisted to bridge the gap between our municipal governing and its citizens. The Buildings Codes Division collected over $2,000,000 in fees, including permit fees, licenses and other miscellaneous charges and performed over 20,000 inspections. The Division continues to review plan applications on commercial buildings within five days and provides same-day review on residential applications. The division provides same-day inspections of all requested inspections prior to 9:00 a.m. The Planning Division continues to assist neighborhoods with the development of Neighborhood Action Plans. This planning process allows for neighborhoods to define a common direction, based on the shared vision of the participants and is articulated in concise statements by the residents of the neighborhoods involved. Presently there are nineteen action plans completed. The Zoning Division acts as a resource agency for developers, realtors and other citizens when presented with requests for current zoning, plat status, development standards or statistical information. The Division continues to administer the scenic corridor provisions for billboards along with sign permits and renewals. During the previous year fee revenue collected for sign permits and sign renewal permits totaled $48,095. Contained in this Annual Report are the accomplishments and achievements from the previous year for the Department. Please review this report and join us in expanding our successes for Little Rock in 2003. Respectfully, Jim Lawson Director


Table of Contents Zoning and Subdivision Summary . . . . . . . . . . . . . . . . . . . . . . . . . . . . . . . . . . . . . . . . . . 1 Building Codes Division Summary . . . . . . . . . . . . . . . . . . . . . . . . . . . . . . . . . . . . . . . . . . 5 Planning Division Summary . . . . . . . . . . . . . . . . . . . . . . . . . . . . . . . . . . . . . . . . . . 9 Urban Development Data Development Activity Summary . . . . . . . . . . . . . . . . . . . . . . . . . . . . . . . . . . . . . . . 14 Population Estimates . . . . . . . . . . . . . . . . . . . . . . . . . . . . . . . . . . . . . . . . . .15
Construction Activity . . . . . . . . . . . . . . . . . . . . . . . . . . . . . . . . . . . . . . . . . .16 Residential Activity . . . . . . . . . . . . . . . . . . . . . . . . . . . . . . . . . . . . . . . . . .19 Housing Construction Values . . . . . . . . . . . . . . . . . . . . . . . . . . . . . . . . . . . . . . . . . .21 Affordable Housing . . . . . . . . . . . . . . . . . . . . . . . . . . . . . . . . . . . . . . . . . .23 Residential Additions and Renovation Activity. . . . . . . . . . . . . . . . . . . . . . . . . . . . 24 Demolition Activity . . . . . . . . . . . . . . . . . . . . . . . . . . . . . . . . . . . . . . . . . .27 Office Activity . . . . . . . . . . . . . . . . . . . . . . . . . . . . . . . . . . . . . . . . . .29 Commercial Activity . . . . . . . . . . . . . . . . . . . . . . . . . . . . . . . . . . . . . . . . . .32 Industrial Activity . . . . . . . . . . . . . . . . . . . . . . . . . . . . . . . . . . . . . . . . . .35 Annexation Activity . . . . . . . . . . . . . . . . . . . . . . . . . . . . . . . . . . . . . . . . . .38 Subdivision Activity . . . . . . . . . . . . . . . . . . . . . . . . . . . . . . . . . . . . . . . . . .39 Zoning Activity . . . . . . . . . . . . . . . . . . . . . . . . . . . . . . . . . . . . . . . . . .42

Zoning and Subdivision Division
1
Zoning and Subdivision Regulations are the principal tools employed by the City of Little Rock in guiding the city objectives and plans to specify goals. They assure compatibility of uses while directing the placement of infrastructure and public services. Platting, rezoning and site development ordinances are administered by this Division. Additionally, use permits, variances and enforcement are dealt with daily. The Division also acts as a resource agency for developers, realtors and other citizens when presented with requests for current zoning, plat status, development standards or statistical information. Limited involvement in maintaining a neighborhood contact list for purposes of monitoring development activities has been continued by the division. The list is monitored for updates and expansions, within a computer master list. This record offers several notice formats for contacts. This Division has encouraged local developers to provide early contact with staff to assure that development proposals are filed in a timely manner, and with involvement of interested persons or organizations. Staff from the Division continues their involvement in neighborhood meetings with developers and area residents. These meetings are held in the neighborhood normally during the evening hours to facilitate attendance by interested neighbors. These meetings usually concern an active application for development. Annual Ordinance Review A primary function of this Division is to assure complete, accurate and up-to-date land development codes for use by the public at all levels of involvement. During 2001 staff worked with the Plans Committee of the Planning Commission on an annual review of proposed changes to the zoning ordinance. There were 25 changes proposed. This process was completed in early 2002. 2002 Sign Code Statistics During 2002, the Division worked to process sign renewals (5 year interval for billboards, 10 year for all others). Sign permits (including renewals) brought in $48,095 in fees for the year. In addition, the Division administered the scenic corridor provisions on billboards. 780 Sign Permits Issued 0 Court Cases 316 Sign Permit Renewals 3,841 Sign Inspections and Re-inspections In 2003, the Division will continue to monitor and enforce the sign ordinance. The staff anticipates no significant changes in the coming year.

Zoning and Subdivision Division
2
Commercial Plan Review The Division provides for a detailed review of all commercial permits for purposes of assuring that all developments comply with Zoning, Subdivision and Landscape Ordinance standards. Additionally, reviews of the landscape and buffer requirements for developments going before the Planning Commission are provided. These reviews not only aid the City Beautiful Commission in its efforts to create a more livable city, but assist in providing a five (5) day “turnaround” on all commercial building permits. 2002 Plans Review for Zoning, Subdivision and Landscape Requirements 261 Commercial Plans/New or Additions 284 Commercial Landscape Plans 2002 Other Activities 29 Franchise Request 798 Site Inspections 108 Certificates of Occupancy 24 Temporary Structure Permits Enforcement The Division performs a key role in maintaining the effect and values of land use regulation by enforcing the Zoning, Subdivision and Landscape Ordinances. 3,074 inspections and re-inspections were performed. 2002 Plan Reviews for Permits 1054 Residential Plans – New or Additions 2002 Privileges Licenses 1479 Retail, Commercial, Office, Industrial and Home Occupation Reviews 2002 Information Inquiries 4,800 Request for Sign, Zoning, Enforcement or Licenses 2002 Court Cases 69 Cases – All Types 2002 Citations Issued 16 Cases – All Types Wireless Communication Facilities The Division continued to administer Article 12 of the City Ordinances, passed January 1998, which regulates wireless communication facilities. During 2002, 20 locations were approved administratively and 9 by the Planning Commission or Board of Directors. Staff shall continue to encourage collocation of WCF facilities.

Zoning and Subdivision Division
3
Zoning Site Plan Zoning Site Plan review is a development review process that provides for case-by-case consideration of project particulars involving site development plans within certain zoning districts in the City of Little Rock. Plans for all such developments are submitted to and reviewed by the Division and the Little Rock Planning Commission. During 2002, the Division and the Planning Commission reviewed three zoning site plans, all of which were approved by the Planning Commission. Subdivision Site Plans Subdivision Site Plan review is a development review process that provides for case by case consideration of project particulars involving multiple building site plans. Plans for all such developments are submitted to and reviewed by the Division and the Little Rock Planning Commission. During 2002, the Division and the Planning Commission reviewed 16 Subdivision Site Plans, with 14 of the plans being approved by the Planning Commission. Conditional Use Permits Divisional staff provides support and analysis for the Planning Commission’s review of Conditional Use Permit applications. Conditional Uses are specifically listed uses within the various zoning districts, which may be approved by the Planning Commission. Such uses are subject to special conditions as determined by the Commission. In 2002, the Commission reviewed 66 Conditional Use Permit applications. Of these, the Commission approved 51 applications. Board of Zoning Adjustment Staff support and analysis for the Board of Zoning Adjustment is provided by divisional Staff. The Little Rock Ordinance provides a multitude of specific requirements which, when applied to certain developments or in individual instances, may create hardship. In those instances, the Board of Adjustment is empowered to grant relief. The Board hears appeals from the decision of the administrative officers in respect to the enforcement and application of the Zoning Ordinance. In addition, the Board is responsible for hearing requests for variances from the literal provisions of the Zoning Ordinance. The Board consists of five (5) members appointed by the Board of Directors to a term of three (3) years. The Board meets one (1) time each month, typically the last Monday of the month. In 2002, the Board heard a total of 148 cases: 140 variance requests, 2 time extensions and 6 appeals. Of the 140 variance requests, 120 were approved. City Beautiful Commission The Zoning and Subdivision Division provides staff support and analysis for the City Beautiful Commission. This nine member commission is responsible for the establishment and maintenance of plans to ensure a high level of visual aesthetic quality. The goal of the commission is to raise the level of the community expectations for the quality of its environment. The commission also hears and decides appeals from enforcement of the various provisions of the City’s Landscape Ordinance. The Commission heard nine such appeal cases in 2002.

Zoning and Subdivision Division
4
Conditional Use Permits
Board of Adjustment Cases

Building Codes Division
5
The Building Codes Division issues construction related permits and provides plan review and inspection services with regard to building, plumbing, electrical and mechanical construction in the city. The primary goal of the Division is to protect the public health and safety through the administration and enforcement of these codes. Within the Building Codes Division there are six working sections. The Building Inspection Section, Electrical Inspection Section, Permit Section, Plan Review Section, Plumbing and Gas Inspection Section and Mechanical Inspection Section.
Building Inspection The Building Inspection Section is responsible for the inspection of all permitted commercial and residential construction jobs for code compliance through the full construction process, from foundation to the completion of construction. Inspections are also performed on dilapidated commercial structures and follow-up action is taken to have the structure repaired or removed.
Code Compliance
Building 2002 2001 2000 1999 Permits Issued 4,561 4,384 4,458 4,269 Inspections 5,572 5,500 5,930 5,734 Violations 1,005 1,175 1,164 1,411 Fees $1,044,848 $747,698 $956,480 $723,629
Plumbing 2002 2001 2000 1999 Permits Issued 3,443 3,058 2,834 2,588 Inspections 5,823 5,072 4,419 4,834 Violations 867 681 562 584 Fees $307,173 $240,635 $246,758 $233,455
Electrical 2002 2001 2000 1999 Permits Issued 2,834 3,067 3,008 2,816 Inspections 6,147 7,185 7,489 8,183 Violations 1,044 861 736 773 Fees $315,153 $276,910 $307,002 $299,907
Mechanical 2002 2001 2000 1999 Permits Issued 1,534 1,419 1,595 1,491 Inspections 2,997 3,547 2,356 2,344 Violations 501 515 364 498 Fees $266,909 $186,173 $187,049 $173,515

Building Codes Division
6
Inspectors in this section also answer complaints involving illegal and unpermitted building projects. This section is responsible for review of building codes and proposes any changes and additions to keep “up-to-date”. Electrical Inspection The Electrical Inspection Section is responsible for inspection of permitted projects for code compliance. This section reviews all new electrical construction as well as electrical repairs. This section also reviews electrical drawings involving commercial buildings and outdoor electrical signs. Inspectors handle complaints involving illegal and unpermitted works and check electrical contractors’ licenses and update the city electrical codes. Plumbing and Gas Inspection The Plumbing and Gas Inspection Section reviews all permitted plumbing and natural gas projects for code compliance. The City of Little Rock also has jurisdiction over such work outside the city limits (if connecting to the city water supply). Inspections include water meter, yard sprinklers, installations involving plumbing and natural gas. Inspectors in this section also handle complaints involving illegal and unpermitted projects. Inspectors review plumbing contractors’ licenses and privilege licenses. Plumbing construction drawings are reviewed for proposed commercial projects and this section also proposes changes and additions to the plumbing codes as necessary. Mechanical Inspection The Mechanical Inspection Section is responsible for inspection of permitted projects for code compliance. These inspections include all heating and air installations. Inspectors in this section also handle complaints involving illegal and unpermitted projects and check contractors for proper licensing. Mechanical construction drawings are reviewed for proposed commercial projects and this section also proposes changes and additions to the mechanical codes as necessary. Plan Review Section The Plan Review Section is responsible for the review of all proposed commercial building plans for code compliance. This review involves all phases of building from foundation to structural, electrical, plumbing and mechanical and qualifies all requirements of Wastewater, Water Works, Civil Engineering, Traffic Engineering, Fire and Landscaping code requirements. This section works closely with other city agencies as well as contractors, architects and developers. Permit Section All construction permits involving building, electrical, plumbing, and mechanical work are issued in this section as well as permits for garages and tents. Records and building plans are maintained on all jobs for which permits have been issued. The permit section also maintains all other general records of the Division.
Building Codes Division
7
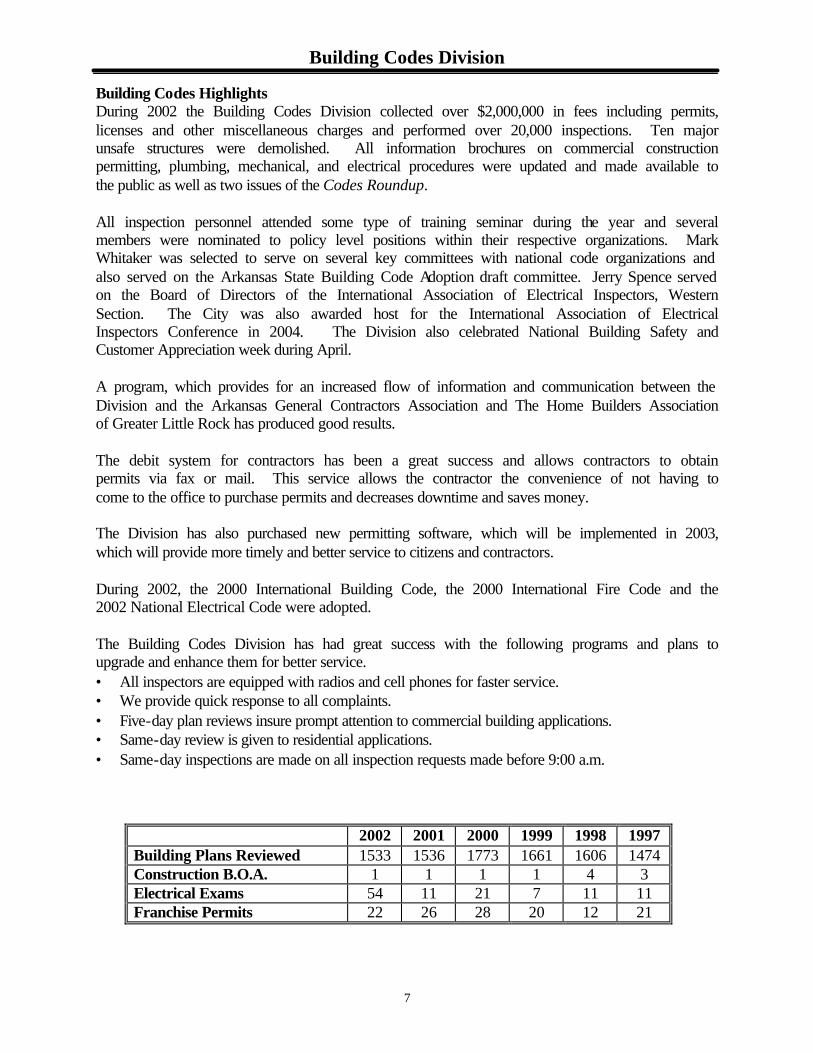
Building Codes Highlights During 2002 the Building Codes Division collected over $2,000,000 in fees including permits, licenses and other miscellaneous charges and performed over 20,000 inspections. Ten major unsafe structures were demolished. All information brochures on commercial construction permitting, plumbing, mechanical, and electrical procedures were updated and made available to the public as well as two issues of the Codes Roundup. All inspection personnel attended some type of training seminar during the year and several members were nominated to policy level positions within their respective organizations. Mark Whitaker was selected to serve on several key committees with national code organizations and also served on the Arkansas State Building Code Adoption draft committee. Jerry Spence served on the Board of Directors of the International Association of Electrical Inspectors, Western Section. The City was also awarded host for the International Association of Electrical Inspectors Conference in 2004. The Division also celebrated National Building Safety and Customer Appreciation week during April. A program, which provides for an increased flow of information and communication between the Division and the Arkansas General Contractors Association and The Home Builders Association of Greater Little Rock has produced good results. The debit system for contractors has been a great success and allows contractors to obtain permits via fax or mail. This service allows the contractor the convenience of not having to come to the office to purchase permits and decreases downtime and saves money. The Division has also purchased new permitting software, which will be implemented in 2003, which will provide more timely and better service to citizens and contractors. During 2002, the 2000 International Building Code, the 2000 International Fire Code and the 2002 National Electrical Code were adopted. The Building Codes Division has had great success with the following programs and plans to upgrade and enhance them for better service. • All inspectors are equipped with radios and cell phones for faster service. • We provide quick response to all complaints. • Five-day plan reviews insure prompt attention to commercial building applications. • Same-day review is given to residential applications. • Same-day inspections are made on all inspection requests made before 9:00 a.m.
2002 2001 2000 1999 1998 1997
Building Plans Reviewed 1533 1536 1773 1661 1606 1474 Construction B.O.A. 1 1 1 1 4 3 Electrical Exams 54 11 21 7 11 11 Franchise Permits 22 26 28 20 12 21

Building Codes Division
8
Major Jobs Reviewed, Permitted or Inspected in 2002 Projects of significant importance to the community involving new construction, additions or renovations include: Churches Factory-Storage Immanuel Baptist Moon Distributors Fellowship Bible Sysco Foods Greater Christ Temple Western Foods First Church of the Nazarene St. Jude Packaging Church at Rock Creek Hugg & Hall Equipment Dixie Church of Christ Gold Star Dairy Holy Souls Business Educational Aldersgate Properties Terry Elementary Arkansas Federal Credit Union Franklin Elementary North Point Auto Group Mabelvale Magnet Family Life Head Quarters Romine Elementary Fulbright Elementary Restaurants Wilson Elementary Long John Silvers Mann Arts & Science Magnet Bo Jangles Bale Elementary IHOP Central High Wendys College Station Elementary Izzys Little Rock Christian Academy Philander Smith College Institutional Little Rock Boys and Girls Clubs Residential Keith Jackson Park Holiday Inn Rave Theatre Westside Loft Apartments Clinton Presidential Library Parham Pointe Apartments Stagecoach Village Mercantile Reservoir Heights Walgreens Cracker Box

Planning Division
9
The Planning Division provides mid and long range planning as well as technical support to the City. The division prepares neighborhood plans and reviews draft amendments to the existing plans. This includes reviewing reclassification requests and development of staff reports for Land Use Plan amendments requested by various groups. The staff of the Planning Division responds to requests for statistics, graphics, and GIS products. This Annual Report is one example of the products produced by the division. The division monitors the Website for updates and assists with all computer needs of the department. In addition, at the request of the Board of Directors and/or the Planning Commission the division staff may work on special studies. A few of the major work efforts from 2002 are described below. Neighborhood Plans The Planning Division has continued the Neighborhood Plan process with the completion of the 65th Street West Neighborhoods Plan. This brings to nineteen the number of Neighborhood Plans completed. The East Little Rock Plan was put on hold due to lack of neighborhood interest, though a Land Use Plan review of the area was completed. Most of the neighborhoods south of Cantrell Road as well as those west of I-430 have completed neighborhood plans. The Birchwood-Walnut Valley Neighborhoods Plan is ready for a neighborhood ‘buy-off’ meeting in January. This plan is for the neighborhoods between I-430 and Bowman Road, from Kanis Road to Rodney Parham Road. The Heights Plan is under way, the plan area is between the Arkansas River and Evergreen – North Lookout, east of Cantrell Road. The plan updates for Chicot West, River Mountain and John Barrow Neighborhoods were completed. Special Planning Efforts The Division Planners worked on two major special efforts: one in the extreme east and the other in the extreme west of the Planning Area. The East of I-30 effort was a concept plan effort to review the area bounded by I-30, Fourche Creek and the Arkansas River. This was done in light of the National Airport’s plan and recent activity east of the downtown office core (Presidential Library, etc.). The effort was to guide the expected redevelopment of the area. Several meetings with owners and residents were conducted and a report delivered to the Board of Directors by the Mayor. Major changes to the City Land Use Plan and Master Street Plan will result from this effort. The western planning effort was the extension of land use and transportation planning as well as zoning to areas outside the City’s previous Planning Boundary. A new three mile boundary was drawn and plans developed. Several meetings were conducted in the area and with various interest groups from the area. A package was developed to designate land uses and Master Street Plan classifications within the 22.05 square mile area. The area was zoned and requests for non-residential zoning were considered. GIS & Graphics Activities GIS continues to be the source of sketch and base maps as well as statistics for neighborhood plans and special studies. Maintenance of data related to future land use, zoning and structure changes (addition or removal) continues. GIS has become a support function of the division for both graphics and statistical reports with use of Arcview software.
Planning Division
10
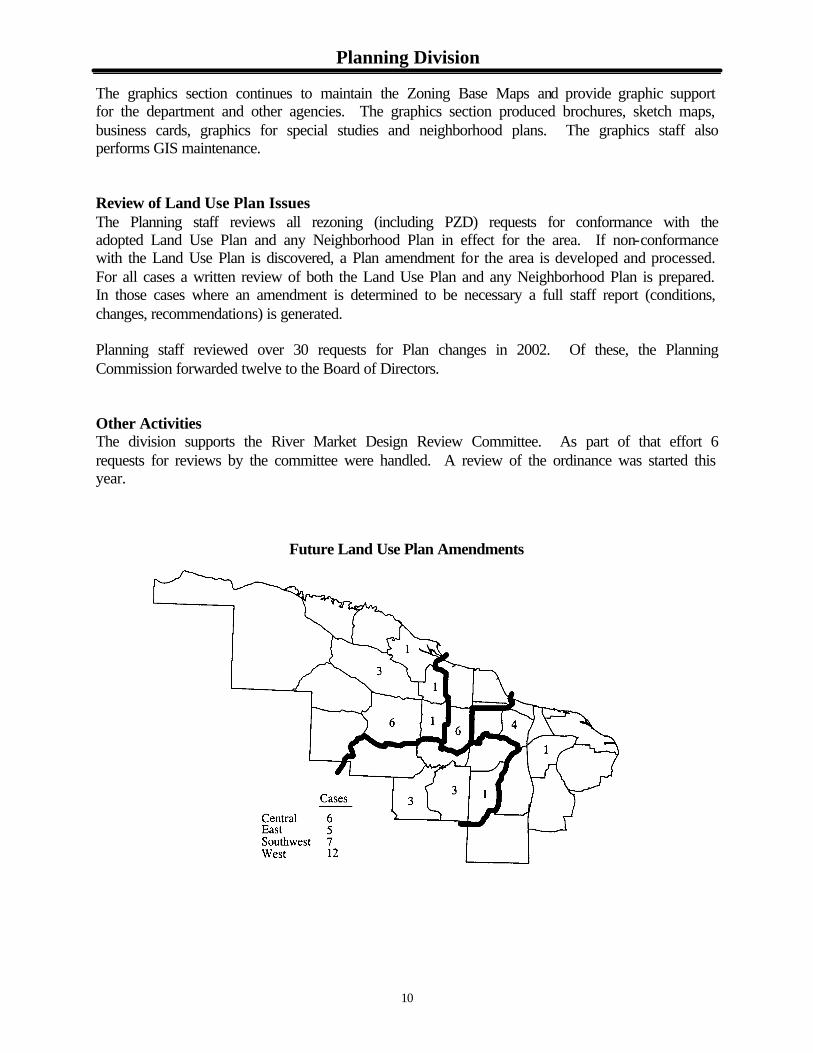
The graphics section continues to maintain the Zoning Base Maps and provide graphic support for the department and other agencies. The graphics section produced brochures, sketch maps, business cards, graphics for special studies and neighborhood plans. The graphics staff also performs GIS maintenance. Review of Land Use Plan Issues The Planning staff reviews all rezoning (including PZD) requests for conformance with the adopted Land Use Plan and any Neighborhood Plan in effect for the area. If non-conformance with the Land Use Plan is discovered, a Plan amendment for the area is developed and processed. For all cases a written review of both the Land Use Plan and any Neighborhood Plan is prepared. In those cases where an amendment is determined to be necessary a full staff report (conditions, changes, recommendations) is generated. Planning staff reviewed over 30 requests for Plan changes in 2002. Of these, the Planning Commission forwarded twelve to the Board of Directors. Other Activities The division supports the River Market Design Review Committee. As part of that effort 6 requests for reviews by the committee were handled. A review of the ordinance was started this year.
Future Land Use Plan Amendments

11
2002
Urban Development
Report Data

Urban Development Report
12
This Urban Development Report is designed to describe and monitor growth and present a comprehensive overview of significant demographic, economic and development conditions, which exist in the City of Little Rock during the 2002 reporting period. Sources of the data are the official records of the Department of Planning and Development, MetroPlan and Arkansas Business. Building permits were used to quantify the numbers, locations and magnitude of the various residential and nonresidential developments. The data reflected by building permits is only the authorization for construction and the possibility exists that a small number of construction projects were not initiated before the end of 2002. Thirty Planning Districts have been designated for both land use and statistical purposes. The districts follow physical features and include not only the area within the corporate limits but also area beyond. For reporting purposes four sub-areas have been designated. Both the Planning Districts and sub-areas form the framework for presentation of data in this report. The preceding map indicates the area of each Planning District while the following chart provides the Planning District names and corresponding sub-area.
Planning District Sub - Area 1 River Mountain West 2 Rodney Parham West 3 West Little Rock Central 4 Height/Hillcrest Central 5 Downtown East 6 East Little Rock East 7 I-30 East 8 Central City East 9 I-630 East/Central 10 Boyle Park Central 11 I-430 West 12 65th Street West Southwest 13 65th Street East Southwest 14 Geyer Springs East Southwest 15 Geyer Springs West Southwest 16 Otter Creek Southwest 17 Crystal Valley Southwest 18 Ellis Mountain West 19 Chenal West 20 Pinnacle West 21 Burlingame Valley West 22 West Fourche West 23 Arch Street Pike East 24 College Station East 25 Port East 26 Port South East 27 Fish Creek East 28 Arch Street South East 29 Barrett West 30 Buzzard Mountain West

Urban Development Report
13
Planning Districts
Sub - Areas

Development Activity Summary
14
Population Estimate 184,354 persons 2002 population estimate
New Construction
654 permits; up 10.7% from 591 in 2001
Single-Family Housing 581 units; up 20.3% from 483 units in 2001
$234,075 avg.; up 7.5% from $217,762 in 2001
Multi-Family Housing 238 units; up 150.5% from 95 units in 2001
Residential Renovations/Additions
805 permits; up 7.6% from 748 in 2001 $17,354,068 construction dollars; up 21% from $14,337,018 in 2001
Demolitions
104 residential units; down 4.6% from 109 in 2001
Office 99,759 square feet; down 75.2% from 399,011 in 2001
$9,229,585 construction dollars; down 58.4% from $22,173,454 in 2001
Commercial 231,895 square feet; down 31.1% from 336,692 in 2001
$17,981,631 construction dollars; up 3.1% from $17,434,611 in 2001
Industrial 150,235 square feet; up 71.7% from 87,502 in 2001
$6,353,680 construction dollars; up 328.7% from $1,482,000 in 2001
Annexations One annexation of 5.34 acres, compared to two annexations totaling 566.86 acres in 2001
Preliminary Plats
706 residential lots; down 36.7 % from 1116 lots in 2001 522.36 total acres; down 62.6 % from 1397.89 acres in 2001
Final Plats
70 cases; down 4.1% from 73 cases in 2001 444.74 acres; up 2.7% from 433.17 acres in 2001
Rezoning
11 cases; down 67.6% from 34 cases in 2001 53.7 acres; down 86% from 387 acres in 2001
PZD’s
61 cases; up 56% from 39 cases in 2001 280.47 acres; up 183.6% from 98.9 acres in 2001

Population Growth and Projections
15
The population change recorded by the Census has consistently been positive. During the latter part of the 1900s annexation of already developed areas help inflate the numbers. This slowed in the 1990s to almost no population gained due to annexation. Thus the large growth shown for the 1960s, 1970s and 1980s is an over representation of the actual urban growth. Little Rock continues to experience a slow growth rate. Most of the growth has been in the west and southwest parts of the City. The east, central and southwest sections of Little Rock experienced most of the population loss. Though it should be noted that there were some areas of growth in all sections of the City. There were even small areas of loss in the high growth areas. The trend for the first decade of the twenty-first century is a growth rate, which would result in less than 5% growth by 2010.
Little Rock Population
Year Population Annual % change
1900 38,307 - 1910 45,941 19.93% 1920 65,142 41.79% 1930 81,679 25.39% 1940 88,039 7.79% 1950 102,213 16.10% 1960 107,813 5.48% 1970 132,483 22.88% 1980 159,024 20.03% 1990 175,795 10.55% 2000 183,133 4.17% 2001 183,923 0.43% 2002 184,354 0.23%

Construction Activity
16
During 2002 the total number of new construction permits issued increased by 63 (10.7%) over the number of permits issued in 2001. In 2002 there were 649 permits issued for a total of $181,954,090 construction dollars. While the number of office permits fell by 45 percent, the amount of area added plunged 75 percent. There were 11 permits issued for a total of 99,759 square feet. The commercial activity remained steady around 20 permits but the area added fell over 30 percent. The square footage of industrial added almost doubled to 150,235 square feet and the value saw almost a five fold increase. New single-family unit construction increased by 20.3% (98 units) from 2001 construction permits issued. The total number added during 2002 was 581 units with an average construction cost of $234,075. This is a 7.5% increase over 2001 average construction cost. During 2001 there were 483 permits issued for an average construction cost of $217,762. For 2002 over 63% of the new housing starts were in the west sub-area. Two hundred seventy-five permits (47.3%) were issued in the Chenal Planning District alone. Second to the Chenal Planning District is Otter Creek, in the southwest sub-area, with 94 permits or 16.2%. Multi-family units constructed increased for the first time in five years. During 2002, there were 26 permits issued (representing a scattering of duplexes, small unit buildings, and one apartment complex) for a total of 238 units. The map below graphically indicates the activity by Planning District within the sub-areas. The data included on the map includes new construction activities (accessory structures are not reflected in the preceding table). In addition, permits are not required for construction outside the city limits.
New Construction Activity

Construction Activity
17
Residential Construction Activity
Planning Single-Family Multi-Family Total District Permits Avg. Cost Permits Units Units
1 22 $233,080 5 20 42 2 0 $0 0 0 0 3 13 $261,308 2 6 19 4 12 $376,250 1 2 14 5 0 $0 0 0 0 6 0 $0 0 0 0 7 0 $0 0 0 0 8 16 $87,907 0 0 16 9 7 $73,393 0 0 7 10 7 $82,657 15 180 187 11 17 $106,662 0 0 17 12 49 $125,416 0 0 49 13 4 $99,363 0 0 4 14 0 $0 0 0 0 15 7 $101,675 1 22 29 16 94 $135,105 0 0 94 17 2 $187,500 0 0 2 18 40 $182,319 2 8 48
19.1 184 $364,469 0 0 184 19.2 90 $217,138 0 0 90 20 16 $298,458 0 0 16 21 0 $0 0 0 0 22 0 $0 0 0 0 23 0 $0 0 0 0 24 0 $0 0 0 0 25 1 $94,600 0 0 1 26 0 $0 0 0 0 581 $234,075 26 238 819

Construction Activity
18
*includes a motel with no square footage reported **includes an industrial permit with no square footage reported
Non-Residential Construction Activity
Planning Commercial Office Industrial PQP District Permits Sq. ft. Permits Sq. ft. Permits Sq. Ft. Permits
1 1 14,560 1 2,370 0 0 1 2 1 24,500 1 36,000 0 0 1 3 0 0 0 0 0 0 1 4 1 3,000 1 7,000 0 0 0 5 0 0 0 0 0 0 0 6 0 0 0 0 0 0 0 7 0 0 0 0 2 26,000 1 8 1 8,000 0 0 0 0 2 9 2 8,281 1 19,250 1 67,547 2 10 1 6,750 1 NA 0 0 1 11 2 12,293 3 17,651 0 0 0 12 1 95,000 0 0 1 13,750 0 13 2* 2,850 0 0 0 0 0 14 0 0 0 0 0 0 0 15 2 8,376 0 0 0 0 1 16 2 11,900 1 5,400 2 6,800** 0 17 0 0 0 0 0 0 0 18 0 0 1 5,200 0 0 0 19 1 7,700 1 6,888 0 0 0 20 1 5,585 0 0 0 0 2 21 0 0 0 0 0 0 0 22 0 0 0 0 0 0 0 23 0 0 0 0 0 0 0 24 0 0 0 0 0 0 0 25 2 23,100 0 0 2 18,218 1 26 0 0 0 0 1 17,920 0 20 231,895 11 99,759 9 150,235 13
Residential Activity
19
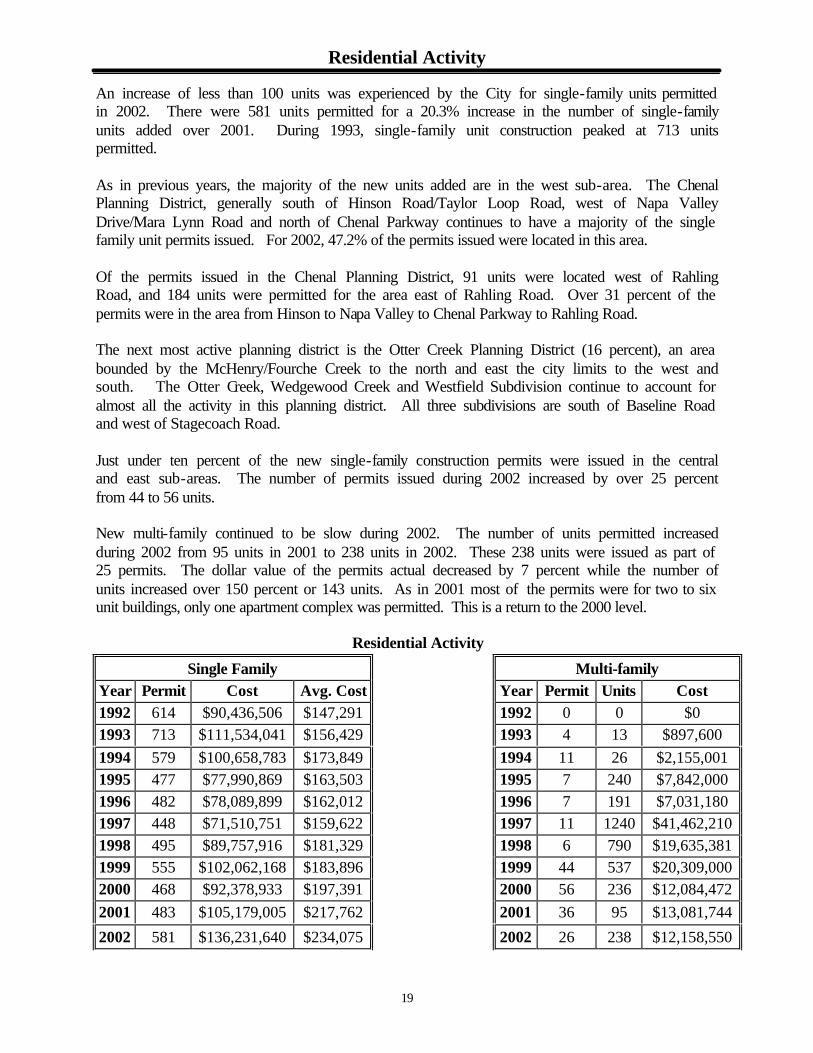
An increase of less than 100 units was experienced by the City for single-family units permitted in 2002. There were 581 units permitted for a 20.3% increase in the number of single-family units added over 2001. During 1993, single-family unit construction peaked at 713 units permitted. As in previous years, the majority of the new units added are in the west sub-area. The Chenal Planning District, generally south of Hinson Road/Taylor Loop Road, west of Napa Valley Drive/Mara Lynn Road and north of Chenal Parkway continues to have a majority of the single family unit permits issued. For 2002, 47.2% of the permits issued were located in this area. Of the permits issued in the Chenal Planning District, 91 units were located west of Rahling Road, and 184 units were permitted for the area east of Rahling Road. Over 31 percent of the permits were in the area from Hinson to Napa Valley to Chenal Parkway to Rahling Road. The next most active planning district is the Otter Creek Planning District (16 percent), an area bounded by the McHenry/Fourche Creek to the north and east the city limits to the west and south. The Otter Creek, Wedgewood Creek and Westfield Subdivision continue to account for almost all the activity in this planning district. All three subdivisions are south of Baseline Road and west of Stagecoach Road. Just under ten percent of the new single-family construction permits were issued in the central and east sub-areas. The number of permits issued during 2002 increased by over 25 percent from 44 to 56 units. New multi-family continued to be slow during 2002. The number of units permitted increased during 2002 from 95 units in 2001 to 238 units in 2002. These 238 units were issued as part of 25 permits. The dollar value of the permits actual decreased by 7 percent while the number of units increased over 150 percent or 143 units. As in 2001 most of the permits were for two to six unit buildings, only one apartment complex was permitted. This is a return to the 2000 level.
Residential Activity
Single Family Multi-family Year Permit Cost Avg. Cost Year Permit Units Cost 1992 614 $90,436,506 $147,291 1992 0 0 $0 1993 713 $111,534,041 $156,429 1993 4 13 $897,600 1994 579 $100,658,783 $173,849 1994 11 26 $2,155,001 1995 477 $77,990,869 $163,503 1995 7 240 $7,842,000 1996 482 $78,089,899 $162,012 1996 7 191 $7,031,180 1997 448 $71,510,751 $159,622 1997 11 1240 $41,462,210 1998 495 $89,757,916 $181,329 1998 6 790 $19,635,381 1999 555 $102,062,168 $183,896 1999 44 537 $20,309,000 2000 468 $92,378,933 $197,391 2000 56 236 $12,084,472 2001 483 $105,179,005 $217,762 2001 36 95 $13,081,744
2002 581 $136,231,640 $234,075 2002 26 238 $12,158,550

Residential Activity
20
Single Family Construction
Single Family Units
Sub-area East Central S-west West
2002 Permits 24 32 156 369 2001 Permits 13 31 89 350 2000 Permits 13 31 78 346 1999 Permits 26 36 103 390 1998 Permits 19 34 78 364 1997 Permits 17 41 91 299
East Central S-west West
2002 % 4.1% 5.5% 26.8% 63.6% 2001 % 2.7% 6.4% 18.4% 72.5% 2000 % 2.8% 6.6% 16.7% 73.9% 1999 % 5.0% 6.0% 19.0% 70.0% 1998 % 4.0% 7.0% 15.0% 74.0% 1997 % 4.0% 9.0% 20.0% 67.0%

Housing Construction Values
21
The average construction cost of a new single-family home increased by 7.5% or $16,313 over 2001. The average unit value in 2001 was $217,762 and in 2002 the average value was $234,075. Interest rates have dropped significantly which is making housing more affordable in real terms. Housing values are represented below in five distribution categories. Less than $50,000, less than $150,000, less than $300,000, less than $500,000 and $500,000 and above. There were three units constructed below $50,000, 188 units constructed in the range of $50,000 to $149,999, 261 units constructed in the range of $150,000 to $299,999, 103 units constructed in the range of $300,000 to $499,999 and 26 units above $500,000. During 2002, 67% of the single-family units constructed cost $150,000 or more. The majority of these homes (83% or 324 homes) were built in the west sub-area of the city. The west sub-area has construction cost ranging from $27,500 to $1,800,00. The central sub-area also has a slightly lower construction cost range from $44,600 to $1,100,000. The east sub-area construction cost ranges from $45,600 to $175,000, and the southwest sub-area construction cost range from $67,200 to $1,575,000. Of the total dollars expended on construction of single-family units the west sub-area accounted for 77.4% ($105,393,740) of the construction dollars and the southwest sub-area accounted for 14.9% ($20,329,444) of all construction dollars expended. The central sub-area, 6.2% ($8,490,600) and the east sub-area, 1.5% ($2,014,860) complete the construction dollars expended for single-family construction for 2002. Of the single-family units added citywide, 44.9% were valued between $150,000 and $300,000, 32.4% were valued between $50,000 and $150,000, 17.7% were valued between $300,000 to $500,000, 4.5% were valued above $500,000 and 0.5% were valued below $50,000. High-end construction for the most part is taking place in the Chenal (Chenal Ridge and Chenal Valley), Heights/Hillcrest, and Pinnacle Planning Districts. Of the units valued over $300,000, 92% or 116 units, were permitted in one of these districts. While in these same districts, 5.2% or 10 units of the less than $150,000 value units can be found. The Central sub-area experienced the only decrease in the average value of single-family units (0.4% or $1000) constructed over 2001 permit values. This is the only sub-area to experience a drop in average value for 2002. The West sub-area had by far the greatest value increase 17.1%. The West Central sub-area experienced an increase of over 25%. The average constructive value for single-family housing in the West and Central sub-areas is at least double that in the Southwest and East sub-areas.
Sub-area 1997 1998 1999 2000 2001 2002 West $174,429 $199,519 $203,664 $216,225 $243,844 $285,620 Central $211,082 $212,912 $278,351 $211,875 $266,315 $265,331 Southwest $111,304 $109,361 $107,852 $107,394 $121,220 $130,317 East $58,080 $25,632 $73,606 $99,405 $80,352 $83,953

Housing Construction Values
22
Construction Cost Single Family Homes Planning District
$500,000 & Greater
$300,000 - $499,999
$150,000 - $299,999
$50,000 - $149,999
Below $50,000
Total
1 0 4 12 6 0 22 2 0 0 0 0 0 0 3 0 6 2 5 0 13 4 2 5 3 2 0 12 5 0 0 0 0 0 0 6 0 0 0 0 0 0 7 0 0 0 0 0 0 8 0 0 2 13 1 16 9 0 0 0 7 0 7 10 0 0 0 6 1 7 11 0 0 3 13 1 17 12 0 0 11 38 0 49 13 0 0 0 4 0 4 14 0 0 0 0 0 0 15 0 0 0 7 0 7 16 0 0 30 64 0 94 17 0 0 2 0 0 2 18 0 3 23 14 0 40
19.1 22 71 90 1 0 184 19.2 0 9 74 7 0 90 20 2 5 9 0 0 16 25 0 0 0 1 0 1
Total 26 103 261 188 3 581
Affordable Housing
23
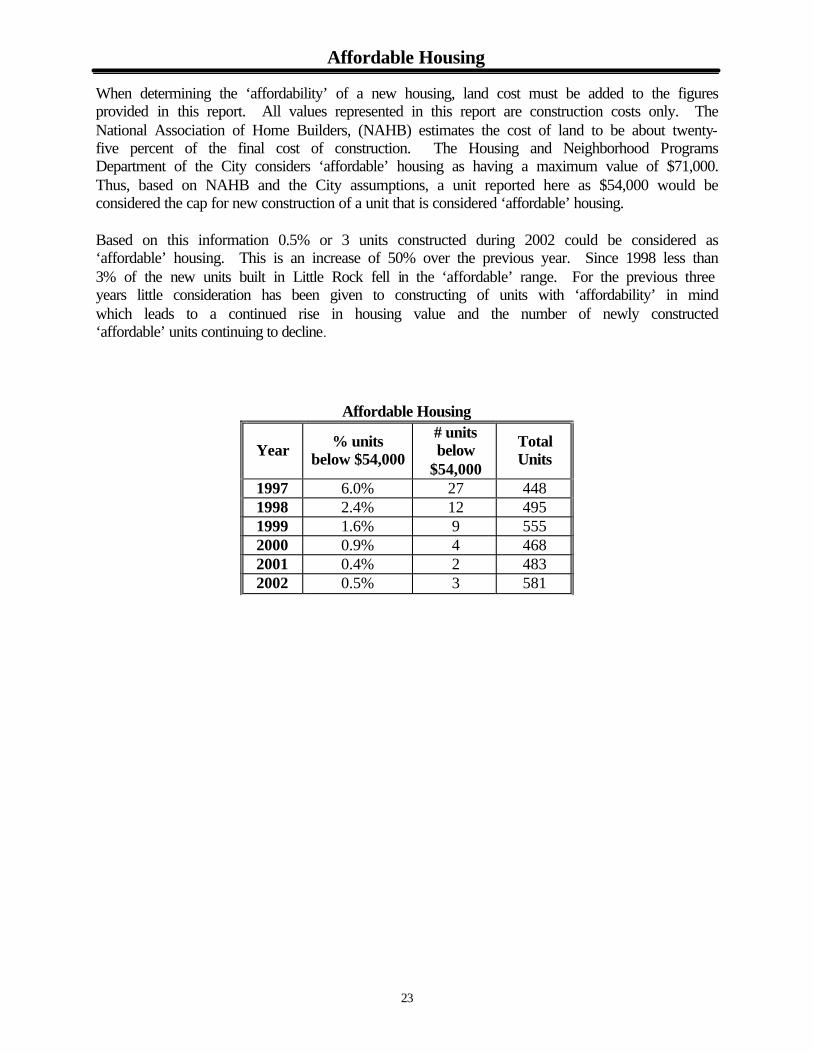
When determining the ‘affordability’ of a new housing, land cost must be added to the figures provided in this report. All values represented in this report are construction costs only. The National Association of Home Builders, (NAHB) estimates the cost of land to be about twenty-five percent of the final cost of construction. The Housing and Neighborhood Programs Department of the City considers ‘affordable’ housing as having a maximum value of $71,000. Thus, based on NAHB and the City assumptions, a unit reported here as $54,000 would be considered the cap for new construction of a unit that is considered ‘affordable’ housing. Based on this information 0.5% or 3 units constructed during 2002 could be considered as ‘affordable’ housing. This is an increase of 50% over the previous year. Since 1998 less than 3% of the new units built in Little Rock fell in the ‘affordable’ range. For the previous three years little consideration has been given to constructing of units with ‘affordability’ in mind which leads to a continued rise in housing value and the number of newly constructed ‘affordable’ units continuing to decline.
Affordable Housing
Year % units below $54,000
# units below
$54,000
Total Units
1997 6.0% 27 448 1998 2.4% 12 495 1999 1.6% 9 555 2000 0.9% 4 468 2001 0.4% 2 483 2002 0.5% 3 581

Residential Renovations/Additions
24
Reinvestment in Little Rock neighborhoods can be illustrated by the amount of renovation and addition activity within the neighborhoods. During 2002 reinvestment totaled in excess of $17 million dollars. The east sub-area had the greatest number of permitted projects with 285 (35.4%). The central and east sub-areas had twice the activity of that in the west and southwest sub-areas. Approximately 70.6% of the permits were issued in one of these two sub-areas. With approximately $12.9 million of the $17.9 million dollars (or 72%) spent for reinvestment occurring in these sub-areas, they are the dominant part of the reinvestment market. It is worth noting that 50.6% of all reinvestment occurred in the central sub-area. The central sub-area accounts for 49.7% of the permits for additions occurred and 69.2% of the dollars were spent. This indicates a strong desire amount of residents in this area to keep and improve the housing stock. The other active sub-area (east) was dominated by renovations rather than additions. While it is a positive sign to see this reinvestment, it can be only to ‘bring the housing up to code’. The ‘addition’ part of the renovation picture gives the clearest view of the desire to reinvest (since renovation can be to make repairs, maintain value, rather than increase the value for the home). To the east sub-area accounted for only 4% of the addition (dollars) but over 37.5% of the renovation (dollars). Multi-Family Renovations The areas, which experienced the largest number of permitted projects were the central and southwest sub-areas. However, the central and east sub-areas have by-far the most dollars spent. The east sub-area had almost as much activity in dollars ($3,769,488) but only a third of the permits (14 to 42). Almost $3.8 million dollars was spent in each the east sub-area with $2.3 million in the central sub-area, the remaining sub-areas experienced less than a half million each. The west and southwest sub-areas each experienced multi-family reinvestment to a lesser degree ($491,700 and $498,747 respectively). Single-Family Additions Single-family additions were concentrated in the central sub-area. Citywide 155 permits were issued for a total of $6,956,349. The central sub-area accounted for 69.2% ($4,812,575) of the dollars permitted. The majority of the central sub-area permits and dollars were expended in the Heights/Hillcrest Planning District (54 permits and $3,540,195) and the West Little Rock Planning District (16 permits and $1,212,844). In the west sub-area 47 permits were issued for $1,695,903. The Chenal and Rodney Parham Districts accounted for 13 and 14 (respectively) of these permits with $558,795 and $488,185 (respectively). The number of permits issued for additions increased from 2001 levels (18.2%). Overall the average value of permits issued for additions increased by 45.4%.

Residential Renovations/Additions
25
Planning Single-Family Single-Family Multi-Family District Additions Renovations Renovations
Permits Avg. Value Permits Avg. Value Permits Avg. Value 1 6 $61,745 27 $29,187 0 $0 2 14 $34,870 25 $11,542 6 $81,950 3 16 $75,803 62 $21,416 2 $3,000 4 54 $65,559 105 $22,167 17 $116,788 5 0 $0 11 $67,911 3 $62,000 6 2 $14,000 7 $5,747 0 $0 7 0 $0 10 $8,330 0 $0 8 3 $20,667 133 $15,940 8 $431,536 9 11 $14,350 92 $8,709 3 $43,733 10 7 $6,615 39 $8,058 23 $13,565 11 6 $24,083 14 $7,903 0 $0 12 4 $20,355 17 $8,186 0 $0 13 2 $5,000 17 $7,597 8 $6,125 14 1 $30,000 15 $10,984 18 $14,319 15 3 $6,367 23 $12,454 14 $13,714 16 1 $25,000 5 $17,300 0 $0 17 0 $0 0 $0 0 $0 18 8 $16,744 8 $15,074 0 $0
19.1 5 $68,979 8 $19,037 0 $0 19.2 8 $26,738 19 $13,707 0 $0 20 0 $0 1 $7,000 0 $0 21 0 $0 0 $0 0 $0 22 0 $0 0 $0 0 $0 23 0 $0 0 $0 0 $0 24 1 $12,000 7 $3,775 0 $0 25 3 $7,500 5 $11,300 0 $0 155 $44,880 650 $15,996 102 $69,248

Residential Renovations/Additions
26
Single Family Renovations
Single Family Additions

Demolition Activity
27
The net change in residential units for 2002 was an increase of 715 residential units. With the exception of the east all the cities sub-areas experienced increases in net units added. Seven of the City’s thirty planning districts experienced net losses of residential units during 2002. The Downtown, I-30 and College Station Districts all went from neutral to negative in 2002. The Heights/Hillcrest is the only district to go from negative to positive growth in units. The remaining four districts were negative both years (East Little Rock, Central Little Rock, I-630, and Geyer Springs East). During 2002, only two of the planning districts experienced double digit net loss in the number of housing units. The Central City Planning District lost a net of 21 units and the I-630 Planning District lost a net of 16 units. Both had double-digit losses in 2001. The Central City district loss in units remained constant at approximately 20 residential units, while the I-630 District improved to a loss of 16 units rather than 26 units. The losses in 2002 were generally single-family homes, with only nine of the 104 units lost not being single-family. Of these nine units four were duplex units and the remaining five were in one structure. Most of the loss in the East Little Rock District is for airport expansion. (Some may consider this loss not to be negative.) The loss of so many single-family homes may have negative impacts in the future, resulting in the deterioration of additional homes in the area. In the last few years the City of Little Rock has started programs to protect the remaining housing stock with the hopes of negating these impacts. While no district lost over 21 units, the fact that the two highest are in the same area as previous years and an older part of Little Rock draws notice. These two districts (Central City and I-630) not only are the high loss districts for 2002 but for the last decade. There were a total of twenty-three units permitted in these districts while 70 were demolished. It is noteworthy that the number of new units in these districts doubled, while the number of units removed remained steady. Efforts need to be redoubled to stabilize and re-energize these neighborhoods if the loss of housing stock is to be stopped in the core.
Residential Units Change
Planning District Units Added
Units Demo Net
1 River Mountain 42 2 40 2 Rodney Parham 0 0 0 3 West Little Rock 19 0 19 4 Heights/Hillcrest 14 11 3 5 Downtown 0 1 -1 6 East Little Rock 0 8 -8 7 I-30 0 3 -3 8 Central City 16 37 -21 9 I-630 7 23 -16 10 Boyle Park 187 3 184 11 I-430 17 2 15 12 65th Street West 49 1 48 13 65th Street East 4 0 4 14 Geyer Springs E. 0 2 -2 15 Geyer Springs W. 29 3 26 16 Otter Creek 94 4 90 17 Crystal Valley 2 0 2 18 Ellis Mountain 48 1 47 19.1 Chenal Valley 184 0 184 19.2 Chenal Ridge 90 2 88 20 Pinnacle 16 0 16 21 Burlingame 0 0 0 22 West Fourche 0 0 0 23 Arch Street Pike 0 0 0 24 College Station 0 1 -1 25 Port 1 0 1 Total 819 104 715

Demolition Activity
28
Single-Family Units Removed
Single Family Unit Change
Sub-Area Units Added
Units Demo Net
West 369 7 362 Central 32 9 23 Southwest 156 10 146 East 24 69 -45
Pla
nnin
g D
istr
ict
1992
1993
1994
1995
1996
1997
1998
1999
2000
2001
20
02
Tot
al
1 2 2 3 1 1 0 2 1 2 1 2 17 2 1 1 0 0 0 3 0 1 0 0 0 6 3 0 1 2 3 0 3 1 2 1 0 0 13 4 6 2 7 2 4 12 8 11 10 13 6 81 5 5 2 10 2 4 3 7 20 5 0 1 59 6 42 13 6 7 14 5 5 3 25 21 8 149 7 13 5 3 8 6 6 5 3 17 1 3 70 8 95 113 75 52 49 38 34 62 61 27 33 639 9 63 84 33 27 31 46 28 24 30 29 23 418 10 6 8 4 5 5 1 2 5 8 5 3 52 11 5 2 0 0 8 1 1 0 2 1 2 22 12 1 0 0 4 2 0 0 3 0 3 1 14 13 0 64 1 0 1 2 2 1 2 0 0 73 14 6 2 1 3 2 2 1 1 10 3 2 33 15 5 1 1 11 1 3 1 3 0 2 3 31 16 1 0 2 2 2 1 0 1 0 1 4 14 17 0 0 0 0 0 0 0 0 0 0 0 0 18 0 1 0 1 0 1 0 0 0 0 1 4 19 2 0 0 3 0 2 1 0 2 0 0 10 22 0 0 0 0 0 0 0 0 0 0 0 0 23 0 0 0 0 0 0 1 0 0 0 0 1 24 1 1 2 1 1 2 0 0 1 2 1 12 25 0 0 0 0 1 3 2 1 2 0 0 9
Total 254 302 150 132 132 134 101 142 178 109 93 1727

Office Activity
29
During 2002, the square footage of new office space added decreased by 75% over 2001. This level of added square footage sets a new low. The total square footage permitted in 2002 was less than 100,000. The number of permits issued also decreased (20 permits in 2001, 11 permits in 2002). In 2002 the total construction cost ($9,229,585) is likewise a decline, to levels seen only twice before over the last decade and a half. The west sub-area accounted for the majority of office activity with 68,109 square feet. The east sub-area accounted for 19,250 square feet, the central sub-area accounted for 7,000 square feet and the southwest sub-area permitted 5,400 additional square feet. Only one building was permitted with over 25,000 square feet and that was for the administration offices of Fellowship Bible Church in the Rodney Parham Planning District. The year 2002 was one with little office activity. What new activity occurred was for small professional office buildings of 5000 to 8000 square feet.
Building Permits – Office Year Permits Sq. Ft. Cost 1990 9 297,477 $18,700,000 1991 9 169,970 $8,794,600 1992 6 249,216 $12,660,000 1993 6 158,206 $8,327,700 1994 12 594,340 $30,625,838 1995 14 286,923 $10,576,200 1996 15 1,204,450 $37,458,666 1997 15 903,984 $10,906,990 1998 29 454,250 $29,764,837 1999 26 371,382 $21,483,887 2000 24 1,710,683 $116,819,784 2001 20 399,011 $22,173,454 2002 11 99,759 $9,229,585
Office Projects Permitted in excess of 25,000 square feet Project Location Sub-area Sq. Ft.
Fellowship Bible Church 1901 Napa Valley Road west 36,000

Office Activity
30
New Office Activity
New Office Activity

Office Vacancy Rate
31
Vacancy Rates are based on 2002 data furnished by Arkansas Business – 2002 Guide to Central Arkansas Commercial Real Estate. It is important to note that the occupancy rates should not be used as a direct comparison from year to year and comparisons must remain general. The survey is a self-selecting non-verified questionnaire. This information is supplied to give an overview of the occupancy rates within the city. The 2002 Lease Guide includes listings on 227 office properties within Little Rock. Arkansas Business made no effort to validate the survey responses. For more information contact Gwen Mortiz, Editor-In-Chief – Arkansas Business at 501-372-1443. Arkansas Business found that the metropolitan occupancy rate softened slightly, two percentage points (87% to 85%). The survey had seen a flat or no change situation for several years. The annualized occupancy rates for the Little Rock sectors (shown below) have experienced varying changes.
All the sub-areas maintained similar leasable areas, with the exception of the southwest sub-area. The leasable area in the southwest sub-area returned to its 2000 level. As for the occupancy rates, the east sub-area was the weakest at approximately 83 percent. This is a point and a half drop. The central sub-area maintained its 90 to 91 percent occupancy and the southwest sub-area strengthened significantly from around 83 to almost 90 percent occupancy. The west sub-area experienced an almost 4 percentage point drop in occupancy. Only the east sub-area was not significantly better than the survey showed the metropolitan area at 85 percent. A few new office projects came on line in 2002 with several more to be completed over the next year or two. Most of these new office buildings are in the west or east (near Downtown) sub-areas. They are mostly being built by the user for their use, not as general office buildings. This growth, while overall vacancy rates improve or hold steady, is a positive sign of growth.
Office Market
Sub-area Total
Leasable Space
Average Occupancy
Rate East 5,089,802 82.9% Central 1,590,124 90.2% Southwest 421,099 89.9% West 2,990,379 87.8%

Commercial Activity
32
The total of new commercial construction in 2002 amounted to 231,895 square feet of commercial space added to the City. This represents a decrease of 31% in square footage added from that in 2001. The number of projects permitted is basically the same as that in 2001 (20 projects versus 22 projects in 2001). Construction values increased 3.1% from 2001 values. In 2002, $17,981,631 construction dollars were permitted compared to $17,434,611 in 2001. The southwest sub-area captured the majority of the new commercial development with 118,126 square feet added. In addition, a hotel was permitted in the southwest sub-area. One project (Rave Theater) accounted for 80 percent of the added square-footage in the southwest sub-area (and 14 percent of all the area added in Little Rock). The west sub-area followed with the addition of 64,638 square feet and one less project. In the east sub-area there were five projects with a total of 39,381 square feet. Commercial activity as with office for the year 2002 was limited to small developments, mostly in the 2500 to 8000 square foot size.
Building Permits – Commercial Year Permits Sq. Ft. Cost 1990 41 905,670 $31,353,969 1991 22 262,942 $8,134,940 1992 24 329,715 $10,358,569 1993 32 794,548 $20,106,738 1994 56 582,508 $24,223,325 1995 50 744,336 $25,061,532 1996 53 3,321,000 $68,384,102 1997 38 2,100,340 $32,916,260 1998 29 419,669 $21,048,399 1999 26 348,112 $12,695,827 2000 20 315,873 $15,983,521 2001 22 336,692 $17,434,611 2002 20 231,895 $17,981,631
Commercial Projects Permitted in excess of 20,000 square feet Project Location Sub-area Sq. Ft.
Rave Theater 18 Colonel Glenn Plaza southwest 95,000 North Point Auto 1500 N. Shackleford Road west 24,500

Commercial Activity
33
New Commercial Activity
New Commercial Activity

Commercial Vacancy Rate
34
“Occupancy in the Greater Little Rock retail market during 2002 fell to its lowest level in 16 years. The drop to 83.4 percent the lowest since, Arkansas Business began surveying retail space.” (Arkansas Business Lease Guide 2002)
The occupancy rate information provided is based on 2002 data furnished by Arkansas Business Lease Guide 2002. It is important to note that the occupancy rates should not be used as a direct comparison from year to year and comparisons should remain general. The information is provided to give an overview of the occupancy rates within the City. The survey is a self-selecting survey, i.e. only those who respond are counted and there is no effort to validate the responses. For more information contact Gwen Mortiz, Editor-In-Chief - Arkansas Business at 501-372-1443.
With the significant decline in occupancies reported for the Metropolitan area, it is interesting to note the changes in sub-areas within Little Rock. The east and southwest sub-areas actually reported better occupancy rates than in 2001. This is the area east of University Avenue and I-30, south of I-630. The Metropolitan area dropped 3 percentage points, but these areas improved by 1 and 9 percentage points respectively. Little Rock’s west sub-area (west of Reservoir – John Barrow Roads and north of Colonel Glenn Road) experienced a similar decline to that of the Metropolitan area (almost 2 percentage points). The central sub-area, Reservoir Road to Downtown and north of I-630, experienced a 10 percentage point drop. Once the brightest spot in Little Rock, this area now has a similar occupancy rate to that in the other sub-areas. As noted by Arkansas Business much of the loss metropolitan wide has been due to the loss of regional or national retail outlets. It is worth noting the changes in “BIG BOX” retail and effects of national business decisions on Little Rock as well as the effects of local and smaller retailers. The central and west sub-areas continue to have most of the retail – approximately 77 percent. Therefore, the changes in these two sub-areas will guide the numbers for the city as a full. The most interesting change reported by this years figures is the 42 percent increase in reported leasable space in the southwest sub-area with a 9 percentage point improvement in the occupancy rate for this sub-area.
Commercial Market
Sub-area Total
Leasable Space
Average Occupancy
Rate East 685,380 72.9% Central 2,157,278 80.7% Southwest 770,426 81.4% West 2,645,477 84.4%

Industrial Activity
35
A total of 150,235 square feet of industrial projects was permitted during 2002 in the city. This represents a 71.7% increase over the square feet permitted during 2001. The total number of projects increased slightly, by two from 2001 levels. There were only 9 projects permitted for a total of 150,235 square feet. The value of new construction increased 328.7 percent from $1,482,000 in 2001to $6,353,680 in 2002, a return to more typical levels of the last few years. During the previous year, the east sub-area permitted the majority of the industrial projects. The east and southwest sub-areas accounted for all of the new industrial projects. The east sub-area had twice the projects as that in the southwest sub-area, with approximately five times the dollars spent ($1 to $5 million). The east sub-area had the greatest number of square feet added with 129,685 square feet. All four of the largest industrial projects permitted were in the east sub-area.
Building Permits – Industrial Year Permits Sq. Ft. Cost 1992 6 584,127 $18,596,851 1993 1 56,400 $750,000 1994 6 91,288 $2,042,624 1995 4 108,750 $2,511,400 1996 3 43,250 $2,221,000 1997 7 513,346 $6,968,001 1998 13 308,464 $26,782,784 1999 18 395,022 $7,622,214 2000 19 382,138 $8,714,609 2001 7 87,502 $1,482,000 2002 9 150,235 $6,353,680
Industrial Projects Permitted in excess of 15,000 square feet Project Location Sub-area Sq. Ft.
Western Foods 4717 Asher Avenue east 67,547 Moon Distributing 2801 Vance east 26,000 Wes-Pak Inc 9100 Frazier Pike east 18,218 Central Transportation Int’l 6501 Sloane Drive east 17,920

Industrial Activity
36
New Industrial Activity
New Industrial Activity

Warehouse Vacancy Rate
37
Due to the nature of industrial/warehouse properties, some fully occupied properties are often not reported. The vacancy rate may trend high as a result of this characteristic. In the 2002 Arkansas Business Lease Guide, the amount of space reported in approximately the same for the central, southwest and west sub-areas. However the east sub-area is reporting 43.3 percent less area. There has not been a loss of over 40 percent of the warehouse/industrial space in the east sub-area. It is reasonable to assume that some space fully occupied in 2002 was not reported in the 2002 Lease Guide.
All four sub-areas are reporting lower occupancy rates. The central and southwest sub-areas are showing a 5 and 4 percent decline respectively. Both the east and west sub-areas had significant drops in occupancy rate of more than 10 percentage points. Of all the reported changes the west sub-area is the most noteworthy, due to the no change in area but the 17 percentage point drop in occupancy. Since this is a self-selecting survey it may over represent vacancies. This would be because the real estate agents are trying to advertise availability of space. Both the 2001 and 2002 surveys found approximately 1.4 million square feet were available. This no change in available area is as important if not more so than the changes reported in each sub-area. It shows stability. It is important to note that the occupancy rates should not be used as a direct comparison from year to year and comparisons must remain general. This information is supplied to give an overview of the occupancy rates within the City. The 2002 Lease Guide includes listings on 92 warehouse properties. Arkansas Business made no effort to validate the survey responses. For more information contact Gwen Moritz, Editor-In-Chief- Arkansas Business at (501)-372-1443.
Warehouse Market
Sub-area Total
Leasable Space
Average Occupancy
Rate East 1,064,469 47.3% Central 853,746 91.2% Southwest 1,981,921 74.2% West 652,674 59.4%

Annexation Activity
38
The City accepted one annexation, totaling 5.34 acres in 2002. The “Rolling Pines Annexation” was the result of a property owner’s request to be included into the corporate limits to receive city services. The owner proposes to develop a multi-family development for elder individuals on the 5.34 acres included in this annexation. The City Limits moves south to the county line on the west side of Heinke Road as a result of this action. In addition, the full length of Heinke Road in Pulaski County now is in the City Limits. Areas presented in the table are based on the area generated using legal descriptions for each area. With the acceptance of this annexation, the current city limits of Little Rock included 118.9 square miles. This is an increase of 43.9% from 1980 and a 11.2 percent increase over the total square miles in 1990. The period of aggressive annexation activity experienced from 1979 through 1985 appears to be over. When reviewing the historical record of Little Rock growth, large expansions occurred in the mid-1950s and again in the late 1970s. It is a second surge in the early to mid-1980s that makes the growth change noticeable to people today. Since the middle 1980s, Little Rock’s growth in area has followed a similar line as that from the mid-1940s to mid-1950s and the early 1960s to the mid-1970s.
Year Cases Annexed Acres
City Limits
Sq. Miles 1970 3 1291.881 50.933 1971 4 68.495 51.040 1972 7 196.349 51.347 1973 10 456.226 52.060 1974 4 708.133 53.166 1975 10 430.023 53.838 1976 7 67.415 53.943 1977 8 1514.043 56.309 1978 29 2369.991 60.012 1979 41 12526.042 79.584 1980 10 1951.289 82.633 1981 9 608.971 83.585 1982 7 367.945 84.159 1984 10 364.905 84.730 1985 4 8746.251 98.396 1986 1 21.244 98.429 1987 5 446.156 99.126 1989 1 2176.691 102.527 1990 2 2781.279 106.873 1991 1 686.131 107.945 1993 5 1093.291 109.653 1994 3 1942.767 112.689 1995 1 72.482 112.802 1996 8 695.018 113.888 1997 2 820.152 115.169 1998 3 247.644 115.556 1999 1 1229.616 117.478 2000 2 328.057 117.990 2001 2 566.858 118.876 2002 1 5.34 118.884

Subdivision Activity
39
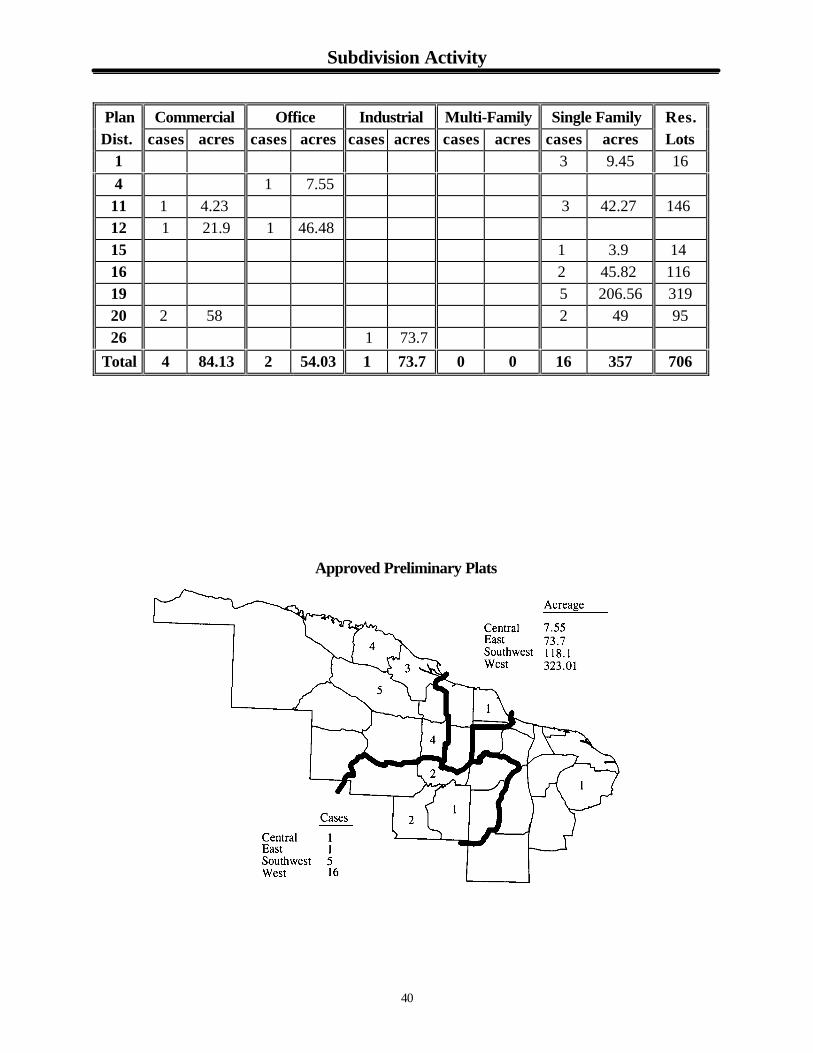
A review of subdivision plat activity is a good measure of likely development over the next year. The maps and table show the locations of Planning Commission approved preliminary plats. This indicates a majority of development activity will likely occur in the west sub-area of the city. In the east and central sub-areas only one case, each was filed for 73.7 and 7.55 acres respectively. In the west sub-area 16 cases and in the southwest sub-area 5 preliminary plat cases were approved by the Planning Commission. By far the west sub-area had the greatest activity with over 323 acres in 16 plats, while the southwest sub-area showed some activity with 118 acres in 5 cases. The central and east sub-areas are for the most part developed leaving little platting activity to occur. It should be noted that the one preliminary plat in the east sub-area is outside the City, adjacent to the Port Industrial Park. This area has been developing over the past fifty years. The west sub-area area (west of I-430) did not begin to develop until the 1960’s. The number of approved preliminary plats decreased from 24 in 2001 to 23 in 2002. The total acreage in 2002 was down from 1397.89 to 522.36 acres. Non-residential activity experienced only slight changes in numbers. In 2001, nine plats were approved while seven plats were approved in 2002. The total acreage platted went from 104.7 acres to 211.9 acres (doubling). Commercial acreage dropped ten acres from 94 to 83 acres, while both office and industrial acreages increased 52 acres and 65 acres respectively. However residential platting activity, saw little change from 15 plats to 16 plats. Multi-family went from 1 plat of 10 acres to no activity. Single family acreage returned to 2000 levels at 357 acres from over 1,280 acres in 2001. Residential lots decreased significantly from 1116 approved in 2001 to 706 residential lots approved in 2002. This is a 37 percent decrease in the number of lots platted. This drop may forecast a potential slowdown in residential development activity citywide, with only minor changes for non-residential activity. The southwest sub-area approvals included: one case for a total acreage of 68.38 of Commercial or Office (21.9 and 46.48 respectively); three cases for a total of 49.72 acres of Single-Family and 130 residential lots. The west sub-area approvals included: three cases for a total of 62.23 acres of Commercial; thirteen cases for a total of 307.28 acres of Single-Family and 576 residential lots. The preliminary plat activity in the east sub-area was associated with activity near the Port Industrial Park. One case, for a total of 73.7 acres of Industrial property, was preliminary platted. The majority of the Single-Family residential approved preliminary plat cases were located in the west sub-area (13 cases) and 86% of the acreage was located in the west sub-area. The east and central sub-areas had no residential preliminary plat activity. The only other area with residential activity was the southwest sub-area with 3 cases and 49.7 acres (14% of the residential acreage).
Subdivision Activity
40
Approved Preliminary Plats
Plan Commercial Office Industrial Multi-Family Single Family Res. Dist. cases acres cases acres cases acres cases acres cases acres Lots
1 3 9.45 16 4 1 7.55 11 1 4.23 3 42.27 146 12 1 21.9 1 46.48 15 1 3.9 14 16 2 45.82 116 19 5 206.56 319 20 2 58 2 49 95 26 1 73.7
Total 4 84.13 2 54.03 1 73.7 0 0 16 357 706

Final Plat Activity
41
The number of final plats decreased during 2002, however the acreage increased from the 2001 rates. In 2002, 70 cases for a total of 444.74 acres were final platted. This is compared to 73 cases and 433.17 acres in 2001 representing a 4 percent decrease in cases and a 2.7 percent increase in acreage. Signed final plat activity has been concentrated in the west sub-area with 39 final plats recorded with 213.55 acres. The southwest sub-area each had 15 cases with 132.10 acres. These two sub-areas represent 77% of the cases and 77.7% of the area final platted in 2002. The table and maps indicate more specifically the Planning District where the strongest activity is occurring. Activity in the west sub-area decreased in the total number of cases final platted. (In 2001, 42 cases were final platted and in 2002, 39 cases were final platted.) The southwest sub-area stayed constant for the number of cases, but the land area final platted tripled. The central sub-area decreased in number of cases (40%) and area (by a quarter). Only the east sub-area experienced an increase in cases from 1 to 7 and area from just over an acre to over 88 acres.
Approved Final Plats
Plan Final Plat Dist. cases acres
1 9 35.01 3 4 6.18 4 1 0.23 5 1 0.23 6 1 3.34 8 1 2.08 9 2 0.58 10 4 4.31 11 1 3.29 15 3 12.02 16 9 22.58 17 3 97.5 18 7 57.88 19 16 100.17 20 6 17.20 24 1 8.12 25 1 74.02
Total 70 444.74

Zoning Activity
42
In 2001 there were 34 cases with a total of 387 acres, while only eleven cases were approved in 2002 with 53.7 acres. The City saw the number of approved cases fall to one-third that of the previous year and the acreage reclassified drop 86 percent. Almost all the ‘regular’ rezoning occurred in southwest Little Rock, 73 percent of the cases. However most of the land area rezoned was in west Little Rock. No land in central or east Little Rock was reclassified in 2002. Just under a third of the area reclassified was to single-family. This accounts for all but one of the non-southwest Little Rock cases. All of the single-family down-zoning was from other residential classes (MF 12, MF 6, PRD). The one non-residential reclassification outside of southwest Little Rock was from ‘C2’ to ‘C3’. The two cases in District 12 were really one case converting a POD to ‘C3’ and ‘O3’, with not a great deal of difference in use pattern from the approved ‘POD’. Planned Zoning District (PZD) activity increased during the 2002 reporting period over the 2001 request and acreage. During 2001, 39 cases were approved as PZD’s for a total of 98.9 acres. During 2002 there were 61 cases and 280.47 acres approved. This is an increase of 56% in the number of cases and 183% in the area involved. The west sub-area each captured 47.5% of the approved PZD cases of the City. The central sub-area followed with approximately 28 % of the cases. The southwest sub-area captured 16.4% of the PZD activity, with the east sub-area capturing 8.2% of the activity. Acreage distribution by percentage indicates the west sub-area accounted for almost 66%, southwest sub-area 19%, the central sub-area 13.2% and the east sub-area 1.5%. To get a complete view of the zoning activity, one needs to look at both PZD and regular reclassification. For 2002 there was a drop (excluding the two city rezonings) in both cases and area reclassified. Figures show a slight decline of 1.4 percent in cases from 73 to 72 and a 31 percent drop in area reclassified from 486 to 334 acres. The table and map of rezoning and PZD approved cases show the areas most likely to develop in 2003 or soon then after. Because of the nature of PZD request, these are projects likely to be developed in the near term. Based on the information provided by the graphic and the table, the majority of growth should take place in the west sub-area. The southwest and central sub-areas will also experience growth, the east sub-area continues to grow but at a slower rate.

Zoning Activity
43
Commercial Office Multi-Family Single-Family Planning District cases acres cases acres cases acres cases acres
12 1 3.28 1 9.71 13 2 4.47 15 1 0.34 16 2 10.52 1 2.5 18 2 14.82 20 1 8.04
Total 7 26.65 1 9.71 0 0 3 17.32
Approved Rezonings

Zoning Activity
44
Approved PZD’s
PZD Activity
Planning Commercial Office Industrial Residential District cases acres cases acres cases acres cases acres
1 1 5.99 3 6.64 2 14.53 3 2 0.86 1 2.72 4 3 1.61 1 0.20 3 0.82 7 1 0.45 8 1 0.64 1 2.05 9 1 0.96 1 0.15 10 4 14.29 3 17.4 11 4 34.79 1 9.35 1 10.33 14 2 4.43 1 0.6 15 1 1.95 1 4.9 16 1 3.77 1 26.14 2 10.35 17 1 1.57 18 2 19.74 3 19.69 3 33.88 19 3 5.26 4 13.14 1 9.6 20 1 1.67
Total 25 93.78 18 70.26 2 27.1 16 89.33

45
Planning and Development Staff - 2003 Jim Lawson, Director
Venita Young, Administrative Assistant
Planning Division Walter Malone – Mgr. Alice Anderson Quenton Burge Vince Hustead Brian Minyard Dennis Webb Tom Wiles
Zoning and Subdivision Division Dana Carney – Mgr. Bob Brown Alice Chalk Jan Giggar Darrell Holladay Donna James Kenneth Jones Janet Lampkin Christy Marvel Monte Moore Darian Pellicciotti Kenny Scott Kelly Smith David Stowe
Building Codes Division Chuck Givens – Mgr. Mary Bracey Ronnie Campbell Arnold Coleman Charles Fulmer Dennis Johnson Rex Lyons Richard Maddox David McClymont Jerry Nash Ronyha O’Neal-Champ Ed Osborn Britt Palmer Jerry Spence Terry Steele Gerard Walsh Mark Whitaker Paul Whitten