Embed Size (px)
Citation preview
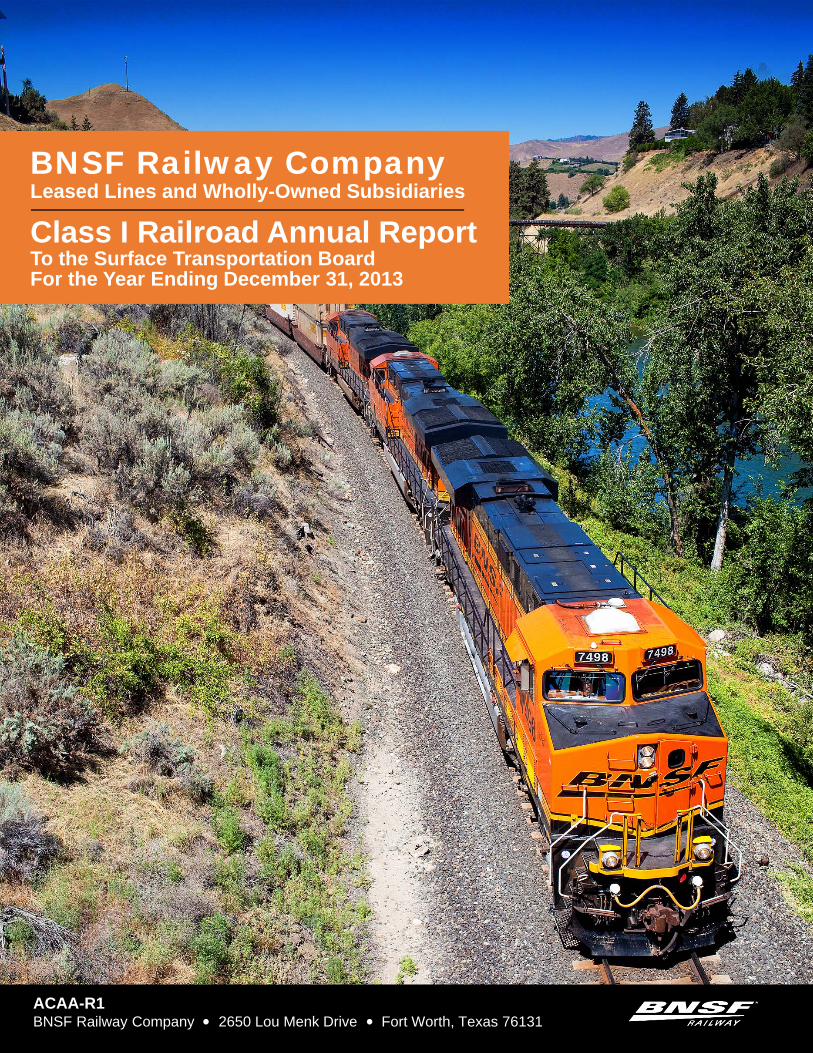
BNSF Railway CompanyLeased Lines and Wholly-Owned Subsidiaries
Class I Railroad Annual ReportTo the Surface Transportation BoardFor the Year Ending December 31, 2013
ACAA-R1BNSF Railway Company 2650 Lou Menk Drive Fort Worth, Texas 76131
NOTICE
1. This report is required for every class I railroad operating within the United States. Three copies of this AnnualReport should be completed. Two of the copies must be filed with the Surface Transportation Board, Office ofEconomics, Environmental Analysis, and Administration, 395 E Street, S.W. Suite 1100,Washington, DC 20423, by March 31 of the year following that for which the report is made. One copy should beretained by the carrier.
2. Every inquiry must be definitely answered. Where the word "none" truly and completely states the fact, itshould be given as the answer. If any inquiry is inapplicable, the words "not applicable" should be used
3. Wherever the space provided in the schedules in insufficient to permit a full and complete statement of therequested information, inserts should be prepared and appropriately identified by the number of the schedule.
4. All entries should be made in a permanent black ink or typed. Those of a contrary character must be indicatedin parenthesis. Items of an unusual character must be indicated by appropriate symbols and explained in footnotes.
5. Money items, except averages, throughout the annual report form should be shown in thousands of dollarsadjusted to accord with footings. Totals for amounts reported in subsidiary accounts included in supportingschedules must be in agreement with related primary accounts. For purposes of rounding, amounts of $500 butless than $1,000 should be raised to the nearest thousand dollars, and amounts of less than $500 should belowered.
6. Except where the context clearly indicates some other meaning, the following terms when used in this Formhave the following meanings:
(a) Board means Surface Transportation Board.
(b) Respondent means the person or corporation in whose behalf the report is made.
(c) Year means the year ended December 31 for which the report is being made.
(d) Close of the Year means the close of business on December 31 for the year in which the report is beingmade. If the report is made for a shorter period than one year, it means the close of the period covered by thereport.
(e) Beginning of the Year means the beginning of business on January 1 of the year for which the report isbeing made. If the report is made for a shorter period than one year, it means the beginning of that period.
(f) Preceding Year means the year ended December 31 of the year preceding the year for which the report ismade.
(g) The Uniform System of Accounts for Railroad Companies means the system of accounts in Part 1201 ofTitle 49, Code of Federal Regulations, as amended.
7. The ICC Termination Act of 1995 abolished the Interstate Commerce Commission and replaced it withthe Surface Transportation Board. Any references to the Interstate Commerce Commission or Commissioncontained in this report refer to the Surface Transportation Board.
8. Any references to the Bureau of Accounts or the Office of Economics contained in this report refer to the Officeof Economics, Environmental Analysis, and Administration of the Surface Transportation Board.
For Index, See Back of Form
THIS PAGE INTENTIONALLY LEFT BLANK
Road Initials: BNSF Year 2013
Name, official title, telephone number, and office address of officer in charge of correspondence withthe Board regarding this report.
(Name) Jon I. Stevens (Title)Vice President & Controller
(Telephone number) (817) 352-4975 (Area code) (Telephone number)
(Office address) 2500 Lou Menk Dr AOB 2, Fort Worth, Texas 76131 (Street and number, City, State, and ZIP code)
SURFACE TRANSPORTATION BOARD
FOR THE
YEAR ENDED DECEMBER 31, 2013
ANNUAL REPORT
OF
BNSF RAILWAY COMPANY
TO THE

THIS PAGE INTENTIONALLY LEFT BLANK
Road Initials: BNSF Year 2013
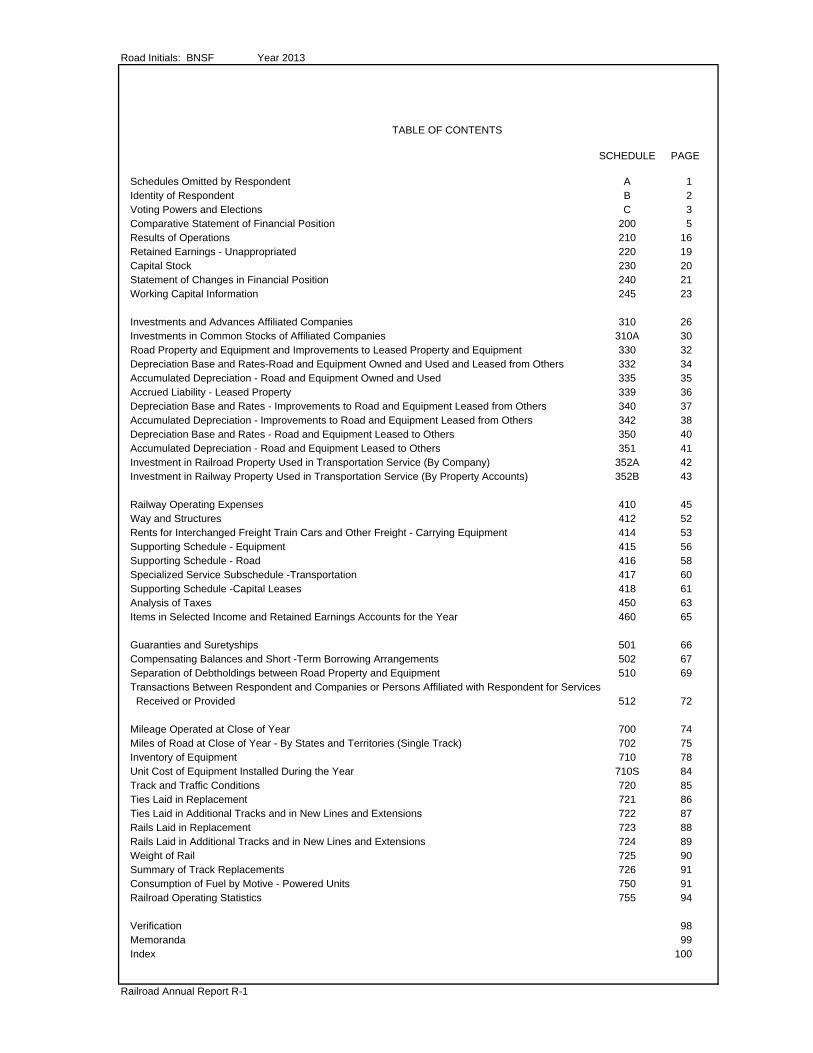
TABLE OF CONTENTS
SCHEDULE PAGE
Schedules Omitted by Respondent A 1Identity of Respondent B 2Voting Powers and Elections C 3Comparative Statement of Financial Position 200 5Results of Operations 210 16Retained Earnings - Unappropriated 220 19Capital Stock 230 20Statement of Changes in Financial Position 240 21Working Capital Information 245 23
Investments and Advances Affiliated Companies 310 26Investments in Common Stocks of Affiliated Companies 310A 30Road Property and Equipment and Improvements to Leased Property and Equipment 330 32Depreciation Base and Rates-Road and Equipment Owned and Used and Leased from Others 332 34Accumulated Depreciation - Road and Equipment Owned and Used 335 35Accrued Liability - Leased Property 339 36Depreciation Base and Rates - Improvements to Road and Equipment Leased from Others 340 37Accumulated Depreciation - Improvements to Road and Equipment Leased from Others 342 38Depreciation Base and Rates - Road and Equipment Leased to Others 350 40Accumulated Depreciation - Road and Equipment Leased to Others 351 41Investment in Railroad Property Used in Transportation Service (By Company) 352A 42Investment in Railway Property Used in Transportation Service (By Property Accounts) 352B 43
Railway Operating Expenses 410 45Way and Structures 412 52Rents for Interchanged Freight Train Cars and Other Freight - Carrying Equipment 414 53Supporting Schedule - Equipment 415 56Supporting Schedule - Road 416 58Specialized Service Subschedule -Transportation 417 60Supporting Schedule -Capital Leases 418 61Analysis of Taxes 450 63Items in Selected Income and Retained Earnings Accounts for the Year 460 65
Guaranties and Suretyships 501 66Compensating Balances and Short -Term Borrowing Arrangements 502 67Separation of Debtholdings between Road Property and Equipment 510 69Transactions Between Respondent and Companies or Persons Affiliated with Respondent for Services Received or Provided 512 72
Mileage Operated at Close of Year 700 74Miles of Road at Close of Year - By States and Territories (Single Track) 702 75Inventory of Equipment 710 78Unit Cost of Equipment Installed During the Year 710S 84Track and Traffic Conditions 720 85Ties Laid in Replacement 721 86Ties Laid in Additional Tracks and in New Lines and Extensions 722 87Rails Laid in Replacement 723 88Rails Laid in Additional Tracks and in New Lines and Extensions 724 89Weight of Rail 725 90Summary of Track Replacements 726 91Consumption of Fuel by Motive - Powered Units 750 91Railroad Operating Statistics 755 94
Verification 98Memoranda 99Index 100
Railroad Annual Report R-1
The dark borders on the schedules represents data that are captured by the Board.
Railroad Annual Report R-1
Road Initials: BNSF Year 2013
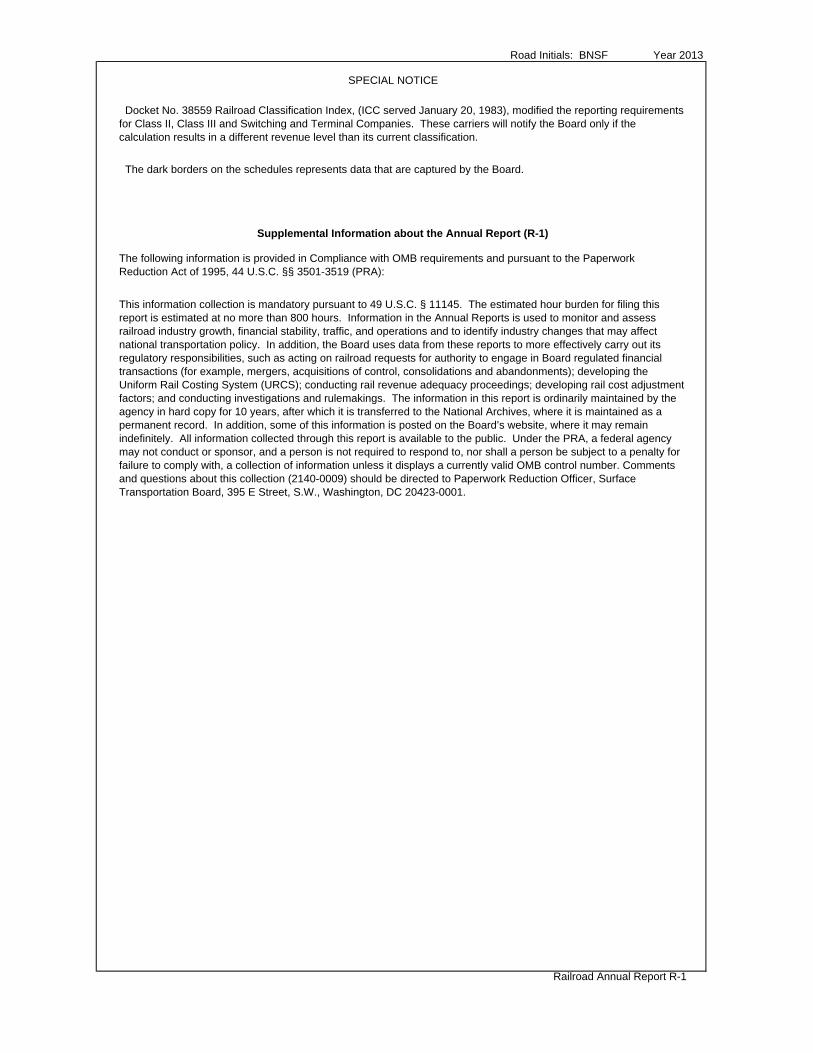
SPECIAL NOTICE
The following information is provided in Compliance with OMB requirements and pursuant to the Paperwork Reduction Act of 1995, 44 U.S.C. §§ 3501-3519 (PRA):
Supplemental Information about the Annual Report (R-1)
This information collection is mandatory pursuant to 49 U.S.C. § 11145. The estimated hour burden for filing this report is estimated at no more than 800 hours. Information in the Annual Reports is used to monitor and assess railroad industry growth, financial stability, traffic, and operations and to identify industry changes that may affect national transportation policy. In addition, the Board uses data from these reports to more effectively carry out its regulatory responsibilities, such as acting on railroad requests for authority to engage in Board regulated financial transactions (for example, mergers, acquisitions of control, consolidations and abandonments); developing the Uniform Rail Costing System (URCS); conducting rail revenue adequacy proceedings; developing rail cost adjustment factors; and conducting investigations and rulemakings. The information in this report is ordinarily maintained by the agency in hard copy for 10 years, after which it is transferred to the National Archives, where it is maintained as a permanent record. In addition, some of this information is posted on the Board’s website, where it may remain indefinitely. All information collected through this report is available to the public. Under the PRA, a federal agency may not conduct or sponsor, and a person is not required to respond to, nor shall a person be subject to a penalty for failure to comply with, a collection of information unless it displays a currently valid OMB control number. Comments and questions about this collection (2140-0009) should be directed to Paperwork Reduction Officer, Surface Transportation Board, 395 E Street, S.W., Washington, DC 20423-0001.
Docket No. 38559 Railroad Classification Index, (ICC served January 20, 1983), modified the reporting requirements for Class II, Class III and Switching and Terminal Companies. These carriers will notify the Board only if the calculation results in a different revenue level than its current classification.
Road Initials: BNSF Year 2013 1
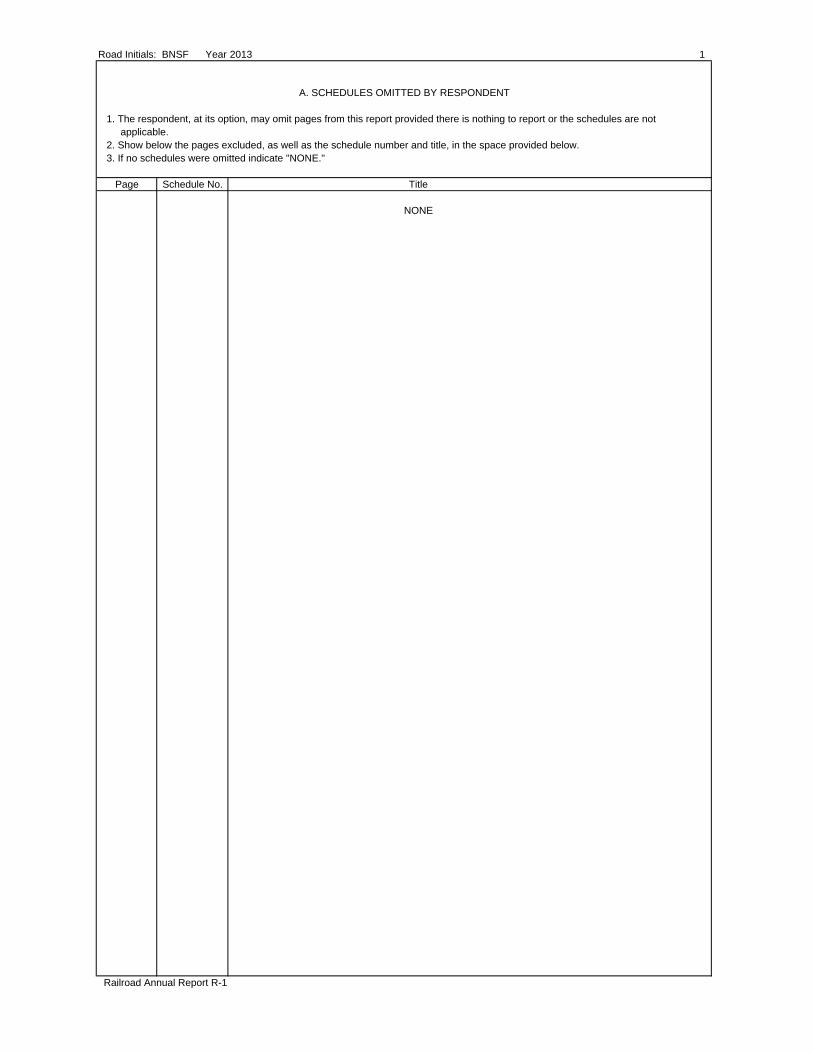
A. SCHEDULES OMITTED BY RESPONDENT
1. The respondent, at its option, may omit pages from this report provided there is nothing to report or the schedules are not applicable. 2. Show below the pages excluded, as well as the schedule number and title, in the space provided below. 3. If no schedules were omitted indicate "NONE."
Page Schedule No. Title
NONE
Railroad Annual Report R-1
2 Road Initials: BNSF Year 2013
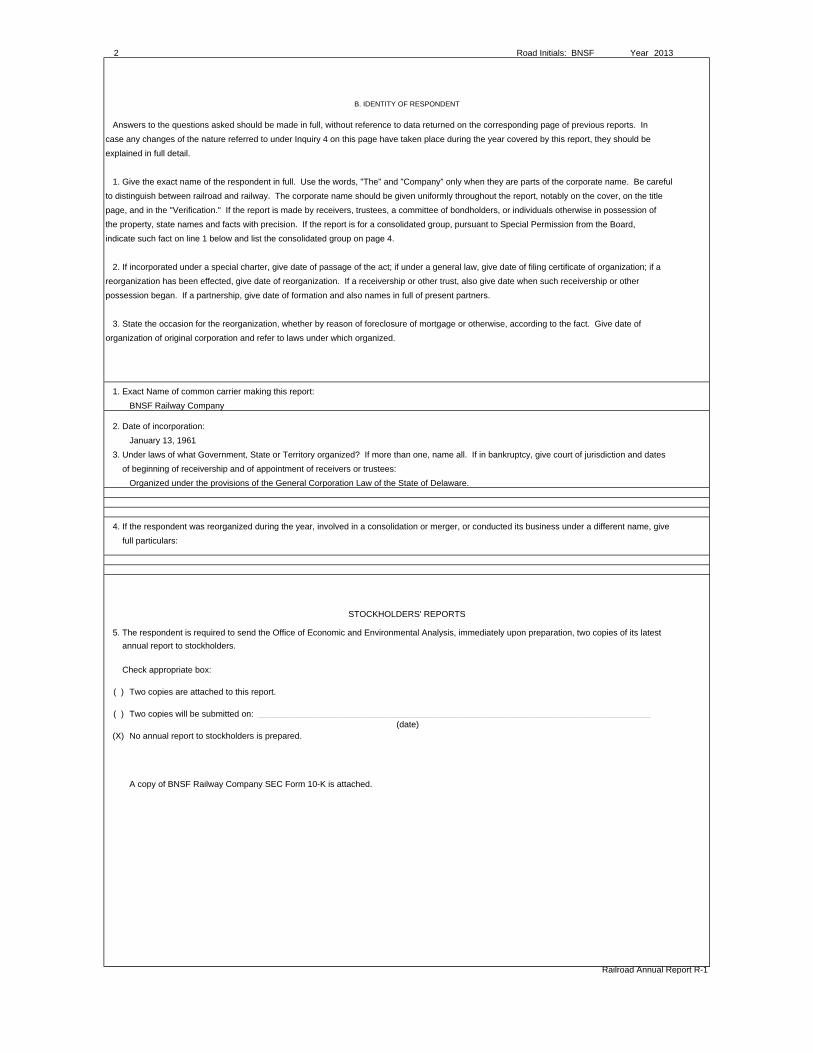
Answers to the questions asked should be made in full, without reference to data returned on the corresponding page of previous reports. In
case any changes of the nature referred to under Inquiry 4 on this page have taken place during the year covered by this report, they should be
explained in full detail.
1. Give the exact name of the respondent in full. Use the words, "The" and "Company" only when they are parts of the corporate name. Be careful
to distinguish between railroad and railway. The corporate name should be given uniformly throughout the report, notably on the cover, on the title
page, and in the "Verification." If the report is made by receivers, trustees, a committee of bondholders, or individuals otherwise in possession of
the property, state names and facts with precision. If the report is for a consolidated group, pursuant to Special Permission from the Board,
indicate such fact on line 1 below and list the consolidated group on page 4.
2. If incorporated under a special charter, give date of passage of the act; if under a general law, give date of filing certificate of organization; if a
reorganization has been effected, give date of reorganization. If a receivership or other trust, also give date when such receivership or other
possession began. If a partnership, give date of formation and also names in full of present partners.
3. State the occasion for the reorganization, whether by reason of foreclosure of mortgage or otherwise, according to the fact. Give date of
organization of original corporation and refer to laws under which organized.
1. Exact Name of common carrier making this report:
BNSF Railway Company
2. Date of incorporation:
January 13, 1961
3. Under laws of what Government, State or Territory organized? If more than one, name all. If in bankruptcy, give court of jurisdiction and dates
of beginning of receivership and of appointment of receivers or trustees:
Organized under the provisions of the General Corporation Law of the State of Delaware.
4. If the respondent was reorganized during the year, involved in a consolidation or merger, or conducted its business under a different name, give
full particulars:
5. The respondent is required to send the Office of Economic and Environmental Analysis, immediately upon preparation, two copies of its latest
annual report to stockholders.
Check appropriate box:
( ) Two copies are attached to this report.
( ) Two copies will be submitted on: __________________________________________________________________________________
(X) No annual report to stockholders is prepared.
A copy of BNSF Railway Company SEC Form 10-K is attached.
Railroad Annual Report R-1
B. IDENTITY OF RESPONDENT
STOCKHOLDERS' REPORTS
(date)
Road Initials: BNSF Year 2013 3
C. VOTING POWERS AND ELECTIONS
1. State the par value of each share of stock: Common $1.00 per share; first preferred, $ N/A per share; second preferred,
$ N/A per share; debenture stock, $ N/A per share.
2. State whether or not each share of stock has the right to one vote; if not, give full particulars in a footnote. [X] Yes [ ] No
3. Are voting rights proportional to holdings? [X] Yes [ ] No. If not, state in a footnote the relation between holdings and corresponding voting rights.
4. Are voting rights attached to any securities other than stock? [ ] Yes [X] No. If yes, name in a footnote each security, other than stock, to which voting rights are
attached (as of the close of the year), and state in detail the relation between holdings and corresponding voting rights, indicating whether voting rights are actual or
contingent and, if contingent, showing the contingency.
5. Has any class or issue of securities any special privileges in the election of directors, trustees, or managers, or in the determination of corporate action by any method?
[ ] Yes [X] No. If yes, describe fully in a footnote each such class or issue and give a succinct statement showing clearly the character and extent of such privileges.
6. Give the date of the latest closing of the stock book prior to the actual filing of this report, and state the purpose of such closing.
Stock books not closed and not required to be closed.
7. State the total voting power of all security holders of the respondent at the date of such closing, if within one year of the date of such filing; if not, state as of the close
of the year. 1,000 votes, as of December 31, 2013
8. State the total number of stockholders of record, as of the date shown in answer to Inquiry 7. One (1) stockholder.
9. Give the names of 30 security holders of the respondent who, at the date of the latest closing of the stock book or compilation of the list of stockholders of the
respondent (if within 1 year prior to the actual filing of this report), had the highest voting powers in the respondent, showing for each his or her address, the number of votes
he or she would have had a right to cast on that date had a meeting then been in order, and the classification of the number of votes to which he or she was entitled, with
respect to securities held by him or her, such securities being classified as common stock, second preferred stock, first preferred stock, and other securities (stating in a
footnote the names of such other securities, if any). If any such holder held in trust, give (in a footnote) the particulars of the trust. In the case of voting trust agreements,
give as supplemental information and the names and addresses of the 30 largest holders of the voting trust certificates and the amount of their individual holdings. If the
stock book was not closed or the list of stockholders compiled within such year, show such 30 security holders as of the close of the year.
Number of Votes, Classified With
Number of Votes Respect to Securities on Which Based
Line to Which Stock
No. Security Holder Preferred Line
Address of Security Holder Was Entitled Common Second First No.
(b) (c) (d) (e) (f)
1 2650 Lou Menk Drive 1,000 1,000 1
2 Fort Worth, TX 76131 2
3 3
4 4
5 5
6 6
7 7
8 8
9 9
10 10
11 11
12 12
13 13
14 14
15 15
16 16
17 17
18 18
19 19
20 20
21 21
22 22
23 23
24 24
25 25
26 26
27 27
28 28
29 29
Railroad Annual Report R-1
Burlington Northern Santa Fe, LLC
(a)
Name of Security Holder
4 Road Initials: BNSF Year 2013
C. VOTING POWERS AND ELECTIONS - Continued
10. State the total number of votes cast at the latest general meeting for the election of directors of the respondent: "Not Applicable"
Refer to note shown under inquiry 9.
11. Give the date of such meeting: "Not Applicable" - Refer to note shown under inquiry 9.
12. Give the place of such meeting: "Not Applicable" - Refer to note shown under inquiry 9.
NOTES AND REMARKS
Consolidated Subsidiaries:
Bayport Systems, Inc.
Bayrail, LLC
BN Leasing Corporation
BN Manitoba, Ltd
BNRR Holdings
BNSF British Columbia, Ltd
BNSF Communications, Inc.
The Burlington Northern and Santa Fe Railway Company de Mexico, S.A. de C.V.
BNSF Equipment Acquisition Co. LLC
BNSF Manitoba, Inc.
BNSF Properties, LLC
BNSF Spectrum, Inc.
BNSF Railway International Serivces, Inc.
Los Angeles Junction Railway Company
Midwest/Northwest Properties, Inc.
Pine Canyon Land Company
San Jacinto Rail, Ltd
Santa Fe Pacific Insurance Company
SFP Pipeline Holdings, Inc.
Santa Fe Pacific Pipelines, Inc.
Santa Fe Pacific Railroad Company
Slover Development Company LLC
Star Lake Railroad Company
Western Fruit Express Company
The Zia Company
Inactive Subsidiaries:
Northern Radio Limited (British Columbia)
Railroad Annual Report R-1
BNSF Railway Company
Road Initials: BNSF Year 2013 5
200. COMPARATIVE STATEMENT OF FINANCIAL POSITION - ASSETS
(Dollars in Thousands)
Line Cross Account Title Balance at close Balance at begin- Line
No. Check of year ing of year No.
(a) (b) (c)
Current Assets
1 701 Cash 531,956 350,126 1
2 702 Temporary cash investments 2
3 703 Special deposits 3
Accounts receivable
4 704 - Loan and notes 4
5 705 - Interline and other balances 59,339 45,608 5
6 706 - Customers 896,566 828,975 6
7 707 - Other 136,900 146,872 7
8 709, 708 - Accrued accounts receivables 162,738 143,758 8
9 708.5 - Receivables from affiliated companies 63,469 31,905 9
10 709.5 - Less: Allowance for uncollectible accounts (53,240) (47,676) 10
11 710, 711, 714 Working funds prepayments deferred income tax debits 534,352 520,661 11
12 712 Materials and supplies 835,245 800,017 12
13 713 Other current assets 189,187 92,436 13
14 TOTAL CURRENT ASSETS 3,356,512 2,912,682 14
Other Assets
15 715, 716, 717 Special funds 1,505 1,809 15
16 721, 721.5 Investments and advances affiliated companies 16
(Schs. 310 and 310A) 466,113 446,964
17 722, 723 Other investments and advances 17
18 724 Allowances for net unrealized loss on noncurrent 18
marketable equity securities - Cr.
19 737, 738 Property used in other than carrier operation 19
(Less depreciation) 338,868 273,038
20 739, 741 Other assets 4,295,686 4,326,763 20
21 743 Other deferred debits 1,608,570 1,192,319 21
22 744 Accumulated deferred income tax debits - 22
23 TOTAL OTHER ASSETS 6,710,742 6,240,893 23
Road and Equipment
24 731, 732 Road (Sch. 330) L-30 Col h & b 42,527,283 40,722,156 24
25 731, 732 Equipment (Sch 330) L-39 Col h & b 10,847,906 9,925,110 25
26 731, 732 Unallocated items 975,500 975,220 26
27 733, 735 Accumulated depreciation and amortization 27
(Schs. 335, 342, 351) (11,673,140) (10,921,707)
28 Net Road and Equipment 42,677,549 40,700,779 28
29 TOTAL ASSETS 52,744,803 49,854,354 29
Railroad Annual Report R-1
NOTES AND REMARKS
6 Road Initials: BNSF Year 2013
200. COMPARATIVE STATEMENT OF FINANCIAL POSITION - LIABILITIES AND SHAREHOLDERS' EQUITY
(Dollars in Thousands)
Line Cross Account Title Balance at close Balance at begin- Line
No. Check of year ing of year No.
(a) (b) (c)
Current Liabilities
30 751 Loans and notes payable 30
31 752 Accounts payable: interline and other balances 12,396 25,847 31
32 753 Audited accounts and wages 265,314 232,957 32
33 754 Other accounts payable 290,143 254,842 33
34 755, 756 Interest and dividends payable 24,881 24,725 34
35 757 Payables to affiliated companies 152,727 144,050 35
36 759 Accrued accounts payable 1,827,651 1,612,439 36
37 760, 761, 761.5 37
762 Taxes accrued 346,322 575,631
38 763 Other current liabilities 212,108 156,980 38
39 764 Equipment obligations and other long-term debt 39
due within one year 144,925 202,788
40 TOTAL CURRENT LIABILITIES 3,276,467 3,230,259 40
Non-Current Liabilities
41 765, 767 Funded debt unmatured 538,676 545,266 41
42 766 Equipment obligations 98,221 124,872 42
43 766.5 Capitalized lease obligations 765,212 861,674 43
44 768 Debt in default 44
45 769 Accounts payable: affiliated companies 45
46 770.1, 770.2 Unamortized debt premium (14,671) (15,558) 46
47 781 Interest in default 47
48 783 Deferred revenues - transfers from govt. authorities 48
49 786 Accumulated deferred income tax credits 13,729,098 12,904,443 49
50 771, 772, 774, 50
775, 782, 784 Other long-term liabilities and deferred credits 3,104,184 3,666,885
51 TOTAL NON-CURRENT LIABILITIES 18,220,720 18,087,582 51
Shareholders' Equity
52 791, 792 Total capital stock 1 1 52
53 Common stock 1 1 53
54 Preferred stock 54
55 Discount on capital stock 55
56 794, 795 Additional capital 15,478,597 15,478,597 56
Retained earnings:
57 797 Appropriated 57
58 798 Unappropriated 15,769,018 13,057,915 58
59 798.1 Net unrealized loss on noncurrent marketable 59
equity securities
60 798.5 Less treasury stock 60
61 Net stockholders equity 31,247,616 28,536,513 61
62 TOTAL LIABILITIES AND SHAREHOLDERS EQUITY 52,744,803 49,854,354 62
NOTES AND REMARKS
Railroad Annual Report R-1
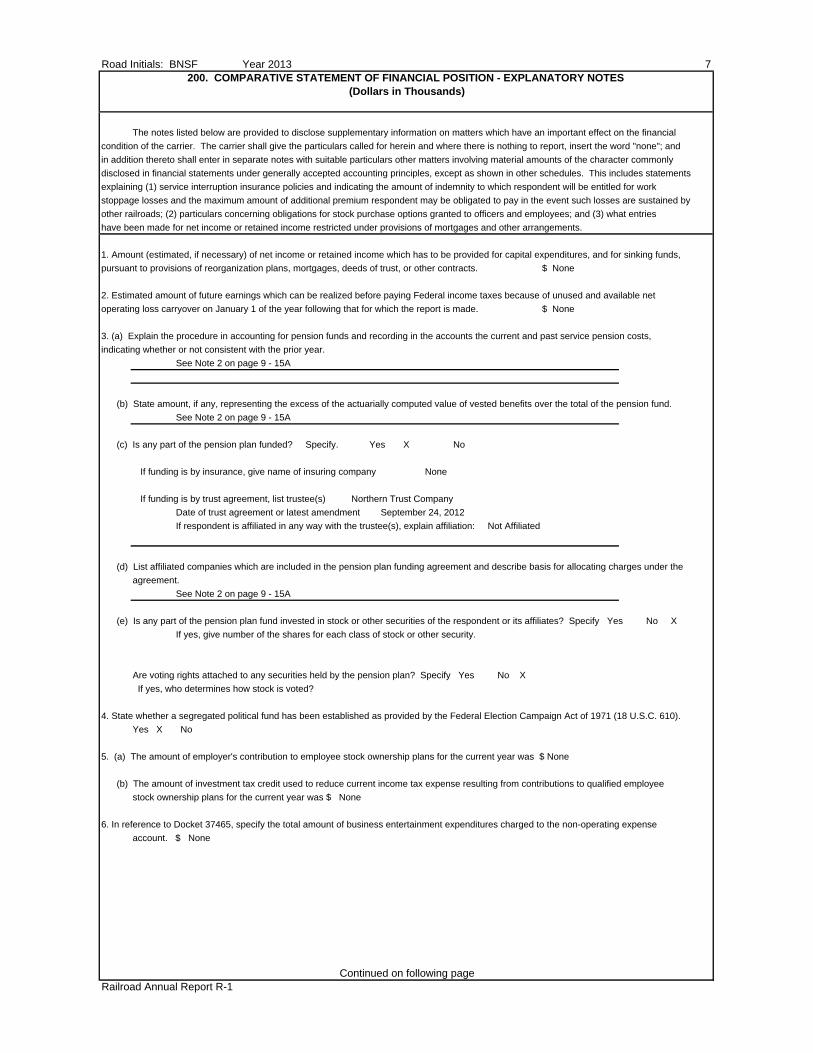
Road Initials: BNSF Year 2013 7200. COMPARATIVE STATEMENT OF FINANCIAL POSITION - EXPLANATORY NOTES
(Dollars in Thousands)
The notes listed below are provided to disclose supplementary information on matters which have an important effect on the financial
condition of the carrier. The carrier shall give the particulars called for herein and where there is nothing to report, insert the word "none"; and
in addition thereto shall enter in separate notes with suitable particulars other matters involving material amounts of the character commonly
disclosed in financial statements under generally accepted accounting principles, except as shown in other schedules. This includes statements
explaining (1) service interruption insurance policies and indicating the amount of indemnity to which respondent will be entitled for work
stoppage losses and the maximum amount of additional premium respondent may be obligated to pay in the event such losses are sustained by
other railroads; (2) particulars concerning obligations for stock purchase options granted to officers and employees; and (3) what entries
have been made for net income or retained income restricted under provisions of mortgages and other arrangements.
1. Amount (estimated, if necessary) of net income or retained income which has to be provided for capital expenditures, and for sinking funds,
pursuant to provisions of reorganization plans, mortgages, deeds of trust, or other contracts. $ None
2. Estimated amount of future earnings which can be realized before paying Federal income taxes because of unused and available net
operating loss carryover on January 1 of the year following that for which the report is made. $ None
3. (a) Explain the procedure in accounting for pension funds and recording in the accounts the current and past service pension costs,
indicating whether or not consistent with the prior year.
See Note 2 on page 9 - 15A
(b) State amount, if any, representing the excess of the actuarially computed value of vested benefits over the total of the pension fund.
See Note 2 on page 9 - 15A
(c) Is any part of the pension plan funded? Specify. Yes X No
If funding is by insurance, give name of insuring company None
If funding is by trust agreement, list trustee(s) Northern Trust Company
Date of trust agreement or latest amendment September 24, 2012
If respondent is affiliated in any way with the trustee(s), explain affiliation: Not Affiliated
(d) List affiliated companies which are included in the pension plan funding agreement and describe basis for allocating charges under the
agreement.
See Note 2 on page 9 - 15A
(e) Is any part of the pension plan fund invested in stock or other securities of the respondent or its affiliates? Specify Yes No X
If yes, give number of the shares for each class of stock or other security.
Are voting rights attached to any securities held by the pension plan? Specify Yes No X
If yes, who determines how stock is voted?
4. State whether a segregated political fund has been established as provided by the Federal Election Campaign Act of 1971 (18 U.S.C. 610).
Yes X No
5. (a) The amount of employer's contribution to employee stock ownership plans for the current year was $ None
(b) The amount of investment tax credit used to reduce current income tax expense resulting from contributions to qualified employee
stock ownership plans for the current year was $ None
6. In reference to Docket 37465, specify the total amount of business entertainment expenditures charged to the non-operating expense
account. $ None
Continued on following pageRailroad Annual Report R-1
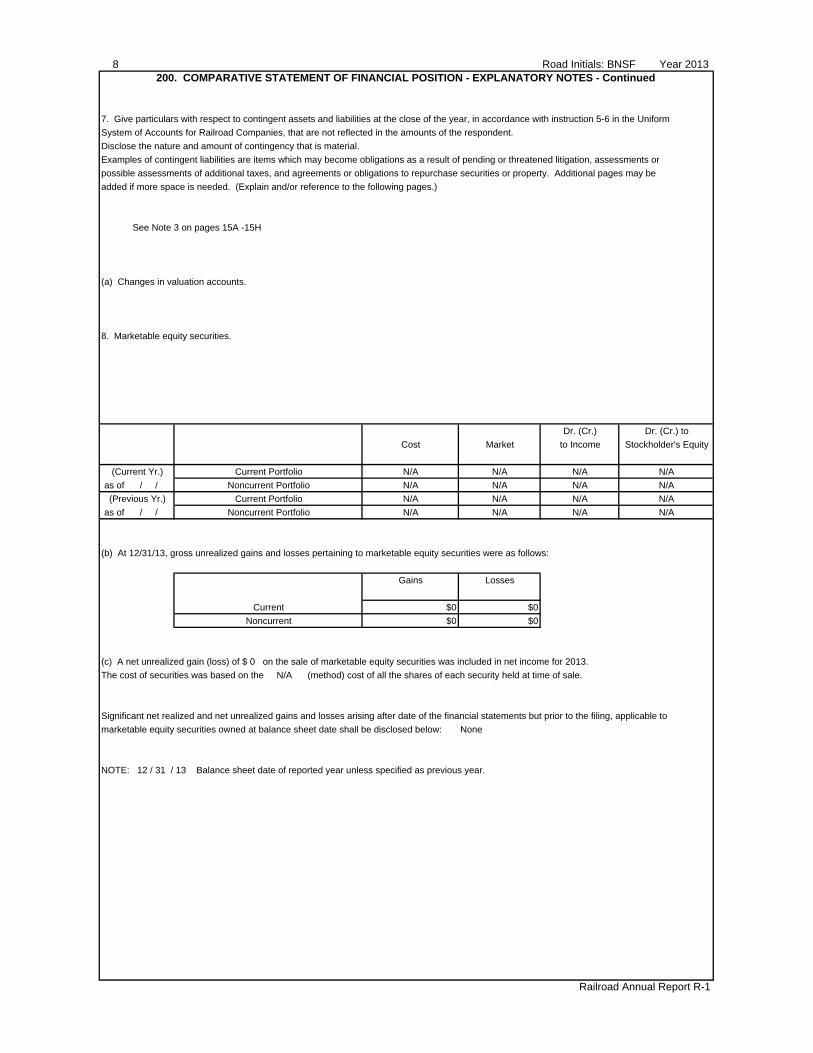
8 Road Initials: BNSF Year 2013200. COMPARATIVE STATEMENT OF FINANCIAL POSITION - EXPLANATORY NOTES - Continued
7. Give particulars with respect to contingent assets and liabilities at the close of the year, in accordance with instruction 5-6 in the Uniform
System of Accounts for Railroad Companies, that are not reflected in the amounts of the respondent.
Disclose the nature and amount of contingency that is material.
Examples of contingent liabilities are items which may become obligations as a result of pending or threatened litigation, assessments or
possible assessments of additional taxes, and agreements or obligations to repurchase securities or property. Additional pages may be
added if more space is needed. (Explain and/or reference to the following pages.)
See Note 3 on pages 15A -15H
(a) Changes in valuation accounts.
8. Marketable equity securities.
Dr. (Cr.) Dr. (Cr.) to
Cost Market to Income Stockholder's Equity
(Current Yr.) Current Portfolio N/A N/A N/A N/A
as of / / Noncurrent Portfolio N/A N/A N/A N/A
(Previous Yr.) Current Portfolio N/A N/A N/A N/A
as of / / Noncurrent Portfolio N/A N/A N/A N/A
(b) At 12/31/13, gross unrealized gains and losses pertaining to marketable equity securities were as follows:
Gains Losses
Current $0 $0
Noncurrent $0 $0
(c) A net unrealized gain (loss) of $ 0 on the sale of marketable equity securities was included in net income for 2013.
The cost of securities was based on the N/A (method) cost of all the shares of each security held at time of sale.
Significant net realized and net unrealized gains and losses arising after date of the financial statements but prior to the filing, applicable to
marketable equity securities owned at balance sheet date shall be disclosed below: None
NOTE: 12 / 31 / 13 Balance sheet date of reported year unless specified as previous year.
Railroad Annual Report R-1
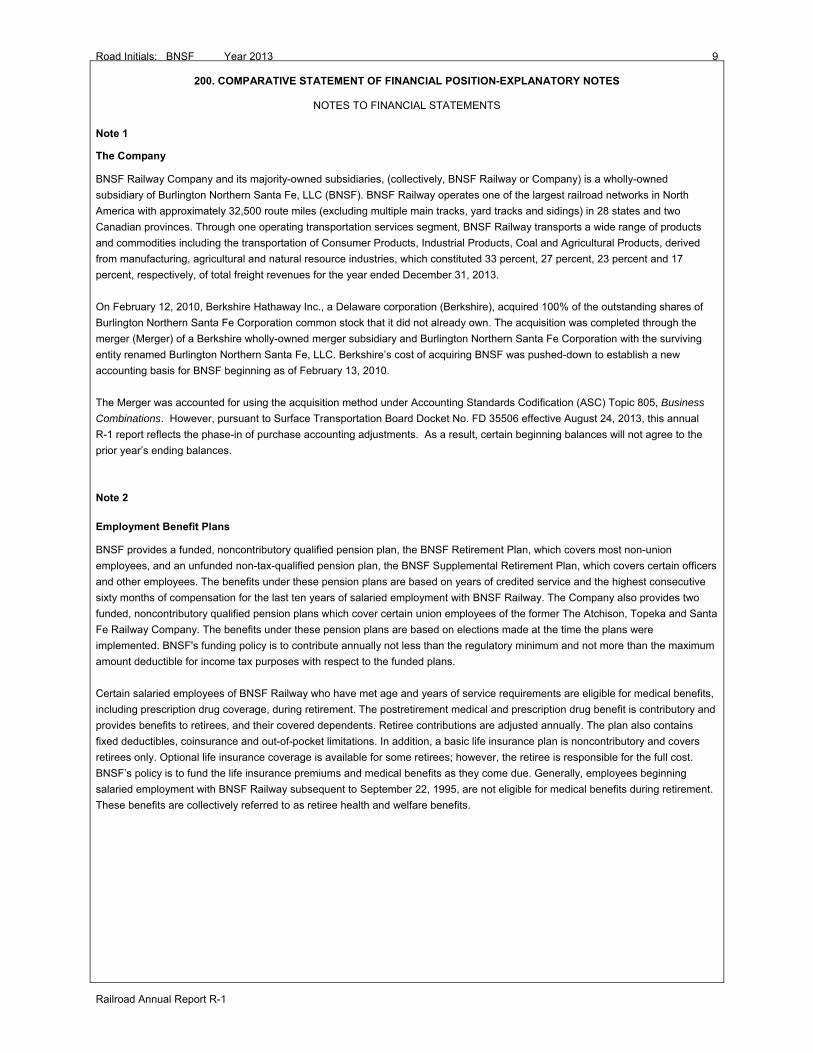
Road Initials: BNSF Year 2013 9
Railroad Annual Report R-1
200. COMPARATIVE STATEMENT OF FINANCIAL POSITION-EXPLANATORY NOTES
NOTES TO FINANCIAL STATEMENTS
Note 1
The Company
BNSF Railway Company and its majority-owned subsidiaries, (collectively, BNSF Railway or Company) is a wholly-owned
subsidiary of Burlington Northern Santa Fe, LLC (BNSF). BNSF Railway operates one of the largest railroad networks in North
America with approximately 32,500 route miles (excluding multiple main tracks, yard tracks and sidings) in 28 states and two
Canadian provinces. Through one operating transportation services segment, BNSF Railway transports a wide range of products
and commodities including the transportation of Consumer Products, Industrial Products, Coal and Agricultural Products, derived
from manufacturing, agricultural and natural resource industries, which constituted 33 percent, 27 percent, 23 percent and 17
percent, respectively, of total freight revenues for the year ended December 31, 2013.
On February 12, 2010, Berkshire Hathaway Inc., a Delaware corporation (Berkshire), acquired 100% of the outstanding shares of
Burlington Northern Santa Fe Corporation common stock that it did not already own. The acquisition was completed through the
merger (Merger) of a Berkshire wholly-owned merger subsidiary and Burlington Northern Santa Fe Corporation with the surviving
entity renamed Burlington Northern Santa Fe, LLC. Berkshire’s cost of acquiring BNSF was pushed-down to establish a new
accounting basis for BNSF beginning as of February 13, 2010.
The Merger was accounted for using the acquisition method under Accounting Standards Codification (ASC) Topic 805, Business
Combinations. However, pursuant to Surface Transportation Board Docket No. FD 35506 effective August 24, 2013, this annual
R-1 report reflects the phase-in of purchase accounting adjustments. As a result, certain beginning balances will not agree to the
prior year’s ending balances.
Note 2
Employment Benefit Plans
BNSF provides a funded, noncontributory qualified pension plan, the BNSF Retirement Plan, which covers most non-union
employees, and an unfunded non-tax-qualified pension plan, the BNSF Supplemental Retirement Plan, which covers certain officers
and other employees. The benefits under these pension plans are based on years of credited service and the highest consecutive
sixty months of compensation for the last ten years of salaried employment with BNSF Railway. The Company also provides two
funded, noncontributory qualified pension plans which cover certain union employees of the former The Atchison, Topeka and Santa
Fe Railway Company. The benefits under these pension plans are based on elections made at the time the plans were
implemented. BNSF's funding policy is to contribute annually not less than the regulatory minimum and not more than the maximum
amount deductible for income tax purposes with respect to the funded plans.
Certain salaried employees of BNSF Railway who have met age and years of service requirements are eligible for medical benefits,
including prescription drug coverage, during retirement. The postretirement medical and prescription drug benefit is contributory and
provides benefits to retirees, and their covered dependents. Retiree contributions are adjusted annually. The plan also contains
fixed deductibles, coinsurance and out-of-pocket limitations. In addition, a basic life insurance plan is noncontributory and covers
retirees only. Optional life insurance coverage is available for some retirees; however, the retiree is responsible for the full cost.
BNSF’s policy is to fund the life insurance premiums and medical benefits as they come due. Generally, employees beginning
salaried employment with BNSF Railway subsequent to September 22, 1995, are not eligible for medical benefits during retirement.
These benefits are collectively referred to as retiree health and welfare benefits.
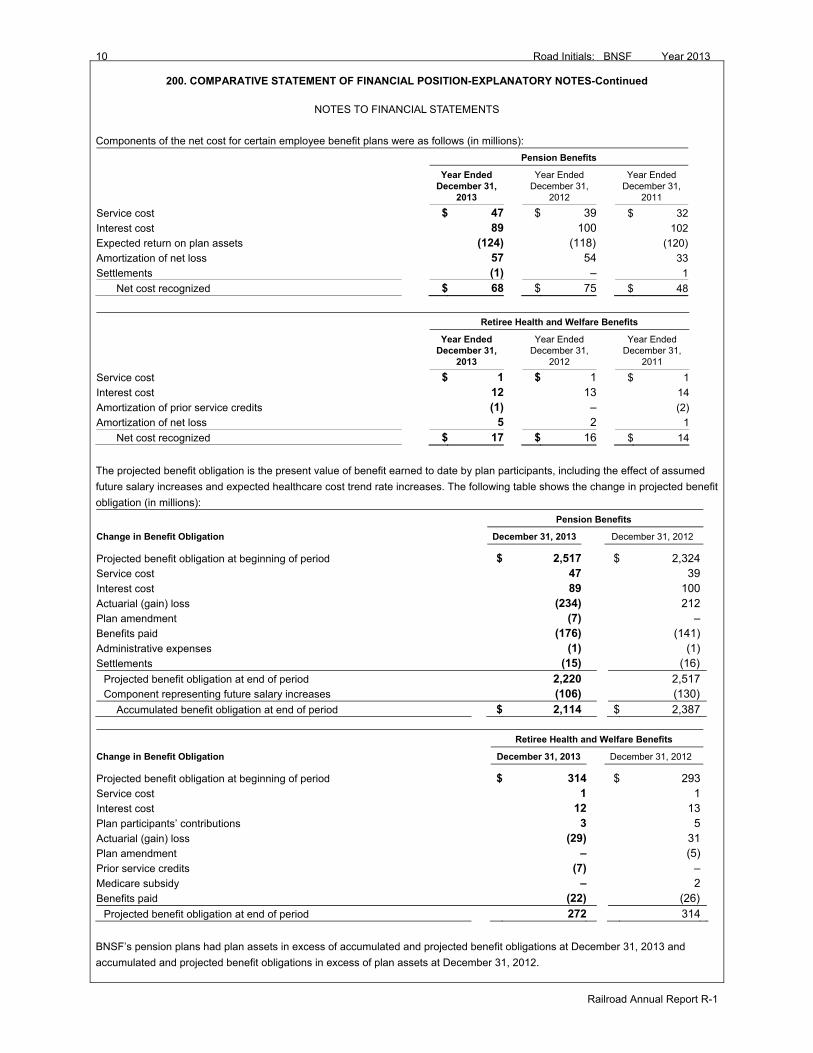
10 Road Initials: BNSF Year 2013
Railroad Annual Report R-1
200. COMPARATIVE STATEMENT OF FINANCIAL POSITION-EXPLANATORY NOTES-Continued
NOTES TO FINANCIAL STATEMENTS
Components of the net cost for certain employee benefit plans were as follows (in millions):
Pension Benefits
Year Ended December 31,
2013
Year Ended December 31,
2012
Year Ended December 31,
2011
Service cost $ 47 $ 39 $ 32
Interest cost 89 100 102
Expected return on plan assets (124) (118) (120))
Amortization of net loss 57 54 33
Settlements (1) – 1
Net cost recognized $ 68 $ 75 $ 48
Retiree Health and Welfare Benefits
Year Ended December 31,
2013
Year Ended December 31,
2012
Year Ended December 31,
2011
Service cost $ 1 $ 1 $ 1
Interest cost 12 13 14
Amortization of prior service credits (1) – (2)
Amortization of net loss 5 2 1
Net cost recognized $ 17 $ 16 $ 14
The projected benefit obligation is the present value of benefit earned to date by plan participants, including the effect of assumed
future salary increases and expected healthcare cost trend rate increases. The following table shows the change in projected benefit
obligation (in millions):
Pension Benefits
Change in Benefit Obligation December 31, 2013 December 31, 2012
Projected benefit obligation at beginning of period $ 2,517 $ 2,324Service cost 47 39Interest cost 89 100Actuarial (gain) loss (234) 212Plan amendment (7) –Benefits paid (176) (141)Administrative expenses (1) (1) Settlements (15) (16) Projected benefit obligation at end of period 2,220 2,517 Component representing future salary increases (106) (130) Accumulated benefit obligation at end of period $ 2,114 $ 2,387
Retiree Health and Welfare Benefits
Change in Benefit Obligation December 31, 2013 December 31, 2012
Projected benefit obligation at beginning of period $ 314 $ 293Service cost 1 1Interest cost 12 13Plan participants’ contributions 3 5Actuarial (gain) loss (29) 31Plan amendment – (5) Prior service credits (7) – Medicare subsidy – 2 Benefits paid (22) (26) Projected benefit obligation at end of period 272 314
BNSF’s pension plans had plan assets in excess of accumulated and projected benefit obligations at December 31, 2013 and
accumulated and projected benefit obligations in excess of plan assets at December 31, 2012.
Road Initials: BNSF Year 2013 11
Railroad Annual Report R-1
200. COMPARATIVE STATEMENT OF FINANCIAL POSITION-EXPLANATORY NOTES-Continued
NOTES TO FINANCIAL STATEMENTS
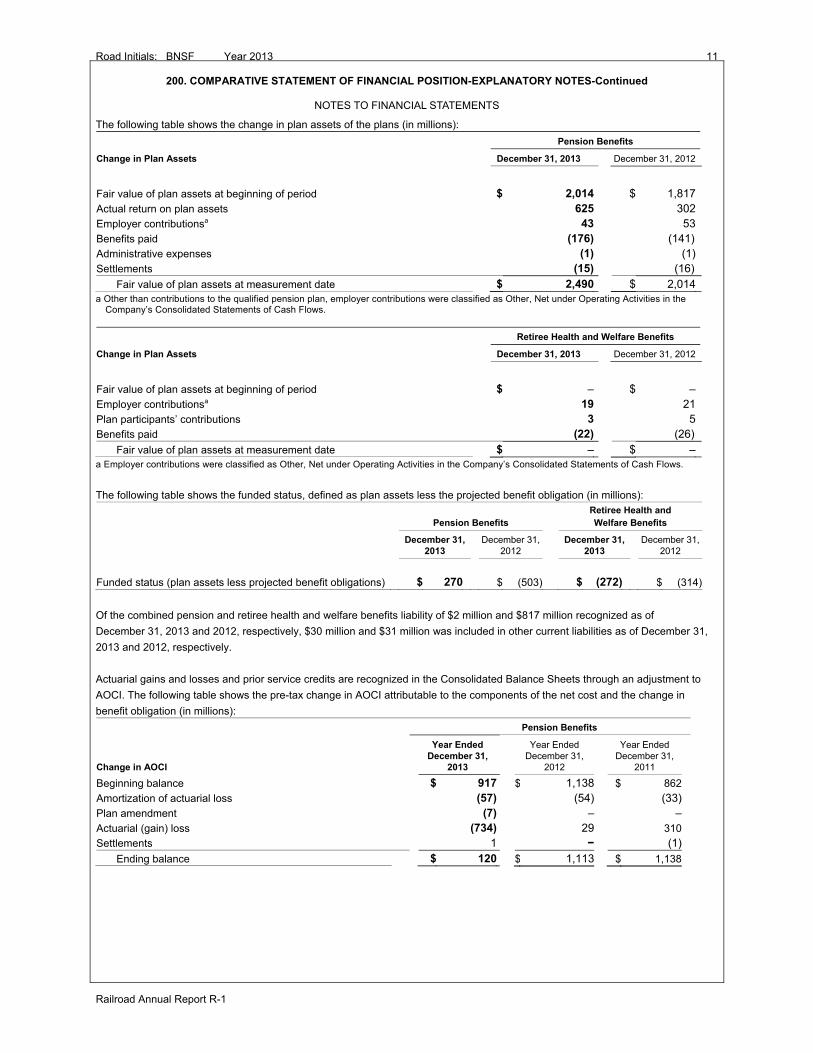
The following table shows the change in plan assets of the plans (in millions):
Pension Benefits
Change in Plan Assets December 31, 2013 December 31, 2012
Fair value of plan assets at beginning of period $ 2,014 $ 1,817Actual return on plan assets 625 302Employer contributionsa 43 53Benefits paid (176) (141)Administrative expenses (1) (1)Settlements (15) (16) Fair value of plan assets at measurement date $ 2,490 $ 2,014 a Other than contributions to the qualified pension plan, employer contributions were classified as Other, Net under Operating Activities in the
Company’s Consolidated Statements of Cash Flows.
Retiree Health and Welfare Benefits
Change in Plan Assets December 31, 2013 December 31, 2012
Fair value of plan assets at beginning of period $ – $ –Employer contributionsa 19 21Plan participants’ contributions 3 5Benefits paid (22) (26) Fair value of plan assets at measurement date $ – $ – a Employer contributions were classified as Other, Net under Operating Activities in the Company’s Consolidated Statements of Cash Flows.
The following table shows the funded status, defined as plan assets less the projected benefit obligation (in millions):
Pension Benefits
Retiree Health and Welfare Benefits
December 31,
2013 December 31,
2012 December 31,
2013 December 31,
2012
Funded status (plan assets less projected benefit obligations) $ 270 $ (503) $ (272) $ (314)
Of the combined pension and retiree health and welfare benefits liability of $2 million and $817 million recognized as of
December 31, 2013 and 2012, respectively, $30 million and $31 million was included in other current liabilities as of December 31,
2013 and 2012, respectively.
Actuarial gains and losses and prior service credits are recognized in the Consolidated Balance Sheets through an adjustment to
AOCI. The following table shows the pre-tax change in AOCI attributable to the components of the net cost and the change in
benefit obligation (in millions):
Pension Benefits
Change in AOCI
Year Ended December 31,
2013
Year Ended December 31,
2012
Year Ended December 31,
2011
Beginning balance $ 917 $ 1,138 $ 862
Amortization of actuarial loss (57) (54) (33)Plan amendment (7) – –Actuarial (gain) loss (734) 29 310
Settlements 1 − (1) Ending balance $ 120 $ 1,113 $ 1,138
12 Road Initials: BNSF Year 2013
Railroad Annual Report R-1
200. COMPARATIVE STATEMENT OF FINANCIAL POSITION-EXPLANATORY NOTES-Continued
NOTES TO FINANCIAL STATEMENTS
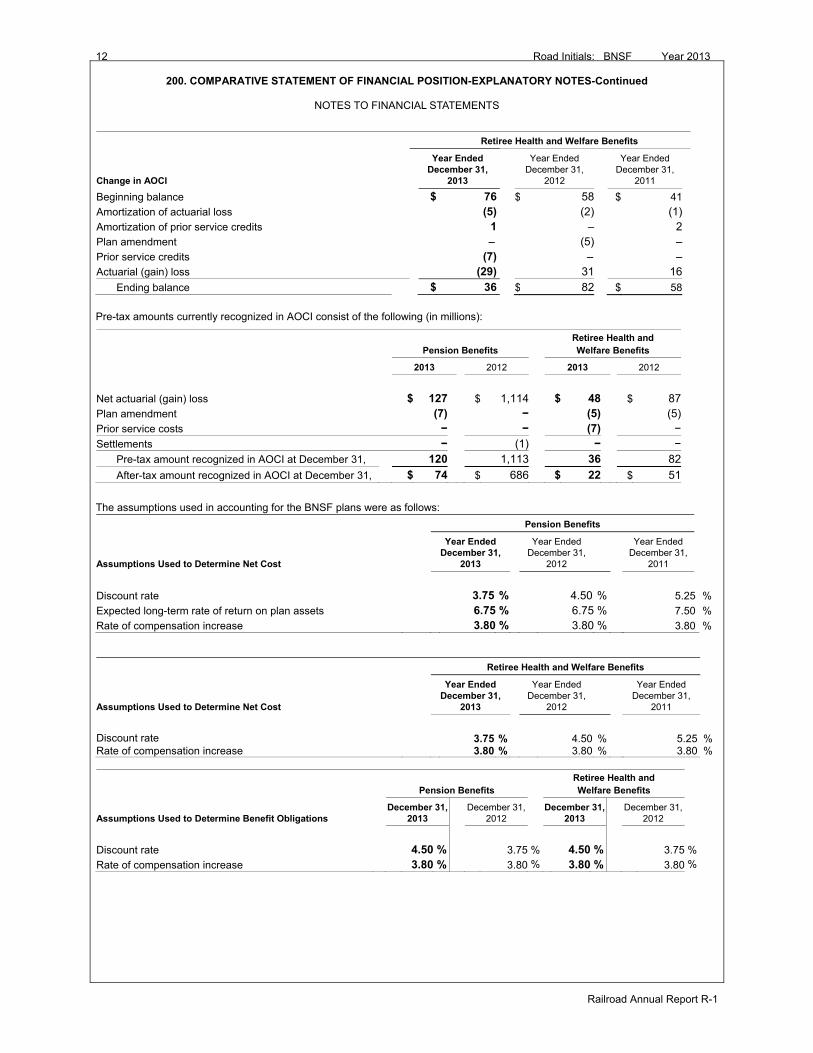
Retiree Health and Welfare Benefits
Change in AOCI
Year Ended December 31,
2013
Year Ended December 31,
2012
Year Ended December 31,
2011
Beginning balance $ 76 $ 58 $ 41
Amortization of actuarial loss (5) (2) (1) Amortization of prior service credits 1 – 2
Plan amendment – (5) –
Prior service credits (7) – –
Actuarial (gain) loss (29) 31 16
Ending balance $ 36 $ 82 $ 58
Pre-tax amounts currently recognized in AOCI consist of the following (in millions):
Pension Benefits
Retiree Health and Welfare Benefits
2013 2012 2013 2012
Net actuarial (gain) loss $ 127 $ 1,114 $ 48 $ 87Plan amendment (7) − (5) (5) Prior service costs − − (7) − Settlements − (1) − − Pre-tax amount recognized in AOCI at December 31, 120 1,113 36 82
After-tax amount recognized in AOCI at December 31, $ 74 $ 686 $ 22 $ 51
The assumptions used in accounting for the BNSF plans were as follows:
Pension Benefits
Assumptions Used to Determine Net Cost
Year Ended December 31,
2013
Year Ended December 31,
2012
Year Ended December 31,
2011
Discount rate 3.75 % 4.50 % 5.25 %
Expected long-term rate of return on plan assets 6.75 % 6.75 % 7.50 %
Rate of compensation increase 3.80 % 3.80 % 3.80 %
Retiree Health and Welfare Benefits
Assumptions Used to Determine Net Cost
Year Ended December 31,
2013
Year Ended December 31,
2012
Year Ended December 31,
2011
Discount rate 3.75 % 4.50 % 5.25 % Rate of compensation increase 3.80 % 3.80 % 3.80 %
Pension Benefits
Retiree Health and Welfare Benefits
Assumptions Used to Determine Benefit Obligations December 31,
2013 December 31,
2012 December 31,
2013 December 31,
2012
Discount rate 4.50 % 3.75 % 4.50 % 3.75 %
Rate of compensation increase 3.80 % 3.80 % 3.80 % 3.80 %
Road Initials: BNSF Year 2013 13
Railroad Annual Report R-1
200. COMPARATIVE STATEMENT OF FINANCIAL POSITION-EXPLANATORY NOTES-Continued
NOTES TO FINANCIAL STATEMENTS
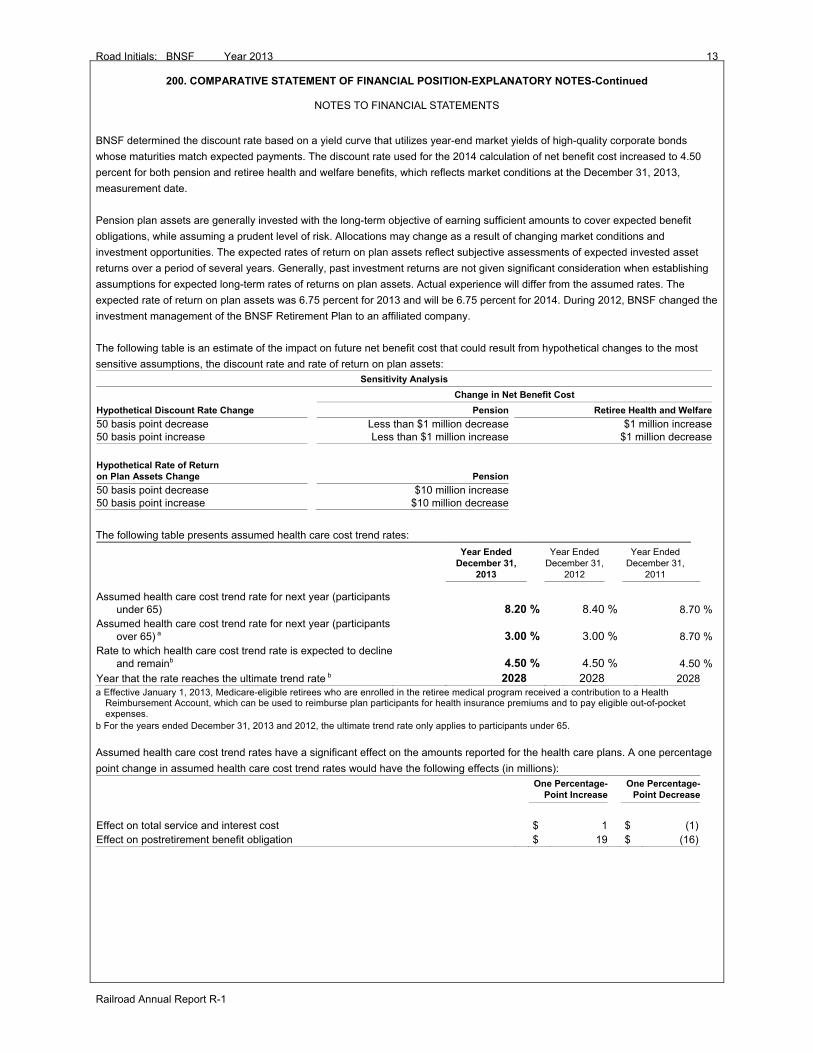
BNSF determined the discount rate based on a yield curve that utilizes year-end market yields of high-quality corporate bonds
whose maturities match expected payments. The discount rate used for the 2014 calculation of net benefit cost increased to 4.50
percent for both pension and retiree health and welfare benefits, which reflects market conditions at the December 31, 2013,
measurement date.
Pension plan assets are generally invested with the long-term objective of earning sufficient amounts to cover expected benefit
obligations, while assuming a prudent level of risk. Allocations may change as a result of changing market conditions and
investment opportunities. The expected rates of return on plan assets reflect subjective assessments of expected invested asset
returns over a period of several years. Generally, past investment returns are not given significant consideration when establishing
assumptions for expected long-term rates of returns on plan assets. Actual experience will differ from the assumed rates. The
expected rate of return on plan assets was 6.75 percent for 2013 and will be 6.75 percent for 2014. During 2012, BNSF changed the
investment management of the BNSF Retirement Plan to an affiliated company.
The following table is an estimate of the impact on future net benefit cost that could result from hypothetical changes to the most
sensitive assumptions, the discount rate and rate of return on plan assets: Sensitivity Analysis
Change in Net Benefit Cost
Hypothetical Discount Rate Change Pension Retiree Health and Welfare
50 basis point decrease Less than $1 million decrease $1 million increase50 basis point increase Less than $1 million increase $1 million decrease
Hypothetical Rate of Return on Plan Assets Change Pension 50 basis point decrease $10 million increase50 basis point increase $10 million decrease
The following table presents assumed health care cost trend rates:
Year Ended December 31,
2013
Year Ended December 31,
2012
Year Ended December 31,
2011
Assumed health care cost trend rate for next year (participants under 65) 8.20 % 8.40 % 8.70 %
Assumed health care cost trend rate for next year (participants over 65) a 3.00 %
3.00 % 8.70 %
Rate to which health care cost trend rate is expected to decline and remainb 4.50 %
4.50 % 4.50 %
Year that the rate reaches the ultimate trend rate b 2028 2028 2028 a Effective January 1, 2013, Medicare-eligible retirees who are enrolled in the retiree medical program received a contribution to a Health
Reimbursement Account, which can be used to reimburse plan participants for health insurance premiums and to pay eligible out-of-pocket expenses.
b For the years ended December 31, 2013 and 2012, the ultimate trend rate only applies to participants under 65.
Assumed health care cost trend rates have a significant effect on the amounts reported for the health care plans. A one percentage
point change in assumed health care cost trend rates would have the following effects (in millions):
One Percentage-
Point Increase One Percentage-
Point Decrease
Effect on total service and interest cost $ 1 $ (1) Effect on postretirement benefit obligation $ 19 $ (16)
14 Road Initials: BNSF Year 2013
Railroad Annual Report R-1
200. COMPARATIVE STATEMENT OF FINANCIAL POSITION-EXPLANATORY NOTES-Continued
NOTES TO FINANCIAL STATEMENTS
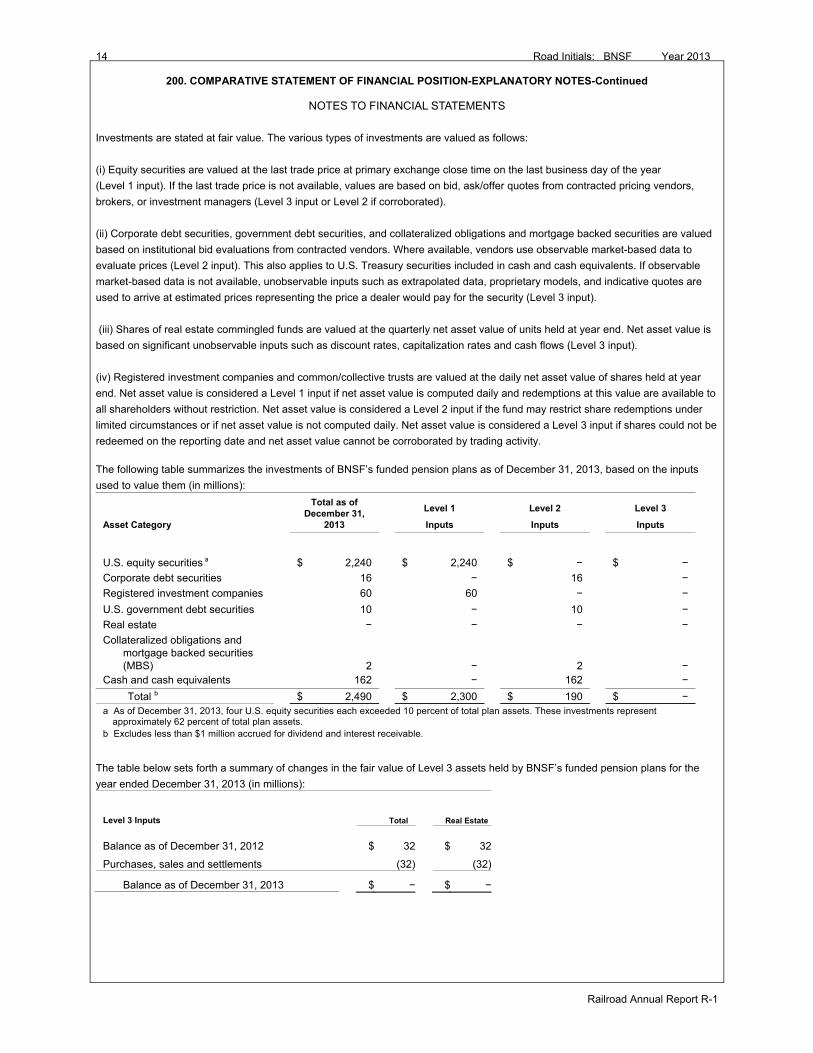
Investments are stated at fair value. The various types of investments are valued as follows:
(i) Equity securities are valued at the last trade price at primary exchange close time on the last business day of the year
(Level 1 input). If the last trade price is not available, values are based on bid, ask/offer quotes from contracted pricing vendors,
brokers, or investment managers (Level 3 input or Level 2 if corroborated).
(ii) Corporate debt securities, government debt securities, and collateralized obligations and mortgage backed securities are valued
based on institutional bid evaluations from contracted vendors. Where available, vendors use observable market-based data to
evaluate prices (Level 2 input). This also applies to U.S. Treasury securities included in cash and cash equivalents. If observable
market-based data is not available, unobservable inputs such as extrapolated data, proprietary models, and indicative quotes are
used to arrive at estimated prices representing the price a dealer would pay for the security (Level 3 input).
(iii) Shares of real estate commingled funds are valued at the quarterly net asset value of units held at year end. Net asset value is
based on significant unobservable inputs such as discount rates, capitalization rates and cash flows (Level 3 input).
(iv) Registered investment companies and common/collective trusts are valued at the daily net asset value of shares held at year
end. Net asset value is considered a Level 1 input if net asset value is computed daily and redemptions at this value are available to
all shareholders without restriction. Net asset value is considered a Level 2 input if the fund may restrict share redemptions under
limited circumstances or if net asset value is not computed daily. Net asset value is considered a Level 3 input if shares could not be
redeemed on the reporting date and net asset value cannot be corroborated by trading activity.
The following table summarizes the investments of BNSF’s funded pension plans as of December 31, 2013, based on the inputs
used to value them (in millions):
Asset Category
Total as of December 31,
2013
Level 1
Inputs
Level 2
Inputs
Level 3
Inputs
U.S. equity securities a $ 2,240 $ 2,240 $ − $ −
Corporate debt securities 16 − 16 −
Registered investment companies 60 60 − −
U.S. government debt securities 10 − 10 −
Real estate − − − −
Collateralized obligations and mortgage backed securities (MBS)
2
− 2 − Cash and cash equivalents 162 − 162 −
Total b $ 2,490 $ 2,300 $ 190 $ − a As of December 31, 2013, four U.S. equity securities each exceeded 10 percent of total plan assets. These investments represent
approximately 62 percent of total plan assets. b Excludes less than $1 million accrued for dividend and interest receivable.
The table below sets forth a summary of changes in the fair value of Level 3 assets held by BNSF’s funded pension plans for the
year ended December 31, 2013 (in millions):
Level 3 Inputs
Total Real Estate
Balance as of December 31, 2012
$ 32 $ 32
Purchases, sales and settlements (32) (32)
Balance as of December 31, 2013
$ − $ −
Road Initials: BNSF Year 2013 15
Railroad Annual Report R-1
200. COMPARATIVE STATEMENT OF FINANCIAL POSITION-EXPLANATORY NOTES-Continued
NOTES TO FINANCIAL STATEMENTS
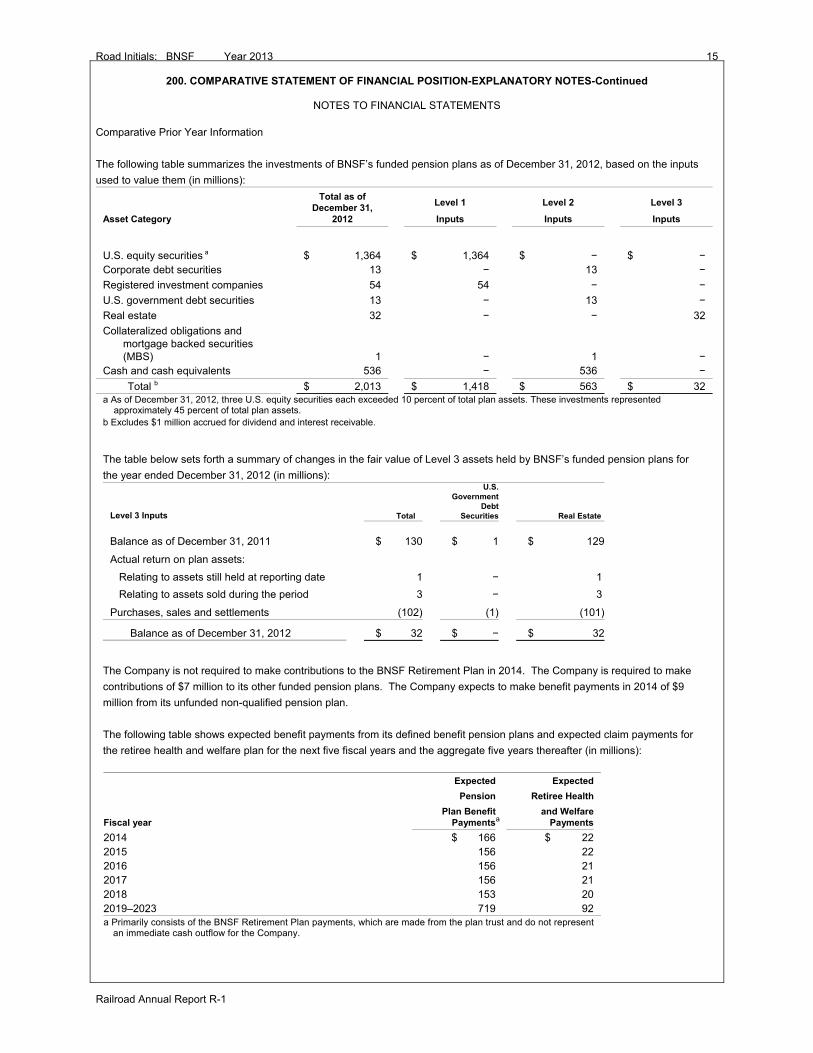
Comparative Prior Year Information
The following table summarizes the investments of BNSF’s funded pension plans as of December 31, 2012, based on the inputs
used to value them (in millions):
Asset Category
Total as of December 31,
2012
Level 1
Inputs
Level 2
Inputs
Level 3
Inputs
U.S. equity securities a $ 1,364 $ 1,364 $ − $ − Corporate debt securities 13 − 13 −
Registered investment companies 54 54 − −
U.S. government debt securities 13 − 13 −
Real estate 32 − − 32
Collateralized obligations and mortgage backed securities (MBS)
1
− 1 − Cash and cash equivalents 536 − 536 −
Total b $ 2,013 $ 1,418 $ 563 $ 32 a As of December 31, 2012, three U.S. equity securities each exceeded 10 percent of total plan assets. These investments represented
approximately 45 percent of total plan assets. b Excludes $1 million accrued for dividend and interest receivable.
The table below sets forth a summary of changes in the fair value of Level 3 assets held by BNSF’s funded pension plans for
the year ended December 31, 2012 (in millions):
Level 3 Inputs
Total
U.S. Government
Debt Securities Real Estate
Balance as of December 31, 2011
$ 130 $ 1 $ 129
Actual return on plan assets:
Relating to assets still held at reporting date 1 − 1
Relating to assets sold during the period 3 − 3
Purchases, sales and settlements (102) (1) (101)
Balance as of December 31, 2012
$ 32 $ − $ 32
The Company is not required to make contributions to the BNSF Retirement Plan in 2014. The Company is required to make
contributions of $7 million to its other funded pension plans. The Company expects to make benefit payments in 2014 of $9
million from its unfunded non-qualified pension plan.
The following table shows expected benefit payments from its defined benefit pension plans and expected claim payments for
the retiree health and welfare plan for the next five fiscal years and the aggregate five years thereafter (in millions):
Fiscal year
Expected
Pension
Plan Benefit Paymentsa
Expected
Retiree Health
and Welfare Payments
2014 $ 166 $ 22 2015 156 22 2016 156 21 2017 156 21 2018 153 20 2019–2023 719 92 a Primarily consists of the BNSF Retirement Plan payments, which are made from the plan trust and do not represent
an immediate cash outflow for the Company.
15A Road Initials: BNSF Year 2013
Railroad Annual Report R-1
200. COMPARATIVE STATEMENT OF FINANCIAL POSITION-EXPLANATORY NOTES-Continued
NOTES TO FINANCIAL STATEMENTS
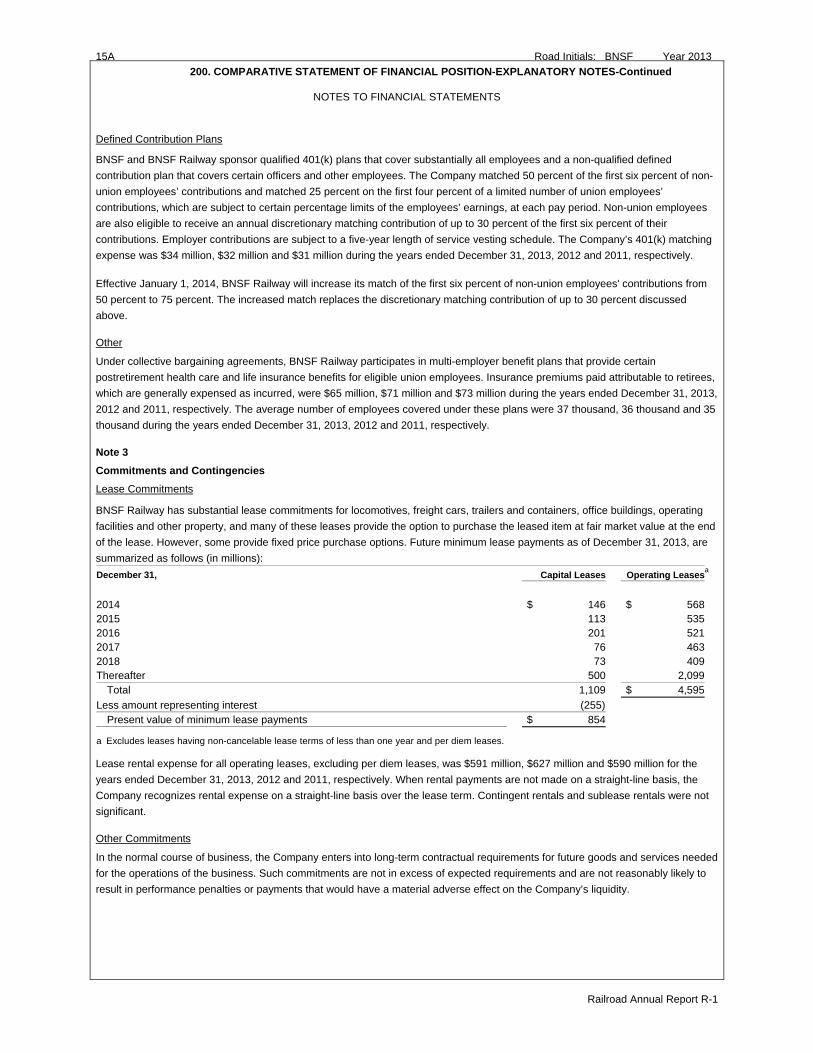
Defined Contribution Plans
BNSF and BNSF Railway sponsor qualified 401(k) plans that cover substantially all employees and a non-qualified defined
contribution plan that covers certain officers and other employees. The Company matched 50 percent of the first six percent of non-
union employees’ contributions and matched 25 percent on the first four percent of a limited number of union employees’
contributions, which are subject to certain percentage limits of the employees’ earnings, at each pay period. Non-union employees
are also eligible to receive an annual discretionary matching contribution of up to 30 percent of the first six percent of their
contributions. Employer contributions are subject to a five-year length of service vesting schedule. The Company’s 401(k) matching
expense was $34 million, $32 million and $31 million during the years ended December 31, 2013, 2012 and 2011, respectively.
Effective January 1, 2014, BNSF Railway will increase its match of the first six percent of non-union employees' contributions from
50 percent to 75 percent. The increased match replaces the discretionary matching contribution of up to 30 percent discussed
above. Other
Under collective bargaining agreements, BNSF Railway participates in multi-employer benefit plans that provide certain
postretirement health care and life insurance benefits for eligible union employees. Insurance premiums paid attributable to retirees,
which are generally expensed as incurred, were $65 million, $71 million and $73 million during the years ended December 31, 2013,
2012 and 2011, respectively. The average number of employees covered under these plans were 37 thousand, 36 thousand and 35
thousand during the years ended December 31, 2013, 2012 and 2011, respectively. Note 3
Commitments and Contingencies
Lease Commitments
BNSF Railway has substantial lease commitments for locomotives, freight cars, trailers and containers, office buildings, operating
facilities and other property, and many of these leases provide the option to purchase the leased item at fair market value at the end
of the lease. However, some provide fixed price purchase options. Future minimum lease payments as of December 31, 2013, are
summarized as follows (in millions):
December 31, Capital Leases Operating Leasesa
2014 $ 146 $ 568 2015 113 535 2016 201 521 2017 76 463 2018 73 409 Thereafter 500 2,099 Total 1,109 $ 4,595
Less amount representing interest (255) Present value of minimum lease payments $ 854
a Excludes leases having non-cancelable lease terms of less than one year and per diem leases.
Lease rental expense for all operating leases, excluding per diem leases, was $591 million, $627 million and $590 million for the
years ended December 31, 2013, 2012 and 2011, respectively. When rental payments are not made on a straight-line basis, the
Company recognizes rental expense on a straight-line basis over the lease term. Contingent rentals and sublease rentals were not
significant. Other Commitments
In the normal course of business, the Company enters into long-term contractual requirements for future goods and services needed
for the operations of the business. Such commitments are not in excess of expected requirements and are not reasonably likely to
result in performance penalties or payments that would have a material adverse effect on the Company’s liquidity.
Road Initials: BNSF Year 2013 15B
Railroad Annual Report R-1
200. COMPARATIVE STATEMENT OF FINANCIAL POSITION-EXPLANATORY NOTES-Continued
NOTES TO FINANCIAL STATEMENTS
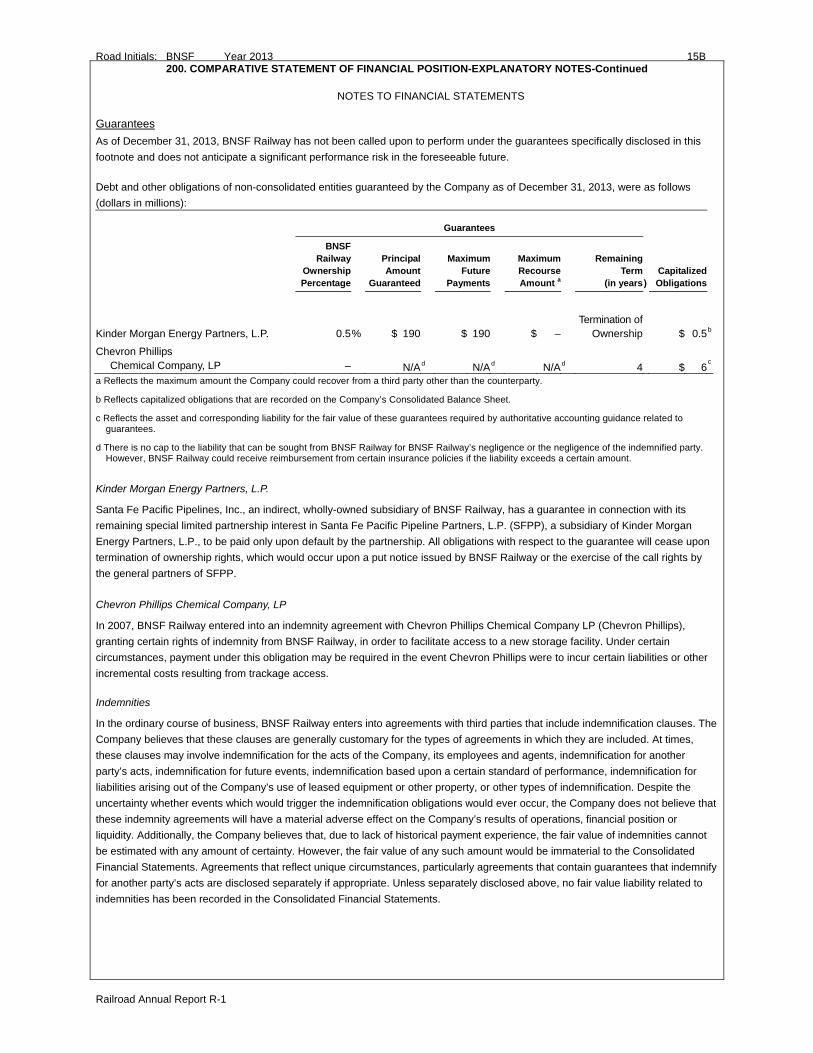
Guarantees
As of December 31, 2013, BNSF Railway has not been called upon to perform under the guarantees specifically disclosed in this
footnote and does not anticipate a significant performance risk in the foreseeable future.
Debt and other obligations of non-consolidated entities guaranteed by the Company as of December 31, 2013, were as follows
(dollars in millions):
Guarantees
BNSF Railway
Ownership Percentage
PrincipalAmount
Guaranteed
MaximumFuture
Payments
MaximumRecourseAmount a
Remaining Term
(in years ) Capitalized Obligations
Kinder Morgan Energy Partners, L.P. 0.5% $ 190 $ 190 $ – Termination of
Ownership $ 0.5b
Chevron Phillips Chemical Company, LP – N/Ad N/Ad N/Ad 4 $ 6
c
a Reflects the maximum amount the Company could recover from a third party other than the counterparty.
b Reflects capitalized obligations that are recorded on the Company’s Consolidated Balance Sheet.
c Reflects the asset and corresponding liability for the fair value of these guarantees required by authoritative accounting guidance related to guarantees.
d There is no cap to the liability that can be sought from BNSF Railway for BNSF Railway’s negligence or the negligence of the indemnified party. However, BNSF Railway could receive reimbursement from certain insurance policies if the liability exceeds a certain amount.
Kinder Morgan Energy Partners, L.P.
Santa Fe Pacific Pipelines, Inc., an indirect, wholly-owned subsidiary of BNSF Railway, has a guarantee in connection with its
remaining special limited partnership interest in Santa Fe Pacific Pipeline Partners, L.P. (SFPP), a subsidiary of Kinder Morgan
Energy Partners, L.P., to be paid only upon default by the partnership. All obligations with respect to the guarantee will cease upon
termination of ownership rights, which would occur upon a put notice issued by BNSF Railway or the exercise of the call rights by
the general partners of SFPP.
Chevron Phillips Chemical Company, LP
In 2007, BNSF Railway entered into an indemnity agreement with Chevron Phillips Chemical Company LP (Chevron Phillips),
granting certain rights of indemnity from BNSF Railway, in order to facilitate access to a new storage facility. Under certain
circumstances, payment under this obligation may be required in the event Chevron Phillips were to incur certain liabilities or other
incremental costs resulting from trackage access.
Indemnities
In the ordinary course of business, BNSF Railway enters into agreements with third parties that include indemnification clauses. The
Company believes that these clauses are generally customary for the types of agreements in which they are included. At times,
these clauses may involve indemnification for the acts of the Company, its employees and agents, indemnification for another
party’s acts, indemnification for future events, indemnification based upon a certain standard of performance, indemnification for
liabilities arising out of the Company’s use of leased equipment or other property, or other types of indemnification. Despite the
uncertainty whether events which would trigger the indemnification obligations would ever occur, the Company does not believe that
these indemnity agreements will have a material adverse effect on the Company’s results of operations, financial position or
liquidity. Additionally, the Company believes that, due to lack of historical payment experience, the fair value of indemnities cannot
be estimated with any amount of certainty. However, the fair value of any such amount would be immaterial to the Consolidated
Financial Statements. Agreements that reflect unique circumstances, particularly agreements that contain guarantees that indemnify
for another party’s acts are disclosed separately if appropriate. Unless separately disclosed above, no fair value liability related to
indemnities has been recorded in the Consolidated Financial Statements.
15C Road Initials: BNSF Year 2013
Railroad Annual Report R-1
200. COMPARATIVE STATEMENT OF FINANCIAL POSITION-EXPLANATORY NOTES-Continued
NOTES TO FINANCIAL STATEMENTS
Variable Interest Entities – Leases
BNSF Railway has entered into various equipment lease transactions in which the structure of the lease contains VIEs. These
VIEs were created solely for the lease transactions and have no other activities, assets or liabilities outside of the lease transactions.
In some of the arrangements, BNSF Railway has the option to purchase some or all of the equipment at a fixed-price, thereby
creating variable interests for BNSF Railway in the VIEs. The future minimum lease payments associated with the VIE leases were
approximately $4 billion as of December 31, 2013. The future minimum lease payments are included in future operating lease
payments disclosed in the lease commitments table within Note 3.
In the event the leased equipment is destroyed, BNSF Railway is obligated to either replace the equipment or pay a fixed loss
amount. The inclusion of the fixed loss amount is a standard clause within equipment lease arrangements. Historically, BNSF
Railway has not incurred significant losses related to this clause. As such, it is not anticipated that the maximum exposure to loss
would materially differ from the future minimum lease payments. BNSF Railway does not provide financial support to the VIEs that it was not previously contractually obligated to provide.
BNSF Railway maintains and operates the equipment based on contractual obligations within the lease arrangements, which set
specific guidelines consistent within the industry. As such, BNSF Railway has no control over activities that could materially impact
the fair value of the leased equipment. BNSF Railway does not hold the power to direct the activities of the VIEs and therefore does
not control the ongoing activities that have a significant impact on the economic performance of the VIEs. Additionally, BNSF
Railway does not have the obligation to absorb losses of the VIEs or the right to receive benefits of the VIEs that could potentially be
significant to the VIEs. Depending on market conditions, the fixed-price purchase options could potentially provide benefit to the
Company; however, any benefits potentially received from a fixed-price purchase option are expected to be minimal. Based on
these factors, BNSF Railway is not the primary beneficiary of the VIEs. As BNSF Railway is not the primary beneficiary and the VIE
leases are classified as operating leases, there are no assets or liabilities related to the VIEs recorded in the Company's
Consolidated Balance Sheet.
Personal Injury and Environmental Costs
Personal Injury
Personal injury claims, including asbestos claims and employee work-related injuries and third-party injuries (collectively, other
personal injury), are a significant expense for the railroad industry. Personal injury claims by BNSF Railway employees are subject
to the provisions of the Federal Employers’ Liability Act (FELA) rather than state workers’ compensation laws. FELA’s system of
requiring the finding of fault, coupled with unscheduled awards and reliance on the jury system, contributed to increased expenses
in past years. Other proceedings include claims by non-employees for punitive as well as compensatory damages. A few
proceedings purport to be class actions. The variability present in settling these claims, including non-employee personal injury and
matters in which punitive damages are alleged, could result in increased expenses in future years. BNSF Railway has implemented
a number of safety programs designed to reduce the number of personal injuries as well as the associated claims and personal
injury expense.
BNSF Railway records an undiscounted liability for personal injury claims when the expected loss is both probable and reasonably
estimable. The liability and ultimate expense projections are estimated using standard actuarial methodologies. Liabilities recorded
for unasserted personal injury claims are based on information currently available. Due to the inherent uncertainty involved in
projecting future events such as the number of claims filed each year, developments in judicial and legislative standards and the
average costs to settle projected claims, actual costs may differ from amounts recorded. BNSF Railway has obtained insurance
coverage for certain claims, as discussed under the heading “BNSF Insurance Company.” Expense accruals and any required
adjustments are classified as materials and other in the Consolidated Statements of Income.
Asbestos
The Company is party to a number of personal injury claims by employees and non-employees who may have been exposed to
asbestos. The heaviest exposure for BNSF Railway employees was due to work conducted in and around the use of steam
locomotive engines that were phased out between the years of 1950 and 1967. However, other types of exposures, including
exposure from locomotive component parts and building materials, continued after 1967 until they were substantially eliminated at
BNSF Railway by 1985.
Road Initials: BNSF Year 2013 15D
Railroad Annual Report R-1
200. COMPARATIVE STATEMENT OF FINANCIAL POSITION-EXPLANATORY NOTES-Continued
NOTES TO FINANCIAL STATEMENTS
BNSF Railway assesses its unasserted asbestos liability exposure on an annual basis during the third quarter. BNSF Railway
determines its asbestos liability by estimating its exposed population, the number of claims likely to be filed, the number of claims
that will likely require payment and the estimated cost per claim. Estimated filing and dismissal rates and average cost per claim are
determined utilizing recent claim data and trends.
Key elements of the assessment include:
• Because BNSF Railway did not have detailed employment records in order to compute the population of potentially exposed
employees, it computed an estimate using Company employee data from 1970 forward and estimated the BNSF Railway
employee base from 1938-1969 using railroad industry historical census data and estimating BNSF Railway’s representation
in the total railroad population.
• The projected incidence of disease was estimated based on epidemiological studies using employees’ age, duration and
intensity of exposure while employed.
• An estimate of the future anticipated claims filing rate by type of disease (non-malignant, cancer and mesothelioma) was
computed using the Company’s average historical claim filing rates for the period 2009-2012.
• An estimate of the future anticipated dismissal rate by type of claim was computed using the Company’s historical average
dismissal rates observed in 2010-2012.
• An estimate of the future anticipated settlement by type of disease was computed using the Company’s historical average of
dollars paid per claim for pending and future claims using the average settlement by type of incidence observed during 2010-
2012.
From these assumptions, BNSF Railway projected the incidence of each type of disease to the estimated population to arrive at an
estimate of the total number of employees that could potentially assert a claim. Historical claim filing rates were applied for each
type of disease to the total number of employees that could potentially assert a claim to determine the total number of anticipated
claim filings by disease type. Historical dismissal rates, which represent claims that are closed without payment, were then applied
to calculate the number of future claims by disease type that would likely require payment by the Company. Finally, the number of
such claims was multiplied by the average settlement value to estimate BNSF Railway’s future liability for unasserted asbestos
claims.
The most sensitive assumptions for this accrual are the estimated future filing rates and estimated average claim values. Asbestos
claim filings are typically sporadic and may include large batches of claims solicited by law firms. To reflect these factors, BNSF
Railway used a multi-year calibration period (i.e., the average historical filing rate for the period 2009-2012) because it believed it
would be most representative of its future claim experience. In addition, for non-malignant claims, the number of future claims to be
filed against BNSF Railway declines at a rate consistent with both mortality and age as there is a decreasing propensity to file a
claim as the population ages. BNSF Railway believes the average claim values by type of disease from the historical period 2010-
2012 are most representative of future claim values. Non-malignant claims, which represent approximately 90 percent of the total
number and 65 percent of the cost of estimated future asbestos claims, were priced by age of the projected claimants. Historically,
the ultimate settlement value of these types of claims is most sensitive to the age of the claimant.
During the third quarters of 2013, 2012 and 2011, the Company analyzed recent filing and payment trends to ensure the
assumptions used by BNSF Railway to estimate its future asbestos liability were reasonable. In 2013 and 2011, management
determined that the liability remained appropriate and no change was recorded. In 2012, management recorded a decrease in
expense of $15 million due primarily to favorable settlements. The Company plans to update its study again in the third quarter of
2014.
Throughout the year, BNSF Railway monitors actual experience against the number of forecasted claims and expected claim
payments and will record adjustments to the Company’s estimates as necessary.
15E Road Initials: BNSF Year 2013
Railroad Annual Report R-1
200. COMPARATIVE STATEMENT OF FINANCIAL POSITION-EXPLANATORY NOTES-Continued
NOTES T O FINANCIAL STATEMENTS
Based on BNSF Railway’s estimate of the potentially exposed employees and related mortality assumptions, it is anticipated that
unasserted asbestos claims will continue to be filed through the year 2050. The Company recorded an amount for the full estimated
filing period through 2050 because it had a relatively finite exposed population (former and current employees hired prior to 1985),
which it was able to identify and reasonably estimate and about which it had obtained reliable demographic data (including age, hire
date and occupation) derived from industry or BNSF Railway specific data that was the basis for the study. BNSF Railway projects
that approximately 60, 80 and 95 percent of the future unasserted asbestos claims will be filed within the next 10, 15 and 25 years,
respectively.
Other Personal Injury
BNSF Railway estimates its other personal injury liability claims and expense quarterly based on the covered population, activity
levels and trends in frequency and the costs of covered injuries. Estimates include unasserted claims except for certain repetitive
stress and other occupational trauma claims that allegedly result from prolonged repeated events or exposure. Such claims are
estimated on an as-reported basis because the Company cannot estimate the range of reasonably possible loss due to other non-
work related contributing causes of such injuries and the fact that continued exposure is required for the potential injury to manifest
itself as a claim. BNSF Railway has not experienced any significant adverse trends related to these types of claims in recent years.
Key elements of the actuarial assessment include:
• Size and demographics (employee age and craft) of the workforce.
• Activity levels (manhours by employee craft and carloadings).
• Expected claim frequency rates by type of claim (employee FELA or third-party liability) based on historical claim frequency
trends.
• Expected dismissal rates by type of claim based on historical dismissal rates.
• Expected average paid amounts by type of claim for open and incurred but not reported claims that eventually close with
payment.
From these assumptions, BNSF Railway estimates the number of open claims by accident year that will likely require payment by
the Company. The projected number of open claims by accident year that will require payment is multiplied by the expected average
cost per claim by accident year and type to determine BNSF Railway’s estimated liability for all asserted claims. Additionally, BNSF
Railway estimates the number of its incurred but not reported claims that will likely result in payment based upon historical
emergence patterns by type of claim. The estimated number of projected claims by accident year requiring payment is multiplied by
the expected average cost per claim by accident year and type to determine BNSF Railway’s estimated liability for incurred but not
reported claims.
BNSF Railway monitors quarterly actual experience against the number of forecasted claims to be received, the forecasted number
of claims closing with payment and expected claim payments. Adjustments to the Company’s estimates are recorded quarterly as
necessary or more frequently as new events or revised estimates develop.
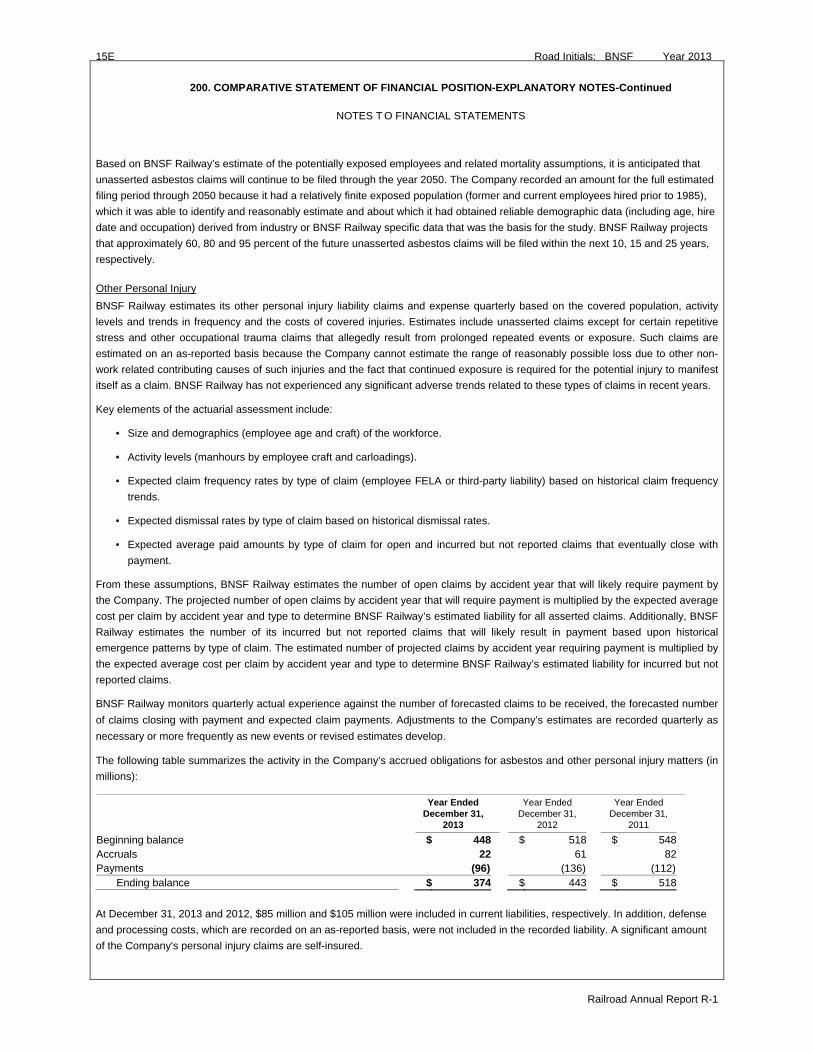
The following table summarizes the activity in the Company’s accrued obligations for asbestos and other personal injury matters (in
millions):
Year Ended December 31,
2013
Year Ended December 31,
2012
Year Ended December 31,
2011 Beginning balance $ 448 $ 518 $ 548Accruals 22 61 82Payments (96) (136) (112) Ending balance $ 374 $ 443 $ 518
At December 31, 2013 and 2012, $85 million and $105 million were included in current liabilities, respectively. In addition, defense
and processing costs, which are recorded on an as-reported basis, were not included in the recorded liability. A significant amount
of the Company's personal injury claims are self-insured.
Road Initials: BNSF Year 2013 15F
Railroad Annual Report R-1
200. COMPARATIVE STATEMENT OF FINANCIAL POSITION-EXPLANATORY NOTES-Continued
NOTES T O FINANCIAL STATEMENTS
Because of the uncertainty surrounding the ultimate outcome of personal injury claims, it is reasonably possible that future costs to
settle personal injury claims may range from approximately $327 million to $442 million. However, BNSF Railway believes that the
$374 million recorded at December 31, 2013, is the best estimate of the Company’s future obligation for the settlement of personal
injury claims.
The amounts recorded by BNSF Railway for personal injury liabilities were based upon currently known facts. Future events, such
as the number of new claims to be filed each year, the average cost of disposing of claims, as well as the numerous uncertainties
surrounding personal injury litigation in the United States, could cause the actual costs to be higher or lower than projected.
Although the final outcome of personal injury matters cannot be predicted with certainty, considering among other things the
meritorious legal defenses available and liabilities that have been recorded, it is the opinion of BNSF Railway that none of these
items, when finally resolved, will have a material adverse effect on the Company’s financial position or liquidity. However, the
occurrence of a number of these items in the same period could have a material adverse effect on the results of operations in a
particular quarter or fiscal year.
BNSF Insurance Company
Burlington Northern Santa Fe Insurance Company, Ltd. (BNSF IC), a wholly-owned subsidiary of BNSF, provides insurance
coverage for certain risks, FELA claims, railroad protective and force account insurance claims and certain excess general liability
and property coverage, and certain other claims which are subject to reinsurance. During the years ended December 31, 2013,
2012 and 2011, BNSF IC wrote insurance coverage with premiums totaling $96 million, $114 million and $118 million, respectively,
for BNSF Railway, net of reimbursements from third parties. During this same time, BNSF Railway recognized $98 million, $112
million and $115 million, respectively, in expense related to those premiums, which is classified as purchased services in the
Consolidated Statements of Income. At December 31, 2013, unamortized premiums remaining on the Consolidated Balance Sheet
were $7 million. During the years ended December 31, 2013, 2012 and 2011, BNSF IC made claim payments totaling $127 million,
$116 million and $56 million, respectively, for settlement of covered claims. At December 31, 2013 and 2012, claims receivables
from BNSF IC were $35 million and $5 million, respectively.
Environmental
The Company’s operations, as well as those of its competitors, are subject to extensive federal, state and local environmental
regulation. BNSF Railway’s operating procedures include practices to protect the environment from the risks inherent in railroad
operations, which frequently involve transporting chemicals and other hazardous materials. Additionally, many of BNSF Railway’s
land holdings are and have been used for industrial or transportation-related purposes or leased to commercial or industrial
companies whose activities may have resulted in discharges onto the property. As a result, BNSF Railway is subject to
environmental cleanup and enforcement actions. In particular, the federal Comprehensive Environmental Response, Compensation
and Liability Act of 1980 (CERCLA), also known as the Superfund law, as well as similar state laws, generally impose joint and
several liability for cleanup and enforcement costs on current and former owners and operators of a site without regard to fault or the
legality of the original conduct. BNSF Railway has been notified that it is a potentially responsible party (PRP) for study and cleanup
costs at Superfund sites for which investigation and remediation payments are or will be made or are yet to be determined (the
Superfund sites) and, in many instances, is one of several PRPs. In addition, BNSF Railway may be considered a PRP under
certain other laws. Accordingly, under CERCLA and other federal and state statutes, BNSF Railway may be held jointly and
severally liable for all environmental costs associated with a particular site. If there are other PRPs, BNSF Railway generally
participates in the cleanup of these sites through cost-sharing agreements with terms that vary from site to site. Costs are typically
allocated based on such factors as relative volumetric contribution of material, the amount of time the site was owned or operated
and/or the portion of the total site owned or operated by each PRP.
BNSF Railway is involved in a number of administrative and judicial proceedings and other mandatory cleanup efforts for 244 sites,
including 16 Superfund sites, at which it is participating in the study or cleanup, or both, of alleged environmental contamination.
Liabilities for environmental cleanup costs are recorded when BNSF Railway’s liability for environmental cleanup is probable and
reasonably estimable. Subsequent adjustments to initial estimates are recorded as necessary based upon additional information
developed in subsequent periods. Environmental costs include initial site surveys and environmental studies as well as costs for
remediation of sites determined to be contaminated.
15G Road Initials: BNSF Year 2013
Railroad Annual Report R-1
200. COMPARATIVE STATEMENT OF FINANCIAL POSITION-EXPLANATORY NOTES-Continued
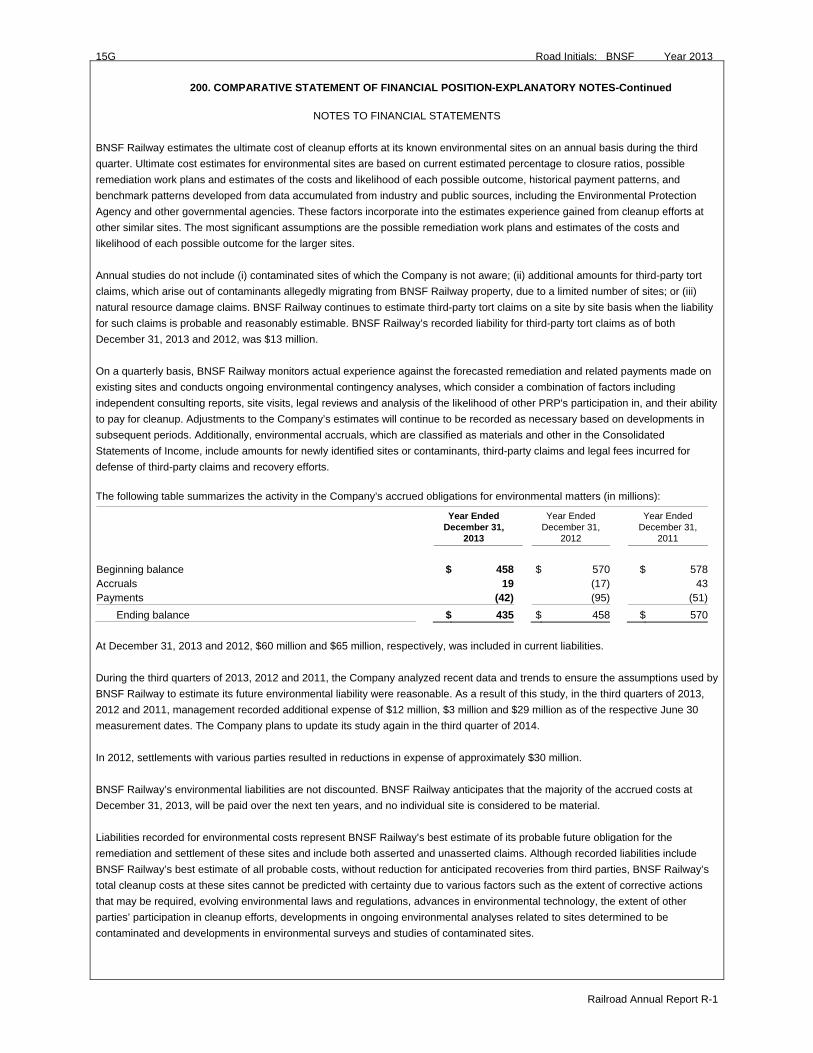
NOTES TO FINANCIAL STATEMENTS
BNSF Railway estimates the ultimate cost of cleanup efforts at its known environmental sites on an annual basis during the third
quarter. Ultimate cost estimates for environmental sites are based on current estimated percentage to closure ratios, possible
remediation work plans and estimates of the costs and likelihood of each possible outcome, historical payment patterns, and
benchmark patterns developed from data accumulated from industry and public sources, including the Environmental Protection
Agency and other governmental agencies. These factors incorporate into the estimates experience gained from cleanup efforts at
other similar sites. The most significant assumptions are the possible remediation work plans and estimates of the costs and
likelihood of each possible outcome for the larger sites.
Annual studies do not include (i) contaminated sites of which the Company is not aware; (ii) additional amounts for third-party tort
claims, which arise out of contaminants allegedly migrating from BNSF Railway property, due to a limited number of sites; or (iii)
natural resource damage claims. BNSF Railway continues to estimate third-party tort claims on a site by site basis when the liability
for such claims is probable and reasonably estimable. BNSF Railway’s recorded liability for third-party tort claims as of both
December 31, 2013 and 2012, was $13 million.
On a quarterly basis, BNSF Railway monitors actual experience against the forecasted remediation and related payments made on
existing sites and conducts ongoing environmental contingency analyses, which consider a combination of factors including
independent consulting reports, site visits, legal reviews and analysis of the likelihood of other PRP's participation in, and their ability
to pay for cleanup. Adjustments to the Company’s estimates will continue to be recorded as necessary based on developments in
subsequent periods. Additionally, environmental accruals, which are classified as materials and other in the Consolidated
Statements of Income, include amounts for newly identified sites or contaminants, third-party claims and legal fees incurred for
defense of third-party claims and recovery efforts.
The following table summarizes the activity in the Company’s accrued obligations for environmental matters (in millions):
Year Ended December 31,
2013
Year Ended December 31,
2012
Year Ended December 31,
2011
Beginning balance $ 458 $ 570 $ 578Accruals 19 (17) 43Payments (42) (95) (51)
Ending balance $ 435 $ 458 $ 570
At December 31, 2013 and 2012, $60 million and $65 million, respectively, was included in current liabilities.
During the third quarters of 2013, 2012 and 2011, the Company analyzed recent data and trends to ensure the assumptions used by
BNSF Railway to estimate its future environmental liability were reasonable. As a result of this study, in the third quarters of 2013,
2012 and 2011, management recorded additional expense of $12 million, $3 million and $29 million as of the respective June 30
measurement dates. The Company plans to update its study again in the third quarter of 2014.
In 2012, settlements with various parties resulted in reductions in expense of approximately $30 million.
BNSF Railway’s environmental liabilities are not discounted. BNSF Railway anticipates that the majority of the accrued costs at
December 31, 2013, will be paid over the next ten years, and no individual site is considered to be material.
Liabilities recorded for environmental costs represent BNSF Railway’s best estimate of its probable future obligation for the
remediation and settlement of these sites and include both asserted and unasserted claims. Although recorded liabilities include
BNSF Railway’s best estimate of all probable costs, without reduction for anticipated recoveries from third parties, BNSF Railway’s
total cleanup costs at these sites cannot be predicted with certainty due to various factors such as the extent of corrective actions
that may be required, evolving environmental laws and regulations, advances in environmental technology, the extent of other
parties’ participation in cleanup efforts, developments in ongoing environmental analyses related to sites determined to be
contaminated and developments in environmental surveys and studies of contaminated sites.
Road Initials: BNSF Year 2013 15H
Railroad Annual Report R-1
200. COMPARATIVE STATEMENT OF FINANCIAL POSITION-EXPLANATORY NOTES-Continued
NOTES TO FINANCIAL STATEMENTS
Because of the uncertainty surrounding these factors, it is reasonably possible that future costs for environmental liabilities may
range from approximately $330 million to $600 million. However, BNSF Railway believes that the $435 million recorded at
December 31, 2013, is the best estimate of the Company’s future obligation for environmental costs.
Although the final outcome of these environmental matters cannot be predicted with certainty, it is the opinion of BNSF Railway that
none of these items, when finally resolved, will have a material adverse effect on the Company’s financial position or liquidity.
However, the occurrence of a number of these items in the same period could have a material adverse effect on the results of
operations in a particular quarter or fiscal year.
Other Claims and Litigation
In addition to asbestos, other personal injury and environmental matters discussed above, BNSF Railway and its subsidiaries are
also parties to a number of other legal actions and claims, governmental proceedings and private civil suits arising in the ordinary
course of business, including those related to disputes and complaints involving certain transportation rates and charges. Some of
the legal proceedings include claims for punitive as well as compensatory damages, and a few proceedings purport to be class
actions. Although the final outcome of these matters cannot be predicted with certainty, considering among other things the
meritorious legal defenses available and liabilities that have been recorded along with applicable insurance, BNSF Railway currently
believes that none of these items, when finally resolved, will have a material adverse effect on the Company’s financial position or
liquidity. However, an unexpected adverse resolution of one or more of these items could have a material adverse effect on the
results of operations in a particular quarter or fiscal year.
Note 4
Hedging Activities
Fuel
Fuel costs represented 30 percent, 31 percent and 31 percent of total operating expenses during the years ended December 31,
2013, 2012 and 2011, respectively. The Company may enter into fuel hedge instruments from time to time; however, the Company
had no unexpired hedge positions as of December 31, 2013 and 2012.
Derivative Activities
The Company had formally documented the relationship between the hedging instrument and the hedged item, as well as the risk
management objective and strategy for the use of the hedging instrument. This documentation included linking the derivatives that
were designated as fair value cash flow hedges to specific assets or liabilities on the balance sheet, commitments or forecasted
transactions. The Company assessed at the time a derivative contract is entered into, and at least quarterly thereafter, whether the
derivative item is effective in offsetting the changes in fair value or cash flows. Any change in fair value resulting from
ineffectiveness, as defined by authoritative accounting guidance related to derivatives and hedging, was recognized in current
period earnings. For derivative instruments that were designated and qualify as cash flow hedges, the effective portion of the gain or
loss on the derivative instrument was recorded in accumulated other comprehensive loss (AOCI) as a separate component of equity
and reclassified into earnings in the period during which the hedge transaction affects earnings. Cash flows related to fuel
derivatives are classified as operating activities in the Consolidated Statements of Cash Flows.
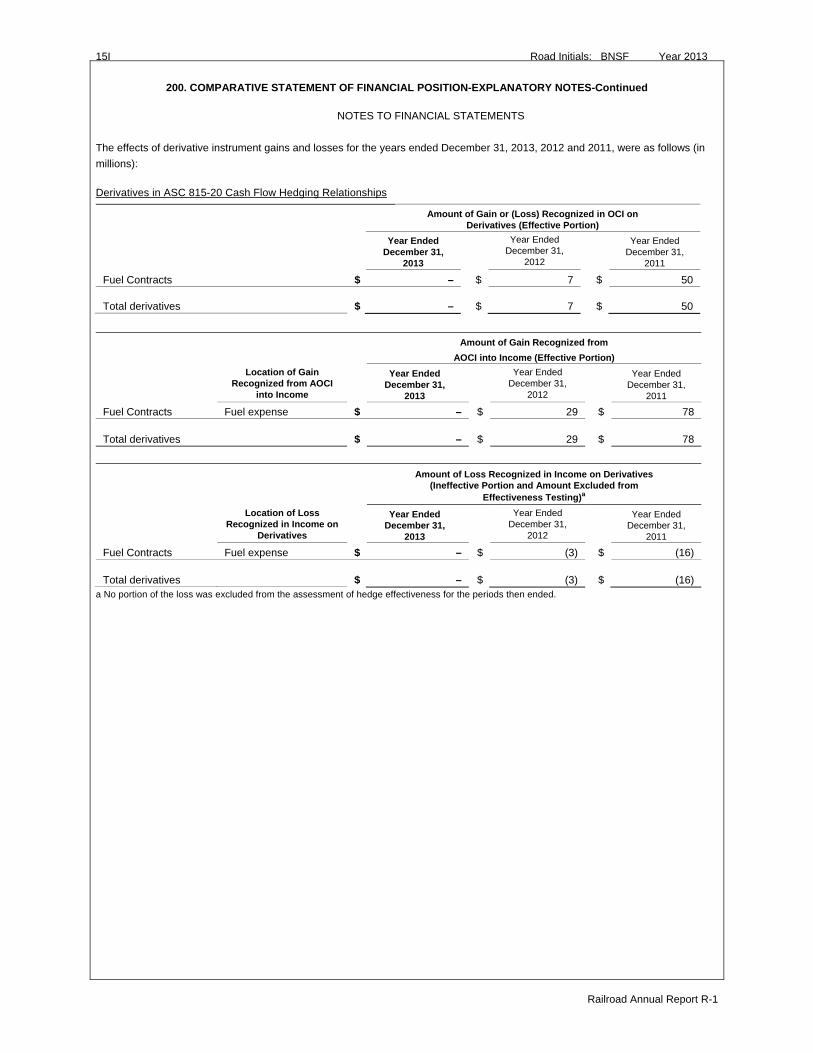
15I Road Initials: BNSF Year 2013
Railroad Annual Report R-1
200. COMPARATIVE STATEMENT OF FINANCIAL POSITION-EXPLANATORY NOTES-Continued
NOTES TO FINANCIAL STATEMENTS
The effects of derivative instrument gains and losses for the years ended December 31, 2013, 2012 and 2011, were as follows (in
millions):
Derivatives in ASC 815-20 Cash Flow Hedging Relationships
Amount of Gain or (Loss) Recognized in OCI on Derivatives (Effective Portion)
Year Ended December 31,
2013
Year Ended December 31,
2012
Year Ended December 31,
2011
Fuel Contracts $ – $ 7 $ 50
Total derivatives $ – $ 7 $ 50
Amount of Gain Recognized from
AOCI into Income (Effective Portion)
Location of Gain Recognized from AOCI
into Income
Year Ended December 31,
2013
Year Ended December 31,
2012
Year Ended December 31,
2011
Fuel Contracts Fuel expense $ – $ 29 $ 78
Total derivatives $ – $ 29 $ 78
Amount of Loss Recognized in Income on Derivatives
(Ineffective Portion and Amount Excluded from Effectiveness Testing)a
Location of Loss Recognized in Income on
Derivatives
Year Ended December 31,
2013
Year Ended December 31,
2012
Year Ended December 31,
2011
Fuel Contracts Fuel expense $ – $ (3) $ (16)
Total derivatives $ – $ (3) $ (16) a No portion of the loss was excluded from the assessment of hedge effectiveness for the periods then ended.
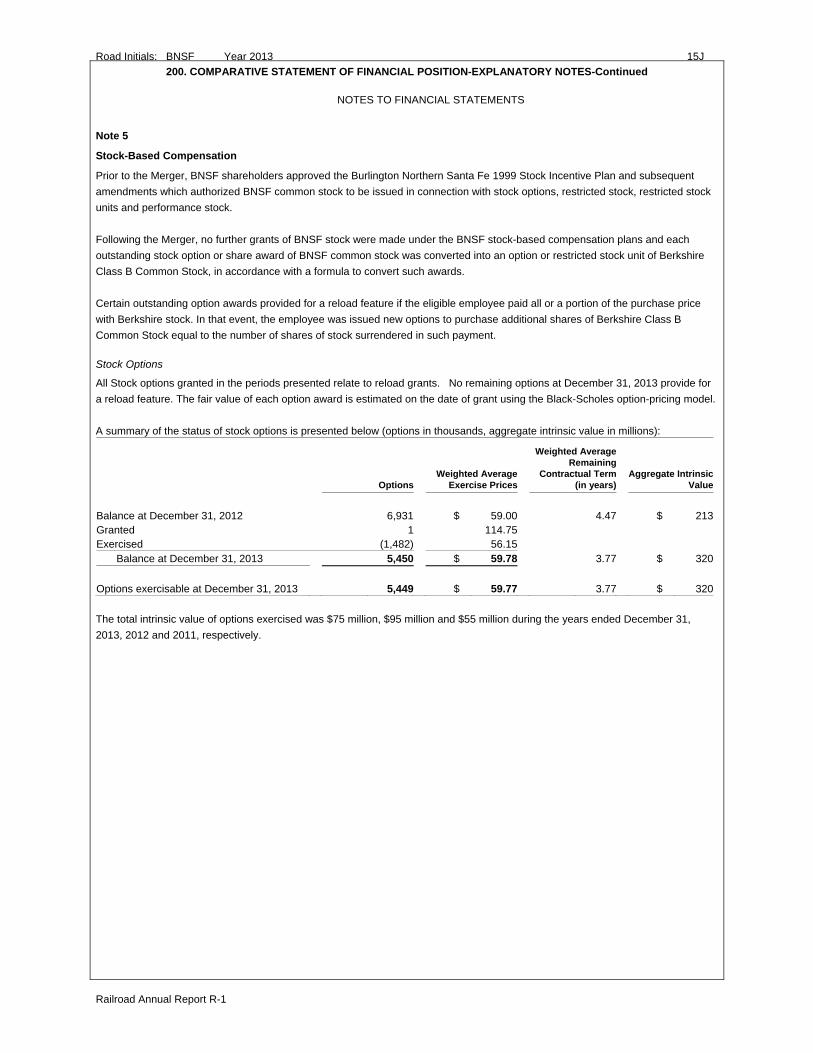
Road Initials: BNSF Year 2013 15J
Railroad Annual Report R-1
200. COMPARATIVE STATEMENT OF FINANCIAL POSITION-EXPLANATORY NOTES-Continued
NOTES TO FINANCIAL STATEMENTS
Note 5
Stock-Based Compensation
Prior to the Merger, BNSF shareholders approved the Burlington Northern Santa Fe 1999 Stock Incentive Plan and subsequent
amendments which authorized BNSF common stock to be issued in connection with stock options, restricted stock, restricted stock
units and performance stock.
Following the Merger, no further grants of BNSF stock were made under the BNSF stock-based compensation plans and each
outstanding stock option or share award of BNSF common stock was converted into an option or restricted stock unit of Berkshire
Class B Common Stock, in accordance with a formula to convert such awards.
Certain outstanding option awards provided for a reload feature if the eligible employee paid all or a portion of the purchase price
with Berkshire stock. In that event, the employee was issued new options to purchase additional shares of Berkshire Class B
Common Stock equal to the number of shares of stock surrendered in such payment.
Stock Options
All Stock options granted in the periods presented relate to reload grants. No remaining options at December 31, 2013 provide for
a reload feature. The fair value of each option award is estimated on the date of grant using the Black-Scholes option-pricing model.
A summary of the status of stock options is presented below (options in thousands, aggregate intrinsic value in millions):
OptionsWeighted Average
Exercise Prices
Weighted Average Remaining
Contractual Term (in years)
Aggregate Intrinsic Value
Balance at December 31, 2012 6,931 $ 59.00 4.47 $ 213 Granted 1 114.75 Exercised (1,482) 56.15 Balance at December 31, 2013 5,450 $ 59.78 3.77 $ 320
Options exercisable at December 31, 2013 5,449 $ 59.77 3.77 $ 320
The total intrinsic value of options exercised was $75 million, $95 million and $55 million during the years ended December 31,
2013, 2012 and 2011, respectively.
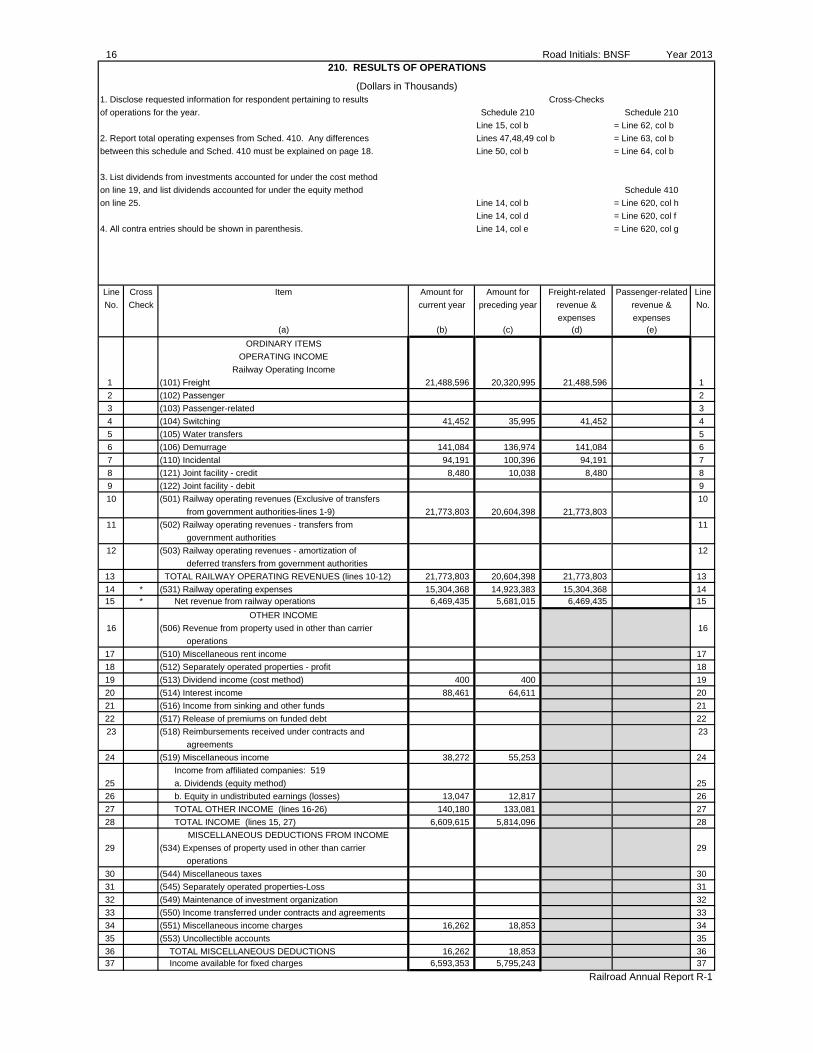
16 Road Initials: BNSF Year 2013210. RESULTS OF OPERATIONS
(Dollars in Thousands)1. Disclose requested information for respondent pertaining to results Cross-Checks
of operations for the year. Schedule 210 Schedule 210
Line 15, col b = Line 62, col b
2. Report total operating expenses from Sched. 410. Any differences Lines 47,48,49 col b = Line 63, col b
between this schedule and Sched. 410 must be explained on page 18. Line 50, col b = Line 64, col b
3. List dividends from investments accounted for under the cost method
on line 19, and list dividends accounted for under the equity method Schedule 410
on line 25. Line 14, col b = Line 620, col h
Line 14, col d = Line 620, col f
4. All contra entries should be shown in parenthesis. Line 14, col e = Line 620, col g
Line Cross Item Amount for Amount for Freight-related Passenger-related Line
No. Check current year preceding year revenue & revenue & No.
expenses expenses(a) (b) (c) (d) (e)
ORDINARY ITEMS
OPERATING INCOME
Railway Operating Income
1 (101) Freight 21,488,596 20,320,995 21,488,596 1
2 (102) Passenger 2
3 (103) Passenger-related 3
4 (104) Switching 41,452 35,995 41,452 4
5 (105) Water transfers 5
6 (106) Demurrage 141,084 136,974 141,084 6
7 (110) Incidental 94,191 100,396 94,191 7
8 (121) Joint facility - credit 8,480 10,038 8,480 8
9 (122) Joint facility - debit 9
10 (501) Railway operating revenues (Exclusive of transfers 10
from government authorities-lines 1-9) 21,773,803 20,604,398 21,773,803
11 (502) Railway operating revenues - transfers from 11
government authorities
12 (503) Railway operating revenues - amortization of 12
deferred transfers from government authorities
13 TOTAL RAILWAY OPERATING REVENUES (lines 10-12) 21,773,803 20,604,398 21,773,803 13
14 * (531) Railway operating expenses 15,304,368 14,923,383 15,304,368 1415 * Net revenue from railway operations 6,469,435 5,681,015 6,469,435 15
OTHER INCOME
16 (506) Revenue from property used in other than carrier 16
operations
17 (510) Miscellaneous rent income 17
18 (512) Separately operated properties - profit 18
19 (513) Dividend income (cost method) 400 400 19
20 (514) Interest income 88,461 64,611 20
21 (516) Income from sinking and other funds 21
22 (517) Release of premiums on funded debt 22
23 (518) Reimbursements received under contracts and 23
agreements
24 (519) Miscellaneous income 38,272 55,253 24
Income from affiliated companies: 519
25 a. Dividends (equity method) 25
26 b. Equity in undistributed earnings (losses) 13,047 12,817 26
27 TOTAL OTHER INCOME (lines 16-26) 140,180 133,081 27
28 TOTAL INCOME (lines 15, 27) 6,609,615 5,814,096 28
MISCELLANEOUS DEDUCTIONS FROM INCOME
29 (534) Expenses of property used in other than carrier 29
operations
30 (544) Miscellaneous taxes 30
31 (545) Separately operated properties-Loss 31
32 (549) Maintenance of investment organization 32
33 (550) Income transferred under contracts and agreements 33
34 (551) Miscellaneous income charges 16,262 18,853 34
35 (553) Uncollectible accounts 35
36 TOTAL MISCELLANEOUS DEDUCTIONS 16,262 18,853 3637 Income available for fixed charges 6,593,353 5,795,243 37
Railroad Annual Report R-1
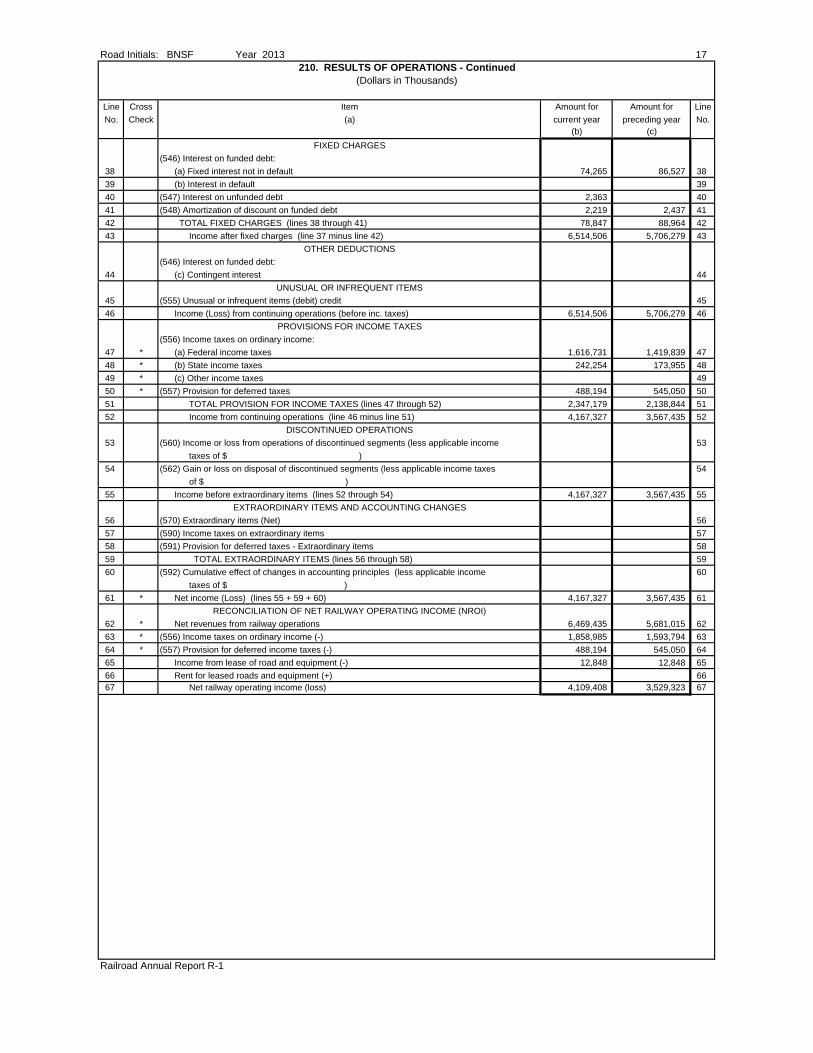
Road Initials: BNSF Year 2013 17210. RESULTS OF OPERATIONS - Continued
(Dollars in Thousands)
Line Cross Item Amount for Amount for Line
No. Check (a) current year preceding year No.(b) (c)
FIXED CHARGES
(546) Interest on funded debt:
38 (a) Fixed interest not in default 74,265 86,527 38
39 (b) Interest in default 39
40 (547) Interest on unfunded debt 2,363 40
41 (548) Amortization of discount on funded debt 2,219 2,437 41
42 TOTAL FIXED CHARGES (lines 38 through 41) 78,847 88,964 42
43 Income after fixed charges (line 37 minus line 42) 6,514,506 5,706,279 43
OTHER DEDUCTIONS
(546) Interest on funded debt:
44 (c) Contingent interest 44
UNUSUAL OR INFREQUENT ITEMS
45 (555) Unusual or infrequent items (debit) credit 45
46 Income (Loss) from continuing operations (before inc. taxes) 6,514,506 5,706,279 46
PROVISIONS FOR INCOME TAXES
(556) Income taxes on ordinary income:
47 * (a) Federal income taxes 1,616,731 1,419,839 47
48 * (b) State income taxes 242,254 173,955 48
49 * (c) Other income taxes 49
50 * (557) Provision for deferred taxes 488,194 545,050 50
51 TOTAL PROVISION FOR INCOME TAXES (lines 47 through 52) 2,347,179 2,138,844 51
52 Income from continuing operations (line 46 minus line 51) 4,167,327 3,567,435 52
DISCONTINUED OPERATIONS
53 (560) Income or loss from operations of discontinued segments (less applicable income 53
taxes of $ )
54 (562) Gain or loss on disposal of discontinued segments (less applicable income taxes 54
of $ )
55 Income before extraordinary items (lines 52 through 54) 4,167,327 3,567,435 55
EXTRAORDINARY ITEMS AND ACCOUNTING CHANGES
56 (570) Extraordinary items (Net) 56
57 (590) Income taxes on extraordinary items 57
58 (591) Provision for deferred taxes - Extraordinary items 58
59 TOTAL EXTRAORDINARY ITEMS (lines 56 through 58) 59
60 (592) Cumulative effect of changes in accounting principles (less applicable income 60
taxes of $ )
61 * Net income (Loss) (lines 55 + 59 + 60) 4,167,327 3,567,435 61
RECONCILIATION OF NET RAILWAY OPERATING INCOME (NROI)
62 * Net revenues from railway operations 6,469,435 5,681,015 62
63 * (556) Income taxes on ordinary income (-) 1,858,985 1,593,794 63
64 * (557) Provision for deferred income taxes (-) 488,194 545,050 64
65 Income from lease of road and equipment (-) 12,848 12,848 65
66 Rent for leased roads and equipment (+) 6667 Net railway operating income (loss) 4,109,408 3,529,323 67
Railroad Annual Report R-1
18 Road Initials: BNSF Year 2013
Railroad Annual Report R-1
NOTES AND REMARKS FOR SCHEDULE 210 AND 220
THIS PAGE INTENTIONALLY LEFT BLANK
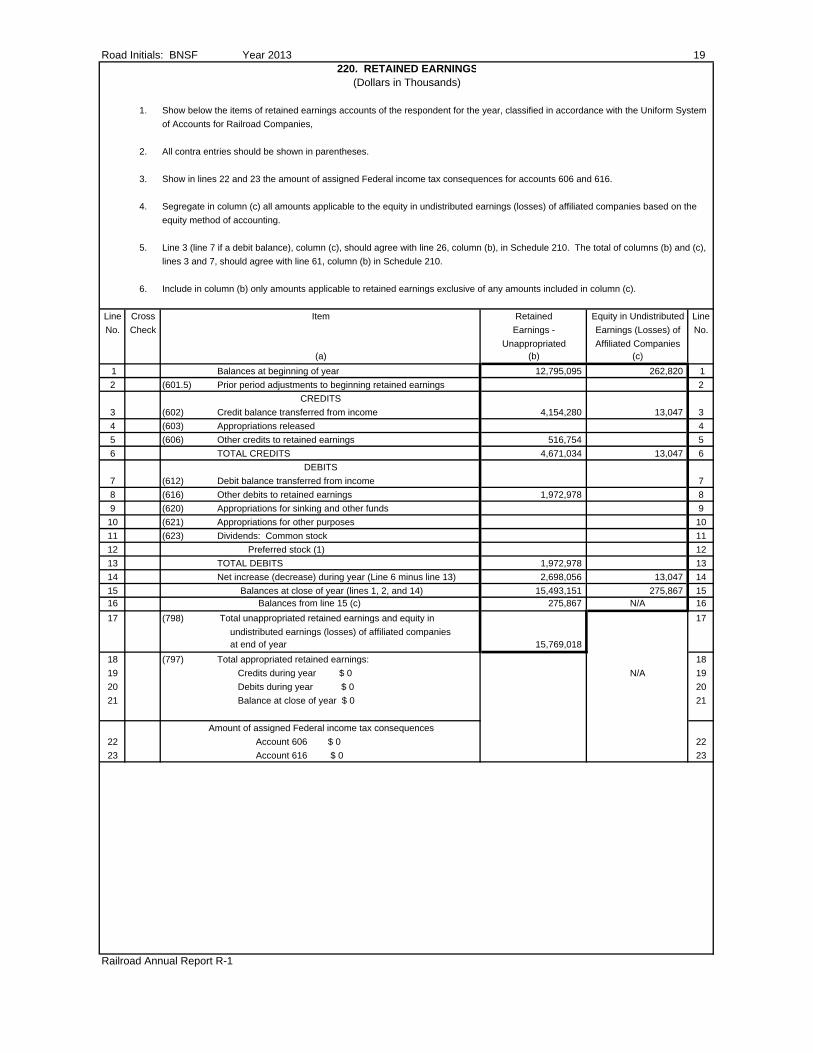
Road Initials: BNSF Year 2013 19220. RETAINED EARNINGS
(Dollars in Thousands)
1. Show below the items of retained earnings accounts of the respondent for the year, classified in accordance with the Uniform System
of Accounts for Railroad Companies,
2. All contra entries should be shown in parentheses.
3. Show in lines 22 and 23 the amount of assigned Federal income tax consequences for accounts 606 and 616.
4. Segregate in column (c) all amounts applicable to the equity in undistributed earnings (losses) of affiliated companies based on the
equity method of accounting.
5. Line 3 (line 7 if a debit balance), column (c), should agree with line 26, column (b), in Schedule 210. The total of columns (b) and (c),
lines 3 and 7, should agree with line 61, column (b) in Schedule 210.
6. Include in column (b) only amounts applicable to retained earnings exclusive of any amounts included in column (c).
Line Cross Item Retained Equity in Undistributed Line
No. Check Earnings - Earnings (Losses) of No.
Unappropriated Affiliated Companies(a) (b) (c)
1 Balances at beginning of year 12,795,095 262,820 1
2 (601.5) Prior period adjustments to beginning retained earnings 2
CREDITS
3 (602) Credit balance transferred from income 4,154,280 13,047 3
4 (603) Appropriations released 4
5 (606) Other credits to retained earnings 516,754 5
6 TOTAL CREDITS 4,671,034 13,047 6
DEBITS
7 (612) Debit balance transferred from income 7
8 (616) Other debits to retained earnings 1,972,978 8
9 (620) Appropriations for sinking and other funds 9
10 (621) Appropriations for other purposes 10
11 (623) Dividends: Common stock 11
12 Preferred stock (1) 12
13 TOTAL DEBITS 1,972,978 13
14 Net increase (decrease) during year (Line 6 minus line 13) 2,698,056 13,047 14
15 Balances at close of year (lines 1, 2, and 14) 15,493,151 275,867 1516 Balances from line 15 (c) 275,867 N/A 16
17 (798) Total unappropriated retained earnings and equity in 17
undistributed earnings (losses) of affiliated companies at end of year 15,769,018
18 (797) Total appropriated retained earnings: 18
19 Credits during year $ 0 N/A 19
20 Debits during year $ 0 20
21 Balance at close of year $ 0 21
Amount of assigned Federal income tax consequences
22 Account 606 $ 0 22
23 Account 616 $ 0 23
Railroad Annual Report R-1
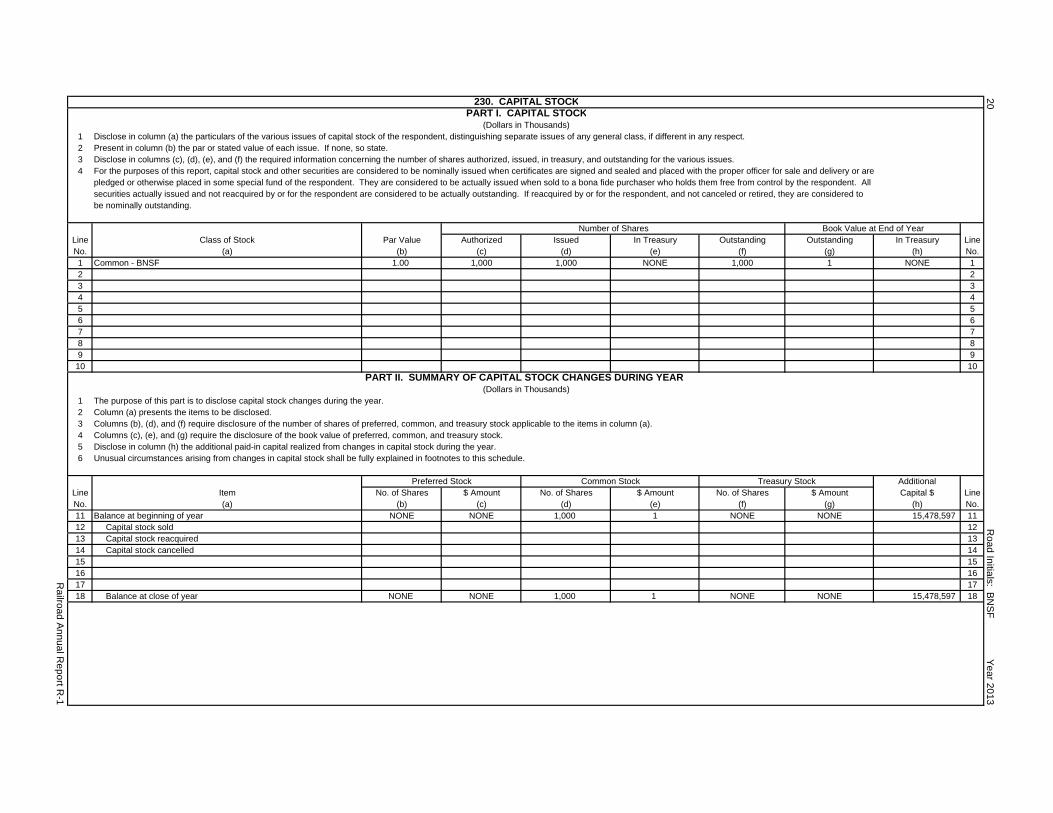
230. CAPITAL STOCKPART I. CAPITAL STOCK
(Dollars in Thousands)1 Disclose in column (a) the particulars of the various issues of capital stock of the respondent, distinguishing separate issues of any general class, if different in any respect.2 Present in column (b) the par or stated value of each issue. If none, so state.3 Disclose in columns (c), (d), (e), and (f) the required information concerning the number of shares authorized, issued, in treasury, and outstanding for the various issues.4 For the purposes of this report, capital stock and other securities are considered to be nominally issued when certificates are signed and sealed and placed with the proper officer for sale and delivery or are
pledged or otherwise placed in some special fund of the respondent. They are considered to be actually issued when sold to a bona fide purchaser who holds them free from control by the respondent. All securities actually issued and not reacquired by or for the respondent are considered to be actually outstanding. If reacquired by or for the respondent, and not canceled or retired, they are considered tobe nominally outstanding.
Number of Shares Book Value at End of YearLine Class of Stock Par Value Authorized Issued In Treasury Outstanding Outstanding In Treasury LineNo. (a) (b) (c) (d) (e) (f) (g) (h) No.1 Common - BNSF 1.00 1,000 1,000 NONE 1,000 1 NONE 12 23 34 45 56 67 78 89 910 10
PART II. SUMMARY OF CAPITAL STOCK CHANGES DURING YEAR (Dollars in Thousands)
1 The purpose of this part is to disclose capital stock changes during the year.2 Column (a) presents the items to be disclosed.3 Columns (b), (d), and (f) require disclosure of the number of shares of preferred, common, and treasury stock applicable to the items in column (a).4 Columns (c), (e), and (g) require the disclosure of the book value of preferred, common, and treasury stock.5 Disclose in column (h) the additional paid-in capital realized from changes in capital stock during the year.6 Unusual circumstances arising from changes in capital stock shall be fully explained in footnotes to this schedule.
Preferred Stock Common Stock Treasury Stock AdditionalLine Item No. of Shares $ Amount No. of Shares $ Amount No. of Shares $ Amount Capital $ LineNo. (a) (b) (c) (d) (e) (f) (g) (h) No.11 Balance at beginning of year NONE NONE 1,000 1 NONE NONE 15,478,597 1112 Capital stock sold 1213 Capital stock reacquired 1314 Capital stock cancelled 1415 1516 1617 1718 Balance at close of year NONE NONE 1,000 1 NONE NONE 15,478,597 18
20
Ro
ad
Initia
ls: BN
SF
Ye
ar 2
01
3
Ra
ilroa
d A
nn
ua
l Re
po
rt R-1
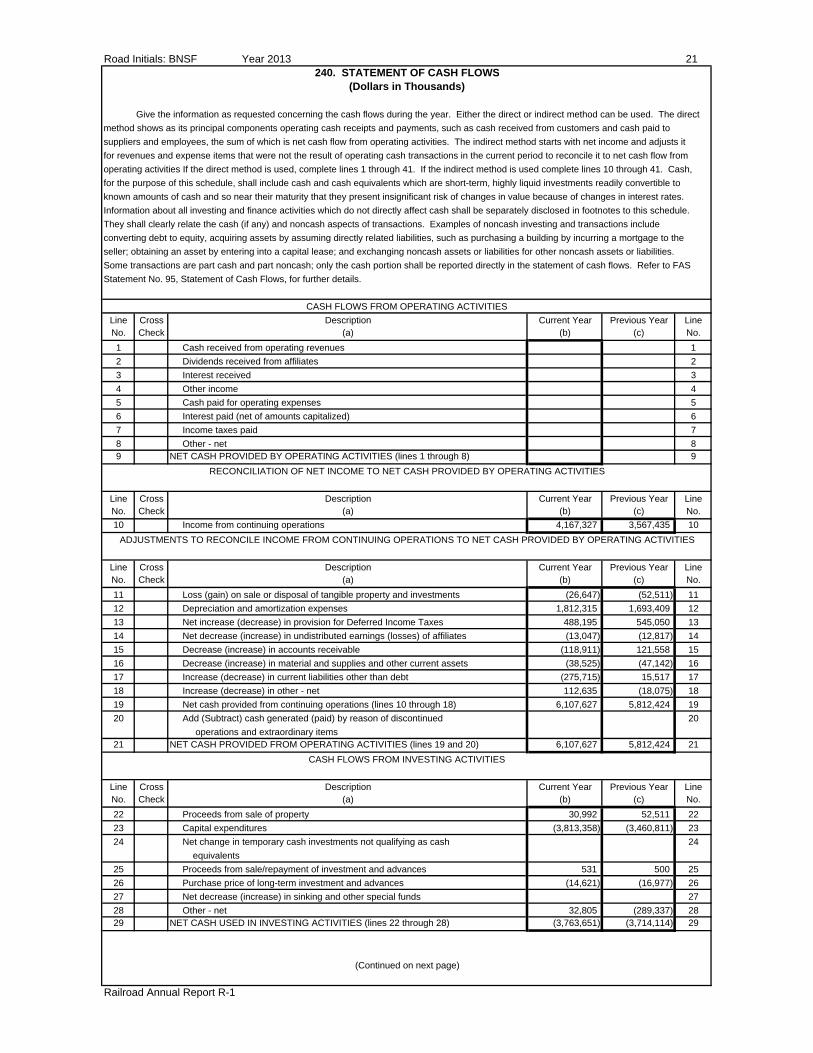
Road Initials: BNSF Year 2013 21240. STATEMENT OF CASH FLOWS
(Dollars in Thousands)
Give the information as requested concerning the cash flows during the year. Either the direct or indirect method can be used. The direct
method shows as its principal components operating cash receipts and payments, such as cash received from customers and cash paid to
suppliers and employees, the sum of which is net cash flow from operating activities. The indirect method starts with net income and adjusts it
for revenues and expense items that were not the result of operating cash transactions in the current period to reconcile it to net cash flow from
operating activities If the direct method is used, complete lines 1 through 41. If the indirect method is used complete lines 10 through 41. Cash,
for the purpose of this schedule, shall include cash and cash equivalents which are short-term, highly liquid investments readily convertible to
known amounts of cash and so near their maturity that they present insignificant risk of changes in value because of changes in interest rates.
Information about all investing and finance activities which do not directly affect cash shall be separately disclosed in footnotes to this schedule.
They shall clearly relate the cash (if any) and noncash aspects of transactions. Examples of noncash investing and transactions include
converting debt to equity, acquiring assets by assuming directly related liabilities, such as purchasing a building by incurring a mortgage to the
seller; obtaining an asset by entering into a capital lease; and exchanging noncash assets or liabilities for other noncash assets or liabilities.
Some transactions are part cash and part noncash; only the cash portion shall be reported directly in the statement of cash flows. Refer to FAS
Statement No. 95, Statement of Cash Flows, for further details.
CASH FLOWS FROM OPERATING ACTIVITIES
Line Cross Description Current Year Previous Year LineNo. Check (a) (b) (c) No.
1 Cash received from operating revenues 1
2 Dividends received from affiliates 2
3 Interest received 3
4 Other income 4
5 Cash paid for operating expenses 5
6 Interest paid (net of amounts capitalized) 6
7 Income taxes paid 7
8 Other - net 89 NET CASH PROVIDED BY OPERATING ACTIVITIES (lines 1 through 8) 9
RECONCILIATION OF NET INCOME TO NET CASH PROVIDED BY OPERATING ACTIVITIES
Line Cross Description Current Year Previous Year LineNo. Check (a) (b) (c) No.
10 Income from continuing operations 4,167,327 3,567,435 10
ADJUSTMENTS TO RECONCILE INCOME FROM CONTINUING OPERATIONS TO NET CASH PROVIDED BY OPERATING ACTIVITIES
Line Cross Description Current Year Previous Year LineNo. Check (a) (b) (c) No.
11 Loss (gain) on sale or disposal of tangible property and investments (26,647) (52,511) 11
12 Depreciation and amortization expenses 1,812,315 1,693,409 12
13 Net increase (decrease) in provision for Deferred Income Taxes 488,195 545,050 13
14 Net decrease (increase) in undistributed earnings (losses) of affiliates (13,047) (12,817) 14
15 Decrease (increase) in accounts receivable (118,911) 121,558 15
16 Decrease (increase) in material and supplies and other current assets (38,525) (47,142) 16
17 Increase (decrease) in current liabilities other than debt (275,715) 15,517 17
18 Increase (decrease) in other - net 112,635 (18,075) 18
19 Net cash provided from continuing operations (lines 10 through 18) 6,107,627 5,812,424 19
20 Add (Subtract) cash generated (paid) by reason of discontinued 20
operations and extraordinary items21 NET CASH PROVIDED FROM OPERATING ACTIVITIES (lines 19 and 20) 6,107,627 5,812,424 21
CASH FLOWS FROM INVESTING ACTIVITIES
Line Cross Description Current Year Previous Year LineNo. Check (a) (b) (c) No.
22 Proceeds from sale of property 30,992 52,511 22
23 Capital expenditures (3,813,358) (3,460,811) 23
24 Net change in temporary cash investments not qualifying as cash 24
equivalents
25 Proceeds from sale/repayment of investment and advances 531 500 25
26 Purchase price of long-term investment and advances (14,621) (16,977) 26
27 Net decrease (increase) in sinking and other special funds 27
28 Other - net 32,805 (289,337) 2829 NET CASH USED IN INVESTING ACTIVITIES (lines 22 through 28) (3,763,651) (3,714,114) 29
(Continued on next page)
Railroad Annual Report R-1
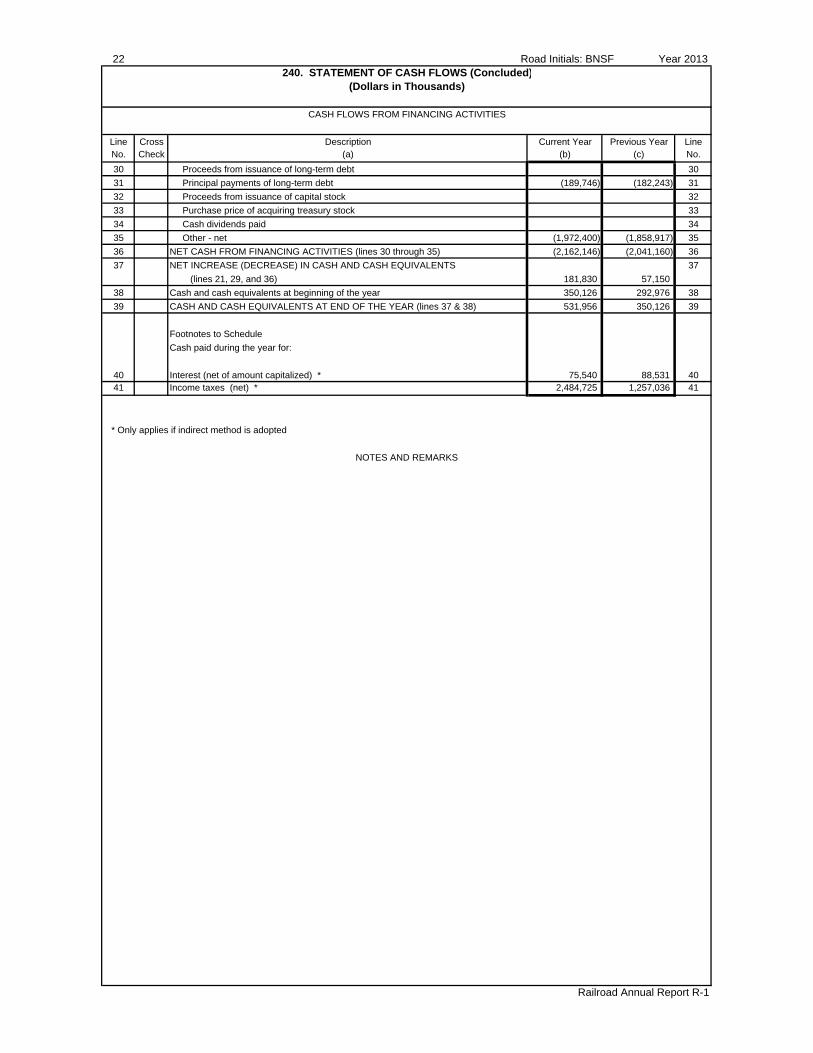
22 Road Initials: BNSF Year 2013240. STATEMENT OF CASH FLOWS (Concluded)
(Dollars in Thousands)
CASH FLOWS FROM FINANCING ACTIVITIES
Line Cross Description Current Year Previous Year LineNo. Check (a) (b) (c) No.
30 Proceeds from issuance of long-term debt 30
31 Principal payments of long-term debt (189,746) (182,243) 31
32 Proceeds from issuance of capital stock 32
33 Purchase price of acquiring treasury stock 33
34 Cash dividends paid 34
35 Other - net (1,972,400) (1,858,917) 35
36 NET CASH FROM FINANCING ACTIVITIES (lines 30 through 35) (2,162,146) (2,041,160) 36
37 NET INCREASE (DECREASE) IN CASH AND CASH EQUIVALENTS 37
(lines 21, 29, and 36) 181,830 57,150
38 Cash and cash equivalents at beginning of the year 350,126 292,976 38
39 CASH AND CASH EQUIVALENTS AT END OF THE YEAR (lines 37 & 38) 531,956 350,126 39
Footnotes to Schedule
Cash paid during the year for:
40 Interest (net of amount capitalized) * 75,540 88,531 4041 Income taxes (net) * 2,484,725 1,257,036 41
* Only applies if indirect method is adopted
NOTES AND REMARKS
Railroad Annual Report R-1
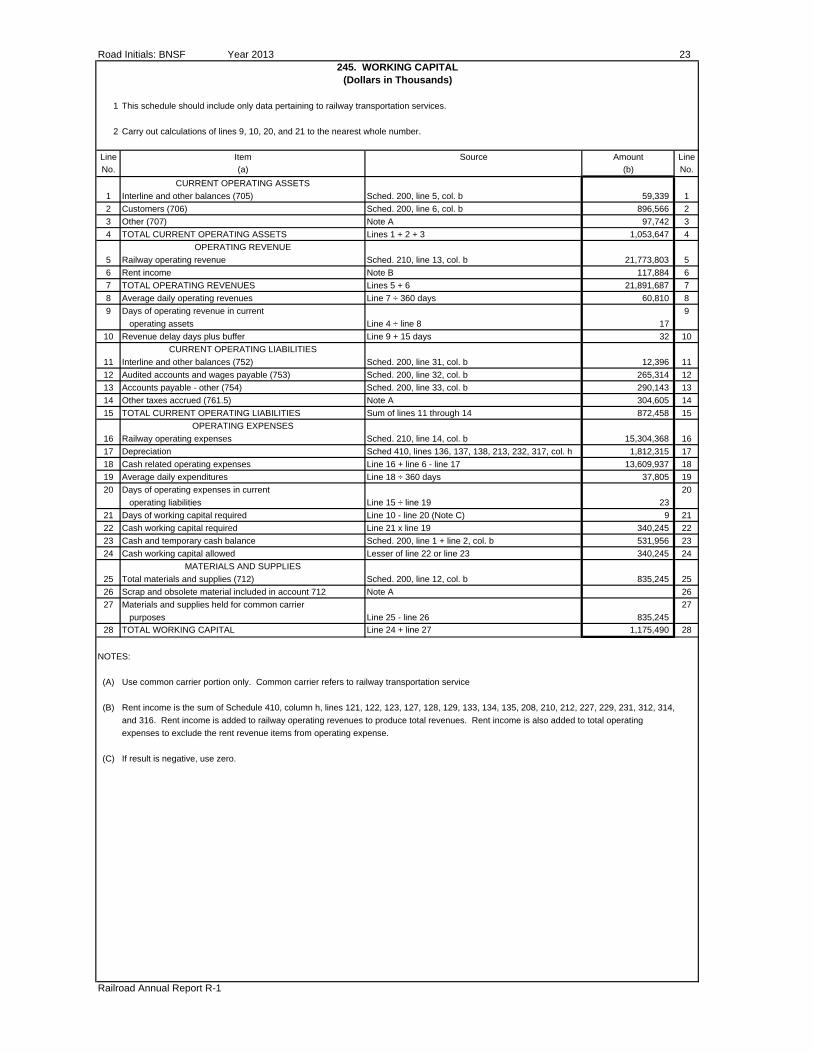
Road Initials: BNSF Year 2013 23245. WORKING CAPITAL
(Dollars in Thousands)
1 This schedule should include only data pertaining to railway transportation services.
2 Carry out calculations of lines 9, 10, 20, and 21 to the nearest whole number.
Line Item Source Amount Line
No. (a) (b) No.
CURRENT OPERATING ASSETS
1 Interline and other balances (705) Sched. 200, line 5, col. b 59,339 1
2 Customers (706) Sched. 200, line 6, col. b 896,566 2
3 Other (707) Note A 97,742 3
4 TOTAL CURRENT OPERATING ASSETS Lines 1 + 2 + 3 1,053,647 4
OPERATING REVENUE
5 Railway operating revenue Sched. 210, line 13, col. b 21,773,803 5
6 Rent income Note B 117,884 6
7 TOTAL OPERATING REVENUES Lines 5 + 6 21,891,687 7
8 Average daily operating revenues Line 7 ÷ 360 days 60,810 8
9 Days of operating revenue in current 9
operating assets Line 4 ÷ line 8 17
10 Revenue delay days plus buffer Line 9 + 15 days 32 10
CURRENT OPERATING LIABILITIES
11 Interline and other balances (752) Sched. 200, line 31, col. b 12,396 11
12 Audited accounts and wages payable (753) Sched. 200, line 32, col. b 265,314 12
13 Accounts payable - other (754) Sched. 200, line 33, col. b 290,143 13
14 Other taxes accrued (761.5) Note A 304,605 14
15 TOTAL CURRENT OPERATING LIABILITIES Sum of lines 11 through 14 872,458 15
OPERATING EXPENSES
16 Railway operating expenses Sched. 210, line 14, col. b 15,304,368 16
17 Depreciation Sched 410, lines 136, 137, 138, 213, 232, 317, col. h 1,812,315 17
18 Cash related operating expenses Line 16 + line 6 - line 17 13,609,937 18
19 Average daily expenditures Line 18 ÷ 360 days 37,805 19
20 Days of operating expenses in current 20
operating liabilities Line 15 ÷ line 19 23
21 Days of working capital required Line 10 - line 20 (Note C) 9 21
22 Cash working capital required Line 21 x line 19 340,245 22
23 Cash and temporary cash balance Sched. 200, line 1 + line 2, col. b 531,956 23
24 Cash working capital allowed Lesser of line 22 or line 23 340,245 24
MATERIALS AND SUPPLIES
25 Total materials and supplies (712) Sched. 200, line 12, col. b 835,245 25
26 Scrap and obsolete material included in account 712 Note A 26
27 Materials and supplies held for common carrier 27
purposes Line 25 - line 26 835,245
28 TOTAL WORKING CAPITAL Line 24 + line 27 1,175,490 28
NOTES:
(A) Use common carrier portion only. Common carrier refers to railway transportation service
(B) Rent income is the sum of Schedule 410, column h, lines 121, 122, 123, 127, 128, 129, 133, 134, 135, 208, 210, 212, 227, 229, 231, 312, 314,
and 316. Rent income is added to railway operating revenues to produce total revenues. Rent income is also added to total operating
expenses to exclude the rent revenue items from operating expense.
(C) If result is negative, use zero.
Railroad Annual Report R-1
24 Road Initials: BNSF Year 2013
NOTES AND REMARKS
Railroad Annual Report R-1
THIS PAGE INTENTIONALLY LEFT BLANK
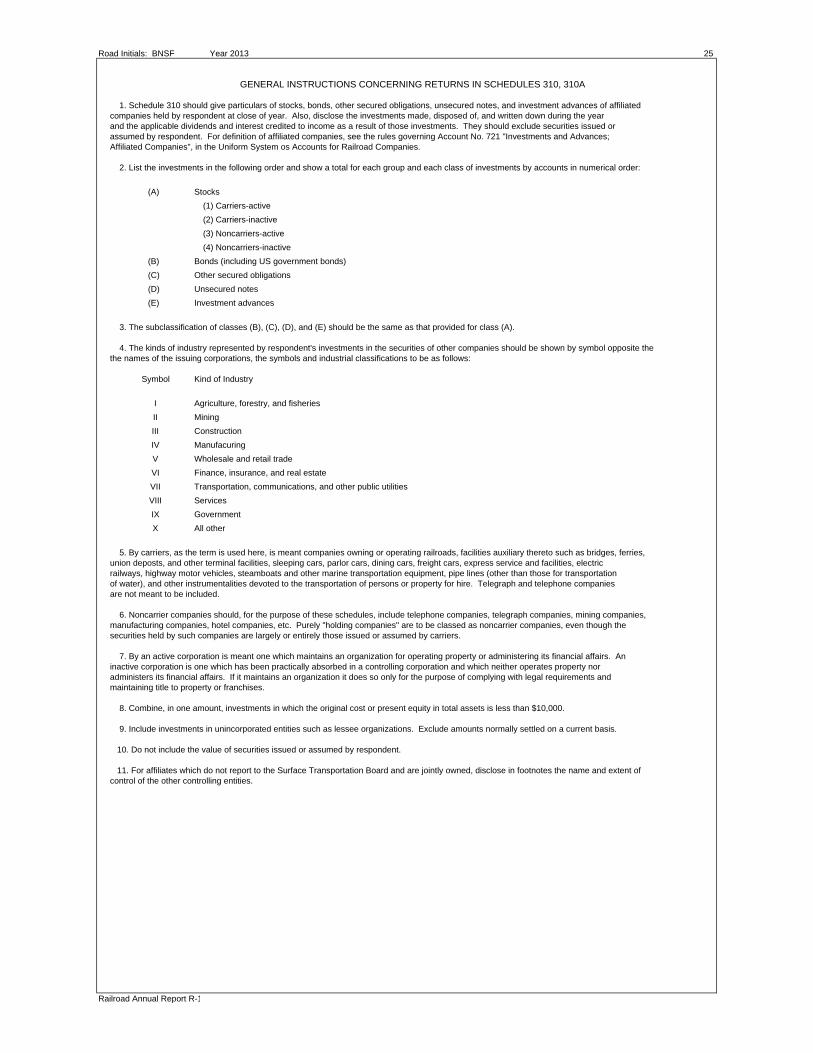
Road Initials: BNSF Year 2013 25
GENERAL INSTRUCTIONS CONCERNING RETURNS IN SCHEDULES 310, 310A
1. Schedule 310 should give particulars of stocks, bonds, other secured obligations, unsecured notes, and investment advances of affiliated companies held by respondent at close of year. Also, disclose the investments made, disposed of, and written down during the year and the applicable dividends and interest credited to income as a result of those investments. They should exclude securities issued or assumed by respondent. For definition of affiliated companies, see the rules governing Account No. 721 "Investments and Advances;Affiliated Companies", in the Uniform System os Accounts for Railroad Companies.
2. List the investments in the following order and show a total for each group and each class of investments by accounts in numerical order:
(A) Stocks
(1) Carriers-active
(2) Carriers-inactive
(3) Noncarriers-active
(4) Noncarriers-inactive
(B) Bonds (including US government bonds)
(C) Other secured obligations
(D) Unsecured notes
(E) Investment advances
3. The subclassification of classes (B), (C), (D), and (E) should be the same as that provided for class (A).
4. The kinds of industry represented by respondent's investments in the securities of other companies should be shown by symbol opposite the the names of the issuing corporations, the symbols and industrial classifications to be as follows:
Symbol Kind of Industry
I Agriculture, forestry, and fisheries
II Mining
III Construction
IV Manufacuring
V Wholesale and retail trade
VI Finance, insurance, and real estate
VII Transportation, communications, and other public utilities
VIII Services
IX Government
X All other
5. By carriers, as the term is used here, is meant companies owning or operating railroads, facilities auxiliary thereto such as bridges, ferries, union deposts, and other terminal facilities, sleeping cars, parlor cars, dining cars, freight cars, express service and facilities, electric railways, highway motor vehicles, steamboats and other marine transportation equipment, pipe lines (other than those for transportation of water), and other instrumentalities devoted to the transportation of persons or property for hire. Telegraph and telephone companies are not meant to be included.
6. Noncarrier companies should, for the purpose of these schedules, include telephone companies, telegraph companies, mining companies, manufacturing companies, hotel companies, etc. Purely "holding companies" are to be classed as noncarrier companies, even though the securities held by such companies are largely or entirely those issued or assumed by carriers.
7. By an active corporation is meant one which maintains an organization for operating property or administering its financial affairs. An inactive corporation is one which has been practically absorbed in a controlling corporation and which neither operates property nor administers its financial affairs. If it maintains an organization it does so only for the purpose of complying with legal requirements and maintaining title to property or franchises.
8. Combine, in one amount, investments in which the original cost or present equity in total assets is less than $10,000.
9. Include investments in unincorporated entities such as lessee organizations. Exclude amounts normally settled on a current basis.
10. Do not include the value of securities issued or assumed by respondent.
11. For affiliates which do not report to the Surface Transportation Board and are jointly owned, disclose in footnotes the name and extent of control of the other controlling entities.
Railroad Annual Report R-1
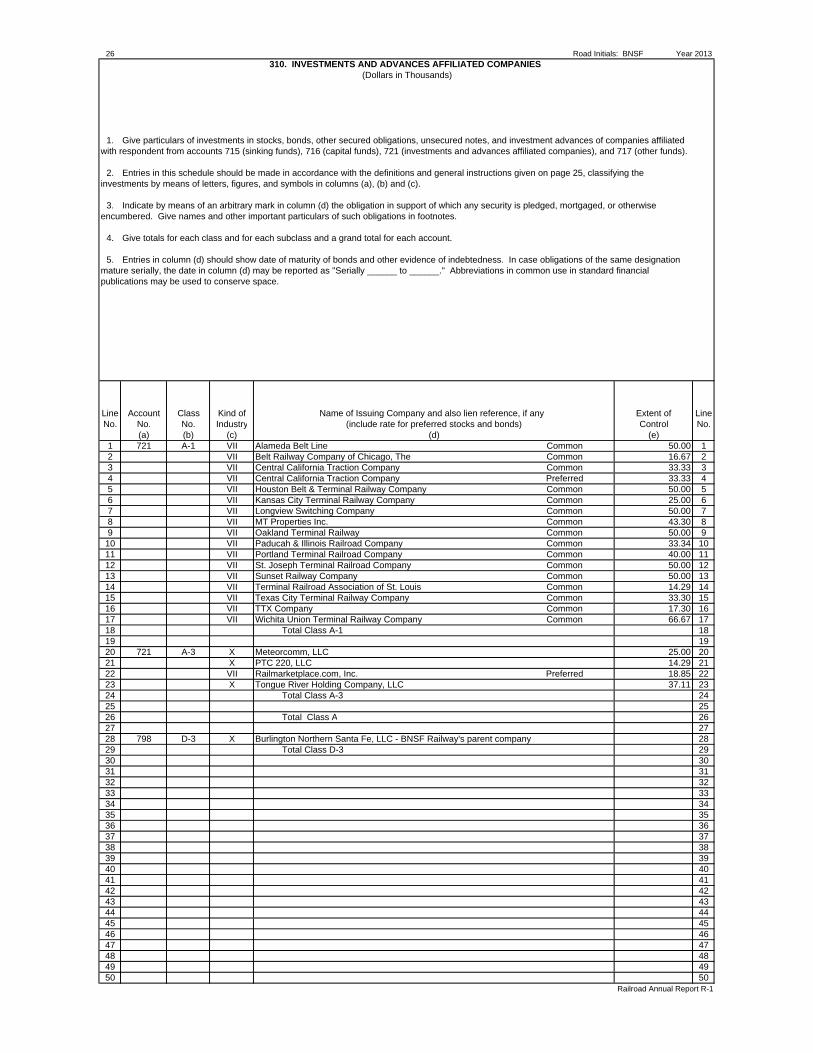
26 Road Initials: BNSF Year 2013310. INVESTMENTS AND ADVANCES AFFILIATED COMPANIES
(Dollars in Thousands)
1. Give particulars of investments in stocks, bonds, other secured obligations, unsecured notes, and investment advances of companies affiliated with respondent from accounts 715 (sinking funds), 716 (capital funds), 721 (investments and advances affiliated companies), and 717 (other funds).
2. Entries in this schedule should be made in accordance with the definitions and general instructions given on page 25, classifying the investments by means of letters, figures, and symbols in columns (a), (b) and (c).
3. Indicate by means of an arbitrary mark in column (d) the obligation in support of which any security is pledged, mortgaged, or otherwise encumbered. Give names and other important particulars of such obligations in footnotes.
4. Give totals for each class and for each subclass and a grand total for each account.
5. Entries in column (d) should show date of maturity of bonds and other evidence of indebtedness. In case obligations of the same designation mature serially, the date in column (d) may be reported as "Serially ______ to ______." Abbreviations in common use in standard financial publications may be used to conserve space.
Line Account Class Kind of Extent of LineNo. No. No. Industry Control No.
(a) (b) (c) (e)1 721 A-1 VII Alameda Belt Line Common 50.00 12 VII Belt Railway Company of Chicago, The Common 16.67 23 VII Central California Traction Company Common 33.33 34 VII Central California Traction Company Preferred 33.33 45 VII Houston Belt & Terminal Railway Company Common 50.00 56 VII Kansas City Terminal Railway Company Common 25.00 67 VII Longview Switching Company Common 50.00 78 VII MT Properties Inc. Common 43.30 89 VII Oakland Terminal Railway Common 50.00 9
10 VII Paducah & Illinois Railroad Company Common 33.34 1011 VII Portland Terminal Railroad Company Common 40.00 1112 VII St. Joseph Terminal Railroad Company Common 50.00 1213 VII Sunset Railway Company Common 50.00 1314 VII Terminal Railroad Association of St. Louis Common 14.29 1415 VII Texas City Terminal Railway Company Common 33.30 1516 VII TTX Company Common 17.30 1617 VII Wichita Union Terminal Railway Company Common 66.67 1718 Total Class A-1 1819 1920 721 A-3 X Meteorcomm, LLC 25.00 2021 X PTC 220, LLC 14.29 2122 VII Railmarketplace.com, Inc. Preferred 18.85 2223 X Tongue River Holding Company, LLC 37.11 2324 Total Class A-3 2425 2526 Total Class A 2627 2728 798 D-3 X Burlington Northern Santa Fe, LLC - BNSF Railway's parent company 2829 Total Class D-3 2930 3031 3132 3233 3334 3435 3536 3637 3738 3839 3940 4041 4142 4243 4344 4445 4546 4647 4748 4849 4950 50
Railroad Annual Report R-1
Name of Issuing Company and also lien reference, if any (include rate for preferred stocks and bonds)
(d)
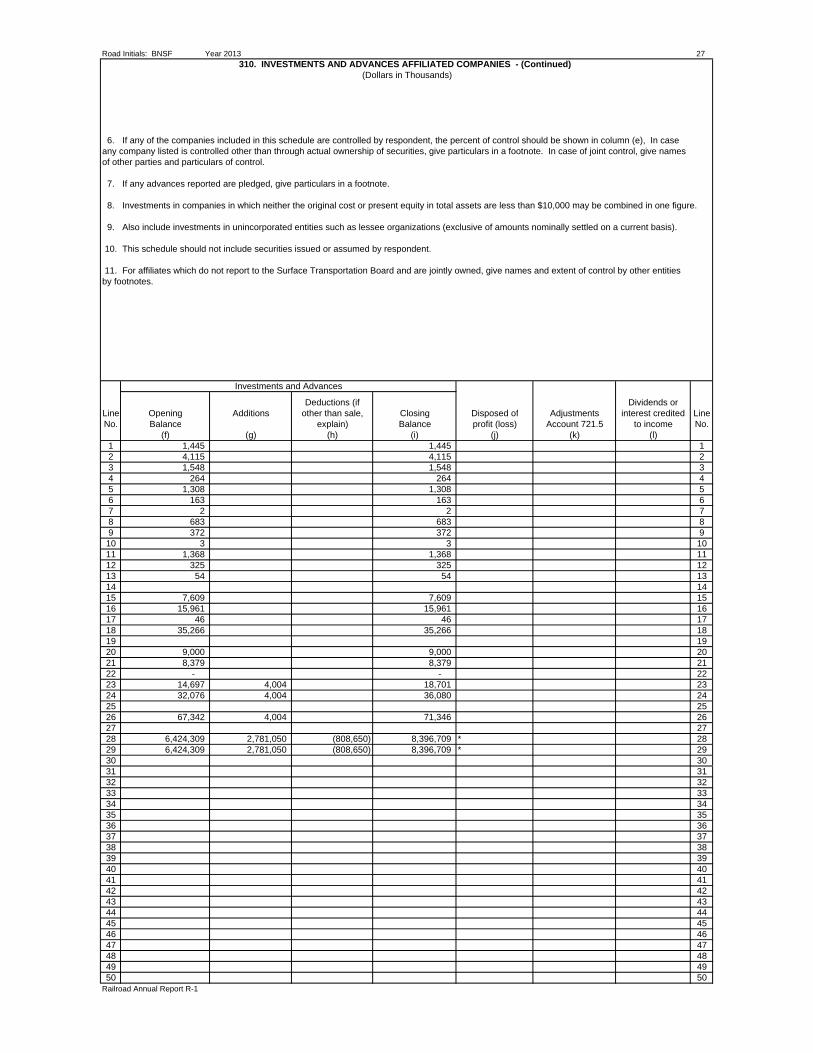
Road Initials: BNSF Year 2013 27310. INVESTMENTS AND ADVANCES AFFILIATED COMPANIES - (Continued)
(Dollars in Thousands)
6. If any of the companies included in this schedule are controlled by respondent, the percent of control should be shown in column (e), In case any company listed is controlled other than through actual ownership of securities, give particulars in a footnote. In case of joint control, give names of other parties and particulars of control.
7. If any advances reported are pledged, give particulars in a footnote.
8. Investments in companies in which neither the original cost or present equity in total assets are less than $10,000 may be combined in one figure.
9. Also include investments in unincorporated entities such as lessee organizations (exclusive of amounts nominally settled on a current basis).
10. This schedule should not include securities issued or assumed by respondent.
11. For affiliates which do not report to the Surface Transportation Board and are jointly owned, give names and extent of control by other entities by footnotes.
Investments and Advances
Deductions (if Dividends orLine Opening Additions other than sale, Closing Disposed of Adjustments interest credited LineNo. Balance explain) Balance profit (loss) Account 721.5 to income No.
(f) (g) (h) (i) (j) (k) (l)1 1,445 1,445 12 4,115 4,115 23 1,548 1,548 34 264 264 45 1,308 1,308 56 163 163 67 2 2 78 683 683 89 372 372 910 3 3 1011 1,368 1,368 1112 325 325 1213 54 54 1314 1415 7,609 7,609 1516 15,961 15,961 1617 46 46 1718 35,266 35,266 1819 1920 9,000 9,000 2021 8,379 8,379 2122 - - 2223 14,697 4,004 18,701 2324 32,076 4,004 36,080 2425 2526 67,342 4,004 71,346 2627 2728 6,424,309 2,781,050 (808,650) 8,396,709 * 2829 6,424,309 2,781,050 (808,650) 8,396,709 * 2930 3031 3132 3233 3334 3435 3536 3637 3738 3839 3940 4041 4142 4243 4344 4445 4546 4647 4748 4849 4950 50
Railroad Annual Report R-1
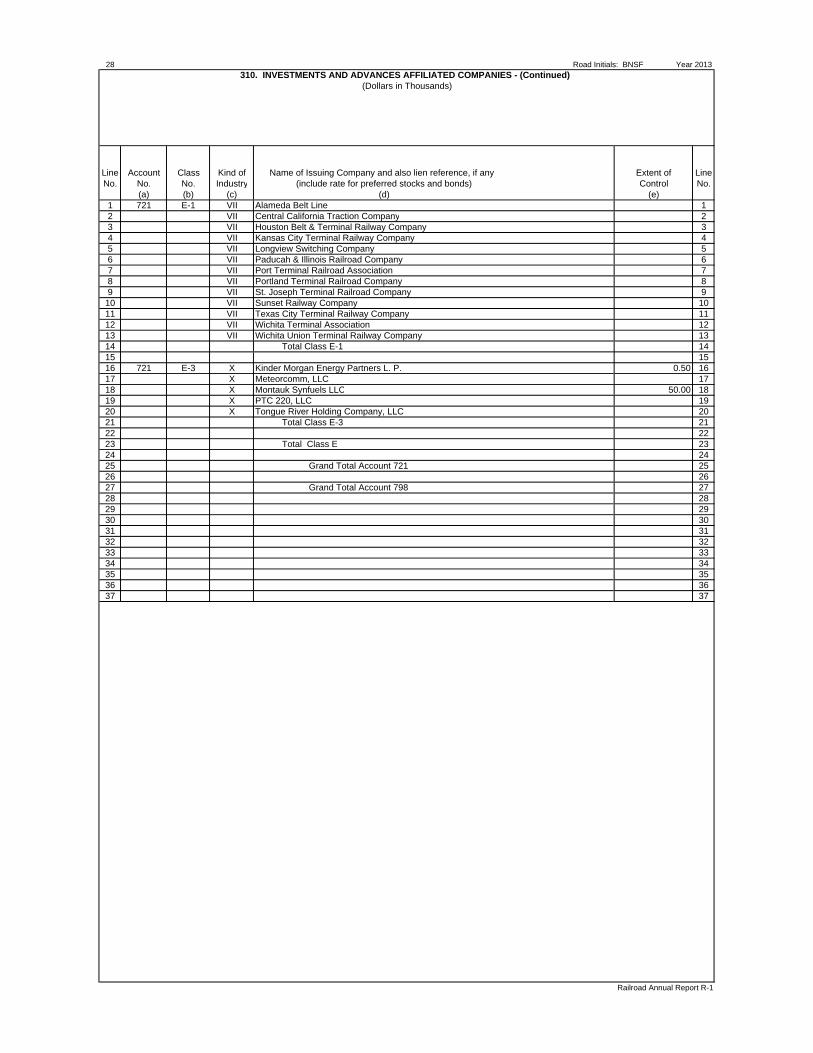
28 Road Initials: BNSF Year 2013310. INVESTMENTS AND ADVANCES AFFILIATED COMPANIES - (Continued)
(Dollars in Thousands)
Line Account Class Kind of Name of Issuing Company and also lien reference, if any Extent of LineNo. No. No. Industry (include rate for preferred stocks and bonds) Control No.
(a) (b) (c) (d) (e)1 721 E-1 VII Alameda Belt Line 12 VII Central California Traction Company 23 VII Houston Belt & Terminal Railway Company 34 VII Kansas City Terminal Railway Company 45 VII Longview Switching Company 56 VII Paducah & Illinois Railroad Company 67 VII Port Terminal Railroad Association 78 VII Portland Terminal Railroad Company 89 VII St. Joseph Terminal Railroad Company 9
10 VII Sunset Railway Company 1011 VII Texas City Terminal Railway Company 1112 VII Wichita Terminal Association 1213 VII Wichita Union Terminal Railway Company 1314 Total Class E-1 1415 1516 721 E-3 X Kinder Morgan Energy Partners L. P. 0.50 1617 X Meteorcomm, LLC 1718 X Montauk Synfuels LLC 50.00 1819 X PTC 220, LLC 1920 X Tongue River Holding Company, LLC 2021 Total Class E-3 2122 2223 Total Class E 2324 2425 Grand Total Account 721 2526 2627 Grand Total Account 798 2728 2829 2930 3031 3132 3233 3334 3435 3536 3637 37
Railroad Annual Report R-1
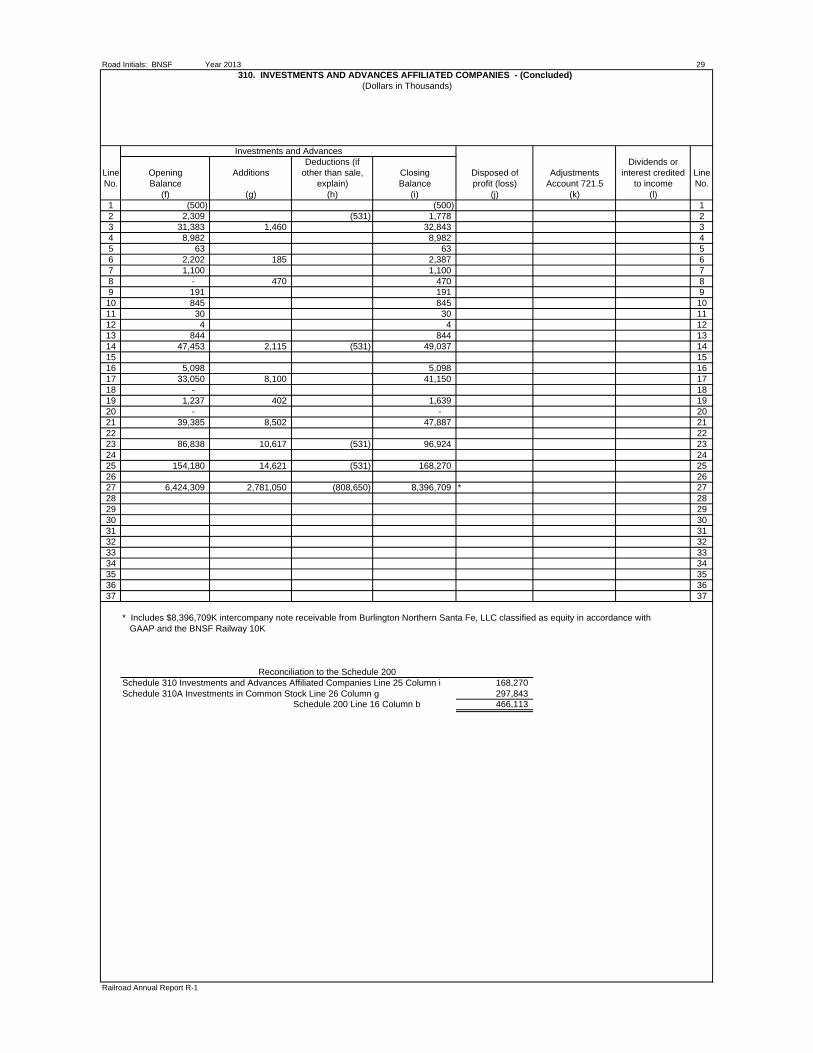
Road Initials: BNSF Year 2013 29310. INVESTMENTS AND ADVANCES AFFILIATED COMPANIES - (Concluded)
(Dollars in Thousands)
Investments and AdvancesDeductions (if Dividends or
Line Opening Additions other than sale, Closing Disposed of Adjustments interest credited LineNo. Balance explain) Balance profit (loss) Account 721.5 to income No.
(f) (g) (h) (i) (j) (k) (l)1 (500) (500) 12 2,309 (531) 1,778 23 31,383 1,460 32,843 34 8,982 8,982 45 63 63 56 2,202 185 2,387 67 1,100 1,100 78 - 470 470 89 191 191 910 845 845 1011 30 30 1112 4 4 1213 844 844 1314 47,453 2,115 (531) 49,037 1415 1516 5,098 5,098 1617 33,050 8,100 41,150 1718 - 1819 1,237 402 1,639 1920 - - 2021 39,385 8,502 47,887 2122 2223 86,838 10,617 (531) 96,924 2324 2425 154,180 14,621 (531) 168,270 2526 2627 6,424,309 2,781,050 (808,650) 8,396,709 * 2728 2829 2930 3031 3132 3233 3334 3435 3536 3637 37
* Includes $8,396,709K intercompany note receivable from Burlington Northern Santa Fe, LLC classified as equity in accordance with GAAP and the BNSF Railway 10K
Schedule 310 Investments and Advances Affiliated Companies Line 25 Column i 168,270Schedule 310A Investments in Common Stock Line 26 Column g 297,843
Schedule 200 Line 16 Column b 466,113
Railroad Annual Report R-1
Reconciliation to the Schedule 200
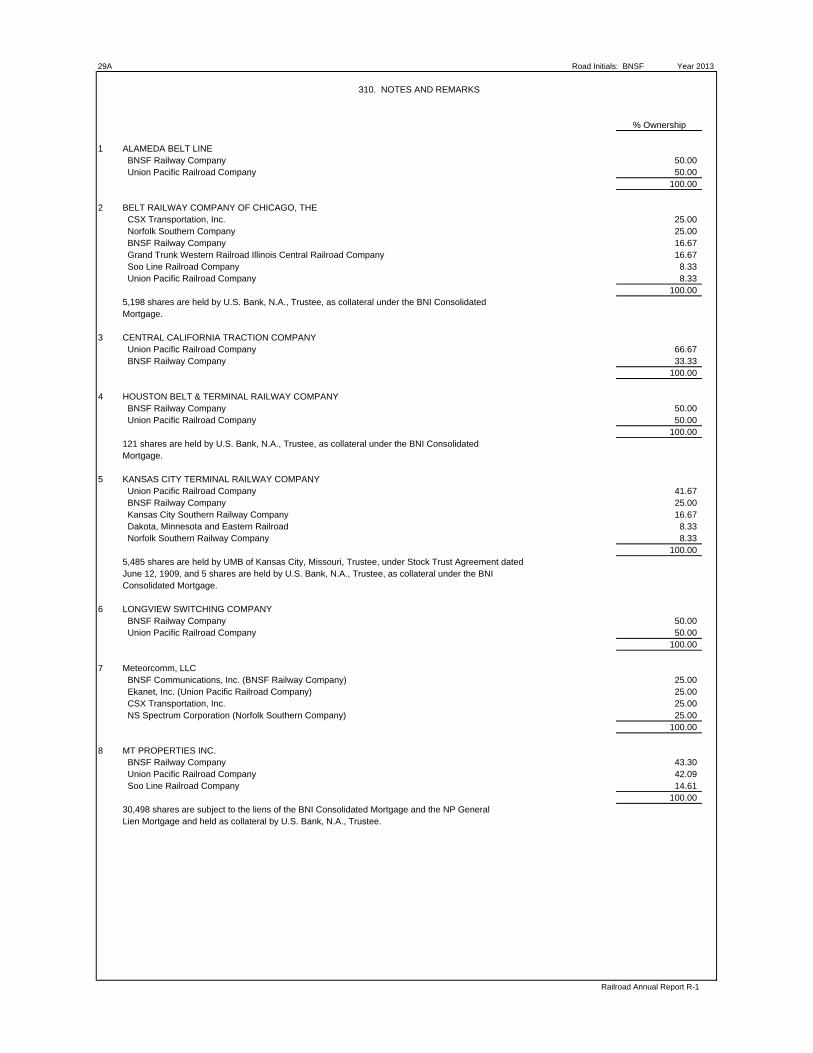
29A Road Initials: BNSF Year 2013
310. NOTES AND REMARKS
% Ownership
1 ALAMEDA BELT LINE BNSF Railway Company 50.00 Union Pacific Railroad Company 50.00
100.00
2 BELT RAILWAY COMPANY OF CHICAGO, THE CSX Transportation, Inc. 25.00 Norfolk Southern Company 25.00 BNSF Railway Company 16.67 Grand Trunk Western Railroad Illinois Central Railroad Company 16.67 Soo Line Railroad Company 8.33 Union Pacific Railroad Company 8.33
100.005,198 shares are held by U.S. Bank, N.A., Trustee, as collateral under the BNI ConsolidatedMortgage.
3 CENTRAL CALIFORNIA TRACTION COMPANY Union Pacific Railroad Company 66.67 BNSF Railway Company 33.33
100.00
4 HOUSTON BELT & TERMINAL RAILWAY COMPANY BNSF Railway Company 50.00 Union Pacific Railroad Company 50.00
100.00121 shares are held by U.S. Bank, N.A., Trustee, as collateral under the BNI ConsolidatedMortgage.
5 KANSAS CITY TERMINAL RAILWAY COMPANY Union Pacific Railroad Company 41.67 BNSF Railway Company 25.00 Kansas City Southern Railway Company 16.67 Dakota, Minnesota and Eastern Railroad 8.33 Norfolk Southern Railway Company 8.33 100.005,485 shares are held by UMB of Kansas City, Missouri, Trustee, under Stock Trust Agreement datedJune 12, 1909, and 5 shares are held by U.S. Bank, N.A., Trustee, as collateral under the BNIConsolidated Mortgage.
6 LONGVIEW SWITCHING COMPANY BNSF Railway Company 50.00 Union Pacific Railroad Company 50.00
100.00
7 Meteorcomm, LLC BNSF Communications, Inc. (BNSF Railway Company) 25.00 Ekanet, Inc. (Union Pacific Railroad Company) 25.00 CSX Transportation, Inc. 25.00 NS Spectrum Corporation (Norfolk Southern Company) 25.00
100.00
8 MT PROPERTIES INC. BNSF Railway Company 43.30 Union Pacific Railroad Company 42.09 Soo Line Railroad Company 14.61
100.0030,498 shares are subject to the liens of the BNI Consolidated Mortgage and the NP General Lien Mortgage and held as collateral by U.S. Bank, N.A., Trustee.
Railroad Annual Report R-1
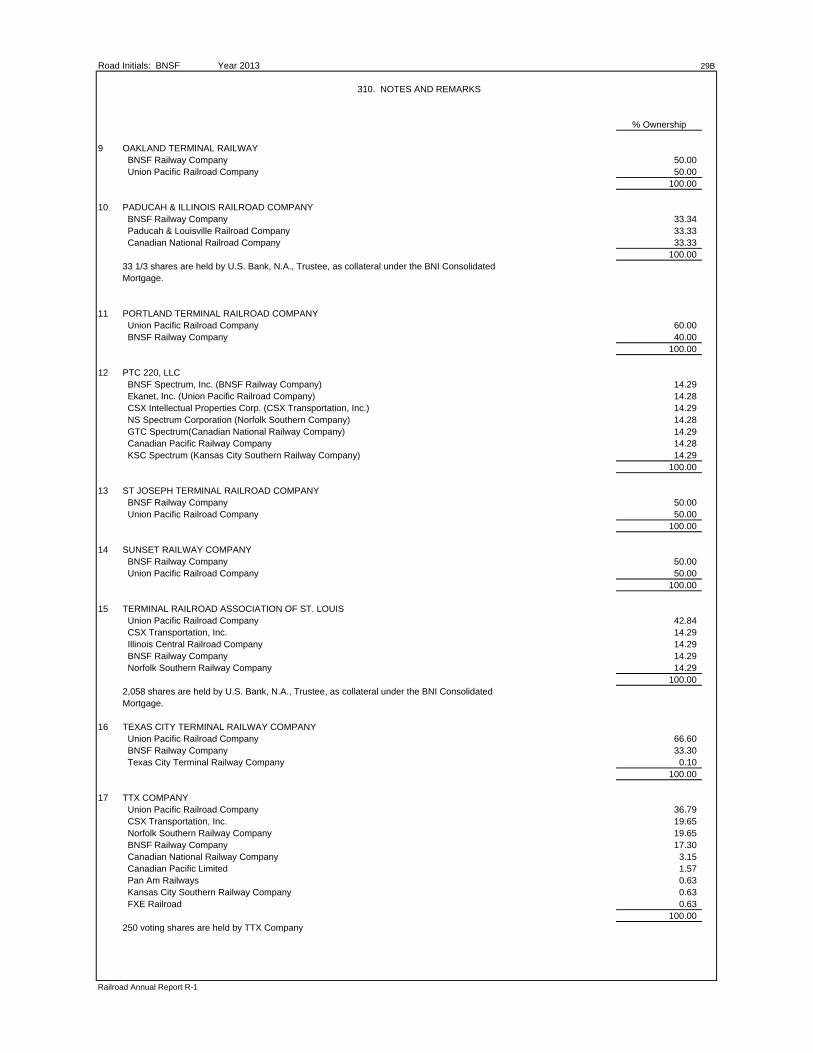
Road Initials: BNSF Year 2013 29B
310. NOTES AND REMARKS
% Ownership
9 OAKLAND TERMINAL RAILWAY BNSF Railway Company 50.00 Union Pacific Railroad Company 50.00
100.00
10 PADUCAH & ILLINOIS RAILROAD COMPANY BNSF Railway Company 33.34 Paducah & Louisville Railroad Company 33.33 Canadian National Railroad Company 33.33 100.0033 1/3 shares are held by U.S. Bank, N.A., Trustee, as collateral under the BNI ConsolidatedMortgage.
11 PORTLAND TERMINAL RAILROAD COMPANY Union Pacific Railroad Company 60.00 BNSF Railway Company 40.00
100.00
12 PTC 220, LLC BNSF Spectrum, Inc. (BNSF Railway Company) 14.29 Ekanet, Inc. (Union Pacific Railroad Company) 14.28 CSX Intellectual Properties Corp. (CSX Transportation, Inc.) 14.29 NS Spectrum Corporation (Norfolk Southern Company) 14.28 GTC Spectrum(Canadian National Railway Company) 14.29 Canadian Pacific Railway Company 14.28 KSC Spectrum (Kansas City Southern Railway Company) 14.29
100.00
13 ST JOSEPH TERMINAL RAILROAD COMPANY BNSF Railway Company 50.00 Union Pacific Railroad Company 50.00
100.00
14 SUNSET RAILWAY COMPANY BNSF Railway Company 50.00 Union Pacific Railroad Company 50.00
100.00
15 TERMINAL RAILROAD ASSOCIATION OF ST. LOUIS Union Pacific Railroad Company 42.84 CSX Transportation, Inc. 14.29 Illinois Central Railroad Company 14.29 BNSF Railway Company 14.29 Norfolk Southern Railway Company 14.29
100.002,058 shares are held by U.S. Bank, N.A., Trustee, as collateral under the BNI ConsolidatedMortgage.
16 TEXAS CITY TERMINAL RAILWAY COMPANY Union Pacific Railroad Company 66.60 BNSF Railway Company 33.30 Texas City Terminal Railway Company 0.10
100.00
17 TTX COMPANY Union Pacific Railroad Company 36.79 CSX Transportation, Inc. 19.65 Norfolk Southern Railway Company 19.65 BNSF Railway Company 17.30 Canadian National Railway Company 3.15 Canadian Pacific Limited 1.57 Pan Am Railways 0.63 Kansas City Southern Railway Company 0.63 FXE Railroad 0.63
100.00250 voting shares are held by TTX Company
Railroad Annual Report R-1
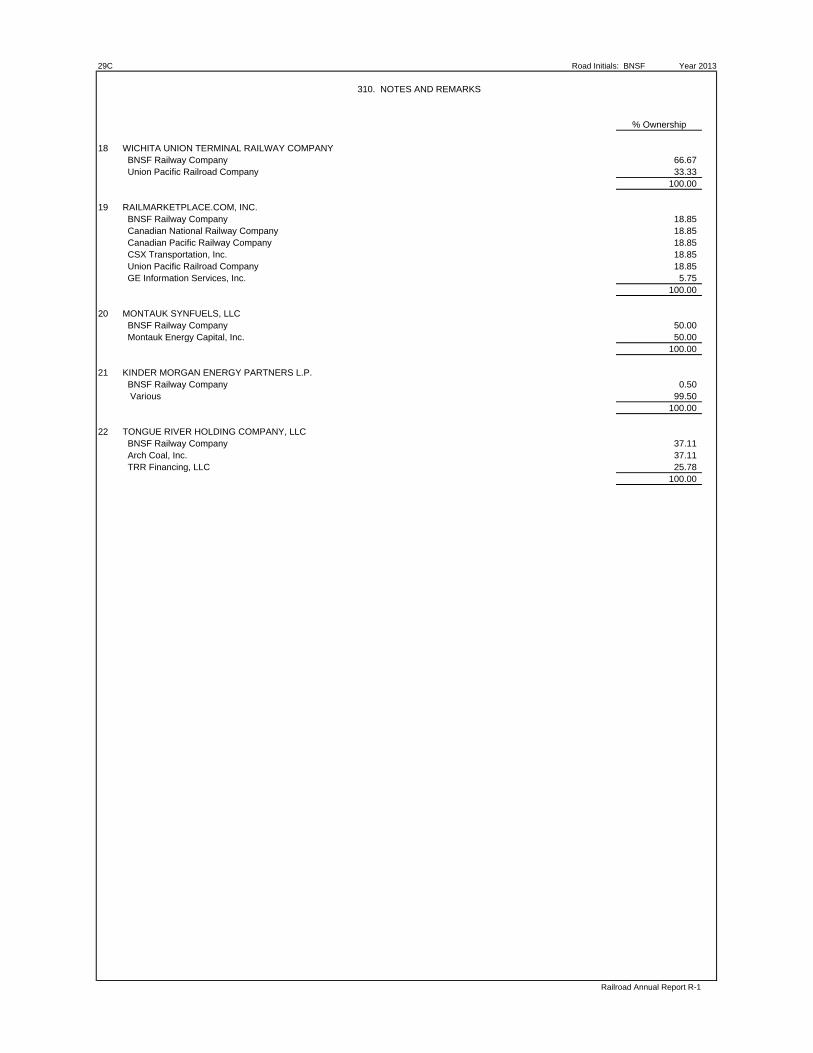
29C Road Initials: BNSF Year 2013
310. NOTES AND REMARKS
% Ownership
18 WICHITA UNION TERMINAL RAILWAY COMPANY BNSF Railway Company 66.67 Union Pacific Railroad Company 33.33
100.00
19 RAILMARKETPLACE.COM, INC. BNSF Railway Company 18.85 Canadian National Railway Company 18.85 Canadian Pacific Railway Company 18.85 CSX Transportation, Inc. 18.85 Union Pacific Railroad Company 18.85 GE Information Services, Inc. 5.75
100.00
20 MONTAUK SYNFUELS, LLC BNSF Railway Company 50.00 Montauk Energy Capital, Inc. 50.00
100.00
21 KINDER MORGAN ENERGY PARTNERS L.P. BNSF Railway Company 0.50 Various 99.50
100.00
22 TONGUE RIVER HOLDING COMPANY, LLC BNSF Railway Company 37.11 Arch Coal, Inc. 37.11 TRR Financing, LLC 25.78
100.00
Railroad Annual Report R-1
Road Initials: BNSF Year 2013 29D
THIS PAGE INTENTIONALLY LEFT BLANK
Railroad Annual Report R-1
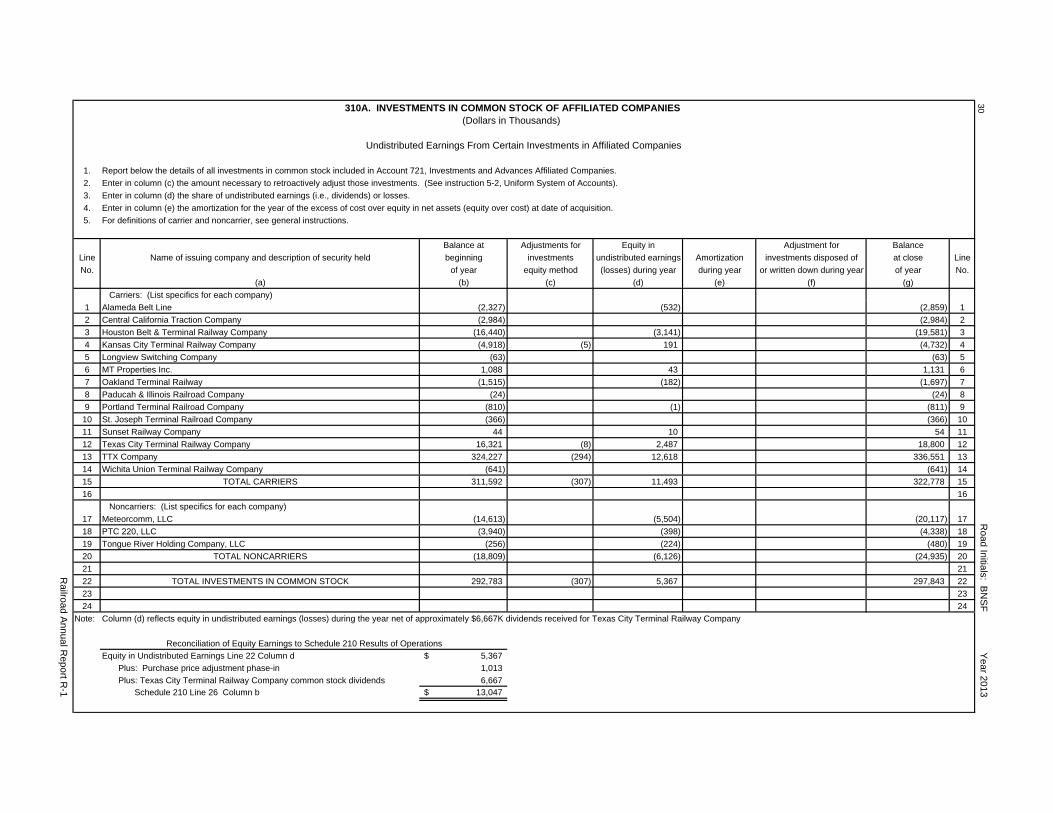
310A. INVESTMENTS IN COMMON STOCK OF AFFILIATED COMPANIES
30
(Dollars in Thousands)
Undistributed Earnings From Certain Investments in Affiliated Companies
1. Report below the details of all investments in common stock included in Account 721, Investments and Advances Affiliated Companies.
2. Enter in column (c) the amount necessary to retroactively adjust those investments. (See instruction 5-2, Uniform System of Accounts).
3. Enter in column (d) the share of undistributed earnings (i.e., dividends) or losses.
4. Enter in column (e) the amortization for the year of the excess of cost over equity in net assets (equity over cost) at date of acquisition.
5. For definitions of carrier and noncarrier, see general instructions.
Balance at Adjustments for Equity in Adjustment for Balance
Line Name of issuing company and description of security held beginning investments undistributed earnings Amortization investments disposed of at close Line
No. of year equity method (losses) during year during year or written down during year of year No.
(a) (b) (c) (d) (e) (f) (g)
Carriers: (List specifics for each company)
1 Alameda Belt Line (2,327) (532) (2,859) 1
2 Central California Traction Company (2,984) (2,984) 2
3 Houston Belt & Terminal Railway Company (16,440) (3,141) (19,581) 3
4 Kansas City Terminal Railway Company (4,918) (5) 191 (4,732) 4
5 Longview Switching Company (63) (63) 5
6 MT Properties Inc. 1,088 43 1,131 6
7 Oakland Terminal Railway (1,515) (182) (1,697) 7
8 Paducah & Illinois Railroad Company (24) (24) 8
9 Portland Terminal Railroad Company (810) (1) (811) 9
10 St. Joseph Terminal Railroad Company (366) (366) 10
11 Sunset Railway Company 44 10 54 11
12 Texas City Terminal Railway Company 16,321 (8) 2,487 18,800 12
13 TTX Company 324,227 (294) 12,618 336,551 13
14 Wichita Union Terminal Railway Company (641) (641) 14
15 TOTAL CARRIERS 311,592 (307) 11,493 322,778 15
16 16
Noncarriers: (List specifics for each company)
17 Meteorcomm, LLC (14,613) (5,504) (20,117) 17
18 PTC 220, LLC (3,940) (398) (4,338) 18
19 Tongue River Holding Company, LLC (256) (224) (480) 19
20 TOTAL NONCARRIERS (18,809) (6,126) (24,935) 20
21 21
22 TOTAL INVESTMENTS IN COMMON STOCK 292,783 (307) 5,367 297,843 22
23 23
24 24
Note: Column (d) reflects equity in undistributed earnings (losses) during the year net of approximately $6,667K dividends received for Texas City Terminal Railway Company
Equity in Undistributed Earnings Line 22 Column d 5,367$
Plus: Purchase price adjustment phase-in 1,013
Plus: Texas City Terminal Railway Company common stock dividends 6,667 Schedule 210 Line 26 Column b 13,047$
Road Initials: B
NS
F Y
ear 2013
Railroad A
nnual Report R
-1
Reconciliation of Equity Earnings to Schedule 210 Results of Operations
Road Initials: BNSF Year 2013 31INSTRUCTIONS CONCERNING RETURNS TO BE MADE IN SCHEDULE 330
1. Give particulars of balances at the beginning and close of the year and of all changes during the year in Account No. 731, Road and Equipment
Property" and Account No. 732, "Improvements on Leased Property" classified by primary accounts in accordance with the Uniform System
of Accounts for Railroad Companies. The balances, by primary accounts, should, insofar as known, be stated in column (b) and all changes
made during the year should be analyzed in columns (c) to (f), inclusive. Column (g) should be the net of the amounts in columns (c) through
(f). Column (h) is the aggregate of columns (b) through (f), inclusive. Grand totals of columns (b) and (h) should equal the sum of Accounts
731 and 732 for the respective periods; if not, a full explanation should be made in a footnote.
2. In column (c), show disbursements made for the specific purpose of purchasing, constructing, and equipping new lines, and for the extension
of old lines, as provided for in Instruction 2-1, :Items to be charged" in the Uniform System of Accounts for Railroad Companies for such
items.
3. In column (d), show the cost of a railway or portion thereof, acquired as an operating entity or system by purchase, merger, consolidation,
reorganization, receivership sale or transfer, or otherwise.
4. Columns (c) and (e) should include all entries covering expenditures for additions and betterments, as defined, whether or not replacing
other property.
5. All credits representing property sold, abandoned, or otherwise retires should be shown in column (f).
6. Both the debit and credit involved in each transfer, adjustment, or clearance, between road and equipment accounts, should be included in the
column in which the item was initially included. Also, the transfer of prior years' debits or credits from investment in road and equipment to
operating expenses or other accounts, or vice versa, should be included in the column applicable to current items of like nature. Each such
transfer, adjustment, or clearance should be fully explained when in excess of $100,000.
7. If during the year an individual charge of $100,000 or more was made to Account No. 2, "Land for Transportation Purposes," state the cost,
location, area, and other details which will identify the property in a footnote.
8. Report on line 29, amounts not included in the primary road accounts. The items reported should be briefly identified and explained under
Notes and Remarks," below. Amounts should be reported on this line only under special circumstances, usually after permission is
obtained from the Board for exceptions to prescribed accounting. Reference to such authority should be made when explaining the amounts
reported. Respondents must not make arbitrary changes to the printed stub or column headings without specific authority from the Board.
9. If during the year a segment of transportation property was acquired, state in a footnote the name of the vendor, the mileage acquired, and
the date of acquisition, giving location and cost of the property to the respondent. Also furnish a statement of the amount included in
each primary account representing such property acquired, referring to the column or columns in which the entries appear.
10. If an amount of less than $5,000 is used as the minimum for additions and betterments to property investment accounts as provided for in
Instruction 2-2 of the Uniform System of Accounts for Railroad Companies, state the amount used in a footnote.
NOTES AND REMARKS
Railroad Annual Report R-1
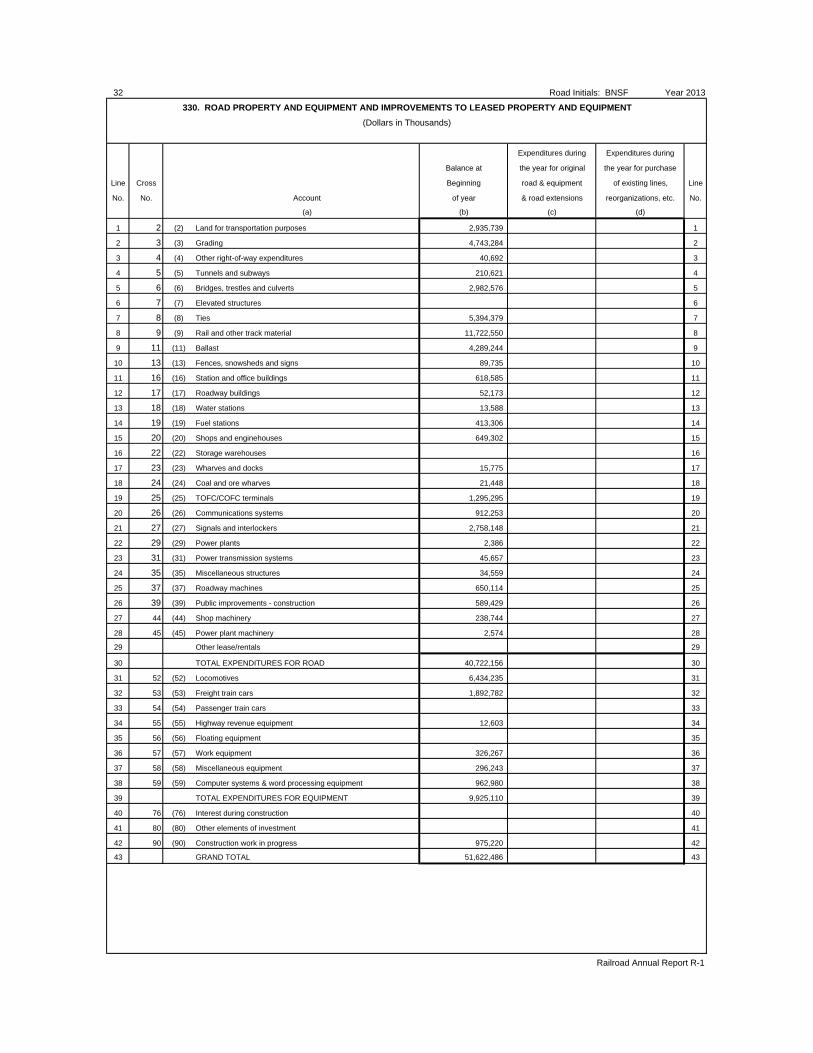
32 Road Initials: BNSF Year 2013
330. ROAD PROPERTY AND EQUIPMENT AND IMPROVEMENTS TO LEASED PROPERTY AND EQUIPMENT
(Dollars in Thousands)
Expenditures during Expenditures during
Balance at the year for original the year for purchase
Line Cross Beginning road & equipment of existing lines, Line
No. No. Account of year & road extensions reorganizations, etc. No.
(a) (b) (c) (d)
1 2 (2) Land for transportation purposes 2,935,739 1
2 3 (3) Grading 4,743,284 2
3 4 (4) Other right-of-way expenditures 40,692 3
4 5 (5) Tunnels and subways 210,621 4
5 6 (6) Bridges, trestles and culverts 2,982,576 5
6 7 (7) Elevated structures 6
7 8 (8) Ties 5,394,379 7
8 9 (9) Rail and other track material 11,722,550 8
9 11 (11) Ballast 4,289,244 9
10 13 (13) Fences, snowsheds and signs 89,735 10
11 16 (16) Station and office buildings 618,585 11
12 17 (17) Roadway buildings 52,173 12
13 18 (18) Water stations 13,588 13
14 19 (19) Fuel stations 413,306 14
15 20 (20) Shops and enginehouses 649,302 15
16 22 (22) Storage warehouses 16
17 23 (23) Wharves and docks 15,775 17
18 24 (24) Coal and ore wharves 21,448 18
19 25 (25) TOFC/COFC terminals 1,295,295 19
20 26 (26) Communications systems 912,253 20
21 27 (27) Signals and interlockers 2,758,148 21
22 29 (29) Power plants 2,386 22
23 31 (31) Power transmission systems 45,657 23
24 35 (35) Miscellaneous structures 34,559 24
25 37 (37) Roadway machines 650,114 25
26 39 (39) Public improvements - construction 589,429 26
27 44 (44) Shop machinery 238,744 27
28 45 (45) Power plant machinery 2,574 28
29 Other lease/rentals 29
30 TOTAL EXPENDITURES FOR ROAD 40,722,156 30
31 52 (52) Locomotives 6,434,235 31
32 53 (53) Freight train cars 1,892,782 32
33 54 (54) Passenger train cars 33
34 55 (55) Highway revenue equipment 12,603 34
35 56 (56) Floating equipment 35
36 57 (57) Work equipment 326,267 36
37 58 (58) Miscellaneous equipment 296,243 37
38 59 (59) Computer systems & word processing equipment 962,980 38
39 TOTAL EXPENDITURES FOR EQUIPMENT 9,925,110 39
40 76 (76) Interest during construction 40
41 80 (80) Other elements of investment 41
42 90 (90) Construction work in progress 975,220 42
43 GRAND TOTAL 51,622,486 43
Railroad Annual Report R-1
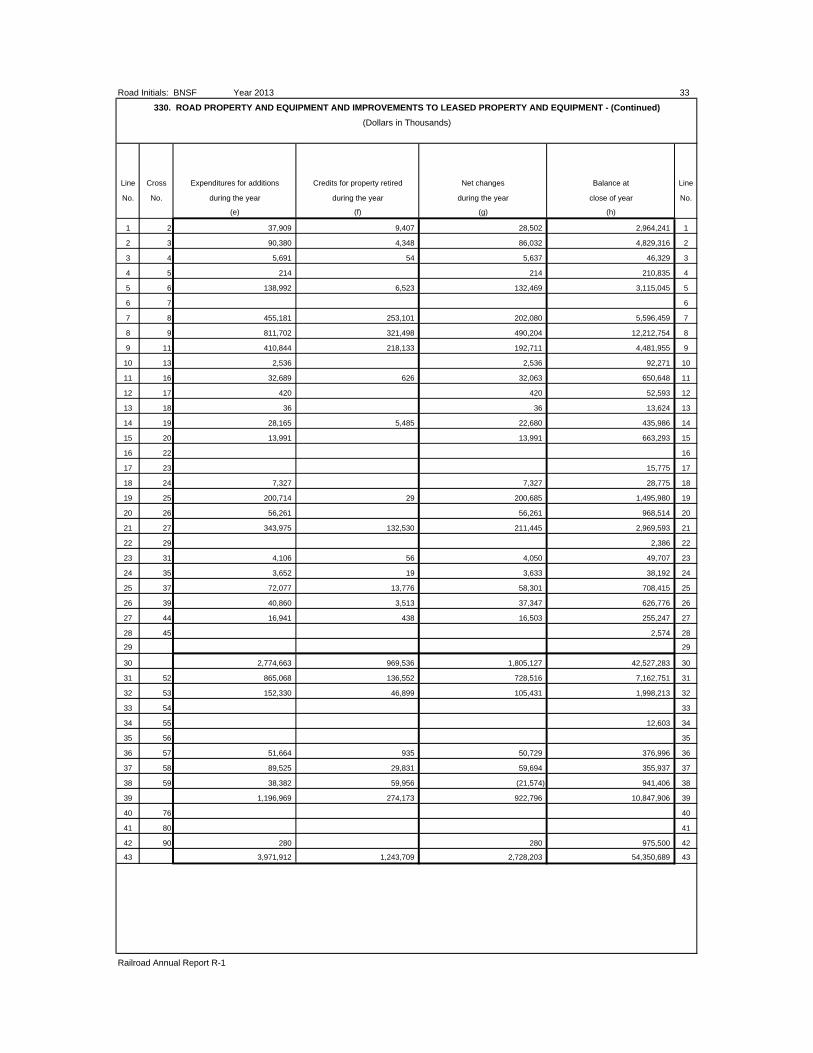
Road Initials: BNSF Year 2013 33
330. ROAD PROPERTY AND EQUIPMENT AND IMPROVEMENTS TO LEASED PROPERTY AND EQUIPMENT - (Continued)
(Dollars in Thousands)
Line Cross Expenditures for additions Credits for property retired Net changes Balance at Line
No. No. during the year during the year during the year close of year No.
(e) (f) (g) (h)
1 2 37,909 9,407 28,502 2,964,241 1
2 3 90,380 4,348 86,032 4,829,316 2
3 4 5,691 54 5,637 46,329 3
4 5 214 214 210,835 4
5 6 138,992 6,523 132,469 3,115,045 5
6 7 6
7 8 455,181 253,101 202,080 5,596,459 7
8 9 811,702 321,498 490,204 12,212,754 8
9 11 410,844 218,133 192,711 4,481,955 9
10 13 2,536 2,536 92,271 10
11 16 32,689 626 32,063 650,648 11
12 17 420 420 52,593 12
13 18 36 36 13,624 13
14 19 28,165 5,485 22,680 435,986 14
15 20 13,991 13,991 663,293 15
16 22 16
17 23 15,775 17
18 24 7,327 7,327 28,775 18
19 25 200,714 29 200,685 1,495,980 19
20 26 56,261 56,261 968,514 20
21 27 343,975 132,530 211,445 2,969,593 21
22 29 2,386 22
23 31 4,106 56 4,050 49,707 23
24 35 3,652 19 3,633 38,192 24
25 37 72,077 13,776 58,301 708,415 25
26 39 40,860 3,513 37,347 626,776 26
27 44 16,941 438 16,503 255,247 27
28 45 2,574 28
29 29
30 2,774,663 969,536 1,805,127 42,527,283 30
31 52 865,068 136,552 728,516 7,162,751 31
32 53 152,330 46,899 105,431 1,998,213 32
33 54 33
34 55 12,603 34
35 56 35
36 57 51,664 935 50,729 376,996 36
37 58 89,525 29,831 59,694 355,937 37
38 59 38,382 59,956 (21,574) 941,406 38
39 1,196,969 274,173 922,796 10,847,906 39
40 76 40
41 80 41
42 90 280 280 975,500 42
43 3,971,912 1,243,709 2,728,203 54,350,689 43
Railroad Annual Report R-1
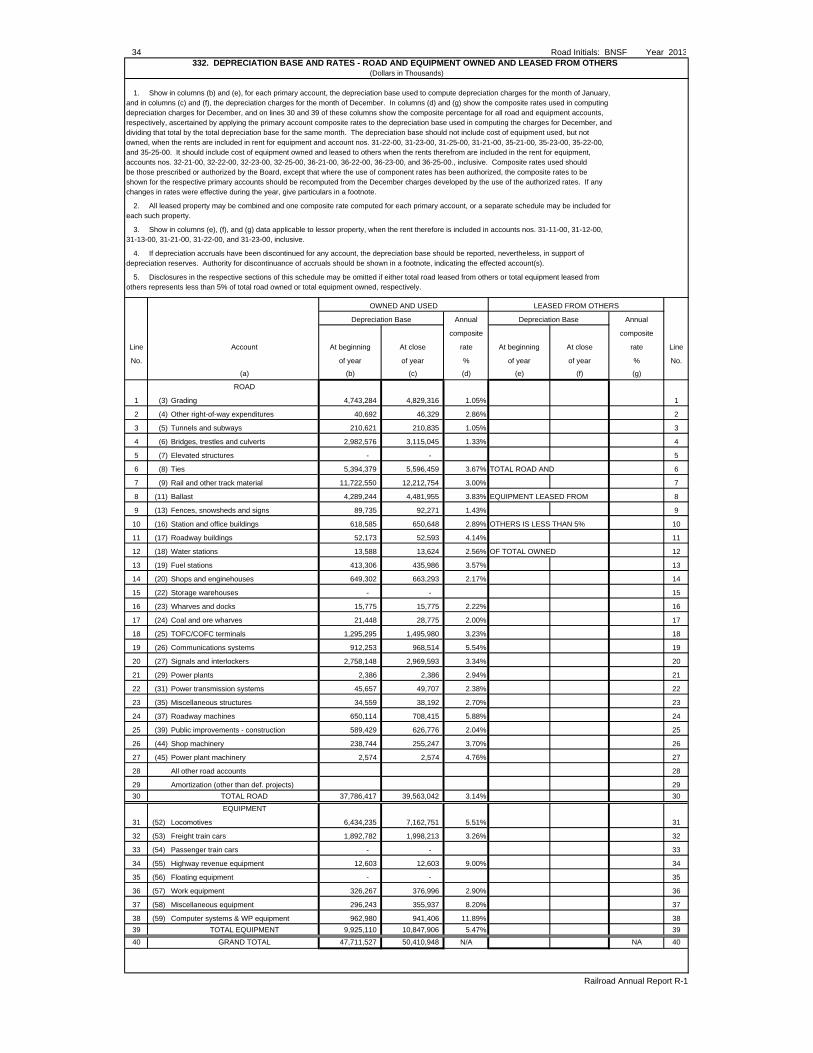
34 Road Initials: BNSF Year 2013332. DEPRECIATION BASE AND RATES - ROAD AND EQUIPMENT OWNED AND LEASED FROM OTHERS
(Dollars in Thousands)
1. Show in columns (b) and (e), for each primary account, the depreciation base used to compute depreciation charges for the month of January, and in columns (c) and (f), the depreciation charges for the month of December. In columns (d) and (g) show the composite rates used in computing depreciation charges for December, and on lines 30 and 39 of these columns show the composite percentage for all road and equipment accounts, respectively, ascertained by applying the primary account composite rates to the depreciation base used in computing the charges for December, and dividing that total by the total depreciation base for the same month. The depreciation base should not include cost of equipment used, but not owned, when the rents are included in rent for equipment and account nos. 31-22-00, 31-23-00, 31-25-00, 31-21-00, 35-21-00, 35-23-00, 35-22-00, and 35-25-00. It should include cost of equipment owned and leased to others when the rents therefrom are included in the rent for equipment, accounts nos. 32-21-00, 32-22-00, 32-23-00, 32-25-00, 36-21-00, 36-22-00, 36-23-00, and 36-25-00., inclusive. Composite rates used should be those prescribed or authorized by the Board, except that where the use of component rates has been authorized, the composite rates to be shown for the respective primary accounts should be recomputed from the December charges developed by the use of the authorized rates. If any changes in rates were effective during the year, give particulars in a footnote.
2. All leased property may be combined and one composite rate computed for each primary account, or a separate schedule may be included for each such property.
3. Show in columns (e), (f), and (g) data applicable to lessor property, when the rent therefore is included in accounts nos. 31-11-00, 31-12-00, 31-13-00, 31-21-00, 31-22-00, and 31-23-00, inclusive.
4. If depreciation accruals have been discontinued for any account, the depreciation base should be reported, nevertheless, in support of depreciation reserves. Authority for discontinuance of accruals should be shown in a footnote, indicating the effected account(s).
5. Disclosures in the respective sections of this schedule may be omitted if either total road leased from others or total equipment leased from others represents less than 5% of total road owned or total equipment owned, respectively.
OWNED AND USED LEASED FROM OTHERS
Depreciation Base Annual Depreciation Base Annual
composite composite
Line Account At beginning At close rate At beginning At close rate Line
No. of year of year % of year of year % No.
(a) (b) (c) (d) (e) (f) (g)
ROAD
1 (3) Grading 4,743,284 4,829,316 1.05% 1
2 (4) Other right-of-way expenditures 40,692 46,329 2.86% 2
3 (5) Tunnels and subways 210,621 210,835 1.05% 3
4 (6) Bridges, trestles and culverts 2,982,576 3,115,045 1.33% 4
5 (7) Elevated structures - - 5
6 (8) Ties 5,394,379 5,596,459 3.67% TOTAL ROAD AND 6
7 (9) Rail and other track material 11,722,550 12,212,754 3.00% 7
8 (11) Ballast 4,289,244 4,481,955 3.83% EQUIPMENT LEASED FROM 8
9 (13) Fences, snowsheds and signs 89,735 92,271 1.43% 9
10 (16) Station and office buildings 618,585 650,648 2.89% OTHERS IS LESS THAN 5% 10
11 (17) Roadway buildings 52,173 52,593 4.14% 11
12 (18) Water stations 13,588 13,624 2.56% OF TOTAL OWNED 12
13 (19) Fuel stations 413,306 435,986 3.57% 13
14 (20) Shops and enginehouses 649,302 663,293 2.17% 14
15 (22) Storage warehouses - - 15
16 (23) Wharves and docks 15,775 15,775 2.22% 16
17 (24) Coal and ore wharves 21,448 28,775 2.00% 17
18 (25) TOFC/COFC terminals 1,295,295 1,495,980 3.23% 18
19 (26) Communications systems 912,253 968,514 5.54% 19
20 (27) Signals and interlockers 2,758,148 2,969,593 3.34% 20
21 (29) Power plants 2,386 2,386 2.94% 21
22 (31) Power transmission systems 45,657 49,707 2.38% 22
23 (35) Miscellaneous structures 34,559 38,192 2.70% 23
24 (37) Roadway machines 650,114 708,415 5.88% 24
25 (39) Public improvements - construction 589,429 626,776 2.04% 25
26 (44) Shop machinery 238,744 255,247 3.70% 26
27 (45) Power plant machinery 2,574 2,574 4.76% 27
28 All other road accounts 28
29 Amortization (other than def. projects) 29
30 TOTAL ROAD 37,786,417 39,563,042 3.14% 30
EQUIPMENT
31 (52) Locomotives 6,434,235 7,162,751 5.51% 31
32 (53) Freight train cars 1,892,782 1,998,213 3.26% 32
33 (54) Passenger train cars - - 33
34 (55) Highway revenue equipment 12,603 12,603 9.00% 34
35 (56) Floating equipment - - 35
36 (57) Work equipment 326,267 376,996 2.90% 36
37 (58) Miscellaneous equipment 296,243 355,937 8.20% 37
38 (59) Computer systems & WP equipment 962,980 941,406 11.89% 38
39 TOTAL EQUIPMENT 9,925,110 10,847,906 5.47% 39
40 GRAND TOTAL 47,711,527 50,410,948 N/A NA 40
Railroad Annual Report R-1
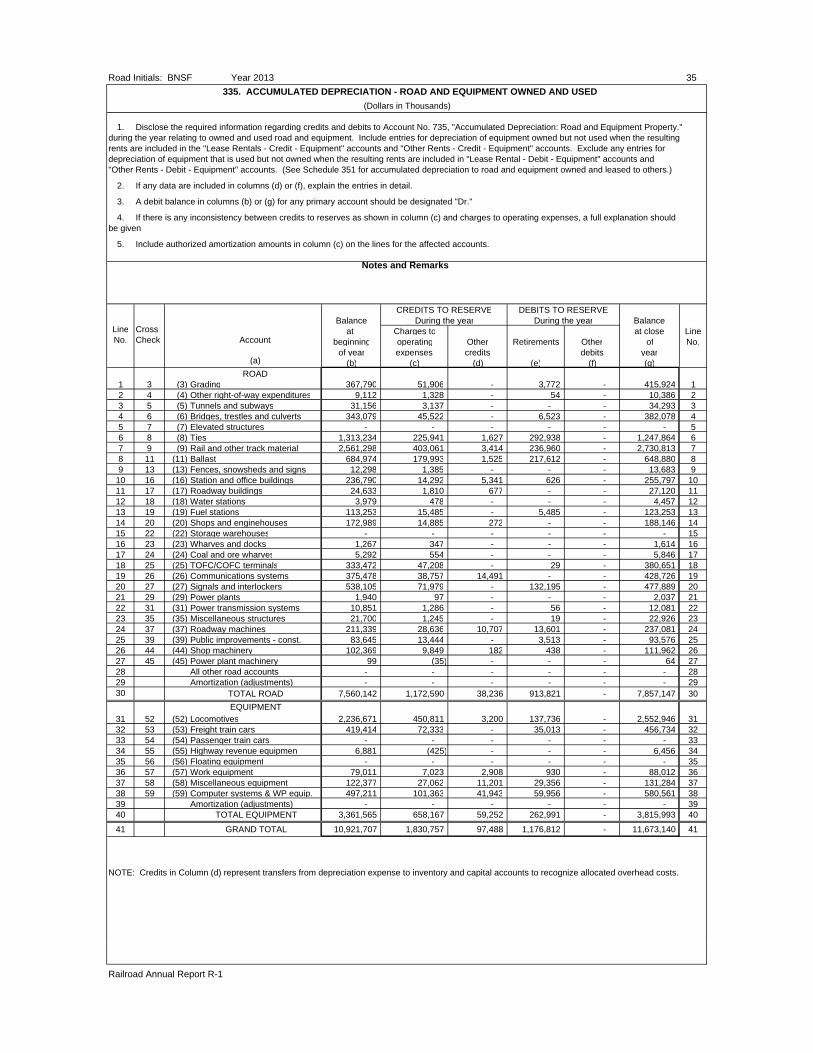
Road Initials: BNSF Year 2013 35
335. ACCUMULATED DEPRECIATION - ROAD AND EQUIPMENT OWNED AND USED
(Dollars in Thousands)
1. Disclose the required information regarding credits and debits to Account No. 735, "Accumulated Depreciation: Road and Equipment Property." during the year relating to owned and used road and equipment. Include entries for depreciation of equipment owned but not used when the resultingrents are included in the "Lease Rentals - Credit - Equipment" accounts and "Other Rents - Credit - Equipment" accounts. Exclude any entries for depreciation of equipment that is used but not owned when the resulting rents are included in "Lease Rental - Debit - Equipment" accounts and "Other Rents - Debit - Equipment" accounts. (See Schedule 351 for accumulated depreciation to road and equipment owned and leased to others.)
2. If any data are included in columns (d) or (f), explain the entries in detail.
3. A debit balance in columns (b) or (g) for any primary account should be designated "Dr."
4. If there is any inconsistency between credits to reserves as shown in column (c) and charges to operating expenses, a full explanation should be given.
5. Include authorized amortization amounts in column (c) on the lines for the affected accounts.
Balance BalanceLine Cross at Charges to at close LineNo. Check Account beginning operating Other Retirements Other of No.
of year expenses credits debits year(a) (b) (c) (d) (e) (f) (g)
ROAD1 3 (3) Grading 367,790 51,906 - 3,772 - 415,924 12 4 (4) Other right-of-way expenditures 9,112 1,328 - 54 - 10,386 23 5 (5) Tunnels and subways 31,156 3,137 - - - 34,293 34 6 (6) Bridges, trestles and culverts 343,079 45,522 - 6,523 - 382,078 45 7 (7) Elevated structures - - - - - - 56 8 (8) Ties 1,313,234 225,941 1,627 292,938 - 1,247,864 67 9 (9) Rail and other track material 2,561,298 403,061 3,414 236,960 - 2,730,813 78 11 (11) Ballast 684,974 179,993 1,525 217,612 - 648,880 89 13 (13) Fences, snowsheds and signs 12,298 1,385 - - - 13,683 9
10 16 (16) Station and office buildings 236,790 14,292 5,341 626 - 255,797 1011 17 (17) Roadway buildings 24,633 1,810 677 - - 27,120 1112 18 (18) Water stations 3,979 478 - - - 4,457 1213 19 (19) Fuel stations 113,253 15,485 - 5,485 - 123,253 1314 20 (20) Shops and enginehouses 172,989 14,885 272 - - 188,146 1415 22 (22) Storage warehouses - - - - - - 1516 23 (23) Wharves and docks 1,267 347 - - - 1,614 1617 24 (24) Coal and ore wharves 5,292 554 - - - 5,846 1718 25 (25) TOFC/COFC terminals 333,472 47,208 - 29 - 380,651 1819 26 (26) Communications systems 375,478 38,757 14,491 - - 428,726 1920 27 (27) Signals and interlockers 538,105 71,979 - 132,195 - 477,889 2021 29 (29) Power plants 1,940 97 - - - 2,037 2122 31 (31) Power transmission systems 10,851 1,286 - 56 - 12,081 2223 35 (35) Miscellaneous structures 21,700 1,245 - 19 - 22,926 2324 37 (37) Roadway machines 211,339 28,636 10,707 13,601 - 237,081 2425 39 (39) Public improvements - const. 83,645 13,444 - 3,513 - 93,576 2526 44 (44) Shop machinery 102,369 9,849 182 438 - 111,962 2627 45 (45) Power plant machinery 99 (35) - - - 64 2728 All other road accounts - - - - - - 2829 Amortization (adjustments) - - - - - - 2930 TOTAL ROAD 7,560,142 1,172,590 38,236 913,821 - 7,857,147 30
EQUIPMENT31 52 (52) Locomotives 2,236,671 450,811 3,200 137,736 - 2,552,946 3132 53 (53) Freight train cars 419,414 72,333 - 35,013 - 456,734 3233 54 (54) Passenger train cars - - - - - - 3334 55 (55) Highway revenue equipmen 6,881 (425) - - - 6,456 3435 56 (56) Floating equipment - - - - - - 3536 57 (57) Work equipment 79,011 7,023 2,908 930 - 88,012 3637 58 (58) Miscellaneous equipment 122,377 27,062 11,201 29,356 - 131,284 3738 59 (59) Computer systems & WP equip. 497,211 101,363 41,943 59,956 - 580,561 3839 Amortization (adjustments) - - - - - - 3940 TOTAL EQUIPMENT 3,361,565 658,167 59,252 262,991 - 3,815,993 40
41 GRAND TOTAL 10,921,707 1,830,757 97,488 1,176,812 - 11,673,140 41
NOTE: Credits in Column (d) represent transfers from depreciation expense to inventory and capital accounts to recognize allocated overhead costs.
Railroad Annual Report R-1
Notes and Remarks
CREDITS TO RESERVEDuring the year
DEBITS TO RESERVEDuring the year
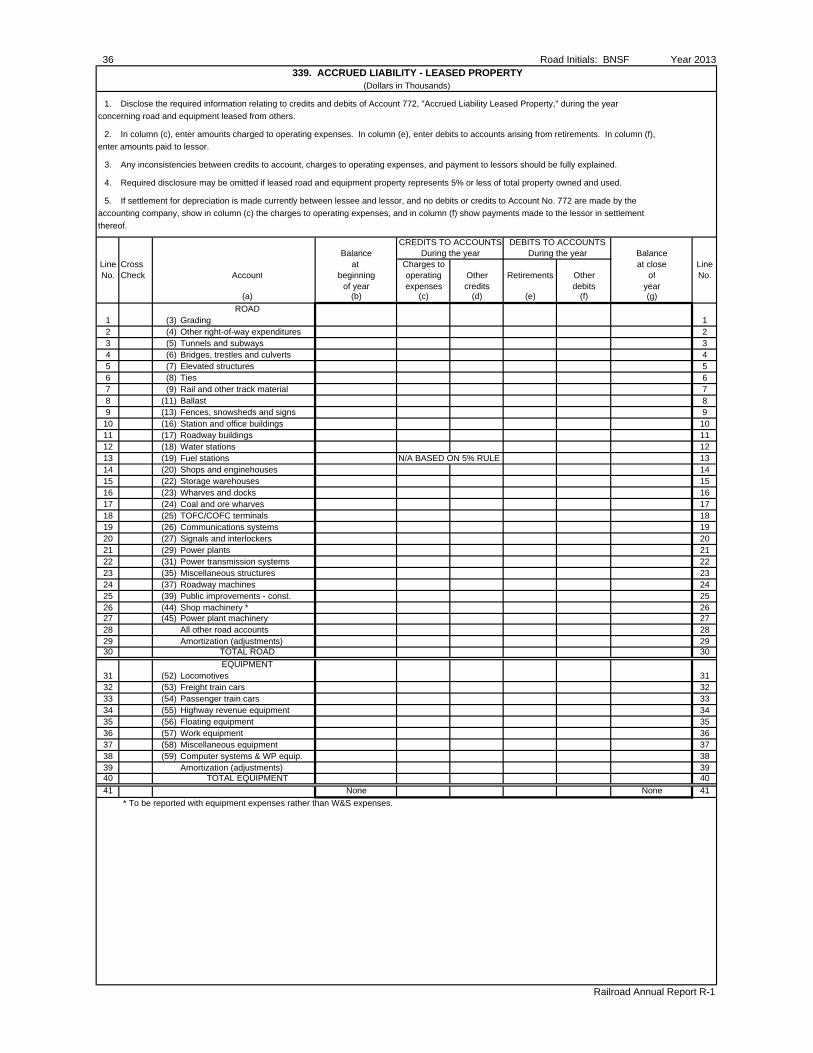
36 Road Initials: BNSF Year 2013339. ACCRUED LIABILITY - LEASED PROPERTY
(Dollars in Thousands)
1. Disclose the required information relating to credits and debits of Account 772, "Accrued Liability Leased Property," during the year
concerning road and equipment leased from others.
2. In column (c), enter amounts charged to operating expenses. In column (e), enter debits to accounts arising from retirements. In column (f),
enter amounts paid to lessor.
3. Any inconsistencies between credits to account, charges to operating expenses, and payment to lessors should be fully explained.
4. Required disclosure may be omitted if leased road and equipment property represents 5% or less of total property owned and used.
5. If settlement for depreciation is made currently between lessee and lessor, and no debits or credits to Account No. 772 are made by the
accounting company, show in column (c) the charges to operating expenses, and in column (f) show payments made to the lessor in settlement
thereof.
CREDITS TO ACCOUNTS DEBITS TO ACCOUNTSBalance During the year During the year Balance
Line Cross at Charges to at close LineNo. Check Account beginning operating Other Retirements Other of No.
of year expenses credits debits year(a) (b) (c) (d) (e) (f) (g)
ROAD1 (3) Grading 12 (4) Other right-of-way expenditures 23 (5) Tunnels and subways 34 (6) Bridges, trestles and culverts 45 (7) Elevated structures 56 (8) Ties 67 (9) Rail and other track material 78 (11) Ballast 89 (13) Fences, snowsheds and signs 910 (16) Station and office buildings 1011 (17) Roadway buildings 1112 (18) Water stations 1213 (19) Fuel stations N/A BASED ON 5% RULE 1314 (20) Shops and enginehouses 1415 (22) Storage warehouses 1516 (23) Wharves and docks 1617 (24) Coal and ore wharves 1718 (25) TOFC/COFC terminals 1819 (26) Communications systems 1920 (27) Signals and interlockers 2021 (29) Power plants 2122 (31) Power transmission systems 2223 (35) Miscellaneous structures 2324 (37) Roadway machines 2425 (39) Public improvements - const. 2526 (44) Shop machinery * 2627 (45) Power plant machinery 2728 All other road accounts 2829 Amortization (adjustments) 2930 TOTAL ROAD 30
EQUIPMENT31 (52) Locomotives 3132 (53) Freight train cars 3233 (54) Passenger train cars 3334 (55) Highway revenue equipment 3435 (56) Floating equipment 3536 (57) Work equipment 3637 (58) Miscellaneous equipment 3738 (59) Computer systems & WP equip. 3839 Amortization (adjustments) 3940 TOTAL EQUIPMENT 40
41 None None 41
* To be reported with equipment expenses rather than W&S expenses.
Railroad Annual Report R-1
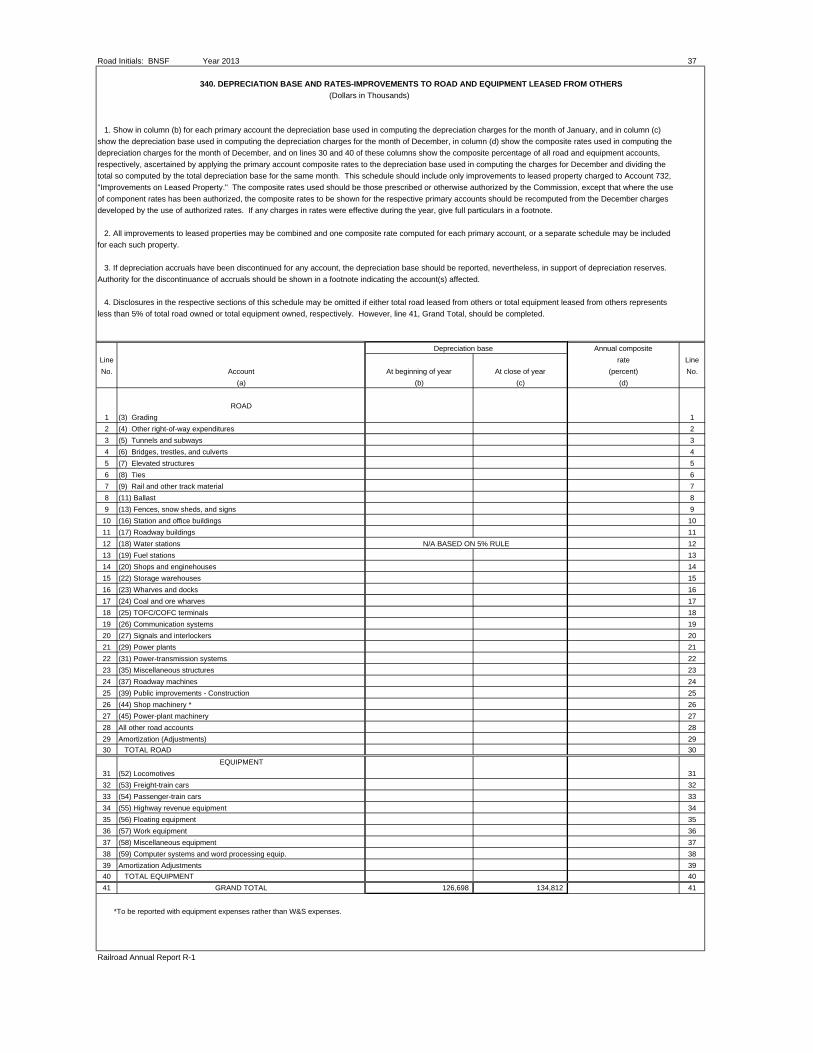
Road Initials: BNSF Year 2013 37
1. Show in column (b) for each primary account the depreciation base used in computing the depreciation charges for the month of January, and in column (c)
show the depreciation base used in computing the depreciation charges for the month of December, in column (d) show the composite rates used in computing the
depreciation charges for the month of December, and on lines 30 and 40 of these columns show the composite percentage of all road and equipment accounts,
respectively, ascertained by applying the primary account composite rates to the depreciation base used in computing the charges for December and dividing the
total so computed by the total depreciation base for the same month. This schedule should include only improvements to leased property charged to Account 732,
"Improvements on Leased Property." The composite rates used should be those prescribed or otherwise authorized by the Commission, except that where the use
of component rates has been authorized, the composite rates to be shown for the respective primary accounts should be recomputed from the December charges
developed by the use of authorized rates. If any charges in rates were effective during the year, give full particulars in a footnote.
2. All improvements to leased properties may be combined and one composite rate computed for each primary account, or a separate schedule may be included
for each such property.
3. If depreciation accruals have been discontinued for any account, the depreciation base should be reported, nevertheless, in support of depreciation reserves.
Authority for the discontinuance of accruals should be shown in a footnote indicating the account(s) affected.
4. Disclosures in the respective sections of this schedule may be omitted if either total road leased from others or total equipment leased from others represents
less than 5% of total road owned or total equipment owned, respectively. However, line 41, Grand Total, should be completed.
Depreciation base Annual composite
Line rate Line
No. Account At beginning of year At close of year (percent) No.
(a) (b) (c) (d)
ROAD
1 (3) Grading 1
2 (4) Other right-of-way expenditures 2
3 (5) Tunnels and subways 3
4 (6) Bridges, trestles, and culverts 4
5 (7) Elevated structures 5
6 (8) Ties 6
7 (9) Rail and other track material 7
8 (11) Ballast 8
9 (13) Fences, snow sheds, and signs 9
10 (16) Station and office buildings 10
11 (17) Roadway buildings 11
12 (18) Water stations N/A BASED ON 5% RULE 12
13 (19) Fuel stations 13
14 (20) Shops and enginehouses 14
15 (22) Storage warehouses 15
16 (23) Wharves and docks 16
17 (24) Coal and ore wharves 17
18 (25) TOFC/COFC terminals 18
19 (26) Communication systems 19
20 (27) Signals and interlockers 20
21 (29) Power plants 21
22 (31) Power-transmission systems 22
23 (35) Miscellaneous structures 23
24 (37) Roadway machines 24
25 (39) Public improvements - Construction 25
26 (44) Shop machinery * 26
27 (45) Power-plant machinery 27
28 All other road accounts 28
29 Amortization (Adjustments) 29
30 TOTAL ROAD 30
EQUIPMENT
31 (52) Locomotives 31
32 (53) Freight-train cars 32
33 (54) Passenger-train cars 33
34 (55) Highway revenue equipment 34
35 (56) Floating equipment 35
36 (57) Work equipment 36
37 (58) Miscellaneous equipment 37
38 (59) Computer systems and word processing equip. 38
39 Amortization Adjustments 39
40 TOTAL EQUIPMENT 40
41 GRAND TOTAL 126,698 134,812 41
*To be reported with equipment expenses rather than W&S expenses.
Railroad Annual Report R-1
340. DEPRECIATION BASE AND RATES-IMPROVEMENTS TO ROAD AND EQUIPMENT LEASED FROM OTHERS
(Dollars in Thousands)
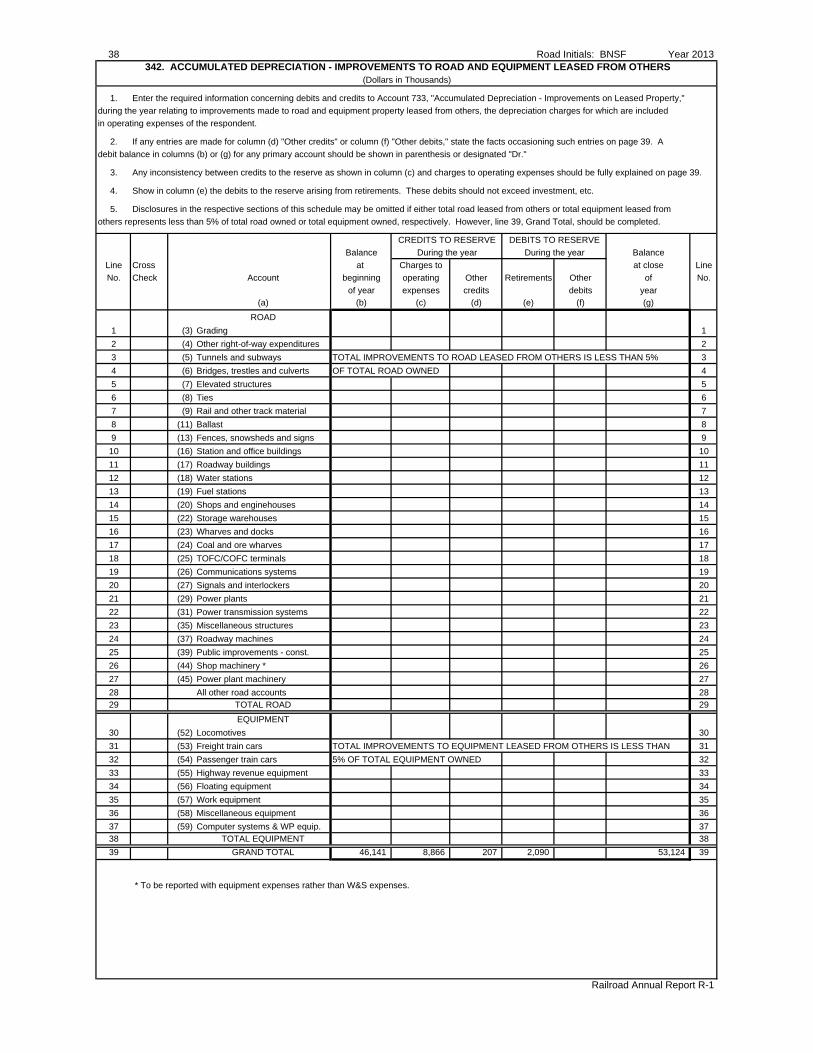
38 Road Initials: BNSF Year 2013
(Dollars in Thousands)
1. Enter the required information concerning debits and credits to Account 733, "Accumulated Depreciation - Improvements on Leased Property,"
during the year relating to improvements made to road and equipment property leased from others, the depreciation charges for which are included
in operating expenses of the respondent.
2. If any entries are made for column (d) "Other credits" or column (f) "Other debits," state the facts occasioning such entries on page 39. A
debit balance in columns (b) or (g) for any primary account should be shown in parenthesis or designated "Dr."
3. Any inconsistency between credits to the reserve as shown in column (c) and charges to operating expenses should be fully explained on page 39.
4. Show in column (e) the debits to the reserve arising from retirements. These debits should not exceed investment, etc.
5. Disclosures in the respective sections of this schedule may be omitted if either total road leased from others or total equipment leased from
others represents less than 5% of total road owned or total equipment owned, respectively. However, line 39, Grand Total, should be completed.
CREDITS TO RESERVE DEBITS TO RESERVE
Balance During the year During the year Balance
Line Cross at Charges to at close Line
No. Check Account beginning operating Other Retirements Other of No.
of year expenses credits debits year(a) (b) (c) (d) (e) (f) (g)
ROAD
1 (3) Grading 1
2 (4) Other right-of-way expenditures 2
3 (5) Tunnels and subways TOTAL IMPROVEMENTS TO ROAD LEASED FROM OTHERS IS LESS THAN 5% 3
4 (6) Bridges, trestles and culverts OF TOTAL ROAD OWNED 4
5 (7) Elevated structures 5
6 (8) Ties 6
7 (9) Rail and other track material 7
8 (11) Ballast 8
9 (13) Fences, snowsheds and signs 9
10 (16) Station and office buildings 10
11 (17) Roadway buildings 11
12 (18) Water stations 12
13 (19) Fuel stations 13
14 (20) Shops and enginehouses 14
15 (22) Storage warehouses 15
16 (23) Wharves and docks 16
17 (24) Coal and ore wharves 17
18 (25) TOFC/COFC terminals 18
19 (26) Communications systems 19
20 (27) Signals and interlockers 20
21 (29) Power plants 21
22 (31) Power transmission systems 22
23 (35) Miscellaneous structures 23
24 (37) Roadway machines 24
25 (39) Public improvements - const. 25
26 (44) Shop machinery * 26
27 (45) Power plant machinery 27
28 All other road accounts 2829 TOTAL ROAD 29
EQUIPMENT
30 (52) Locomotives 30
31 (53) Freight train cars TOTAL IMPROVEMENTS TO EQUIPMENT LEASED FROM OTHERS IS LESS THAN 31
32 (54) Passenger train cars 5% OF TOTAL EQUIPMENT OWNED 32
33 (55) Highway revenue equipment 33
34 (56) Floating equipment 34
35 (57) Work equipment 35
36 (58) Miscellaneous equipment 36
37 (59) Computer systems & WP equip. 3738 TOTAL EQUIPMENT 38
39 GRAND TOTAL 46,141 8,866 207 2,090 53,124 39
* To be reported with equipment expenses rather than W&S expenses.
Railroad Annual Report R-1
342. ACCUMULATED DEPRECIATION - IMPROVEMENTS TO ROAD AND EQUIPMENT LEASED FROM OTHERS
Road Initials: BNSF Year 2013 39NOTES AND REMARKS FOR SCHEDULE 342
Railroad Annual Report R-1
THIS PAGE INTENTIONALLY LEFT BLANK
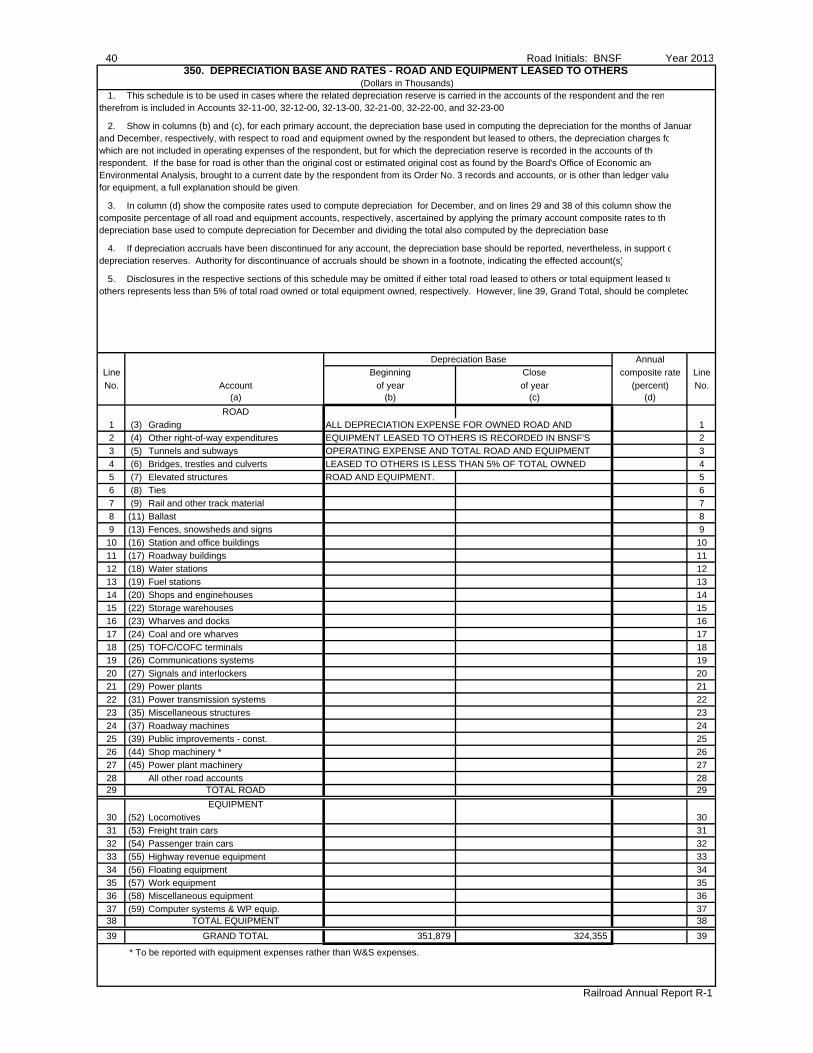
40 Road Initials: BNSF Year 2013350. DEPRECIATION BASE AND RATES - ROAD AND EQUIPMENT LEASED TO OTHERS
(Dollars in Thousands)1. This schedule is to be used in cases where the related depreciation reserve is carried in the accounts of the respondent and the ren
therefrom is included in Accounts 32-11-00, 32-12-00, 32-13-00, 32-21-00, 32-22-00, and 32-23-00
2. Show in columns (b) and (c), for each primary account, the depreciation base used in computing the depreciation for the months of Januaryand December, respectively, with respect to road and equipment owned by the respondent but leased to others, the depreciation charges fowhich are not included in operating expenses of the respondent, but for which the depreciation reserve is recorded in the accounts of therespondent. If the base for road is other than the original cost or estimated original cost as found by the Board's Office of Economic andEnvironmental Analysis, brought to a current date by the respondent from its Order No. 3 records and accounts, or is other than ledger valuefor equipment, a full explanation should be given.
3. In column (d) show the composite rates used to compute depreciation for December, and on lines 29 and 38 of this column show thecomposite percentage of all road and equipment accounts, respectively, ascertained by applying the primary account composite rates to thedepreciation base used to compute depreciation for December and dividing the total also computed by the depreciation base
4. If depreciation accruals have been discontinued for any account, the depreciation base should be reported, nevertheless, in support odepreciation reserves. Authority for discontinuance of accruals should be shown in a footnote, indicating the effected account(s)
5. Disclosures in the respective sections of this schedule may be omitted if either total road leased to others or total equipment leased toothers represents less than 5% of total road owned or total equipment owned, respectively. However, line 39, Grand Total, should be completed
Depreciation Base Annual
Line Beginning Close composite rate Line
No. Account of year of year (percent) No.(a) (b) (c) (d)
ROAD
1 (3) Grading ALL DEPRECIATION EXPENSE FOR OWNED ROAD AND 1
2 (4) Other right-of-way expenditures EQUIPMENT LEASED TO OTHERS IS RECORDED IN BNSF'S 2
3 (5) Tunnels and subways OPERATING EXPENSE AND TOTAL ROAD AND EQUIPMENT 3
4 (6) Bridges, trestles and culverts LEASED TO OTHERS IS LESS THAN 5% OF TOTAL OWNED 4
5 (7) Elevated structures ROAD AND EQUIPMENT. 5
6 (8) Ties 6
7 (9) Rail and other track material 7
8 (11) Ballast 8
9 (13) Fences, snowsheds and signs 9
10 (16) Station and office buildings 10
11 (17) Roadway buildings 11
12 (18) Water stations 12
13 (19) Fuel stations 13
14 (20) Shops and enginehouses 14
15 (22) Storage warehouses 15
16 (23) Wharves and docks 16
17 (24) Coal and ore wharves 17
18 (25) TOFC/COFC terminals 18
19 (26) Communications systems 19
20 (27) Signals and interlockers 20
21 (29) Power plants 21
22 (31) Power transmission systems 22
23 (35) Miscellaneous structures 23
24 (37) Roadway machines 24
25 (39) Public improvements - const. 25
26 (44) Shop machinery * 26
27 (45) Power plant machinery 27
28 All other road accounts 2829 TOTAL ROAD 29
EQUIPMENT
30 (52) Locomotives 30
31 (53) Freight train cars 31
32 (54) Passenger train cars 32
33 (55) Highway revenue equipment 33
34 (56) Floating equipment 34
35 (57) Work equipment 35
36 (58) Miscellaneous equipment 36
37 (59) Computer systems & WP equip. 3738 TOTAL EQUIPMENT 38
39 GRAND TOTAL 351,879 324,355 39
* To be reported with equipment expenses rather than W&S expenses.
Railroad Annual Report R-1
Road Initials: BNSF Year 2013 41351. ACCUMULATED DEPRECIATION - ROAD AND EQUIPMENT LEASED TO OTHERS
(Dollars in Thousands)
1. This schedule is to be used in cases where the related depreciation reserve is carried in the accounts of the respondent and the rent
therefrom is included in Accounts 32-11-00, 32-12-00, 32-13-00, 32-21-00, 32-22-00, and 32-23-00.
2. Disclose credits and debits to Account 735, "Accumulated Depreciation - Road and Equipment Property," during the year relating to road
and equipment leased to others, the depreciation charges for which are not included in operating expenses of the respondent. (See Schedule 330
for the reserve relating to road and equipment owned and used by the respondent.
3. If any entries are made for column (d) "Other credits" or column (f) "Other debits," state the facts occasioning such entries on page 39. A
debit balance in columns (b) or (g) for any primary account should be shown in parenthesis or designated "Dr."
4. Disclosures in the respective sections of this schedule may be omitted if either total road leased to others or total equipment leased to
others represents less than 5% of total road owned or total equipment owned, respectively. However, line 39, Grand Total, should be completed.
CREDITS TO RESERVE DEBITS TO RESERVEBalance During the year During the year Balance
Line Cross at Charges to at close LineNo. Check Account beginning operating Other Retirements Other of No.
of year expenses credits debits year(a) (b) (c) (d) (e) (f) (g)
ROAD1 (3) Grading 12 (4) Other right-of-way expenditures TOTAL ROAD LEASED TO OTHERS IS LESS THAN 5% 23 (5) Tunnels and subways OF TOTAL ROAD OWNED. 34 (6) Bridges, trestles and culverts 45 (7) Elevated structures 56 (8) Ties 67 (9) Rail and other track material 78 (11) Ballast 89 (13) Fences, snowsheds and signs 910 (16) Station and office buildings 1011 (17) Roadway buildings 1112 (18) Water stations 1213 (19) Fuel stations 1314 (20) Shops and enginehouses 1415 (22) Storage warehouses 1516 (23) Wharves and docks 1617 (24) Coal and ore wharves 1718 (25) TOFC/COFC terminals 1819 (26) Communications systems 1920 (27) Signals and interlockers 2021 (29) Power plants 2122 (31) Power transmission systems 2223 (35) Miscellaneous structures 2324 (37) Roadway machines 2425 (39) Public improvements - const. 2526 (44) Shop machinery * 2627 (45) Power plant machinery 2728 All other road accounts 2829 TOTAL ROAD 29
EQUIPMENT30 (52) Locomotives 3031 (53) Freight train cars TOTAL EQUIPMENT LEASED TO OTHERS IS LESS THAN 5% 3132 (54) Passenger train cars OF TOTAL EQUIPMENT OWNED. 3233 (55) Highway revenue equipment 3334 (56) Floating equipment 3435 (57) Work equipment 3536 (58) Miscellaneous equipment 3637 (59) Computer systems & WP equip. 3738 TOTAL EQUIPMENT 38
39 GRAND TOTAL 140,697 134,686 39
* To be reported with equipment expenses rather than W&S expenses.
Railroad Annual Report R-1
42 Road Initials: BNSF Year 2013352A. INVESTMENT IN RAILROAD PROPERTY USED IN TRANSPORTATION SERVICE (By Company)
(Dollars in Thousands)
1. Disclose the investment in railway property used in transportation service at the close of the year. This investment represents the aggregate of property ownedor leased by respondent and used in respondent's transportation service. Such property includes (a) investment reported in Accounts 731, "Road and EquipmentProperty" and 732, "improvements on Leased Property" of respondent, less any 731 or 732 property leased to others for their exclusive use of road, track, or bridges (including equipment or other railway property covered by the contract). Equipment leased to others under separate distinct contracts shall not be deducted fromrespondent's 731 or 732 property, and (b) the investment of other companies' 731 or 732 property (including operating and lessor railroads) used by respondent whenthe lease is for exclusive use or control of roads, tracks, or bridges (including equipment or other railway property covered by the contract). This excludes leaseequipment from operating railroads under separate distinct contracts and the investment of other carriers in property jointly used by respondent.
2. In column (a), classify each company in this schedule as: "R" for respondent, "L" for lessor railroad, "P" for inactive or proprietary company or "O" for otherleased properties.
3. In columns (a) to (e), inclusive, first show the data requested for respondent (R); next show data for companies whose entire properties are used in transportationservice of the respondent, divided between lessor (L) and proprietary (P) companies; followed by data for carriers and others (O), portions of whose property are usedin transportation service of respondent. Show a total for each class of company in columns (d) and (e). Then show, as deductions. data for transportationproperty leased to carriers and others.
4. In column (c), line-haul carriers report the miles of road used in line-haul service. Report miles in whole numbers.
5. In column (d), show the amount applicable to Accounts 731 and 732 on the books of companies whose names appear in column (b). Values of propertyof other carriers segregated by estimate or otherwise should correspond in amount to deductions made by the owners in their reports. If separate value is notavailable, an explanation should be provided. Differences between amounts shown in column (d) of this schedule and column (c), line 24, on the asset side ofthe general balance sheet of each individual railway should be explained in a footnote. Book values included in Accounts 731 and 732 of the owner should bereported in column (d) in reference to the investment of respondent in securities of the owner unless a good reason can be given for the contrary. Methods ofestimating (by capitalizing rentals at 6% or otherwise) value of property of private owners, or portions of property of other carriers, should be explained.
6. In column (e), show the amount of depreciation and amortization accrued as of the close of the year in Accounts 733, 734, 735, 736, and 772, that is applicableto the property of the carriers whose names are listed in column (b), regardless of where reserves therefor are recorded.
DepreciationClass Miles of road Investments & amortization of
Line (See Name of company used (See Ins. 4) in property defense projects LineNo. (Ins. 2) (whole number) (See Ins. 5) (See Ins. 6) No.
(a) (b) (c) (d) (e)1 R The Burlington Northern and Santa Fe Railway Company 23,319 54,350,689 11,673,140 12 23 Add Leased from Others: 34 L Dayton, TX - Yard *** ** **** 45 L Copper City, MT 51 ** **** 56 Total Leased from Others 51 67 78 Deduct Leased to Others: 89 O *Timber Rock Railroad (TIBR) - Silsbee, TX Yard; Silsbee to Tenaha, TX 129 62,946 20,775 9
10 O*Portland & Western Railroad (PNWR) - Salem Yard, Albany Yard, Eugene Yard, Quinaby to Eugene, OR 77 17,622 9,068 10
11 O*Alabama & Gulf Coast Railway (AGR) - Mobile Yard, AL; Bucks, AL to Mobile, AL; Columbus to Whitbury, MS 27 2,463 1,043 11
12 O METRA - Aurora, IL Yard *** 439 125 1213 O South Kansas and Oklahoma Railroad (SKOL) - Pittsburg to Cherokee, KS 6 410 49 1314 O Burlington Junction (BJRY) - Quincy, IL to Marblehead, IL 6 5,550 4,139 14
15 O*Southwestern Railroad (SW) - Clovis, NM to Loving, NM; Ricon to Deming, NM; MCC Jct - NMPI; Carlsbad, NM to Eddy Potash 274 43,032 26,032 15
16O Kettle Falls International Railway (KFR) - Chewallah, WA to Columbia Gardens, BC
& Kettle Falls, WA 83 22,137 7,519 1617 O KAW River Railroad (KAW) - Birmingham to Kearney, MO 16 8,646 3,591 1718 O Mission Mountain Railroad (MMT) - Columbia Falls to Kalispell, MT 16 1,671 1,590 1819 O Northern Lines (NLR)- St. Cloud to East St. Cloud & St. Cloud to Cold Springs, MN 6 63 18 1920 O R.J. Corman - Tennessee Yard (Memphis Terminal) and Airport Park *** 46,688 10,076 2021 O Dakota Northern Railroad (DNR) - Grafton to Walhalla & Grafton to Glasston, ND 70 6,566 5,162 2122 O *Central Washington Railroad - Gibbon, WA to Granger, WA; Yakima to Moxee City, 40 11,650 2,823 2223 O *Industry (INDY) - Reno Jct., WY to Jacobs Jct., WY; Red Oak, IA, Red Cloud, NE 10 3,963 2,054 23
24 O*Tacoma Rail (TRMW) - Lakeview, WA to Nisqually, WA; Tacoma, WA to Lakeview, WA; Olympia, WA to Belmore, WA, & St. Clair, WA to Quadlok, WA 28 688 477 24
25 O Minnesota National Guard (MNG) - Little Falls, MN to Camp Riley, MN 8 466 447 2526 O Minnesota Commercial Railway Company (MNNR)- E MPLS M&D Jct 10 803 1,370 2627 O Nebraska, Kansas & Colorado Railway (NKCR) - Imperial Sub 48 3,340 4,284 2728 O Stillwater Central Railroad (SLWC) - Greig, OK to Wheatland, OK 10 1,751 (12) 2829 O Union Pacific Railroad (UP) - Marion to Hulbert, AR 5 483 340 2930 O Canadian National (CN) - Fraser River Jct, BC to Vancouver, BC 15 30,045 4,352 3031 O Chicago Lumber District (CIRY) - Chicago, IL Lumber District Yard *** 3,130 1,667 3132 O Blue Mountain Railroad (BLMR) - Wallula Jct, WA to Zanger, WA 4 195 43 3233 O Missouri & Valley Park Railroad (M&VP) - Yard *** 3,715 1,552 3334 O Richmond Pacific Railroad Corporation (RPRC) - Yard *** 32,711 9,138 3435 O York Canyon Line 12 651 35 3536 O San Joaquin Valley Railway-SJVR 2 36 0 3637 Total Leased to Others 902 311,860 117,757 3738 3839 Deduct Operated by Others: 3940 O Red River Valley & Western Railway (RRVW) 434 12,495 16,929 4041 Total Operated by Others 434 12,495 16,929 41
42 Net Deductions (1,285) (324,355) (134,686) 42
43 TOTAL 22,034 54,026,334 11,538,454 43
* Lease lines were consolidated to present one line per lessor.
** Investment not available to respondent.
*** Miles of road used not available to respondent.
**** Depreciation not available to respondent.
Railroad Annual Report R-1
Road Initials: BNSF Year 2013 43352B. INVESTMENT IN RAILROAD PROPERTY USED IN TRANSPORTATION SERVICE (By Property Account)
(Dollars in Thousands)
1. In columns (b) through (e) give, by primary accounts, the amount of investment at the close of the year in property of respondent and each
group or class of companies and properties.
2. The amounts for respondent and for each group or class of companies and properties on line 44 should correspond with the amounts for
each class of company and property shown in Schedule 352A. Continuing records shall be maintained by respondent of the primary property
accounts separately for each company or property included in this schedule.
3. Report on line 29 amounts representing capitalization of rentals for leased property based on 6% per year where property is not classified
by accounts by noncarrier owners, or where the cost of property leased from other carriers is not ascertainable. Identify noncarrier owners, and
briefly explain on page 39 the methods of estimating value of property on noncarriers or property of other carriers.
4. Report on line 30 amounts not included in the accounts shown, or on line 29. The items reported should be briefly identified and explained.
Also include here those items after permission is obtained from the Board for exceptions to prescribed accounting. Reference to such authority
should be made when explaining amounts reported. Respondents must not make arbitrary changes to the printed stub or column headings without
specific authority from the Board.
Line Cross Account Respondent Lessor Inactive (proprie- Other leased LineNo. Check Railroads tary companies) properties No.
(a) (b) (c) (d) (e)*
1 (2) Land for transportation purposes 2,964,241 (24,751) 1
2 (3) Grading 4,829,316 (14,520) 2
3 (4) Other right-of-way expenditures 46,329 (653) 3
4 (5) Tunnels and subways 210,835 (329) 4
5 (6) Bridges, trestles and culverts 3,115,045 (19,543) 5
6 (7) Elevated structures - - 6
7 (8) Ties 5,596,459 (71,412) 7
8 (9) Rail and other track material 12,212,754 (100,055) 8
9 (11) Ballast 4,481,955 (47,327) 9
10 (13) Fences, snowsheds and signs 92,271 (750) 10
11 (16) Station and office buildings 650,648 (6,606) 11
12 (17) Roadway buildings 52,593 (202) 12
13 (18) Water stations 13,624 (10) 13
14 (19) Fuel stations 435,986 (1,614) 14
15 (20) Shops and enginehouses 663,293 (10,431) 15
16 (22) Storage warehouses - - 16
17 (23) Wharves and docks 15,775 - 17
18 (24) Coal and ore wharves 28,775 - 18
19 (25) TOFC/COFC terminals 1,495,980 - 19
20 (26) Communications systems 968,514 (5,097) 20
21 (27) Signals and interlockers 2,969,593 (13,769) 21
22 (29) Power plants 2,386 - 22
23 (31) Power transmission systems 49,707 (709) 23
24 (35) Miscellaneous structures 38,192 (130) 24
25 (37) Roadway machines 708,415 - 25
26 (39) Public improvements - construction 626,776 (4,498) 26
27 (44) Shop machinery 255,247 (1,767) 27
28 (45) Power plant machinery 2,574 - 28
29 Leased property (capitalized rentals) 29
30 Other (specify and explain) 30
31 TOTAL ROAD 42,527,283 (324,173) 31
32 (52) Locomotives 7,162,751 - 32
33 (53) Freight train cars 1,998,213 - 33
34 (54) Passenger train cars - - 34
35 (55) Highway revenue equipment 12,603 - 35
36 (56) Floating equipment - - 36
37 (57) Work equipment 376,996 - 37
38 (58) Miscellaneous equipment 355,937 - 38
39 (59) Computer systems & WP equipment 941,406 (182) 39
40 TOTAL EQUIPMENT 10,847,906 (182) 40
41 (76) Interest during construction - - 41
42 (80) Other elements of investment - - 42
43 (90) Construction work in progress 975,500 - 4344 GRAND TOTAL 54,350,689 (324,355) 44
* Includes property leased to and operated by others.
Railroad Annual Report R-1
INSTRUCTIONS CONCERNING RETURNS TO BE MADE IN SCHEDULE 410
Cross Checks
Schedule 410 Schedule 210 Schedule 410 Schedule 412
Line 620, column (h) = Line 14, column (b) Lines 136 through 138, column (f) = Line 29. column (b)
Line 620, column (f) = Line 14, column (d) Lines 118 through 123, and 130
Line 620, column (g) = Line 14, column (e) through 135, column (f) = Line 29. column (c)
Schedule 414 Schedule 415
Line 231, column (f) = Line 19, columns (b) through (d) Lines 207, 208, 211, 212, column (f) = Lines 5, 38, column (f)
Line 230, column (f) = Line 19, columns (e) through (g) Lines 226, 227, column (f) = Lines 24, 39, column (f)
Lines 311, 312, 315, 316, column (f) = Lines 32, 35, 36, 37, 40, 41, column (f)
Schedule 417 And
Schedule 414
Line 507, column (f) = Line 1, column (j)
Line 508, column (f) = Line 2, column (j) Minus line 24, columns (b) through (d)
Line 509, column (f) = Line 3, column (j) plus line 24, columns (e) through (g)
Line 510, column (f) = Line 4, column (j)
Line 511, column (f) = Line 5, column (j) Schedule 415
Line 512, column (f) = Line 6, column (j)
Line 513, column (f) = Line 7, column (j) Line 213, column (f) = Lines 5, 38, columns (c) and (d)
Line 514, column (f) = Line 8, column (j) Line 232, column (f) = Lines 24, 39, columns (c) and (d)
Line 515, column (f) = Line 9, column (j) Line 317, column (f) = Lines 32, 35, 36, 37, 40, 41,
Line 516, column (f) = Line 10, column (j) columns (c) and (d)
Line 517, column (f) = Line 11, column (j)
Line 202, 203, 216, column (f) , equal Lines 5, 38, column (b)
to or greater than, but variance cannot
exceed line 216, column (f)
Lines 221, 222, 235, column (f), equal Lines 24, 39, column (b)
to or greater than, but variance cannot
exceed line 235, column (f)
Lines 302 through 307 and 320, column (f) Lines 32, 35, 36, 37, 40, 41, column (b)
equal to or greater than, but variance
cannot exceed line 320, column (f)
Railroad A
nnual Report R
-1
44R
oad Initials: BN
SF
Year 2013
Railroad A
nnual Report R
-1
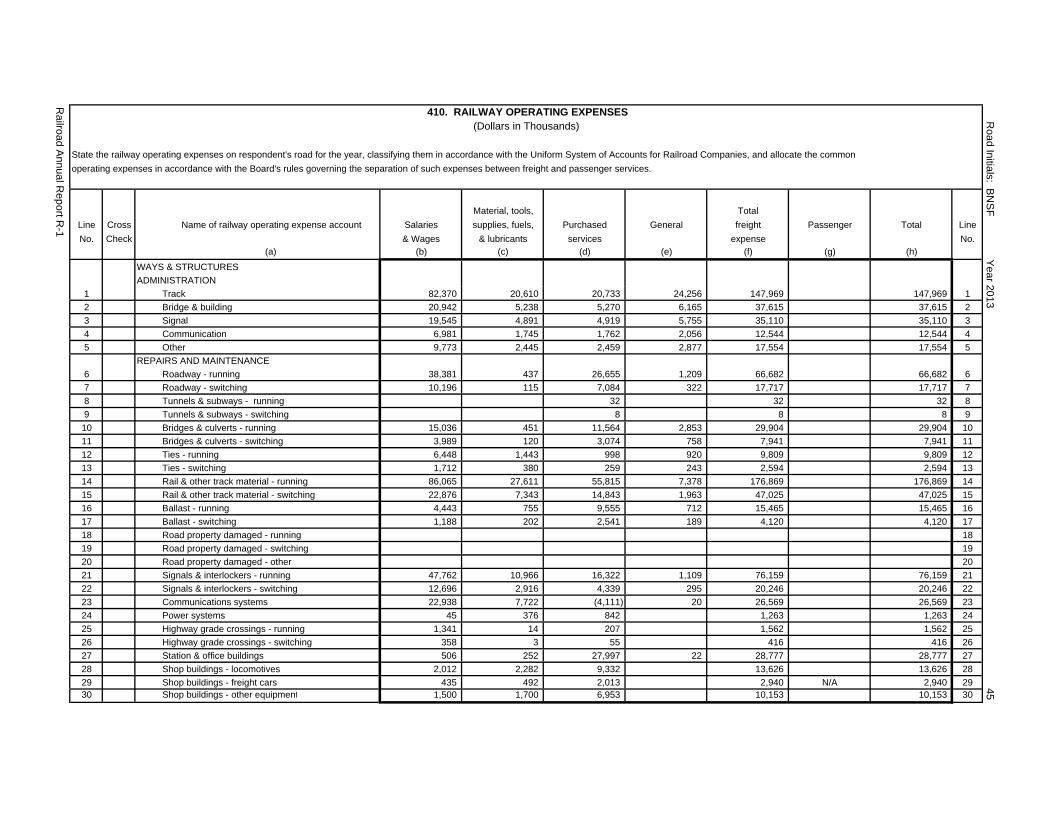
410. RAILWAY OPERATING EXPENSES(Dollars in Thousands)
State the railway operating expenses on respondent's road for the year, classifying them in accordance with the Uniform System of Accounts for Railroad Companies, and allocate the common
operating expenses in accordance with the Board's rules governing the separation of such expenses between freight and passenger services.
Material, tools, Total
Line Cross Name of railway operating expense account Salaries supplies, fuels, Purchased General freight Passenger Total Line
No. Check & Wages & lubricants services expense No.(a) (b) (c) (d) (e) (f) (g) (h)
WAYS & STRUCTURES
ADMINISTRATION
1 Track 82,370 20,610 20,733 24,256 147,969 147,969 1
2 Bridge & building 20,942 5,238 5,270 6,165 37,615 37,615 2
3 Signal 19,545 4,891 4,919 5,755 35,110 35,110 3
4 Communication 6,981 1,745 1,762 2,056 12,544 12,544 4
5 Other 9,773 2,445 2,459 2,877 17,554 17,554 5
REPAIRS AND MAINTENANCE
6 Roadway - running 38,381 437 26,655 1,209 66,682 66,682 6
7 Roadway - switching 10,196 115 7,084 322 17,717 17,717 7
8 Tunnels & subways - running 32 32 32 8
9 Tunnels & subways - switching 8 8 8 9
10 Bridges & culverts - running 15,036 451 11,564 2,853 29,904 29,904 10
11 Bridges & culverts - switching 3,989 120 3,074 758 7,941 7,941 11
12 Ties - running 6,448 1,443 998 920 9,809 9,809 12
13 Ties - switching 1,712 380 259 243 2,594 2,594 13
14 Rail & other track material - running 86,065 27,611 55,815 7,378 176,869 176,869 14
15 Rail & other track material - switching 22,876 7,343 14,843 1,963 47,025 47,025 15
16 Ballast - running 4,443 755 9,555 712 15,465 15,465 16
17 Ballast - switching 1,188 202 2,541 189 4,120 4,120 17
18 Road property damaged - running 18
19 Road property damaged - switching 19
20 Road property damaged - other 20
21 Signals & interlockers - running 47,762 10,966 16,322 1,109 76,159 76,159 21
22 Signals & interlockers - switching 12,696 2,916 4,339 295 20,246 20,246 22
23 Communications systems 22,938 7,722 (4,111) 20 26,569 26,569 23
24 Power systems 45 376 842 1,263 1,263 24
25 Highway grade crossings - running 1,341 14 207 1,562 1,562 25
26 Highway grade crossings - switching 358 3 55 416 416 26
27 Station & office buildings 506 252 27,997 22 28,777 28,777 27
28 Shop buildings - locomotives 2,012 2,282 9,332 13,626 13,626 28
29 Shop buildings - freight cars 435 492 2,013 2,940 N/A 2,940 2930 Shop buildings - other equipment 1,500 1,700 6,953 10,153 10,153 30
Ra
ilroa
d A
nn
ua
l Re
po
rt R-1
Ro
ad
Initia
ls: BN
SF
Ye
ar 2
01
34
5
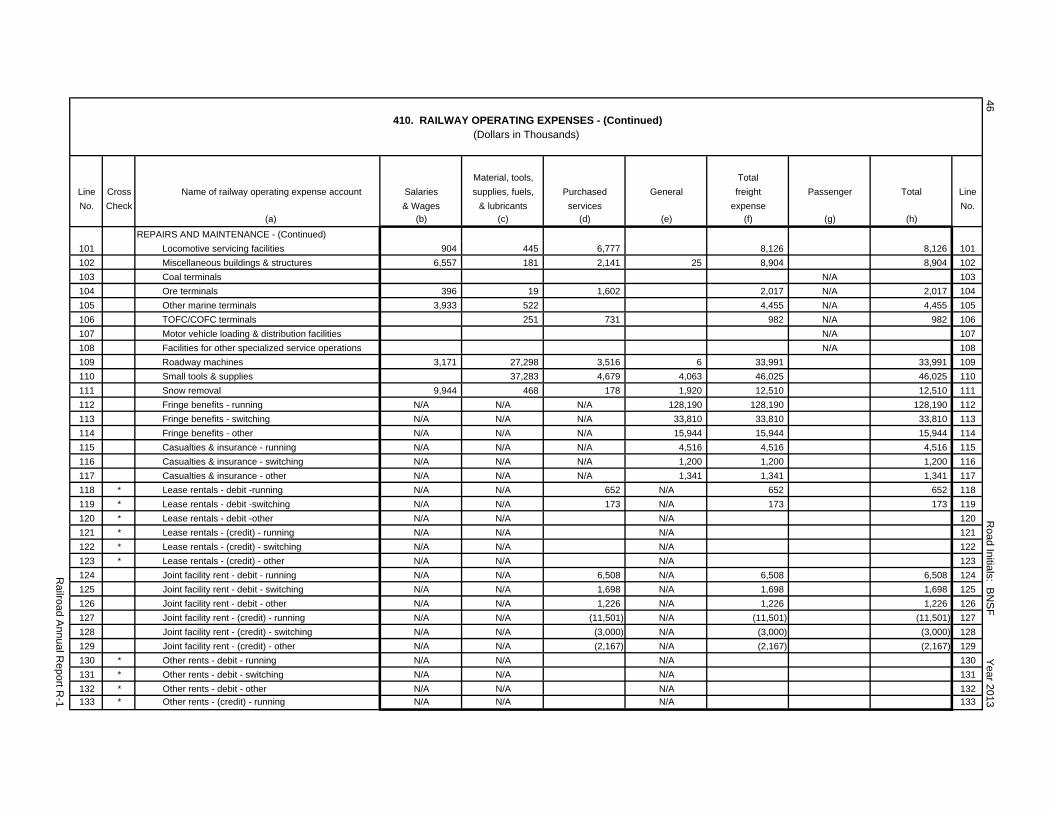
410. RAILWAY OPERATING EXPENSES - (Continued)(Dollars in Thousands)
Material, tools, Total
Line Cross Name of railway operating expense account Salaries supplies, fuels, Purchased General freight Passenger Total Line
No. Check & Wages & lubricants services expense No.
(a) (b) (c) (d) (e) (f) (g) (h)
REPAIRS AND MAINTENANCE - (Continued)
101 Locomotive servicing facilities 904 445 6,777 8,126 8,126 101
102 Miscellaneous buildings & structures 6,557 181 2,141 25 8,904 8,904 102
103 Coal terminals N/A 103
104 Ore terminals 396 19 1,602 2,017 N/A 2,017 104
105 Other marine terminals 3,933 522 4,455 N/A 4,455 105
106 TOFC/COFC terminals 251 731 982 N/A 982 106
107 Motor vehicle loading & distribution facilities N/A 107
108 Facilities for other specialized service operations N/A 108
109 Roadway machines 3,171 27,298 3,516 6 33,991 33,991 109
110 Small tools & supplies 37,283 4,679 4,063 46,025 46,025 110
111 Snow removal 9,944 468 178 1,920 12,510 12,510 111
112 Fringe benefits - running N/A N/A N/A 128,190 128,190 128,190 112
113 Fringe benefits - switching N/A N/A N/A 33,810 33,810 33,810 113
114 Fringe benefits - other N/A N/A N/A 15,944 15,944 15,944 114
115 Casualties & insurance - running N/A N/A N/A 4,516 4,516 4,516 115
116 Casualties & insurance - switching N/A N/A N/A 1,200 1,200 1,200 116
117 Casualties & insurance - other N/A N/A N/A 1,341 1,341 1,341 117
118 * Lease rentals - debit -running N/A N/A 652 N/A 652 652 118
119 * Lease rentals - debit -switching N/A N/A 173 N/A 173 173 119
120 * Lease rentals - debit -other N/A N/A N/A 120
121 * Lease rentals - (credit) - running N/A N/A N/A 121
122 * Lease rentals - (credit) - switching N/A N/A N/A 122
123 * Lease rentals - (credit) - other N/A N/A N/A 123
124 Joint facility rent - debit - running N/A N/A 6,508 N/A 6,508 6,508 124
125 Joint facility rent - debit - switching N/A N/A 1,698 N/A 1,698 1,698 125
126 Joint facility rent - debit - other N/A N/A 1,226 N/A 1,226 1,226 126
127 Joint facility rent - (credit) - running N/A N/A (11,501) N/A (11,501) (11,501) 127
128 Joint facility rent - (credit) - switching N/A N/A (3,000) N/A (3,000) (3,000) 128
129 Joint facility rent - (credit) - other N/A N/A (2,167) N/A (2,167) (2,167) 129
130 * Other rents - debit - running N/A N/A N/A 130
131 * Other rents - debit - switching N/A N/A N/A 131
132 * Other rents - debit - other N/A N/A N/A 132
133 * Other rents - (credit) - running N/A N/A N/A 133
Ra
ilroa
d A
nn
ua
l Re
po
rt R-1
Ro
ad
Initia
ls: BN
SF
Ye
ar 2
01
34
6
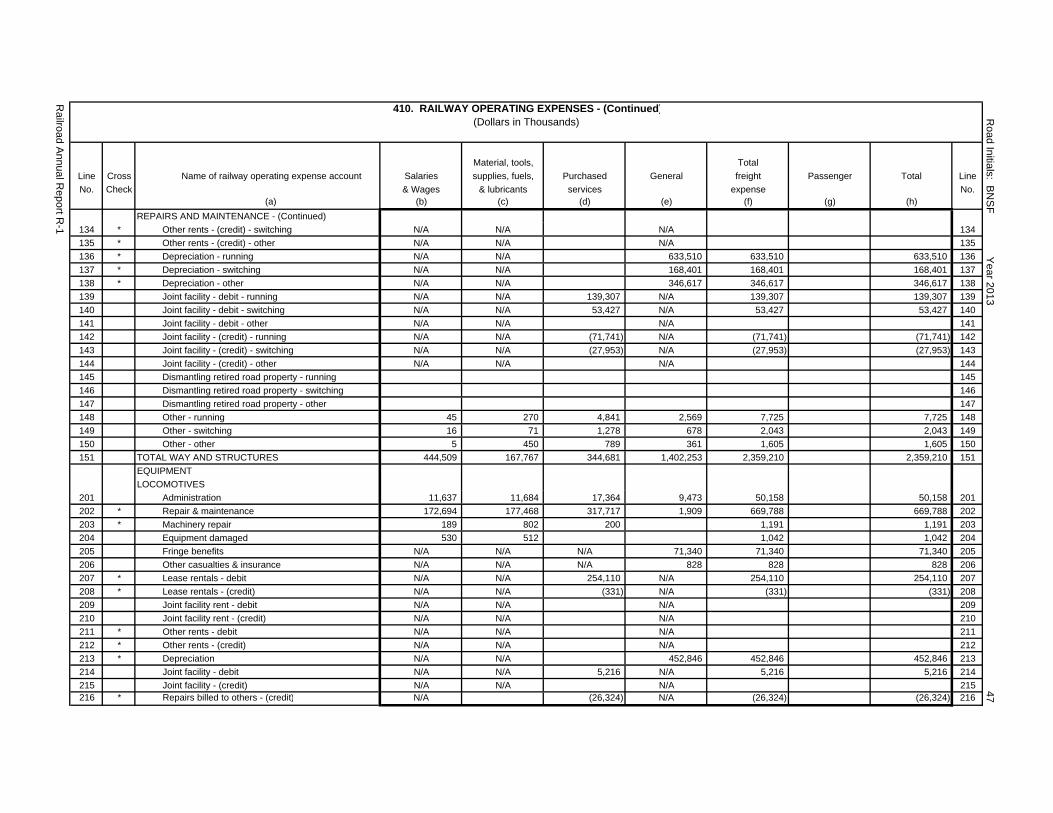
410. RAILWAY OPERATING EXPENSES - (Continued)(Dollars in Thousands)
Material, tools, Total
Line Cross Name of railway operating expense account Salaries supplies, fuels, Purchased General freight Passenger Total Line
No. Check & Wages & lubricants services expense No.(a) (b) (c) (d) (e) (f) (g) (h)
REPAIRS AND MAINTENANCE - (Continued)
134 * Other rents - (credit) - switching N/A N/A N/A 134
135 * Other rents - (credit) - other N/A N/A N/A 135
136 * Depreciation - running N/A N/A 633,510 633,510 633,510 136
137 * Depreciation - switching N/A N/A 168,401 168,401 168,401 137
138 * Depreciation - other N/A N/A 346,617 346,617 346,617 138
139 Joint facility - debit - running N/A N/A 139,307 N/A 139,307 139,307 139
140 Joint facility - debit - switching N/A N/A 53,427 N/A 53,427 53,427 140
141 Joint facility - debit - other N/A N/A N/A 141
142 Joint facility - (credit) - running N/A N/A (71,741) N/A (71,741) (71,741) 142
143 Joint facility - (credit) - switching N/A N/A (27,953) N/A (27,953) (27,953) 143
144 Joint facility - (credit) - other N/A N/A N/A 144
145 Dismantling retired road property - running 145
146 Dismantling retired road property - switching 146
147 Dismantling retired road property - other 147
148 Other - running 45 270 4,841 2,569 7,725 7,725 148
149 Other - switching 16 71 1,278 678 2,043 2,043 149
150 Other - other 5 450 789 361 1,605 1,605 150
151 TOTAL WAY AND STRUCTURES 444,509 167,767 344,681 1,402,253 2,359,210 2,359,210 151
EQUIPMENT
LOCOMOTIVES
201 Administration 11,637 11,684 17,364 9,473 50,158 50,158 201
202 * Repair & maintenance 172,694 177,468 317,717 1,909 669,788 669,788 202
203 * Machinery repair 189 802 200 1,191 1,191 203
204 Equipment damaged 530 512 1,042 1,042 204
205 Fringe benefits N/A N/A N/A 71,340 71,340 71,340 205
206 Other casualties & insurance N/A N/A N/A 828 828 828 206
207 * Lease rentals - debit N/A N/A 254,110 N/A 254,110 254,110 207
208 * Lease rentals - (credit) N/A N/A (331) N/A (331) (331) 208
209 Joint facility rent - debit N/A N/A N/A 209
210 Joint facility rent - (credit) N/A N/A N/A 210
211 * Other rents - debit N/A N/A N/A 211
212 * Other rents - (credit) N/A N/A N/A 212
213 * Depreciation N/A N/A 452,846 452,846 452,846 213
214 Joint facility - debit N/A N/A 5,216 N/A 5,216 5,216 214
215 Joint facility - (credit) N/A N/A N/A 215216 * Repairs billed to others - (credit) N/A (26,324) N/A (26,324) (26,324) 216
Ra
ilroa
d A
nn
ua
l Re
po
rt R-1
Ro
ad
Initia
ls: BN
SF
Ye
ar 2
01
34
7
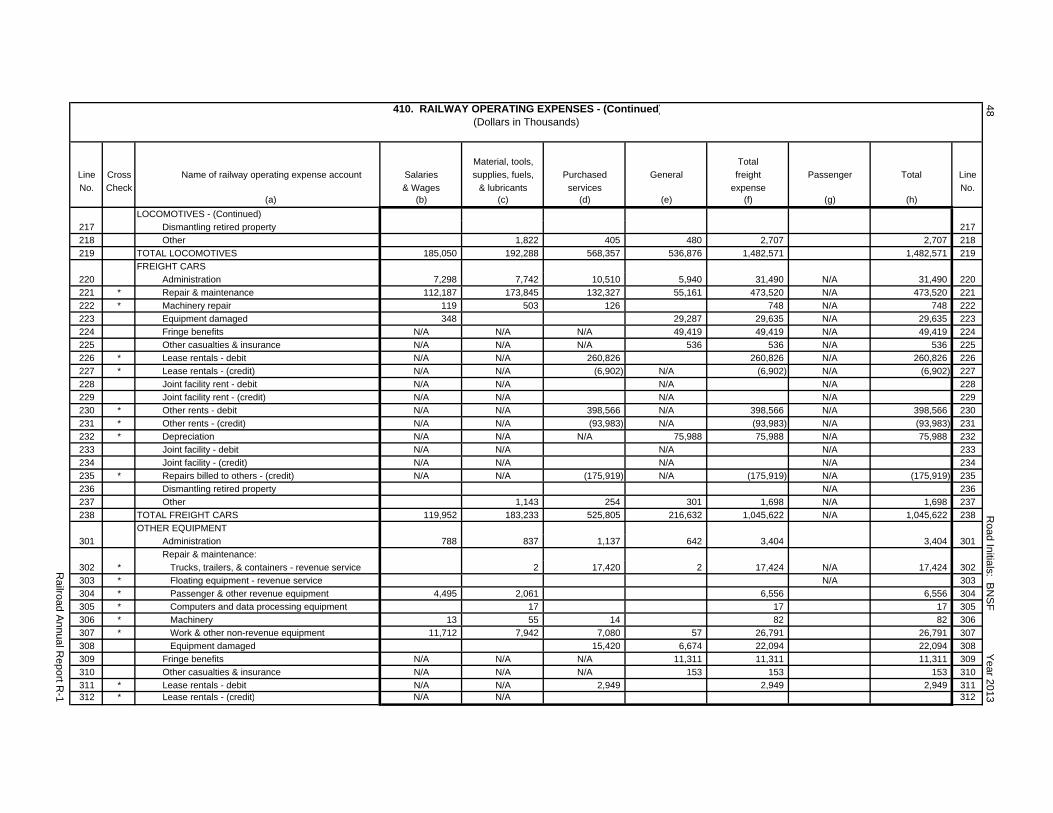
410. RAILWAY OPERATING EXPENSES - (Continued)(Dollars in Thousands)
Material, tools, Total
Line Cross Name of railway operating expense account Salaries supplies, fuels, Purchased General freight Passenger Total Line
No. Check & Wages & lubricants services expense No.(a) (b) (c) (d) (e) (f) (g) (h)
LOCOMOTIVES - (Continued)
217 Dismantling retired property 217
218 Other 1,822 405 480 2,707 2,707 218
219 TOTAL LOCOMOTIVES 185,050 192,288 568,357 536,876 1,482,571 1,482,571 219
FREIGHT CARS
220 Administration 7,298 7,742 10,510 5,940 31,490 N/A 31,490 220
221 * Repair & maintenance 112,187 173,845 132,327 55,161 473,520 N/A 473,520 221
222 * Machinery repair 119 503 126 748 N/A 748 222
223 Equipment damaged 348 29,287 29,635 N/A 29,635 223
224 Fringe benefits N/A N/A N/A 49,419 49,419 N/A 49,419 224
225 Other casualties & insurance N/A N/A N/A 536 536 N/A 536 225
226 * Lease rentals - debit N/A N/A 260,826 260,826 N/A 260,826 226
227 * Lease rentals - (credit) N/A N/A (6,902) N/A (6,902) N/A (6,902) 227
228 Joint facility rent - debit N/A N/A N/A N/A 228
229 Joint facility rent - (credit) N/A N/A N/A N/A 229
230 * Other rents - debit N/A N/A 398,566 N/A 398,566 N/A 398,566 230
231 * Other rents - (credit) N/A N/A (93,983) N/A (93,983) N/A (93,983) 231
232 * Depreciation N/A N/A N/A 75,988 75,988 N/A 75,988 232
233 Joint facility - debit N/A N/A N/A N/A 233
234 Joint facility - (credit) N/A N/A N/A N/A 234
235 * Repairs billed to others - (credit) N/A N/A (175,919) N/A (175,919) N/A (175,919) 235
236 Dismantling retired property N/A 236
237 Other 1,143 254 301 1,698 N/A 1,698 237
238 TOTAL FREIGHT CARS 119,952 183,233 525,805 216,632 1,045,622 N/A 1,045,622 238
OTHER EQUIPMENT
301 Administration 788 837 1,137 642 3,404 3,404 301
Repair & maintenance:
302 * Trucks, trailers, & containers - revenue service 2 17,420 2 17,424 N/A 17,424 302
303 * Floating equipment - revenue service N/A 303
304 * Passenger & other revenue equipment 4,495 2,061 6,556 6,556 304
305 * Computers and data processing equipment 17 17 17 305
306 * Machinery 13 55 14 82 82 306
307 * Work & other non-revenue equipment 11,712 7,942 7,080 57 26,791 26,791 307
308 Equipment damaged 15,420 6,674 22,094 22,094 308
309 Fringe benefits N/A N/A N/A 11,311 11,311 11,311 309
310 Other casualties & insurance N/A N/A N/A 153 153 153 310
311 * Lease rentals - debit N/A N/A 2,949 2,949 2,949 311312 * Lease rentals - (credit) N/A N/A 312
Ra
ilroa
d A
nn
ua
l Re
po
rt R-1
Ro
ad
Initia
ls: BN
SF
Ye
ar 2
01
34
8
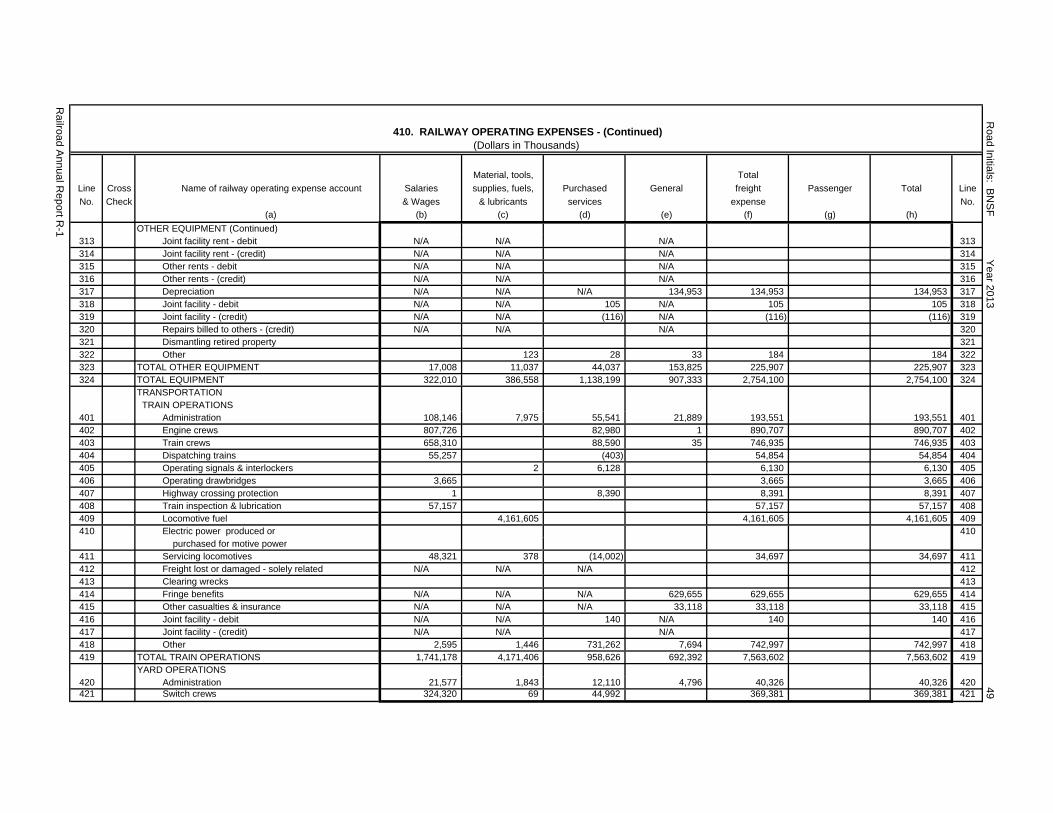
410. RAILWAY OPERATING EXPENSES - (Continued)(Dollars in Thousands)
Material, tools, Total
Line Cross Name of railway operating expense account Salaries supplies, fuels, Purchased General freight Passenger Total Line
No. Check & Wages & lubricants services expense No.
(a) (b) (c) (d) (e) (f) (g) (h)
OTHER EQUIPMENT (Continued)313 Joint facility rent - debit N/A N/A N/A 313314 Joint facility rent - (credit) N/A N/A N/A 314315 Other rents - debit N/A N/A N/A 315316 Other rents - (credit) N/A N/A N/A 316317 Depreciation N/A N/A N/A 134,953 134,953 134,953 317318 Joint facility - debit N/A N/A 105 N/A 105 105 318319 Joint facility - (credit) N/A N/A (116) N/A (116) (116) 319320 Repairs billed to others - (credit) N/A N/A N/A 320321 Dismantling retired property 321322 Other 123 28 33 184 184 322323 TOTAL OTHER EQUIPMENT 17,008 11,037 44,037 153,825 225,907 225,907 323324 TOTAL EQUIPMENT 322,010 386,558 1,138,199 907,333 2,754,100 2,754,100 324
TRANSPORTATION TRAIN OPERATIONS
401 Administration 108,146 7,975 55,541 21,889 193,551 193,551 401402 Engine crews 807,726 82,980 1 890,707 890,707 402403 Train crews 658,310 88,590 35 746,935 746,935 403404 Dispatching trains 55,257 (403) 54,854 54,854 404405 Operating signals & interlockers 2 6,128 6,130 6,130 405406 Operating drawbridges 3,665 3,665 3,665 406407 Highway crossing protection 1 8,390 8,391 8,391 407408 Train inspection & lubrication 57,157 57,157 57,157 408409 Locomotive fuel 4,161,605 4,161,605 4,161,605 409410 Electric power produced or 410
purchased for motive power411 Servicing locomotives 48,321 378 (14,002) 34,697 34,697 411412 Freight lost or damaged - solely related N/A N/A N/A 412413 Clearing wrecks 413414 Fringe benefits N/A N/A N/A 629,655 629,655 629,655 414415 Other casualties & insurance N/A N/A N/A 33,118 33,118 33,118 415416 Joint facility - debit N/A N/A 140 N/A 140 140 416417 Joint facility - (credit) N/A N/A N/A 417418 Other 2,595 1,446 731,262 7,694 742,997 742,997 418419 TOTAL TRAIN OPERATIONS 1,741,178 4,171,406 958,626 692,392 7,563,602 7,563,602 419
YARD OPERATIONS420 Administration 21,577 1,843 12,110 4,796 40,326 40,326 420421 Switch crews 324,320 69 44,992 369,381 369,381 421
Ra
ilroa
d A
nn
ua
l Re
po
rt R-1
Ro
ad
Initia
ls: BN
SF
Ye
ar 2
01
34
9
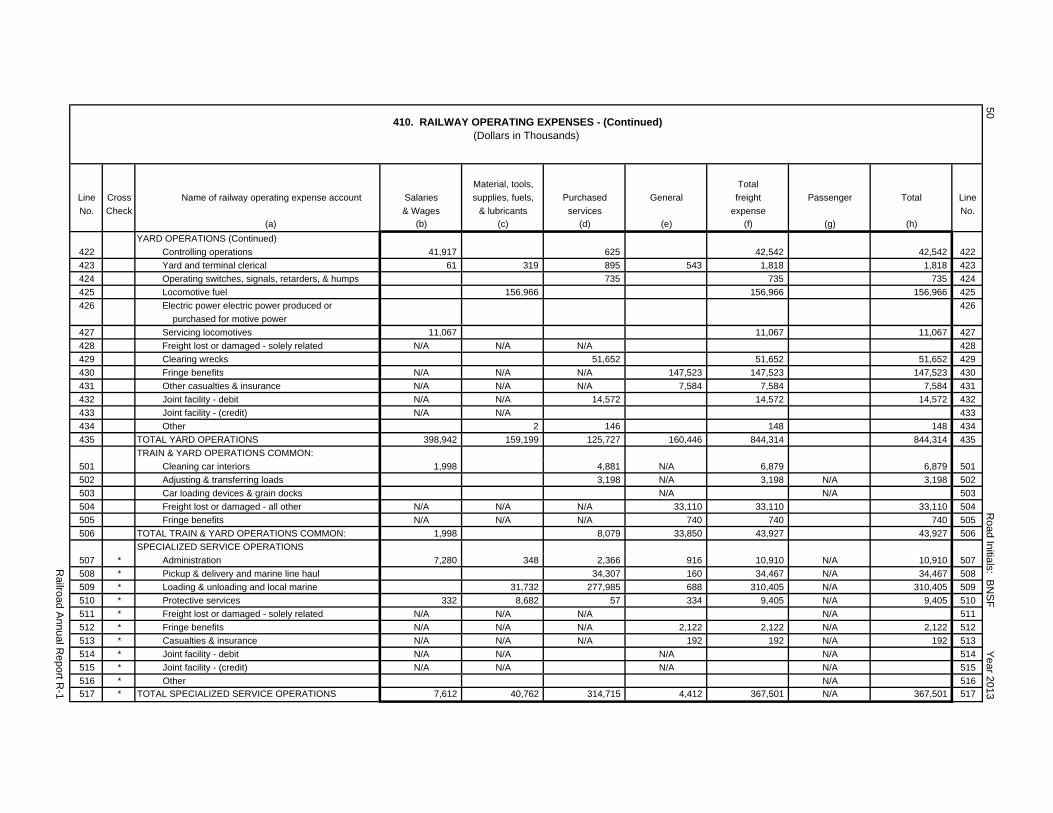
410. RAILWAY OPERATING EXPENSES - (Continued)(Dollars in Thousands)
Material, tools, Total
Line Cross Name of railway operating expense account Salaries supplies, fuels, Purchased General freight Passenger Total Line
No. Check & Wages & lubricants services expense No.
(a) (b) (c) (d) (e) (f) (g) (h)
YARD OPERATIONS (Continued)
422 Controlling operations 41,917 625 42,542 42,542 422
423 Yard and terminal clerical 61 319 895 543 1,818 1,818 423
424 Operating switches, signals, retarders, & humps 735 735 735 424
425 Locomotive fuel 156,966 156,966 156,966 425
426 Electric power electric power produced or 426
purchased for motive power
427 Servicing locomotives 11,067 11,067 11,067 427
428 Freight lost or damaged - solely related N/A N/A N/A 428
429 Clearing wrecks 51,652 51,652 51,652 429
430 Fringe benefits N/A N/A N/A 147,523 147,523 147,523 430
431 Other casualties & insurance N/A N/A N/A 7,584 7,584 7,584 431
432 Joint facility - debit N/A N/A 14,572 14,572 14,572 432
433 Joint facility - (credit) N/A N/A 433
434 Other 2 146 148 148 434
435 TOTAL YARD OPERATIONS 398,942 159,199 125,727 160,446 844,314 844,314 435
TRAIN & YARD OPERATIONS COMMON:
501 Cleaning car interiors 1,998 4,881 N/A 6,879 6,879 501
502 Adjusting & transferring loads 3,198 N/A 3,198 N/A 3,198 502
503 Car loading devices & grain docks N/A N/A 503
504 Freight lost or damaged - all other N/A N/A N/A 33,110 33,110 33,110 504
505 Fringe benefits N/A N/A N/A 740 740 740 505
506 TOTAL TRAIN & YARD OPERATIONS COMMON: 1,998 8,079 33,850 43,927 43,927 506
SPECIALIZED SERVICE OPERATIONS
507 * Administration 7,280 348 2,366 916 10,910 N/A 10,910 507
508 * Pickup & delivery and marine line haul 34,307 160 34,467 N/A 34,467 508
509 * Loading & unloading and local marine 31,732 277,985 688 310,405 N/A 310,405 509
510 * Protective services 332 8,682 57 334 9,405 N/A 9,405 510
511 * Freight lost or damaged - solely related N/A N/A N/A N/A 511
512 * Fringe benefits N/A N/A N/A 2,122 2,122 N/A 2,122 512
513 * Casualties & insurance N/A N/A N/A 192 192 N/A 192 513
514 * Joint facility - debit N/A N/A N/A N/A 514
515 * Joint facility - (credit) N/A N/A N/A N/A 515
516 * Other N/A 516
517 * TOTAL SPECIALIZED SERVICE OPERATIONS 7,612 40,762 314,715 4,412 367,501 N/A 367,501 517
50
Ro
ad
Initia
ls: BN
SF
Ye
ar 2
01
3
Ra
ilroa
d A
nn
ua
l Re
po
rt R-1
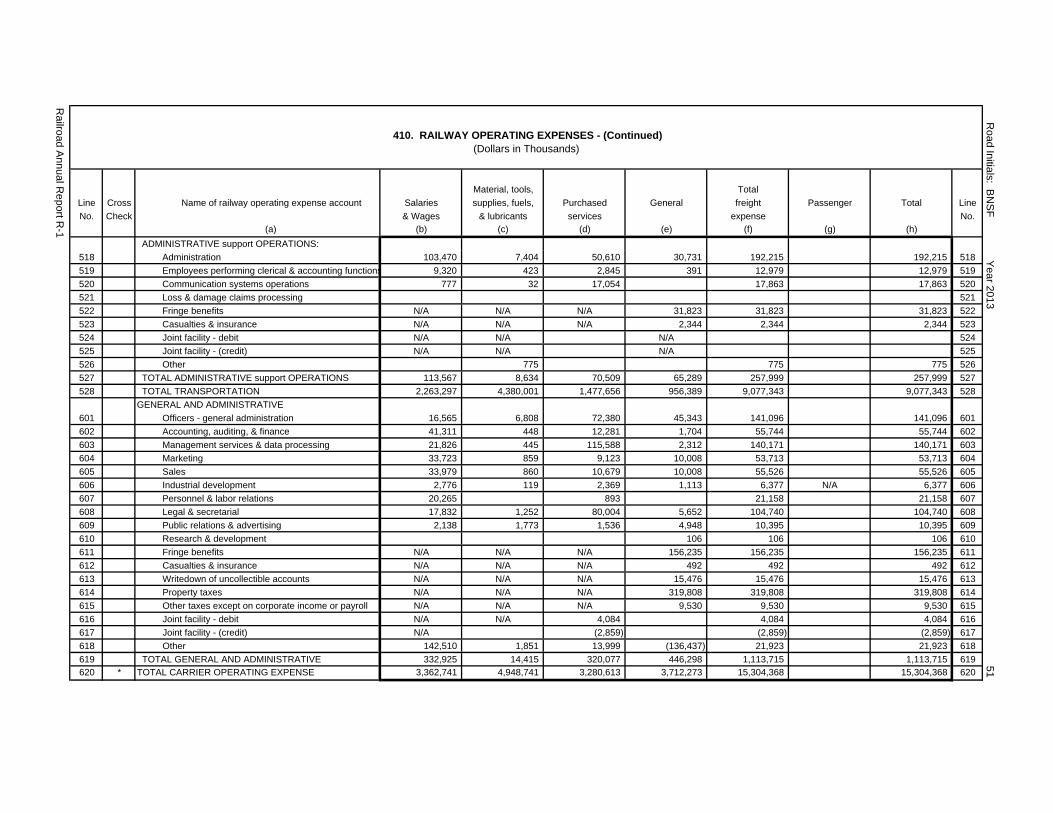
410. RAILWAY OPERATING EXPENSES - (Continued)(Dollars in Thousands)
Material, tools, Total
Line Cross Name of railway operating expense account Salaries supplies, fuels, Purchased General freight Passenger Total Line
No. Check & Wages & lubricants services expense No.
(a) (b) (c) (d) (e) (f) (g) (h)
ADMINISTRATIVE support OPERATIONS:
518 Administration 103,470 7,404 50,610 30,731 192,215 192,215 518
519 Employees performing clerical & accounting functions 9,320 423 2,845 391 12,979 12,979 519
520 Communication systems operations 777 32 17,054 17,863 17,863 520
521 Loss & damage claims processing 521
522 Fringe benefits N/A N/A N/A 31,823 31,823 31,823 522
523 Casualties & insurance N/A N/A N/A 2,344 2,344 2,344 523
524 Joint facility - debit N/A N/A N/A 524
525 Joint facility - (credit) N/A N/A N/A 525
526 Other 775 775 775 526
527 TOTAL ADMINISTRATIVE support OPERATIONS 113,567 8,634 70,509 65,289 257,999 257,999 527
528 TOTAL TRANSPORTATION 2,263,297 4,380,001 1,477,656 956,389 9,077,343 9,077,343 528
GENERAL AND ADMINISTRATIVE
601 Officers - general administration 16,565 6,808 72,380 45,343 141,096 141,096 601
602 Accounting, auditing, & finance 41,311 448 12,281 1,704 55,744 55,744 602
603 Management services & data processing 21,826 445 115,588 2,312 140,171 140,171 603
604 Marketing 33,723 859 9,123 10,008 53,713 53,713 604
605 Sales 33,979 860 10,679 10,008 55,526 55,526 605
606 Industrial development 2,776 119 2,369 1,113 6,377 N/A 6,377 606
607 Personnel & labor relations 20,265 893 21,158 21,158 607
608 Legal & secretarial 17,832 1,252 80,004 5,652 104,740 104,740 608
609 Public relations & advertising 2,138 1,773 1,536 4,948 10,395 10,395 609
610 Research & development 106 106 106 610
611 Fringe benefits N/A N/A N/A 156,235 156,235 156,235 611
612 Casualties & insurance N/A N/A N/A 492 492 492 612
613 Writedown of uncollectible accounts N/A N/A N/A 15,476 15,476 15,476 613
614 Property taxes N/A N/A N/A 319,808 319,808 319,808 614
615 Other taxes except on corporate income or payroll N/A N/A N/A 9,530 9,530 9,530 615
616 Joint facility - debit N/A N/A 4,084 4,084 4,084 616
617 Joint facility - (credit) N/A (2,859) (2,859) (2,859) 617
618 Other 142,510 1,851 13,999 (136,437) 21,923 21,923 618
619 TOTAL GENERAL AND ADMINISTRATIVE 332,925 14,415 320,077 446,298 1,113,715 1,113,715 619
620 * TOTAL CARRIER OPERATING EXPENSE 3,362,741 4,948,741 3,280,613 3,712,273 15,304,368 15,304,368 620
Ro
ad
Initia
ls: BN
SF
Ye
ar 2
01
3
Ra
ilroa
d A
nn
ua
l Re
po
rt R-1
51
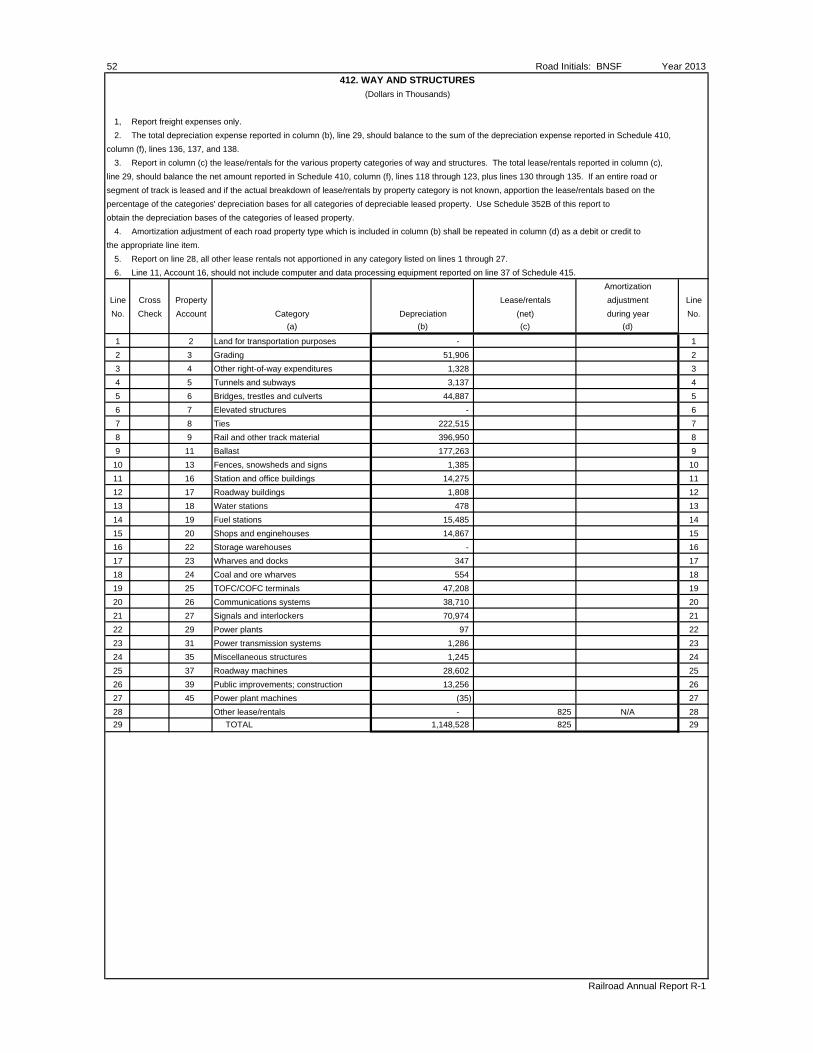
52 Road Initials: BNSF Year 2013
412. WAY AND STRUCTURES
(Dollars in Thousands)
1, Report freight expenses only.
2. The total depreciation expense reported in column (b), line 29, should balance to the sum of the depreciation expense reported in Schedule 410,
column (f), lines 136, 137, and 138.
3. Report in column (c) the lease/rentals for the various property categories of way and structures. The total lease/rentals reported in column (c),
line 29, should balance the net amount reported in Schedule 410, column (f), lines 118 through 123, plus lines 130 through 135. If an entire road or
segment of track is leased and if the actual breakdown of lease/rentals by property category is not known, apportion the lease/rentals based on the
percentage of the categories' depreciation bases for all categories of depreciable leased property. Use Schedule 352B of this report to
obtain the depreciation bases of the categories of leased property.
4. Amortization adjustment of each road property type which is included in column (b) shall be repeated in column (d) as a debit or credit to
the appropriate line item.
5. Report on line 28, all other lease rentals not apportioned in any category listed on lines 1 through 27.
6. Line 11, Account 16, should not include computer and data processing equipment reported on line 37 of Schedule 415.
Amortization
Line Cross Property Lease/rentals adjustment Line
No. Check Account Category Depreciation (net) during year No.
(a) (b) (c) (d)
1 2 Land for transportation purposes - 1
2 3 Grading 51,906 2
3 4 Other right-of-way expenditures 1,328 3
4 5 Tunnels and subways 3,137 4
5 6 Bridges, trestles and culverts 44,887 5
6 7 Elevated structures - 6
7 8 Ties 222,515 7
8 9 Rail and other track material 396,950 8
9 11 Ballast 177,263 9
10 13 Fences, snowsheds and signs 1,385 10
11 16 Station and office buildings 14,275 11
12 17 Roadway buildings 1,808 12
13 18 Water stations 478 13
14 19 Fuel stations 15,485 14
15 20 Shops and enginehouses 14,867 15
16 22 Storage warehouses - 16
17 23 Wharves and docks 347 17
18 24 Coal and ore wharves 554 18
19 25 TOFC/COFC terminals 47,208 19
20 26 Communications systems 38,710 20
21 27 Signals and interlockers 70,974 21
22 29 Power plants 97 22
23 31 Power transmission systems 1,286 23
24 35 Miscellaneous structures 1,245 24
25 37 Roadway machines 28,602 25
26 39 Public improvements; construction 13,256 26
27 45 Power plant machines (35) 27
28 Other lease/rentals - 825 N/A 28
29 TOTAL 1,148,528 825 29
Railroad Annual Report R-1
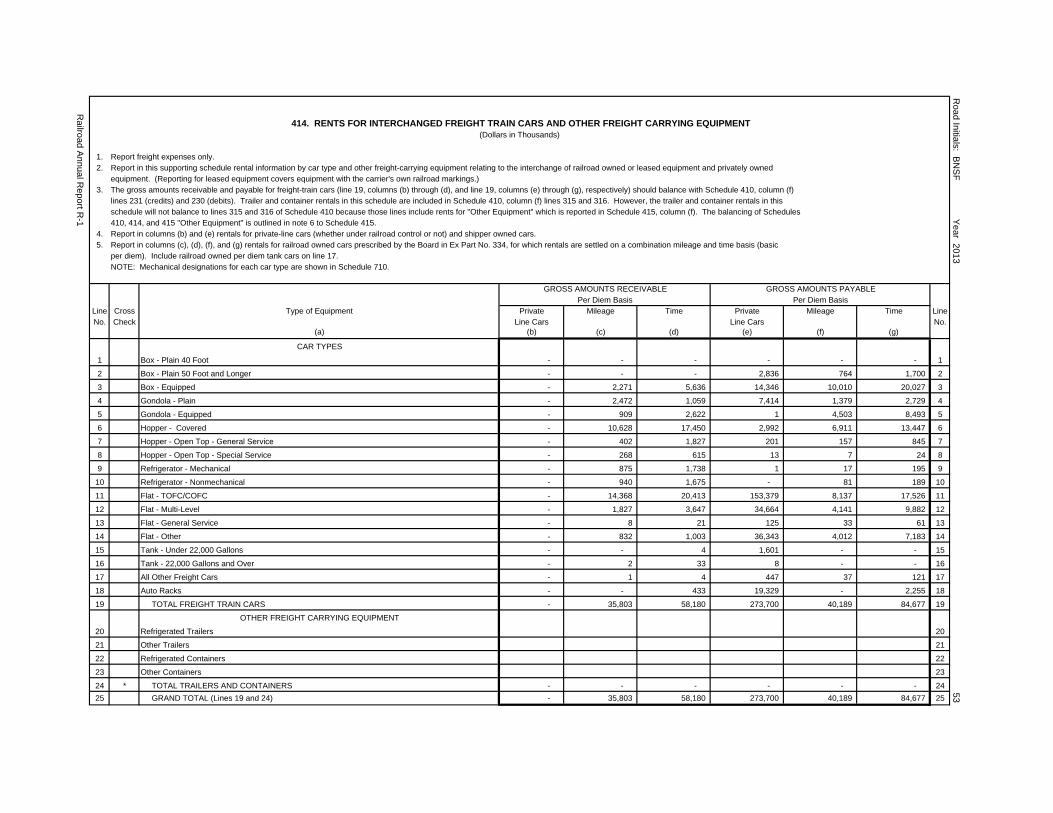
414. RENTS FOR INTERCHANGED FREIGHT TRAIN CARS AND OTHER FREIGHT CARRYING EQUIPMENT(Dollars in Thousands)
1. Report freight expenses only.2. Report in this supporting schedule rental information by car type and other freight-carrying equipment relating to the interchange of railroad owned or leased equipment and privately owned
equipment. (Reporting for leased equipment covers equipment with the carrier's own railroad markings.)3. The gross amounts receivable and payable for freight-train cars (line 19, columns (b) through (d), and line 19, columns (e) through (g), respectively) should balance with Schedule 410, column (f)
lines 231 (credits) and 230 (debits). Trailer and container rentals in this schedule are included in Schedule 410, column (f) lines 315 and 316. However, the trailer and container rentals in thisschedule will not balance to lines 315 and 316 of Schedule 410 because those lines include rents for "Other Equipment" which is reported in Schedule 415, column (f). The balancing of Schedules410, 414, and 415 "Other Equipment" is outlined in note 6 to Schedule 415.
4. Report in columns (b) and (e) rentals for private-line cars (whether under railroad control or not) and shipper owned cars.5. Report in columns (c), (d), (f), and (g) rentals for railroad owned cars prescribed by the Board in Ex Part No. 334, for which rentals are settled on a combination mileage and time basis (basic
per diem). Include railroad owned per diem tank cars on line 17.NOTE: Mechanical designations for each car type are shown in Schedule 710.
GROSS AMOUNTS RECEIVABLE GROSS AMOUNTS PAYABLEPer Diem Basis Per Diem Basis
Line Cross Type of Equipment Private Mileage Time Private Mileage Time LineNo. Check Line Cars Line Cars No.
(a) (b) (c) (d) (e) (f) (g)
CAR TYPES
1 Box - Plain 40 Foot - - - - - - 1
2 Box - Plain 50 Foot and Longer - - - 2,836 764 1,700 2
3 Box - Equipped - 2,271 5,636 14,346 10,010 20,027 3
4 Gondola - Plain - 2,472 1,059 7,414 1,379 2,729 4
5 Gondola - Equipped - 909 2,622 1 4,503 8,493 5
6 Hopper - Covered - 10,628 17,450 2,992 6,911 13,447 6
7 Hopper - Open Top - General Service - 402 1,827 201 157 845 7
8 Hopper - Open Top - Special Service - 268 615 13 7 24 8
9 Refrigerator - Mechanical - 875 1,738 1 17 195 9
10 Refrigerator - Nonmechanical - 940 1,675 - 81 189 10
11 Flat - TOFC/COFC - 14,368 20,413 153,379 8,137 17,526 11
12 Flat - Multi-Level - 1,827 3,647 34,664 4,141 9,882 12
13 Flat - General Service - 8 21 125 33 61 13
14 Flat - Other - 832 1,003 36,343 4,012 7,183 14
15 Tank - Under 22,000 Gallons - - 4 1,601 - - 15
16 Tank - 22,000 Gallons and Over - 2 33 8 - - 16
17 All Other Freight Cars - 1 4 447 37 121 17
18 Auto Racks - - 433 19,329 - 2,255 18
19 TOTAL FREIGHT TRAIN CARS - 35,803 58,180 273,700 40,189 84,677 19
OTHER FREIGHT CARRYING EQUIPMENT
20 Refrigerated Trailers 20
21 Other Trailers 21
22 Refrigerated Containers 22
23 Other Containers 23
24 * TOTAL TRAILERS AND CONTAINERS - - - - - - 24
25 GRAND TOTAL (Lines 19 and 24) - 35,803 58,180 273,700 40,189 84,677 25
Ro
ad
Initia
ls: BN
SF
Ye
ar 2
01
3
Ra
ilroa
d A
nn
ua
l Re
po
rt R-1
53
54 Road Initials: BNSF Year 2013NOTES AND REMARKS
Railroad Annual Report R-1
THIS PAGE INTENTIONALLY LEFT BLANK
Road Initials: BNSF Year 2013 55GENERAL INSTRUCTIONS CONCERNING RETURNS TO BE MADE TO SCHEDULE 415
1. Report freight expenses only.
2. Report by type of equipment all natural expenses relating to equipment functions (salaries and wages, materials, tools, supplies, fuels and
lubricants, purchased services, and general).
3. Report in column (b) net repair expense, excluding the cost to repair damaged equipment.
Schedule 415, column (b) will balance to Schedule 410, column (f) as follows:
(a) Locomotives, line 5 plus line 38, compared to the sum of Schedule 410, lines 202, 203, and 216 (excluding wreck repairs). Do not
report in Schedule 415, Equipment Damaged from Schedule 410, line 204.
(b) Freight cars, line 24 plus line 39, compared to the sum of Schedule 410, lines 221, 222, and 235 (excluding wreck repairs). Do not
report in Schedule 415, Equipment Damaged from Schedule 410, line 223.
(c) Sum of highway equipment (line 32), floating equipment (line 35), passenger and other revenue equipment (line 36), computer and data
processing equipment (line 37), machinery-other equipment (line 40), and work and other non-revenue equipment (line 41), compared
to Schedule 410, the sum of lines 302 through 307, plus line 320 (excluding wreck repairs). Do not report in Schedule 415, equipment
damaged from Schedule 410, line 308.
Note: Lines 216, 235, and 320 of Schedule 410 are credit amounts.
The allocation of freight car repair expenses reportable on Schedule 415 by car types shall be in accordance with Instruction 2-21, Freight
train repair costing, 49 CFR 1201.
4. Depreciation expense for each class of equipment by car type shall be reported in columns (c) and (d). For improvements on leased
property, Accounts 732 and 733, use a supplementary Schedule 415, which will relate to Schedules 340 and 342.
Depreciation charges reported in columns (c) and (d) will balance to Schedule 410, column (f) as follows:
(a) Locomotives, lines 5 and 38, compared to Schedule 410, line 213.
(b) Freight cars, lines 24 and 39, compared to Schedule 410, line 232.
(c) Sum of highway equipment (line 32), floating equipment (line 35), passenger and other revenue equipment (line 36), computer and data
processing equipment (line 37), machinery-other equipment (line 40), and work and other non-revenue equipment (line 41), compared
to Schedule 410, line 317.
5. Amortization adjustment of each equipment type which is included in column (c) shall be reported in column (e) as a debit or credit to the
appropriate line item.
6. Lease/rentals reported in column (f) should balance to column (f) of Schedule 410 as follows:
(a) Locomotives, lines 5 and 38, compared to Schedule 410, lines 207, 208, 211, and 212.
(b) Freight cars, lines 24 and 39, compared to Schedule 410, lines 226 and 227 (note that Schedule 410, lines 230 and 231, are reported in
Schedule 415, and are not included in Schedule 415).
(c) Sum of lease/rentals for all other equipment, lines 32, 35, 36, 37, 40, and 41, will balance to Schedule 410, lines 311, 312, 315, and 316,
except for the interchange rental on trailers and containers which is reported in Schedule 414. Therefore, both Schedules 414 and 415
should be used when balancing lease/rentals other equipment to Schedule 410. Do not report in Schedule 415, the trailer and
container rentals reported in Schedule 414.
7. Investment base by types of equipment shall be reported in columns (g) and (h) and should not include the cost of equipment used but not
owned when rents therefore are included in the rent for equipment and Account Nos. 31-21-00, 31-22-00, 31-23-00, 35-21-00, 35-22-00,
and 35-23-00. It should include the cost of equipment owned and leased to others when the rents are included in the rent for Equipment
Account Nos. 32-21-00, 32-22-00, 32-23-00, 36-21-00, 36-22-00, and 36-23-00.
Property used but not owned should also be included when the rent is included in Account Nos. 31-12-00, 31-13-00, 31-21-00, 31-22-00,
and 31-23-00, inclusive.
The grand total of each equipment account in column (h) of Schedule 330 should equal the totals of line items constituting the
equipment account totals of columns (g) and (h) of Schedule 415.
8. Accumulated depreciation for each class of equipment shall be reported in columns (i) and (j). The grand total of each equipment reserve
account in column (g), Schedule 335, shall equal the combined aggregate total accumulated depreciation for line items constituting the
corresponding equipment accounts reported in columns (i) and (j), on Schedule 415.
Railroad Annual Report R-1
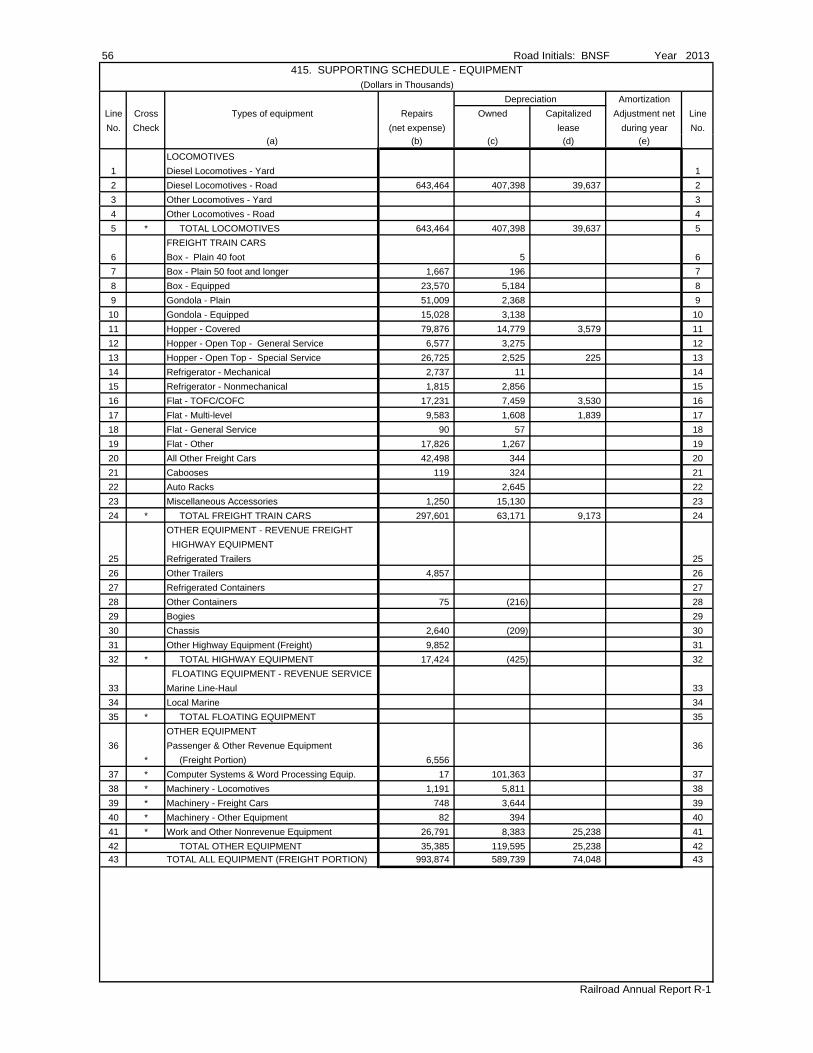
56 Road Initials: BNSF Year 2013415. SUPPORTING SCHEDULE - EQUIPMENT
(Dollars in Thousands)
Depreciation Amortization
Line Cross Types of equipment Repairs Owned Capitalized Adjustment net Line
No. Check (net expense) lease during year No.
(a) (b) (c) (d) (e)
LOCOMOTIVES
1 Diesel Locomotives - Yard 1
2 Diesel Locomotives - Road 643,464 407,398 39,637 2
3 Other Locomotives - Yard 3
4 Other Locomotives - Road 4
5 * TOTAL LOCOMOTIVES 643,464 407,398 39,637 5
FREIGHT TRAIN CARS
6 Box - Plain 40 foot 5 6
7 Box - Plain 50 foot and longer 1,667 196 7
8 Box - Equipped 23,570 5,184 8
9 Gondola - Plain 51,009 2,368 9
10 Gondola - Equipped 15,028 3,138 10
11 Hopper - Covered 79,876 14,779 3,579 11
12 Hopper - Open Top - General Service 6,577 3,275 12
13 Hopper - Open Top - Special Service 26,725 2,525 225 13
14 Refrigerator - Mechanical 2,737 11 14
15 Refrigerator - Nonmechanical 1,815 2,856 15
16 Flat - TOFC/COFC 17,231 7,459 3,530 16
17 Flat - Multi-level 9,583 1,608 1,839 17
18 Flat - General Service 90 57 18
19 Flat - Other 17,826 1,267 19
20 All Other Freight Cars 42,498 344 20
21 Cabooses 119 324 21
22 Auto Racks 2,645 22
23 Miscellaneous Accessories 1,250 15,130 23
24 * TOTAL FREIGHT TRAIN CARS 297,601 63,171 9,173 24
OTHER EQUIPMENT - REVENUE FREIGHT
HIGHWAY EQUIPMENT
25 Refrigerated Trailers 25
26 Other Trailers 4,857 26
27 Refrigerated Containers 27
28 Other Containers 75 (216) 28
29 Bogies 29
30 Chassis 2,640 (209) 30
31 Other Highway Equipment (Freight) 9,852 31
32 * TOTAL HIGHWAY EQUIPMENT 17,424 (425) 32
FLOATING EQUIPMENT - REVENUE SERVICE
33 Marine Line-Haul 33
34 Local Marine 34
35 * TOTAL FLOATING EQUIPMENT 35
OTHER EQUIPMENT
36 Passenger & Other Revenue Equipment 36
* (Freight Portion) 6,556
37 * Computer Systems & Word Processing Equip. 17 101,363 37
38 * Machinery - Locomotives 1,191 5,811 38
39 * Machinery - Freight Cars 748 3,644 39
40 * Machinery - Other Equipment 82 394 40
41 * Work and Other Nonrevenue Equipment 26,791 8,383 25,238 41
42 TOTAL OTHER EQUIPMENT 35,385 119,595 25,238 42
43 TOTAL ALL EQUIPMENT (FREIGHT PORTION) 993,874 589,739 74,048 43
Railroad Annual Report R-1
Road Initials: BNSF Year 2013 57415. SUPPORTING SCHEDULE - EQUIPMENT - (Continued)
Investment base as of 12/31 Accumulated depreciation as of 12/31
Line Cross Lease & rentals Owned Capitalized Owned Capitalized Line
No. Check (net) lease lease No.
(f) (g) (h) (i) (j)
1 1
2 253,779 6,549,693 613,058 2,318,475 234,471 2
3 3
4 4
5 * 253,779 6,549,693 613,058 2,318,475 234,471 5
6 40 (57) 6
7 39 30 7
8 9,793 130,763 15,153 8
9 92,159 28,098 9
10 34,730 92,355 42,623 10
11 82,218 511,174 138,941 111,630 18,745 11
12 99,981 46,117 12
13 29,113 92,764 9,473 17,236 1,372 13
14 174 (279) 14
15 10,098 72,759 19,847 15
16 64,322 182,069 97,890 17,292 17,373 16
17 51,381 69,471 8,406 8,230 17
18 1,942 870 18
19 7,555 37,737 17,163 19
20 3,509 13,486 6,169 20
21 10,418 8,036 21
22 12,586 111,057 14,305 22
23 182,140 58,375 23
24 * 253,924 1,682,438 315,775 411,014 45,720 24
25 25
26 26
27 27
28 490 6,410 3,284 28
29 29
30 2,459 6,193 3,172 30
31 31
32 * 2,949 12,603 6,456 32
33 33
34 34
35 * 35
36 36
*
37 * 941,406 580,561 37
38 * 150,596 66,058 38
39 * 94,441 41,426 39
40 * 10,210 4,478 40
41 * 612,891 120,042 118,218 101,078 41
42 1,809,544 120,042 810,741 101,078 42
43 510,652 10,054,278 1,048,875 3,546,686 381,269 43
(1) Data reported on lines 38, 39, and 40 in columns (g) and (h) are investment recorded in property account 44, allocated to locomotives,
freight cars, and other equipment.
(2) Depreciation reported on lines 38, 39, and 40 in column (c) is calculated by multiplying the investment in each element by the effective
composite rate for property account 44, and then adding or subtracting the adjustment reported in column (e). This calculation
should equal the amount shown in column (c), Schedule 335.
Railroad Annual Report R-1
416. SUPPORTING SCHEDULE - ROAD
58
(Dollars in Thousands)
Owned and Used Improvements to Leased Property Capitalized Leases Total
Accumulated
Density Depr. Depr. Current Depreciation
Line Category Account Investment Accumulated Rate Investment Accumulated Rate Investment Year Accumulated Investment & Line
No. (Class) No. Base Depreciation % Base Depreciation % Base Amortization Amortization Base Amortization No.
(a) (b) (c) (d) (e) (f) (g) (h) (i) (j) (k) (l) (m)
1 I 3 3,560,656 306,662 1.05% NO CAPITAL LEASES IN ACCOUNTS 3, 8, 9, 11 3,560,656 306,662 1
2 8 3,819,344 865,387 3.95% 3,819,344 865,387 2
3 9 9,422,837 2,304,510 3.10% 9,422,837 2,304,510 3
4 11 3,187,120 441,415 4.17% 3,187,120 441,415 4
5 SUB TOTAL 19,989,957 3,917,974 19,989,957 3,917,974 5
6 II 3 849,959 73,202 1.05% 849,959 73,202 6
7 8 1,255,503 225,239 3.41% 1,255,503 225,239 7
8 9 1,860,106 225,667 2.75% 1,860,106 225,667 8
9 11 813,053 124,563 3.45% 813,053 124,563 9
10 SUB TOTAL 4,778,621 648,671 4,778,621 648,671 10
11 III 3 - - 11
12 8 - - 12
13 9 - - 13
14 11 - - 14
15 SUB TOTAL - - - - 15
16 IV 3 418,701 36,060 1.05% 418,701 36,060 16
17 8 521,612 157,238 2.45% 521,612 157,238 17
18 9 929,811 200,636 1.92% 929,811 200,636 18
19 11 481,782 82,902 2.22% 481,782 82,902 19
20 SUB TOTAL 2,351,906 476,836 2,351,906 476,836 20
21 21
22 22
23 23
24 24
25 25
26 GRAND TOTAL 27,120,484 5,043,481 N/A - - - 27,120,484 5,043,481 26
Notes:
(1) The base grand total for owned and used, improvements to leased property, and capitalized leases should equal the sum of Accounts 3, 8, 9, and 11 shown at year end on
Schedule 330.
(2) Columns (c) and (d) include improvements to leased property. Improvements to leased property are not separately included based on the 5% rule.
Road Initials: B
NS
F Y
ear 2013
Railroad A
nnual Report R
-1
TOTAL IMPROVEMENTS TO
PROPERTY LEASED FROM
OTHERS IS LESS THAN 5%
OF TOTAL PROPERTY OWNED.
Road Initials: BNSF Year 2013 59NOTES AND REMARKS
Railroad Annual Report R-1
THIS PAGE INTENTIONALLY LEFT BLANK
417. SPECIALIZED SERVICE SUBSCHEDULE - TRANSPORTATION
60
(Dollars in Thousands)
1. Report freight expenses only.
2. Report in lines 1, 2, 3, 4, and 10 the total of those natural expenses (salaries and wages, material, tools, supplies, fuels and lubricants, purchased services, and general) incurred in the operation of each
type of specialized service facility. This schedule does not include switching services performed by train and yard crews in connection with or within specialized service facilities.
3. When it is necessary to apportion expenses, such as administrative expenses to two or more services, they shall be apportioned on the most equitable basis available to the respondent and only to the
services they support. The total expenses in column (j) should balance with the respective line items in Schedule 410, Railway Operating Expenses.
4. Report in column (b), line 2, the expenses incurred in highway movements of trailers and containers performed at the expense of the reporting railroad within a terminal area for the purpose of pick-up,
delivery, or highway interchange service. Report in column (b), line 3, the expenses incurred in operating facilities for handling trailers and/or containers, including storage expenses. See Schedule 755, note R.
5. The operation of floating equipment in line-haul service (between distinct terminals) should be reported in column (c) on line 2.. Floating operations conducted within a general terminal or harbor area
should be reported in column (c), line 3.
6. Report in column (g), line 3, the expenses incurred by the railroad in loading and unloading automobiles, trucks, etc., to and from bi-level and tri-level auto rack cars. Report on line 2, column (g),
the expense incurred by the railroad in moving automobiles, etc., between bi-level and tri-level loading and unloading facilities over the highway to shippers, receivers, or connecting carriers. Report in
column (f) operating expenses for land facilities in support of floating operations, including the operation of docks and wharves.
7. Report on line 4, column (b), the expenses relating to heating and refrigeration of TOFC/COFC trailers and containers (total debits and credits). The expenses on line 4, column (h) relate to refrigerator
cars only.
8. Report in column (i) total expenses incurred in performing rail substitute service, other highway revenue service, LCL terminal operations, warehouse operations, freight car transloading, grain
elevator terminal operations, and livestock feeding operations only.
Coal Ore Other Motor vehicle Protective Other Total
Line Cross Items TOFC/COFC Floating marine marine marine load & services special columns Line
No. Check terminal equipment terminal terminal terminal distribution refrigerator car services (b) - (i) No.
(a) (b) (c) (d) (e) (f) (g) (h) (i) (j)
1 * Administration 9,636 - - 31 968 275 - 10,910 1
2 * Pick up and delivery, marine line haul 34,307 160 N/A 34,467 2
3 * Loading and unloading and local marine 278,835 1,015 30,555 N/A 310,405 3
4 * Protective services - total debits and credits 7 742 8,656 9,405 4
5 * Freight lost or damaged - solely related 5
6 * Fringe benefits 1,785 303 34 2,122 6
7 * Casualty and insurance 192 192 7
8 * Joint facility - debit 8
9 * Joint facility - credit ( ) ( ) ( ) ( ) ( ) ( ) ( ) ( ) ( ) 9
10 * Other - - - - - - - - 10
11 * TOTAL 324,762 1,349 32,425 8,965 367,501 11
Railroad A
nnual Report R
-1
Road Initials: B
NS
F Y
ear 2013
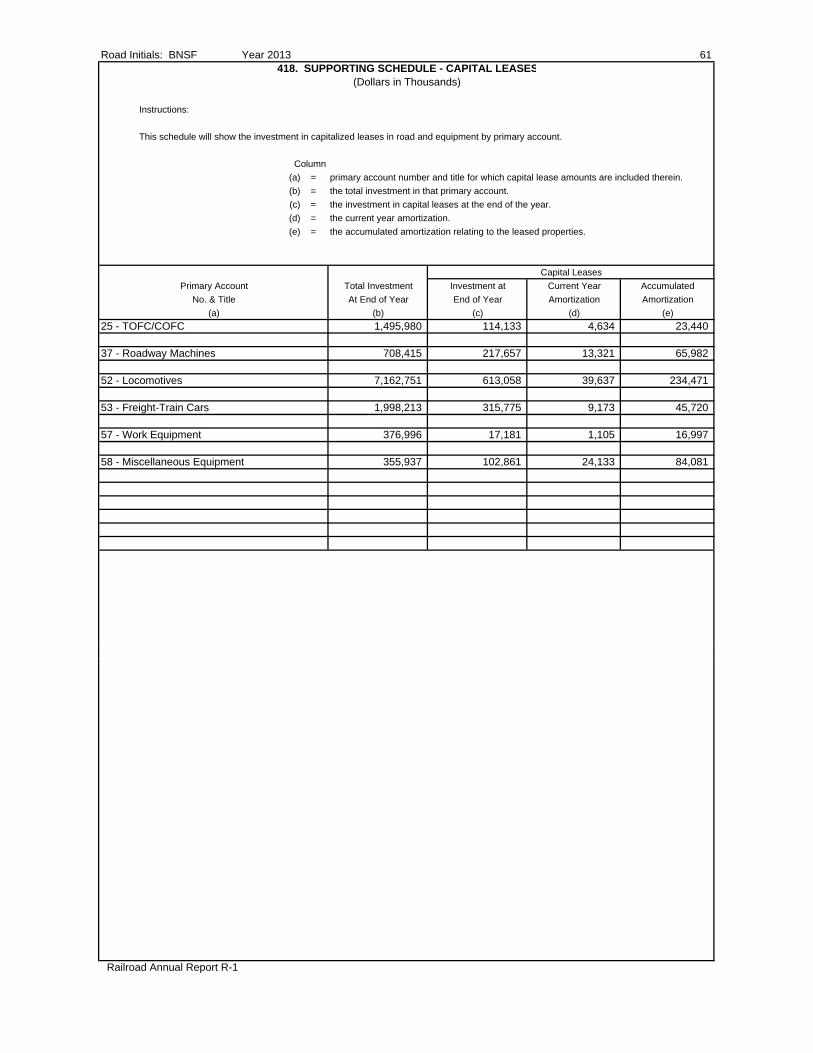
Road Initials: BNSF Year 2013 61418. SUPPORTING SCHEDULE - CAPITAL LEASES
(Dollars in Thousands)
Instructions:
This schedule will show the investment in capitalized leases in road and equipment by primary account.
Column
(a) = primary account number and title for which capital lease amounts are included therein.
(b) = the total investment in that primary account.
(c) = the investment in capital leases at the end of the year.
(d) = the current year amortization.
(e) = the accumulated amortization relating to the leased properties.
Capital Leases
Primary Account Total Investment Investment at Current Year Accumulated
No. & Title At End of Year End of Year Amortization Amortization
(a) (b) (c) (d) (e)
25 - TOFC/COFC 1,495,980 114,133 4,634 23,440
37 - Roadway Machines 708,415 217,657 13,321 65,982
52 - Locomotives 7,162,751 613,058 39,637 234,471
53 - Freight-Train Cars 1,998,213 315,775 9,173 45,720
57 - Work Equipment 376,996 17,181 1,105 16,997
58 - Miscellaneous Equipment 355,937 102,861 24,133 84,081
Railroad Annual Report R-1

62 Road Initials: BNSF Year 2013NOTES AND REMARKS
Railroad Annual Report R-1
THIS PAGE INTENTIONALLY LEFT BLANK
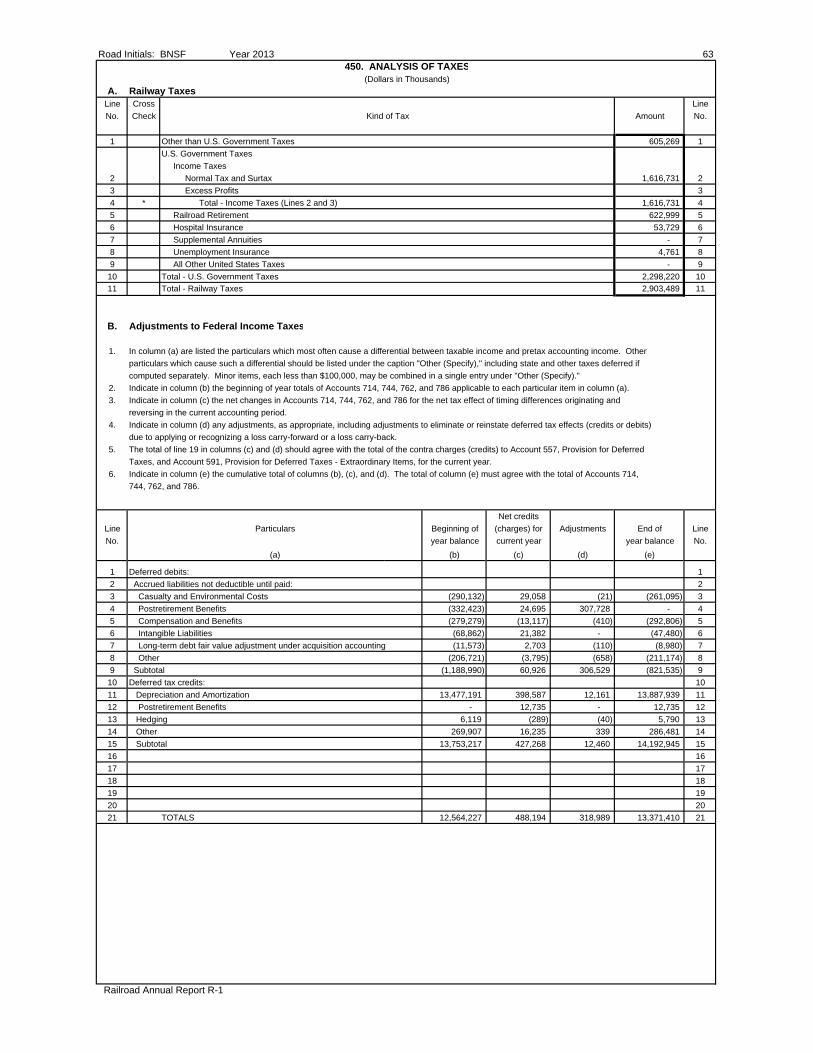
Road Initials: BNSF Year 2013 63450. ANALYSIS OF TAXES
(Dollars in Thousands)
A. Railway TaxesLine Cross Line
No. Check Kind of Tax Amount No.
1 Other than U.S. Government Taxes 605,269 1
U.S. Government Taxes
Income Taxes
2 Normal Tax and Surtax 1,616,731 2
3 Excess Profits 3
4 * Total - Income Taxes (Lines 2 and 3) 1,616,731 4
5 Railroad Retirement 622,999 5
6 Hospital Insurance 53,729 6
7 Supplemental Annuities - 7
8 Unemployment Insurance 4,761 8
9 All Other United States Taxes - 9
10 Total - U.S. Government Taxes 2,298,220 10
11 Total - Railway Taxes 2,903,489 11
B. Adjustments to Federal Income Taxes
1. In column (a) are listed the particulars which most often cause a differential between taxable income and pretax accounting income. Other
particulars which cause such a differential should be listed under the caption "Other (Specify)," including state and other taxes deferred if
computed separately. Minor items, each less than $100,000, may be combined in a single entry under "Other (Specify)."
2. Indicate in column (b) the beginning of year totals of Accounts 714, 744, 762, and 786 applicable to each particular item in column (a).
3. Indicate in column (c) the net changes in Accounts 714, 744, 762, and 786 for the net tax effect of timing differences originating and
reversing in the current accounting period.
4. Indicate in column (d) any adjustments, as appropriate, including adjustments to eliminate or reinstate deferred tax effects (credits or debits)
due to applying or recognizing a loss carry-forward or a loss carry-back.
5. The total of line 19 in columns (c) and (d) should agree with the total of the contra charges (credits) to Account 557, Provision for Deferred
Taxes, and Account 591, Provision for Deferred Taxes - Extraordinary Items, for the current year.
6. Indicate in column (e) the cumulative total of columns (b), (c), and (d). The total of column (e) must agree with the total of Accounts 714,
744, 762, and 786.
Net credits
Line Particulars Beginning of (charges) for Adjustments End of Line
No. year balance current year year balance No.
(a) (b) (c) (d) (e)
1 Deferred debits: 1
2 Accrued liabilities not deductible until paid: 2
3 Casualty and Environmental Costs (290,132) 29,058 (21) (261,095) 3
4 Postretirement Benefits (332,423) 24,695 307,728 - 4
5 Compensation and Benefits (279,279) (13,117) (410) (292,806) 5
6 Intangible Liabilities (68,862) 21,382 - (47,480) 6
7 Long-term debt fair value adjustment under acquisition accounting (11,573) 2,703 (110) (8,980) 7
8 Other (206,721) (3,795) (658) (211,174) 8
9 Subtotal (1,188,990) 60,926 306,529 (821,535) 9
10 Deferred tax credits: 10
11 Depreciation and Amortization 13,477,191 398,587 12,161 13,887,939 11
12 Postretirement Benefits - 12,735 - 12,735 12
13 Hedging 6,119 (289) (40) 5,790 13
14 Other 269,907 16,235 339 286,481 14
15 Subtotal 13,753,217 427,268 12,460 14,192,945 15
16 16
17 17
18 18
19 19
20 20
21 TOTALS 12,564,227 488,194 318,989 13,371,410 21
Railroad Annual Report R-1
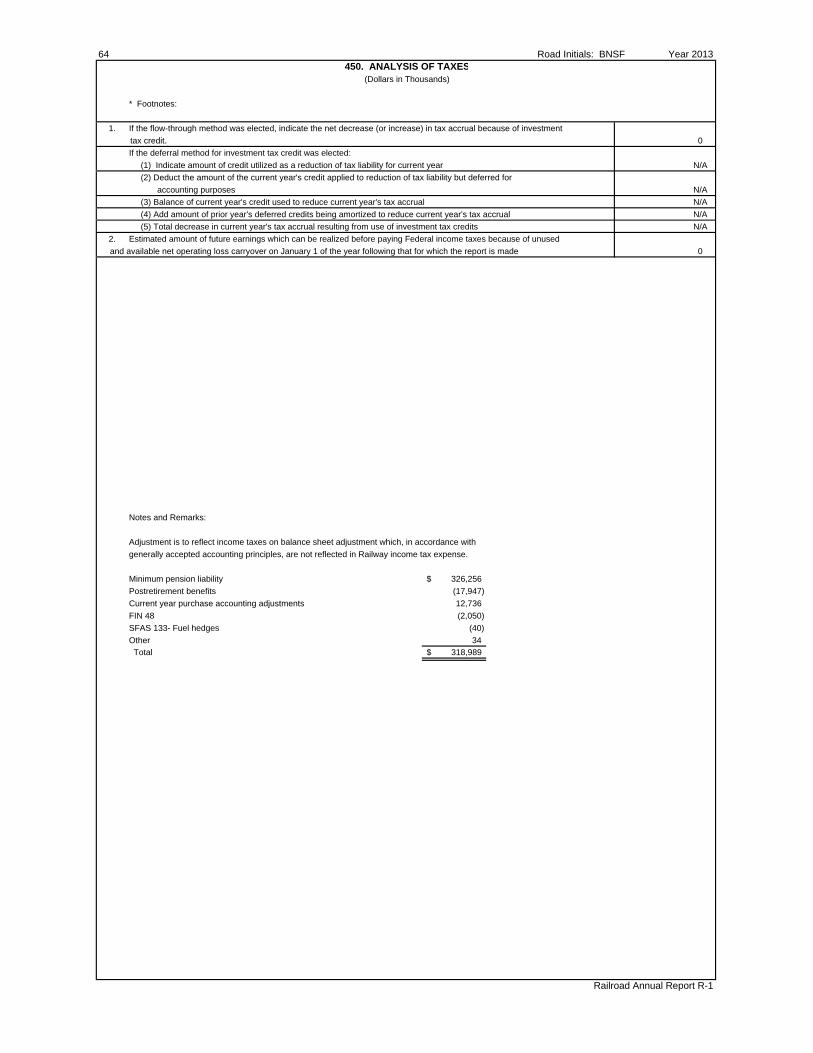
64 Road Initials: BNSF Year 2013450. ANALYSIS OF TAXES
(Dollars in Thousands)
* Footnotes:
1. If the flow-through method was elected, indicate the net decrease (or increase) in tax accrual because of investment
tax credit. 0
If the deferral method for investment tax credit was elected:
(1) Indicate amount of credit utilized as a reduction of tax liability for current year N/A
(2) Deduct the amount of the current year's credit applied to reduction of tax liability but deferred for
accounting purposes N/A
(3) Balance of current year's credit used to reduce current year's tax accrual N/A
(4) Add amount of prior year's deferred credits being amortized to reduce current year's tax accrual N/A
(5) Total decrease in current year's tax accrual resulting from use of investment tax credits N/A
2. Estimated amount of future earnings which can be realized before paying Federal income taxes because of unused
and available net operating loss carryover on January 1 of the year following that for which the report is made 0
Notes and Remarks:
Adjustment is to reflect income taxes on balance sheet adjustment which, in accordance with
generally accepted accounting principles, are not reflected in Railway income tax expense.
Minimum pension liability 326,256$
Postretirement benefits (17,947)
Current year purchase accounting adjustments 12,736
FIN 48 (2,050)
SFAS 133- Fuel hedges (40)
Other 34
Total 318,989$
Railroad Annual Report R-1
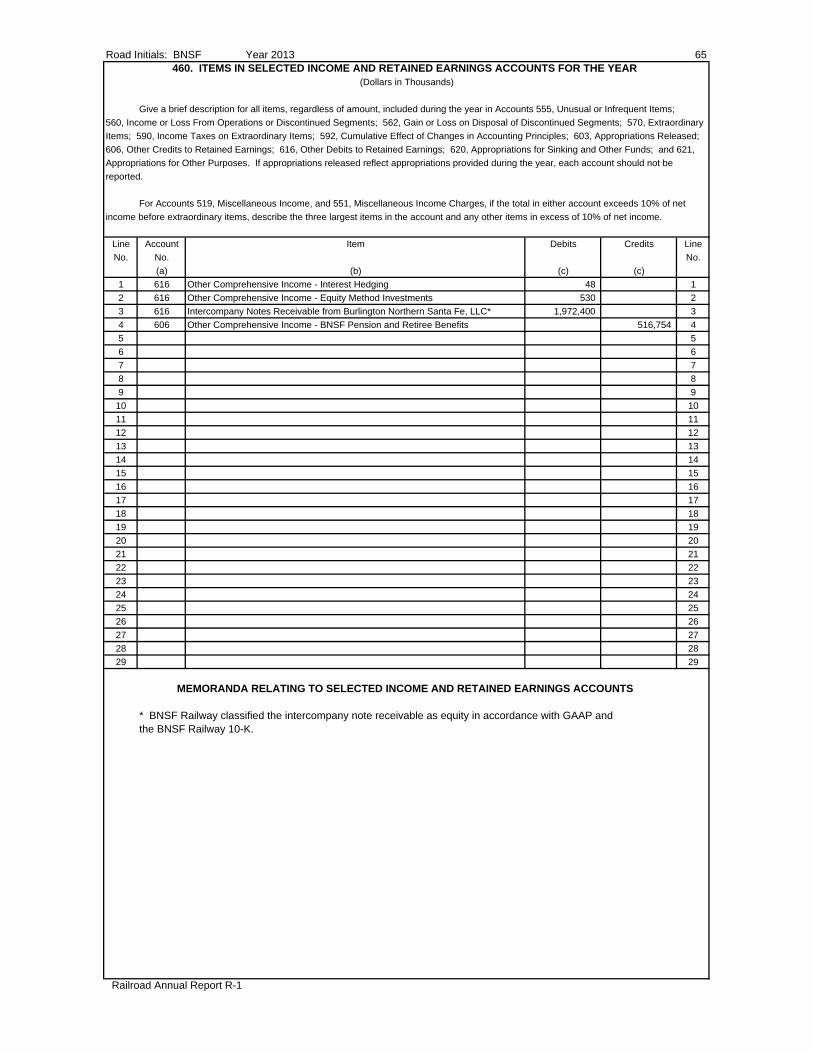
Road Initials: BNSF Year 2013 65460. ITEMS IN SELECTED INCOME AND RETAINED EARNINGS ACCOUNTS FOR THE YEAR
(Dollars in Thousands)
Give a brief description for all items, regardless of amount, included during the year in Accounts 555, Unusual or Infrequent Items;
560, Income or Loss From Operations or Discontinued Segments; 562, Gain or Loss on Disposal of Discontinued Segments; 570, Extraordinary
Items; 590, Income Taxes on Extraordinary Items; 592, Cumulative Effect of Changes in Accounting Principles; 603, Appropriations Released;
606, Other Credits to Retained Earnings; 616, Other Debits to Retained Earnings; 620, Appropriations for Sinking and Other Funds; and 621,
Appropriations for Other Purposes. If appropriations released reflect appropriations provided during the year, each account should not be
reported.
For Accounts 519, Miscellaneous Income, and 551, Miscellaneous Income Charges, if the total in either account exceeds 10% of net
income before extraordinary items, describe the three largest items in the account and any other items in excess of 10% of net income.
Line Account Item Debits Credits Line
No. No. No.
(a) (b) (c) (c)
1 616 Other Comprehensive Income - Interest Hedging 48 1
2 616 Other Comprehensive Income - Equity Method Investments 530 2
3 616 Intercompany Notes Receivable from Burlington Northern Santa Fe, LLC* 1,972,400 3
4 606 Other Comprehensive Income - BNSF Pension and Retiree Benefits 516,754 4
5 5
6 6
7 7
8 8
9 9
10 10
11 11
12 12
13 13
14 14
15 15
16 16
17 17
18 18
19 19
20 20
21 21
22 22
23 23
24 24
25 25
26 26
27 27
28 28
29 29
MEMORANDA RELATING TO SELECTED INCOME AND RETAINED EARNINGS ACCOUNTS
* BNSF Railway classified the intercompany note receivable as equity in accordance with GAAP and the BNSF Railway 10-K.
Railroad Annual Report R-1
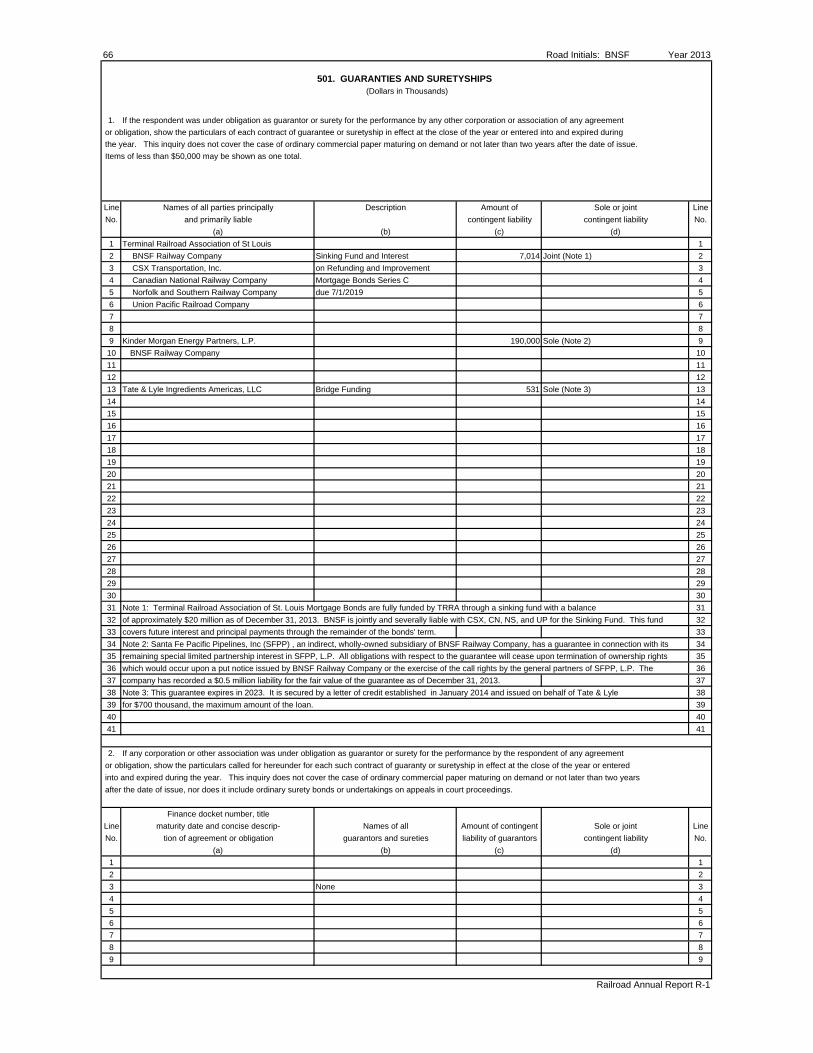
66 Road Initials: BNSF Year 2013
501. GUARANTIES AND SURETYSHIPS (Dollars in Thousands)
1. If the respondent was under obligation as guarantor or surety for the performance by any other corporation or association of any agreement
or obligation, show the particulars of each contract of guarantee or suretyship in effect at the close of the year or entered into and expired during
the year. This inquiry does not cover the case of ordinary commercial paper maturing on demand or not later than two years after the date of issue.
Items of less than $50,000 may be shown as one total.
Line Names of all parties principally Description Amount of Sole or joint Line
No. and primarily liable contingent liability contingent liability No.
(a) (b) (c) (d)
1 Terminal Railroad Association of St Louis 1
2 BNSF Railway Company Sinking Fund and Interest 7,014 Joint (Note 1) 2
3 CSX Transportation, Inc. on Refunding and Improvement 3
4 Canadian National Railway Company Mortgage Bonds Series C 4
5 Norfolk and Southern Railway Company due 7/1/2019 5
6 Union Pacific Railroad Company 6
7 7
8 8
9 Kinder Morgan Energy Partners, L.P. 190,000 Sole (Note 2) 9
10 BNSF Railway Company 10
11 11
12 12
13 Tate & Lyle Ingredients Americas, LLC Bridge Funding 531 Sole (Note 3) 13
14 14
15 15
16 16
17 17
18 18
19 19
20 20
21 21
22 22
23 23
24 24
25 25
26 26
27 27
28 28
29 29
30 30
31 Note 1: Terminal Railroad Association of St. Louis Mortgage Bonds are fully funded by TRRA through a sinking fund with a balance 31
32 of approximately $20 million as of December 31, 2013. BNSF is jointly and severally liable with CSX, CN, NS, and UP for the Sinking Fund. This fund 32
33 covers future interest and principal payments through the remainder of the bonds' term. 33
34 Note 2: Santa Fe Pacific Pipelines, Inc (SFPP) , an indirect, wholly-owned subsidiary of BNSF Railway Company, has a guarantee in connection with its 34
35 remaining special limited partnership interest in SFPP, L.P. All obligations with respect to the guarantee will cease upon termination of ownership rights 35
36 which would occur upon a put notice issued by BNSF Railway Company or the exercise of the call rights by the general partners of SFPP, L.P. The 36
37 company has recorded a $0.5 million liability for the fair value of the guarantee as of December 31, 2013. 37
38 Note 3: This guarantee expires in 2023. It is secured by a letter of credit established in January 2014 and issued on behalf of Tate & Lyle 38
39 for $700 thousand, the maximum amount of the loan. 39
40 40
41 41
2. If any corporation or other association was under obligation as guarantor or surety for the performance by the respondent of any agreement
or obligation, show the particulars called for hereunder for each such contract of guaranty or suretyship in effect at the close of the year or entered
into and expired during the year. This inquiry does not cover the case of ordinary commercial paper maturing on demand or not later than two years
after the date of issue, nor does it include ordinary surety bonds or undertakings on appeals in court proceedings.
Finance docket number, title
Line maturity date and concise descrip- Names of all Amount of contingent Sole or joint Line
No. tion of agreement or obligation guarantors and sureties liability of guarantors contingent liability No.
(a) (b) (c) (d)
1 1
2 2
3 None 3
4 4
5 5
6 6
7 7
8 8
9 9
Railroad Annual Report R-1
Road Initials: BNSF Year 2013 67502. COMPENSATING BALANCES AND SHORT-TERM BORROWING AGREEMENTS
(Dollars in Thousands)
Using the following notes as a guideline, show the requirements of compensating balances and short-term borrowing agreements. Footnote
disclosure is required even the arrangement is not reduced to writing.
1. Disclose compensating balances not legally restricted, lines of credit used and unused, average interest rate of short-term borrowings that are
outstanding at balance sheet date, maximum amount of outstanding borrowings during the period and the weighted average rate of those borrowings.
2. Time deposits and certificates of deposit constituting compensating balances not legally restricted should be disclosed.
3. Compensating balance arrangements need only be disclosed for the latest fiscal year.
4. Compensating balances included in Account 703, Special Deposits, and in Account 717, Other Funds, should also be separately disclosed below.
5. Compensating balance arrangements are sufficiently material to require disclosure in footnotes when the aggregate of written and oral
agreement balances amount to 15% or more of liquid assets (current cash balances, restricted and unrestricted, plus marketable securities).
6. When a carrier is not in compliance with a compensating balance requirement, that fact should be disclosed, along with stated and possible
sanctions, whenever such possible sanctions may be immediate (not vague or unpredictable) and material.
1. None
2. None
3. None
4. None
5. None
6. None
Railroad Annual Report R-1
68 Road Initials: BNSF Year 2013
Railroad Annual Report R-1
NOTES AND REMARKS
THIS PAGE INTENTIONALLY LEFT BLANK
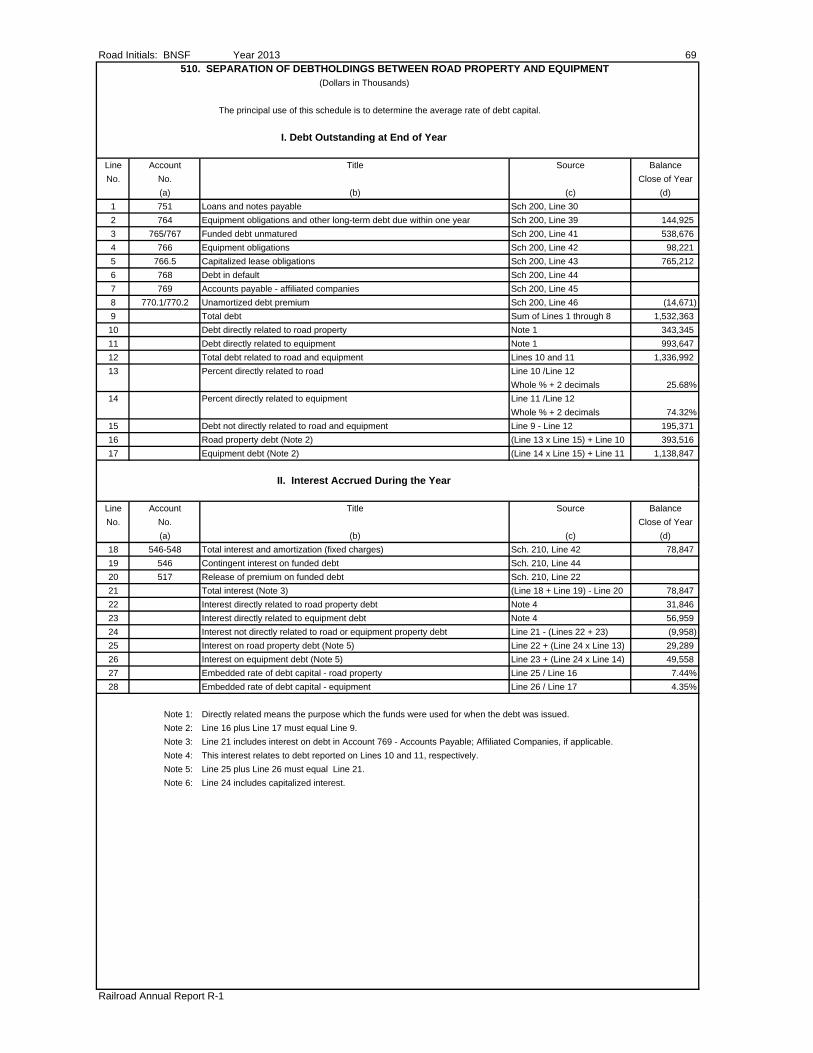
Road Initials: BNSF Year 2013 69510. SEPARATION OF DEBTHOLDINGS BETWEEN ROAD PROPERTY AND EQUIPMENT
(Dollars in Thousands)
The principal use of this schedule is to determine the average rate of debt capital.
I. Debt Outstanding at End of Year
Line Account Title Source Balance
No. No. Close of Year
(a) (b) (c) (d)
1 751 Loans and notes payable Sch 200, Line 30
2 764 Equipment obligations and other long-term debt due within one year Sch 200, Line 39 144,925
3 765/767 Funded debt unmatured Sch 200, Line 41 538,676
4 766 Equipment obligations Sch 200, Line 42 98,221
5 766.5 Capitalized lease obligations Sch 200, Line 43 765,212
6 768 Debt in default Sch 200, Line 44
7 769 Accounts payable - affiliated companies Sch 200, Line 45
8 770.1/770.2 Unamortized debt premium Sch 200, Line 46 (14,671)
9 Total debt Sum of Lines 1 through 8 1,532,363
10 Debt directly related to road property Note 1 343,345
11 Debt directly related to equipment Note 1 993,647
12 Total debt related to road and equipment Lines 10 and 11 1,336,992
13 Percent directly related to road Line 10 /Line 12
Whole % + 2 decimals 25.68%
14 Percent directly related to equipment Line 11 /Line 12
Whole % + 2 decimals 74.32%
15 Debt not directly related to road and equipment Line 9 - Line 12 195,371
16 Road property debt (Note 2) (Line 13 x Line 15) + Line 10 393,516
17 Equipment debt (Note 2) (Line 14 x Line 15) + Line 11 1,138,847
II. Interest Accrued During the Year
Line Account Title Source Balance
No. No. Close of Year
(a) (b) (c) (d)
18 546-548 Total interest and amortization (fixed charges) Sch. 210, Line 42 78,847
19 546 Contingent interest on funded debt Sch. 210, Line 44
20 517 Release of premium on funded debt Sch. 210, Line 22
21 Total interest (Note 3) (Line 18 + Line 19) - Line 20 78,847
22 Interest directly related to road property debt Note 4 31,846
23 Interest directly related to equipment debt Note 4 56,959
24 Interest not directly related to road or equipment property debt Line 21 - (Lines 22 + 23) (9,958)
25 Interest on road property debt (Note 5) Line 22 + (Line 24 x Line 13) 29,289
26 Interest on equipment debt (Note 5) Line 23 + (Line 24 x Line 14) 49,558
27 Embedded rate of debt capital - road property Line 25 / Line 16 7.44%
28 Embedded rate of debt capital - equipment Line 26 / Line 17 4.35%
Note 1: Directly related means the purpose which the funds were used for when the debt was issued.
Note 2: Line 16 plus Line 17 must equal Line 9.
Note 3: Line 21 includes interest on debt in Account 769 - Accounts Payable; Affiliated Companies, if applicable.
Note 4: This interest relates to debt reported on Lines 10 and 11, respectively.
Note 5: Line 25 plus Line 26 must equal Line 21.
Note 6: Line 24 includes capitalized interest.
Railroad Annual Report R-1

70 Road Initials: BNSF Year 2013NOTES AND REMARKS
Railroad Annual Report R-1
THIS PAGE INTENTIONALLY LEFT BLANK
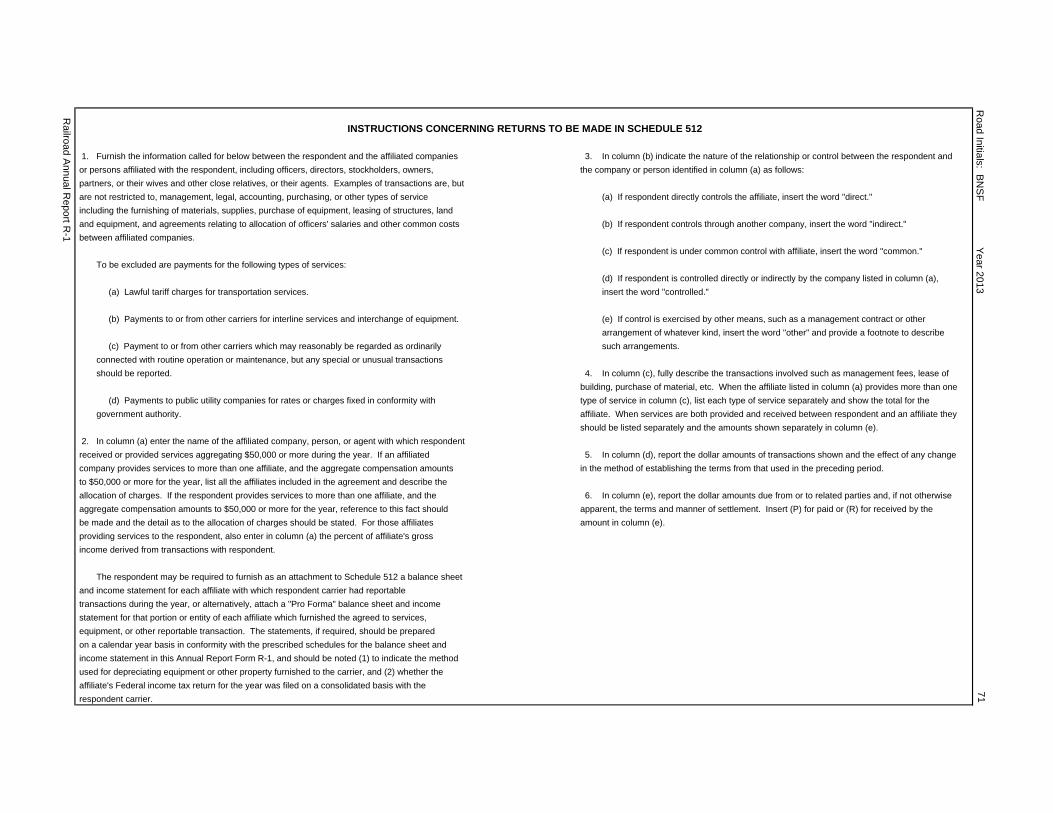
INSTRUCTIONS CONCERNING RETURNS TO BE MADE IN SCHEDULE 512
1. Furnish the information called for below between the respondent and the affiliated companies 3. In column (b) indicate the nature of the relationship or control between the respondent and
or persons affiliated with the respondent, including officers, directors, stockholders, owners, the company or person identified in column (a) as follows:
partners, or their wives and other close relatives, or their agents. Examples of transactions are, but
are not restricted to, management, legal, accounting, purchasing, or other types of service (a) If respondent directly controls the affiliate, insert the word "direct."
including the furnishing of materials, supplies, purchase of equipment, leasing of structures, land
and equipment, and agreements relating to allocation of officers' salaries and other common costs (b) If respondent controls through another company, insert the word "indirect."
between affiliated companies.
(c) If respondent is under common control with affiliate, insert the word "common."
To be excluded are payments for the following types of services:
(d) If respondent is controlled directly or indirectly by the company listed in column (a),
(a) Lawful tariff charges for transportation services. insert the word "controlled."
(b) Payments to or from other carriers for interline services and interchange of equipment. (e) If control is exercised by other means, such as a management contract or other
arrangement of whatever kind, insert the word "other" and provide a footnote to describe
(c) Payment to or from other carriers which may reasonably be regarded as ordinarily such arrangements.
connected with routine operation or maintenance, but any special or unusual transactions
should be reported. 4. In column (c), fully describe the transactions involved such as management fees, lease of
building, purchase of material, etc. When the affiliate listed in column (a) provides more than one
(d) Payments to public utility companies for rates or charges fixed in conformity with type of service in column (c), list each type of service separately and show the total for the
government authority. affiliate. When services are both provided and received between respondent and an affiliate they
should be listed separately and the amounts shown separately in column (e).
2. In column (a) enter the name of the affiliated company, person, or agent with which respondent
received or provided services aggregating $50,000 or more during the year. If an affiliated 5. In column (d), report the dollar amounts of transactions shown and the effect of any change
company provides services to more than one affiliate, and the aggregate compensation amounts in the method of establishing the terms from that used in the preceding period.
to $50,000 or more for the year, list all the affiliates included in the agreement and describe the
allocation of charges. If the respondent provides services to more than one affiliate, and the 6. In column (e), report the dollar amounts due from or to related parties and, if not otherwise
aggregate compensation amounts to $50,000 or more for the year, reference to this fact should apparent, the terms and manner of settlement. Insert (P) for paid or (R) for received by the
be made and the detail as to the allocation of charges should be stated. For those affiliates amount in column (e).
providing services to the respondent, also enter in column (a) the percent of affiliate's gross
income derived from transactions with respondent.
The respondent may be required to furnish as an attachment to Schedule 512 a balance sheet
and income statement for each affiliate with which respondent carrier had reportable
transactions during the year, or alternatively, attach a "Pro Forma" balance sheet and income
statement for that portion or entity of each affiliate which furnished the agreed to services,
equipment, or other reportable transaction. The statements, if required, should be prepared
on a calendar year basis in conformity with the prescribed schedules for the balance sheet and
income statement in this Annual Report Form R-1, and should be noted (1) to indicate the method
used for depreciating equipment or other property furnished to the carrier, and (2) whether the
affiliate's Federal income tax return for the year was filed on a consolidated basis with the
respondent carrier.
Railroad A
nnual Report R
-1
Road Initials: B
NS
F Y
ear 201371
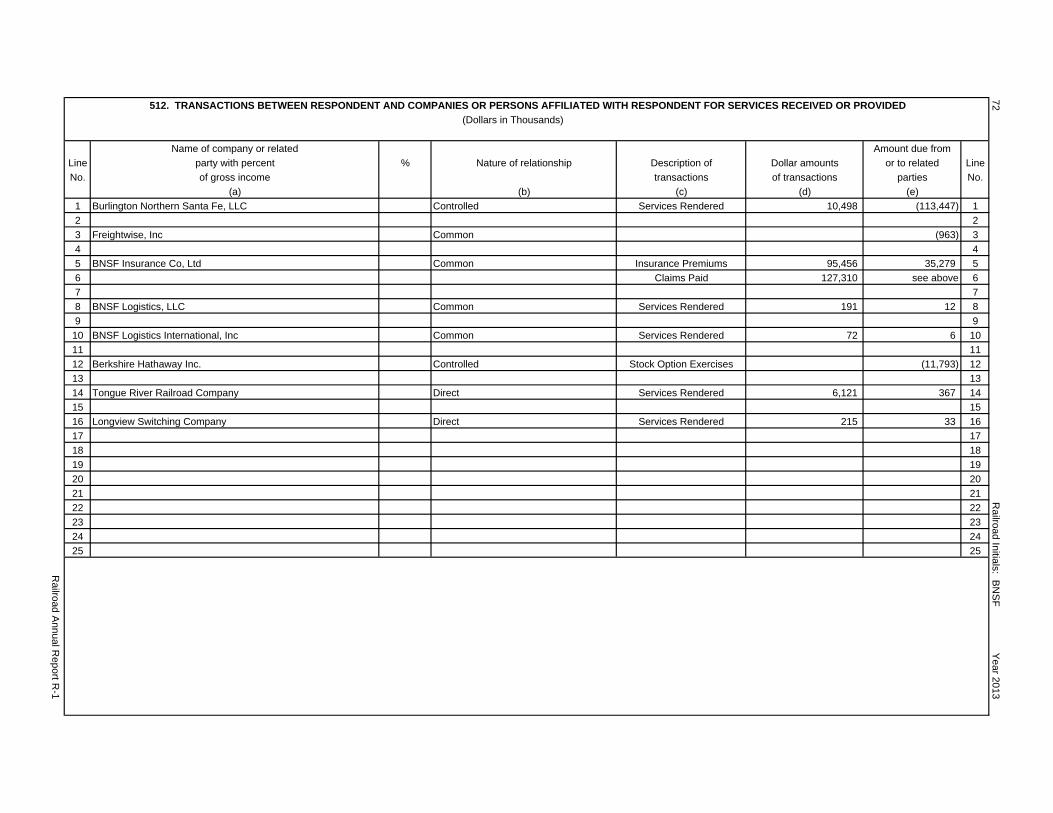
(Dollars in Thousands)
Name of company or related Amount due from
Line party with percent % Nature of relationship Description of Dollar amounts or to related Line
No. of gross income transactions of transactions parties No.
(a) (b) (c) (d) (e)
1 Burlington Northern Santa Fe, LLC Controlled Services Rendered 10,498 (113,447) 1
2 2
3 Freightwise, Inc Common (963) 3
4 4
5 BNSF Insurance Co, Ltd Common Insurance Premiums 95,456 35,279 5
6 Claims Paid 127,310 see above 6
7 7
8 BNSF Logistics, LLC Common Services Rendered 191 12 8
9 9
10 BNSF Logistics International, Inc Common Services Rendered 72 6 10
11 11
12 Berkshire Hathaway Inc. Controlled Stock Option Exercises (11,793) 12
13 13
14 Tongue River Railroad Company Direct Services Rendered 6,121 367 14
15 15
16 Longview Switching Company Direct Services Rendered 215 33 16
17 17
18 18
19 19
20 20
21 21
22 22
23 23
24 24
25 25
Railroad Initials: B
NS
F Y
ear 2013
Railroad A
nnual Report R
-1
512. TRANSACTIONS BETWEEN RESPONDENT AND COMPANIES OR PERSONS AFFILIATED WITH RESPONDENT FOR SERVICES RECEIVED OR PROVIDED
72
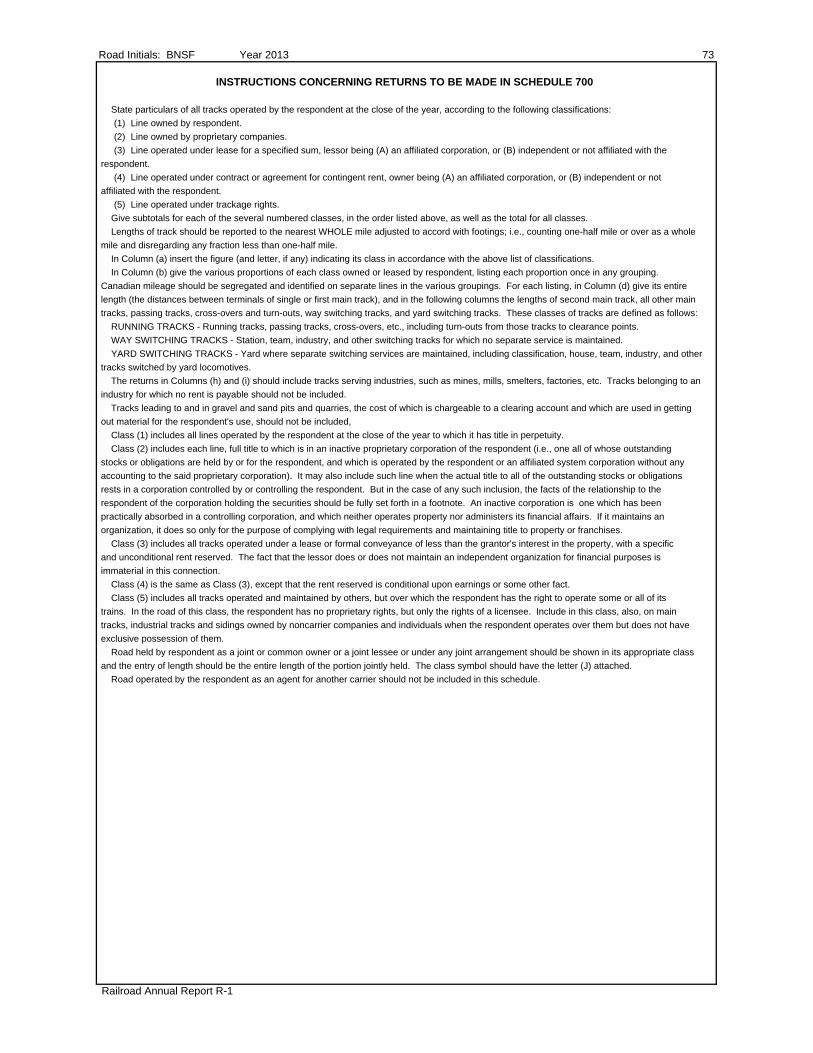
Road Initials: BNSF Year 2013 73
INSTRUCTIONS CONCERNING RETURNS TO BE MADE IN SCHEDULE 700
State particulars of all tracks operated by the respondent at the close of the year, according to the following classifications:
(1) Line owned by respondent.
(2) Line owned by proprietary companies.
(3) Line operated under lease for a specified sum, lessor being (A) an affiliated corporation, or (B) independent or not affiliated with the
respondent.
(4) Line operated under contract or agreement for contingent rent, owner being (A) an affiliated corporation, or (B) independent or not
affiliated with the respondent.
(5) Line operated under trackage rights.
Give subtotals for each of the several numbered classes, in the order listed above, as well as the total for all classes.
Lengths of track should be reported to the nearest WHOLE mile adjusted to accord with footings; i.e., counting one-half mile or over as a whole
mile and disregarding any fraction less than one-half mile.
In Column (a) insert the figure (and letter, if any) indicating its class in accordance with the above list of classifications.
In Column (b) give the various proportions of each class owned or leased by respondent, listing each proportion once in any grouping.
Canadian mileage should be segregated and identified on separate lines in the various groupings. For each listing, in Column (d) give its entire
length (the distances between terminals of single or first main track), and in the following columns the lengths of second main track, all other main
tracks, passing tracks, cross-overs and turn-outs, way switching tracks, and yard switching tracks. These classes of tracks are defined as follows:
RUNNING TRACKS - Running tracks, passing tracks, cross-overs, etc., including turn-outs from those tracks to clearance points.
WAY SWITCHING TRACKS - Station, team, industry, and other switching tracks for which no separate service is maintained.
YARD SWITCHING TRACKS - Yard where separate switching services are maintained, including classification, house, team, industry, and other
tracks switched by yard locomotives.
The returns in Columns (h) and (i) should include tracks serving industries, such as mines, mills, smelters, factories, etc. Tracks belonging to an
industry for which no rent is payable should not be included.
Tracks leading to and in gravel and sand pits and quarries, the cost of which is chargeable to a clearing account and which are used in getting
out material for the respondent's use, should not be included,
Class (1) includes all lines operated by the respondent at the close of the year to which it has title in perpetuity.
Class (2) includes each line, full title to which is in an inactive proprietary corporation of the respondent (i.e., one all of whose outstanding
stocks or obligations are held by or for the respondent, and which is operated by the respondent or an affiliated system corporation without any
accounting to the said proprietary corporation). It may also include such line when the actual title to all of the outstanding stocks or obligations
rests in a corporation controlled by or controlling the respondent. But in the case of any such inclusion, the facts of the relationship to the
respondent of the corporation holding the securities should be fully set forth in a footnote. An inactive corporation is one which has been
practically absorbed in a controlling corporation, and which neither operates property nor administers its financial affairs. If it maintains an
organization, it does so only for the purpose of complying with legal requirements and maintaining title to property or franchises.
Class (3) includes all tracks operated under a lease or formal conveyance of less than the grantor's interest in the property, with a specific
and unconditional rent reserved. The fact that the lessor does or does not maintain an independent organization for financial purposes is
immaterial in this connection.
Class (4) is the same as Class (3), except that the rent reserved is conditional upon earnings or some other fact.
Class (5) includes all tracks operated and maintained by others, but over which the respondent has the right to operate some or all of its
trains. In the road of this class, the respondent has no proprietary rights, but only the rights of a licensee. Include in this class, also, on main
tracks, industrial tracks and sidings owned by noncarrier companies and individuals when the respondent operates over them but does not have
exclusive possession of them.
Road held by respondent as a joint or common owner or a joint lessee or under any joint arrangement should be shown in its appropriate class
and the entry of length should be the entire length of the portion jointly held. The class symbol should have the letter (J) attached.
Road operated by the respondent as an agent for another carrier should not be included in this schedule.
Railroad Annual Report R-1
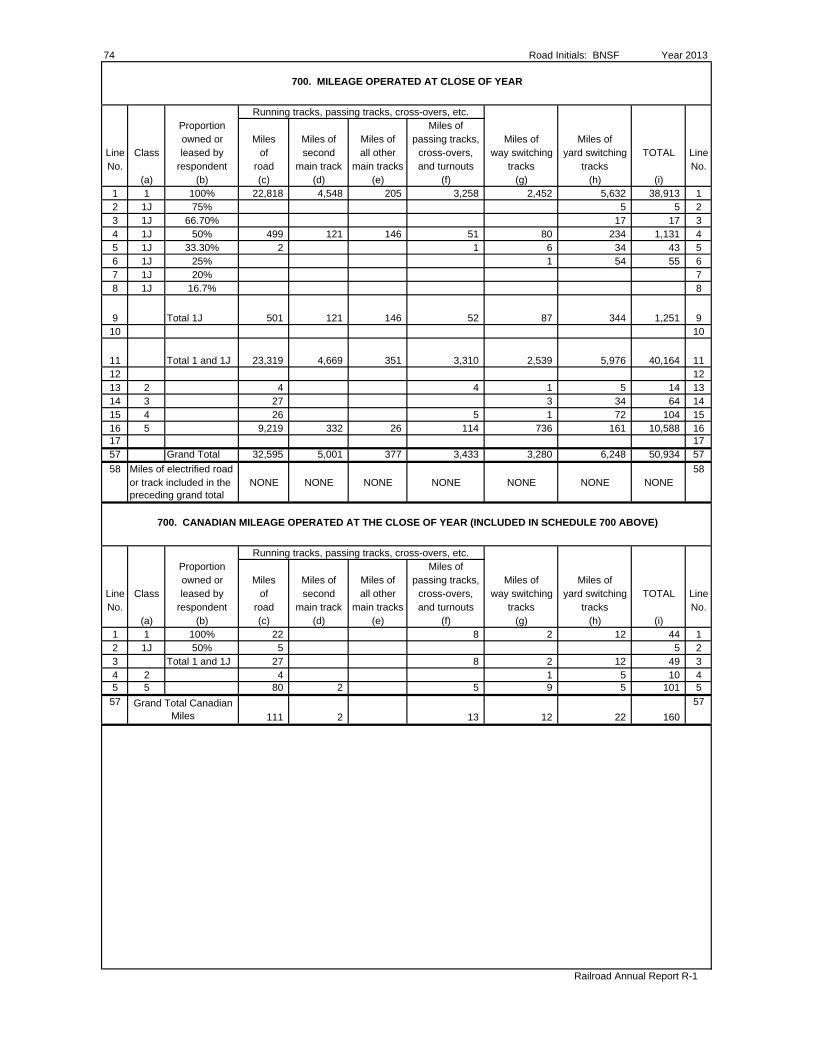
74 Road Initials: BNSF Year 2013
700. MILEAGE OPERATED AT CLOSE OF YEAR
Running tracks, passing tracks, cross-overs, etc.Proportion Miles ofowned or Miles Miles of Miles of passing tracks, Miles of Miles of
Line Class leased by of second all other cross-overs, way switching yard switching TOTAL LineNo. respondent road main track main tracks and turnouts tracks tracks No.
(a) (b) (c) (d) (e) (f) (g) (h) (i)1 1 100% 22,818 4,548 205 3,258 2,452 5,632 38,913 12 1J 75% 5 5 23 1J 66.70% 17 17 34 1J 50% 499 121 146 51 80 234 1,131 45 1J 33.30% 2 1 6 34 43 56 1J 25% 1 54 55 67 1J 20% 78 1J 16.7% 8
9 Total 1J 501 121 146 52 87 344 1,251 910 10
11 Total 1 and 1J 23,319 4,669 351 3,310 2,539 5,976 40,164 1112 1213 2 4 4 1 5 14 1314 3 27 3 34 64 1415 4 26 5 1 72 104 1516 5 9,219 332 26 114 736 161 10,588 1617 1757 Grand Total 32,595 5,001 377 3,433 3,280 6,248 50,934 57
58 Miles of electrified road 58or track included in the NONE NONE NONE NONE NONE NONE NONEpreceding grand total
Running tracks, passing tracks, cross-overs, etc.Proportion Miles ofowned or Miles Miles of Miles of passing tracks, Miles of Miles of
Line Class leased by of second all other cross-overs, way switching yard switching TOTAL LineNo. respondent road main track main tracks and turnouts tracks tracks No.
(a) (b) (c) (d) (e) (f) (g) (h) (i)1 1 100% 22 8 2 12 44 12 1J 50% 5 5 23 Total 1 and 1J 27 8 2 12 49 34 2 4 1 5 10 45 5 80 2 5 9 5 101 5
57
111 2 13 12 22 160
57
Railroad Annual Report R-1
700. CANADIAN MILEAGE OPERATED AT THE CLOSE OF YEAR (INCLUDED IN SCHEDULE 700 ABOVE)
Grand Total Canadian Miles
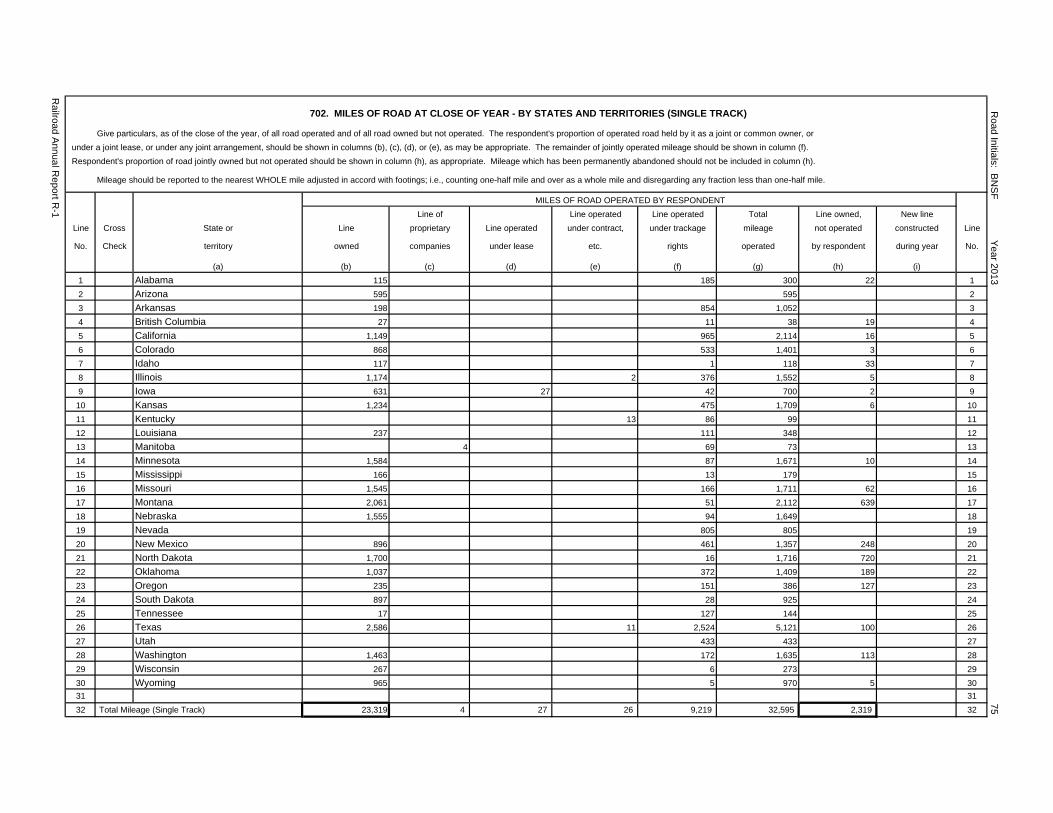
702. MILES OF ROAD AT CLOSE OF YEAR - BY STATES AND TERRITORIES (SINGLE TRACK)
Give particulars, as of the close of the year, of all road operated and of all road owned but not operated. The respondent's proportion of operated road held by it as a joint or common owner, or
under a joint lease, or under any joint arrangement, should be shown in columns (b), (c), (d), or (e), as may be appropriate. The remainder of jointly operated mileage should be shown in column (f).
Respondent's proportion of road jointly owned but not operated should be shown in column (h), as appropriate. Mileage which has been permanently abandoned should not be included in column (h).
Mileage should be reported to the nearest WHOLE mile adjusted in accord with footings; i.e., counting one-half mile and over as a whole mile and disregarding any fraction less than one-half mile.
MILES OF ROAD OPERATED BY RESPONDENT
Line of Line operated Line operated Total Line owned, New line
Line Cross State or Line proprietary Line operated under contract, under trackage mileage not operated constructed Line
No. Check territory owned companies under lease etc. rights operated by respondent during year No.
(a) (b) (c) (d) (e) (f) (g) (h) (i)
1 Alabama 115 185 300 22 1
2 Arizona 595 595 2
3 Arkansas 198 854 1,052 3
4 British Columbia 27 11 38 19 4
5 California 1,149 965 2,114 16 5
6 Colorado 868 533 1,401 3 6
7 Idaho 117 1 118 33 7
8 Illinois 1,174 2 376 1,552 5 8
9 Iowa 631 27 42 700 2 9
10 Kansas 1,234 475 1,709 6 10
11 Kentucky 13 86 99 11
12 Louisiana 237 111 348 12
13 Manitoba 4 69 73 13
14 Minnesota 1,584 87 1,671 10 14
15 Mississippi 166 13 179 15
16 Missouri 1,545 166 1,711 62 16
17 Montana 2,061 51 2,112 639 17
18 Nebraska 1,555 94 1,649 18
19 Nevada 805 805 19
20 New Mexico 896 461 1,357 248 20
21 North Dakota 1,700 16 1,716 720 21
22 Oklahoma 1,037 372 1,409 189 22
23 Oregon 235 151 386 127 23
24 South Dakota 897 28 925 24
25 Tennessee 17 127 144 25
26 Texas 2,586 11 2,524 5,121 100 26
27 Utah 433 433 27
28 Washington 1,463 172 1,635 113 28
29 Wisconsin 267 6 273 29
30 Wyoming 965 5 970 5 30
31 31
32 Total Mileage (Single Track) 23,319 4 27 26 9,219 32,595 2,319 32
Railroad A
nnual Report R
-1
75R
oad Initials: BN
SF
Year 2013
76 Road Initials: BNSF Year 2013
NOTES AND REMARKS
THIS PAGE INTENTIONALLY LEFT BLANK
Railroad Annual Report R-1
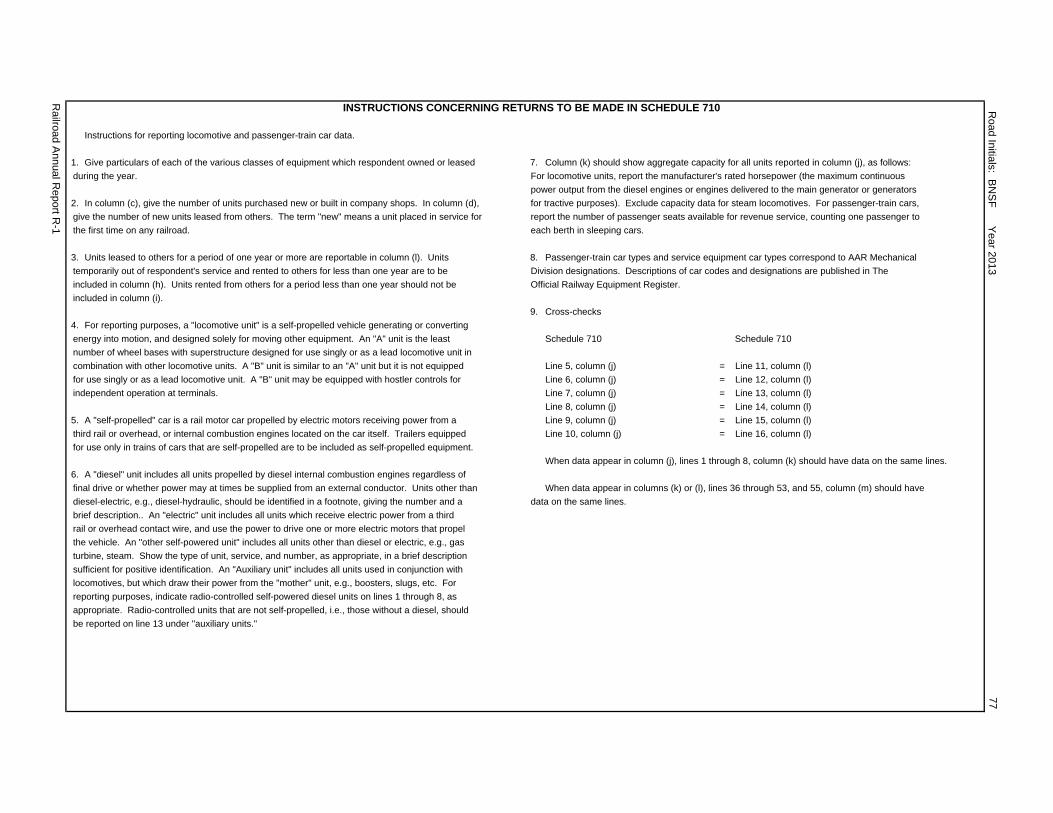
INSTRUCTIONS CONCERNING RETURNS TO BE MADE IN SCHEDULE 710
Instructions for reporting locomotive and passenger-train car data.
1. Give particulars of each of the various classes of equipment which respondent owned or leased 7. Column (k) should show aggregate capacity for all units reported in column (j), as follows:
during the year. For locomotive units, report the manufacturer's rated horsepower (the maximum continuous
power output from the diesel engines or engines delivered to the main generator or generators
2. In column (c), give the number of units purchased new or built in company shops. In column (d), for tractive purposes). Exclude capacity data for steam locomotives. For passenger-train cars,
give the number of new units leased from others. The term "new" means a unit placed in service for report the number of passenger seats available for revenue service, counting one passenger to
the first time on any railroad. each berth in sleeping cars.
3. Units leased to others for a period of one year or more are reportable in column (l). Units 8. Passenger-train car types and service equipment car types correspond to AAR Mechanical
temporarily out of respondent's service and rented to others for less than one year are to be Division designations. Descriptions of car codes and designations are published in The
included in column (h). Units rented from others for a period less than one year should not be Official Railway Equipment Register.
included in column (i).
9. Cross-checks
4. For reporting purposes, a "locomotive unit" is a self-propelled vehicle generating or converting
energy into motion, and designed solely for moving other equipment. An "A" unit is the least Schedule 710 Schedule 710
number of wheel bases with superstructure designed for use singly or as a lead locomotive unit in
combination with other locomotive units. A "B" unit is similar to an "A" unit but it is not equipped Line 5, column (j) = Line 11, column (l)
for use singly or as a lead locomotive unit. A "B" unit may be equipped with hostler controls for Line 6, column (j) = Line 12, column (l)
independent operation at terminals. Line 7, column (j) = Line 13, column (l)
Line 8, column (j) = Line 14, column (l)
5. A "self-propelled" car is a rail motor car propelled by electric motors receiving power from a Line 9, column (j) = Line 15, column (l)
third rail or overhead, or internal combustion engines located on the car itself. Trailers equipped Line 10, column (j) = Line 16, column (l)
for use only in trains of cars that are self-propelled are to be included as self-propelled equipment.
When data appear in column (j), lines 1 through 8, column (k) should have data on the same lines.
6. A "diesel" unit includes all units propelled by diesel internal combustion engines regardless of
final drive or whether power may at times be supplied from an external conductor. Units other than When data appear in columns (k) or (l), lines 36 through 53, and 55, column (m) should have
diesel-electric, e.g., diesel-hydraulic, should be identified in a footnote, giving the number and a data on the same lines.
brief description.. An "electric" unit includes all units which receive electric power from a third
rail or overhead contact wire, and use the power to drive one or more electric motors that propel
the vehicle. An "other self-powered unit" includes all units other than diesel or electric, e.g., gas
turbine, steam. Show the type of unit, service, and number, as appropriate, in a brief description
sufficient for positive identification. An "Auxiliary unit" includes all units used in conjunction with
locomotives, but which draw their power from the "mother" unit, e.g., boosters, slugs, etc. For
reporting purposes, indicate radio-controlled self-powered diesel units on lines 1 through 8, as
appropriate. Radio-controlled units that are not self-propelled, i.e., those without a diesel, should
be reported on line 13 under "auxiliary units."
Railroad A
nnual Report R
-1
Road Initials: B
NS
F Y
ear 201377
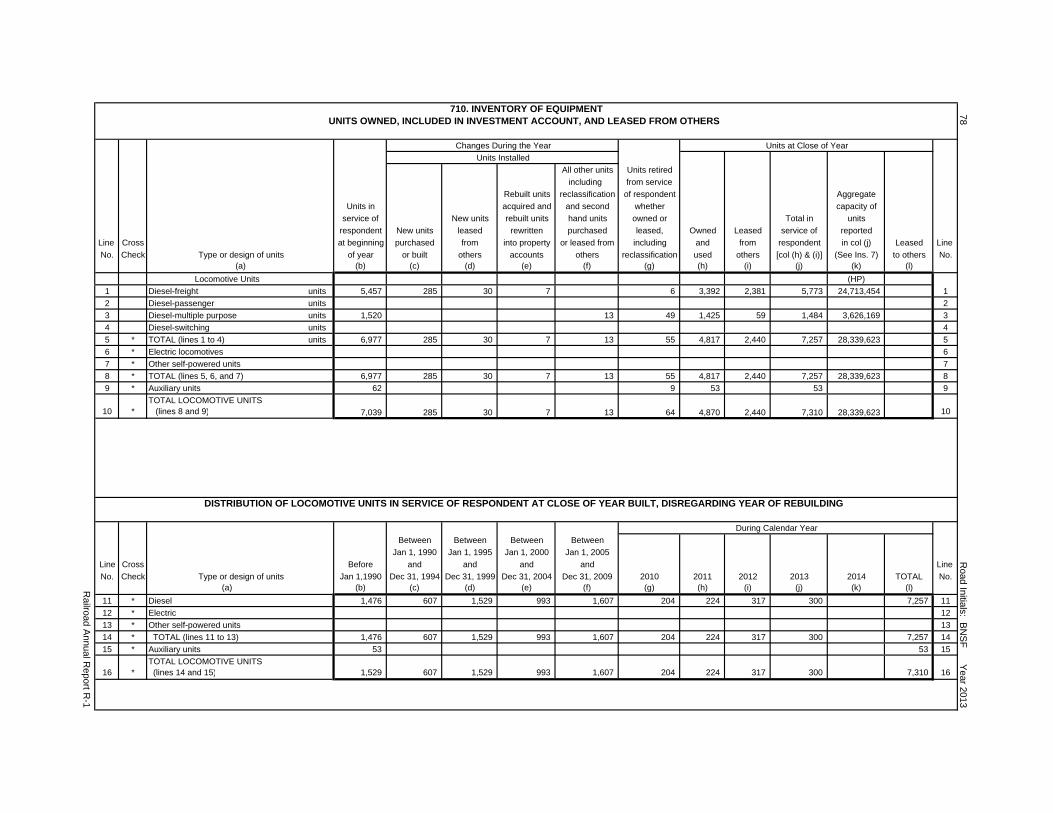
710. INVENTORY OF EQUIPMENTUNITS OWNED, INCLUDED IN INVESTMENT ACCOUNT, AND LEASED FROM OTHERS
Changes During the Year Units at Close of Year
Units Installed
All other units Units retired
including from service
Rebuilt units reclassification of respondent Aggregate
Units in acquired and and second whether capacity of
service of New units rebuilt units hand units owned or Total in units
respondent New units leased rewritten purchased leased, Owned Leased service of reported
Line Cross at beginning purchased from into property or leased from including and from respondent in col (j) Leased Line
No. Check Type or design of units of year or built others accounts others reclassification used others [col (h) & (i)] (See Ins. 7) to others No.(a) (b) (c) (d) (e) (f) (g) (h) (i) (j) (k) (l)
Locomotive Units (HP)
1 Diesel-freight units 5,457 285 30 7 6 3,392 2,381 5,773 24,713,454 1
2 Diesel-passenger units 2
3 Diesel-multiple purpose units 1,520 13 49 1,425 59 1,484 3,626,169 3
4 Diesel-switching units 4
5 * TOTAL (lines 1 to 4) units 6,977 285 30 7 13 55 4,817 2,440 7,257 28,339,623 5
6 * Electric locomotives 6
7 * Other self-powered units 7
8 * TOTAL (lines 5, 6, and 7) 6,977 285 30 7 13 55 4,817 2,440 7,257 28,339,623 8
9 * Auxiliary units 62 9 53 53 9
TOTAL LOCOMOTIVE UNITS10 * (lines 8 and 9) 10
DISTRIBUTION OF LOCOMOTIVE UNITS IN SERVICE OF RESPONDENT AT CLOSE OF YEAR BUILT, DISREGARDING YEAR OF REBUILDING
During Calendar Year
Between Between Between Between
Jan 1, 1990 Jan 1, 1995 Jan 1, 2000 Jan 1, 2005
Line Cross Before and and and and Line
No. Check Type or design of units Jan 1,1990 Dec 31, 1994 Dec 31, 1999 Dec 31, 2004 Dec 31, 2009 2010 2011 2012 2013 2014 TOTAL No.(a) (b) (c) (d) (e) (f) (g) (h) (i) (j) (k) (l)
11 * Diesel 1,476 607 1,529 993 1,607 204 224 317 300 7,257 11
12 * Electric 12
13 * Other self-powered units 13
14 * TOTAL (lines 11 to 13) 1,476 607 1,529 993 1,607 204 224 317 300 7,257 14
15 * Auxiliary units 53 53 15
TOTAL LOCOMOTIVE UNITS16 * (lines 14 and 15) 1,529 607 1,529 993 1,607 204 224 317 300 7,310 16
13 64 4,870 2,440285 30 7
78
7,039
Railroad A
nnual Report R
-1
Road Initials: B
NS
F Y
ear 2013
7,310 28,339,623
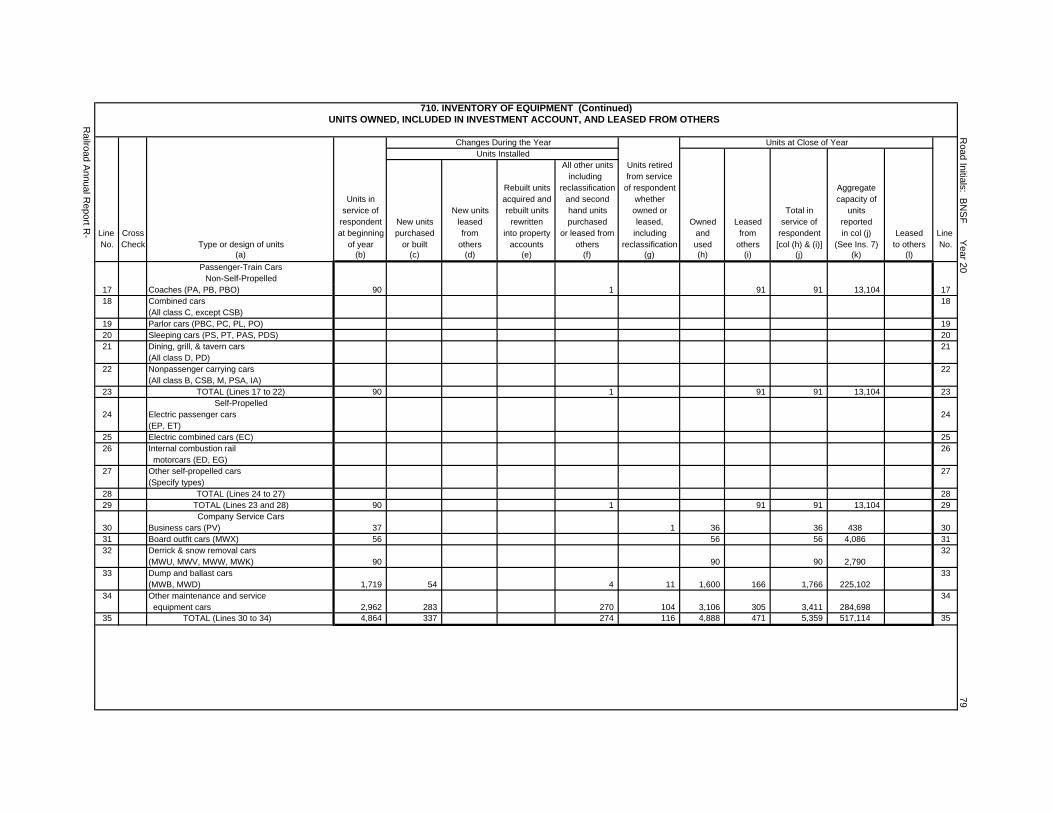
710. INVENTORY OF EQUIPMENT (Continued)UNITS OWNED, INCLUDED IN INVESTMENT ACCOUNT, AND LEASED FROM OTHERS
Changes During the Year Units at Close of YearUnits Installed
All other units Units retiredincluding from service
Rebuilt units reclassification of respondent AggregateUnits in acquired and and second whether capacity of
service of New units rebuilt units hand units owned or Total in unitsrespondent New units leased rewritten purchased leased, Owned Leased service of reported
Line Cross at beginning purchased from into property or leased from including and from respondent in col (j) Leased Line No. Check Type or design of units of year or built others accounts others reclassification used others [col (h) & (i)] (See Ins. 7) to others No.
(a) (b) (c) (d) (e) (f) (g) (h) (i) (j) (k) (l)
Passenger-Train CarsNon-Self-Propelled
17 Coaches (PA, PB, PBO) 90 1 91 91 13,104 1718 Combined cars 18
(All class C, except CSB)19 Parlor cars (PBC, PC, PL, PO) 1920 Sleeping cars (PS, PT, PAS, PDS) 2021 Dining, grill, & tavern cars 21
(All class D, PD)22 Nonpassenger carrying cars 22
(All class B, CSB, M, PSA, IA)23 TOTAL (Lines 17 to 22) 90 1 91 91 13,104 23
Self-Propelled24 Electric passenger cars 24
(EP, ET)25 Electric combined cars (EC) 2526 Internal combustion rail 26
motorcars (ED, EG)27 Other self-propelled cars 27
(Specify types)28 TOTAL (Lines 24 to 27) 2829 TOTAL (Lines 23 and 28) 90 1 91 91 13,104 29
Company Service Cars30 Business cars (PV) 37 1 36 36 438 3031 Board outfit cars (MWX) 56 56 56 4,086 3132 Derrick & snow removal cars 32
(MWU, MWV, MWW, MWK) 90 90 90 2,79033 Dump and ballast cars 33
(MWB, MWD) 1,719 54 4 11 1,600 166 1,766 225,10234 Other maintenance and service 34
equipment cars 2,962 283 270 104 3,106 305 3,411 284,69835 TOTAL (Lines 30 to 34) 4,864 337 274 116 4,888 471 5,359 517,114 35
79
Railroad A
nnual Report R
-
Road Initials: B
NS
F Y
ear 20
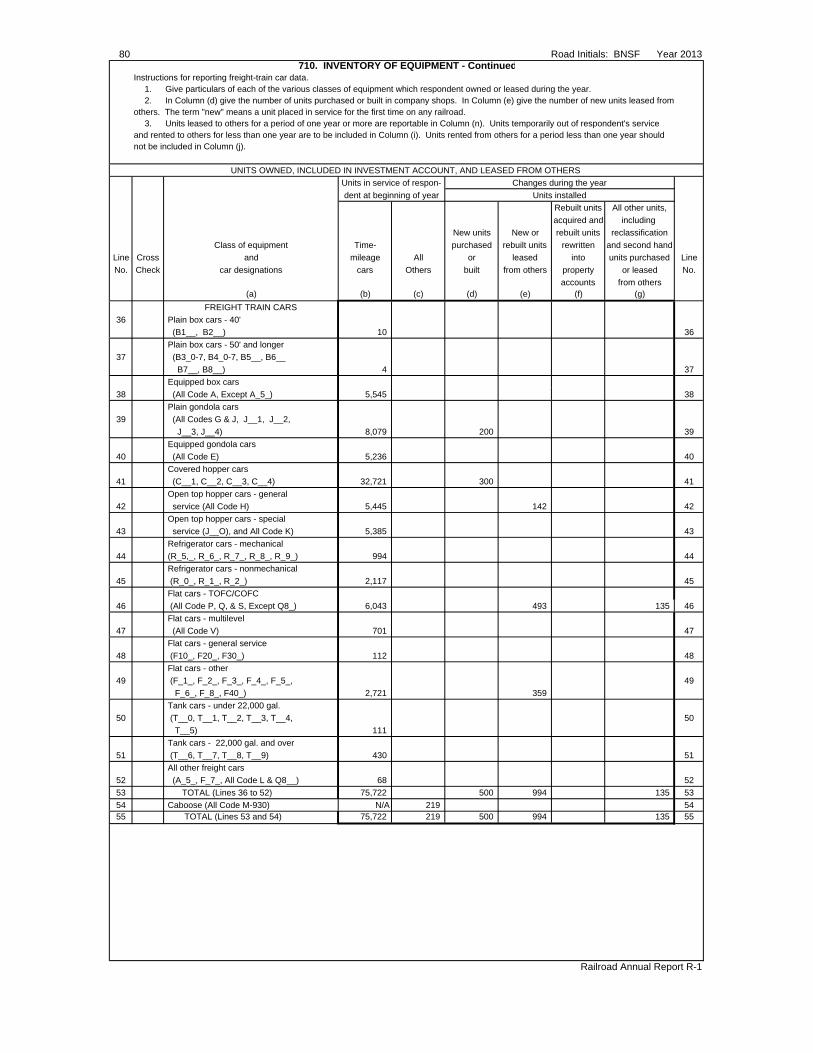
80 Road Initials: BNSF Year 2013710. INVENTORY OF EQUIPMENT - Continued
Instructions for reporting freight-train car data.1. Give particulars of each of the various classes of equipment which respondent owned or leased during the year.2. In Column (d) give the number of units purchased or built in company shops. In Column (e) give the number of new units leased from
others. The term "new" means a unit placed in service for the first time on any railroad.3. Units leased to others for a period of one year or more are reportable in Column (n). Units temporarily out of respondent's service
and rented to others for less than one year are to be included in Column (i). Units rented from others for a period less than one year should not be included in Column (j).
UNITS OWNED, INCLUDED IN INVESTMENT ACCOUNT, AND LEASED FROM OTHERS
Units in service of respon- Changes during the year
dent at beginning of year Units installed
Rebuilt units All other units,
acquired and including
New units New or rebuilt units reclassification
Class of equipment Time- purchased rebuilt units rewritten and second hand
Line Cross and mileage All or leased into units purchased Line
No. Check car designations cars Others built from others property or leased No.
accounts from others(a) (b) (c) (d) (e) (f) (g)
FREIGHT TRAIN CARS
36 Plain box cars - 40'
(B1__, B2__) 10 36
Plain box cars - 50' and longer
37 (B3_0-7, B4_0-7, B5__, B6__
B7__, B8__) 4 37
Equipped box cars
38 (All Code A, Except A_5_) 5,545 38
Plain gondola cars
39 (All Codes G & J, J__1, J__2,
J__3, J__4) 8,079 200 39
Equipped gondola cars
40 (All Code E) 5,236 40
Covered hopper cars
41 (C__1, C__2, C__3, C__4) 32,721 300 41
Open top hopper cars - general
42 service (All Code H) 5,445 142 42
Open top hopper cars - special
43 service (J__O), and All Code K) 5,385 43
Refrigerator cars - mechanical
44 (R_5,_, R_6_, R_7_, R_8_, R_9_) 994 44
Refrigerator cars - nonmechanical
45 (R_0_, R_1_, R_2_) 2,117 45
Flat cars - TOFC/COFC
46 (All Code P, Q, & S, Except Q8_) 6,043 493 135 46
Flat cars - multilevel
47 (All Code V) 701 47
Flat cars - general service
48 (F10_, F20_, F30_) 112 48
Flat cars - other
49 (F_1_, F_2_, F_3_, F_4_, F_5_, 49
F_6_, F_8_, F40_) 2,721 359
Tank cars - under 22,000 gal.
50 (T__0, T__1, T__2, T__3, T__4, 50
T__5) 111
Tank cars - 22,000 gal. and over
51 (T__6, T__7, T__8, T__9) 430 51
All other freight cars
52 (A_5_, F_7_, All Code L & Q8__) 68 52
53 TOTAL (Lines 36 to 52) 75,722 500 994 135 53
54 Caboose (All Code M-930) N/A 219 5455 TOTAL (Lines 53 and 54) 75,722 219 500 994 135 55
Railroad Annual Report R-1
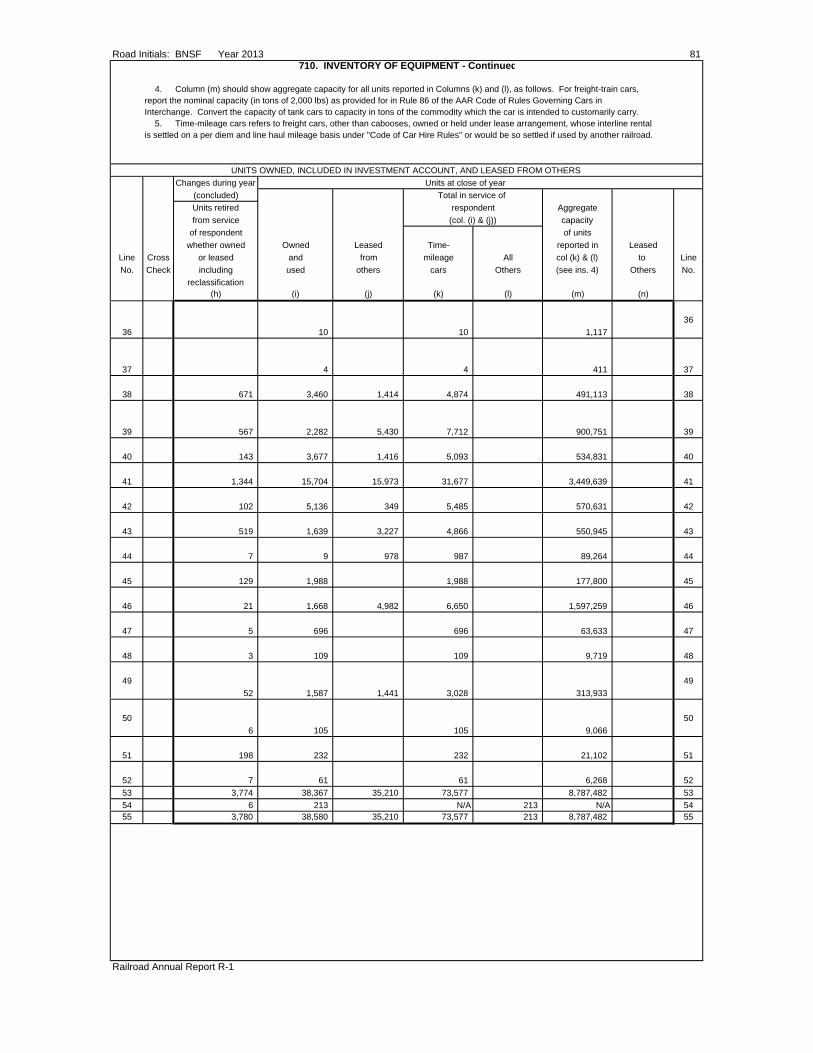
Road Initials: BNSF Year 2013 81710. INVENTORY OF EQUIPMENT - Continued
4. Column (m) should show aggregate capacity for all units reported in Columns (k) and (l), as follows. For freight-train cars,report the nominal capacity (in tons of 2,000 lbs) as provided for in Rule 86 of the AAR Code of Rules Governing Cars inInterchange. Convert the capacity of tank cars to capacity in tons of the commodity which the car is intended to customarily carry.
5. Time-mileage cars refers to freight cars, other than cabooses, owned or held under lease arrangement, whose interline rentalis settled on a per diem and line haul mileage basis under "Code of Car Hire Rules" or would be so settled if used by another railroad.
UNITS OWNED, INCLUDED IN INVESTMENT ACCOUNT, AND LEASED FROM OTHERS
Changes during year Units at close of year
(concluded) Total in service of
Units retired respondent Aggregate
from service (col. (i) & (j)) capacity
of respondent of units
whether owned Owned Leased Time- reported in Leased
Line Cross or leased and from mileage All col (k) & (l) to Line
No. Check including used others cars Others (see ins. 4) Others No.
reclassification(h) (i) (j) (k) (l) (m) (n)
36
36 10 10 1,117
37 4 4 411 37
38 671 3,460 1,414 4,874 491,113 38
39 567 2,282 5,430 7,712 900,751 39
40 143 3,677 1,416 5,093 534,831 40
41 1,344 15,704 15,973 31,677 3,449,639 41
42 102 5,136 349 5,485 570,631 42
43 519 1,639 3,227 4,866 550,945 43
44 7 9 978 987 89,264 44
45 129 1,988 1,988 177,800 45
46 21 1,668 4,982 6,650 1,597,259 46
47 5 696 696 63,633 47
48 3 109 109 9,719 48
49 49
52 1,587 1,441 3,028 313,933
50 50
6 105 105 9,066
51 198 232 232 21,102 51
52 7 61 61 6,268 52
53 3,774 38,367 35,210 73,577 8,787,482 53
54 6 213 N/A 213 N/A 5455 3,780 38,580 35,210 73,577 213 8,787,482 55
Railroad Annual Report R-1
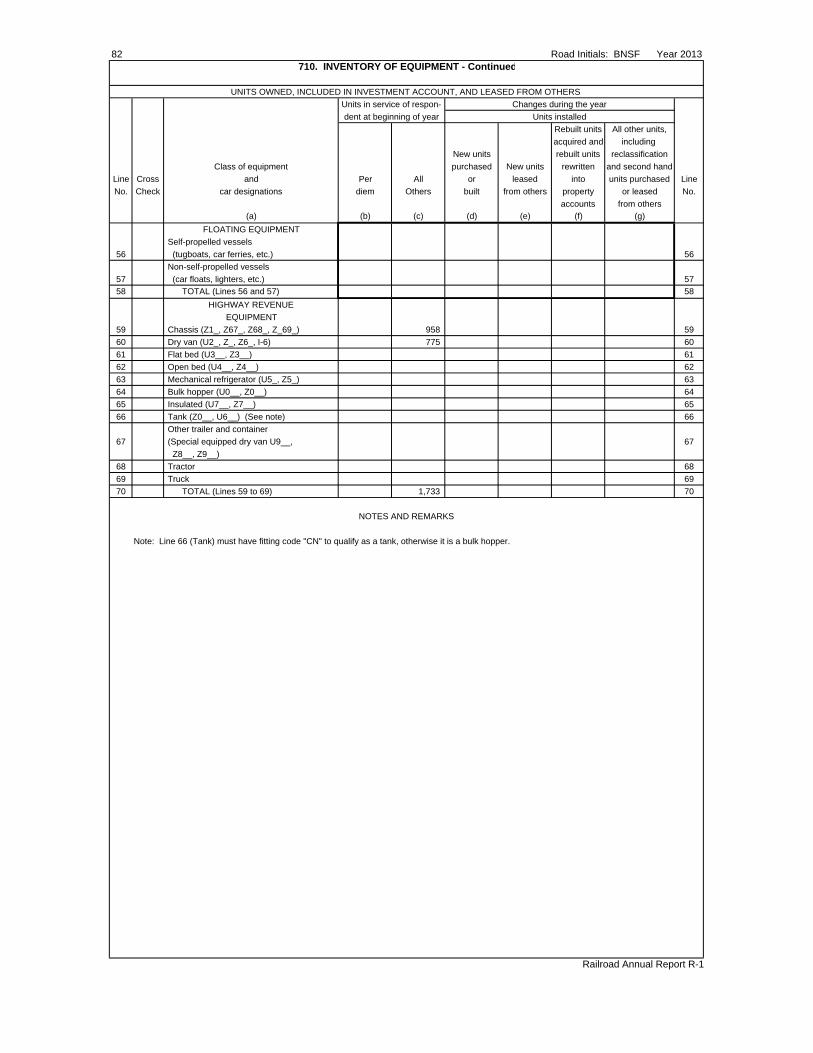
82 Road Initials: BNSF Year 2013710. INVENTORY OF EQUIPMENT - Continued
UNITS OWNED, INCLUDED IN INVESTMENT ACCOUNT, AND LEASED FROM OTHERS
Units in service of respon- Changes during the year
dent at beginning of year Units installed
Rebuilt units All other units,
acquired and including
New units rebuilt units reclassification
Class of equipment purchased New units rewritten and second hand
Line Cross and Per All or leased into units purchased Line
No. Check car designations diem Others built from others property or leased No.
accounts from others
(a) (b) (c) (d) (e) (f) (g)
FLOATING EQUIPMENT
Self-propelled vessels
56 (tugboats, car ferries, etc.) 56
Non-self-propelled vessels
57 (car floats, lighters, etc.) 57
58 TOTAL (Lines 56 and 57) 58
HIGHWAY REVENUE
EQUIPMENT
59 Chassis (Z1_, Z67_, Z68_, Z_69_) 958 59
60 Dry van (U2_, Z_, Z6_, I-6) 775 60
61 Flat bed (U3__, Z3__) 61
62 Open bed (U4__, Z4__) 62
63 Mechanical refrigerator (U5_, Z5_) 63
64 Bulk hopper (U0__, Z0__) 64
65 Insulated (U7__, Z7__) 65
66 Tank (Z0__, U6__) (See note) 66
Other trailer and container
67 (Special equipped dry van U9__, 67
Z8__, Z9__)
68 Tractor 68
69 Truck 69
70 TOTAL (Lines 59 to 69) 1,733 70
NOTES AND REMARKS
Note: Line 66 (Tank) must have fitting code "CN" to qualify as a tank, otherwise it is a bulk hopper.
Railroad Annual Report R-1
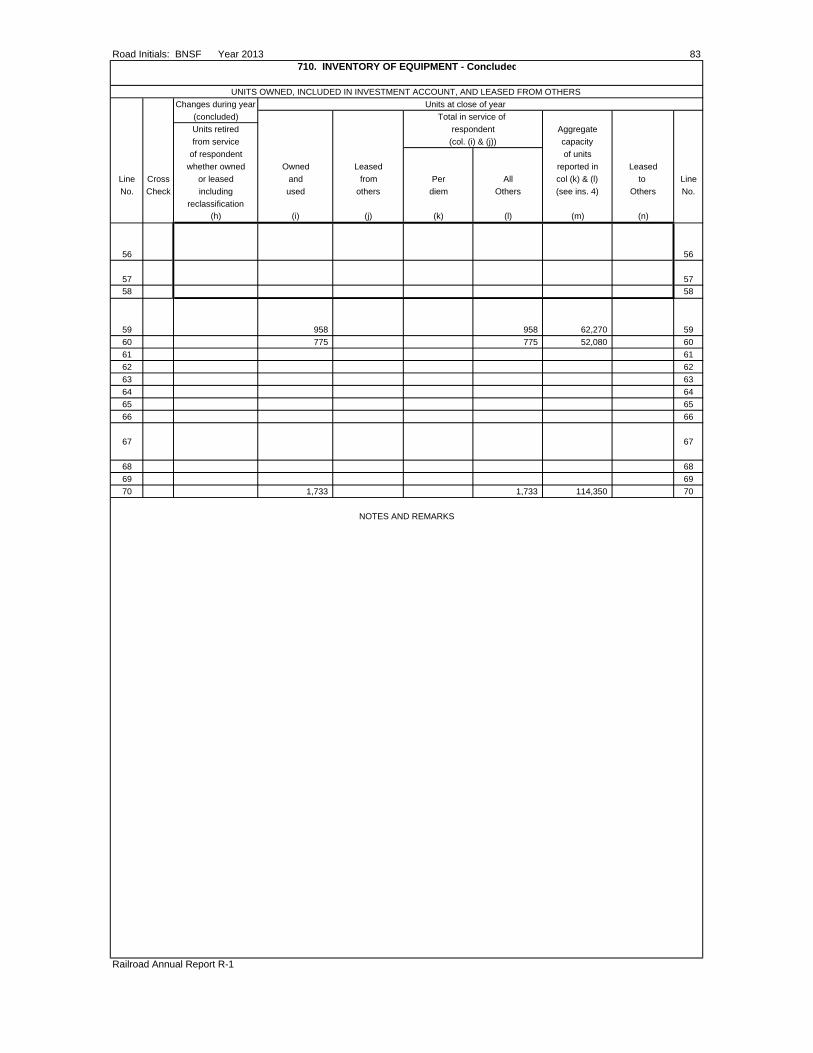
Road Initials: BNSF Year 2013 83710. INVENTORY OF EQUIPMENT - Concluded
UNITS OWNED, INCLUDED IN INVESTMENT ACCOUNT, AND LEASED FROM OTHERS
Changes during year Units at close of year
(concluded) Total in service of
Units retired respondent Aggregate
from service (col. (i) & (j)) capacity
of respondent of units
whether owned Owned Leased reported in Leased
Line Cross or leased and from Per All col (k) & (l) to Line
No. Check including used others diem Others (see ins. 4) Others No.
reclassification
(h) (i) (j) (k) (l) (m) (n)
56 56
57 57
58 58
59 958 958 62,270 59
60 775 775 52,080 60
61 61
62 62
63 63
64 64
65 65
66 66
67 67
68 68
69 69
70 1,733 1,733 114,350 70
NOTES AND REMARKS
Railroad Annual Report R-1
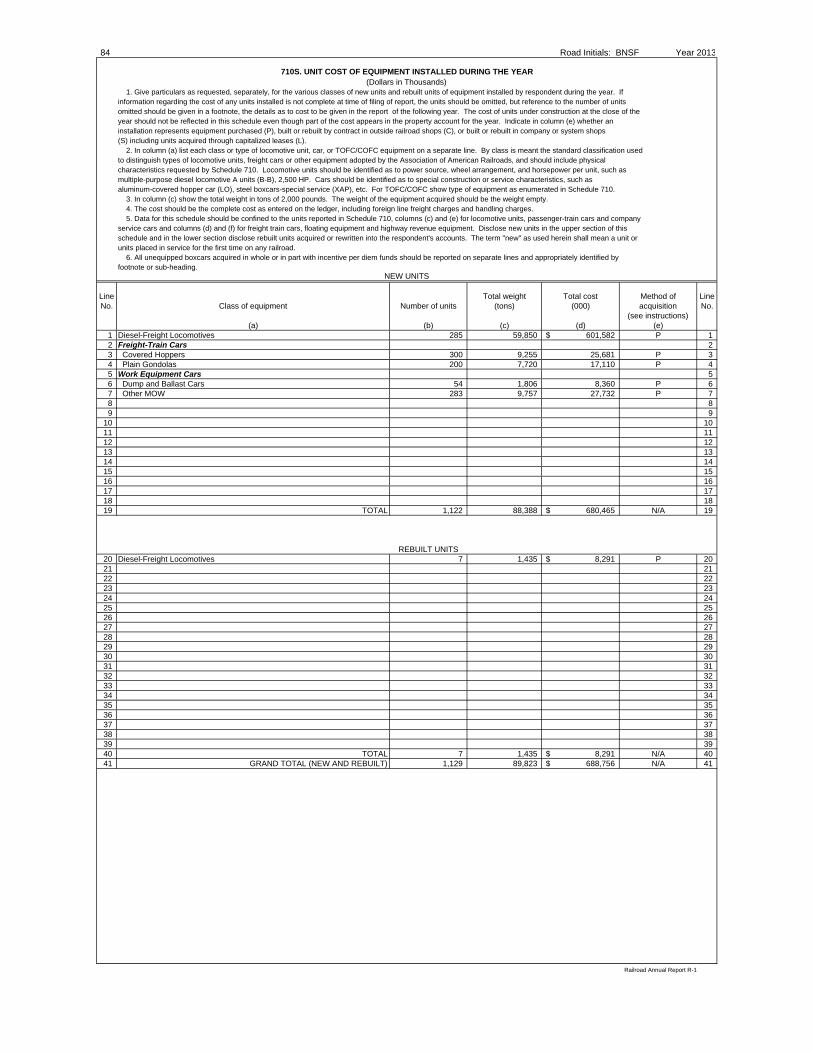
84 Road Initials: BNSF Year 2013
710S. UNIT COST OF EQUIPMENT INSTALLED DURING THE YEAR(Dollars in Thousands)
1. Give particulars as requested, separately, for the various classes of new units and rebuilt units of equipment installed by respondent during the year. Ifinformation regarding the cost of any units installed is not complete at time of filing of report, the units should be omitted, but reference to the number of unitsomitted should be given in a footnote, the details as to cost to be given in the report of the following year. The cost of units under construction at the close of theyear should not be reflected in this schedule even though part of the cost appears in the property account for the year. Indicate in column (e) whether aninstallation represents equipment purchased (P), built or rebuilt by contract in outside railroad shops (C), or built or rebuilt in company or system shops(S) including units acquired through capitalized leases (L). 2. In column (a) list each class or type of locomotive unit, car, or TOFC/COFC equipment on a separate line. By class is meant the standard classification usedto distinguish types of locomotive units, freight cars or other equipment adopted by the Association of American Railroads, and should include physicalcharacteristics requested by Schedule 710. Locomotive units should be identified as to power source, wheel arrangement, and horsepower per unit, such asmultiple-purpose diesel locomotive A units (B-B), 2,500 HP. Cars should be identified as to special construction or service characteristics, such asaluminum-covered hopper car (LO), steel boxcars-special service (XAP), etc. For TOFC/COFC show type of equipment as enumerated in Schedule 710. 3. In column (c) show the total weight in tons of 2,000 pounds. The weight of the equipment acquired should be the weight empty. 4. The cost should be the complete cost as entered on the ledger, including foreign line freight charges and handling charges. 5. Data for this schedule should be confined to the units reported in Schedule 710, columns (c) and (e) for locomotive units, passenger-train cars and companyservice cars and columns (d) and (f) for freight train cars, floating equipment and highway revenue equipment. Disclose new units in the upper section of thisschedule and in the lower section disclose rebuilt units acquired or rewritten into the respondent's accounts. The term "new" as used herein shall mean a unit orunits placed in service for the first time on any railroad. 6. All unequipped boxcars acquired in whole or in part with incentive per diem funds should be reported on separate lines and appropriately identified byfootnote or sub-heading.
Line Total weight Total cost Method of LineNo. Class of equipment Number of units (tons) (000) acquisition No.
(see instructions)(a) (b) (c) (d) (e)
1 Diesel-Freight Locomotives 285 59,850 601,582$ P 12 Freight-Train Cars 23 Covered Hoppers 300 9,255 25,681 P 34 Plain Gondolas 200 7,720 17,110 P 45 Work Equipment Cars 56 Dump and Ballast Cars 54 1,806 8,360 P 67 Other MOW 283 9,757 27,732 P 78 89 9
10 1011 1112 1213 1314 1415 1516 1617 1718 1819 TOTAL 1,122 88,388 680,465$ N/A 19
REBUILT UNITS20 Diesel-Freight Locomotives 7 1,435 8,291$ P 2021 2122 2223 2324 2425 2526 2627 2728 2829 2930 3031 3132 3233 3334 3435 3536 3637 3738 3839 3940 TOTAL 7 1,435 8,291$ N/A 4041 GRAND TOTAL (NEW AND REBUILT) 1,129 89,823 688,756$ N/A 41
Railroad Annual Report R-1
NEW UNITS
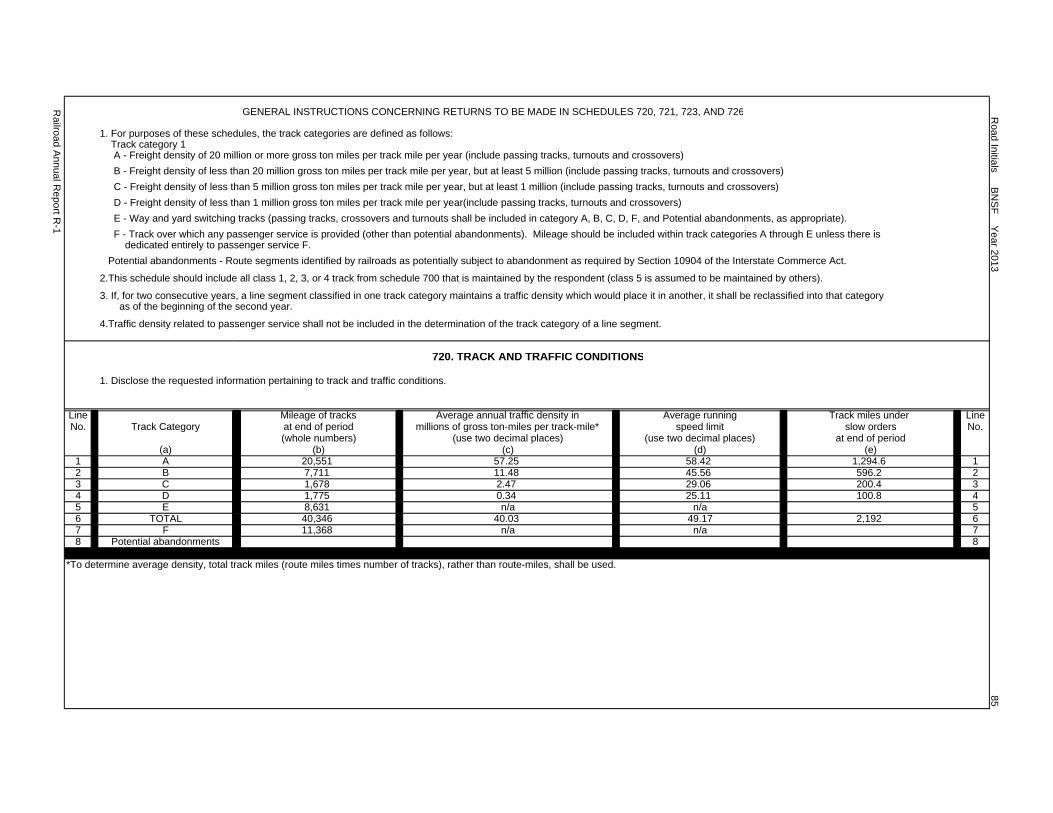
GENERAL INSTRUCTIONS CONCERNING RETURNS TO BE MADE IN SCHEDULES 720, 721, 723, AND 726
1. For purposes of these schedules, the track categories are defined as follows: Track category 1 A - Freight density of 20 million or more gross ton miles per track mile per year (include passing tracks, turnouts and crossovers)
B - Freight density of less than 20 million gross ton miles per track mile per year, but at least 5 million (include passing tracks, turnouts and crossovers)
C - Freight density of less than 5 million gross ton miles per track mile per year, but at least 1 million (include passing tracks, turnouts and crossovers)
D - Freight density of less than 1 million gross ton miles per track mile per year(include passing tracks, turnouts and crossovers)
E - Way and yard switching tracks (passing tracks, crossovers and turnouts shall be included in category A, B, C, D, F, and Potential abandonments, as appropriate).
F - Track over which any passenger service is provided (other than potential abandonments). Mileage should be included within track categories A through E unless there is dedicated entirely to passenger service F.
Potential abandonments - Route segments identified by railroads as potentially subject to abandonment as required by Section 10904 of the Interstate Commerce Act.
2.This schedule should include all class 1, 2, 3, or 4 track from schedule 700 that is maintained by the respondent (class 5 is assumed to be maintained by others).
3. If, for two consecutive years, a line segment classified in one track category maintains a traffic density which would place it in another, it shall be reclassified into that category as of the beginning of the second year.
4.Traffic density related to passenger service shall not be included in the determination of the track category of a line segment.
720. TRACK AND TRAFFIC CONDITIONS
1. Disclose the requested information pertaining to track and traffic conditions.
Line Mileage of tracks Average annual traffic density in Average running Track miles under LineNo. Track Category at end of period millions of gross ton-miles per track-mile* speed limit slow orders No.
(whole numbers) (use two decimal places) (use two decimal places) at end of period(a) (b) (c) (d) (e)
1 A 20,551 57.25 58.42 1,294.6 12 B 7,711 11.48 45.56 596.2 23 C 1,678 2.47 29.06 200.4 34 D 1,775 0.34 25.11 100.8 45 E 8,631 n/a n/a 56 TOTAL 40,346 40.03 49.17 2,192 67 F 11,368 n/a n/a 78 Potential abandonments 8
*To determine average density, total track miles (route miles times number of tracks), rather than route-miles, shall be used.
Road Initials B
NS
F Y
ear 201385
Railroad A
nnual Report R
-1
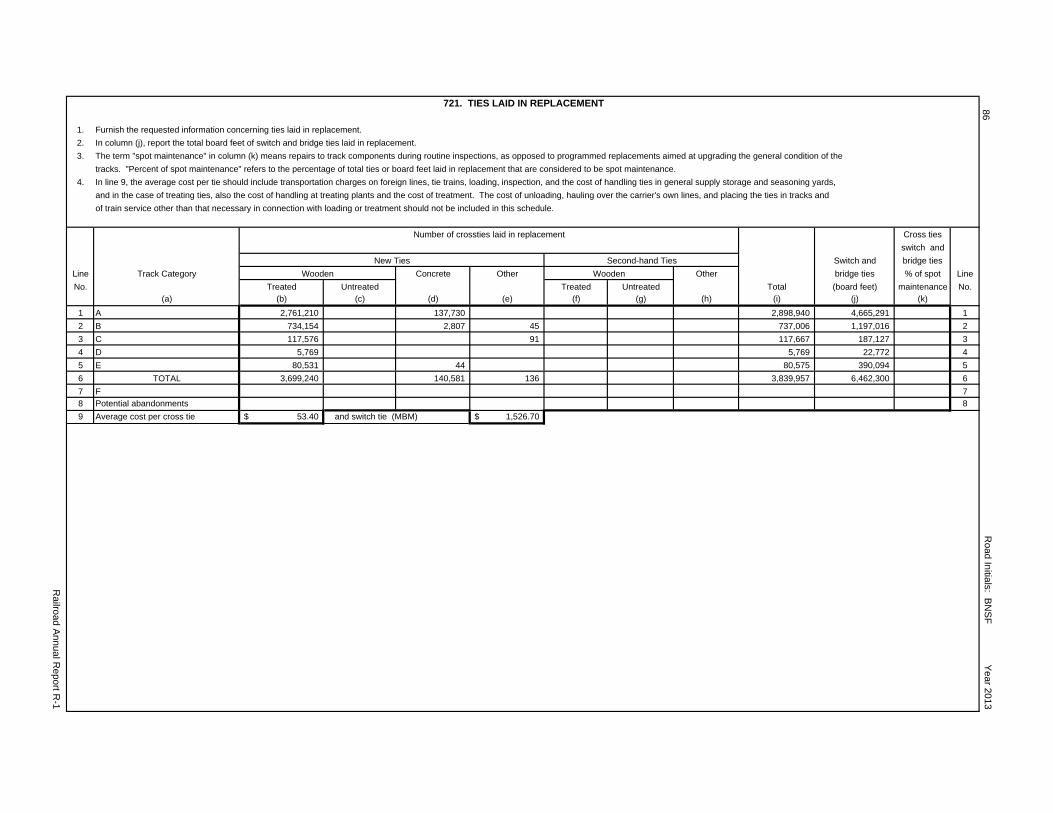
721. TIES LAID IN REPLACEMENT
1. Furnish the requested information concerning ties laid in replacement.
2. In column (j), report the total board feet of switch and bridge ties laid in replacement.
3. The term "spot maintenance" in column (k) means repairs to track components during routine inspections, as opposed to programmed replacements aimed at upgrading the general condition of the
tracks. "Percent of spot maintenance" refers to the percentage of total ties or board feet laid in replacement that are considered to be spot maintenance.
4. In line 9, the average cost per tie should include transportation charges on foreign lines, tie trains, loading, inspection, and the cost of handling ties in general supply storage and seasoning yards,
and in the case of treating ties, also the cost of handling at treating plants and the cost of treatment. The cost of unloading, hauling over the carrier's own lines, and placing the ties in tracks and
of train service other than that necessary in connection with loading or treatment should not be included in this schedule.
Number of crossties laid in replacement Cross ties
switch and
New Ties Second-hand Ties Switch and bridge ties
Line Track Category Wooden Concrete Other Wooden Other bridge ties % of spot Line
No. Treated Untreated Treated Untreated Total (board feet) maintenance No.(a) (b) (c) (d) (e) (f) (g) (h) (i) (j) (k)
1 A 2,761,210 137,730 2,898,940 4,665,291 1
2 B 734,154 2,807 45 737,006 1,197,016 2
3 C 117,576 91 117,667 187,127 3
4 D 5,769 5,769 22,772 4
5 E 80,531 44 80,575 390,094 5
6 TOTAL 3,699,240 140,581 136 3,839,957 6,462,300 6
7 F 78 Potential abandonments 8
9 Average cost per cross tie 53.40$ and switch tie (MBM) 1,526.70$
86
Railroad A
nnual Report R
-1
Road Initials: B
NS
F Y
ear 2013
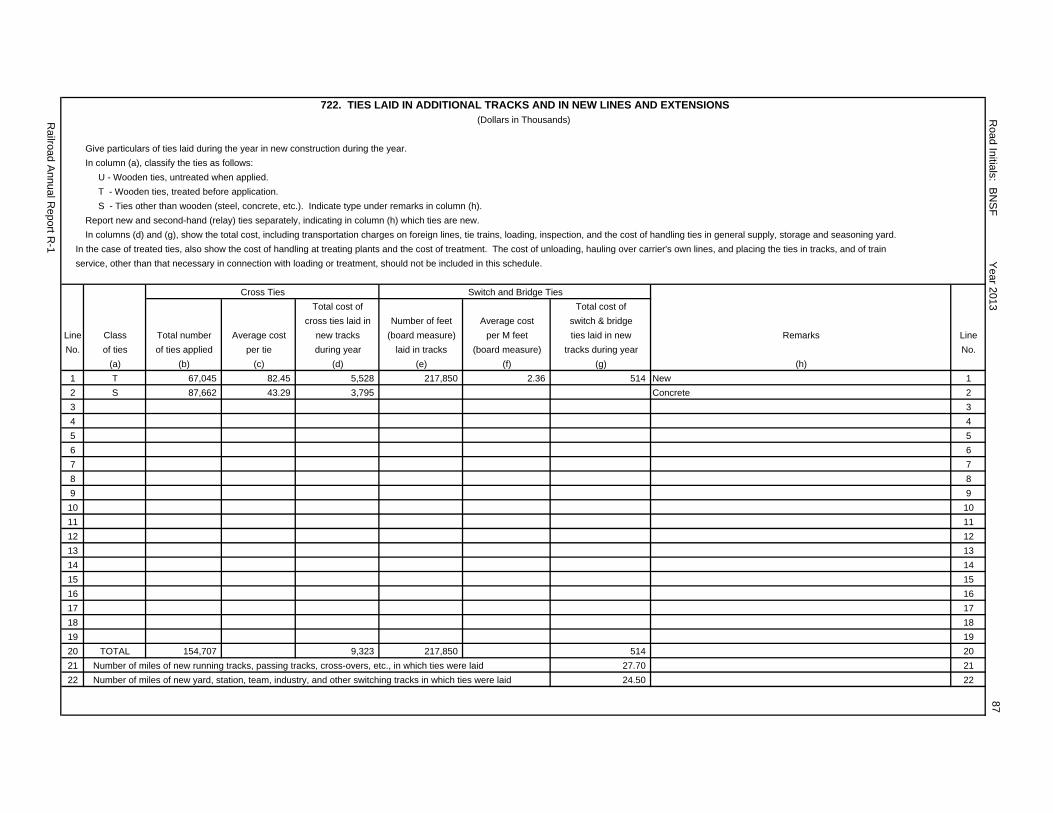
722. TIES LAID IN ADDITIONAL TRACKS AND IN NEW LINES AND EXTENSIONS(Dollars in Thousands)
Give particulars of ties laid during the year in new construction during the year.
In column (a), classify the ties as follows:
U - Wooden ties, untreated when applied.
T - Wooden ties, treated before application.
S - Ties other than wooden (steel, concrete, etc.). Indicate type under remarks in column (h).
Report new and second-hand (relay) ties separately, indicating in column (h) which ties are new.
In columns (d) and (g), show the total cost, including transportation charges on foreign lines, tie trains, loading, inspection, and the cost of handling ties in general supply, storage and seasoning yard.
In the case of treated ties, also show the cost of handling at treating plants and the cost of treatment. The cost of unloading, hauling over carrier's own lines, and placing the ties in tracks, and of train
service, other than that necessary in connection with loading or treatment, should not be included in this schedule.
Cross Ties Switch and Bridge Ties
Total cost of Total cost of
cross ties laid in Number of feet Average cost switch & bridge
Line Class Total number Average cost new tracks (board measure) per M feet ties laid in new Remarks Line
No. of ties of ties applied per tie during year laid in tracks (board measure) tracks during year No.
(a) (b) (c) (d) (e) (f) (g) (h)
1 T 67,045 82.45 5,528 217,850 2.36 514 New 1
2 S 87,662 43.29 3,795 Concrete 2
3 3
4 4
5 5
6 6
7 7
8 8
9 9
10 10
11 11
12 12
13 13
14 14
15 15
16 16
17 17
18 18
19 19
20 TOTAL 154,707 9,323 217,850 514 20
21 Number of miles of new running tracks, passing tracks, cross-overs, etc., in which ties were laid 27.70 21
22 Number of miles of new yard, station, team, industry, and other switching tracks in which ties were laid 24.50 22
Railroad A
nnual Report R
-1
Road Initials: B
NS
F Y
ear 201387
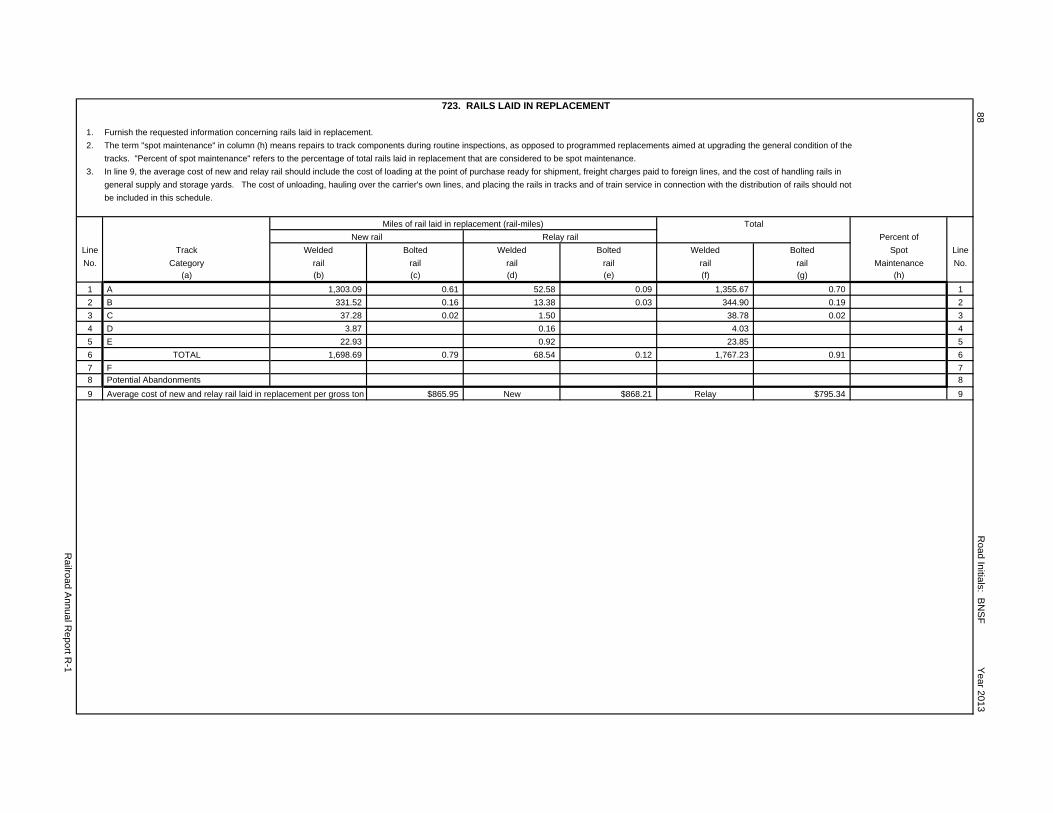
723. RAILS LAID IN REPLACEMENT
1. Furnish the requested information concerning rails laid in replacement.
2. The term "spot maintenance" in column (h) means repairs to track components during routine inspections, as opposed to programmed replacements aimed at upgrading the general condition of the
tracks. "Percent of spot maintenance" refers to the percentage of total rails laid in replacement that are considered to be spot maintenance.
3. In line 9, the average cost of new and relay rail should include the cost of loading at the point of purchase ready for shipment, freight charges paid to foreign lines, and the cost of handling rails in
general supply and storage yards. The cost of unloading, hauling over the carrier's own lines, and placing the rails in tracks and of train service in connection with the distribution of rails should not
be included in this schedule.
Miles of rail laid in replacement (rail-miles) Total
New rail Relay rail Percent of
Line Track Welded Bolted Welded Bolted Welded Bolted Spot Line
No. Category rail rail rail rail rail rail Maintenance No.(a) (b) (c) (d) (e) (f) (g) (h)
1 A 1,303.09 0.61 52.58 0.09 1,355.67 0.70 1
2 B 331.52 0.16 13.38 0.03 344.90 0.19 2
3 C 37.28 0.02 1.50 38.78 0.02 3
4 D 3.87 0.16 4.03 4
5 E 22.93 0.92 23.85 5
6 TOTAL 1,698.69 0.79 68.54 0.12 1,767.23 0.91 6
7 F 78 Potential Abandonments 8
9 Average cost of new and relay rail laid in replacement per gross ton $865.95 New $868.21 Relay $795.34 9
88R
oad Initials: BN
SF
Year 2013
Railroad A
nnual Report R
-1
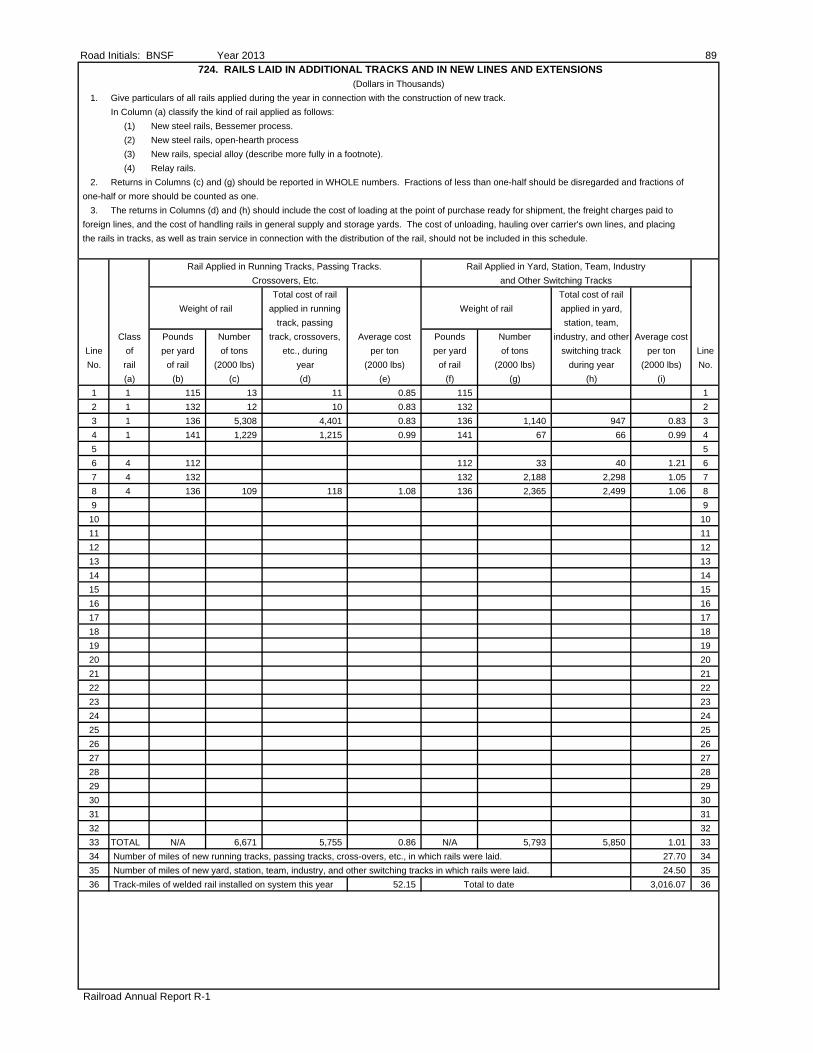
Road Initials: BNSF Year 2013 89724. RAILS LAID IN ADDITIONAL TRACKS AND IN NEW LINES AND EXTENSIONS
(Dollars in Thousands)
1. Give particulars of all rails applied during the year in connection with the construction of new track.
In Column (a) classify the kind of rail applied as follows:
(1) New steel rails, Bessemer process.
(2) New steel rails, open-hearth process
(3) New rails, special alloy (describe more fully in a footnote).
(4) Relay rails.
2. Returns in Columns (c) and (g) should be reported in WHOLE numbers. Fractions of less than one-half should be disregarded and fractions of
one-half or more should be counted as one.
3. The returns in Columns (d) and (h) should include the cost of loading at the point of purchase ready for shipment, the freight charges paid to
foreign lines, and the cost of handling rails in general supply and storage yards. The cost of unloading, hauling over carrier's own lines, and placing
the rails in tracks, as well as train service in connection with the distribution of the rail, should not be included in this schedule.
Rail Applied in Running Tracks, Passing Tracks. Rail Applied in Yard, Station, Team, Industry
Crossovers, Etc. and Other Switching Tracks
Total cost of rail Total cost of rail
Weight of rail applied in running Weight of rail applied in yard,
track, passing station, team,
Class Pounds Number track, crossovers, Average cost Pounds Number industry, and other Average cost
Line of per yard of tons etc., during per ton per yard of tons switching track per ton Line
No. rail of rail (2000 lbs) year (2000 lbs) of rail (2000 lbs) during year (2000 lbs) No.
(a) (b) (c) (d) (e) (f) (g) (h) (i)
1 1 115 13 11 0.85 115 1
2 1 132 12 10 0.83 132 2
3 1 136 5,308 4,401 0.83 136 1,140 947 0.83 3
4 1 141 1,229 1,215 0.99 141 67 66 0.99 4
5 5
6 4 112 112 33 40 1.21 6
7 4 132 132 2,188 2,298 1.05 7
8 4 136 109 118 1.08 136 2,365 2,499 1.06 8
9 9
10 10
11 11
12 12
13 13
14 14
15 15
16 16
17 17
18 18
19 19
20 20
21 21
22 22
23 23
24 24
25 25
26 26
27 27
28 28
29 29
30 30
31 31
32 32
33 TOTAL N/A 6,671 5,755 0.86 N/A 5,793 5,850 1.01 33
34 Number of miles of new running tracks, passing tracks, cross-overs, etc., in which rails were laid. 27.70 34
35 Number of miles of new yard, station, team, industry, and other switching tracks in which rails were laid. 24.50 35
36 Track-miles of welded rail installed on system this year 52.15 Total to date 3,016.07 36
Railroad Annual Report R-1
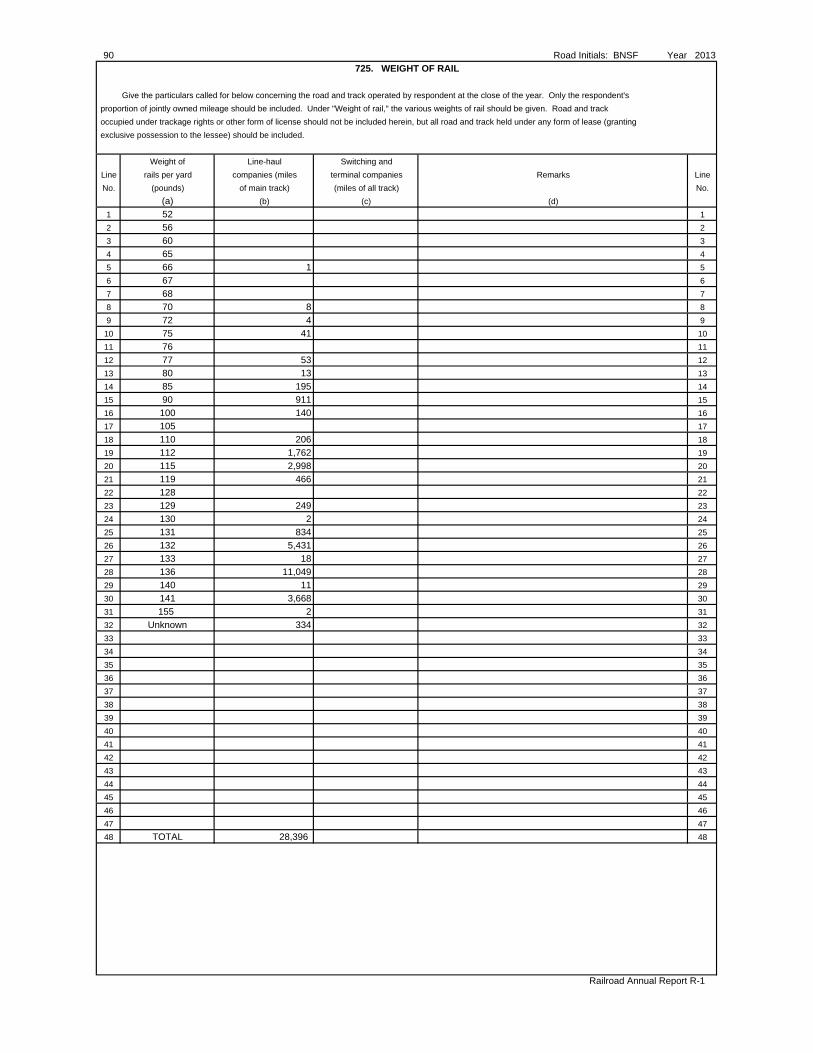
90 Road Initials: BNSF Year 2013
725. WEIGHT OF RAIL
Give the particulars called for below concerning the road and track operated by respondent at the close of the year. Only the respondent's
proportion of jointly owned mileage should be included. Under "Weight of rail," the various weights of rail should be given. Road and track
occupied under trackage rights or other form of license should not be included herein, but all road and track held under any form of lease (granting
exclusive possession to the lessee) should be included.
Weight of Line-haul Switching and
Line rails per yard companies (miles terminal companies Remarks Line
No. (pounds) of main track) (miles of all track) No.
(a) (b) (c) (d)
1 52 1
2 56 2
3 60 3
4 65 4
5 66 1 5
6 67 6
7 68 7
8 70 8 8
9 72 4 9
10 75 41 10
11 76 11
12 77 53 12
13 80 13 13
14 85 195 14
15 90 911 15
16 100 140 16
17 105 17
18 110 206 18
19 112 1,762 19
20 115 2,998 20
21 119 466 21
22 128 22
23 129 249 23
24 130 2 24
25 131 834 25
26 132 5,431 26
27 133 18 27
28 136 11,049 28
29 140 11 29
30 141 3,668 30
31 155 2 31
32 Unknown 334 32
33 33
34 34
35 35
36 36
37 37
38 38
39 39
40 40
41 41
42 42
43 43
44 44
45 45
46 46
47 47
48 TOTAL 28,396 48
Railroad Annual Report R-1
726. SUMMARY OF TRACK REPLACEMENTS
1. Furnish the requested information concerning the summary of track replacements.
2. In columns (d), (e), (g), and (j), give the percentage of replacements to units of property in each track category at year end.
Ties Rail Ballast Track Surfacing
Number of ties replaced Percent replaced
Switch and Switch and Miles of rail Cubic yards
Line Track Crossties bridge ties Crossties bridge ties replaced Percent of ballast Percent Line
No. Category (board feet) (board feet) (rail-miles) Replaced placed surfaced No.
(a) (b) (c) (d) (e) (f) (g) (h) (j)
1 A 2,898,940 4,665,291 4.44% N/A 1,356.37 3.30% 2,010,764 16,413 79.86% 1
2 B 737,006 1,197,016 3.01% N/A 345.09 2.24% 55,505 453 5.87% 2
3 C 117,667 187,127 2.20% N/A 38.80 1.16% 6,578 54 3.22% 3
4 D 5,769 22,772 0.10% N/A 4.03 0.11% 2,098 17 0.96% 4
5 E 80,575 390,094 0.29% N/A 23.85 0.14% 4,858 40 0.46% 5
6 TOTAL 3,839,957 6,462,300 2.99% N/A 1,768.14 2.19% 2,079,803 16,977 42.08% 6
7 F N/A 7
8 Potential abandonments N/A 8
750. CONSUMPTION OF DIESEL FUEL(Dollars in Thousands)
LOCOMOTIVES
Line Kind of locomotive service Diesel oil (gallons) Line
No. (a) (b) No.
1 Freight 1,328,531,642 1
2 Passenger 2
3 Yard Switching 50,109,515 3
4 TOTAL 1,378,641,157 4
5 COST OF FUEL $(000)* 4,318,571$ 5
6 Work Train 947,703 6
*Show cost of fuel charged to train and yard service (function 67-Loco. Fuels). The cost stated for diesel fuel should be the total charges in the accounts specified, including freight charges and handling
expenses. Fuel consumed by mixed and special trains that are predominantly freight should be included in freight service, but where the service of mixed or special trains is predominantly passenger, the
fuel should be included in passenger service. 91
Railroad A
nnual Report R
-1
Road Initials: B
NS
F Y
ear 2013
Miles
surfaced
(i)
92 Road Initials: BNSF Year 2008INSTRUCTIONS CONCERNING RETURNS TO BE MADE IN SCHEDULE 755
Unit Train, Way Train, and Through Train data under items 2, 3, 4, 6, and 12 shall be obtained from conductor's wheel reports (freight)or similar reports. Unit train service is a specialized scheduled shuttle type service in equipment (railroad or privately owned) dedicatedto such service, moving between origin and destination. The applicable tariffs and/or contracts generally require that a specific minimumtonnage or quantity of carloads be tendered as a unit for shipment on one bill of lading or other shipping document in a solid train formovement between origin and destination. Such tariffs and/or contracts generally contain restricted detention provisions and aresubject to time-volume requirements which reflect the approximate capacity of the unit trains for the stated period. Way trains aredefined as trains operated primarily to gather and distribute cars in road service and move them between way stations or way points.Through trains are those trains operated between two or more major concentration or distribution points. Do not include unit trainstatistics in way or through train statistics. A work train is a train operated solely or preponderantly for the purpose of transportingcompany freight, work equipment, or company employees. Statistics for work trains should be reported under Item 11, only. Statisticsrelated to company equipment, company employees, and company freight moving in transportation trains are not to be reported inItem 11, but are to be reported in Items 4-17, 6-04, 7-02, 8-04, and 8-05, as instructed in notes I, K, and L.
(A) Report miles of road operated at close of year, excluding industrial tracks, yard tracks, and sidings.
(B) A train-mile is a movement of a train a distance of one mile. In computing train-miles, fractions representing less that one-halfmile shall be disregarded and other fractions shall be considered as one mile. Train Miles-Running shall be based on the actual distancerun between terminals and/or stations and shall be computed from the official time tables or distance tables. Train-Miles shall not beincreased to cover the running of locomotives from shops to terminals, doubling hills, switching, or other work at way stations, or for theservice of helper or pusher locomotives or of extra locomotives on double-head or triple-head trains. When the carrier's trains aredetoured over foreign roads, the miles shall be computed on the basis of the miles actually run and in accordance with the serviceperformed. Train-miles shall be kept separately for trains hauled by locomotives and trains moved by motorcars.
(C) A motorcar is a self-propelled unit of equipment designed to carry freight or passengers, and is not considered a locomotive.
(D) A locomotive is a self-propelled unit of equipment designed solely for moving other equipment. A locomotive unit-mile is a movement of a locomotive unit a distance of one mile under its own power. Include miles made by all locomotive units. Exclude milesmade by motorcars. Miles of locomotives in helper service shall be computed on the basis of actual distance run in such service.
(E) All locomotive unit-miles in road service shall be based on the actual distance run between terminals and/or stations. Followinstruction (B) regarding fractions and official time tables for computing locomotive miles.
(F) Train switching locomotive-miles shall be computed at the rate of six miles per hour for the time actually engaged in suchservice. Include miles allowed for train locomotives for performing switching service at terminals and way stations.
(G) Yard switching locomotive-miles shall be computed at the rate of six miles per hour for the time actually engaged in yardswitching service. Include miles allowed for yard locomotives for switching service in yards where regular switching service ismaintained and in terminal switching and transfer service.
(H) A car-mile is a movement of a unit of car equipment a distance of one mile. Use car designations shown in Schedule 710. UnderRailroad Owned and Leased Cars, items 4-01 and 4-11, report both foreign cars and respondent's own cars while on the line of therespondent railroad. In Items 4-13 and 4-15, report private-line cars and shipper owned cars. Loaded and empty miles should bereported whether or not the railroad reimbursed the owner on a loaded and/or empty mile basis. Report miles made by flatcarscarrying empty highway trailers that are not moving under revenue billigs as empty freight cars-miles. Do not report miles made bymotorcars or business cars.
(I) Exclude from Items 4-01, 4-11, 4-13, and 4-5, car-miles of work equipment, cars carrying company freight, and non-revenueprivate line cars moving in transportation trains. Include such car-miles in Items 4-17, 4-18, and 4-19. If private line cars move in revenueservice, yhe loaded and empty miles should not be considered n0-payment or non-revenue car-miles.
(J) Report miles actually run by passenger-train cars in transportation service. Passenger-train car-miles include miles run by coachesand cars in which passengers are carried at regular tariff fares without extra charge for space occupied; miles run by combinationpassenger and baggage, passenger and mail, passenger and express; miles run by sleeping, parlor, and other cars for which an extrafare is charged; miles run by dining, cafe, and other cars devoted exclusively to the serving of meals and other refreshments and by club, lounge, and observation cars; and miles run by other passenger-train cars where services are combined, such as baggage, express,and mail.
(K) From conductor's or dispatcher's train reports or other appropriate sources, compute weight in tons (2,000 pounds). Item 6-01includes weight of all locomotive units moved one mile in transportation trains. Ton-miles of motorcars should be excluded. Items 6-02and 6-03 represent tons behind locomotive units (cars and contents, cabooses) moved one mile in transportation trains (excluding non-revenue gross ton-miles). Nonrevenue gross ton-miles in transportation trains include work equipment and cars carrying companyfreight and their contents. Use 150 pounds as the average weight per passenger and four tons as the average weight of contents of each head-end car.
(L) From conductor's train reports or other appropriate sources, compute ton-miles of freight. Ton-miles represent the number of tonsof revenue and nonrevenue freight moved one mile in a transportation train. Include net ton-miles in motorcar trains. Exclude l.c.l.shipment of freight handled in mixed baggage express cars. Total ton-miles of revenue freight should correspond to the ton-milesreported on Form CBS.
Railroad Annual Report R-1
Road Initials: BNSF Year 2008 93INSTRUCTIONS CONCERNING RETURNS TO BE MADE IN SCHEDULE 755 - (Concluded)
(M) Road service represents elapse time of transportation trains (both ordinary and light) between the time of leaving the initialterminals and the time at final terminals, including trains switching at way stations and delays on road as shown by conductor's ordispatcher's train reports. Include time of motorcar service performed by train locomotives at terminals and way stations. Report inItem 9-02, train switching hours included in Item 9-01. Train switching is the time spent by the train while performing switching serviceat terminals and way stations where no regular yard service is maintained. A train hour is independent of the number of locomotivesin the train.
(N) Yard switching hours are hours expended in switching service performed by yard crews in yards where regular switching service ismaintained, including switching and transfer service in connection with the transportation of revenue and incidentally of company freight. Hours in yard switching are independent of the number of locomotives used.
(O) Work-train miles include the miles run by trains engaged in company service such as official inspection; inspection trains for railway commissioners for which no revenue is received; trains running special with fire apparatus to save carrier's property fromdestruction: trains run for transporting the carrier's employees to and from work when no transportation charge is made; wrecking trainsrun solely for the purpose of transporting company material; trains run for distributing material and supplies for use in connection withoperations; and all other trains used in work-train services. Exclude miles run by locomotives while engaged incidentally in switchingcompany materials in company shops or material yards in connection with regular yard switching service or in switching equipment forrepairs between yards and shops.
(P) The number of loaded freight cars shall be obtained from the conductors' wheel report and shall be the sum of all loaded carshandled by each train. For example, if a car moves loaded (1) in a way train from the origination points, (2) in two through trains, and (3) ina way-train to the destination point, the total count of loaded cars would be four: two counts for the movements in the way trains and twocounts for the movements in through trains. Therefore, each car originated or received from a connecting carrier receives an initialcount, plus one count for each subsequent physical transfer between trains on respondent's lines. No additional count is given becauseof crew change or changes in track identification number unless there is a physical transfer of the car between trains. Each car movingunder revenue billing shall be considered as a loaded car.
(Q) Report vehicles (TOFC trailers/containers, automobiles and trucks) loaded and unloaded to and from TOFC and multiple levelfreight cars when the work is performed at the railroad's expense.
(R) Report the number of loaded revenue trailers/containers picked up, plus revenue trailers/containers delivered in TOFC/COFC andin highway interchange service, when the work is performed at the railroad's expense. (Performed at railroad's expense means thatrailroad employees perform the service or that the railroad hires a subsidiary or outside contractor to perform the service.) Do not includethose trailers/containers which are picked up or delivered by a shipper or motor carrier, etc. when a tariff provision requires that theshipper or motor carrier, etc., and not the railroad, perform that service. Note: The count should reflect the trailers/containers for which expenses are reported in Schedule 417, line 2, column (b).
(S) Report under Marine Terminals, Item 16, the tons loaded onto and unloaded from marine vessels at the expense of the reportingrailroad.
(T) Report the total number of foreign railroad cars on line at the end of the year (except surplus cars, see below). Foreign railroadcars refers to freight cars owned by other railroads whose interline rental is settled on time (by hour) and actual line-haul mileagecharges under the Code of Car Hire Rules.
Carriers will be governed by local conditions in determining whether a car at an interchange point should be considered "on-line."Unserviceable cars include cars on repair tracks undergoing or awaiting repairs. They include cars on repair tracks repaired andawaiting switching, cars on repair tracks undergoing or awaiting repairs switching, cars awaiting movement to repair tracks held in trainyards (excluding cars which are to be repaired in the train yard without loss of time), cars moving empty in trains en route to shop, andcars stored awaiting disposition.
Surplus cars are cars which are in serviceable condition for loading on the last day of the year, but have not been placed forloading within 48 hours. This count can be an annual average based on weekly count of cars that have not been placed for loadingwithin 48 hours.
(U) Flat-TOFC/COFC Car-miles reported in lines 25 (4-020), 41 (4-120), 57 (4-140), and 75 (4-160) will be computed using cars rather thanconstructed container platforms. For example, an articulated car consisting of five platforms moved one mile will be counted as one car-mile,not five car-miles.
(V) The intermodal Load Factor reported on Line 134 will be calculated for the average number of intermodal (TOFC/COFC) units loadedon the average intermodal car. Units are to be calculated in the same manner as Line 123 (13 TOFC/COFC - No. of Revenue Trailers &Containers Loaded and Unloaded (Q)). Intermodal cars will be calculated in accordance with instruction U for reporting Flat-TOFC/COFCCar-miles. Both intermodal (TOFC/COFC) units and intermodal cars are to be calculated using actual units and not constructed intermodal(TOFC/COFC) units or cars.
Railroad Annual Report R-1
94 Road Initials: BNSF Year 2013
755. RAILROAD OPERATING STATISTICS
Line Cross Item Description Freight Passenger Line
No. Check Train Train No.
(a) (b) (c)
1 1 Miles of Road Operated (A) 32,595 1
2 Train Miles - Running (B)
2 2-01 Unit Trains 58,749,279 XXXXXX 2
3 2-02 Way Trains 5,618,601 XXXXXX 3
4 2-03 Through Trains 102,897,715 4
5 2-04 TOTAL TRAIN MILES (Lines 2-4) 167,265,595 5
6 2-05 Motorcars (C) 6
7 2-07 TOTAL ALL TRAINS (Lines 5 and 6) 167,265,595 7
3 Locomotive Unit Miles (D)
Road Service (E)
8 3-01 Unit Trains 187,548,929 XXXXXX 8
9 3-02 Way Trains 12,222,593 XXXXXX 9
10 3-03 Through Trains 323,046,668 10
11 3-04 TOTAL (Lines 8-10) 522,818,190 11
12 3-11 Train Switching (F) 4,975,198 XXXXXX 12
13 3-21 Yard Switching (G) 14,744,442 13
14 3-31 TOTAL ALL SERVICES (Lines 11-13) 542,537,830 14
4 Freight Car-Miles (thousands) (H)
4-01 RR Owned and Leased Cars - Loaded
15 4-010 Box-Plain 40-Foot XXXXXX 15
16 4-011 Box-Plain 50-Foot and Longer 8,048 XXXXXX 16
17 4-012 Box-Equipped 144,260 XXXXXX 17
18 4-013 Gondola-Plain 285,305 XXXXXX 18
19 4-014 Gondola-Equipped 64,774 XXXXXX 19
20 4-015 Hopper-Covered 603,148 XXXXXX 20
21 4-016 Hopper-Open Top-General Service 48,200 XXXXXX 21
22 4-017 Hopper-Open Top-Special Service 120,946 XXXXXX 22
23 4-018 Refrigerator-Mechanical 16,060 XXXXXX 23
24 4-019 Refrigerator-Non-Mechanical 31,126 XXXXXX 24
25 4-020 Flat-TOFC/COFC 631,927 XXXXXX 25
26 4-021 Flat-Multi-Level 62,082 XXXXXX 26
27 4-022 Flat-General Service 337 XXXXXX 27
28 4-023 Flat-All Other 80,004 XXXXXX 28
29 4-024 All Other Car Types-Total 19,673 XXXXXX 29
30 4-025 TOTAL (Lines 15-29) 2,115,890 XXXXXX 30
Railroad Annual Report R-1
Road Initials: BNSF Year 2013 95
755. RAILROAD OPERATING STATISTICS - (Continued)
Line Cross Item Description Freight Passenger Line
No. Check Train Train No.
(a) (b) (c)
4-11 RR Owned and Leased Cars - Empty
31 4-110 Box-Plain 40-Foot XXXXXX 31
32 4-111 Box-Plain 50-Foot and Longer 6,036 XXXXXX 32
33 4-112 Box-Equipped 113,678 XXXXXX 33
34 4-113 Gondola-Plain 243,900 XXXXXX 34
35 4-114 Gondola-Equipped 64,467 XXXXXX 35
36 4-115 Hopper-Covered 610,769 XXXXXX 36
37 4-116 Hopper-Open Top-General Service 64,536 XXXXXX 37
38 4-117 Hopper-Open Top-Special Service 136,528 XXXXXX 38
39 4-118 Refrigerator-Mechanical 10,210 XXXXXX 39
40 4-119 Refrigerator-Non-Mechanical 23,331 XXXXXX 40
41 4-120 Flat-TOFC/COFC 65,088 XXXXXX 41
42 4-121 Flat-Multi-Level 21,929 XXXXXX 42
43 4-122 Flat-General Service 762 XXXXXX 43
44 4-123 Flat-All Other 74,946 XXXXXX 44
45 4-124 All Other Car Types-Total 27,705 XXXXXX 45
46 4-125 TOTAL (Lines 31-45) 1,463,885 XXXXXX 46
4-13 Private Line Cars - Loaded (H)
47 4-130 Box-Plain 40-Foot XXXXXX 47
48 4-131 Box-Plain 50-Foot and Longer 8,059 XXXXXX 48
49 4-132 Box-Equipped 32,819 XXXXXX 49
50 4-133 Gondola-Plain 1,072,274 XXXXXX 50
51 4-134 Gondola-Equipped 19,608 XXXXXX 51
52 4-135 Hopper-Covered 442,159 XXXXXX 52
53 4-136 Hopper-Open Top-General Service 67,304 XXXXXX 53
54 4-137 Hopper-Open Top-Special Service 684,708 XXXXXX 54
55 4-138 Refrigerator-Mechanical 4,858 XXXXXX 55
56 4-139 Refrigerator-Non-Mechanical 553 XXXXXX 56
57 4-140 Flat-TOFC/COFC 1,017,846 XXXXXX 57
58 4-141 Flat-Multi-Level 241,841 XXXXXX 58
59 4-142 Flat-General Service 270 XXXXXX 59
60 4-143 Flat-All Other 68,445 XXXXXX 60
61 4-144 Tank Under 22,000 Gallons 155,103 XXXXXX 61
62 4-145 Tank - 22,000 Gallons and Over 760,569 XXXXXX 62
63 4-146 All Other Car Types-Total 3,059 XXXXXX 63
64 4-147 TOTAL (Lines 47-63) 4,579,475 XXXXXX 64
Railroad Annual Report R-1
96 Road Initials: BNSF Year 2013
755. RAILROAD OPERATING STATISTICS - (Continued)
Line Cross Item Description Freight Passenger Line
No. Check Train Train No.
(a) (b) (c)
4-15 Private Line Cars - Empty (H)
65 4-150 Box-Plain 40-Foot XXXXXX 65
66 4-151 Box-Plain 50-Foot and Longer 6,056 XXXXXX 66
67 4-152 Box-Equipped 14,452 XXXXXX 67
68 4-153 Gondola-Plain 1,084,676 XXXXXX 68
69 4-154 Gondola-Equipped 20,802 XXXXXX 69
70 4-155 Hopper-Covered 452,195 XXXXXX 70
71 4-156 Hopper-Open Top-General Service 67,616 XXXXXX 71
72 4-157 Hopper-Open Top-Special Service 697,763 XXXXXX 72
73 4-158 Refrigerator-Mechanical 5,022 XXXXXX 73
74 4-159 Refrigerator-Non-Mechanical 570 XXXXXX 74
75 4-160 Flat-TOFC/COFC 100,669 XXXXXX 75
76 4-161 Flat-Multi-Level 79,016 XXXXXX 76
77 4-162 Flat-General Service 403 XXXXXX 77
78 4-163 Flat-All Other 66,896 XXXXXX 78
79 4-164 Tank Under 22,000 Gallons 164,161 XXXXXX 79
80 4-165 Tank - 22,000 Gallons and Over 815,580 XXXXXX 80
81 4-166 All Other Car Types-Total 7,984 XXXXXX 81
82 4-167 TOTAL (Lines 65-81) 3,583,861 XXXXXX 82
83 4-17 Work Equipment and Company Freight Car-Miles 77,565 XXXXXX 83
84 4-18 No Payment Car-Miles (I) <1> XXXXXX 84
4-19 Total Car-Miles by Train Type (Note)
85 4-191 Unit Trains 6,478,762 XXXXXX 85
86 4-192 Way Trains 170,096 XXXXXX 86
87 4-193 Through Trains 5,171,818 XXXXXX 87
88 4-194 TOTAL (Lines 85-87) 11,820,676 XXXXXX 88
89 4-20 Caboose Miles 63 XXXXXX 89
<1> Total number of loaded miles __18,374__ and empty miles __3,371_ by roadrailer reported above in lines 29 and 45 respectively, rather than line 84.
Note: Line 88, total car miles, is equal to the sum of lines 30, 46, 64, 82, 83, and 84. Accordingly, the car miles reported on lines 83 and 84
are to be allocated to lines 85, 86, and 87, and included in the total shown on line 88.
Railroad Annual Report R-1
Road Initials: BNSF Year 2013 97
755. RAILROAD OPERATING STATISTICS - (Concluded)
Line Cross Item Description Freight Passenger Line
No. Check Train Train No.
(a) (b) (c)
6 Gross Ton-Miles (thousands) (K)
98 6-01 Road Locomotives 107,342,826 98
6-02 Freight Trains, Crs., Cnts, & Caboose
99 6-020 Unit Trains 562,684,953 XXXXXX 99
100 6-021 Way Trains 11,475,333 XXXXXX 100
101 6-022 Through Trains 572,779,584 XXXXXX 101
102 6-03 Passenger Trains, Crs, & Cnts. 102
103 6-04 Non-Revenue 14,535,481 XXXXXX 103
104 6-05 TOTAL (Lines 98 - 103) 1,268,818,177 104
7 Tons of Freight (thousands)
105 7-01 Revenue 605,368 XXXXXX 105
106 7-02 Non-Revenue 12,450 XXXXXX 106
107 7-03 TOTAL (Lines 105 and 106) 617,818 XXXXXX 107
8 Ton-Miles of Freight (thousands) (L)
108 8-01 Revenue - Road Service 675,423,679 XXXXXX 108
109 8-02 Revenue - Lake Transfer Service XXXXXX 109
110 8-03 TOTAL (Lines 108 and 109) 675,423,679 XXXXXX 110
111 8-04 Non-Revenue - Road Service 7,200,904 XXXXXX 111
112 8-05 Non-Revenue - Lake Transfer Service XXXXXX 112
113 8-06 TOTAL (Lines 111 and 112) 7,200,904 XXXXXX 113
114 8-07 TOTAL - REVENUE & NON-REVENUE (Lines 110 and 113) 682,624,583 XXXXXX 114
9 Train Hours (M)
115 9-01 Road Service 9,542,310 XXXXXX 115
116 9-0 Train Switching 318,663 XXXXXX 116
117 10 TOTAL YARD-SWITCHING HOURS (N) 2,457,407 XXXXXX 117
11 Train-Miles Work Trains (O)
118 11-01 Locomotives 2,281,272 XXXXXX 118
119 11-02 Motorcars XXXXXX 119
12 Number of Loaded Freight Cars (P)
120 12-01 Unit Trains 4,501,667 XXXXXX 120
121 12-02 Way Trains 2,581,760 XXXXXX 121
122 12-03 Through Trains 6,315,043 XXXXXX 122
123 13 TOFC/COFC- No. of Revenue Trailers & Containers Loaded and Unloaded (Q) 7,654,243 XXXXXX 123
124 14 Multi-Level Cars - No. of Motor Vehicles Loaded & Unloaded (Q) 2,038,931 XXXXXX 124
125 15 TOFC/COFC - No. of Revenue Trailers Picked Up & Delivered (R) 171,579 XXXXXX 125
16 Revenue-Tons Marine Terminal (S)
126 16-01 Marine Terminals - Coal XXXXXX 126
127 16-02 Marine Terminals - Ore 7,733,856 XXXXXX 127
128 16-03 Marine Terminals - Other XXXXXX 128
129 16-04 TOTAL (Lines 126 - 128) 7,733,856 XXXXXX 129
17 Number of Foreign Per-Diem Cars on Line (T)
130 17-01 Serviceable 12,731 XXXXXX 130
131 17-02 Unserviceable 224 XXXXXX 131
132 17-03 Surplus 463 XXXXXX 132
133 17-04 TOTAL (Lines 130 - 132) 13,418 XXXXXX 133
134 TOFC/COFC - Average No. of Units Loaded Per Car 5.40 XXXXXX 134
Railroad Annual Report R-1
98 Road Initials: BNSF Year 2013
PTC Supplement
TO THE
SURFACE TRANSPORTATION BOARD
FOR THE
YEAR ENDED DECEMBER 31, 2013
Schedules 330, 332, 335, 352B, 410, 700, 710, 710S, and 720
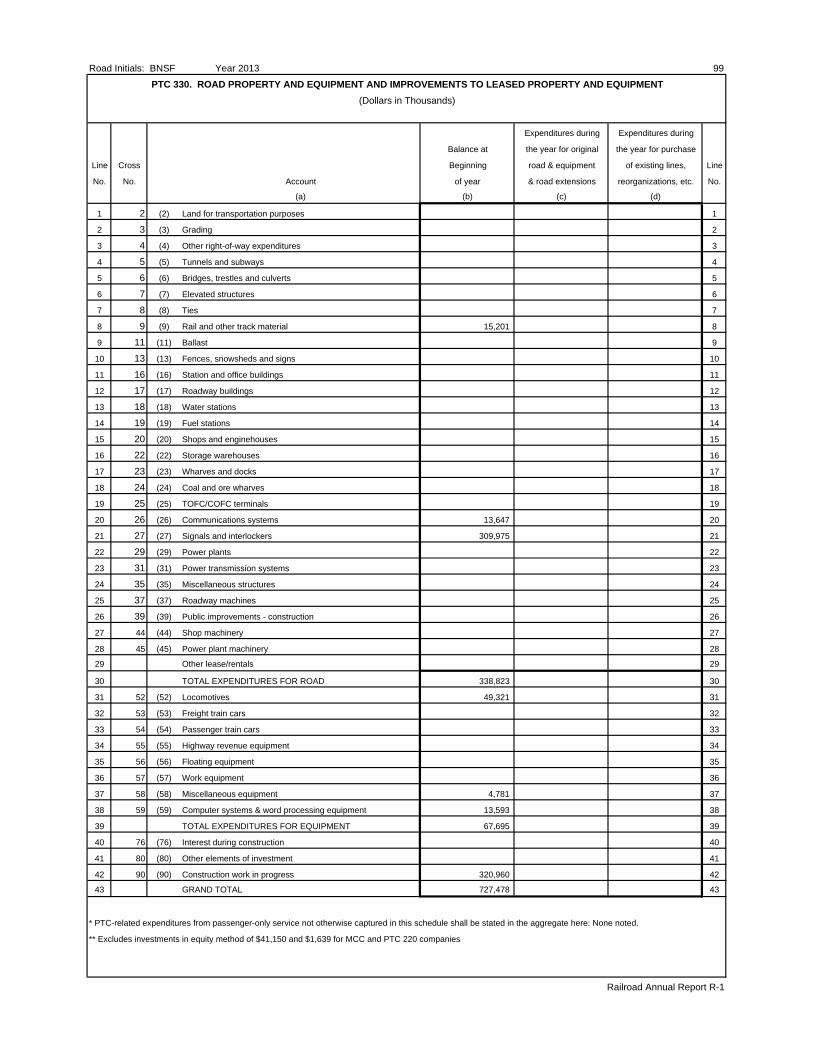
Road Initials: BNSF Year 2013 99
PTC 330. ROAD PROPERTY AND EQUIPMENT AND IMPROVEMENTS TO LEASED PROPERTY AND EQUIPMENT
(Dollars in Thousands)
Expenditures during Expenditures during
Balance at the year for original the year for purchase
Line Cross Beginning road & equipment of existing lines, Line
No. No. Account of year & road extensions reorganizations, etc. No.
(a) (b) (c) (d)
1 2 (2) Land for transportation purposes 1
2 3 (3) Grading 2
3 4 (4) Other right-of-way expenditures 3
4 5 (5) Tunnels and subways 4
5 6 (6) Bridges, trestles and culverts 5
6 7 (7) Elevated structures 6
7 8 (8) Ties 7
8 9 (9) Rail and other track material 15,201 8
9 11 (11) Ballast 9
10 13 (13) Fences, snowsheds and signs 10
11 16 (16) Station and office buildings 11
12 17 (17) Roadway buildings 12
13 18 (18) Water stations 13
14 19 (19) Fuel stations 14
15 20 (20) Shops and enginehouses 15
16 22 (22) Storage warehouses 16
17 23 (23) Wharves and docks 17
18 24 (24) Coal and ore wharves 18
19 25 (25) TOFC/COFC terminals 19
20 26 (26) Communications systems 13,647 20
21 27 (27) Signals and interlockers 309,975 21
22 29 (29) Power plants 22
23 31 (31) Power transmission systems 23
24 35 (35) Miscellaneous structures 24
25 37 (37) Roadway machines 25
26 39 (39) Public improvements - construction 26
27 44 (44) Shop machinery 27
28 45 (45) Power plant machinery 28
29 Other lease/rentals 29
30 TOTAL EXPENDITURES FOR ROAD 338,823 30
31 52 (52) Locomotives 49,321 31
32 53 (53) Freight train cars 32
33 54 (54) Passenger train cars 33
34 55 (55) Highway revenue equipment 34
35 56 (56) Floating equipment 35
36 57 (57) Work equipment 36
37 58 (58) Miscellaneous equipment 4,781 37
38 59 (59) Computer systems & word processing equipment 13,593 38
39 TOTAL EXPENDITURES FOR EQUIPMENT 67,695 39
40 76 (76) Interest during construction 40
41 80 (80) Other elements of investment 41
42 90 (90) Construction work in progress 320,960 42
43 GRAND TOTAL 727,478 43
* PTC-related expenditures from passenger-only service not otherwise captured in this schedule shall be stated in the aggregate here: None noted.
** Excludes investments in equity method of $41,150 and $1,639 for MCC and PTC 220 companies
Railroad Annual Report R-1
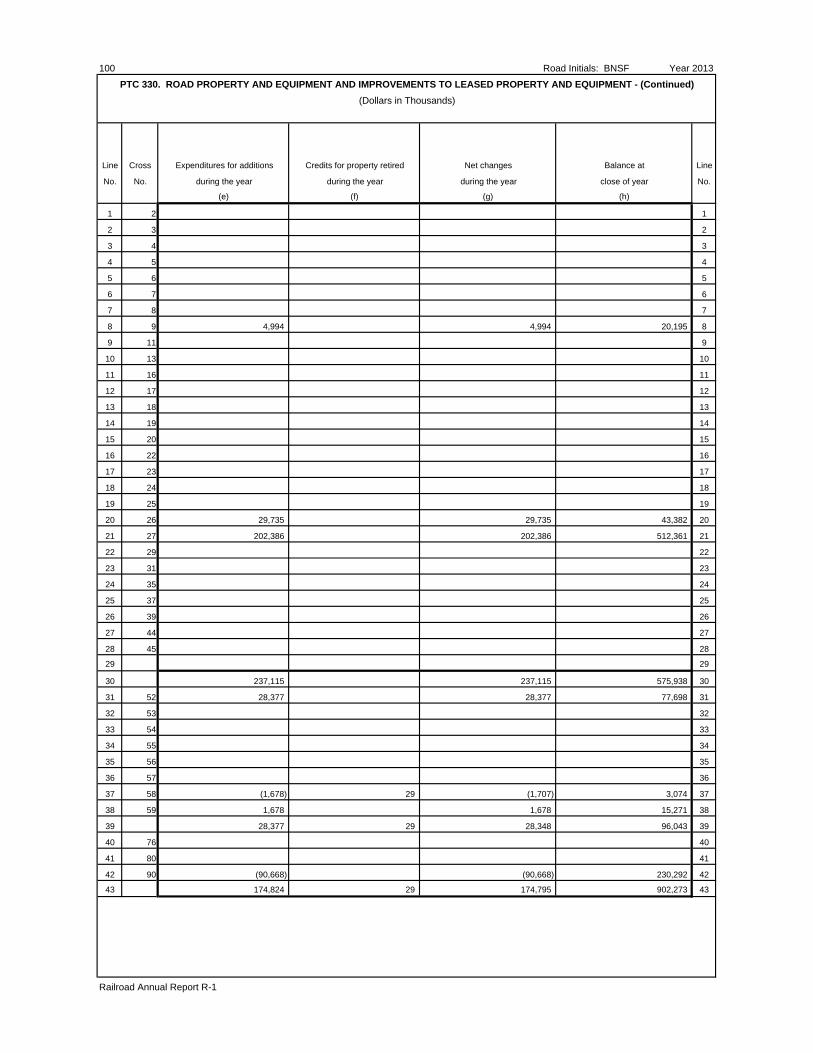
100 Road Initials: BNSF Year 2013
PTC 330. ROAD PROPERTY AND EQUIPMENT AND IMPROVEMENTS TO LEASED PROPERTY AND EQUIPMENT - (Continued)
(Dollars in Thousands)
Line Cross Expenditures for additions Credits for property retired Net changes Balance at Line
No. No. during the year during the year during the year close of year No.
(e) (f) (g) (h)
1 2 1
2 3 2
3 4 3
4 5 4
5 6 5
6 7 6
7 8 7
8 9 4,994 4,994 20,195 8
9 11 9
10 13 10
11 16 11
12 17 12
13 18 13
14 19 14
15 20 15
16 22 16
17 23 17
18 24 18
19 25 19
20 26 29,735 29,735 43,382 20
21 27 202,386 202,386 512,361 21
22 29 22
23 31 23
24 35 24
25 37 25
26 39 26
27 44 27
28 45 28
29 29
30 237,115 237,115 575,938 30
31 52 28,377 28,377 77,698 31
32 53 32
33 54 33
34 55 34
35 56 35
36 57 36
37 58 (1,678) 29 (1,707) 3,074 37
38 59 1,678 1,678 15,271 38
39 28,377 29 28,348 96,043 39
40 76 40
41 80 41
42 90 (90,668) (90,668) 230,292 42
43 174,824 29 174,795 902,273 43
Railroad Annual Report R-1
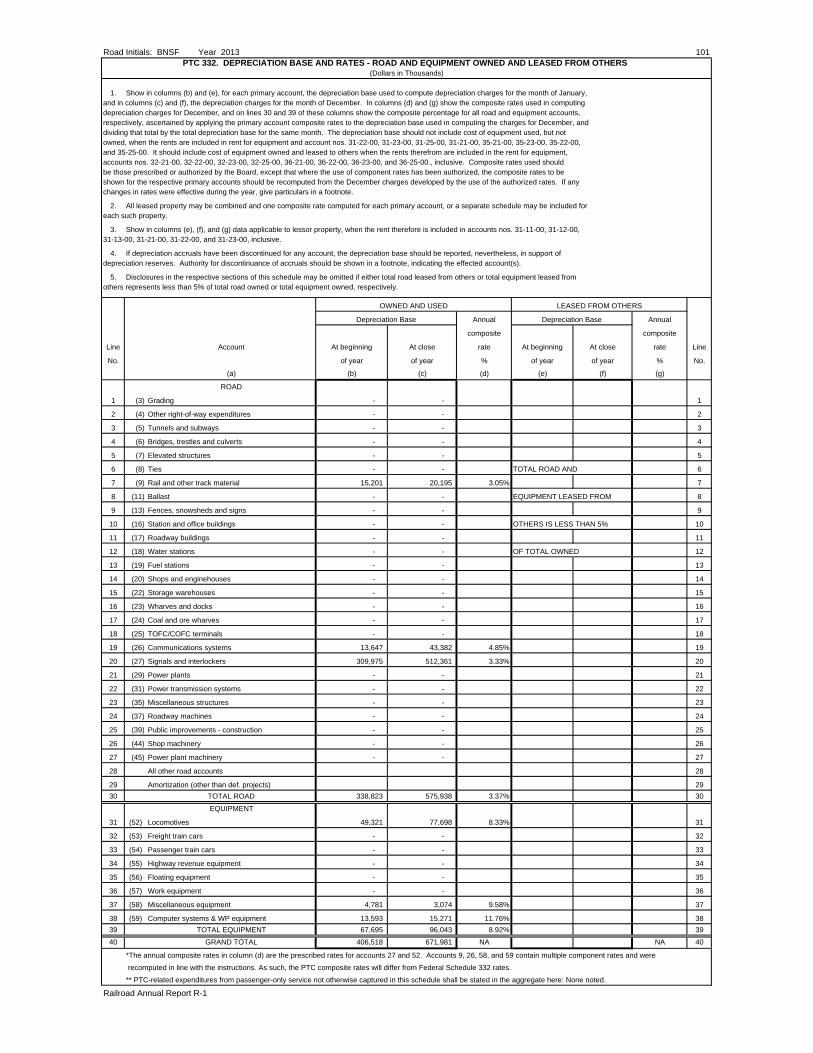
Road Initials: BNSF Year 2013 101PTC 332. DEPRECIATION BASE AND RATES - ROAD AND EQUIPMENT OWNED AND LEASED FROM OTHERS
(Dollars in Thousands)
1. Show in columns (b) and (e), for each primary account, the depreciation base used to compute depreciation charges for the month of January, and in columns (c) and (f), the depreciation charges for the month of December. In columns (d) and (g) show the composite rates used in computing depreciation charges for December, and on lines 30 and 39 of these columns show the composite percentage for all road and equipment accounts, respectively, ascertained by applying the primary account composite rates to the depreciation base used in computing the charges for December, and dividing that total by the total depreciation base for the same month. The depreciation base should not include cost of equipment used, but not owned, when the rents are included in rent for equipment and account nos. 31-22-00, 31-23-00, 31-25-00, 31-21-00, 35-21-00, 35-23-00, 35-22-00, and 35-25-00. It should include cost of equipment owned and leased to others when the rents therefrom are included in the rent for equipment, accounts nos. 32-21-00, 32-22-00, 32-23-00, 32-25-00, 36-21-00, 36-22-00, 36-23-00, and 36-25-00., inclusive. Composite rates used should be those prescribed or authorized by the Board, except that where the use of component rates has been authorized, the composite rates to be shown for the respective primary accounts should be recomputed from the December charges developed by the use of the authorized rates. If any changes in rates were effective during the year, give particulars in a footnote.
2. All leased property may be combined and one composite rate computed for each primary account, or a separate schedule may be included for each such property.
3. Show in columns (e), (f), and (g) data applicable to lessor property, when the rent therefore is included in accounts nos. 31-11-00, 31-12-00, 31-13-00, 31-21-00, 31-22-00, and 31-23-00, inclusive.
4. If depreciation accruals have been discontinued for any account, the depreciation base should be reported, nevertheless, in support of depreciation reserves. Authority for discontinuance of accruals should be shown in a footnote, indicating the effected account(s).
5. Disclosures in the respective sections of this schedule may be omitted if either total road leased from others or total equipment leased from others represents less than 5% of total road owned or total equipment owned, respectively.
OWNED AND USED LEASED FROM OTHERS
Depreciation Base Annual Depreciation Base Annual
composite composite
Line Account At beginning At close rate At beginning At close rate Line
No. of year of year % of year of year % No.
(a) (b) (c) (d) (e) (f) (g)
ROAD
1 (3) Grading - - 1
2 (4) Other right-of-way expenditures - - 2
3 (5) Tunnels and subways - - 3
4 (6) Bridges, trestles and culverts - - 4
5 (7) Elevated structures - - 5
6 (8) Ties - - TOTAL ROAD AND 6
7 (9) Rail and other track material 15,201 20,195 3.05% 7
8 (11) Ballast - - EQUIPMENT LEASED FROM 8
9 (13) Fences, snowsheds and signs - - 9
10 (16) Station and office buildings - - OTHERS IS LESS THAN 5% 10
11 (17) Roadway buildings - - 11
12 (18) Water stations - - OF TOTAL OWNED 12
13 (19) Fuel stations - - 13
14 (20) Shops and enginehouses - - 14
15 (22) Storage warehouses - - 15
16 (23) Wharves and docks - - 16
17 (24) Coal and ore wharves - - 17
18 (25) TOFC/COFC terminals - - 18
19 (26) Communications systems 13,647 43,382 4.85% 19
20 (27) Signals and interlockers 309,975 512,361 3.33% 20
21 (29) Power plants - - 21
22 (31) Power transmission systems - - 22
23 (35) Miscellaneous structures - - 23
24 (37) Roadway machines - - 24
25 (39) Public improvements - construction - - 25
26 (44) Shop machinery - - 26
27 (45) Power plant machinery - - 27
28 All other road accounts 28
29 Amortization (other than def. projects) 29
30 TOTAL ROAD 338,823 575,938 3.37% 30
EQUIPMENT
31 (52) Locomotives 49,321 77,698 8.33% 31
32 (53) Freight train cars - - 32
33 (54) Passenger train cars - - 33
34 (55) Highway revenue equipment - - 34
35 (56) Floating equipment - - 35
36 (57) Work equipment - - 36
37 (58) Miscellaneous equipment 4,781 3,074 9.58% 37
38 (59) Computer systems & WP equipment 13,593 15,271 11.76% 38
39 TOTAL EQUIPMENT 67,695 96,043 8.92% 39
40 GRAND TOTAL 406,518 671,981 NA NA 40
*The annual composite rates in column (d) are the prescribed rates for accounts 27 and 52. Accounts 9, 26, 58, and 59 contain multiple component rates and were
recomputed in line with the instructions. As such, the PTC composite rates will differ from Federal Schedule 332 rates.
** PTC-related expenditures from passenger-only service not otherwise captured in this schedule shall be stated in the aggregate here: None noted.
Railroad Annual Report R-1
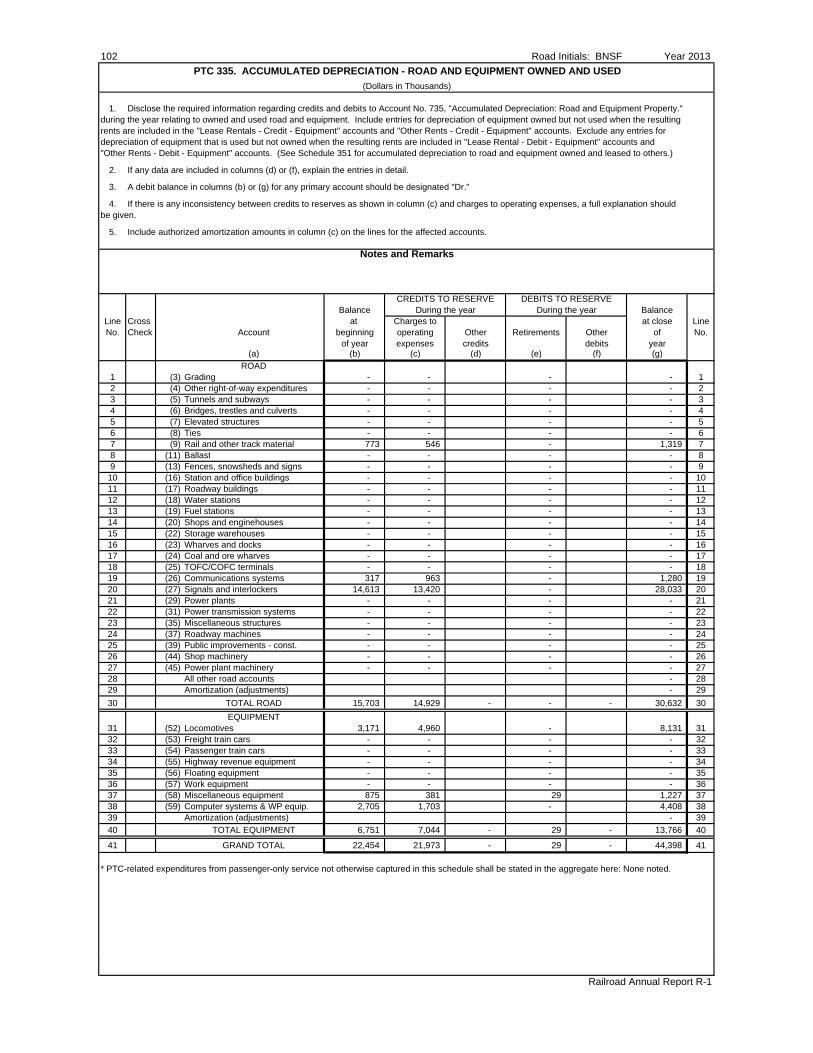
102 Road Initials: BNSF Year 2013
PTC 335. ACCUMULATED DEPRECIATION - ROAD AND EQUIPMENT OWNED AND USED
(Dollars in Thousands)
1. Disclose the required information regarding credits and debits to Account No. 735, "Accumulated Depreciation: Road and Equipment Property." during the year relating to owned and used road and equipment. Include entries for depreciation of equipment owned but not used when the resulting rents are included in the "Lease Rentals - Credit - Equipment" accounts and "Other Rents - Credit - Equipment" accounts. Exclude any entries for depreciation of equipment that is used but not owned when the resulting rents are included in "Lease Rental - Debit - Equipment" accounts and "Other Rents - Debit - Equipment" accounts. (See Schedule 351 for accumulated depreciation to road and equipment owned and leased to others.)
2. If any data are included in columns (d) or (f), explain the entries in detail.
3. A debit balance in columns (b) or (g) for any primary account should be designated "Dr."
4. If there is any inconsistency between credits to reserves as shown in column (c) and charges to operating expenses, a full explanation should be given.
5. Include authorized amortization amounts in column (c) on the lines for the affected accounts.
CREDITS TO RESERVE DEBITS TO RESERVEBalance During the year During the year Balance
Line Cross at Charges to at close LineNo. Check Account beginning operating Other Retirements Other of No.
of year expenses credits debits year(a) (b) (c) (d) (e) (f) (g)
ROAD1 (3) Grading - - - - 12 (4) Other right-of-way expenditures - - - - 23 (5) Tunnels and subways - - - - 34 (6) Bridges, trestles and culverts - - - - 45 (7) Elevated structures - - - - 56 (8) Ties - - - - 67 (9) Rail and other track material 773 546 - 1,319 78 (11) Ballast - - - - 89 (13) Fences, snowsheds and signs - - - - 9
10 (16) Station and office buildings - - - - 1011 (17) Roadway buildings - - - - 1112 (18) Water stations - - - - 1213 (19) Fuel stations - - - - 1314 (20) Shops and enginehouses - - - - 1415 (22) Storage warehouses - - - - 1516 (23) Wharves and docks - - - - 1617 (24) Coal and ore wharves - - - - 1718 (25) TOFC/COFC terminals - - - - 1819 (26) Communications systems 317 963 - 1,280 1920 (27) Signals and interlockers 14,613 13,420 - 28,033 2021 (29) Power plants - - - - 2122 (31) Power transmission systems - - - - 2223 (35) Miscellaneous structures - - - - 2324 (37) Roadway machines - - - - 2425 (39) Public improvements - const. - - - - 2526 (44) Shop machinery - - - - 2627 (45) Power plant machinery - - - - 2728 All other road accounts - 2829 Amortization (adjustments) - 29
30 TOTAL ROAD 15,703 14,929 - - - 30,632 30
EQUIPMENT31 (52) Locomotives 3,171 4,960 - 8,131 3132 (53) Freight train cars - - - - 3233 (54) Passenger train cars - - - - 3334 (55) Highway revenue equipment - - - - 3435 (56) Floating equipment - - - - 3536 (57) Work equipment - - - - 3637 (58) Miscellaneous equipment 875 381 29 1,227 3738 (59) Computer systems & WP equip. 2,705 1,703 - 4,408 3839 Amortization (adjustments) - 39
40 TOTAL EQUIPMENT 6,751 7,044 - 29 - 13,766 40
41 GRAND TOTAL 22,454 21,973 - 29 - 44,398 41
* PTC-related expenditures from passenger-only service not otherwise captured in this schedule shall be stated in the aggregate here: None noted.
Railroad Annual Report R-1
Notes and Remarks
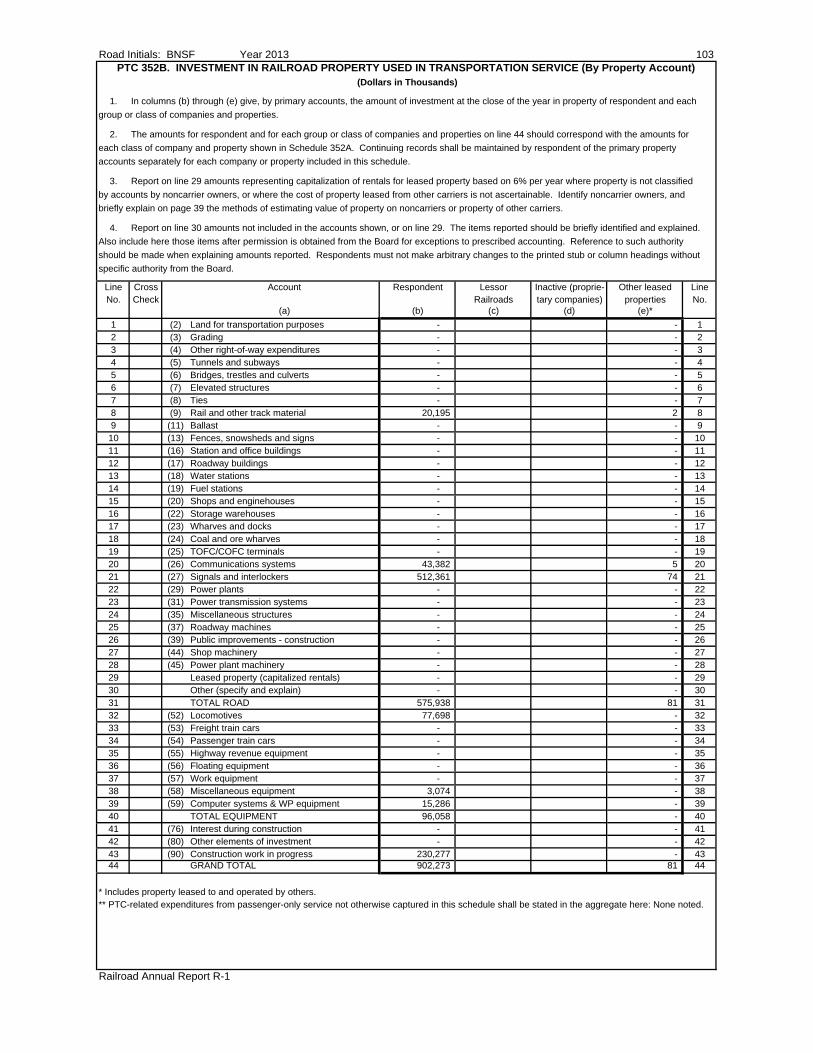
Road Initials: BNSF Year 2013 103PTC 352B. INVESTMENT IN RAILROAD PROPERTY USED IN TRANSPORTATION SERVICE (By Property Account)
(Dollars in Thousands)
1. In columns (b) through (e) give, by primary accounts, the amount of investment at the close of the year in property of respondent and each
group or class of companies and properties.
2. The amounts for respondent and for each group or class of companies and properties on line 44 should correspond with the amounts for
each class of company and property shown in Schedule 352A. Continuing records shall be maintained by respondent of the primary property
accounts separately for each company or property included in this schedule.
3. Report on line 29 amounts representing capitalization of rentals for leased property based on 6% per year where property is not classified
by accounts by noncarrier owners, or where the cost of property leased from other carriers is not ascertainable. Identify noncarrier owners, and
briefly explain on page 39 the methods of estimating value of property on noncarriers or property of other carriers.
4. Report on line 30 amounts not included in the accounts shown, or on line 29. The items reported should be briefly identified and explained.
Also include here those items after permission is obtained from the Board for exceptions to prescribed accounting. Reference to such authority
should be made when explaining amounts reported. Respondents must not make arbitrary changes to the printed stub or column headings without
specific authority from the Board.
Line Cross Account Respondent Lessor Inactive (proprie- Other leased LineNo. Check Railroads tary companies) properties No.
(a) (b) (c) (d) (e)*
1 (2) Land for transportation purposes - - 12 (3) Grading - - 23 (4) Other right-of-way expenditures - - 34 (5) Tunnels and subways - - 45 (6) Bridges, trestles and culverts - - 56 (7) Elevated structures - - 67 (8) Ties - - 78 (9) Rail and other track material 20,195 2 89 (11) Ballast - - 910 (13) Fences, snowsheds and signs - - 1011 (16) Station and office buildings - - 1112 (17) Roadway buildings - - 1213 (18) Water stations - - 1314 (19) Fuel stations - - 1415 (20) Shops and enginehouses - - 1516 (22) Storage warehouses - - 1617 (23) Wharves and docks - - 1718 (24) Coal and ore wharves - - 1819 (25) TOFC/COFC terminals - - 1920 (26) Communications systems 43,382 5 2021 (27) Signals and interlockers 512,361 74 2122 (29) Power plants - - 2223 (31) Power transmission systems - - 2324 (35) Miscellaneous structures - - 2425 (37) Roadway machines - - 2526 (39) Public improvements - construction - - 2627 (44) Shop machinery - - 2728 (45) Power plant machinery - - 2829 Leased property (capitalized rentals) - - 2930 Other (specify and explain) - - 3031 TOTAL ROAD 575,938 81 3132 (52) Locomotives 77,698 - 3233 (53) Freight train cars - - 3334 (54) Passenger train cars - - 3435 (55) Highway revenue equipment - - 3536 (56) Floating equipment - - 3637 (57) Work equipment - - 3738 (58) Miscellaneous equipment 3,074 - 3839 (59) Computer systems & WP equipment 15,286 - 3940 TOTAL EQUIPMENT 96,058 - 4041 (76) Interest during construction - - 4142 (80) Other elements of investment - - 4243 (90) Construction work in progress 230,277 - 4344 GRAND TOTAL 902,273 81 44
* Includes property leased to and operated by others.** PTC-related expenditures from passenger-only service not otherwise captured in this schedule shall be stated in the aggregate here: None noted.
Railroad Annual Report R-1
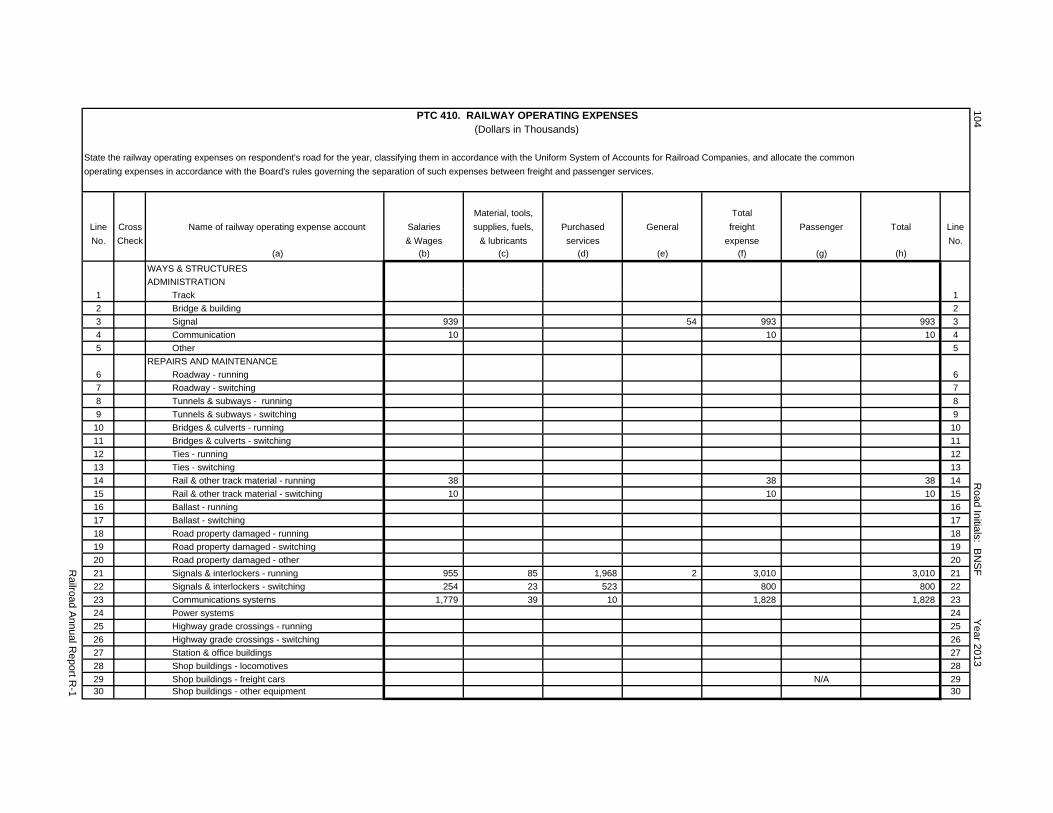
PTC 410. RAILWAY OPERATING EXPENSES(Dollars in Thousands)
State the railway operating expenses on respondent's road for the year, classifying them in accordance with the Uniform System of Accounts for Railroad Companies, and allocate the common
operating expenses in accordance with the Board's rules governing the separation of such expenses between freight and passenger services.
Material, tools, Total
Line Cross Name of railway operating expense account Salaries supplies, fuels, Purchased General freight Passenger Total Line
No. Check & Wages & lubricants services expense No.(a) (b) (c) (d) (e) (f) (g) (h)
WAYS & STRUCTURES
ADMINISTRATION
1 Track 1
2 Bridge & building 2
3 Signal 939 54 993 993 3
4 Communication 10 10 10 4
5 Other 5
REPAIRS AND MAINTENANCE
6 Roadway - running 6
7 Roadway - switching 7
8 Tunnels & subways - running 8
9 Tunnels & subways - switching 9
10 Bridges & culverts - running 10
11 Bridges & culverts - switching 11
12 Ties - running 12
13 Ties - switching 13
14 Rail & other track material - running 38 38 38 14
15 Rail & other track material - switching 10 10 10 15
16 Ballast - running 16
17 Ballast - switching 17
18 Road property damaged - running 18
19 Road property damaged - switching 19
20 Road property damaged - other 20
21 Signals & interlockers - running 955 85 1,968 2 3,010 3,010 21
22 Signals & interlockers - switching 254 23 523 800 800 22
23 Communications systems 1,779 39 10 1,828 1,828 23
24 Power systems 24
25 Highway grade crossings - running 25
26 Highway grade crossings - switching 26
27 Station & office buildings 27
28 Shop buildings - locomotives 28
29 Shop buildings - freight cars N/A 2930 Shop buildings - other equipment 30
104 R
oad Initials: BN
SF
Year 2013
Railroad A
nnual Report R
-1
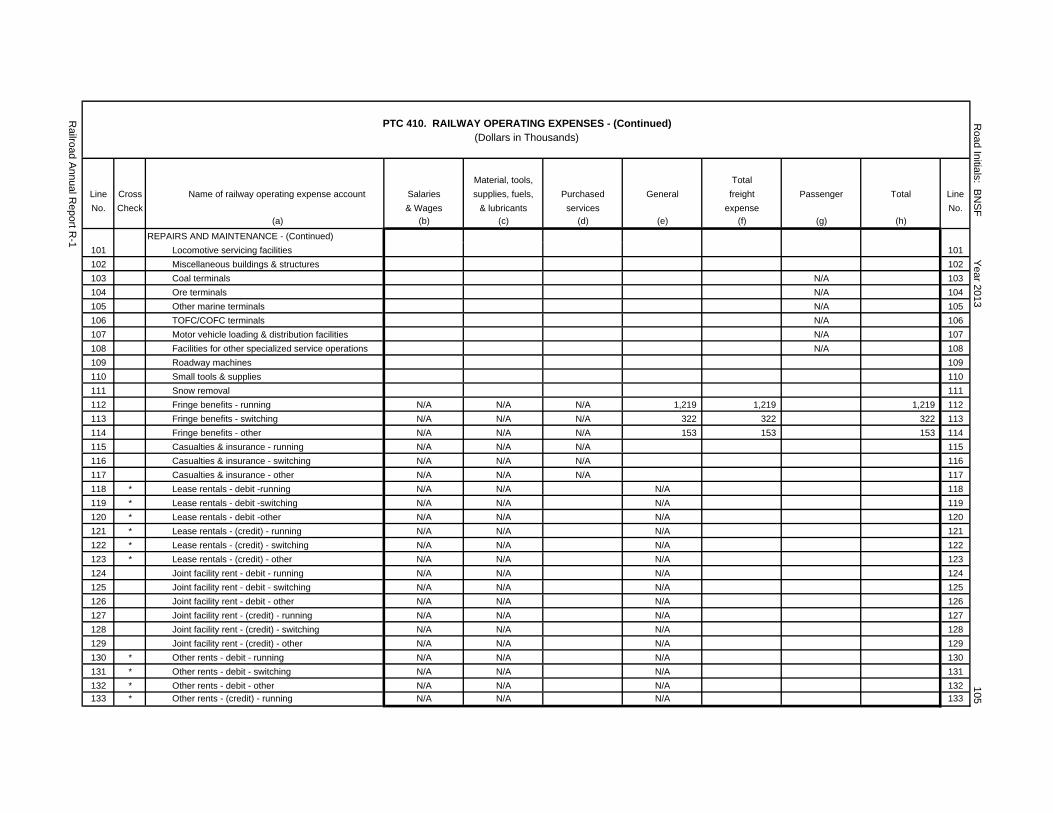
PTC 410. RAILWAY OPERATING EXPENSES - (Continued)(Dollars in Thousands)
Material, tools, Total
Line Cross Name of railway operating expense account Salaries supplies, fuels, Purchased General freight Passenger Total Line
No. Check & Wages & lubricants services expense No.
(a) (b) (c) (d) (e) (f) (g) (h)
REPAIRS AND MAINTENANCE - (Continued)
101 Locomotive servicing facilities 101
102 Miscellaneous buildings & structures 102
103 Coal terminals N/A 103
104 Ore terminals N/A 104
105 Other marine terminals N/A 105
106 TOFC/COFC terminals N/A 106
107 Motor vehicle loading & distribution facilities N/A 107
108 Facilities for other specialized service operations N/A 108
109 Roadway machines 109
110 Small tools & supplies 110
111 Snow removal 111
112 Fringe benefits - running N/A N/A N/A 1,219 1,219 1,219 112
113 Fringe benefits - switching N/A N/A N/A 322 322 322 113
114 Fringe benefits - other N/A N/A N/A 153 153 153 114
115 Casualties & insurance - running N/A N/A N/A 115
116 Casualties & insurance - switching N/A N/A N/A 116
117 Casualties & insurance - other N/A N/A N/A 117
118 * Lease rentals - debit -running N/A N/A N/A 118
119 * Lease rentals - debit -switching N/A N/A N/A 119
120 * Lease rentals - debit -other N/A N/A N/A 120
121 * Lease rentals - (credit) - running N/A N/A N/A 121
122 * Lease rentals - (credit) - switching N/A N/A N/A 122
123 * Lease rentals - (credit) - other N/A N/A N/A 123
124 Joint facility rent - debit - running N/A N/A N/A 124
125 Joint facility rent - debit - switching N/A N/A N/A 125
126 Joint facility rent - debit - other N/A N/A N/A 126
127 Joint facility rent - (credit) - running N/A N/A N/A 127
128 Joint facility rent - (credit) - switching N/A N/A N/A 128
129 Joint facility rent - (credit) - other N/A N/A N/A 129
130 * Other rents - debit - running N/A N/A N/A 130
131 * Other rents - debit - switching N/A N/A N/A 131
132 * Other rents - debit - other N/A N/A N/A 132
133 * Other rents - (credit) - running N/A N/A N/A 133
105
Railroad A
nnual Report R
-1
Road Initials: B
NS
F Y
ear 2013
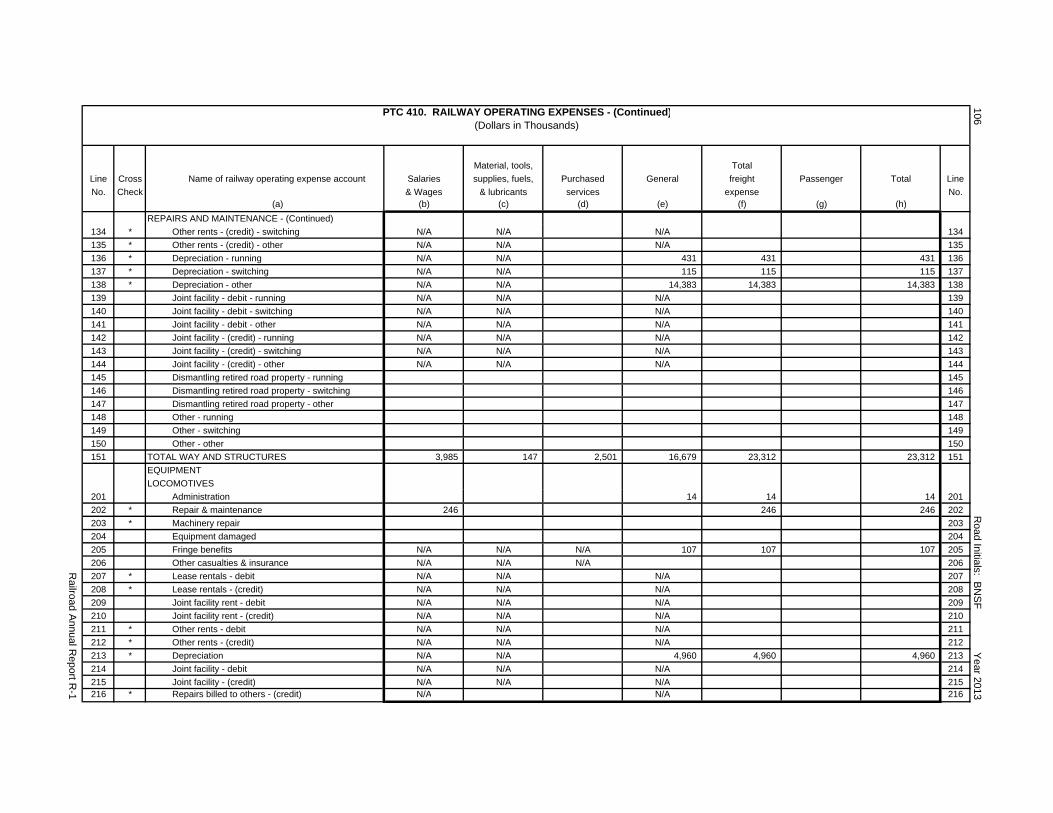
PTC 410. RAILWAY OPERATING EXPENSES - (Continued)(Dollars in Thousands)
Material, tools, Total
Line Cross Name of railway operating expense account Salaries supplies, fuels, Purchased General freight Passenger Total Line
No. Check & Wages & lubricants services expense No.(a) (b) (c) (d) (e) (f) (g) (h)
REPAIRS AND MAINTENANCE - (Continued)
134 * Other rents - (credit) - switching N/A N/A N/A 134
135 * Other rents - (credit) - other N/A N/A N/A 135
136 * Depreciation - running N/A N/A 431 431 431 136
137 * Depreciation - switching N/A N/A 115 115 115 137
138 * Depreciation - other N/A N/A 14,383 14,383 14,383 138
139 Joint facility - debit - running N/A N/A N/A 139
140 Joint facility - debit - switching N/A N/A N/A 140
141 Joint facility - debit - other N/A N/A N/A 141
142 Joint facility - (credit) - running N/A N/A N/A 142
143 Joint facility - (credit) - switching N/A N/A N/A 143
144 Joint facility - (credit) - other N/A N/A N/A 144
145 Dismantling retired road property - running 145
146 Dismantling retired road property - switching 146
147 Dismantling retired road property - other 147
148 Other - running 148
149 Other - switching 149
150 Other - other 150
151 TOTAL WAY AND STRUCTURES 3,985 147 2,501 16,679 23,312 23,312 151
EQUIPMENT
LOCOMOTIVES
201 Administration 14 14 14 201
202 * Repair & maintenance 246 246 246 202
203 * Machinery repair 203
204 Equipment damaged 204
205 Fringe benefits N/A N/A N/A 107 107 107 205
206 Other casualties & insurance N/A N/A N/A 206
207 * Lease rentals - debit N/A N/A N/A 207
208 * Lease rentals - (credit) N/A N/A N/A 208
209 Joint facility rent - debit N/A N/A N/A 209
210 Joint facility rent - (credit) N/A N/A N/A 210
211 * Other rents - debit N/A N/A N/A 211
212 * Other rents - (credit) N/A N/A N/A 212
213 * Depreciation N/A N/A 4,960 4,960 4,960 213
214 Joint facility - debit N/A N/A N/A 214
215 Joint facility - (credit) N/A N/A N/A 215216 * Repairs billed to others - (credit) N/A N/A 216
106 R
oad Initials: BN
SF
Year 2013
Railroad A
nnual Report R
-1
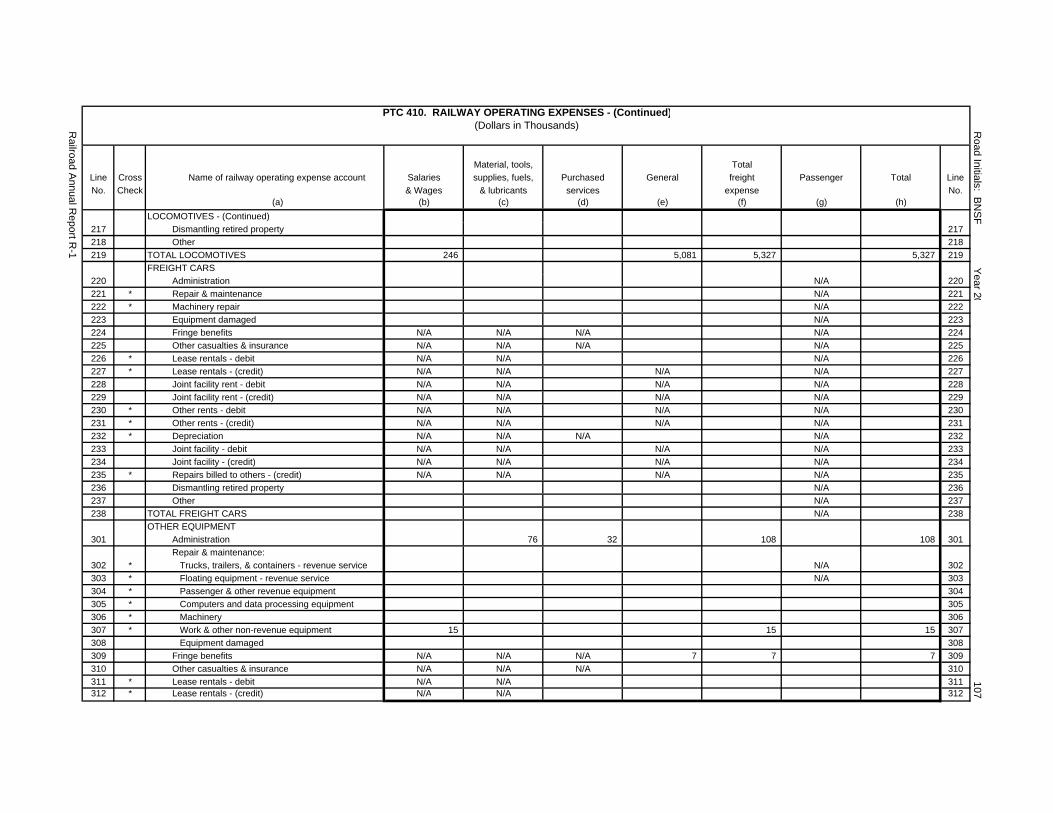
PTC 410. RAILWAY OPERATING EXPENSES - (Continued)(Dollars in Thousands)
Material, tools, Total
Line Cross Name of railway operating expense account Salaries supplies, fuels, Purchased General freight Passenger Total Line
No. Check & Wages & lubricants services expense No.(a) (b) (c) (d) (e) (f) (g) (h)
LOCOMOTIVES - (Continued)
217 Dismantling retired property 217
218 Other 218
219 TOTAL LOCOMOTIVES 246 5,081 5,327 5,327 219
FREIGHT CARS
220 Administration N/A 220
221 * Repair & maintenance N/A 221
222 * Machinery repair N/A 222
223 Equipment damaged N/A 223
224 Fringe benefits N/A N/A N/A N/A 224
225 Other casualties & insurance N/A N/A N/A N/A 225
226 * Lease rentals - debit N/A N/A N/A 226
227 * Lease rentals - (credit) N/A N/A N/A N/A 227
228 Joint facility rent - debit N/A N/A N/A N/A 228
229 Joint facility rent - (credit) N/A N/A N/A N/A 229
230 * Other rents - debit N/A N/A N/A N/A 230
231 * Other rents - (credit) N/A N/A N/A N/A 231
232 * Depreciation N/A N/A N/A N/A 232
233 Joint facility - debit N/A N/A N/A N/A 233
234 Joint facility - (credit) N/A N/A N/A N/A 234
235 * Repairs billed to others - (credit) N/A N/A N/A N/A 235
236 Dismantling retired property N/A 236
237 Other N/A 237
238 TOTAL FREIGHT CARS N/A 238
OTHER EQUIPMENT
301 Administration 76 32 108 108 301
Repair & maintenance:
302 * Trucks, trailers, & containers - revenue service N/A 302
303 * Floating equipment - revenue service N/A 303
304 * Passenger & other revenue equipment 304
305 * Computers and data processing equipment 305
306 * Machinery 306
307 * Work & other non-revenue equipment 15 15 15 307
308 Equipment damaged 308
309 Fringe benefits N/A N/A N/A 7 7 7 309
310 Other casualties & insurance N/A N/A N/A 310
311 * Lease rentals - debit N/A N/A 311312 * Lease rentals - (credit) N/A N/A 312
Railroad A
nnual Report R
-1
Road Initials: B
NS
F Y
ear 20107
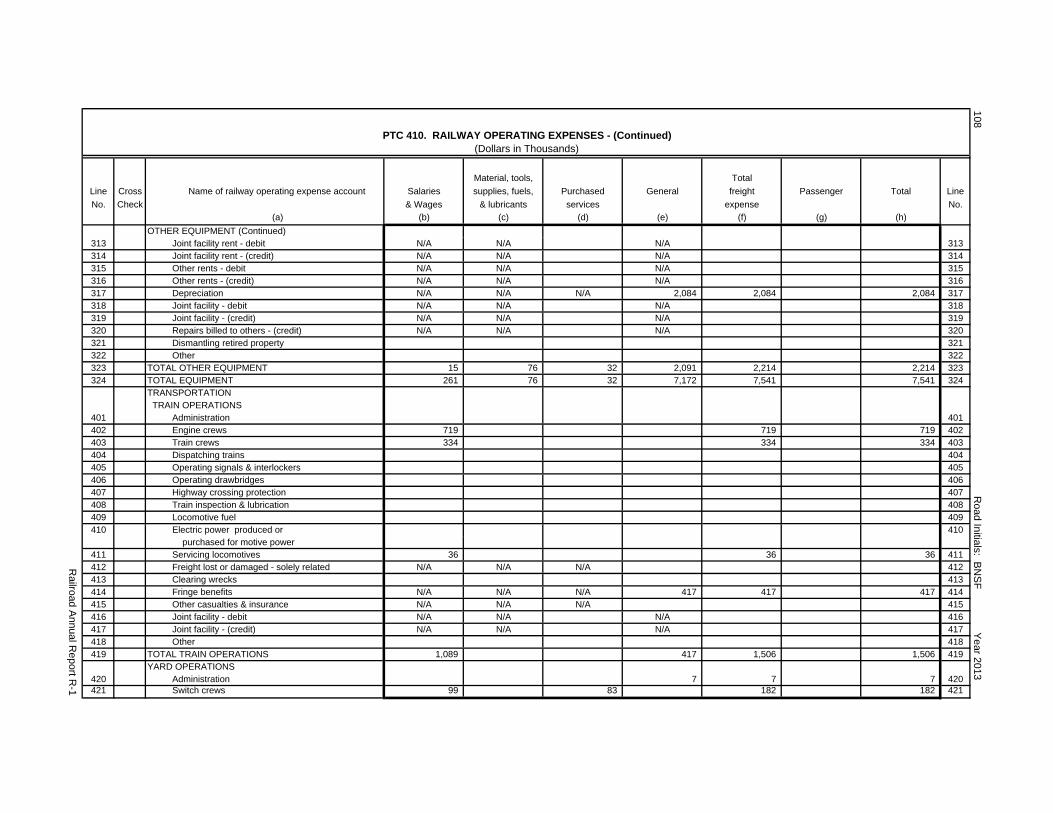
PTC 410. RAILWAY OPERATING EXPENSES - (Continued)(Dollars in Thousands)
Material, tools, Total
Line Cross Name of railway operating expense account Salaries supplies, fuels, Purchased General freight Passenger Total Line
No. Check & Wages & lubricants services expense No.
(a) (b) (c) (d) (e) (f) (g) (h)
OTHER EQUIPMENT (Continued)313 Joint facility rent - debit N/A N/A N/A 313314 Joint facility rent - (credit) N/A N/A N/A 314315 Other rents - debit N/A N/A N/A 315316 Other rents - (credit) N/A N/A N/A 316317 Depreciation N/A N/A N/A 2,084 2,084 2,084 317318 Joint facility - debit N/A N/A N/A 318319 Joint facility - (credit) N/A N/A N/A 319320 Repairs billed to others - (credit) N/A N/A N/A 320321 Dismantling retired property 321322 Other 322323 TOTAL OTHER EQUIPMENT 15 76 32 2,091 2,214 2,214 323324 TOTAL EQUIPMENT 261 76 32 7,172 7,541 7,541 324
TRANSPORTATION TRAIN OPERATIONS
401 Administration 401402 Engine crews 719 719 719 402403 Train crews 334 334 334 403404 Dispatching trains 404405 Operating signals & interlockers 405406 Operating drawbridges 406407 Highway crossing protection 407408 Train inspection & lubrication 408409 Locomotive fuel 409410 Electric power produced or 410
purchased for motive power411 Servicing locomotives 36 36 36 411412 Freight lost or damaged - solely related N/A N/A N/A 412413 Clearing wrecks 413414 Fringe benefits N/A N/A N/A 417 417 417 414415 Other casualties & insurance N/A N/A N/A 415416 Joint facility - debit N/A N/A N/A 416417 Joint facility - (credit) N/A N/A N/A 417418 Other 418419 TOTAL TRAIN OPERATIONS 1,089 417 1,506 1,506 419
YARD OPERATIONS420 Administration 7 7 7 420421 Switch crews 99 83 182 182 421
Railroad A
nnual Report R
-1
Road Initials: B
NS
F Y
ear 2013108
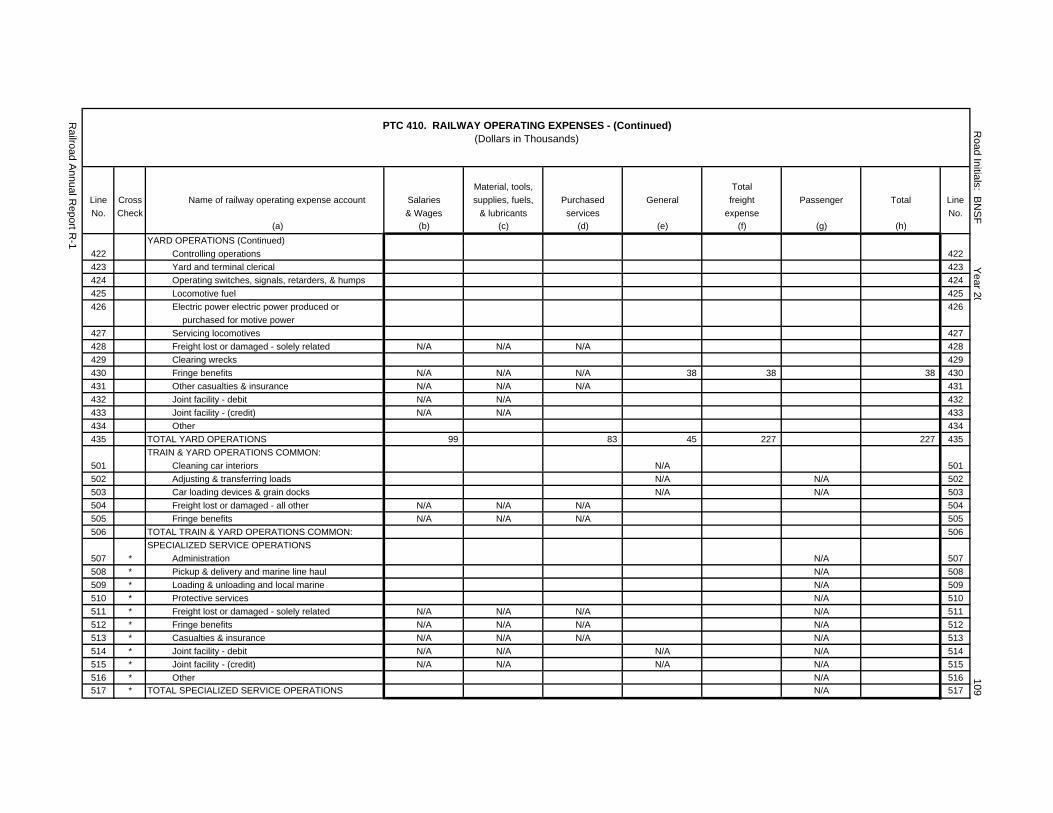
PTC 410. RAILWAY OPERATING EXPENSES - (Continued)(Dollars in Thousands)
Material, tools, Total
Line Cross Name of railway operating expense account Salaries supplies, fuels, Purchased General freight Passenger Total Line
No. Check & Wages & lubricants services expense No.
(a) (b) (c) (d) (e) (f) (g) (h)
YARD OPERATIONS (Continued)
422 Controlling operations 422
423 Yard and terminal clerical 423
424 Operating switches, signals, retarders, & humps 424
425 Locomotive fuel 425
426 Electric power electric power produced or 426
purchased for motive power
427 Servicing locomotives 427
428 Freight lost or damaged - solely related N/A N/A N/A 428
429 Clearing wrecks 429
430 Fringe benefits N/A N/A N/A 38 38 38 430
431 Other casualties & insurance N/A N/A N/A 431
432 Joint facility - debit N/A N/A 432
433 Joint facility - (credit) N/A N/A 433
434 Other 434
435 TOTAL YARD OPERATIONS 99 83 45 227 227 435
TRAIN & YARD OPERATIONS COMMON:
501 Cleaning car interiors N/A 501
502 Adjusting & transferring loads N/A N/A 502
503 Car loading devices & grain docks N/A N/A 503
504 Freight lost or damaged - all other N/A N/A N/A 504
505 Fringe benefits N/A N/A N/A 505
506 TOTAL TRAIN & YARD OPERATIONS COMMON: 506
SPECIALIZED SERVICE OPERATIONS
507 * Administration N/A 507
508 * Pickup & delivery and marine line haul N/A 508
509 * Loading & unloading and local marine N/A 509
510 * Protective services N/A 510
511 * Freight lost or damaged - solely related N/A N/A N/A N/A 511
512 * Fringe benefits N/A N/A N/A N/A 512
513 * Casualties & insurance N/A N/A N/A N/A 513
514 * Joint facility - debit N/A N/A N/A N/A 514
515 * Joint facility - (credit) N/A N/A N/A N/A 515
516 * Other N/A 516
517 * TOTAL SPECIALIZED SERVICE OPERATIONS N/A 517
Railroad A
nnual Report R
-1
Road Initials: B
NS
F Y
ear 20109
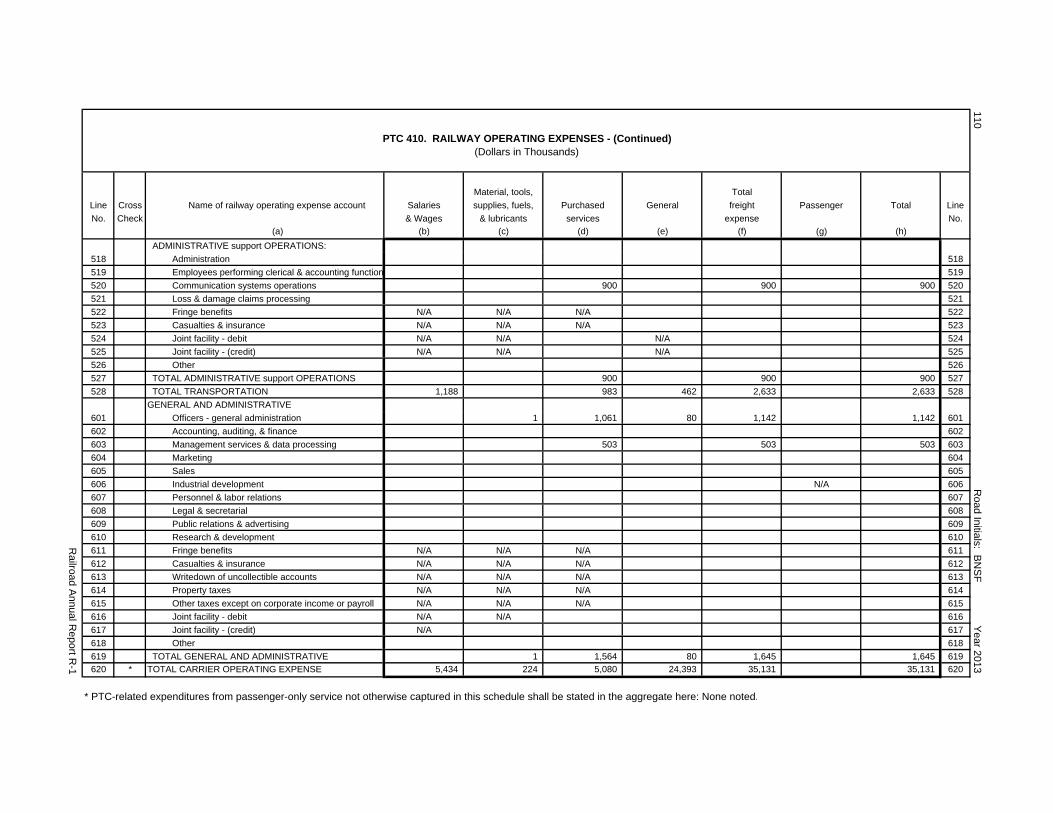
PTC 410. RAILWAY OPERATING EXPENSES - (Continued)(Dollars in Thousands)
Material, tools, Total
Line Cross Name of railway operating expense account Salaries supplies, fuels, Purchased General freight Passenger Total Line
No. Check & Wages & lubricants services expense No.
(a) (b) (c) (d) (e) (f) (g) (h)
ADMINISTRATIVE support OPERATIONS:
518 Administration 518
519 Employees performing clerical & accounting function 519
520 Communication systems operations 900 900 900 520
521 Loss & damage claims processing 521
522 Fringe benefits N/A N/A N/A 522
523 Casualties & insurance N/A N/A N/A 523
524 Joint facility - debit N/A N/A N/A 524
525 Joint facility - (credit) N/A N/A N/A 525
526 Other 526
527 TOTAL ADMINISTRATIVE support OPERATIONS 900 900 900 527
528 TOTAL TRANSPORTATION 1,188 983 462 2,633 2,633 528
GENERAL AND ADMINISTRATIVE
601 Officers - general administration 1 1,061 80 1,142 1,142 601
602 Accounting, auditing, & finance 602
603 Management services & data processing 503 503 503 603
604 Marketing 604
605 Sales 605
606 Industrial development N/A 606
607 Personnel & labor relations 607
608 Legal & secretarial 608
609 Public relations & advertising 609
610 Research & development 610
611 Fringe benefits N/A N/A N/A 611
612 Casualties & insurance N/A N/A N/A 612
613 Writedown of uncollectible accounts N/A N/A N/A 613
614 Property taxes N/A N/A N/A 614
615 Other taxes except on corporate income or payroll N/A N/A N/A 615
616 Joint facility - debit N/A N/A 616
617 Joint facility - (credit) N/A 617
618 Other 618
619 TOTAL GENERAL AND ADMINISTRATIVE 1 1,564 80 1,645 1,645 619
620 * TOTAL CARRIER OPERATING EXPENSE 5,434 224 5,080 24,393 35,131 35,131 620
* PTC-related expenditures from passenger-only service not otherwise captured in this schedule shall be stated in the aggregate here: None noted.
110 R
oad Initials: BN
SF
Year 2013
Railroad A
nnual Report R
-1
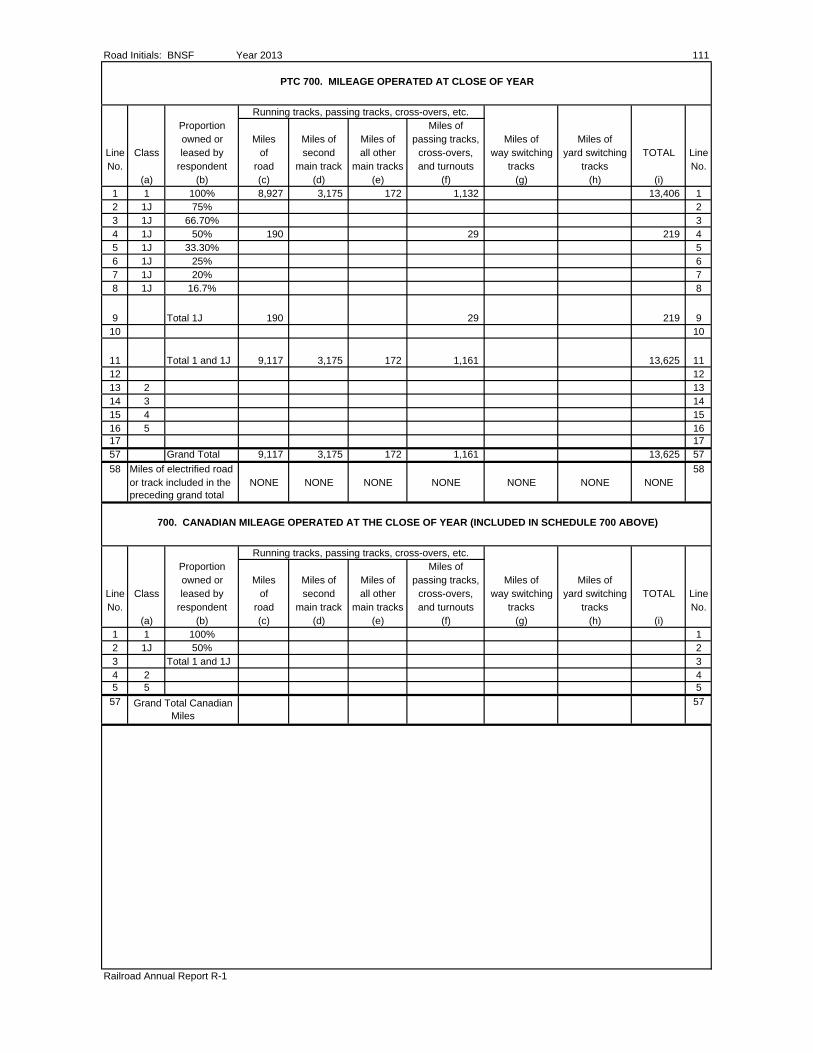
Road Initials: BNSF Year 2013 111
PTC 700. MILEAGE OPERATED AT CLOSE OF YEAR
Running tracks, passing tracks, cross-overs, etc.Proportion Miles ofowned or Miles Miles of Miles of passing tracks, Miles of Miles of
Line Class leased by of second all other cross-overs, way switching yard switching TOTAL LineNo. respondent road main track main tracks and turnouts tracks tracks No.
(a) (b) (c) (d) (e) (f) (g) (h) (i)1 1 100% 8,927 3,175 172 1,132 13,406 12 1J 75% 23 1J 66.70% 34 1J 50% 190 29 219 45 1J 33.30% 56 1J 25% 67 1J 20% 78 1J 16.7% 8
9 Total 1J 190 29 219 910 10
11 Total 1 and 1J 9,117 3,175 172 1,161 13,625 1112 1213 2 1314 3 1415 4 1516 5 1617 1757 Grand Total 9,117 3,175 172 1,161 13,625 57
58 Miles of electrified road 58or track included in the NONE NONE NONE NONE NONE NONE NONEpreceding grand total
Running tracks, passing tracks, cross-overs, etc.Proportion Miles ofowned or Miles Miles of Miles of passing tracks, Miles of Miles of
Line Class leased by of second all other cross-overs, way switching yard switching TOTAL LineNo. respondent road main track main tracks and turnouts tracks tracks No.
(a) (b) (c) (d) (e) (f) (g) (h) (i)1 1 100% 12 1J 50% 23 Total 1 and 1J 34 2 45 5 5
57 57
Railroad Annual Report R-1
700. CANADIAN MILEAGE OPERATED AT THE CLOSE OF YEAR (INCLUDED IN SCHEDULE 700 ABOVE)
Grand Total Canadian Miles
112 Road Initials: BNSF Year 2013NOTES AND REMARKS
Railroad Annual Report R-1
THIS PAGE INTENTIONALLY LEFT BLANK
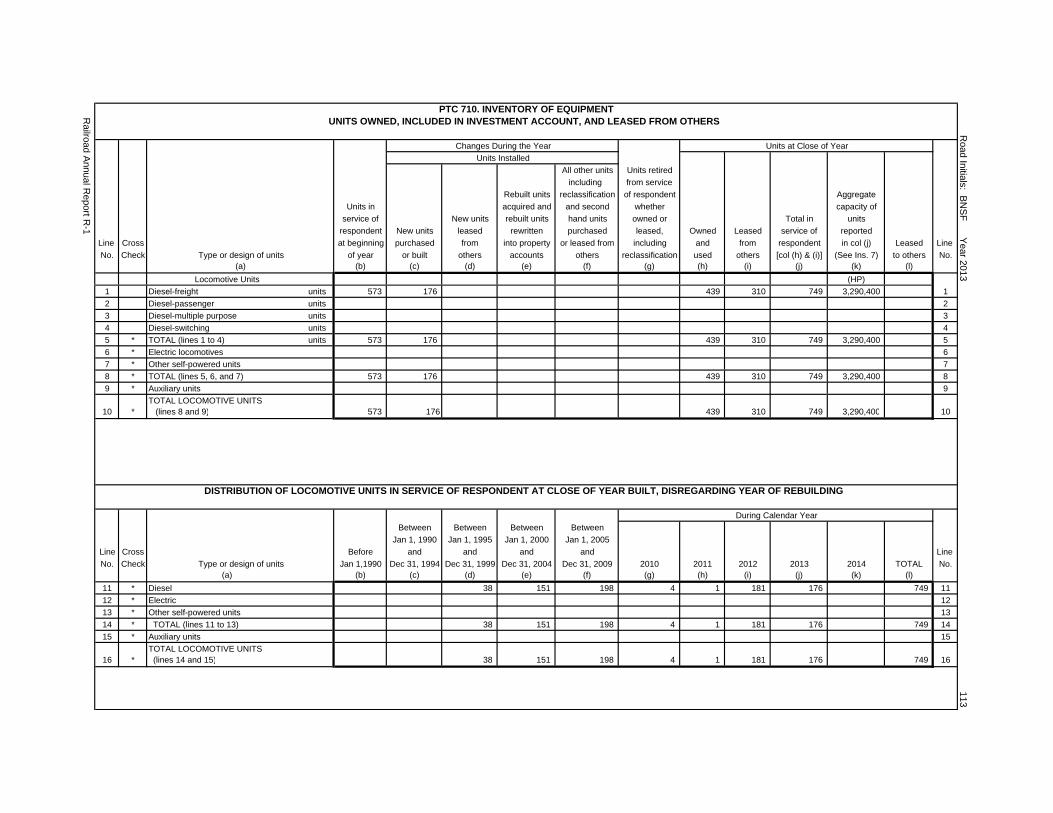
PTC 710. INVENTORY OF EQUIPMENTUNITS OWNED, INCLUDED IN INVESTMENT ACCOUNT, AND LEASED FROM OTHERS
Changes During the Year Units at Close of Year
Units Installed
All other units Units retired
including from service
Rebuilt units reclassification of respondent Aggregate
Units in acquired and and second whether capacity of
service of New units rebuilt units hand units owned or Total in units
respondent New units leased rewritten purchased leased, Owned Leased service of reported
Line Cross at beginning purchased from into property or leased from including and from respondent in col (j) Leased Line
No. Check Type or design of units of year or built others accounts others reclassification used others [col (h) & (i)] (See Ins. 7) to others No.(a) (b) (c) (d) (e) (f) (g) (h) (i) (j) (k) (l)
Locomotive Units (HP)
1 Diesel-freight units 573 176 439 310 749 3,290,400 1
2 Diesel-passenger units 2
3 Diesel-multiple purpose units 3
4 Diesel-switching units 4
5 * TOTAL (lines 1 to 4) units 573 176 439 310 749 3,290,400 5
6 * Electric locomotives 6
7 * Other self-powered units 7
8 * TOTAL (lines 5, 6, and 7) 573 176 439 310 749 3,290,400 8
9 * Auxiliary units 9
TOTAL LOCOMOTIVE UNITS10 * (lines 8 and 9) 573 176 439 310 749 3,290,400 10
DISTRIBUTION OF LOCOMOTIVE UNITS IN SERVICE OF RESPONDENT AT CLOSE OF YEAR BUILT, DISREGARDING YEAR OF REBUILDING
During Calendar Year
Between Between Between Between
Jan 1, 1990 Jan 1, 1995 Jan 1, 2000 Jan 1, 2005
Line Cross Before and and and and Line
No. Check Type or design of units Jan 1,1990 Dec 31, 1994 Dec 31, 1999 Dec 31, 2004 Dec 31, 2009 2010 2011 2012 2013 2014 TOTAL No.(a) (b) (c) (d) (e) (f) (g) (h) (i) (j) (k) (l)
11 * Diesel 38 151 198 4 1 181 176 749 11
12 * Electric 12
13 * Other self-powered units 13
14 * TOTAL (lines 11 to 13) 38 151 198 4 1 181 176 749 14
15 * Auxiliary units 15
TOTAL LOCOMOTIVE UNITS16 * (lines 14 and 15) 38 151 198 4 1 181 176 749 16
Railroad A
nnual Report R
-1
113 R
oad Initials: BN
SF
Year 2013

PTC 710. INVENTORY OF EQUIPMENT (Continued)UNITS OWNED, INCLUDED IN INVESTMENT ACCOUNT, AND LEASED FROM OTHERS
Changes During the Year Units at Close of YearUnits Installed
All other units Units retiredincluding from service
Rebuilt units reclassification of respondent AggregateUnits in acquired and and second whether capacity of
service of New units rebuilt units hand units owned or Total in unitsrespondent New units leased rewritten purchased leased, Owned Leased service of reported
Line Cross at beginning purchased from into property or leased from including and from respondent in col (j) Leased Line No. Check Type or design of units of year or built others accounts others reclassification used others [col (h) & (i)] (See Ins. 7) to others No.
(a) (b) (c) (d) (e) (f) (g) (h) (i) (j) (k) (l)
Passenger-Train CarsNon-Self-Propelled
17 Coaches (PA, PB, PBO) - 1718 Combined cars 18
(All class C, except CSB) - 19 Parlor cars (PBC, PC, PL, PO) - 1920 Sleeping cars (PS, PT, PAS, PDS) - 2021 Dining, grill, & tavern cars 21
(All class D, PD) - 22 Nonpassenger carrying cars 22
(All class B, CSB, M, PSA, IA) - 23 TOTAL (Lines 17 to 22) - - - - - - - - - - - 23
Self-Propelled24 Electric passenger cars 24
(EP, ET) - 25 Electric combined cars (EC) - 2526 Internal combustion rail 26
motorcars (ED, EG) - 27 Other self-propelled cars 27
(Specify types) - 28 TOTAL (Lines 24 to 27) - - - - - - - - - - - 2829 TOTAL (Lines 23 and 28) - - - - - - - - - - - 29
Company Service Cars30 Business cars (PV) - 3031 Board outfit cars (MWX) - 3132 Derrick & snow removal cars 32
(MWU, MWV, MWW, MWK) - 33 Dump and ballast cars 33
(MWB, MWD) - 34 Other maintenance and service 34
equipment cars - 35 TOTAL (Lines 30 to 34) - - - - - - - - - - - 35
Railroad A
nnual Report R
114 R
oad Initials: BN
SF
Year 2013
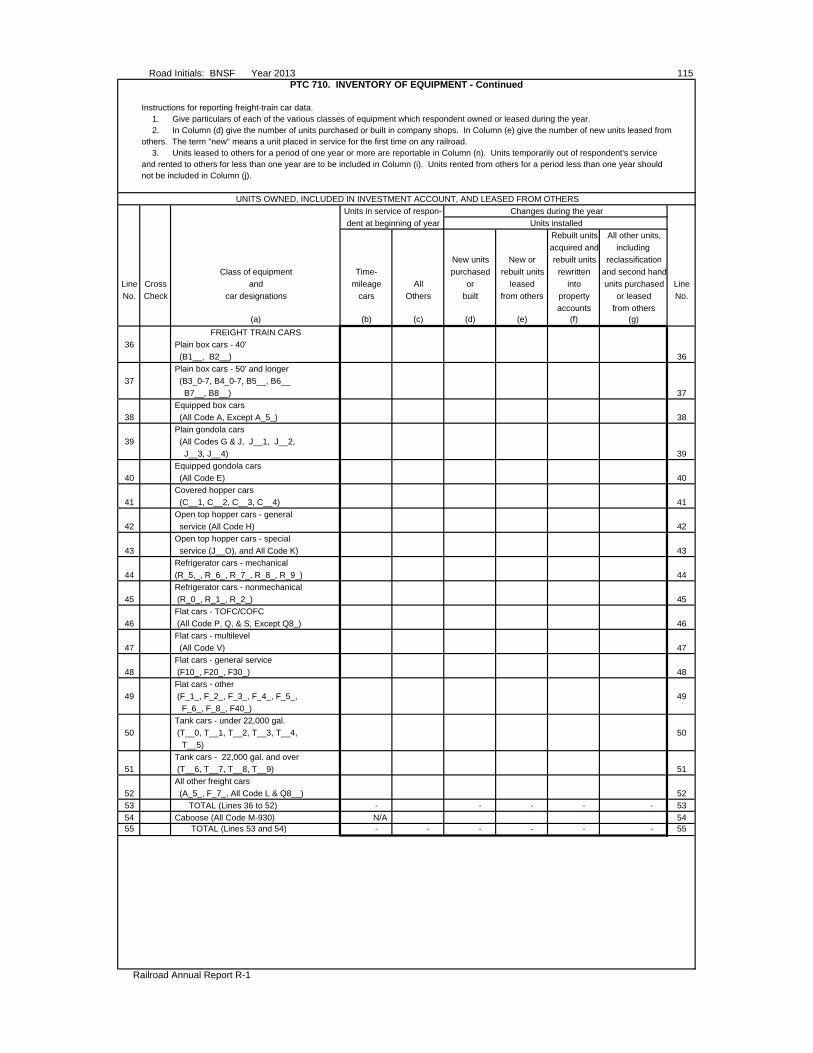
Road Initials: BNSF Year 2013 115PTC 710. INVENTORY OF EQUIPMENT - Continued
Instructions for reporting freight-train car data.1. Give particulars of each of the various classes of equipment which respondent owned or leased during the year.2. In Column (d) give the number of units purchased or built in company shops. In Column (e) give the number of new units leased from
others. The term "new" means a unit placed in service for the first time on any railroad.3. Units leased to others for a period of one year or more are reportable in Column (n). Units temporarily out of respondent's service
and rented to others for less than one year are to be included in Column (i). Units rented from others for a period less than one year should not be included in Column (j).
UNITS OWNED, INCLUDED IN INVESTMENT ACCOUNT, AND LEASED FROM OTHERS
Units in service of respon- Changes during the year
dent at beginning of year Units installed
Rebuilt units All other units,
acquired and including
New units New or rebuilt units reclassification
Class of equipment Time- purchased rebuilt units rewritten and second hand
Line Cross and mileage All or leased into units purchased Line
No. Check car designations cars Others built from others property or leased No.
accounts from others(a) (b) (c) (d) (e) (f) (g)
FREIGHT TRAIN CARS
36 Plain box cars - 40'
(B1__, B2__) 36
Plain box cars - 50' and longer
37 (B3_0-7, B4_0-7, B5__, B6__
B7__, B8__) 37
Equipped box cars
38 (All Code A, Except A_5_) 38
Plain gondola cars
39 (All Codes G & J, J__1, J__2,
J__3, J__4) 39
Equipped gondola cars
40 (All Code E) 40
Covered hopper cars
41 (C__1, C__2, C__3, C__4) 41
Open top hopper cars - general
42 service (All Code H) 42
Open top hopper cars - special
43 service (J__O), and All Code K) 43
Refrigerator cars - mechanical
44 (R_5,_, R_6_, R_7_, R_8_, R_9_) 44
Refrigerator cars - nonmechanical
45 (R_0_, R_1_, R_2_) 45
Flat cars - TOFC/COFC
46 (All Code P, Q, & S, Except Q8_) 46
Flat cars - multilevel
47 (All Code V) 47
Flat cars - general service
48 (F10_, F20_, F30_) 48
Flat cars - other
49 (F_1_, F_2_, F_3_, F_4_, F_5_, 49
F_6_, F_8_, F40_)
Tank cars - under 22,000 gal.
50 (T__0, T__1, T__2, T__3, T__4, 50
T__5)
Tank cars - 22,000 gal. and over
51 (T__6, T__7, T__8, T__9) 51
All other freight cars
52 (A_5_, F_7_, All Code L & Q8__) 52
53 TOTAL (Lines 36 to 52) - - - - - 53
54 Caboose (All Code M-930) N/A 5455 TOTAL (Lines 53 and 54) - - - - - - 55
Railroad Annual Report R-1
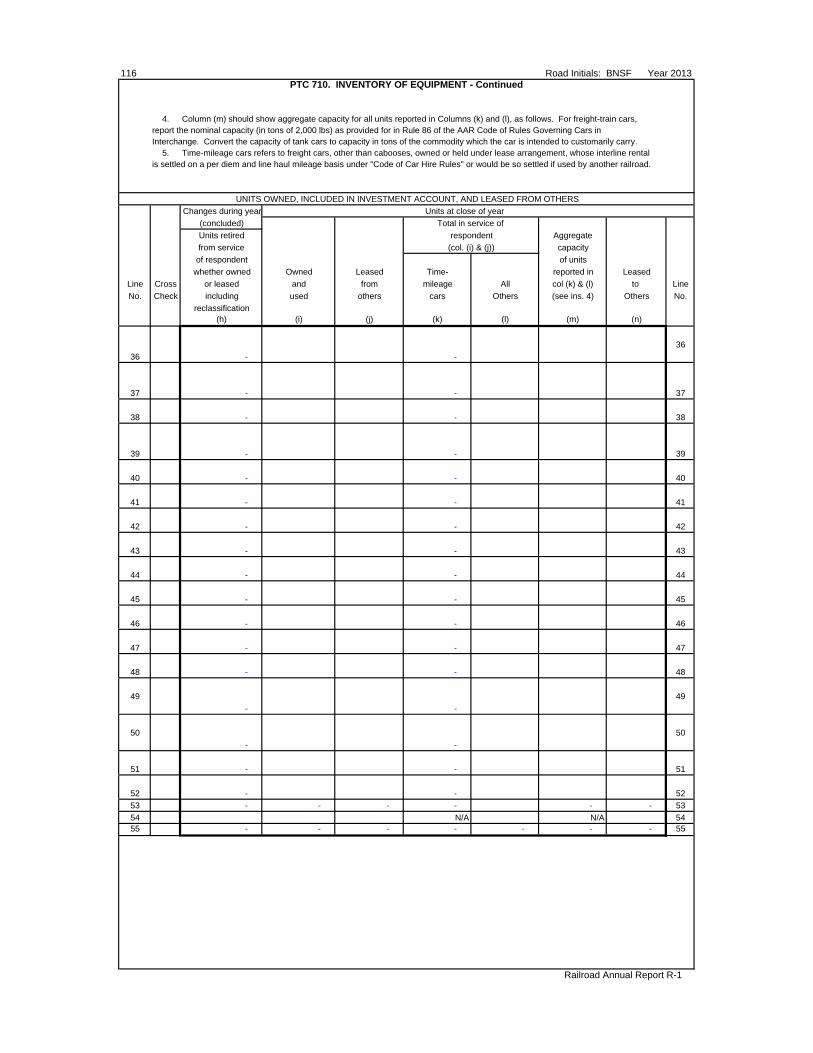
116 Road Initials: BNSF Year 2013PTC 710. INVENTORY OF EQUIPMENT - Continued
4. Column (m) should show aggregate capacity for all units reported in Columns (k) and (l), as follows. For freight-train cars,report the nominal capacity (in tons of 2,000 lbs) as provided for in Rule 86 of the AAR Code of Rules Governing Cars inInterchange. Convert the capacity of tank cars to capacity in tons of the commodity which the car is intended to customarily carry.
5. Time-mileage cars refers to freight cars, other than cabooses, owned or held under lease arrangement, whose interline rentalis settled on a per diem and line haul mileage basis under "Code of Car Hire Rules" or would be so settled if used by another railroad.
UNITS OWNED, INCLUDED IN INVESTMENT ACCOUNT, AND LEASED FROM OTHERS
Changes during year Units at close of year
(concluded) Total in service of
Units retired respondent Aggregate
from service (col. (i) & (j)) capacity
of respondent of units
whether owned Owned Leased Time- reported in Leased
Line Cross or leased and from mileage All col (k) & (l) to Line
No. Check including used others cars Others (see ins. 4) Others No.
reclassification(h) (i) (j) (k) (l) (m) (n)
36
36 - -
37 - - 37
38 - - 38
39 - - 39
40 - - 40
41 - - 41
42 - - 42
43 - - 43
44 - - 44
45 - - 45
46 - - 46
47 - - 47
48 - - 48
49 49
- -
50 50
- -
51 - - 51
52 - - 52
53 - - - - - - 53
54 N/A N/A 5455 - - - - - - - 55
Railroad Annual Report R-1
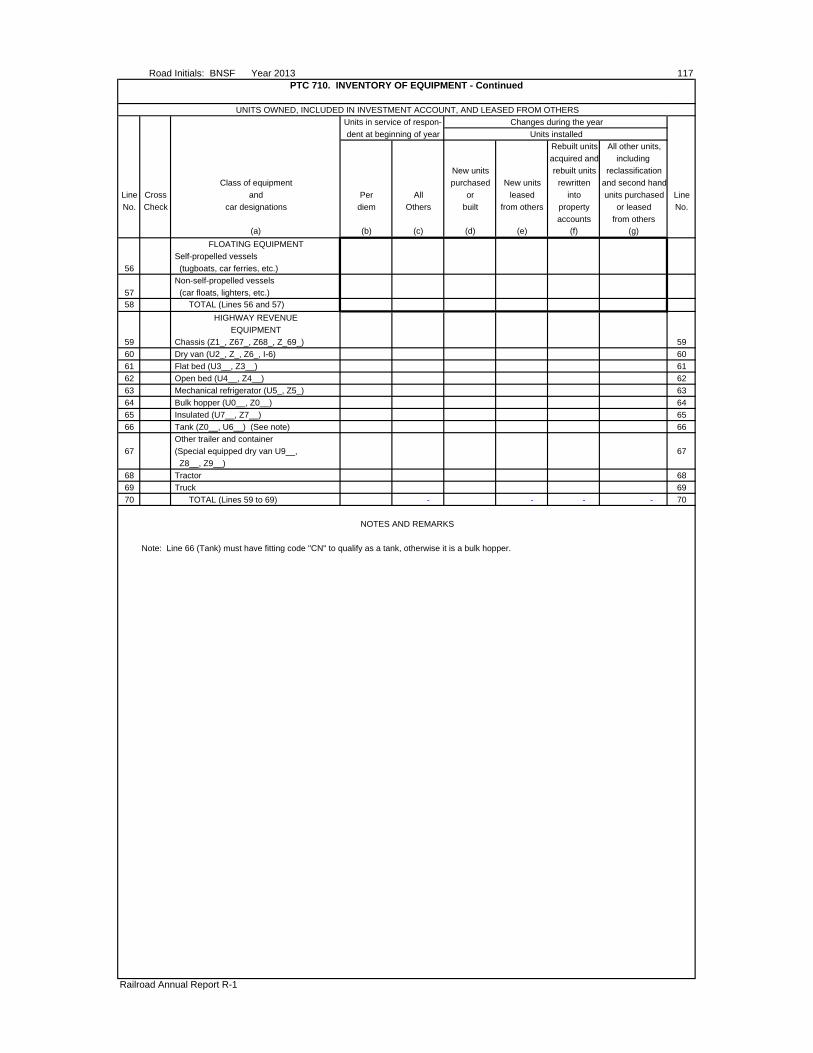
Road Initials: BNSF Year 2013 117PTC 710. INVENTORY OF EQUIPMENT - Continued
UNITS OWNED, INCLUDED IN INVESTMENT ACCOUNT, AND LEASED FROM OTHERS
Units in service of respon- Changes during the year
dent at beginning of year Units installed
Rebuilt units All other units,
acquired and including
New units rebuilt units reclassification
Class of equipment purchased New units rewritten and second hand
Line Cross and Per All or leased into units purchased Line
No. Check car designations diem Others built from others property or leased No.
accounts from others
(a) (b) (c) (d) (e) (f) (g)
FLOATING EQUIPMENT
Self-propelled vessels
56 (tugboats, car ferries, etc.)
Non-self-propelled vessels
57 (car floats, lighters, etc.)
58 TOTAL (Lines 56 and 57)
HIGHWAY REVENUE
EQUIPMENT
59 Chassis (Z1_, Z67_, Z68_, Z_69_) 59
60 Dry van (U2_, Z_, Z6_, I-6) 60
61 Flat bed (U3__, Z3__) 61
62 Open bed (U4__, Z4__) 62
63 Mechanical refrigerator (U5_, Z5_) 63
64 Bulk hopper (U0__, Z0__) 64
65 Insulated (U7__, Z7__) 65
66 Tank (Z0__, U6__) (See note) 66
Other trailer and container
67 (Special equipped dry van U9__, 67
Z8__, Z9__)
68 Tractor 68
69 Truck 69
70 TOTAL (Lines 59 to 69) - - - - 70
NOTES AND REMARKS
Note: Line 66 (Tank) must have fitting code "CN" to qualify as a tank, otherwise it is a bulk hopper.
Railroad Annual Report R-1
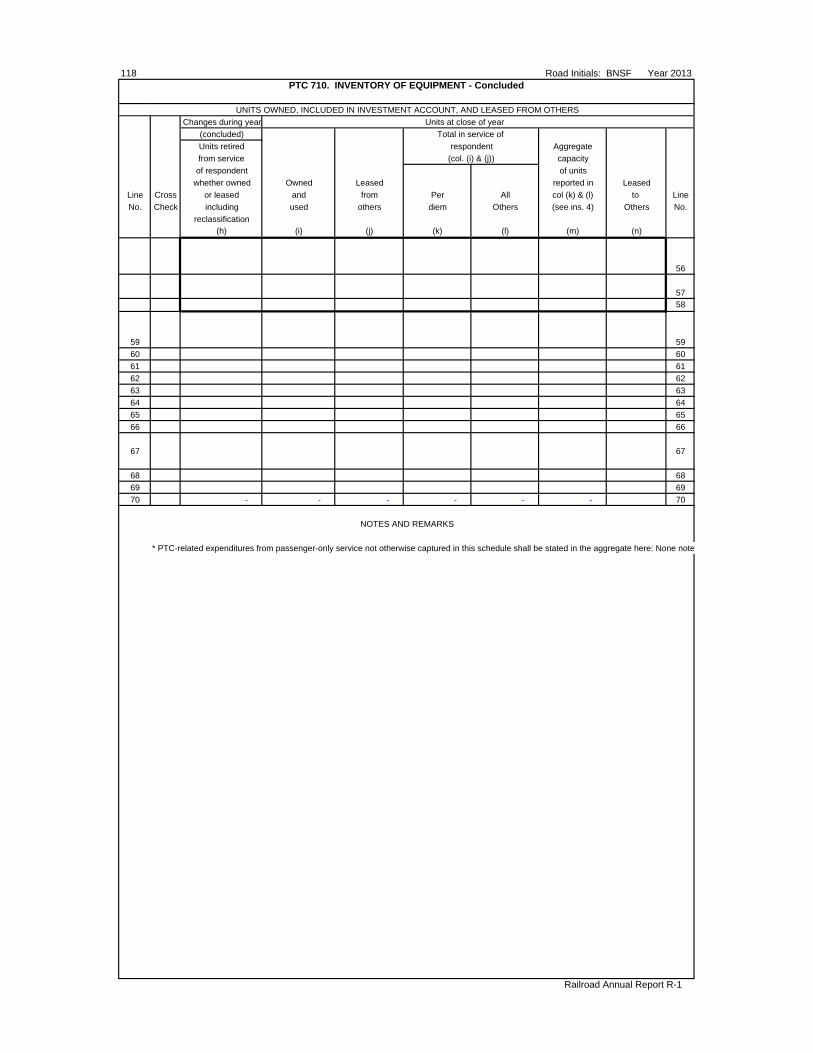
118 Road Initials: BNSF Year 2013PTC 710. INVENTORY OF EQUIPMENT - Concluded
UNITS OWNED, INCLUDED IN INVESTMENT ACCOUNT, AND LEASED FROM OTHERS
Changes during year Units at close of year
(concluded) Total in service of
Units retired respondent Aggregate
from service (col. (i) & (j)) capacity
of respondent of units
whether owned Owned Leased reported in Leased
Line Cross or leased and from Per All col (k) & (l) to Line
No. Check including used others diem Others (see ins. 4) Others No.
reclassification
(h) (i) (j) (k) (l) (m) (n)
56
57
58
59 59
60 60
61 61
62 62
63 63
64 64
65 65
66 66
67 67
68 68
69 69
70 - - - - - - 70
NOTES AND REMARKS
* PTC-related expenditures from passenger-only service not otherwise captured in this schedule shall be stated in the aggregate here: None note
Railroad Annual Report R-1
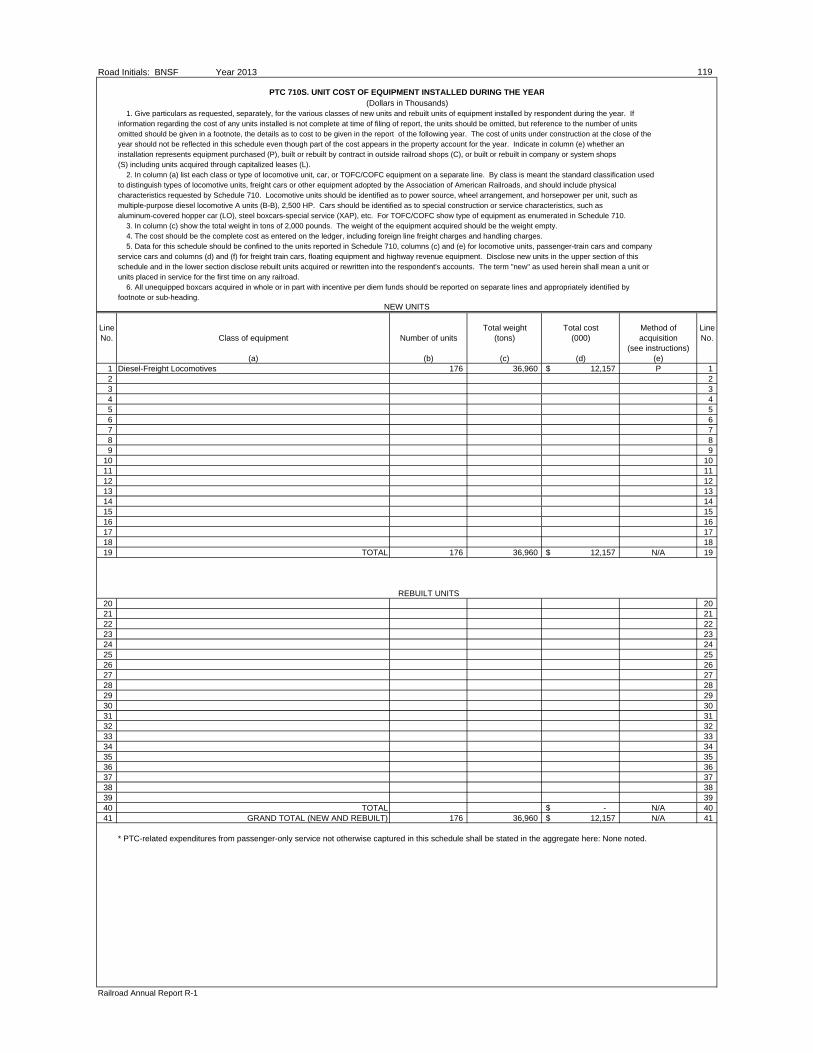
Road Initials: BNSF Year 2013
PTC 710S. UNIT COST OF EQUIPMENT INSTALLED DURING THE YEAR(Dollars in Thousands)
1. Give particulars as requested, separately, for the various classes of new units and rebuilt units of equipment installed by respondent during the year. Ifinformation regarding the cost of any units installed is not complete at time of filing of report, the units should be omitted, but reference to the number of unitsomitted should be given in a footnote, the details as to cost to be given in the report of the following year. The cost of units under construction at the close of theyear should not be reflected in this schedule even though part of the cost appears in the property account for the year. Indicate in column (e) whether aninstallation represents equipment purchased (P), built or rebuilt by contract in outside railroad shops (C), or built or rebuilt in company or system shops(S) including units acquired through capitalized leases (L). 2. In column (a) list each class or type of locomotive unit, car, or TOFC/COFC equipment on a separate line. By class is meant the standard classification usedto distinguish types of locomotive units, freight cars or other equipment adopted by the Association of American Railroads, and should include physicalcharacteristics requested by Schedule 710. Locomotive units should be identified as to power source, wheel arrangement, and horsepower per unit, such asmultiple-purpose diesel locomotive A units (B-B), 2,500 HP. Cars should be identified as to special construction or service characteristics, such asaluminum-covered hopper car (LO), steel boxcars-special service (XAP), etc. For TOFC/COFC show type of equipment as enumerated in Schedule 710. 3. In column (c) show the total weight in tons of 2,000 pounds. The weight of the equipment acquired should be the weight empty. 4. The cost should be the complete cost as entered on the ledger, including foreign line freight charges and handling charges. 5. Data for this schedule should be confined to the units reported in Schedule 710, columns (c) and (e) for locomotive units, passenger-train cars and companyservice cars and columns (d) and (f) for freight train cars, floating equipment and highway revenue equipment. Disclose new units in the upper section of thisschedule and in the lower section disclose rebuilt units acquired or rewritten into the respondent's accounts. The term "new" as used herein shall mean a unit orunits placed in service for the first time on any railroad. 6. All unequipped boxcars acquired in whole or in part with incentive per diem funds should be reported on separate lines and appropriately identified byfootnote or sub-heading.
Line Total weight Total cost Method of LineNo. Class of equipment Number of units (tons) (000) acquisition No.
(see instructions)(a) (b) (c) (d) (e)
1 Diesel-Freight Locomotives 176 36,960 12,157$ P 12 23 34 45 56 67 78 89 9
10 1011 1112 1213 1314 1415 1516 1617 1718 1819 TOTAL 176 36,960 12,157$ N/A 19
REBUILT UNITS20 2021 2122 2223 2324 2425 2526 2627 2728 2829 2930 3031 3132 3233 3334 3435 3536 3637 3738 3839 3940 TOTAL -$ N/A 4041 GRAND TOTAL (NEW AND REBUILT) 176 36,960 12,157$ N/A 41
* PTC-related expenditures from passenger-only service not otherwise captured in this schedule shall be stated in the aggregate here: None noted.
Railroad Annual Report R-1
NEW UNITS
119
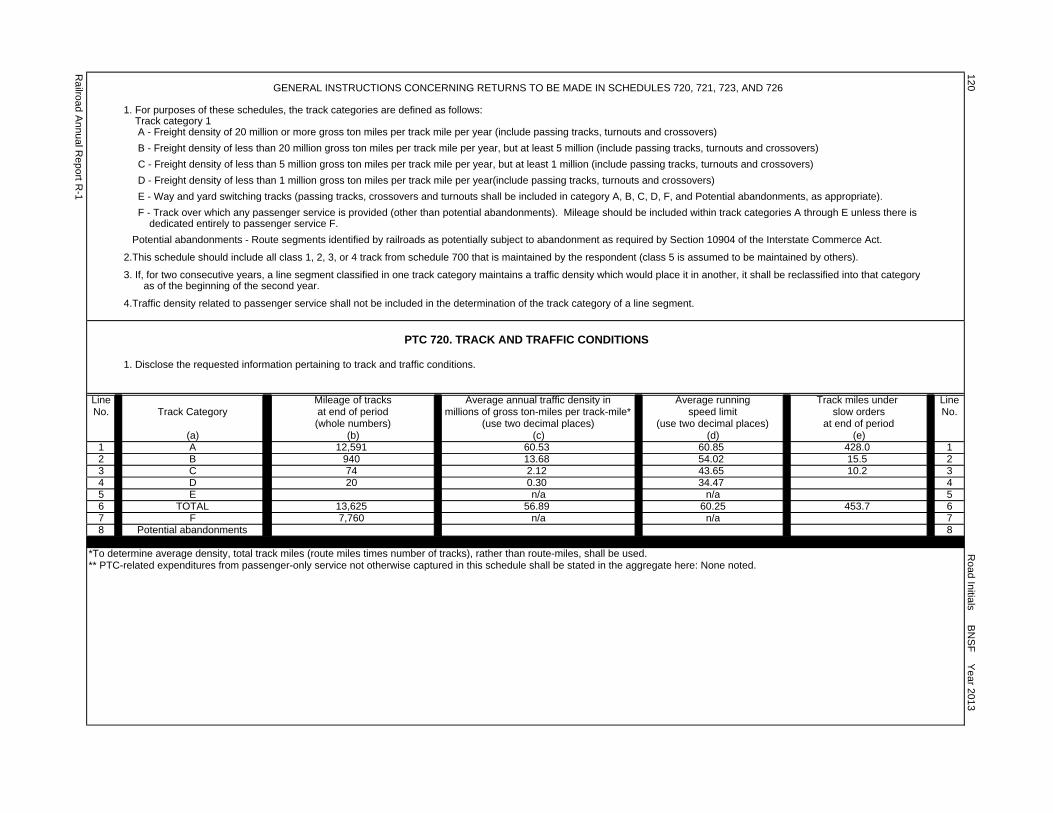
GENERAL INSTRUCTIONS CONCERNING RETURNS TO BE MADE IN SCHEDULES 720, 721, 723, AND 726
1. For purposes of these schedules, the track categories are defined as follows: Track category 1 A - Freight density of 20 million or more gross ton miles per track mile per year (include passing tracks, turnouts and crossovers)
B - Freight density of less than 20 million gross ton miles per track mile per year, but at least 5 million (include passing tracks, turnouts and crossovers)
C - Freight density of less than 5 million gross ton miles per track mile per year, but at least 1 million (include passing tracks, turnouts and crossovers)
D - Freight density of less than 1 million gross ton miles per track mile per year(include passing tracks, turnouts and crossovers)
E - Way and yard switching tracks (passing tracks, crossovers and turnouts shall be included in category A, B, C, D, F, and Potential abandonments, as appropriate).
F - Track over which any passenger service is provided (other than potential abandonments). Mileage should be included within track categories A through E unless there is dedicated entirely to passenger service F.
Potential abandonments - Route segments identified by railroads as potentially subject to abandonment as required by Section 10904 of the Interstate Commerce Act.
2.This schedule should include all class 1, 2, 3, or 4 track from schedule 700 that is maintained by the respondent (class 5 is assumed to be maintained by others).
3. If, for two consecutive years, a line segment classified in one track category maintains a traffic density which would place it in another, it shall be reclassified into that category as of the beginning of the second year.
4.Traffic density related to passenger service shall not be included in the determination of the track category of a line segment.
1. Disclose the requested information pertaining to track and traffic conditions.
Line Mileage of tracks Average annual traffic density in Average running Track miles under LineNo. Track Category at end of period millions of gross ton-miles per track-mile* speed limit slow orders No.
(whole numbers) (use two decimal places) (use two decimal places) at end of period(a) (b) (c) (d) (e)
1 A 12,591 60.53 60.85 428.0 12 B 940 13.68 54.02 15.5 23 C 74 2.12 43.65 10.2 34 D 20 0.30 34.47 45 E n/a n/a 56 TOTAL 13,625 56.89 60.25 453.7 67 F 7,760 n/a n/a 78 Potential abandonments 8
*To determine average density, total track miles (route miles times number of tracks), rather than route-miles, shall be used.** PTC-related expenditures from passenger-only service not otherwise captured in this schedule shall be stated in the aggregate here: None noted.
Ra
ilroa
d A
nn
ua
l Re
po
rt R-1
12
0 R
oa
d In
itials B
NS
F Y
ea
r 20
13
PTC 720. TRACK AND TRAFFIC CONDITIONS
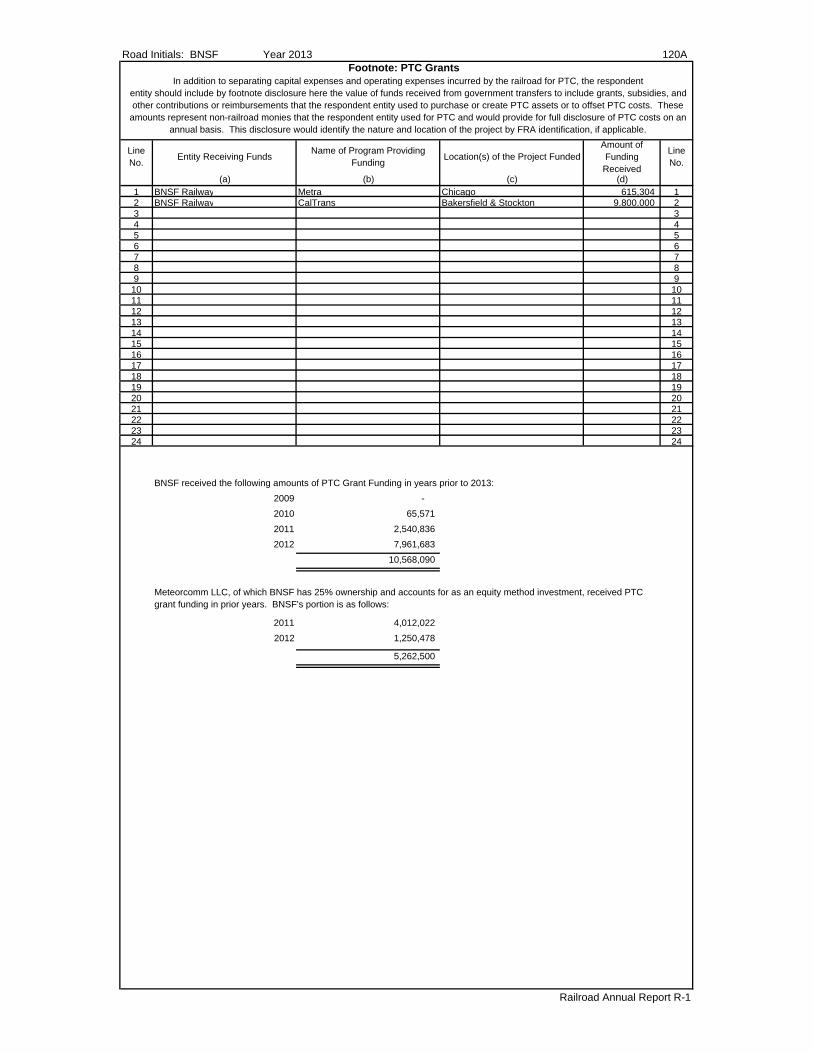
Road Initials: BNSF Year 2013 120AFootnote: PTC Grants
LineNo.
Entity Receiving FundsName of Program Providing
FundingLocation(s) of the Project Funded
Amount of Funding Received
LineNo.
(a) (b) (c) (d)1 BNSF Railway Metra Chicago 615,304 12 BNSF Railway CalTrans Bakersfield & Stockton 9,800,000 23 34 45 56 67 78 89 910 1011 1112 1213 1314 1415 1516 1617 1718 1819 1920 2021 2122 2223 2324 24
BNSF received the following amounts of PTC Grant Funding in years prior to 2013:
2009 -
2010 65,571
2011 2,540,836
2012 7,961,683
10,568,090
2011 4,012,022
2012 1,250,478
5,262,500
Railroad Annual Report R-1
In addition to separating capital expenses and operating expenses incurred by the railroad for PTC, the respondententity should include by footnote disclosure here the value of funds received from government transfers to include grants, subsidies, and other contributions or reimbursements that the respondent entity used to purchase or create PTC assets or to offset PTC costs. These
amounts represent non-railroad monies that the respondent entity used for PTC and would provide for full disclosure of PTC costs on an annual basis. This disclosure would identify the nature and location of the project by FRA identification, if applicable.
Meteorcomm LLC, of which BNSF has 25% ownership and accounts for as an equity method investment, received PTC grant funding in prior years. BNSF's portion is as follows:
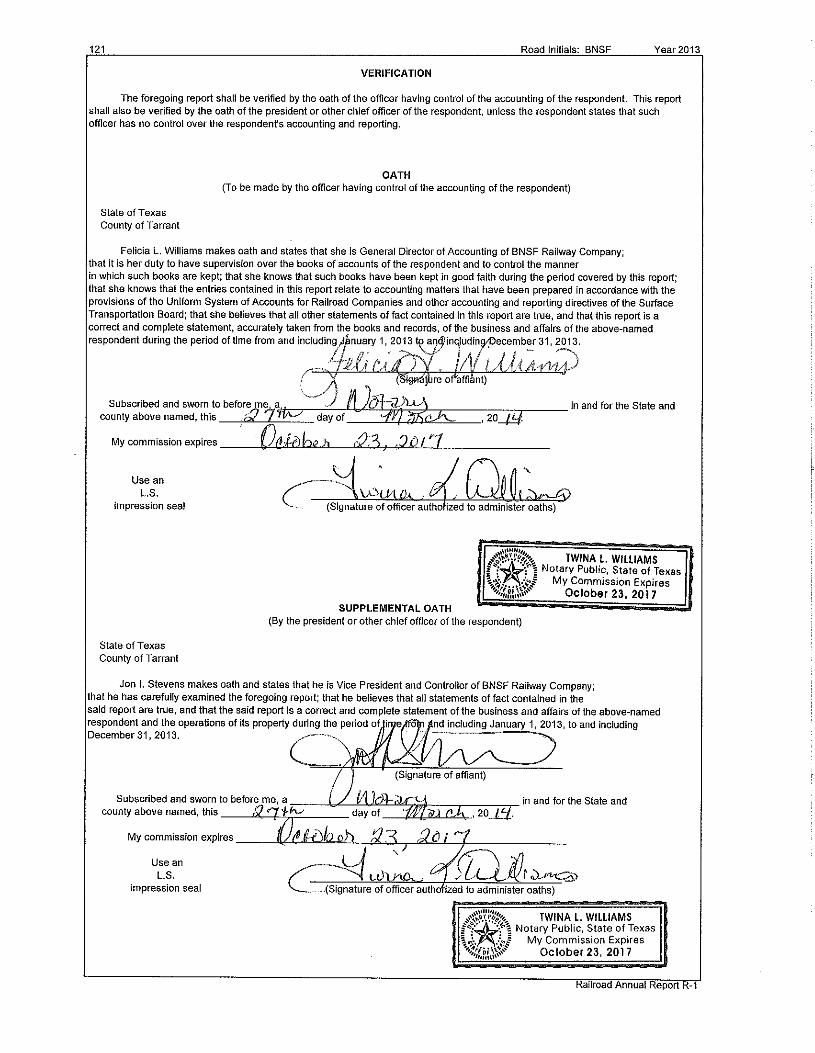
Road Initials: BNSF Year 2013 122
MEMORANDA
(FOR USE OF BOARD ONLY)
CORRESPONDENCE
Answer
Office Addressed Date of Letter, Fax, Subject Answer Date of Letter, Fax, or File Number
or Telegram Needed Telegram of Letter,
Fax, or
Name Title Month Day Year Page Month Day Year Telegram
CORRECTIONS
Authority
Date Clerk Making
Correction Page Date of Letter, Fax, Officer Sending Letter, Fax, or Telegram Board Correction
or Telegram File Number
Month Day Year Month Day Year Name Title Name
EXPLANATORY REMARKS
Railroad Annual Report R-1
Road Initials: BNSF Year 2013
INDEX
Page No.Accumulated depreciation Road and equipment leased From others 38 Improvements to 38 To others 41 Owned and used 35Accruals-Railway tax 63Analysis of taxes 63Application of funds-Source 21Balance sheet 5-9Capital stock 20Car, locomotive, and floating equipment-Classification 78-83Changes in financial position 21-22Company service equipment 79Compensating balances and short-term borrowing arrangements 67Consumption of fuel by motive-power units 91Contingent assets and liabilities 8Crossties (see Ties)Debt holdings 69Depreciation base and rates Road and equipment leased From others 34 Improvements to 32-33 To others 40 Owned and used 34Electric locomotive equipment at close of year 68Equipment-classified 78-83 Company service 79 Floating 82-83 Freight-train cars 80-81 Highway revenue equipment 82-83 Passenger-train cars 78-79 Inventory 78-83 Owned-Not in service of respondent 78Equipment-Leased, depreciation base and rate From others 34 Improvements to 37 Reserve 38 To others 40 Reserve 41Equipment-Owned, depreciation base rates 34 Reserve 35Expenses-railway operating 45-53Extraordinary items 17Federal income taxes 63Financial position-Changes in 21-22Floating equipment 82-83Freight cars loaded 94Freight-train cars 80-81Freight car-miles 94Fuel consumed diesel 91 Cost 91Funded debt (see Debt holdings)Guaranties and suretyships 66Identity of respondent 2Items in selected income and retained earnings accounts 65Investments in common stocks of affiliated companies 30Investments and advances of affiliated companies 26-29 Railway property used in transportation service 42-43 Road and equipment 32-33 Changes during year 32-33 Leased property-improvements made during the year 32-33Leases 61Locomotive equipment 78 Electric and other 78 Consumption of fuel diesel 78Locomotive unit miles 91
Railroad Annual Report R-1
123
Road Initials: BNSF Year 2013
INDEX - Continued
Page No.
Mileage-Average of road operated 85 Of new tracks in which rails were laid 88 Of new tracks in which ties were laid 87Miscellaneous items in retained income accounts for the year 65Motorcar car miles 94Motor rail cars owned or leased 79Net income 17Oath 98Operating expenses (see Expenses) Revenues (see Revenues) Statistics (see Statistics)Ordinary income 16Private line cars loaded 95Private line cars empty 95Rails Laid in replacement 88 Charges to operating expenses 45 Additional tracks, new lines, and extensions 89 Miles of new track in which rails were laid 88 Weight of 89Railway--Operating expenses 45-53Railway--Operating revenues 16Results of Operations 16-17Retained income unappropriated 19 Miscellaneous items in accounts for year 11Revenues Freight 16 Passenger 16Road and equipment-Investment in 32-33 Improvements to leased property 32-33 Reserve 38 Leased to others-Depreciation base and rates 40 Reserve 41 Owned-Depreciation base and rates 34 Reserve 35 Used-Depreciation base and rates 34 Reserve 35Road-Mileage operated at close of year 74 By States and Territories 75Securities (see Investments)Short-term borrowing arrangements-compensating balances and 67Sinking funds 7Source and application of working capital 21-22Specialized service subschedule 60Statement of changes in financial position 21-22Stock outstanding 20 Changes during year 20 Number of security holders 3 Total voting power 3-4 Value per share 3 Voting rights 3Supporting schedule-Road 56-57Suretyships-Guaranties and 66Ties laid in replacement 86Ties-Additional tracks, new lines, and extensions 87Tracks operated at close of year 74 Miles of, at close of year 75Track and traffic conditions 85Train hours, yard switching 97Train miles 94Tons of freight 97Ton-miles of freight 97TOFC/COFC number of revenue trailers and containers - loaded & unload 97Voting powers and elections 3Weight of rail 90
Railroad Annual Report R-1
124