Embed Size (px)
Citation preview

February 5, 2015
BMO 12th Annual Infrastructure & Utilities ConferenceInvestor Presentation
Pierre Despars
Executive Vice President, Corporate Affairs
and Chief Financial Officer

Cautionary note
Certain statements contained in this presentation may be forward-looking pursuant to applicable securities laws. Such forward-looking
statements reflect the intentions, plans, expectations and opinions of the management of Gaz Métro inc., acting in its capacity as General
Partner of Gaz Métro Limited Partnership (“Gaz Métro”), (the “Management”) and are based on information currently available to
Management and assumptions about future events. Forward-looking statements involve known and unknown risks and uncertainties and
other factors outside Gaz Métro’s control. A number of factors could cause actual results of Gaz Métro to differ materially from the current
expectations as expressed in the forward-looking statements.
Although these forward-looking statements are based upon what Management believes to be reasonable assumptions, Gaz Métro cannot
assure investors that actual results will be consistent with these forward-looking statements. These forward-looking statements are made as
of the date of this presentation, and Gaz Métro assumes no obligation to update or revise them to reflect new events or circumstances, except
as required pursuant to applicable securities laws. You are cautioned not to place undue reliance on these forward-looking statements. The
complete version of the cautionary note regarding forward-looking statements as well as a description of the relevant assumptions and risk
factors likely to affect Gaz Métro’s actual results are included in the Management’s Discussion and Analysis for the fiscal year ended
September 30, 2014 of Gaz Métro inc., which is available on SEDAR under Gaz Métro inc.’s profile at www.sedar.com.
Non-GAAP Financial Measures
In the opinion of Management, certain indicators, such as net income attributable to the Partners of Gaz Métro, excluding non-recurring items
(“recurring net income”), provide readers with information considered useful for analyzing the financial results of Gaz Métro. However, these
indicators are not standardized in accordance with Canadian generally accepted accounting principles (“GAAP”) and should not be
considered in isolation or as substitutes for other performance measures that are in accordance with GAAP. The results obtained might not be
comparable with similar indicators used by other issuers and should therefore be considered only as complementary information.
1
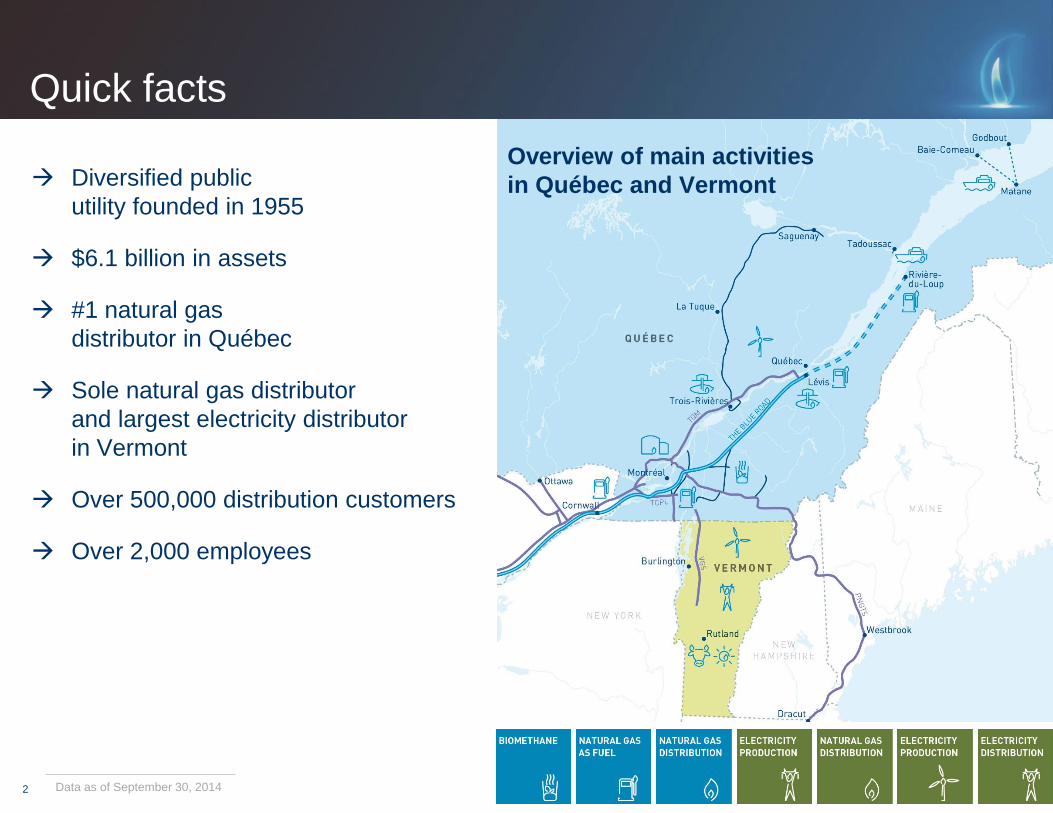
Quick facts
Diversified public
utility founded in 1955
$6.1 billion in assets
#1 natural gas
distributor in Québec
Sole natural gas distributor
and largest electricity distributor
in Vermont
Over 500,000 distribution customers
Over 2,000 employees
2 Data as of September 30, 2014
Overview of main activities
in Québec and Vermont

Highlights
Regulated asset base with predictable returns
Nearly all recurring net income generated by regulated activities
Increasingly diversified public utility through a prudent
and targeted diversification strategy
Total assets have more than doubled since 2006
Strong sponsorship from key interest owners
Strong and predictable financial performance
Strong credit ratings from internationally
recognized rating agencies
3

Business segments
Energy
Distribution
Transportation of
Natural Gas
Energy Services,
Storage and OtherEnergy Production
% of net income
F201491.3% 8.7% n.m. n.m.
4
Storage: Regulated
Others: Non-regulated
Non-regulatedRegulated

Natural gas distribution in Québec
1 Projected rate base in the 2015 rate case filed with the Régie de l’énergie.
Approved ROE for fiscal 2015.
Distributes ≈ 97%of natural gas in Québec
Over 10,000 kmof pipeline
300municipalities served
≈ 195,000 customers
Regulated assets:
≈ $1.9 billion1
Authorized ROE:
8.90%1

Natural gas distribution in Québec: our customers1
61 Fiscal year 2014
RESIDENTIAL COMMERCIAL INDUSTRIAL
Customers 139,445 71.3% Customers 48,600 24.8% Customers 7,572 3.9%
Volume 20.1 Bcf 10.0% Volume 62.3 Bcf 30.9% Volume 119.1 Bcf 59.1%
% of distribution revenues ≈ 21% % of distribution revenues ≈ 45% % of distribution revenues ≈ 34%

7
Natural gas distribution in Vermont
Wholly-owned since
1986
Sole gas distributor in Vermont
≈ 47,000 customers
1 Based on 2015 rate case as approved by Vermont Public Service Board (VPSB). Regulated assets include US$89M related to investments for Phase I. 2 Phase II subject to VPSB’s approval (Phase I approved in December 2013)
Projects to extend
distribution network2
Phase I to service Vergennes
and Middlebury
Phase II to service International
Paper Mill (NY State)
Investments: US$154M
for Phase I
Commissioning of Phase I
expected in 2016
Regulated assets:
≈ US$215M1
Authorized ROE:
10.20%1

8
Electricity distribution in Vermont
Acquisition of Green Mountain
Power (GMP) in
2007
Acquisition of Central Vermont
Public Service (CVPS) in
2012
1 Based on 2015 rate case as approved by Vermont Public Service Board (VPSB)
≈ 70%of electricity distribution market
in Vermont
≈ 260,000customers
Regulated assets:
≈ US$1.2B1
Authorized ROE:
9.60%1

Asset base diversification since 2006
In 2005, adoption of development and diversification strategy to reduce exposure
to the Québec natural gas distribution activity and become a diversified energy provider Entry in Vermont electricity distribution market
Participation in the Seigneurie de Beaupré Wind Farms (340 MW)
As a result of the successful execution of this strategy, Gaz Métro reduced its asset
exposure to Québec natural gas distribution from 72.5% in 2006 to 38.3% in 2014
9
2006$2.8 billion in assets≈ 200,000 customers
2014$6.1 billion in assets
≈ 500,000 customers
Natural gas distribution in Québec
Natural gas distribution in Vermont
Natural gas transportation
Energy services, Storage and Other
Natural gas distribution in Québec
Natural gas and electricity
distribution in Vermont
Natural gas transportation
Energy production
Energy services, Storage and Other
Data for fiscal years ended September 30, 2006 and 2014
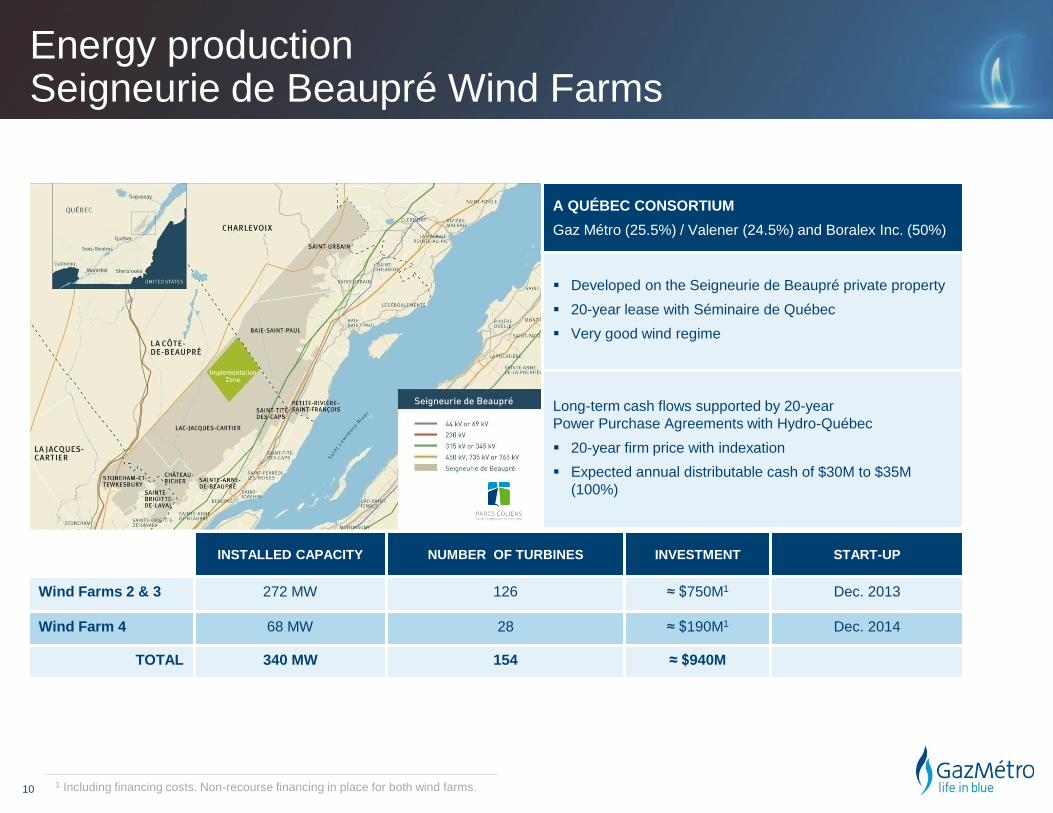
Energy productionSeigneurie de Beaupré Wind Farms
101 Including financing costs. Non-recourse financing in place for both wind farms.
A QUÉBEC CONSORTIUM
Gaz Métro (25.5%) / Valener (24.5%) and Boralex Inc. (50%)
Developed on the Seigneurie de Beaupré private property
20-year lease with Séminaire de Québec
Very good wind regime
Long-term cash flows supported by 20-year
Power Purchase Agreements with Hydro-Québec
20-year firm price with indexation
Expected annual distributable cash of $30M to $35M
(100%)
INSTALLED CAPACITY NUMBER OF TURBINES INVESTMENT START-UP
Wind Farms 2 & 3 272 MW 126 ≈ $750M1 Dec. 2013
Wind Farm 4 68 MW 28 ≈ $190M1 Dec. 2014
TOTAL 340 MW 154 ≈ $940M

Energy productionSeigneurie de Beaupré Wind Farms
11

A significant environmental advantage
-32% GHGs compared to FUEL OIL
Up to -25% GHGs compared to DIESEL
12
Electricity
Heavy fuel oil, gasoline and diesel
Natural gas
Increase
natural gas
presence
Quebec energy consumption
39.7% 38.1% 13.8%
Source: Ministère de l’énergie et des Ressources naturelles (2011 data)

Liquefied natural gas
Partnership with Government of Quebec
through Investissement Québec (IQ)
$118M investment in which IQ
will contribute up to $50M
Project to triple the liquefaction
capacity of Gaz Métro’s LSR1
plant located in Eastern Montreal Provide LNG to industries located outside main
distribution network such as Nord-du-Québec
and Côte-Nord regions
Target road and maritime transportation sectors
Capacity expected to be available
by end of 2016
13 1 Gaz Métro’s natural gas liquefaction, storage and re-gasification plant

Ownership structure
Caisse de dépôt et placement
du Québec (“CDPQ”) 25.9% indirect ownership in Gaz Métro
Enbridge Inc. 27.6% indirect ownership in Gaz Métro
Valener (TSX: VNR) Publicly-traded company whose main
asset consists of a 29.0% direct interest
in Gaz Métro
Provides Gaz Métro with potential access
to public equity market as required
Also owns 24.5% of the Seigneurie de
Beaupré Wind farms (340 MW contracted)
14 * CDPQ is Trencap’s controlling shareholder (59.64%)
Principal Interest Owners Corporate Structure
100%
100%
61.11%
100%
38.89%
71%
29%
25.5%
24.5%
TRENCAP
NOVERCO
GAZ MÉTRO INC. (the Issuer)
PUBLIC
SEIGNEURIE DE BEAUPRÉ WIND
FARMS (ENERGY PRODUCTION)
ENERGY
DISTRIBUTION
TRANSPORTATION OF
NATURAL GAS
ENERGY SERVICES,
STORAGE & OTHER
*
(THE GUARANTOR)

Key features of trust indenture
Gaz Métro inc. (GMi) (the “Issuer”)
Single purpose entity
General Partner of Gaz Métro
Financing vehicle for Gaz Métro
First mortgage bonds secured by the assets of GMi and Gaz Métro
(including Gaz Métro’s network)
Debt issuance test (Gaz Métro level)
No additional debt unless:
Funded Debt / Aggregate Capitalization ≤ 65%
Interest Coverage (EBIT) ≥ 1.5x
Distribution test (Gaz Métro level)
No distributions unless Funded Debt / Aggregate Capitalization ≤ 75%
Maintenance of regulated activities
Interest in non-regulated energy activities not to exceed 10%
of Gaz Métro’s assets (sub-level of 5% for non-energy activities)
15

Financial strength
16
S&P DBRS
Corporate / Issuer rating A (stable) A (stable)
Senior debt rating A+ (stable) A (stable)
Strong credit ratings

Strong financial preformance
151,3
147,5
151,6
165,7
174,7
130
135
140
145
150
155
160
165
170
175
180
2010 2011 2012 2013 2014
17
3.7% compound annual
growth rate (CAGR)
Recurring net income ($ millions)
Fiscal year

Strong key ratios
Regulated businesses provide Gaz Métro with significant stability and
predictability in its cash flows
Total debt / total capitalization ratio of 68.1% as of September 30, 2014
(consolidated basis)
18
Total Debt is defined as the sum of long-term debt, current portion of long-term debt and bank loans, and Total Capitalization is
defined as Total Debt plus total shareholders’ equity plus minority interests. Interest Coverage is defined as EBIT (Earnings Before
Interest and Taxes, including share in earnings of entities subject to significant influence) / Interest Expense.
Funds from Operations is defined as cash flows related to operating activities (before change in non-cash working capital items).
0,0%
10,0%
20,0%
30,0%
40,0%
50,0%
60,0%
70,0%
80,0%
0,0
0,5
1,0
1,5
2,0
2,5
3,0
3,5
4,0
4,5
5,0
2010 2011 2012 2013 2014
Interest Coverage Total Debt / Total Capitalization Funds from Operations / Average Total Debt
Fiscal year

Debt maturity profile
Staggered debt maturity profile
No significant short term refinancing risk
19
0
50
100
150
200
250
20
15
20
16
20
17
20
18
20
19
20
20
20
21
20
22
20
23
20
24
20
25
20
26
20
27
20
28
20
29
20
30
20
31
20
32
20
33
20
34
20
35
20
36
20
37
20
38
20
39
20
40
20
41
20
42
20
43
20
44
20
45
20
46
20
47
20
48
20
49
20
50
20
51
20
52
C$ First Mortgage Bonds US$ Senior Secured Notes$ millions
Fiscal year

Cash flows from operations
& credit facilities of ≈ $226M
Long-term debt of ≈ $93M1
Contribution from Investissement
Québec of ≈ $21M
Equity injection from GMi of ≈ $85M2
Equity injection from Valener
of ≈ $35M2
CAPEX of ≈ $390M for
extensions and improvements
to energy distribution systems Gaz Métro-QDA: ≈ $130M
VGS & GMP: ≈ $240M
Other: ≈ $20M
CAPEX of ≈ $50M
for LSR plant expansion
CAPEX of ≈ $20M
to complete wind farm 4
Expected cash requirements for fiscal 2015
20
≈ $460M
1 $20M project financing non-recourse to Gaz Métro and Valener. Already funded (included in restricted cash).
Remaining portion in US$ converted at C$1.122 Additional equity could be required depending on impact of CATS regulation
Note: amounts presented on consolidated basis
Requirements Sources

Questions?21