Embed Size (px)
Citation preview

BMO 16th Annual Infrastructure
& Utilities Conference
Aida CipollaEVP & CFO
February 7, 2019
Toronto Hydro Corporation
Disclaimer
2 | BMO 16th Annual Infrastructure & Utilities Conference
This document is not intended to provide the basis of any credit or other evaluation, does not constitute or form part of any offer or invitation to sell or issue, or any solicitation of any
offer to purchase or subscribe for, any securities, nor shall any part of this document form the basis of, or be relied on in connection w ith, any contract or investment decision in
relation to any securities. This document does not constitute any form of commitment, recommendation, representation or w arrantyon the part of Toronto Hydro Corporation and its affiliates (collectively, “Toronto Hydro”). No reliance should be placed on the accuracy or completeness of the information contained in this document.
Certain information included in this document constitutes "forward-looking information" w ithin the meaning of applicable securities legislation. The purpose of the forward-looking
information is to provide Toronto Hydro’s current expectations regarding future results of operations, performance, business prospects and opportunities and may not be appropriate for other purposes. All information, other than statements of historical fact, w hich address activities, events or developments that w e expect or anticipate may or w ill occur in the
future, are forward-looking information. The w ords "anticipates", "believes", "budgets", "committed", "can", "could", "estimates", "expects", "focus", "forecasts", "intends", "may",
"might", "plans", "propose", "projects", "schedule", "should", "will", "would", "objective", "outlook" or the negative or other variations of these w ords or other comparable w ords or
phrases, are intended to identify forward-looking information, although not all forward-looking information contains these identifying w ords. The forward-looking information reflects Toronto Hydro’s current beliefs and is based on information currently available to Toronto Hydro.
Specif ic forward-looking information in this document includes, but is not limited to, statements regarding: Toronto Hydro’s electricity distribution rates and rate applications; capital
expenditure programs; Toronto Hydro’s future results of operations, performance, business prospects and opportunities; future funding; future investment f lexibility; the aging of assets; regulator-approved returns on equity; the impact of Ontario’s Fair Hydro Plan; the amount and timing of dividends to be paid; Toronto Hydro’s debt and debt maturity profile;
and pilot projects being considered.
The forw ard-looking information is based on estimates and assumptions made by Toronto Hydro’s management in light of past experience and perception of historical trends, current conditions and expected future developments, as w ell as other factors that management believes to be reasonable in the circumstances, including, but not limited to, the
amount of indebtedness of Toronto Hydro, changes in funding requirements, the future course of the economy and financial markets, no unforeseen delays and costs in Toronto
Hydro’s capital projects, no unforeseen changes in the legislative and operating framew ork for electricity distribution in On tario, the receipt of applicable regulatory approvals and
requested rate orders, no unexpected delays in obtaining required approvals, the ability of Toronto Hydro to obtain and retain qualif ied staff, equipment and services in a timely and cost eff icient manner, no unforeseen changes in electricity distribution rate orders or rate setting methodologies, no unfavourable changes in environmental regulations,no
unfavourable changes in electricity regulations or government policy, no unforeseen change of landscape for competitive forces in the electricity distribution industry in Ontario, the
useful life of assets, the future prices of components of residential electricity prices, the impact of Ontario’s Fair Hydro Plan, the receipt of favourable judgments, the level of interest
rates, Toronto Hydro’s ability to borrow, Toronto Hydro’s credit ratings, customer demand, and assumptions regarding general business and economic conditions.
The forw ard-looking information is subject to risks, uncertainties and other factors that could cause actual results to differ materially from historical results or results anticipated by
the forward-looking information, w hich are discussed in sections entitled "Forw ard-Looking Information" and "Risk Factors" in Toronto Hydro Corporation’s annual information form
(“AIF”) and the sections entitled "Forw ard-Looking Information" and "Risk Management and Risk Factors" in Toronto Hydro Corporation's management's discussion and analysis (“MD&A”), w hich are available electronically at www.sedar.com. All of the forward-looking information included in this document is qualif ied by the cautionary statements in this
"Disclaimer" section and the sections entitled "Forw ard-Looking Information" and "Risk Factors" in Toronto Hydro’s AIF and the sections entitled "Forw ard-Looking Information" and
"Risk Management and Risk Factors" in Toronto Hydro Corporation's MD&A. These factors are not intended to represent a complete list of the factors that could affect Toronto
Hydro; how ever, these factors should be considered carefully and readers should not place undue reliance on forward-looking information provided herein.
Further, the information (including forward-looking information) contained herein is dated as of the date of this document or as of the date specif ied in this document, as the case
may be, and Toronto Hydro has no intention and undertakes no obligation to update or revise any forward-looking information, w hether as a result of new information, future events
or otherw ise, except as required by law .

Toronto Hydro Corporation3 | BMO 16th Annual Infrastructure & Utilities Conference
Business Overview
Toronto Hydro Corporation (THC) owns the electricity distribution company
serving Toronto, Canada’s largest city.
A leader in conservation and demand management, Toronto Hydro distributes
approximately 19% of the electricity consumed in Ontario, and owns and
operates $4.4 billion of capital assets.
Generation Transmission Distribution
Annual Report 2017

Toronto Hydro Corporation4 | BMO 16th Annual Infrastructure & Utilities Conference
Company Overview
Toronto Hydro Electricity Distribution System
is comprised of…..
178,800 poles
60,540 distribution transformers
17,350 primary switches
15,540 kilometres of overhead wires
13,220 kilometres of underground wires
153 in-service municipal substations
5 operations centres
1 transmission system terminal station
1 control centre
Annual Report 2017
$4.4 billion
Toronto Hydro Corporation5 | BMO 16th Annual Infrastructure & Utilities Conference
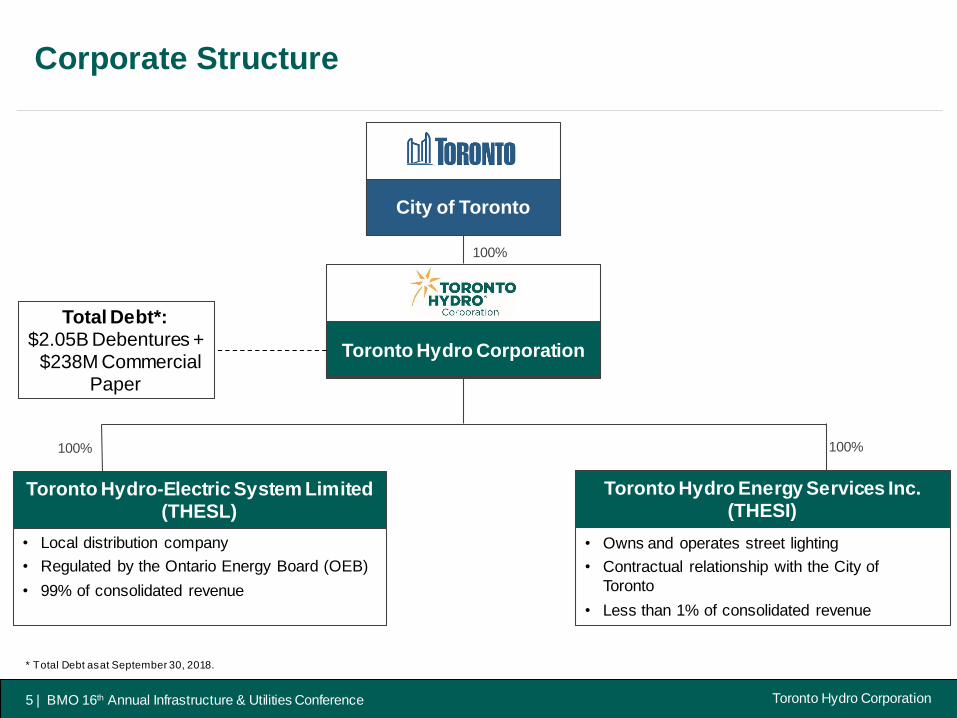
Corporate Structure
100%
100% 100%
City of Toronto
Toronto Hydro-Electric System Limited (THESL)
• Local distribution company
• Regulated by the Ontario Energy Board (OEB)
• 99% of consolidated revenue
Toronto Hydro Energy Services Inc. (THESI)
• Owns and operates street lighting
• Contractual relationship with the City of
Toronto
• Less than 1% of consolidated revenue
Toronto Hydro Corporation
Total Debt*:$2.05B Debentures +
$238M Commercial Paper
* Total Debt as at September 30, 2018.

Toronto Hydro Corporation6 | BMO 16th Annual Infrastructure & Utilities Conference
Corporate Strategy

Toronto Hydro Corporation7 | BMO 16th Annual Infrastructure & Utilities Conference
Shareholder Direction: Guiding Principles
Operate efficiently & on a commercially prudent basis
Maintain a reliable & efficient
distribution System
Be environmentally
responsible
Engage in effective
recruitment and procurement
practices
Optimize Return on
Equity (ROE)
Maintain compliance with all laws
Shareholder
Direction

Toronto Hydro Corporation8 | BMO 16th Annual Infrastructure & Utilities Conference
Corporate Pillars
Toronto Hydro Corporation9 | BMO 16th Annual Infrastructure & Utilities Conference
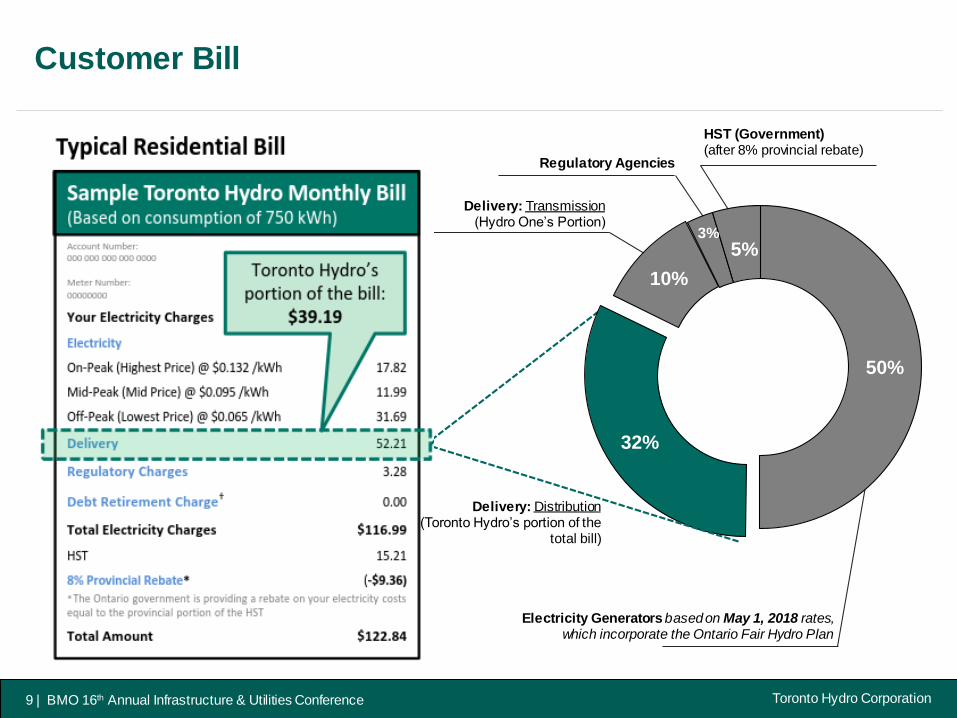
Customer Bill
50%
32%
10%
3%
5%
HST (Government)(after 8% provincial rebate)
Regulatory Agencies
Delivery: Transmission(Hydro One’s Portion)
Electricity Generators based on May 1, 2018 rates, which incorporate the Ontario Fair Hydro Plan
Delivery: Distribution(Toronto Hydro’s portion of the
total bill)

Toronto Hydro Corporation10 | BMO 16th Annual Infrastructure & Utilities Conference
Customer Profile
11%89%
*0.01%,Large Users
Customer Mix 2017~ 768K Customers
ResidentialService2
GeneralService1
Large Users3
1 Premises other than "Residential“ with a monthly peak demand of less than 5,000kW2 Domestic or household purposes (including single family or individually metered multi-family units and seasonal occupancy) 3 Customer with a monthly peak demand of 5,000kW or more averaged over a twelve -month period
Numbers are rounded and are based on Annual Information Form 2017
67%
27%7%
Total Service Revenue Mix 2017$3,742 Millions (M)

Toronto Hydro Corporation11 | BMO 16th Annual Infrastructure & Utilities Conference
Regulatory Affairs

Toronto Hydro Corporation12 | BMO 16th Annual Infrastructure & Utilities Conference
Regulatory Updates
Toronto Hydro enjoys a sustainable business model supported by a robust
regulatory framework
THESL is currently in its final year of the Custom Incentive Regulation (CIR)
Application (2015-2019)
Deemed capital structure of 60% debt / 40% equity; actual of 55.5% / 44.5% as
at September 30, 2018
The CIR Application for 2020-2024period was submitted in August 2018
The Application includes an ask of $4.3B for capital and operating spending
Interrogatories were submitted in January 2019
Technical Conference scheduled in February 2019
Oral Hearing expected in 2019

Toronto Hydro Corporation13 | BMO 16th Annual Infrastructure & Utilities Conference
2020-2024 Proposed Plan
Based on 2020-2024 CIR Application submitted to OEB and subjected to their approval
33%
40%
16%
9%
3%
Toronto Hydro Corporation14 | BMO 16th Annual Infrastructure & Utilities Conference
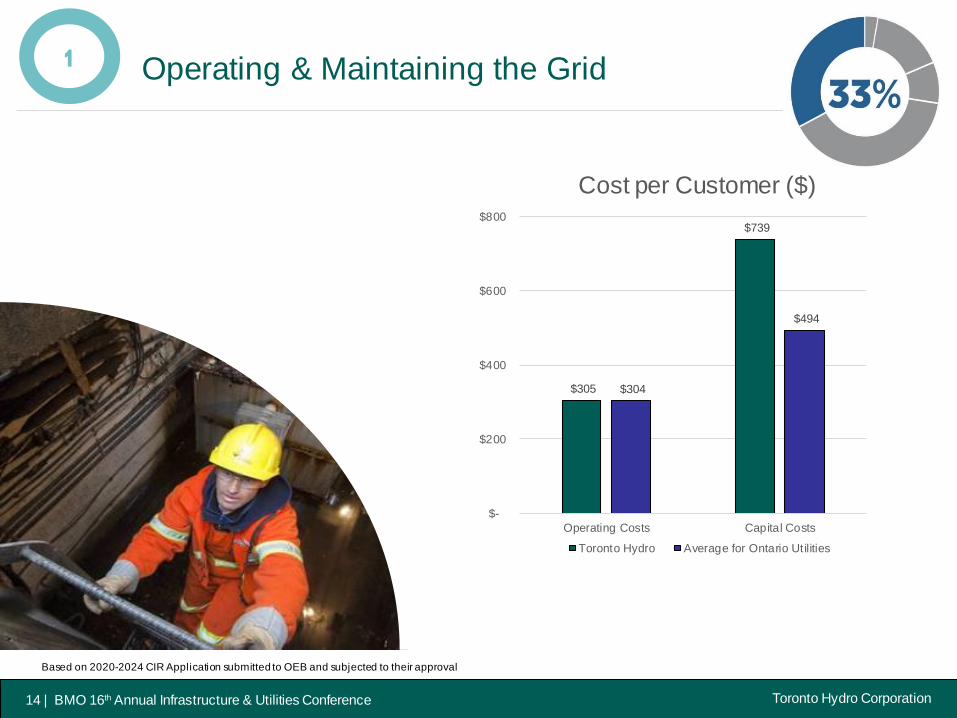
Based on 2020-2024 CIR Application submitted to OEB and subjected to their approval
Operating & Maintaining the Grid1
$305
$739
$304
$494
$-
$200
$400
$600
$800
Operating Costs Capital Costs
Cost per Customer ($)
Toronto Hydro Average for Ontario Utilities
1

Toronto Hydro Corporation15 | BMO 16th Annual Infrastructure & Utilities Conference
Based on 2020-2024 CIR Application submitted to OEB and subjected to their approval
Addressing Safety and Reliability 2
*Tree Contacts, Human Elements

Toronto Hydro Corporation16 | BMO 16th Annual Infrastructure & Utilities Conference
Based on 2020-2024 CIR Application submitted to OEB and subjected to their approval
16
Meeting the Needs of a Growing City
Source: Toronto City Planning Division, Research and Information, September 2016
3

Toronto Hydro Corporation17 | BMO 16th Annual Infrastructure & Utilities Conference
Based on 2020-2024 CIR Application submitted to OEB and subjected to their approval
17
4 Keeping the Business Running

Toronto Hydro Corporation18 | BMO 16th Annual Infrastructure & Utilities Conference
Innovation & Planning for the Future5
*Based on 2020-2024 CIR Application submitted to OEB and subjected to their approval
18

Toronto Hydro Corporation19 | BMO 16th Annual Infrastructure & Utilities Conference
BELOW THE
RATE OF INFLATION
Based on 2020-2024 CIR Application submitted to OEB and subjected to their approval
19
Proposed Plan: Customer Bill Impact
BELOW THE
RATE OF INFLATION
These costs shown are the average annual impacts on your monthly bill for each of the five years of the plan (2020-2024)
1.7%
AVERAGE ANNUAL
INCREASE ON
TORONTO HYDRO’S
1/3 OF THE BILL(RESIDENTIAL)

Toronto Hydro Corporation20 | BMO 16th Annual Infrastructure & Utilities Conference
Financial Highlights

Toronto Hydro Corporation21 | BMO 16th Annual Infrastructure & Utilities Conference
Distribution Revenue and Net Income Growth ($ in Millions)
Distribution Revenue grew at a CAGR of 5.8%
Net Income grew at a CAGR of 6.7%
Numbers up to 2014 are based on US GAAP and numbers beyond 2014 are based on IFRS accounting standards
121112
127
151 157
92 89
52
128 121135
2013 2014 2015 2016 2017 2018
Net Income-Full Year Net Income-9 Months
578 554 555
648724
402 420 424489
543 510
2013 2014 2015 2016 2017 2018
Revenue-Full Year Revenue-9 Months

Toronto Hydro Corporation22 | BMO 16th Annual Infrastructure & Utilities Conference
Rate Base and Capital Expenditures ($ in Millions)
THESL Rate Base grew at a CAGR of 9.6% over 2013-17, generating strong,
consistent financials
OEB approved funding for THESL`s capital expenditure programs of over $2 B
for 2015-19
446
586533 546 545
2013 2014 2015 2016 2017
2,663 2,755 3,213
3,550 3,851
2013 2014 2015 2016 2017
Numbers up to 2014 are based on US GAAP and numbers beyond 2014 are based on IFRS accounting standards

Toronto Hydro Corporation23 | BMO 16th Annual Infrastructure & Utilities Conference
Stable Credit Ratings
DBRS and S&P affirmed Toronto Hydro`s Long Term Issuer Ratings at A, with
Stable outlook in 2018
Rating Agency Issuer Rating Long-Term Debt Commercial Paper
DBRS A / Stable A / Stable R-1 (Low)
S&P A / Stable A / - - / -
AFFO is calculated as EBITDA – Net financing charges – Current tax + Net movements in Regulatory Accounts. LTM stands for Last T welve Months
Debt is calculated as the sum of Short-term and Long-term debt
17.9%
13.8%
13.0%13.5%
16.2%15.6%
0.0%
4.0%
8.0%
12.0%
16.0%
20.0%
2013 2014 2015 2016 2017 TTM Sep
2018
AFFO/Debt
57.0%
60.7%
62.4%
62.2%
55.6% 55.5%
52.0%
54.0%
56.0%
58.0%
60.0%
62.0%
64.0%
2013 2014 2015 2016 2017 TTM Sep
2018
Debt-to-Capitalization

Toronto Hydro Corporation24 | BMO 16th Annual Infrastructure & Utilities Conference
Liquidity
Toronto Hydro’s treasury objective is to ensure sufficient liquidity is available to
meet the needs of the business while minimizing financing costs
The company also has a Commercial Paper Program backed by the revolving
credit facility
Toronto Hydro’s weighted average interest rate on its short-term debt of $223M was
1.58% for the 9 months ending September 2018
Liquidity as of Sept. 30, 2018
Facility Type Size Availability
Revolving Credit Facility(maturing Oct. 2023)
$800M* $562M
Prudential Facility (LC) $75M $39.7M
Working Capital Facility $20M $20M
Total $895M $621.7M
* Includes Commercial Paper Program, which has a limit of $600M

Toronto Hydro Corporation
250
300
250
200 200 200 200 200
245
0
50
100
150
200
250
300
350
2019 2021 2023 2026 2040 2044 2045 2048 2063
25 | BMO 16th Annual Infrastructure & Utilities Conference
Debt Maturity Profile ($ in Millions)
Maturing
in
Nov`19Issued
in
Nov`17

Toronto Hydro Corporation26 | BMO 16th Annual Infrastructure & Utilities Conference
Toronto Hydro in Summary
Pure play in regulated local distribution
Electricity distribution accounts for 99% of Toronto Hydro’s business
Strong franchise area
Serves Canada’s largest city
Favourable customer mix
Recession-resistant and stable customer base
Largest users include the City of Toronto, major universities, hospitals and
office towers
Solid financial profile
Stable regulated earnings and cash flow
Stable regulatory environment
Monopoly electricity business

Toronto Hydro Corporation
CONTACT INFORMATION
Toronto Hydro Corporation14 Carlton Street
Toronto, OntarioM5B 1K5
(416) [email protected]
Questions