Embed Size (px)
Citation preview

February 10, 2017
ICICI Securities Ltd | Retail Equity Research
Result Update
Lacklustre profitable growth; revival key... • BlueDart’s (BDE) revenues revived post underperformance over two
consecutive quarters. Revenues grew 10.4% YoY (up 8.6% QoQ) to | 720 crore (I-direct estimates: | 665.4 crore). Contribution from B2C sequentially grew 400 bps QoQ (flat YoY) to 26%. Growth in B2B business remains sluggish
• EBITDA margins were at a two year low of 8% mainly impacted by exceptional other expenses to the extent of | 18.7 crore paid for consultation and advisory fees. However, excluding the same margins continue to remain subdued at 10.6% (I-direct expectations: 12.5%). Higher handling charges coupled with elevated employee expenses continue to dent operating profitability. Subsequently, EBITDA de-grew by 36% (down 23% QoQ) to | 57.7 crore much below our expectations | 83.2 crore
• Elevated depreciation levels coupled with higher tax rate (~38% vs. normal run-rate of 34%) during the quarter further dented the PAT. The resultant PAT de-grew by 44% YoY (down 34% QoQ) to | 28.2 crore (I-direct estimate: | 47.4 crore)
Tapering e-tailing opportunities; industry to take some time to mature… Total gross merchandise value of FAS (Flipkart, Amazon and Snapdeal) was estimated at $14-16 billion at the end of 2016 vs. $11 billion in 2015 and $3-4 billion in 2014. However, according to a research report by RedSeeer Consulting, Indian e-tail industry grew 12% to $14.5 bn in 2016 vs. estimated 180% growth in 2015. Discounting guidelines from Department of Industrial Policy and Promotion (DIPP) moderated the lucrative nature of the e-tailing segment. In addition to the same sourcing guidelines to the extent of 25% from single vendor added to the woes. Dwindling growth rates resulted in valuation downgrades for a number of e-commerce players which impacted their funding. Subsequently, BlueDart’s earlier plans of opening e-fulfilment centres were tapered and it now operates two centres at Gurgaon and Bengaluru, respectively. Inimitable infrastructure, pan-India presence; competitive edge With a fleet of six freighters and express support vehicles of 9185 vehicles (outsourced), BDE covers over 34267 locations. The company leverages its pan-India reach via 21 ground hubs and 250 network routes. This widespread infrastructure enables the company to have a competitive advantage over existing domestic players and new entrants. As per the management the captive logistics companies for e-commerce players to the likes of e-kart, Gojavas, etc, would continue to co-exist in the logistics ecosystem. However, given their capabilities and scalability, these players would remain regional in nature. Subsequently, with the pan-India reach, BDE would continue to remain the preferred logistic partner for catering to Tier II and Tier III cities. We continue to believe that BDE network continues to enjoy the uniqueness as compared to its peers and thus command the valuation premium. GST – Bellwether for organised logistics industry… Indian surface transport industry is estimated to consist of more than 4 million trucks, managed by just about one million transporters. The inefficiencies are expected to be resolved post GST-era. Centralised management of volumes would fetch a better pay load factor on the back of route optimisation leading to a faster turnaround time. We believe that BDE is well equipped to ride out the next growth cycle triggered by GST implementation which would accrue gradually over our DCF period. We maintain BUY recommendation with a revised target price of | 5500.
BlueDart Express (BLUDAR) | 4250 Rating matrix
Rating : Buy Target : | 5500
Target Period : 12 months Potential Upside : 29%
What’s changed? Target Changed from | 6000 to | 5500
EPS FY17E Changed from | 75.3 to | 66.2
EPS FY18E Changed from | 86 to | 74.2
EPS FY19E Introduced at | 101.2
Rating Unchanged
Quarterly performance
Q3FY17 Q3FY16 YoY (%) Q2FY17 QoQ (%)
Revenue 720.0 653.0 10.3 663.2 8.6
EBITDA 57.7 89.5 -35.6 74.8 -22.9EBITDA Margin 8.0 13.7 -569 bps 11.3 -327 bps
PAT 28.2 50.1 -43.8 42.8 -34.2 Key financials | Crore FY16 FY17E FY18E FY19E
Net Sales 2,565 2,681 2,808 3,335 EBITDA 382 283 327 412 Net Profit 193.0 157.2 176.4 240.4
EPS 81.2 66.2 74.2 101.2 Valuation summary
FY16 FY17E FY18E FY19E
P/E (x) 52.3 64.2 57.3 42.0 Target P/E (x) 67.7 83.1 74.1 54.4 EV/EBITDA (x) 26.7 36.1 31.6 25.3 P / BV (x) 24.4 20.9 18.2 12.3 RONW (%) 46.6 32.6 31.7 29.2 ROCE (%) 35.9 29.5 30.2 35.2
Stock data Particular AmountMarket Capitalization (| crore) 10,336 Total Debt (FY16) (| Crore) 392.2 Cash (FY16) (| Crore) 288.2 EV (| Crore) 10,439.6 52 week H/L 6419 / 4162 Equity Capital (| Crore) 23.8 Face Value (|) 10.0
Peer Set
1M 3M 6M 12M
Patel Integrated 1.4 1.3 (18.8) (8.3)
Transport Corp. 21.8 1.4 (1.4) 49.9
Blue Dart Exp. (3.2) (15.2) (24.2) (31.4)
Gati 3.5 (4.6) (23.8) 12.4 Research Analyst
Bharat Chhoda [email protected]
Ankit Panchmatia [email protected]
ICICI Securities Ltd | Retail Equity Research Page 2
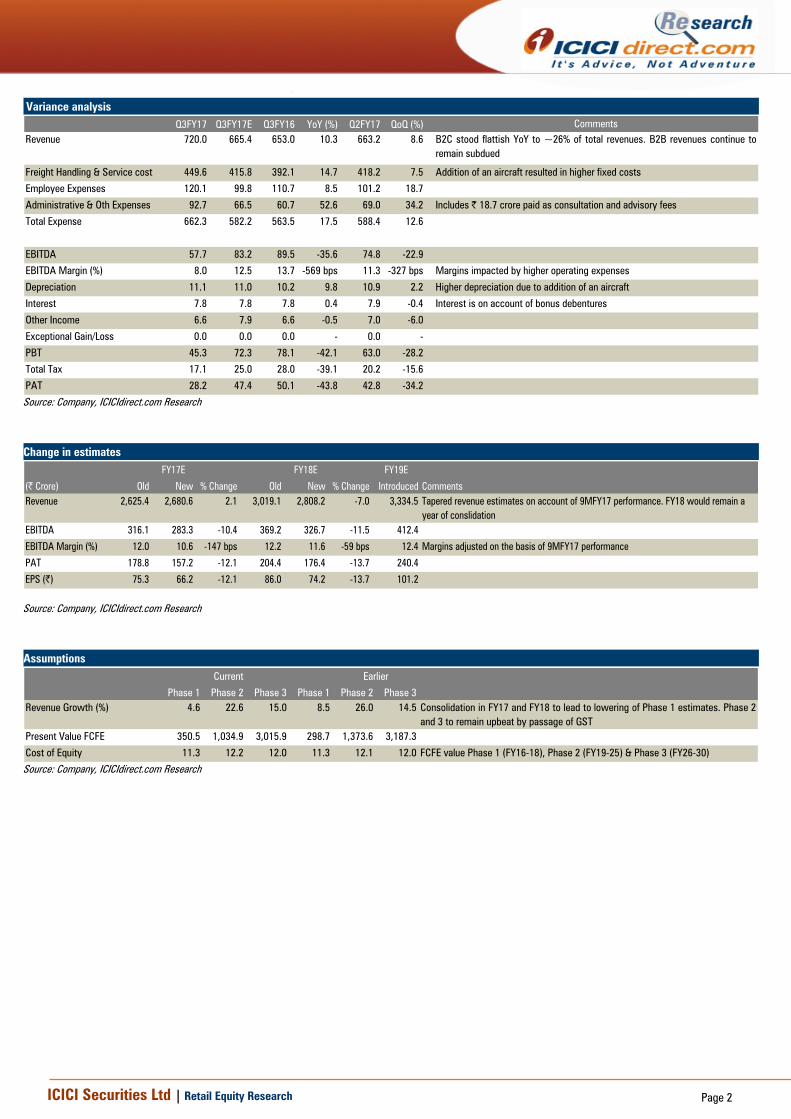
Variance analysis Q3FY17 Q3FY17E Q3FY16 YoY (%) Q2FY17 QoQ (%) Comments
Revenue 720.0 665.4 653.0 10.3 663.2 8.6
Freight Handling & Service cost 449.6 415.8 392.1 14.7 418.2 7.5 Addition of an aircraft resulted in higher fixed costs
Employee Expenses 120.1 99.8 110.7 8.5 101.2 18.7
Administrative & Oth Expenses 92.7 66.5 60.7 52.6 69.0 34.2 Includes | 18.7 crore paid as consultation and advisory fees
Total Expense 662.3 582.2 563.5 17.5 588.4 12.6
EBITDA 57.7 83.2 89.5 -35.6 74.8 -22.9
EBITDA Margin (%) 8.0 12.5 13.7 -569 bps 11.3 -327 bps Margins impacted by higher operating expenses
Depreciation 11.1 11.0 10.2 9.8 10.9 2.2 Higher depreciation due to addition of an aircraft
Interest 7.8 7.8 7.8 0.4 7.9 -0.4 Interest is on account of bonus debentures
Other Income 6.6 7.9 6.6 -0.5 7.0 -6.0
Exceptional Gain/Loss 0.0 0.0 0.0 - 0.0 -
PBT 45.3 72.3 78.1 -42.1 63.0 -28.2
Total Tax 17.1 25.0 28.0 -39.1 20.2 -15.6
PAT 28.2 47.4 50.1 -43.8 42.8 -34.2
B2C stood flattish YoY to ~26% of total revenues. B2B revenues continue toremain subdued
Source: Company, ICICIdirect.com Research Change in estimates
FY19E
(| Crore) Old New % Change Old New % Change Introduced CommentsRevenue 2,625.4 2,680.6 2.1 3,019.1 2,808.2 -7.0 3,334.5 Tapered revenue estimates on account of 9MFY17 performance. FY18 would remain a
year of conslidationEBITDA 316.1 283.3 -10.4 369.2 326.7 -11.5 412.4
EBITDA Margin (%) 12.0 10.6 -147 bps 12.2 11.6 -59 bps 12.4 Margins adjusted on the basis of 9MFY17 performance
PAT 178.8 157.2 -12.1 204.4 176.4 -13.7 240.4
EPS (|) 75.3 66.2 -12.1 86.0 74.2 -13.7 101.2
FY17E FY18E
Source: Company, ICICIdirect.com Research Assumptions
Current
Phase 1 Phase 2 Phase 3 Phase 1 Phase 2 Phase 3Revenue Growth (%) 4.6 22.6 15.0 8.5 26.0 14.5 Consolidation in FY17 and FY18 to lead to lowering of Phase 1 estimates. Phase 2
and 3 to remain upbeat by passage of GSTPresent Value FCFE 350.5 1,034.9 3,015.9 298.7 1,373.6 3,187.3
Cost of Equity 11.3 12.2 12.0 11.3 12.1 12.0 FCFE value Phase 1 (FY16-18), Phase 2 (FY19-25) & Phase 3 (FY26-30)
Earlier
Source: Company, ICICIdirect.com Research
ICICI Securities Ltd | Retail Equity Research Page 3
Company Analysis Consolidation to continue over FY18; FY19 upbeat by GST implementation
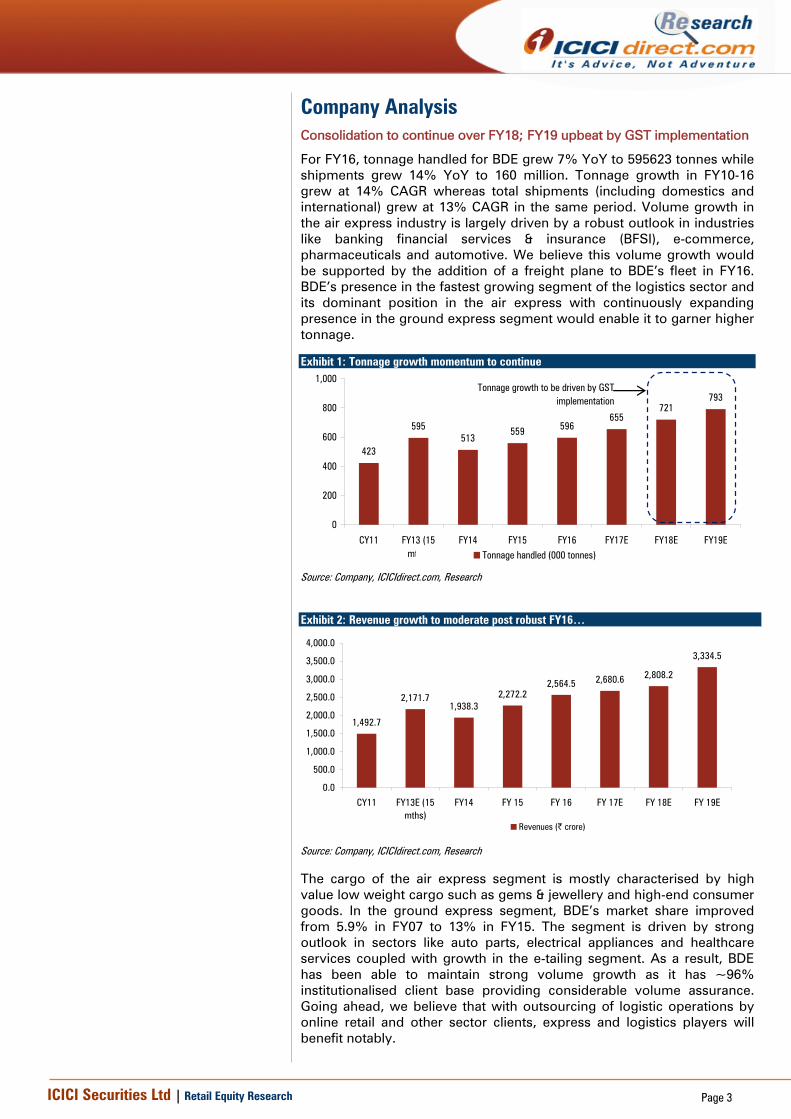
For FY16, tonnage handled for BDE grew 7% YoY to 595623 tonnes while shipments grew 14% YoY to 160 million. Tonnage growth in FY10-16 grew at 14% CAGR whereas total shipments (including domestics and international) grew at 13% CAGR in the same period. Volume growth in the air express industry is largely driven by a robust outlook in industries like banking financial services & insurance (BFSI), e-commerce, pharmaceuticals and automotive. We believe this volume growth would be supported by the addition of a freight plane to BDE’s fleet in FY16. BDE’s presence in the fastest growing segment of the logistics sector and its dominant position in the air express with continuously expanding presence in the ground express segment would enable it to garner higher tonnage.
Exhibit 2: Revenue growth to moderate post robust FY16…
1,492.7
2,171.71,938.3
2,272.22,564.5 2,680.6 2,808.2
3,334.5
0.0
500.0
1,000.0
1,500.0
2,000.0
2,500.0
3,000.0
3,500.0
4,000.0
CY11 FY13E (15mths)
FY14 FY 15 FY 16 FY 17E FY 18E FY 19E
Revenues (| crore)
Source: Company, ICICIdirect.com, Research
The cargo of the air express segment is mostly characterised by high value low weight cargo such as gems & jewellery and high-end consumer goods. In the ground express segment, BDE’s market share improved from 5.9% in FY07 to 13% in FY15. The segment is driven by strong outlook in sectors like auto parts, electrical appliances and healthcare services coupled with growth in the e-tailing segment. As a result, BDE has been able to maintain strong volume growth as it has ~96% institutionalised client base providing considerable volume assurance. Going ahead, we believe that with outsourcing of logistic operations by online retail and other sector clients, express and logistics players will benefit notably.
Exhibit 1: Tonnage growth momentum to continue
423
595513
559 596655
721793
0
200
400
600
800
1,000
CY11 FY13 (15mths)
FY14 FY15 FY16 FY17E FY18E FY19ETonnage handled (000 tonnes)
Tonnage growth to be driven by GST implementation
Source: Company, ICICIdirect.com, Research
ICICI Securities Ltd | Retail Equity Research Page 4
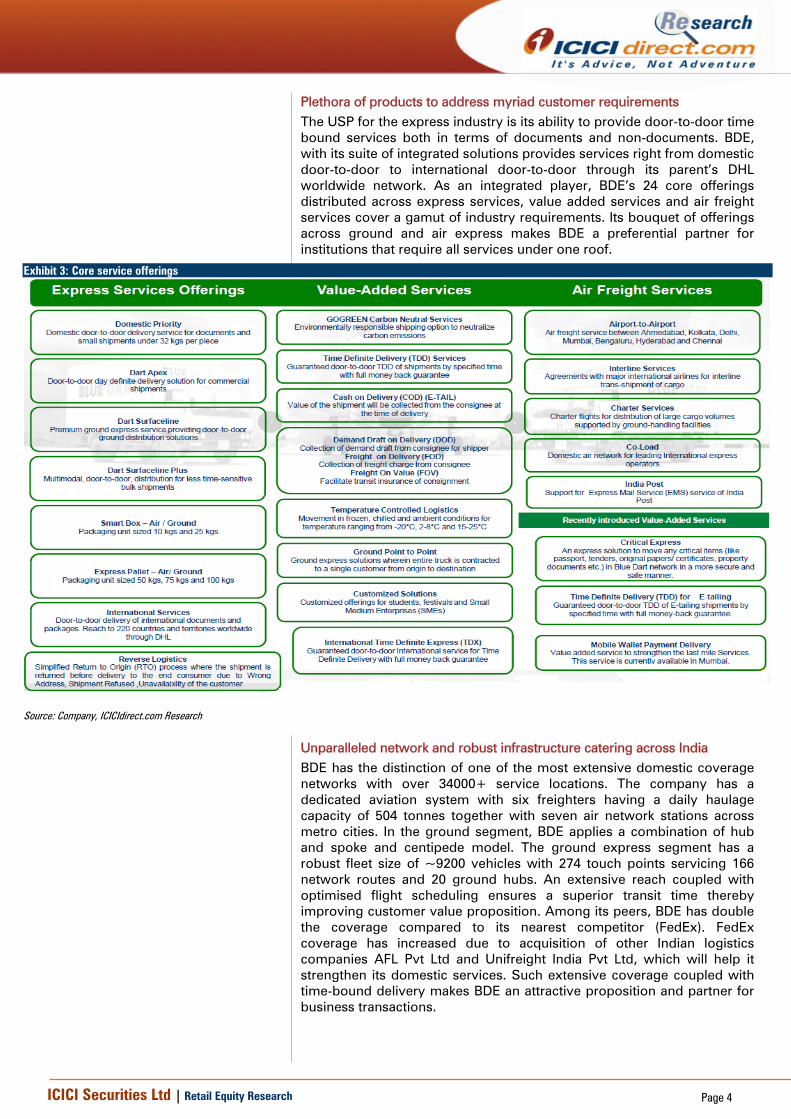
Plethora of products to address myriad customer requirements The USP for the express industry is its ability to provide door-to-door time bound services both in terms of documents and non-documents. BDE, with its suite of integrated solutions provides services right from domestic door-to-door to international door-to-door through its parent’s DHL worldwide network. As an integrated player, BDE’s 24 core offerings distributed across express services, value added services and air freight services cover a gamut of industry requirements. Its bouquet of offerings across ground and air express makes BDE a preferential partner for institutions that require all services under one roof.
Exhibit 3: Core service offerings
Source: Company, ICICIdirect.com Research
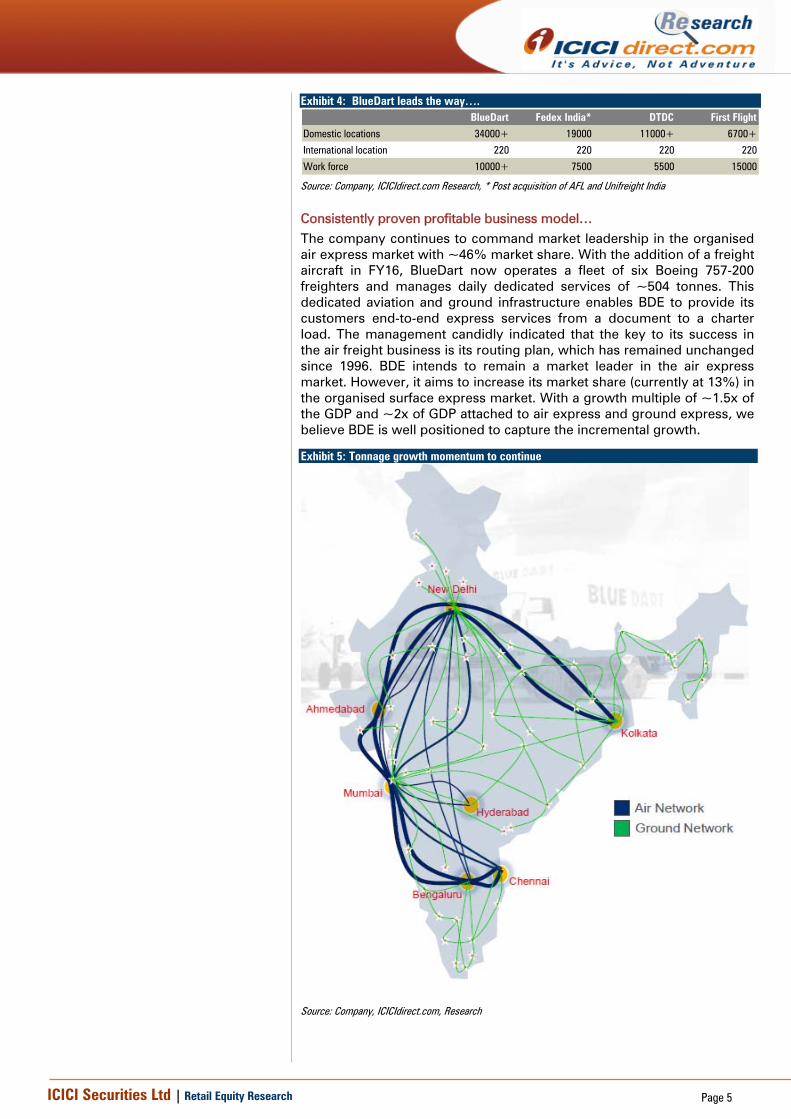
Unparalleled network and robust infrastructure catering across India BDE has the distinction of one of the most extensive domestic coverage networks with over 34000+ service locations. The company has a dedicated aviation system with six freighters having a daily haulage capacity of 504 tonnes together with seven air network stations across metro cities. In the ground segment, BDE applies a combination of hub and spoke and centipede model. The ground express segment has a robust fleet size of ~9200 vehicles with 274 touch points servicing 166 network routes and 20 ground hubs. An extensive reach coupled with optimised flight scheduling ensures a superior transit time thereby improving customer value proposition. Among its peers, BDE has double the coverage compared to its nearest competitor (FedEx). FedEx coverage has increased due to acquisition of other Indian logistics companies AFL Pvt Ltd and Unifreight India Pvt Ltd, which will help it strengthen its domestic services. Such extensive coverage coupled with time-bound delivery makes BDE an attractive proposition and partner for business transactions.
ICICI Securities Ltd | Retail Equity Research Page 5
Exhibit 4: BlueDart leads the way…. BlueDart Fedex India* DTDC First Flight
Domestic locations 34000+ 19000 11000+ 6700+
International location 220 220 220 220
Work force 10000+ 7500 5500 15000
Source: Company, ICICIdirect.com Research, * Post acquisition of AFL and Unifreight India
Consistently proven profitable business model… The company continues to command market leadership in the organised air express market with ~46% market share. With the addition of a freight aircraft in FY16, BlueDart now operates a fleet of six Boeing 757-200 freighters and manages daily dedicated services of ~504 tonnes. This dedicated aviation and ground infrastructure enables BDE to provide its customers end-to-end express services from a document to a charter load. The management candidly indicated that the key to its success in the air freight business is its routing plan, which has remained unchanged since 1996. BDE intends to remain a market leader in the air express market. However, it aims to increase its market share (currently at 13%) in the organised surface express market. With a growth multiple of ~1.5x of the GDP and ~2x of GDP attached to air express and ground express, we believe BDE is well positioned to capture the incremental growth.
Exhibit 5: Tonnage growth momentum to continue
Source: Company, ICICIdirect.com, Research
ICICI Securities Ltd | Retail Equity Research Page 6
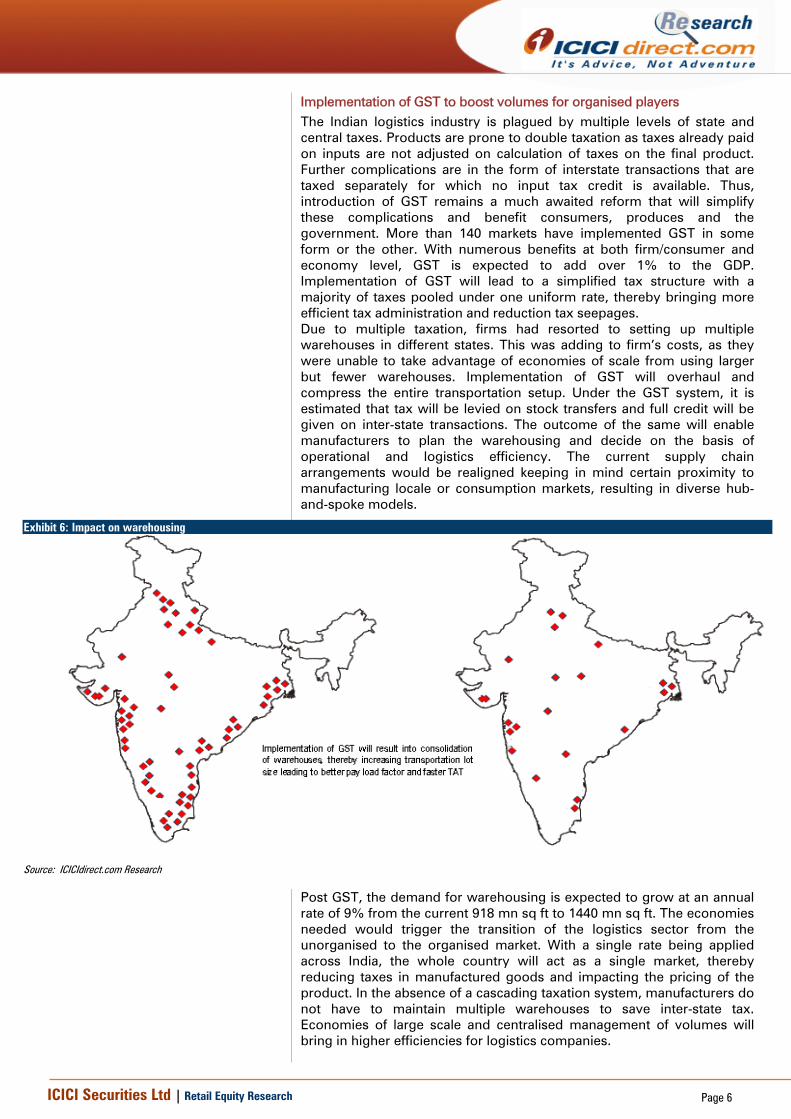
Implementation of GST to boost volumes for organised players The Indian logistics industry is plagued by multiple levels of state and central taxes. Products are prone to double taxation as taxes already paid on inputs are not adjusted on calculation of taxes on the final product. Further complications are in the form of interstate transactions that are taxed separately for which no input tax credit is available. Thus, introduction of GST remains a much awaited reform that will simplify these complications and benefit consumers, produces and the government. More than 140 markets have implemented GST in some form or the other. With numerous benefits at both firm/consumer and economy level, GST is expected to add over 1% to the GDP. Implementation of GST will lead to a simplified tax structure with a majority of taxes pooled under one uniform rate, thereby bringing more efficient tax administration and reduction tax seepages. Due to multiple taxation, firms had resorted to setting up multiple warehouses in different states. This was adding to firm’s costs, as they were unable to take advantage of economies of scale from using larger but fewer warehouses. Implementation of GST will overhaul and compress the entire transportation setup. Under the GST system, it is estimated that tax will be levied on stock transfers and full credit will be given on inter-state transactions. The outcome of the same will enable manufacturers to plan the warehousing and decide on the basis of operational and logistics efficiency. The current supply chain arrangements would be realigned keeping in mind certain proximity to manufacturing locale or consumption markets, resulting in diverse hub-and-spoke models.
Exhibit 6: Impact on warehousing
Source: ICICIdirect.com Research
Post GST, the demand for warehousing is expected to grow at an annual rate of 9% from the current 918 mn sq ft to 1440 mn sq ft. The economies needed would trigger the transition of the logistics sector from the unorganised to the organised market. With a single rate being applied across India, the whole country will act as a single market, thereby reducing taxes in manufactured goods and impacting the pricing of the product. In the absence of a cascading taxation system, manufacturers do not have to maintain multiple warehouses to save inter-state tax. Economies of large scale and centralised management of volumes will bring in higher efficiencies for logistics companies.
ICICI Securities Ltd | Retail Equity Research Page 7
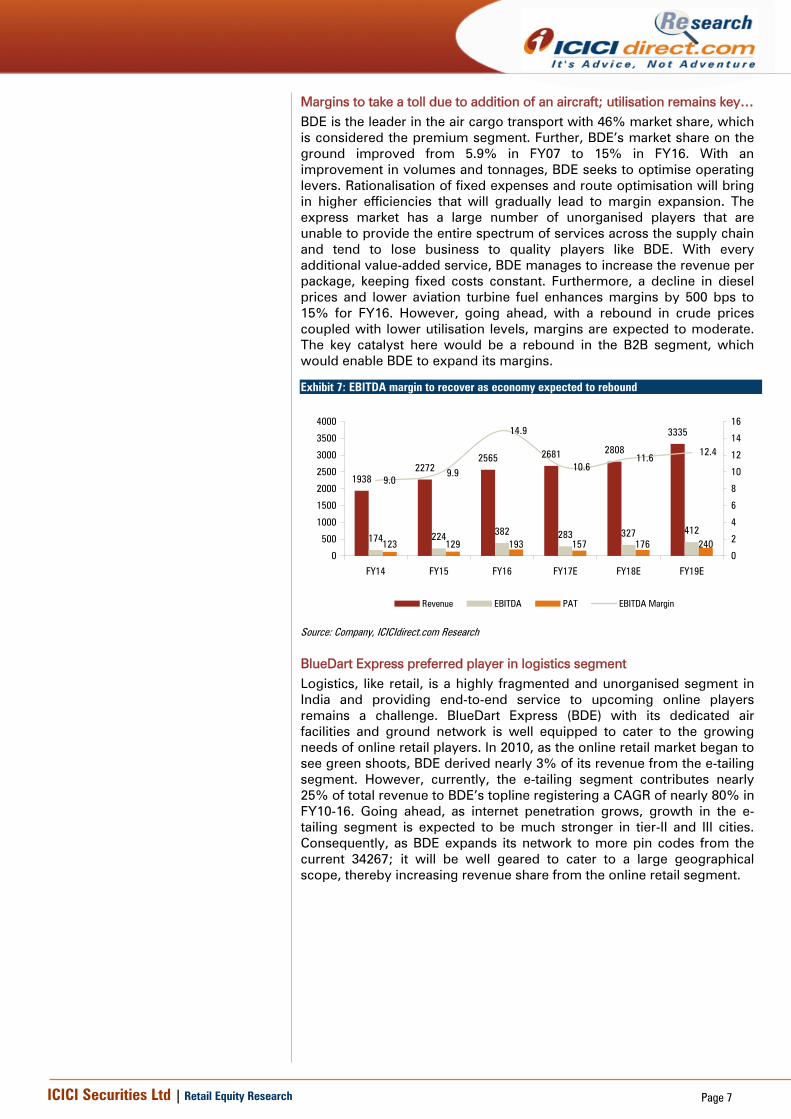
Margins to take a toll due to addition of an aircraft; utilisation remains key… BDE is the leader in the air cargo transport with 46% market share, which is considered the premium segment. Further, BDE’s market share on the ground improved from 5.9% in FY07 to 15% in FY16. With an improvement in volumes and tonnages, BDE seeks to optimise operating levers. Rationalisation of fixed expenses and route optimisation will bring in higher efficiencies that will gradually lead to margin expansion. The express market has a large number of unorganised players that are unable to provide the entire spectrum of services across the supply chain and tend to lose business to quality players like BDE. With every additional value-added service, BDE manages to increase the revenue per package, keeping fixed costs constant. Furthermore, a decline in diesel prices and lower aviation turbine fuel enhances margins by 500 bps to 15% for FY16. However, going ahead, with a rebound in crude prices coupled with lower utilisation levels, margins are expected to moderate. The key catalyst here would be a rebound in the B2B segment, which would enable BDE to expand its margins. Exhibit 7: EBITDA margin to recover as economy expected to rebound
19382272
2565 2681 2808
3335
174 224 382 283 327 412123 129 193 157 176 240
9.09.9
14.9
10.611.6
12.4
0
500
1000
1500
2000
2500
3000
3500
4000
FY14 FY15 FY16 FY17E FY18E FY19E
0
2
4
6
8
10
12
14
16
Revenue EBITDA PAT EBITDA Margin
Source: Company, ICICIdirect.com Research
BlueDart Express preferred player in logistics segment Logistics, like retail, is a highly fragmented and unorganised segment in India and providing end-to-end service to upcoming online players remains a challenge. BlueDart Express (BDE) with its dedicated air facilities and ground network is well equipped to cater to the growing needs of online retail players. In 2010, as the online retail market began to see green shoots, BDE derived nearly 3% of its revenue from the e-tailing segment. However, currently, the e-tailing segment contributes nearly 25% of total revenue to BDE’s topline registering a CAGR of nearly 80% in FY10-16. Going ahead, as internet penetration grows, growth in the e-tailing segment is expected to be much stronger in tier-II and III cities. Consequently, as BDE expands its network to more pin codes from the current 34267; it will be well geared to cater to a large geographical scope, thereby increasing revenue share from the online retail segment.
ICICI Securities Ltd | Retail Equity Research Page 8
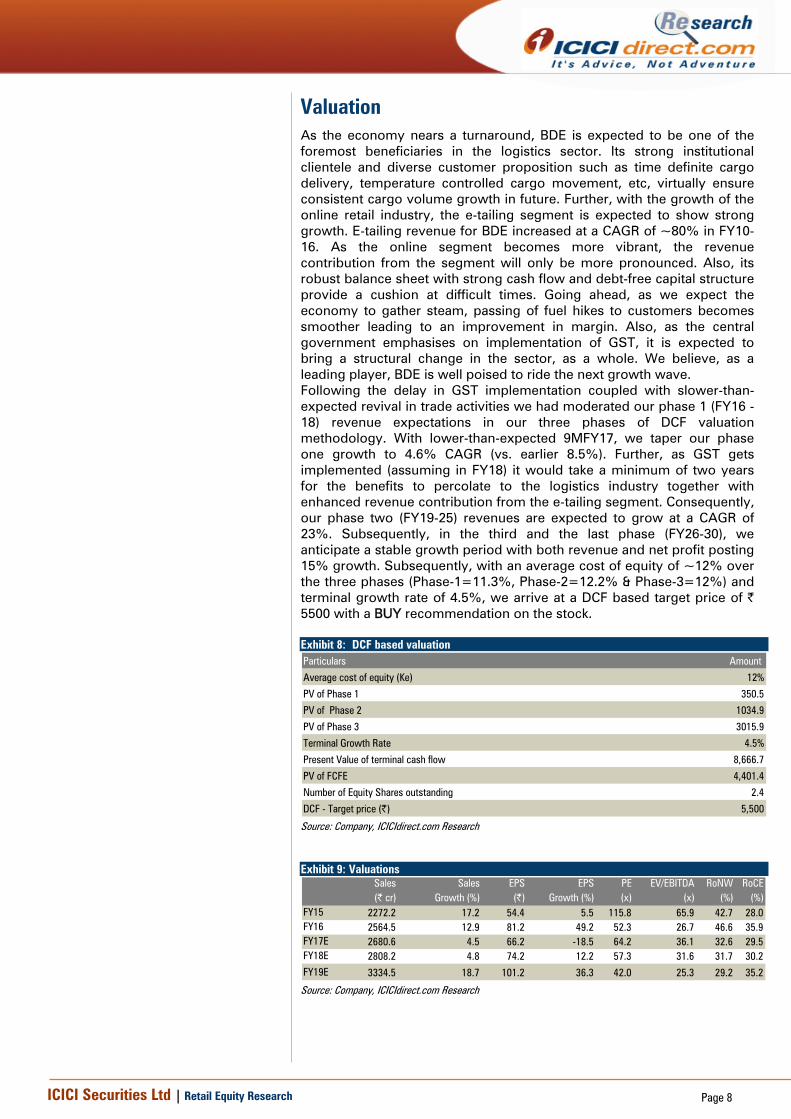
Valuation As the economy nears a turnaround, BDE is expected to be one of the foremost beneficiaries in the logistics sector. Its strong institutional clientele and diverse customer proposition such as time definite cargo delivery, temperature controlled cargo movement, etc, virtually ensure consistent cargo volume growth in future. Further, with the growth of the online retail industry, the e-tailing segment is expected to show strong growth. E-tailing revenue for BDE increased at a CAGR of ~80% in FY10-16. As the online segment becomes more vibrant, the revenue contribution from the segment will only be more pronounced. Also, its robust balance sheet with strong cash flow and debt-free capital structure provide a cushion at difficult times. Going ahead, as we expect the economy to gather steam, passing of fuel hikes to customers becomes smoother leading to an improvement in margin. Also, as the central government emphasises on implementation of GST, it is expected to bring a structural change in the sector, as a whole. We believe, as a leading player, BDE is well poised to ride the next growth wave. Following the delay in GST implementation coupled with slower-than-expected revival in trade activities we had moderated our phase 1 (FY16 -18) revenue expectations in our three phases of DCF valuation methodology. With lower-than-expected 9MFY17, we taper our phase one growth to 4.6% CAGR (vs. earlier 8.5%). Further, as GST gets implemented (assuming in FY18) it would take a minimum of two years for the benefits to percolate to the logistics industry together with enhanced revenue contribution from the e-tailing segment. Consequently, our phase two (FY19-25) revenues are expected to grow at a CAGR of 23%. Subsequently, in the third and the last phase (FY26-30), we anticipate a stable growth period with both revenue and net profit posting 15% growth. Subsequently, with an average cost of equity of ~12% over the three phases (Phase-1=11.3%, Phase-2=12.2% & Phase-3=12%) and terminal growth rate of 4.5%, we arrive at a DCF based target price of | 5500 with a BUY recommendation on the stock. Exhibit 8: DCF based valuation Particulars Amount
Average cost of equity (Ke) 12%
PV of Phase 1 350.5
PV of Phase 2 1034.9
PV of Phase 3 3015.9
Terminal Growth Rate 4.5%
Present Value of terminal cash flow 8,666.7
PV of FCFE 4,401.4
Number of Equity Shares outstanding 2.4
DCF - Target price (|) 5,500 Source: Company, ICICIdirect.com Research
Exhibit 9: Valuations
Sales Sales EPS EPS PE EV/EBITDA RoNW RoCE(| cr) Growth (%) (|) Growth (%) (x) (x) (%) (%)
FY15 2272.2 17.2 54.4 5.5 115.8 65.9 42.7 28.0FY16 2564.5 12.9 81.2 49.2 52.3 26.7 46.6 35.9FY17E 2680.6 4.5 66.2 -18.5 64.2 36.1 32.6 29.5FY18E 2808.2 4.8 74.2 12.2 57.3 31.6 31.7 30.2FY19E 3334.5 18.7 101.2 36.3 42.0 25.3 29.2 35.2
Source: Company, ICICIdirect.com Research
ICICI Securities Ltd | Retail Equity Research Page 9
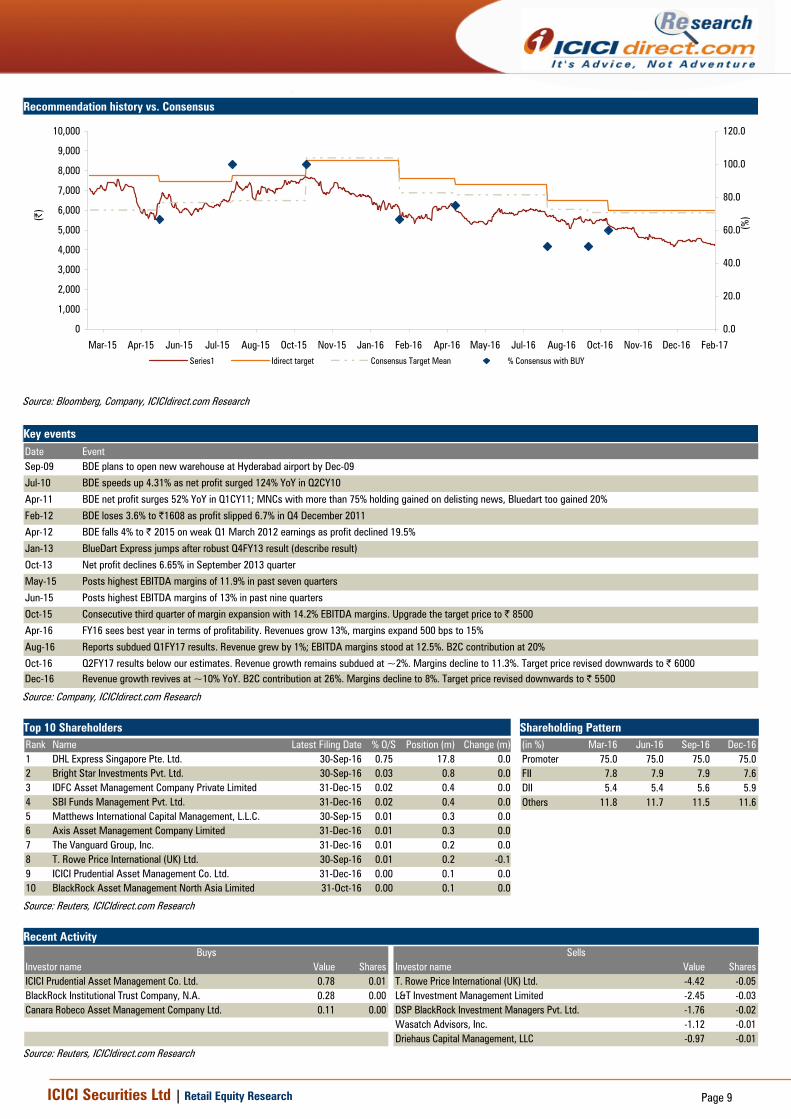
Recommendation history vs. Consensus
0
1,000
2,000
3,000
4,000
5,000
6,000
7,000
8,000
9,000
10,000
Feb-17Dec-16Nov-16Oct-16Aug-16Jul-16May-16Apr-16Feb-16Jan-16Nov-15Oct-15Aug-15Jul-15Jun-15Apr-15Mar-15
(|)
0.0
20.0
40.0
60.0
80.0
100.0
120.0
(%)
Series1 Idirect target Consensus Target Mean % Consensus with BUY
Source: Bloomberg, Company, ICICIdirect.com Research Key events Date EventSep-09 BDE plans to open new warehouse at Hyderabad airport by Dec-09
Jul-10 BDE speeds up 4.31% as net profit surged 124% YoY in Q2CY10
Apr-11 BDE net profit surges 52% YoY in Q1CY11; MNCs with more than 75% holding gained on delisting news, Bluedart too gained 20%
Feb-12 BDE loses 3.6% to |1608 as profit slipped 6.7% in Q4 December 2011
Apr-12 BDE falls 4% to | 2015 on weak Q1 March 2012 earnings as profit declined 19.5%
Jan-13 BlueDart Express jumps after robust Q4FY13 result (describe result)
Oct-13 Net profit declines 6.65% in September 2013 quarter
May-15 Posts highest EBITDA margins of 11.9% in past seven quarters
Jun-15 Posts highest EBITDA margins of 13% in past nine quarters
Oct-15 Consecutive third quarter of margin expansion with 14.2% EBITDA margins. Upgrade the target price to | 8500
Apr-16 FY16 sees best year in terms of profitability. Revenues grow 13%, margins expand 500 bps to 15%
Aug-16 Reports subdued Q1FY17 results. Revenue grew by 1%; EBITDA margins stood at 12.5%. B2C contribution at 20%
Oct-16 Q2FY17 results below our estimates. Revenue growth remains subdued at ~2%. Margins decline to 11.3%. Target price revised downwards to | 6000Dec-16 Revenue growth revives at ~10% YoY. B2C contribution at 26%. Margins decline to 8%. Target price revised downwards to | 5500
Source: Company, ICICIdirect.com Research Top 10 Shareholders Shareholding Pattern Rank Name Latest Filing Date % O/S Position (m) Change (m)1 DHL Express Singapore Pte. Ltd. 30-Sep-16 0.75 17.8 0.02 Bright Star Investments Pvt. Ltd. 30-Sep-16 0.03 0.8 0.03 IDFC Asset Management Company Private Limited 31-Dec-15 0.02 0.4 0.04 SBI Funds Management Pvt. Ltd. 31-Dec-16 0.02 0.4 0.05 Matthews International Capital Management, L.L.C. 30-Sep-15 0.01 0.3 0.06 Axis Asset Management Company Limited 31-Dec-16 0.01 0.3 0.07 The Vanguard Group, Inc. 31-Dec-16 0.01 0.2 0.08 T. Rowe Price International (UK) Ltd. 30-Sep-16 0.01 0.2 -0.19 ICICI Prudential Asset Management Co. Ltd. 31-Dec-16 0.00 0.1 0.010 BlackRock Asset Management North Asia Limited 31-Oct-16 0.00 0.1 0.0
(in %) Mar-16 Jun-16 Sep-16 Dec-16Promoter 75.0 75.0 75.0 75.0FII 7.8 7.9 7.9 7.6DII 5.4 5.4 5.6 5.9Others 11.8 11.7 11.5 11.6
Source: Reuters, ICICIdirect.com Research Recent Activity
Investor name Value Shares Investor name Value SharesICICI Prudential Asset Management Co. Ltd. 0.78 0.01 T. Rowe Price International (UK) Ltd. -4.42 -0.05BlackRock Institutional Trust Company, N.A. 0.28 0.00 L&T Investment Management Limited -2.45 -0.03Canara Robeco Asset Management Company Ltd. 0.11 0.00 DSP BlackRock Investment Managers Pvt. Ltd. -1.76 -0.02
Wasatch Advisors, Inc. -1.12 -0.01Driehaus Capital Management, LLC -0.97 -0.01
Buys Sells
Source: Reuters, ICICIdirect.com Research

ICICI Securities Ltd | Retail Equity Research Page 10
.
Financial summary Profit and loss statement | Crore (Year-end March) FY15 FY16 FY17E FY18E FY19ETotal operating Income 2,272.2 2,564.5 2,680.6 2,808.2 3,334.5Growth (%) 17.2 12.9 4.5 4.8 18.7Aircraft CharterCost 40.0 37.8 37.8 37.8 37.8Other Aircraft Expenses 420.3 322.0 348.5 365.1 433.5Fuel Charges 387.0 372.4 389.2 407.7 483.5Other Operating Expenses 670.6 641.1 750.6 786.3 933.7Employee Cost 321.6 500.9 509.3 561.6 666.9Other Expenses 208.3 308.6 361.9 322.9 366.8Total Expenditure 2,047.9 2,182.8 2,397.3 2,481.5 2,922.2EBITDA 224.2 381.7 283.3 326.7 412.4Growth (%) 28.8 70.2 -25.8 15.3 26.2Depreciation 43.6 82.1 43.0 58.7 63.7Interest 11.2 35.5 29.9 29.9 15.0Other Income 24.6 30.2 27.8 29.2 30.6PBT 194.1 294.3 238.2 267.2 364.3Total Tax 66.9 101.4 81.0 90.9 123.9PAT 129.3 193.0 157.2 176.4 240.4Growth (%) 5.1 51.7 -18.5 12.2 36.3EPS (|) 54.4 81.2 66.2 74.2 101.2
Source: Company, ICICIdirect.com Research
Cash flow statement | Crore (Year-end March) FY15 FY16 FY17E FY18E FY19EProfit after Tax 127.2 193.0 157.2 176.4 240.4Add: Depreciation 43.6 82.1 43.0 58.7 63.7(Inc)/dec in Current Assets -29.4 -31.3 -14.0 42.0 -69.2Inc/(dec) in CL and Provisions 53.3 151.9 7.5 -17.5 94.7Others -33.6 0.0 0.0 0.0 0.0CF from operating activities 161.1 395.6 193.7 259.6 329.7(Inc)/dec in Investments -2.2 26.5 0.0 0.0 0.0(Inc)/dec in Fixed Assets 20.1 -562.5 -100.0 -100.0 -100.0Others 7.3 370.5 204.2 -28.6 -134.1CF from investing activities 25.2 -165.5 104.2 -128.6 -234.1Issue/(Buy back) of Equity 4.7 0.0 0.0 0.0 0.0Inc/(dec) in loan funds 332.2 0.0 0.0 0.0 0.0Others -463.3 -108.2 -326.0 -87.8 3.6CF from financing activities -126.5 -108.2 -326.0 -87.8 3.6Net Cash flow 59.8 121.9 -28.0 43.2 99.2Opening Cash 106.5 166.2 288.2 260.1 303.3Closing Cash 166.2 288.2 260.1 303.3 402.5
Source: Company, ICICIdirect.com Research
Balance sheet | Crore (Year-end March) FY15 FY16 FY17E FY18E FY19ELiabilitiesEquity Capital 23.8 23.8 23.8 23.8 23.8Reserve and Surplus 283.5 390.4 457.6 533.2 639.4Total Shareholders funds 307.3 414.1 481.4 557.0 663.1Total Debt 332.2 392.2 392.2 392.2 392.2Long term Provisions 14.8 17.6 0.0 0.0 0.0Other Long term liabilities 0.0 11.0 0.0 0.0 0.0Deferred Tax Liability 10.17 -14.65 9.47 0.00 0.00Minority Interest 0.00 12.39 12.39 12.39 12.39Total Liabilities 664.5 832.7 895.5 961.6 1,067.7
AssetsGross Block 386.8 953.2 1,074.7 1,174.7 1,274.7Less: Acc Depreciation 171.1 448.8 491.8 550.5 614.2Impairment 0.0 0.0 0.0 0.0 0.0Net Block 215.6 504.4 582.9 624.2 660.4Capital WIP 25.4 21.5 22.5 23.7 24.9Total Fixed Assets 241.0 525.9 605.4 647.8 685.3Non-current Investments 26.5 0.0 0.0 0.0 0.0Long term loans & advances 183.0 86.8 91.1 95.7 100.4Deferred Tax Asset 0.6 1.2 1.2 1.2 1.2Inventory 4.0 21.1 22.0 23.1 27.4Debtors 291.0 318.4 330.5 307.7 365.4Loans and Advances 71.0 57.8 58.8 38.5 45.7Other Current Assets 4.8 8.9 9.3 9.8 0.0Cash 166.3 288.2 260.1 303.3 402.5Current investments 0.0 0.0 0.0 0.0 0.0Total Current Assets 537.0 694.4 680.7 682.4 841.0Creditors 128.0 173.0 176.3 192.3 274.1Other liab & Provisions 205.3 302.6 306.8 273.2 286.2Total Current Liabilities 333.4 475.6 483.1 465.6 560.3Net Current Assets 203.6 218.8 197.7 216.9 280.8Application of Funds 664.5 832.7 895.4 961.6 1,067.7
Source: Company, ICICIdirect.com Research
Key ratios (Year-end March) FY15 FY16 FY17E FY18E FY19EPer share data (|)EPS 53.5 81.2 66.2 74.2 101.2Cash EPS 71.9 115.8 84.3 98.9 128.0BV 129.3 174.3 202.9 234.1 346.4DPS 20.0 40.6 33.1 37.1 50.6Cash Per Share 70.0 121.3 109.5 127.7 169.4Operating Ratios (%)EBITDA Margin 9.9 14.9 10.6 11.6 12.4PBT / Total Operating income 8.5 11.5 8.9 9.5 10.9PAT Margin 5.6 7.5 5.9 6.3 7.2Inventory days 0.6 3.0 3.0 3.0 3.0Debtor days 46.7 45.3 45.0 40.0 40.0Creditor days 20.6 24.6 24.0 25.0 30.0Return Ratios (%)RoE 41.4 46.6 32.6 31.7 29.2RoCE 27.6 35.9 29.5 30.2 35.2RoIC 40.4 57.8 38.6 34.2 29.9Valuation Ratios (x)P/E 112.1 52.3 64.2 57.3 42.0EV / EBITDA 64.3 26.7 36.1 31.6 25.3EV / Net Sales 6.3 4.0 3.8 3.7 3.1Market Cap / Sales 6.3 3.9 3.8 3.6 3.0Price to Book Value 46.4 24.4 20.9 18.2 12.3Solvency RatiosDebt/EBITDA 1.5 1.0 1.4 1.2 1.0Debt / Equity 1.1 0.9 0.7 0.6 0.2Current Ratio 1.7 1.5 1.4 1.5 1.5Quick Ratio 1.6 1.4 1.2 1.0 0.4
Source: Company, ICICIdirect.com Research
ICICI Securities Ltd | Retail Equity Research Page 11
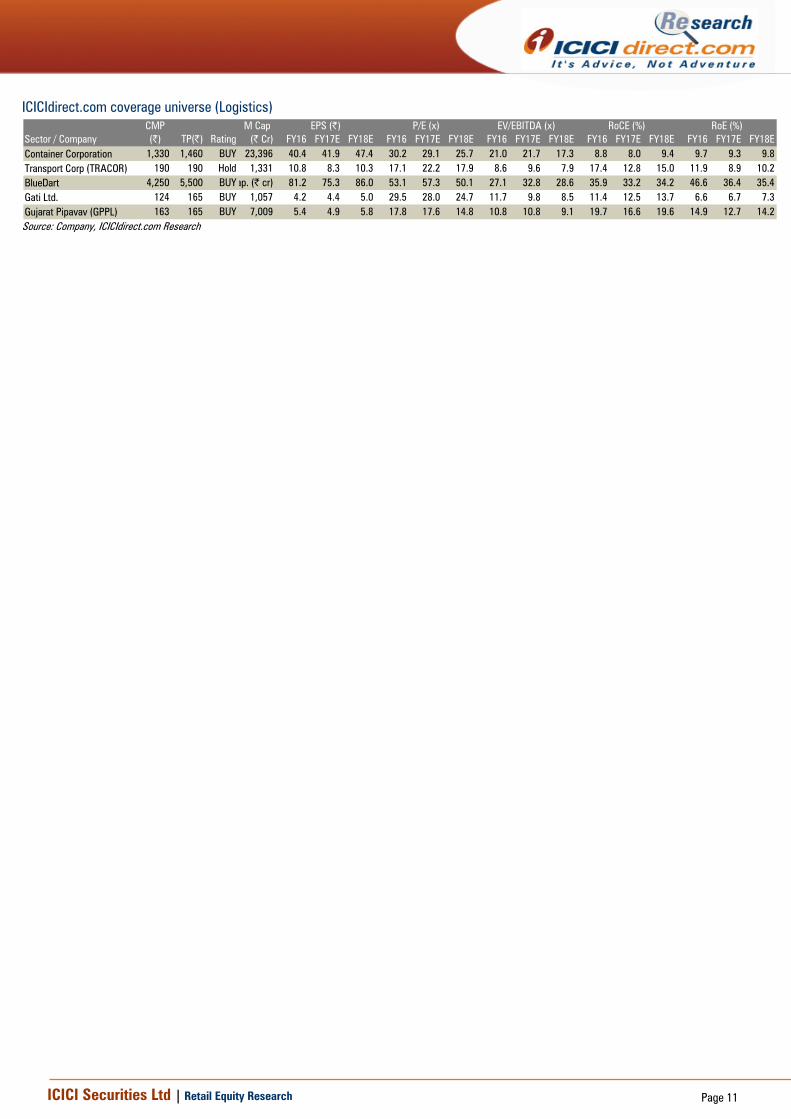
ICICIdirect.com coverage universe (Logistics) CMP M Cap(|) TP(|) Rating (| Cr) FY16 FY17E FY18E FY16 FY17E FY18E FY16 FY17E FY18E FY16 FY17E FY18E FY16 FY17E FY18E
Container Corporation 1,330 1,460 BUY 23,396 40.4 41.9 47.4 30.2 29.1 25.7 21.0 21.7 17.3 8.8 8.0 9.4 9.7 9.3 9.8Transport Corp (TRACOR) 190 190 Hold 1,331 10.8 8.3 10.3 17.1 22.2 17.9 8.6 9.6 7.9 17.4 12.8 15.0 11.9 8.9 10.2BlueDart 4,250 5,500 BUYap. (| cr) 81.2 75.3 86.0 53.1 57.3 50.1 27.1 32.8 28.6 35.9 33.2 34.2 46.6 36.4 35.4Gati Ltd. 124 165 BUY 1,057 4.2 4.4 5.0 29.5 28.0 24.7 11.7 9.8 8.5 11.4 12.5 13.7 6.6 6.7 7.3Gujarat Pipavav (GPPL) 163 165 BUY 7,009 5.4 4.9 5.8 17.8 17.6 14.8 10.8 10.8 9.1 19.7 16.6 19.6 14.9 12.7 14.2
Sector / CompanyRoE (%)EPS (|) P/E (x) EV/EBITDA (x) RoCE (%)
Source: Company, ICICIdirect.com Research

ICICI Securities Ltd | Retail Equity Research Page 12
RATING RATIONALE ICICIdirect.com endeavours to provide objective opinions and recommendations. ICICIdirect.com assigns ratings to its stocks according to their notional target price vs. current market price and then categorises them as Strong Buy, Buy, Hold and Sell. The performance horizon is two years unless specified and the notional target price is defined as the analysts' valuation for a stock. Strong Buy: >15%/20% for large caps/midcaps, respectively, with high conviction; Buy: >10%/15% for large caps/midcaps, respectively; Hold: Up to +/-10%; Sell: -10% or more;
Pankaj Pandey Head – Research [email protected]
ICICIdirect.com Research Desk, ICICI Securities Limited, 1st Floor, Akruti Trade Centre, Road No. 7, MIDC, Andheri (East) Mumbai – 400 093

ICICI Securities Ltd | Retail Equity Research Page 13
ANALYST CERTIFICATION We /I, Bharat Chhoda, MBA and Ankit Panchmatia, MBA Research Analysts, authors and the names subscribed to this report, hereby certify that all of the views expressed in this research report accurately reflect our views about the subject issuer(s) or securities. We also certify that no part of our compensation was, is, or will be directly or indirectly related to the specific recommendation(s) or view(s) in this report.
Terms & conditions and other disclosures: ICICI Securities Limited (ICICI Securities) is a full-service, integrated investment banking and is, inter alia, engaged in the business of stock brokering and distribution of financial products. ICICI Securities Limited is a Sebi registered Research Analyst with Sebi Registration Number – INH000000990. ICICI Securities is a wholly-owned subsidiary of ICICI Bank which is India’s largest private sector bank and has its various subsidiaries engaged in businesses of housing finance, asset management, life insurance, general insurance, venture capital fund management, etc. (“associates”), the details in respect of which are available on www.icicibank.com. ICICI Securities is one of the leading merchant bankers/ underwriters of securities and participate in virtually all securities trading markets in India. We and our associates might have investment banking and other business relationship with a significant percentage of companies covered by our Investment Research Department. ICICI Securities generally prohibits its analysts, persons reporting to analysts and their relatives from maintaining a financial interest in the securities or derivatives of any companies that the analysts cover. The information and opinions in this report have been prepared by ICICI Securities and are subject to change without any notice. The report and information contained herein is strictly confidential and meant solely for the selected recipient and may not be altered in any way, transmitted to, copied or distributed, in part or in whole, to any other person or to the media or reproduced in any form, without prior written consent of ICICI Securities. While we would endeavour to update the information herein on a reasonable basis, ICICI Securities is under no obligation to update or keep the information current. Also, there may be regulatory, compliance or other reasons that may prevent ICICI Securities from doing so. Non-rated securities indicate that rating on a particular security has been suspended temporarily and such suspension is in compliance with applicable regulations and/or ICICI Securities policies, in circumstances where ICICI Securities might be acting in an advisory capacity to this company, or in certain other circumstances. This report is based on information obtained from public sources and sources believed to be reliable, but no independent verification has been made nor is its accuracy or completeness guaranteed. This report and information herein is solely for informational purpose and shall not be used or considered as an offer document or solicitation of offer to buy or sell or subscribe for securities or other financial instruments. Though disseminated to all the customers simultaneously, not all customers may receive this report at the same time. ICICI Securities will not treat recipients as customers by virtue of their receiving this report. Nothing in this report constitutes investment, legal, accounting and tax advice or a representation that any investment or strategy is suitable or appropriate to your specific circumstances. The securities discussed and opinions expressed in this report may not be suitable for all investors, who must make their own investment decisions, based on their own investment objectives, financial positions and needs of specific recipient. This may not be taken in substitution for the exercise of independent judgment by any recipient. The recipient should independently evaluate the investment risks. The value and return on investment may vary because of changes in interest rates, foreign exchange rates or any other reason. ICICI Securities accepts no liabilities whatsoever for any loss or damage of any kind arising out of the use of this report. Past performance is not necessarily a guide to future performance. Investors are advised to see Risk Disclosure Document to understand the risks associated before investing in the securities markets. Actual results may differ materially from those set forth in projections. Forward-looking statements are not predictions and may be subject to change without notice. ICICI Securities or its associates might have managed or co-managed public offering of securities for the subject company or might have been mandated by the subject company for any other assignment in the past twelve months. ICICI Securities or its associates might have received any compensation from the companies mentioned in the report during the period preceding twelve months from the date of this report for services in respect of managing or co-managing public offerings, corporate finance, investment banking or merchant banking, brokerage services or other advisory service in a merger or specific transaction. ICICI Securities or its associates might have received any compensation for products or services other than investment banking or merchant banking or brokerage services from the companies mentioned in the report in the past twelve months. ICICI Securities encourages independence in research report preparation and strives to minimize conflict in preparation of research report. ICICI Securities or its associates or its analysts did not receive any compensation or other benefits from the companies mentioned in the report or third party in connection with preparation of the research report. Accordingly, neither ICICI Securities nor Research Analysts and their relatives have any material conflict of interest at the time of publication of this report. It is confirmed that Bharat Chhoda, MBA and Ankit Panchmatia, MBA Research Analysts of this report have not received any compensation from the companies mentioned in the report in the preceding twelve months. Compensation of our Research Analysts is not based on any specific merchant banking, investment banking or brokerage service transactions. ICICI Securities or its subsidiaries collectively or Research Analysts or their relatives do not own 1% or more of the equity securities of the Company mentioned in the report as of the last day of the month preceding the publication of the research report. Since associates of ICICI Securities are engaged in various financial service businesses, they might have financial interests or beneficial ownership in various companies including the subject company/companies mentioned in this report. It is confirmed that Bharat Chhoda, MBA and Ankit Panchmatia, MBA Research Analysts do not serve as an officer, director or employee of the companies mentioned in the report. ICICI Securities may have issued other reports that are inconsistent with and reach different conclusion from the information presented in this report. Neither the Research Analysts nor ICICI Securities have been engaged in market making activity for the companies mentioned in the report. We submit that no material disciplinary action has been taken on ICICI Securities by any Regulatory Authority impacting Equity Research Analysis activities. This report is not directed or intended for distribution to, or use by, any person or entity who is a citizen or resident of or located in any locality, state, country or other jurisdiction, where such distribution, publication, availability or use would be contrary to law, regulation or which would subject ICICI Securities and affiliates to any registration or licensing requirement within such jurisdiction. The securities described herein may or may not be eligible for sale in all jurisdictions or to certain category of investors. Persons in whose possession this document may come are required to inform themselves of and to observe such restriction.