Embed Size (px)
Citation preview

STATISTICS IS
THE EYES OF
GOVERNMENT ADMINISTRATION
• Chicago Convention 1944 establishes thobligation of ICAO(International Civil AviatioOrganization) contracting States to submit ATransport Statistics. Accordingly ICAO hadeveloped various Forms for data collection.
• Schedule XI of the Aircraft Rules,1937 provides fofurnishing of the Traffic Returns to whom a permhas been granted by the DGCA.
Instructions 10.9 of CAR SERIES “C’ PART ISECTION 3 –AIR TRANSPORT dated 1st MARCH1994, The operator shall regularly submit to DGCAinformation relating to their operationaengineering, and commercial and financiaperformance
CIVIL AVIATION REQUIREMENTS
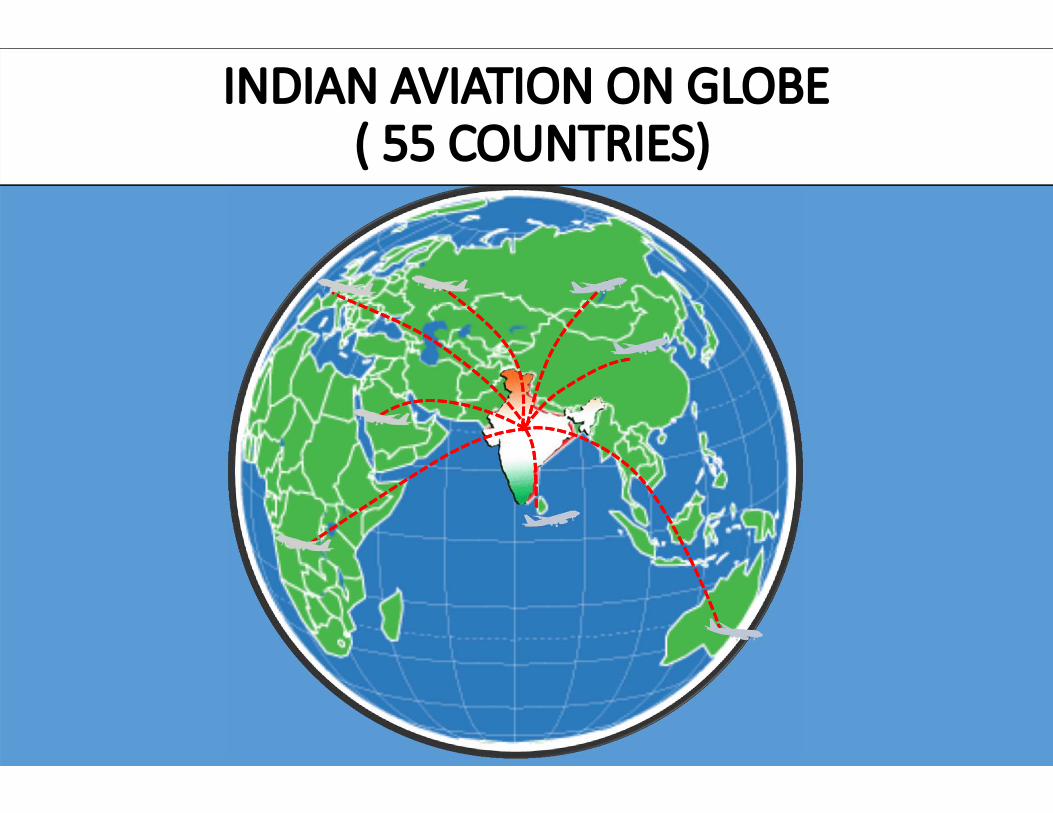
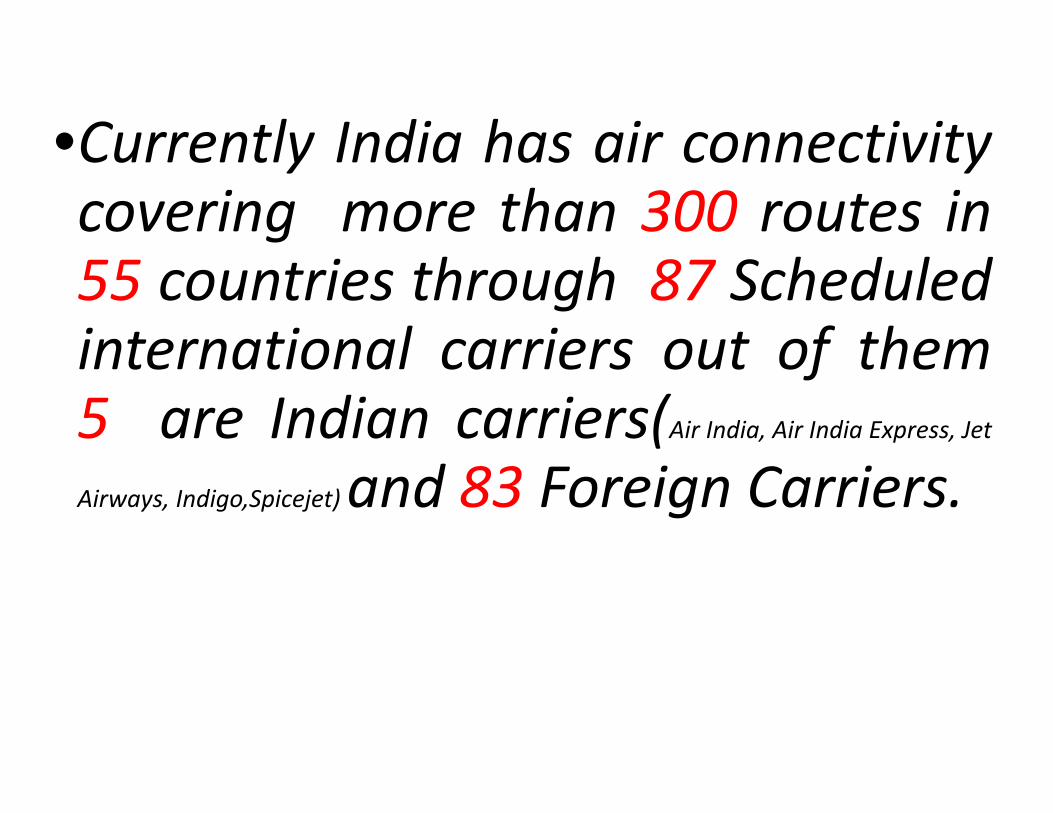
•Currently India has air connectivitycovering more than 300 routes in55 countries through 87 Scheduledinternational carriers out of them5 are Indian carriers(Air India, Air India Express, JetAirways, Indigo,Spicejet)and 83 Foreign Carriers.
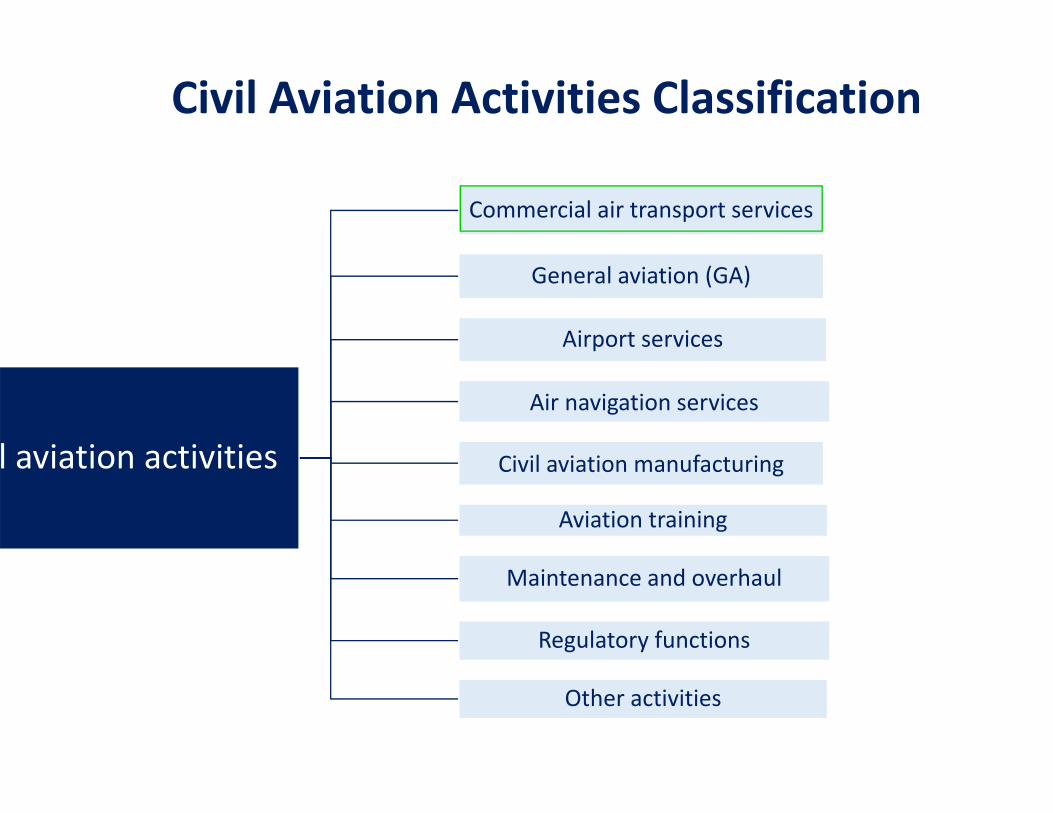
l aviation activities
Commercial air transport services
General aviation (GA)
Airport services
Air navigation services
Civil aviation manufacturing
Aviation training
Maintenance and overhaul
Regulatory functions
Other activities
Civil Aviation Activities Classification
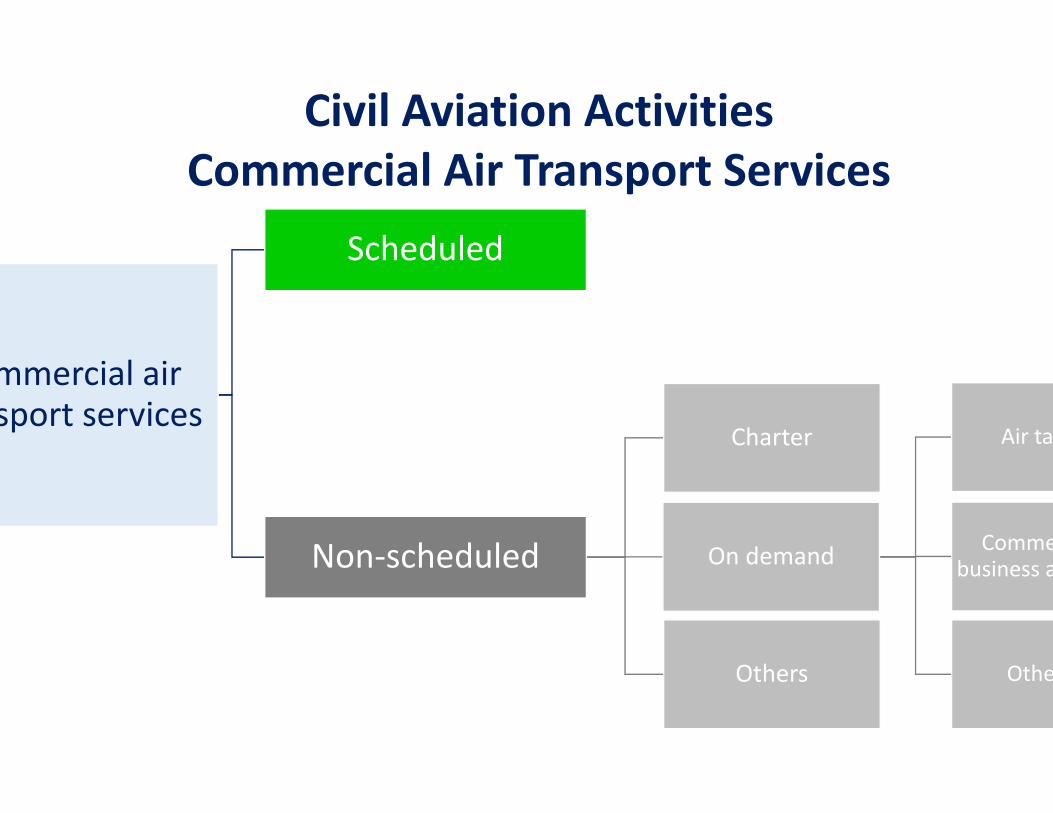
mmercial air sport services
Scheduled
Non‐scheduled
Charter
On demand
Air ta
Commebusiness a
OtheOthers
Civil Aviation ActivitiesCommercial Air Transport Services
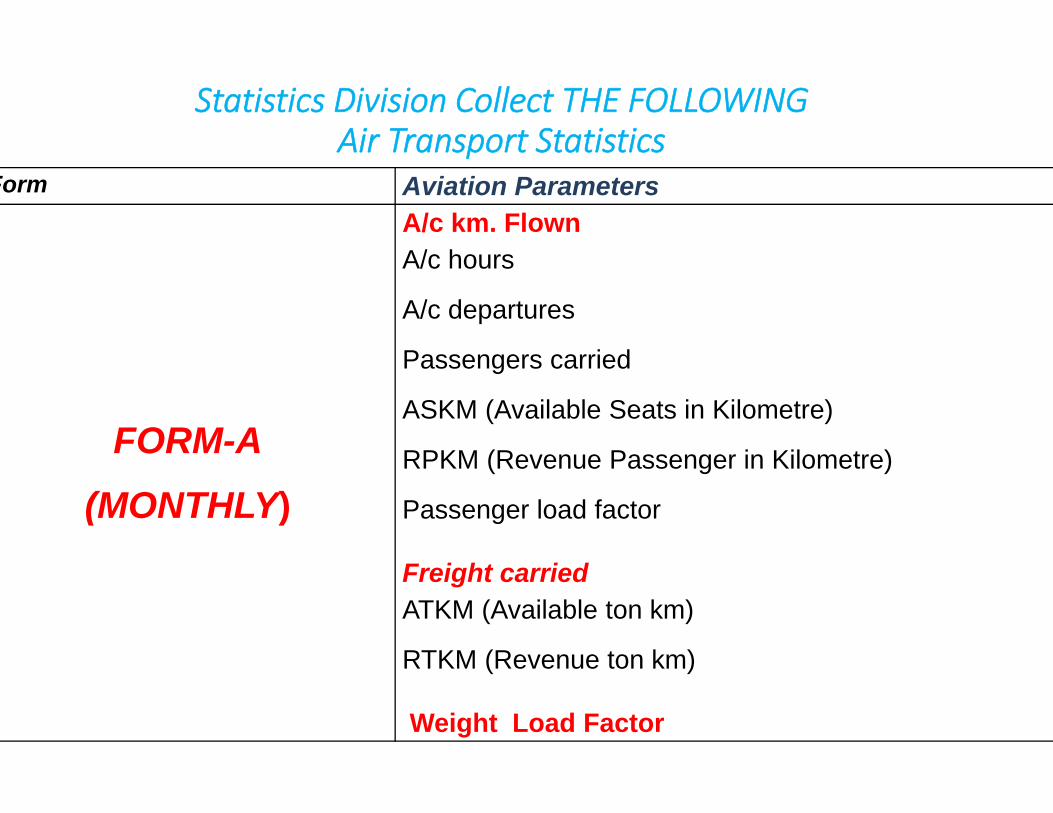
Statistics Division Collect THE FOLLOWING Air Transport Statistics
Form Aviation Parameters
FORM-A(MONTHLY)
A/c km. FlownA/c hours
A/c departures
Passengers carried
ASKM (Available Seats in Kilometre)
RPKM (Revenue Passenger in Kilometre)
Passenger load factor
Freight carriedATKM (Available ton km)
RTKM (Revenue ton km)
Weight Load Factor
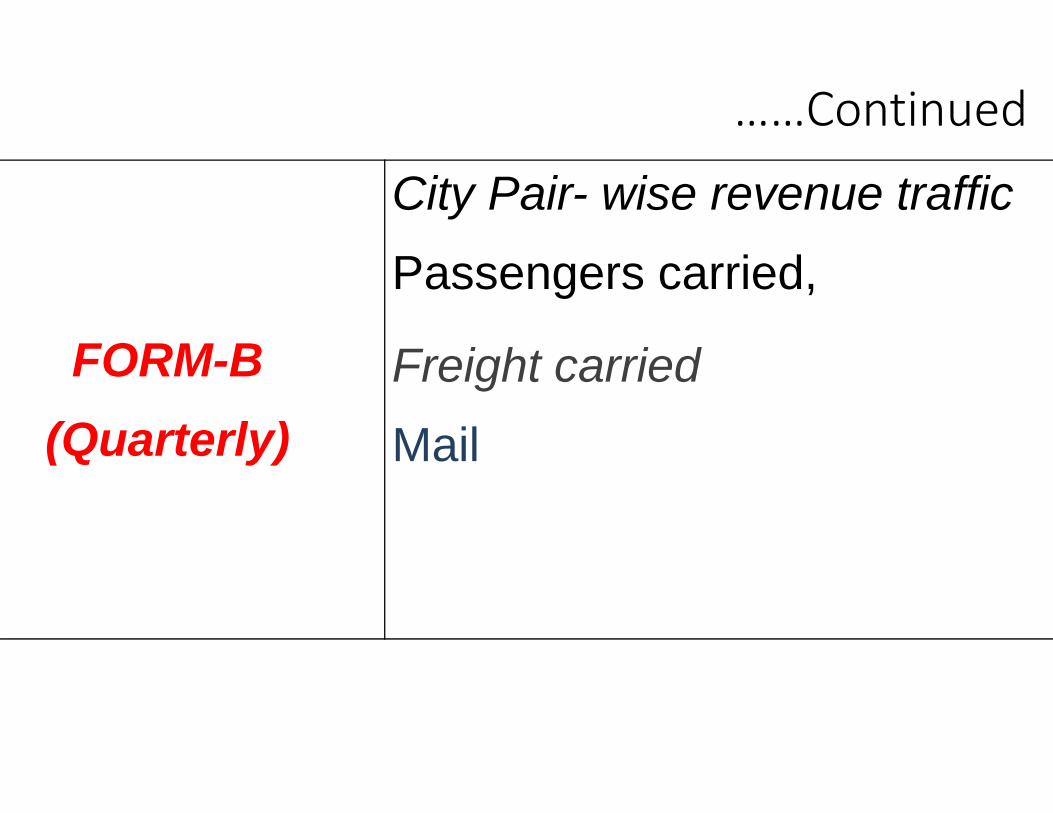
……Continued
FORM-B(Quarterly)
City Pair- wise revenue traffic
Passengers carried,
Freight carried
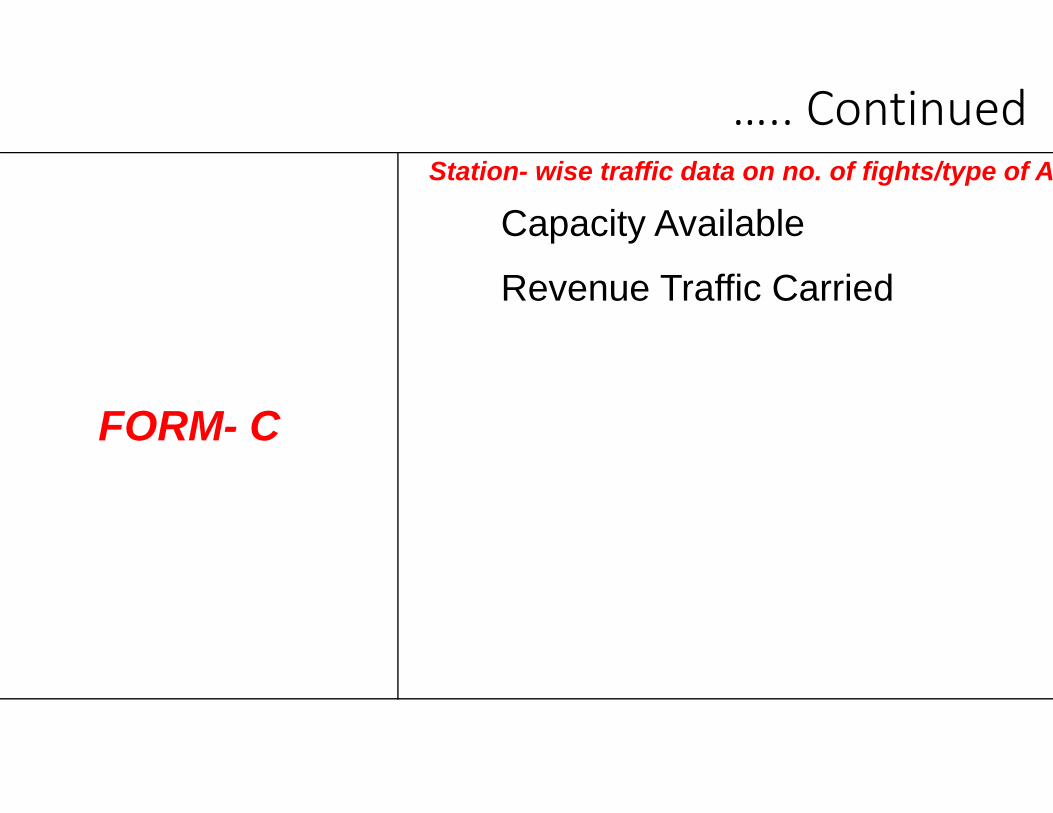
….. Continued
FORM- C
Station- wise traffic data on no. of fights/type of A/
Capacity Available
Revenue Traffic Carried
…….Continu
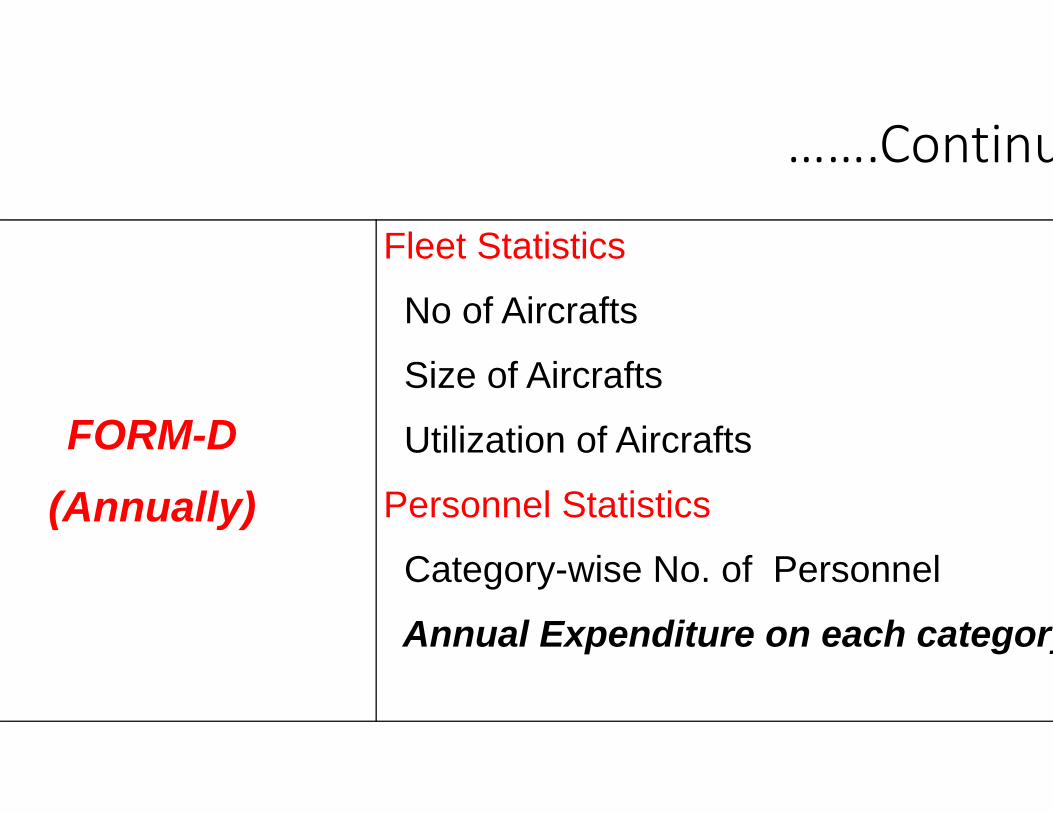
FORM-D(Annually)
Fleet Statistics
No of Aircrafts
Size of Aircrafts
Utilization of Aircrafts
Personnel Statistics
Category-wise No. of Personnel
Annual Expenditure on each category
…..condinue
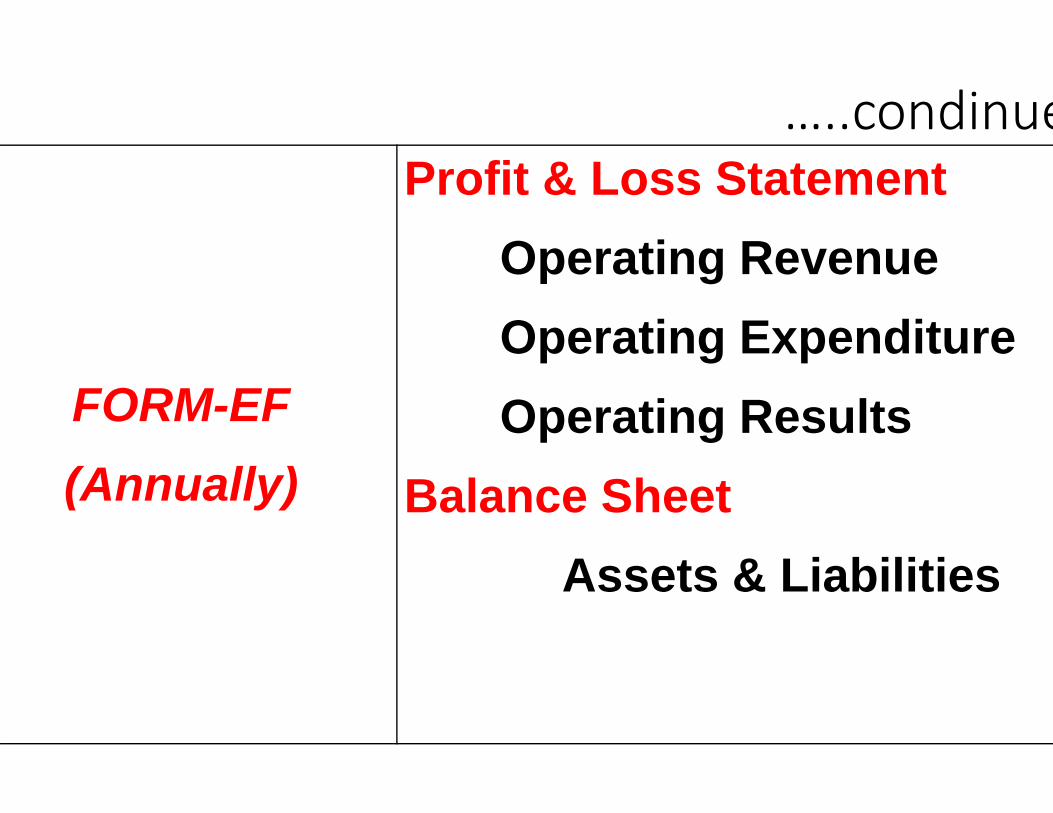
FORM-EF(Annually)
Profit & Loss StatementOperating RevenueOperating ExpenditureOperating Results
Balance SheetAssets & Liabilities
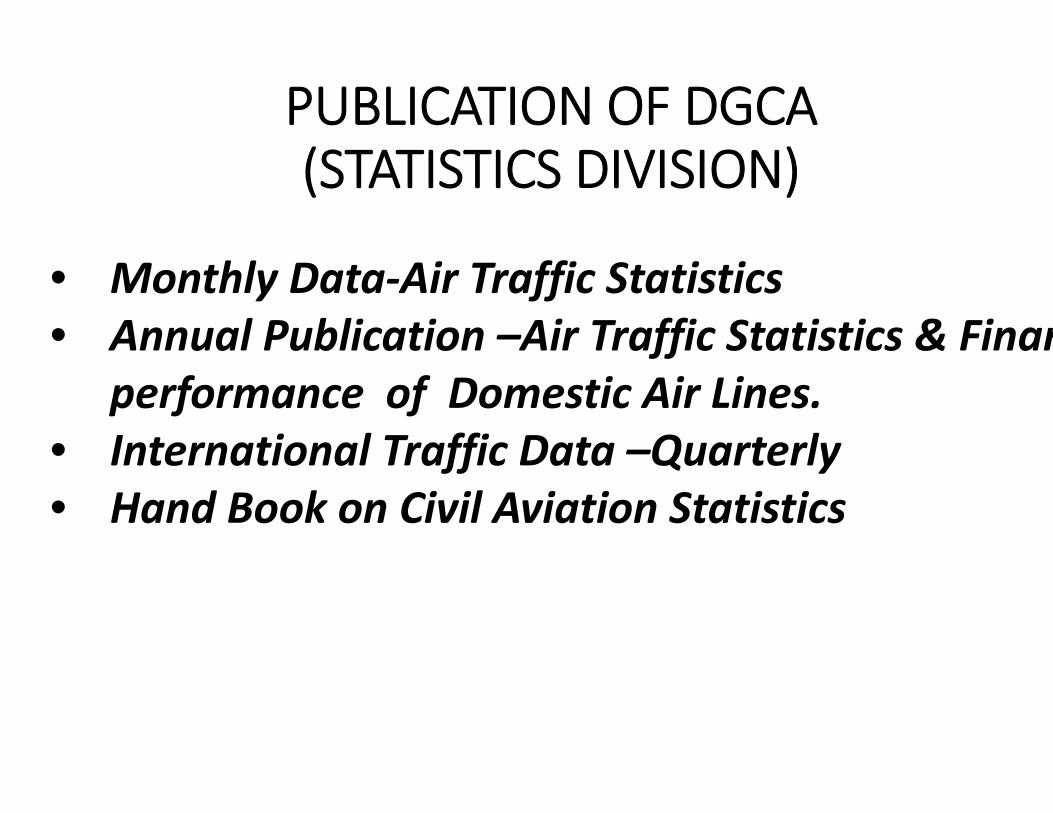
PUBLICATION OF DGCA(STATISTICS DIVISION)
• Monthly Data‐Air Traffic Statistics • Annual Publication –Air Traffic Statistics & Finan
performance of Domestic Air Lines.• International Traffic Data –Quarterly • Hand Book on Civil Aviation Statistics
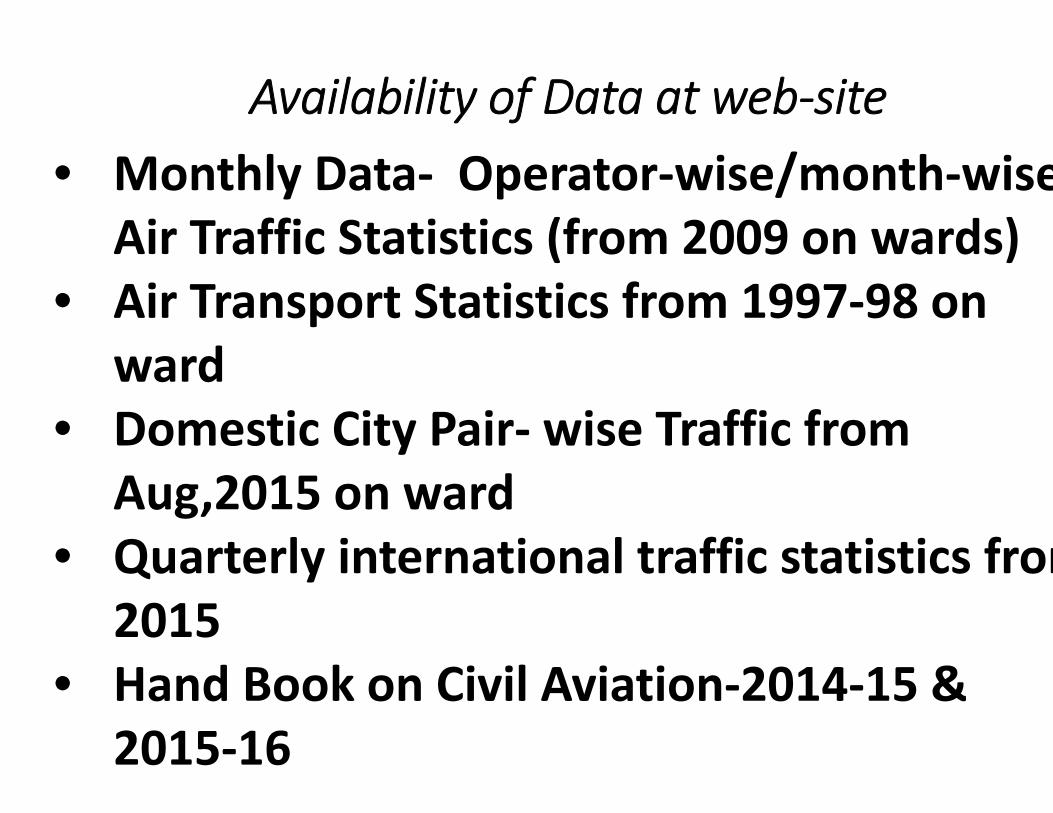
Availability of Data at web‐site• Monthly Data‐ Operator‐wise/month‐wise
Air Traffic Statistics (from 2009 on wards)• Air Transport Statistics from 1997‐98 on
ward• Domestic City Pair‐ wise Traffic from
Aug,2015 on ward• Quarterly international traffic statistics from
2015• Hand Book on Civil Aviation‐2014‐15 &
2015‐16
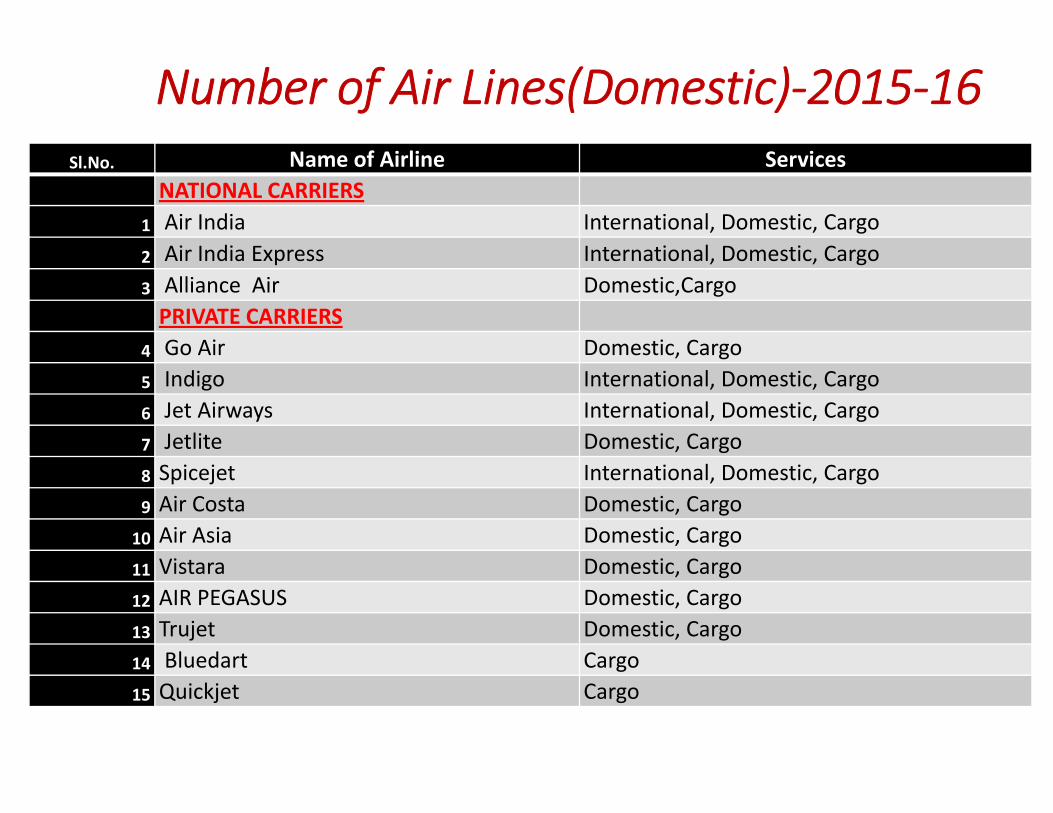
Number of Air Lines(Domestic)‐2015‐16Sl.No. Name of Airline Services
NATIONAL CARRIERS1 Air India International, Domestic, Cargo2 Air India Express International, Domestic, Cargo3 Alliance Air Domestic,CargoPRIVATE CARRIERS
4 Go Air Domestic, Cargo5 Indigo International, Domestic, Cargo6 Jet Airways International, Domestic, Cargo7 Jetlite Domestic, Cargo8 Spicejet International, Domestic, Cargo9 Air Costa Domestic, Cargo10 Air Asia Domestic, Cargo11 Vistara Domestic, Cargo12 AIR PEGASUS Domestic, Cargo13 Trujet Domestic, Cargo14 Bluedart Cargo15 Quickjet Cargo
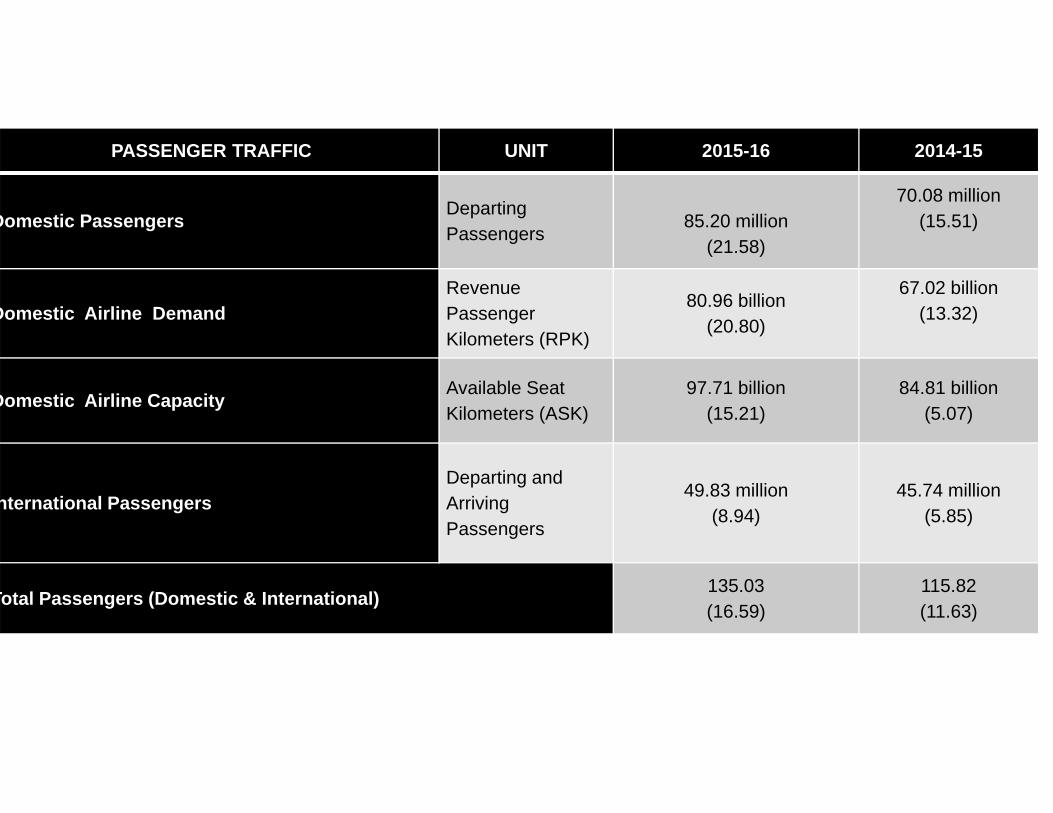
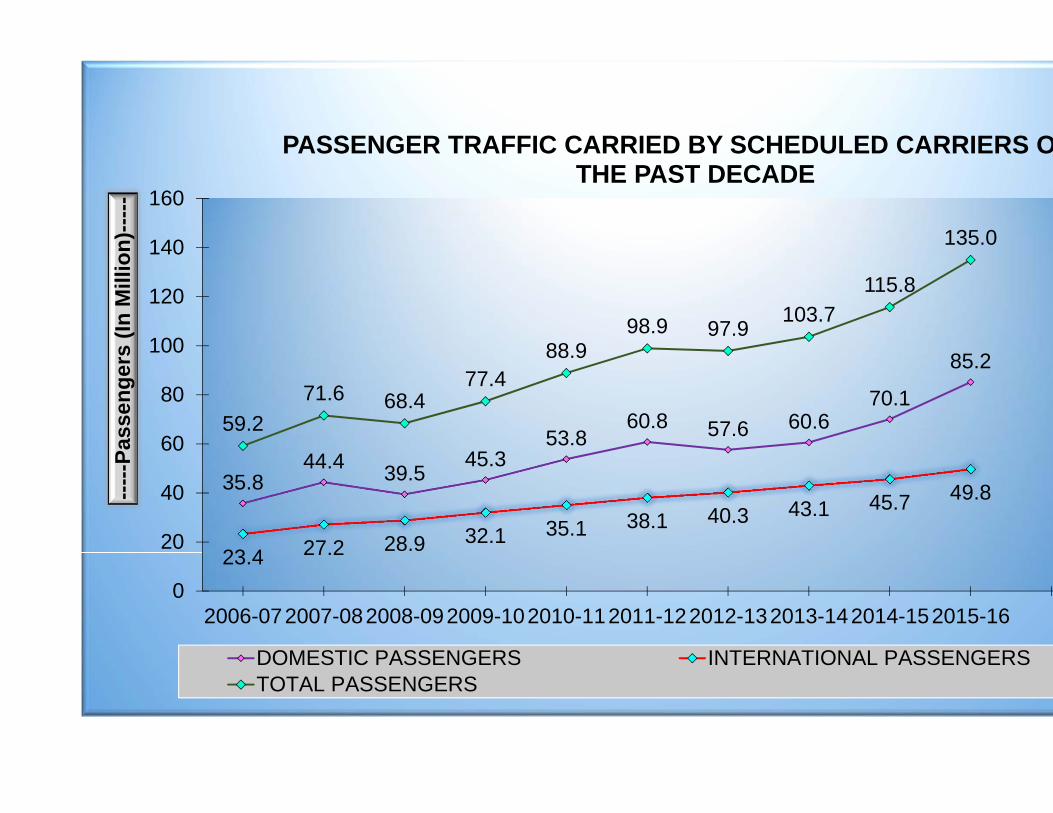
PASSENGER TRAFFIC UNIT 2015-16 2014-15
Domestic Passengers Departing Passengers
85.20 million(21.58)
70.08 million(15.51)
Domestic Airline DemandRevenue Passenger Kilometers (RPK)
80.96 billion(20.80)
67.02 billion(13.32)
Domestic Airline Capacity Available Seat Kilometers (ASK)
97.71 billion(15.21)
84.81 billion(5.07)
nternational PassengersDeparting and Arriving Passengers
49.83 million(8.94)
45.74 million(5.85)
Total Passengers (Domestic & International) 135.03(16.59)
115.82(11.63)
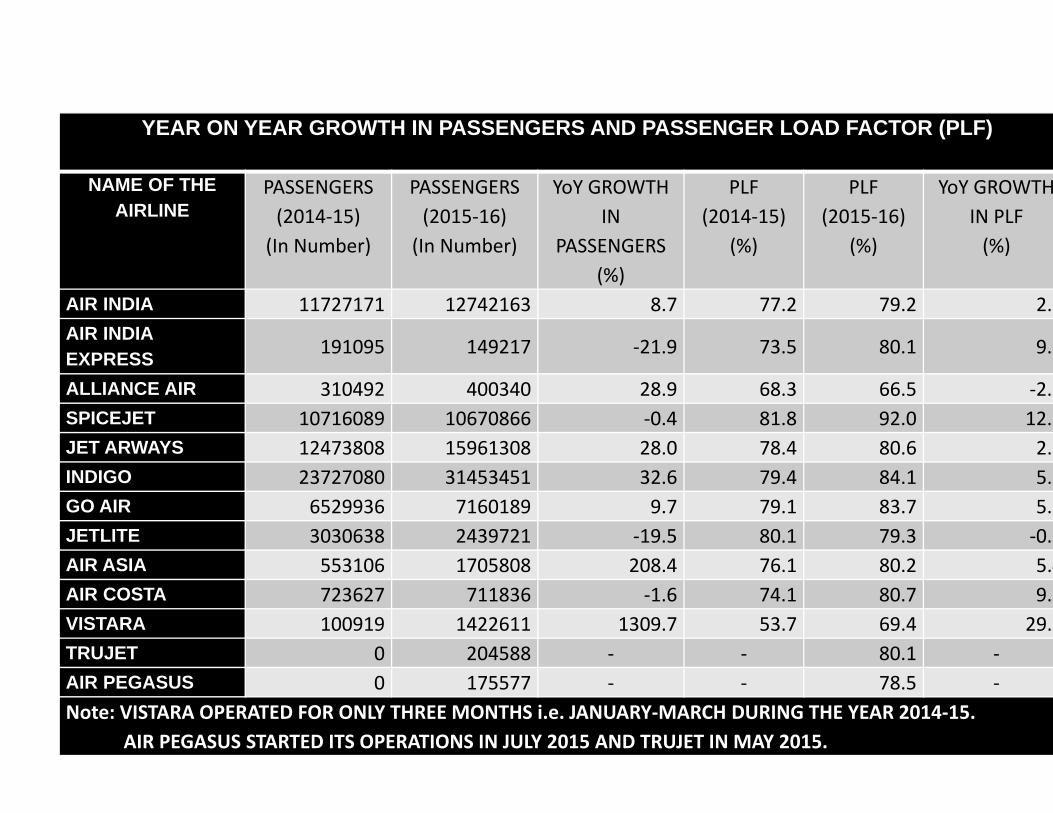
YEAR ON YEAR GROWTH IN PASSENGERS AND PASSENGER LOAD FACTOR (PLF)
NAME OF THE AIRLINE
PASSENGERS(2014‐15)(In Number)
PASSENGERS(2015‐16)(In Number)
YoY GROWTH IN
PASSENGERS(%)
PLF(2014‐15)
(%)
PLF(2015‐16)
(%)
YoY GROWTHIN PLF(%)
AIR INDIA 11727171 12742163 8.7 77.2 79.2 2.6AIR INDIA EXPRESS 191095 149217 ‐21.9 73.5 80.1 9.0
ALLIANCE AIR 310492 400340 28.9 68.3 66.5 ‐2.6SPICEJET 10716089 10670866 ‐0.4 81.8 92.0 12.5JET ARWAYS 12473808 15961308 28.0 78.4 80.6 2.8INDIGO 23727080 31453451 32.6 79.4 84.1 5.9GO AIR 6529936 7160189 9.7 79.1 83.7 5.7JETLITE 3030638 2439721 ‐19.5 80.1 79.3 ‐0.9AIR ASIA 553106 1705808 208.4 76.1 80.2 5.4AIR COSTA 723627 711836 ‐1.6 74.1 80.7 9.0VISTARA 100919 1422611 1309.7 53.7 69.4 29.TRUJET 0 204588 ‐ ‐ 80.1 ‐AIR PEGASUS 0 175577 ‐ ‐ 78.5 ‐Note: VISTARA OPERATED FOR ONLY THREE MONTHS i.e. JANUARY‐MARCH DURING THE YEAR 2014‐15.
AIR PEGASUS STARTED ITS OPERATIONS IN JULY 2015 AND TRUJET IN MAY 2015.
35.844.4 39.5
45.353.8
60.8 57.6 60.670.1
85.2
23.4 27.2 28.9 32.1 35.1 38.1 40.3 43.1 45.7 49.8
59.271.6 68.4
77.488.9
98.9 97.9103.7
115.8
135.0
0
20
40
60
80
100
120
140
160
2006-072007-082008-092009-102010-112011-122012-132013-142014-152015-16
-----P
asse
nger
s (In
Mill
ion)
-----
PASSENGER TRAFFIC CARRIED BY SCHEDULED CARRIERS OTHE PAST DECADE
DOMESTIC PASSENGERS INTERNATIONAL PASSENGERSTOTAL PASSENGERS
9271025 1072
1139
12921219 1238 1262
1368 1404
322 368 342394
465 453 452508
591 624
0
200
400
600
800
1000
1200
1400
1600
2006-07 2007-08 2008-09 2009-10 2010-11 2011-12 2012-13 2013-14 2014-15 2015-16
--Fr
eigh
t (Th
ousa
nd M
etric
Ton
ne)-
-
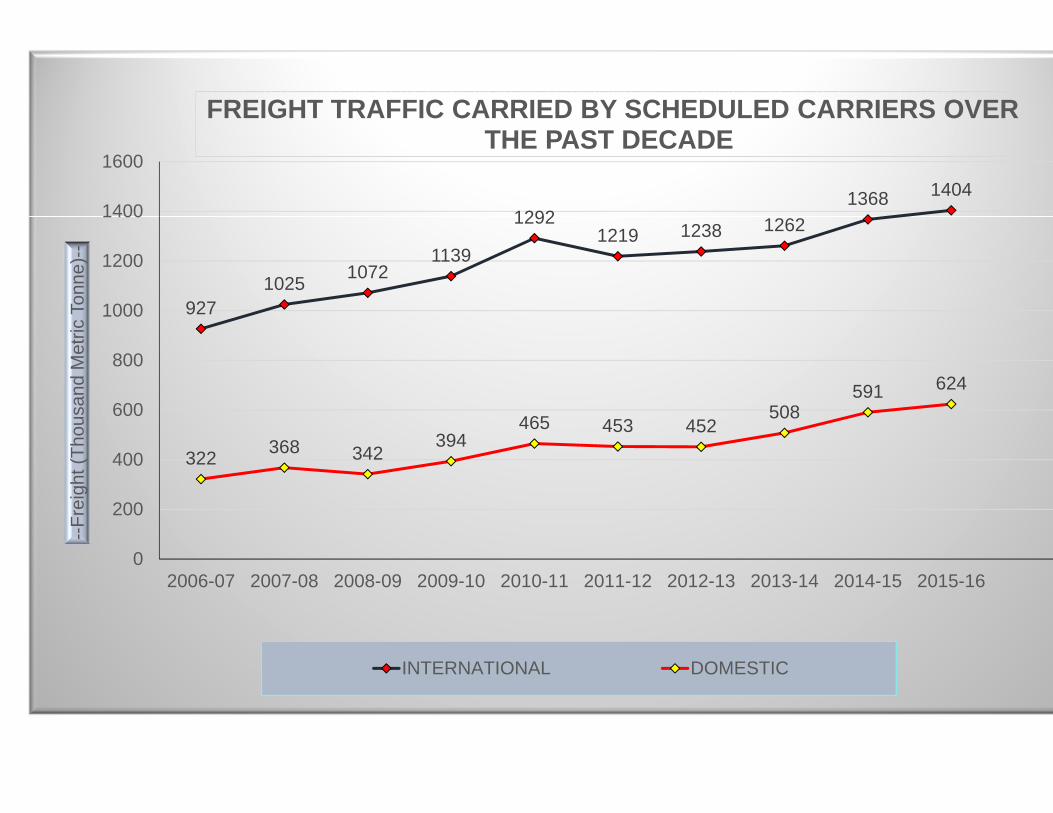
FREIGHT TRAFFIC CARRIED BY SCHEDULED CARRIERS OVER THE PAST DECADE
INTERNATIONAL DOMESTIC
156183
229
272
327
370409 412
366 361393 406
44 56 6699
122 127 134 147125 120 126 123
0
50
100
150
200
250
300
350
400
450
----
---N
umbe
r---
----
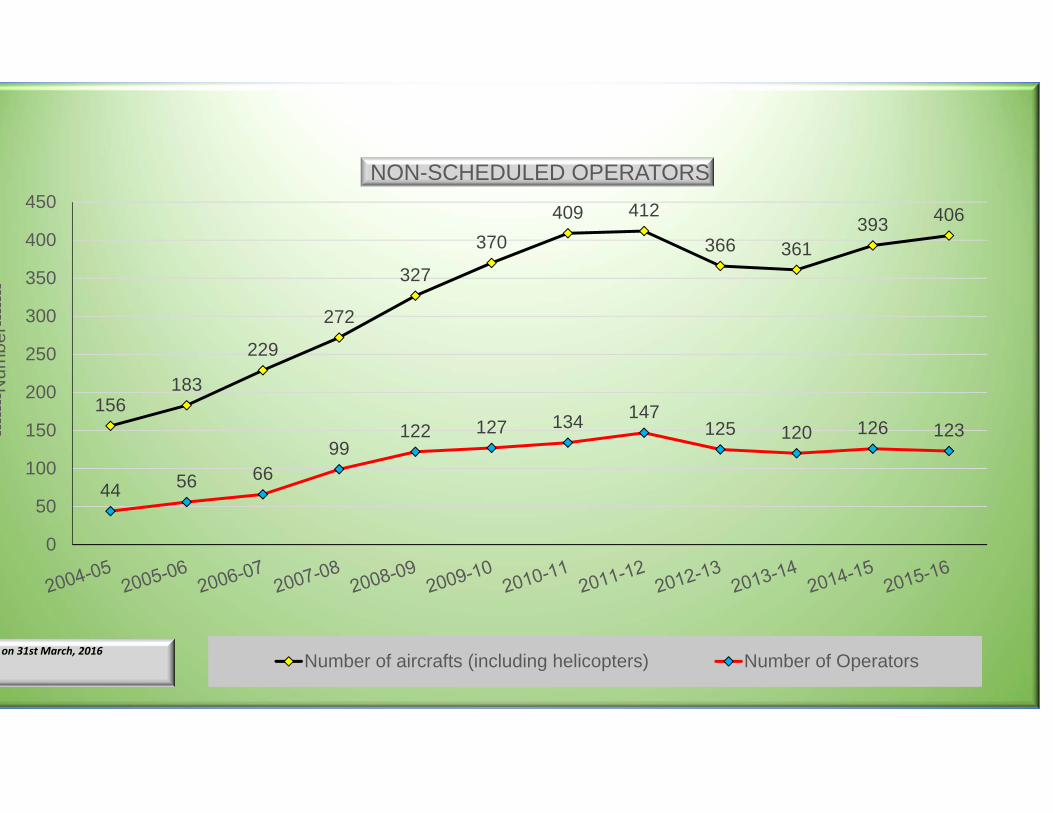
NON-SCHEDULED OPERATORS
Number of aircrafts (including helicopters) Number of Operatorson 31st March, 2016
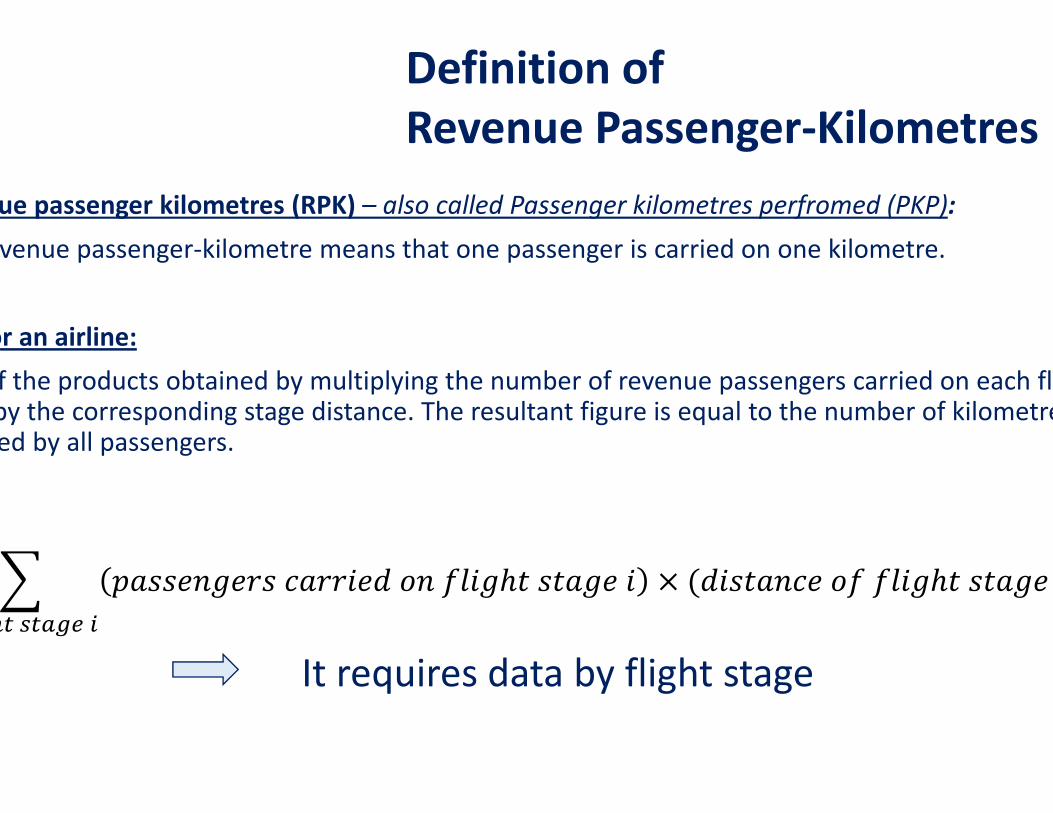
ue passenger kilometres (RPK) – also called Passenger kilometres perfromed (PKP):venue passenger‐kilometre means that one passenger is carried on one kilometre.
or an airline: f the products obtained by multiplying the number of revenue passengers carried on each flby the corresponding stage distance. The resultant figure is equal to the number of kilometreed by all passengers.
Definition of Revenue Passenger‐Kilometres
It requires data by flight stage
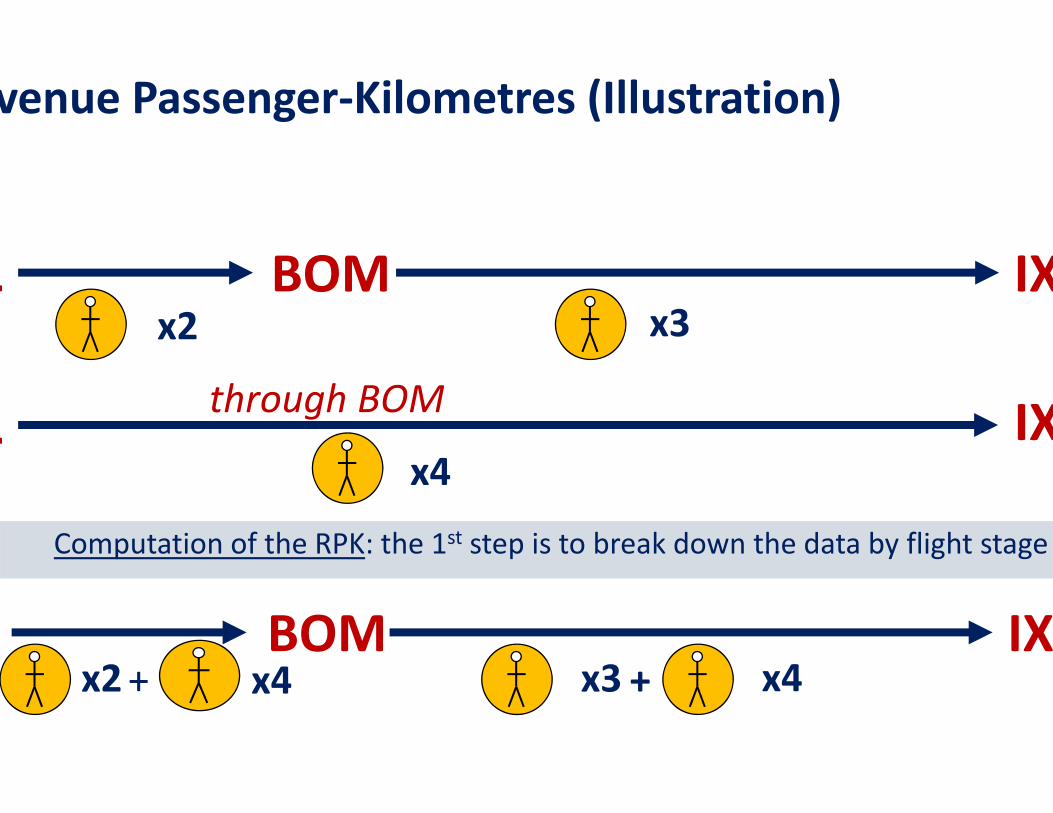
venue Passenger‐Kilometres (Illustration)
L BOM IX
L IXthrough BOM
Computation of the RPK: the 1st step is to break down the data by flight stage
BOM IX
x2 x3
x4
x2 x4+ x3 x4+
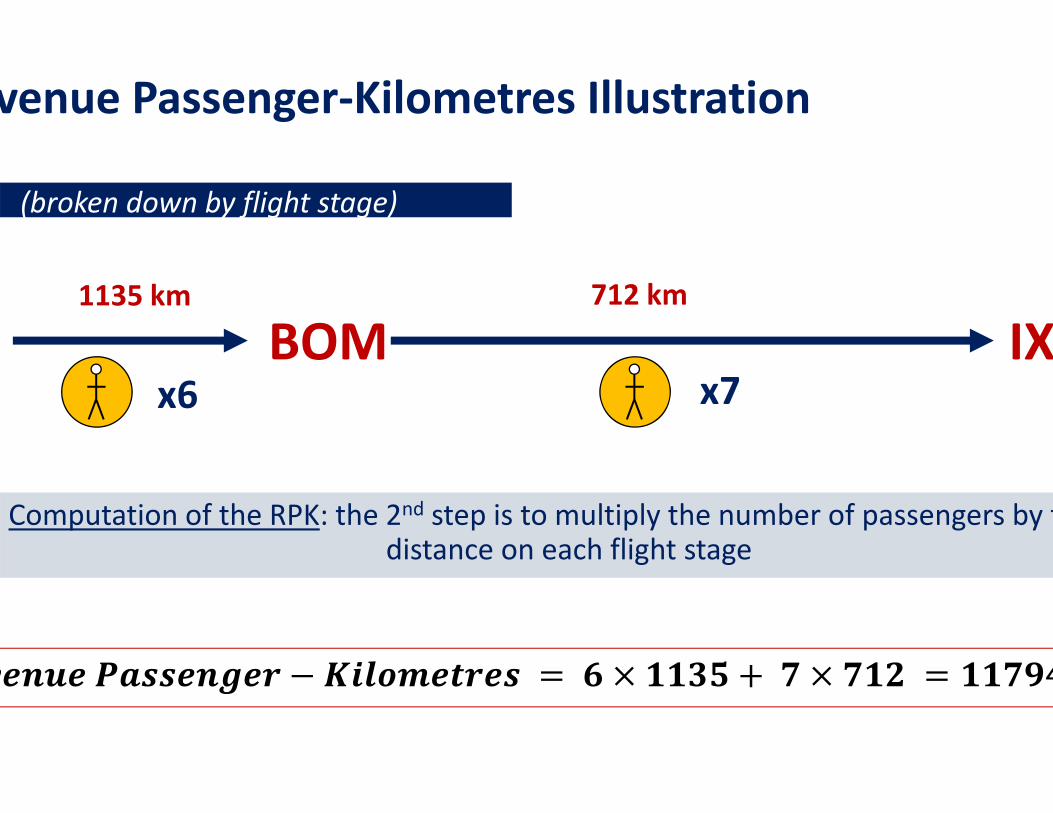
venue Passenger‐Kilometres Illustration
BOM IX
(broken down by flight stage)
Computation of the RPK: the 2nd step is to multiply the number of passengers by tdistance on each flight stage
x6 x7
1135 km 712 km
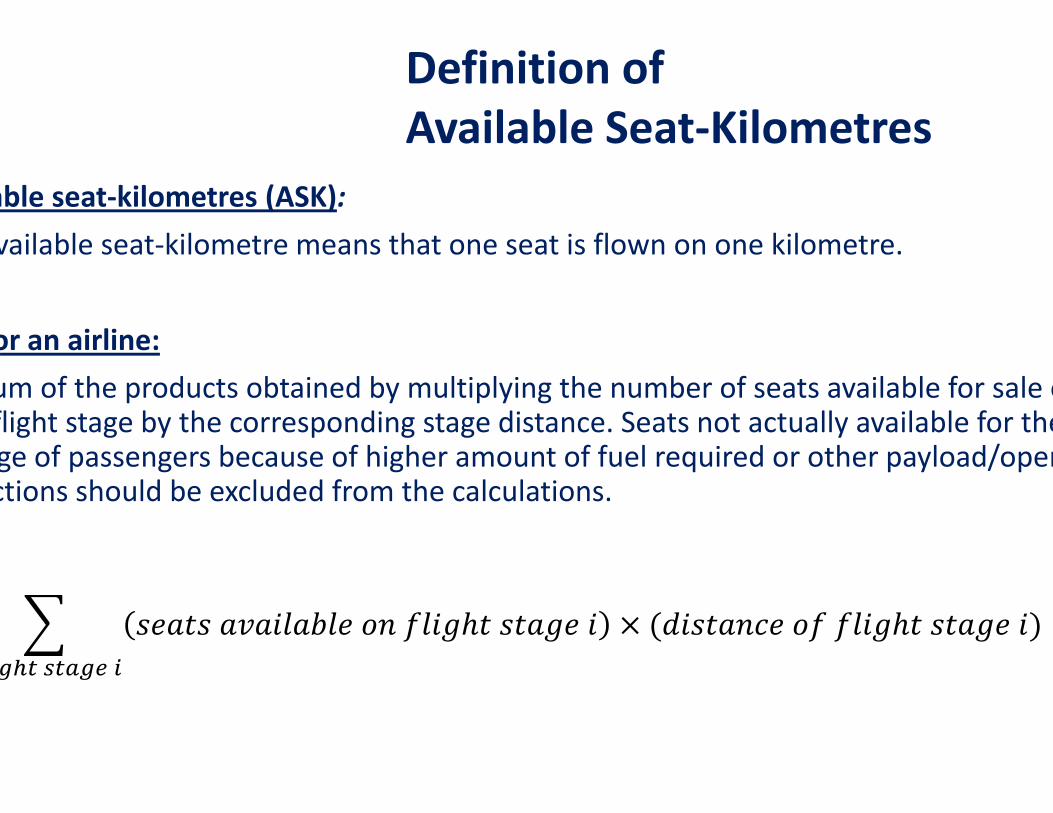
able seat‐kilometres (ASK): vailable seat‐kilometre means that one seat is flown on one kilometre.
or an airline: um of the products obtained by multiplying the number of seats available for sale oflight stage by the corresponding stage distance. Seats not actually available for thege of passengers because of higher amount of fuel required or other payload/operctions should be excluded from the calculations.
Definition of Available Seat‐Kilometres
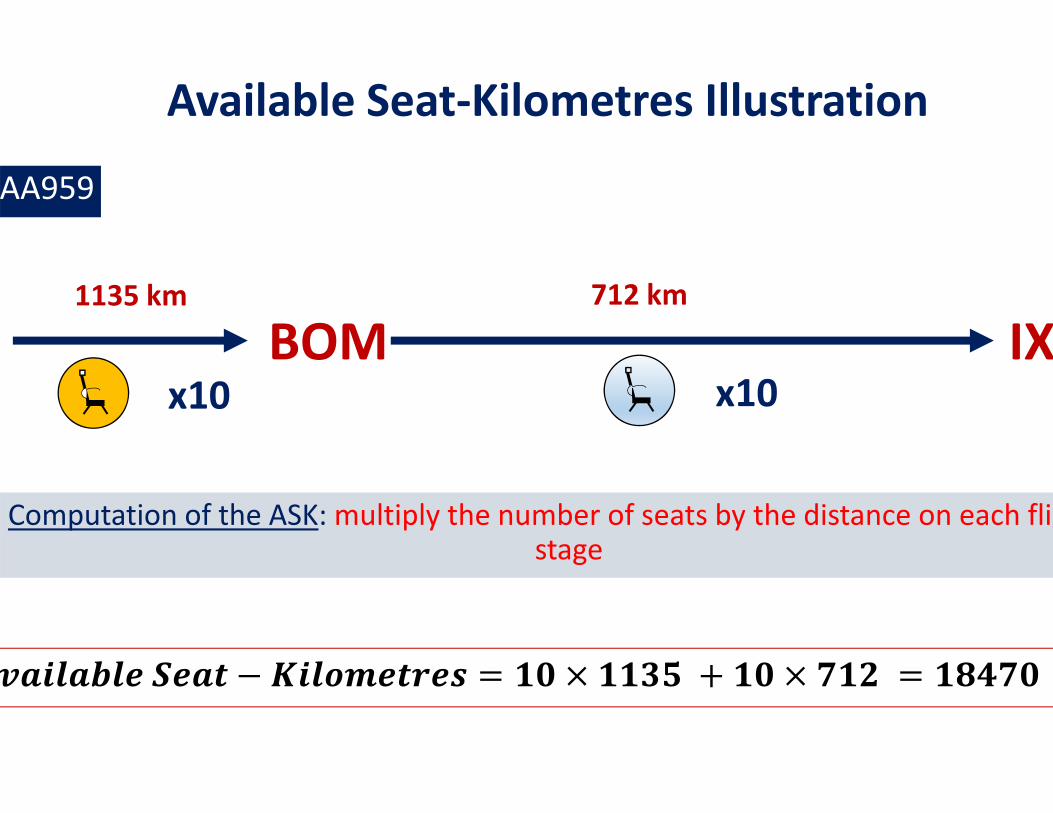
Available Seat‐Kilometres Illustration
BOM IX
AA959
Computation of the ASK: multiply the number of seats by the distance on each fligstage
x10 x10
1135 km 712 km
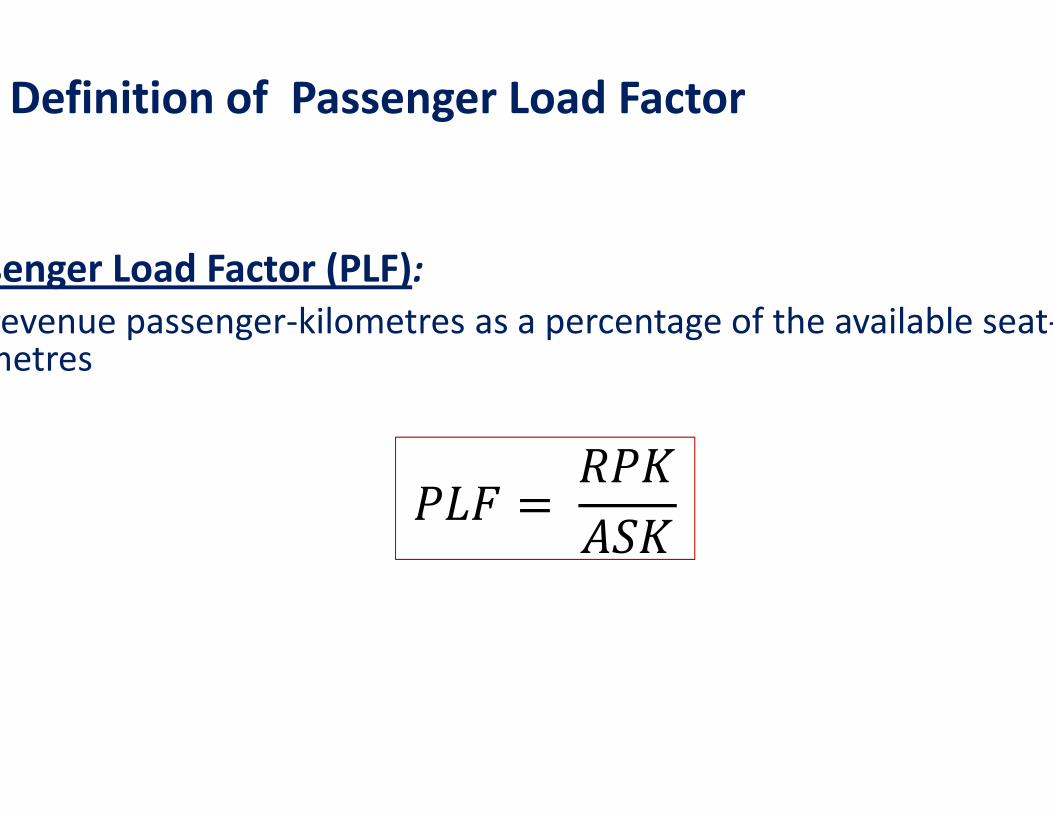
senger Load Factor (PLF): revenue passenger‐kilometres as a percentage of the available seat‐metres
Definition of Passenger Load Factor
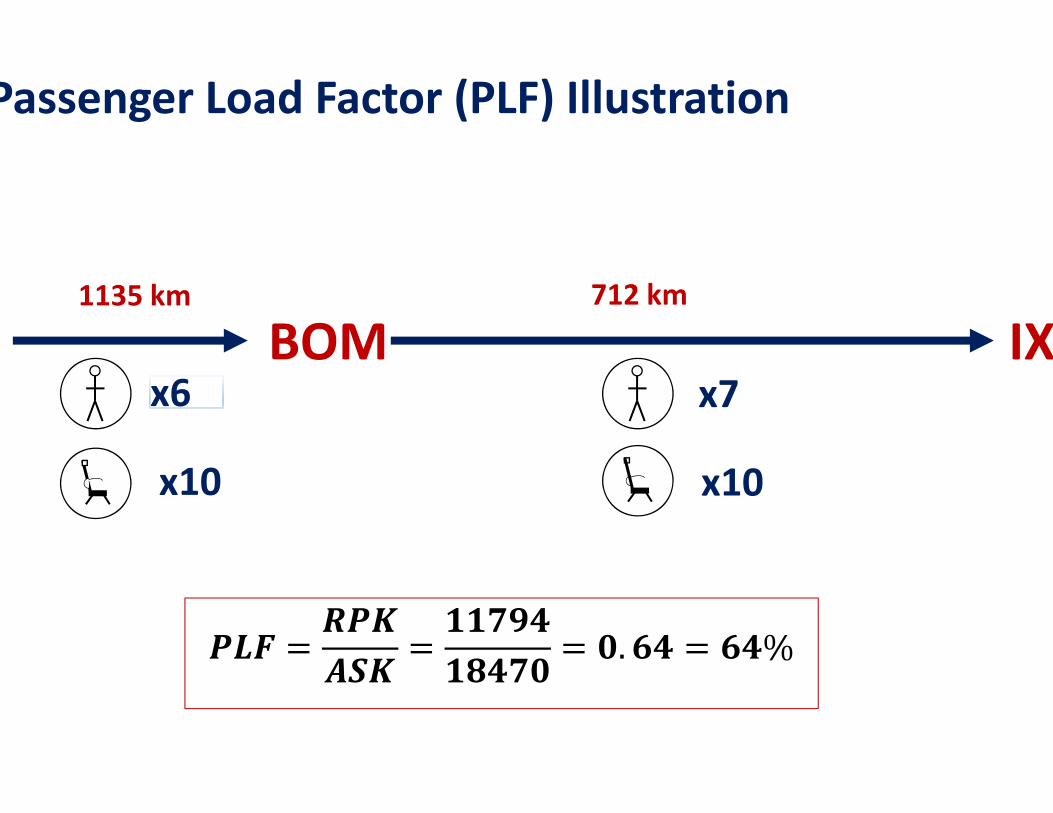
Passenger Load Factor (PLF) Illustration
BOM IX
x10 x10
1135 km 712 km
x6 x7
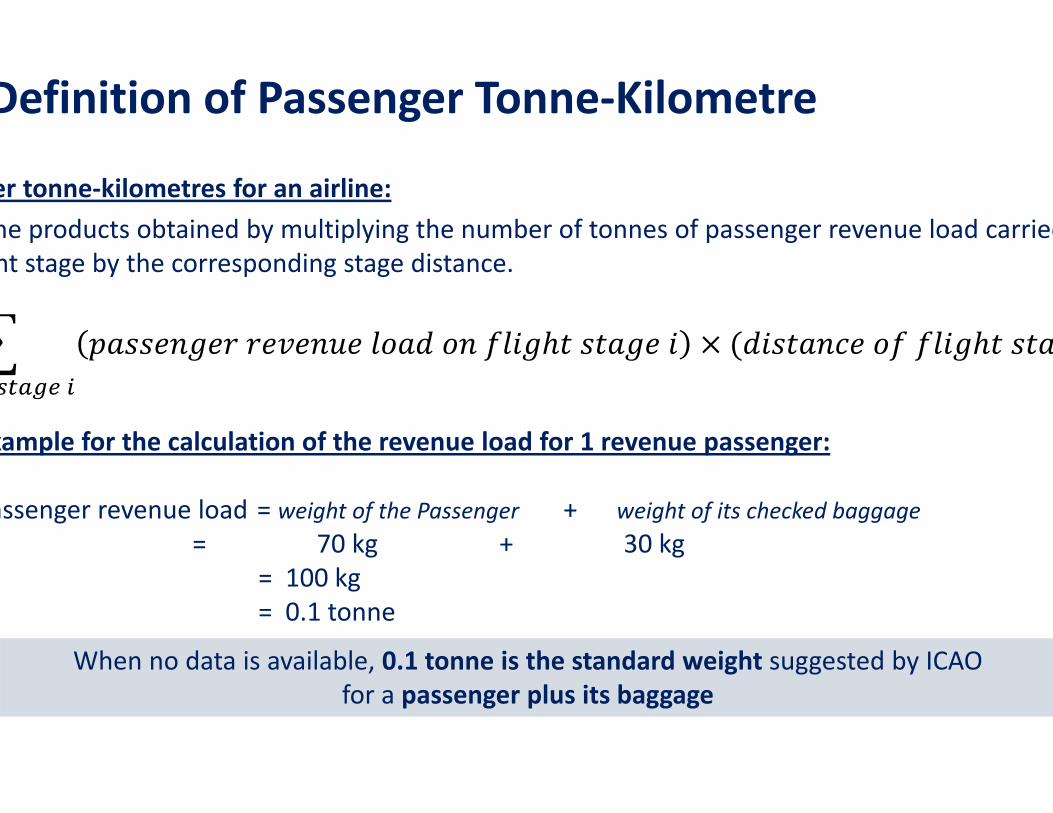
xample for the calculation of the revenue load for 1 revenue passenger:
assenger revenue load = weight of the Passenger + weight of its checked baggage= 70 kg + 30 kg
= 100 kg= 0.1 tonne
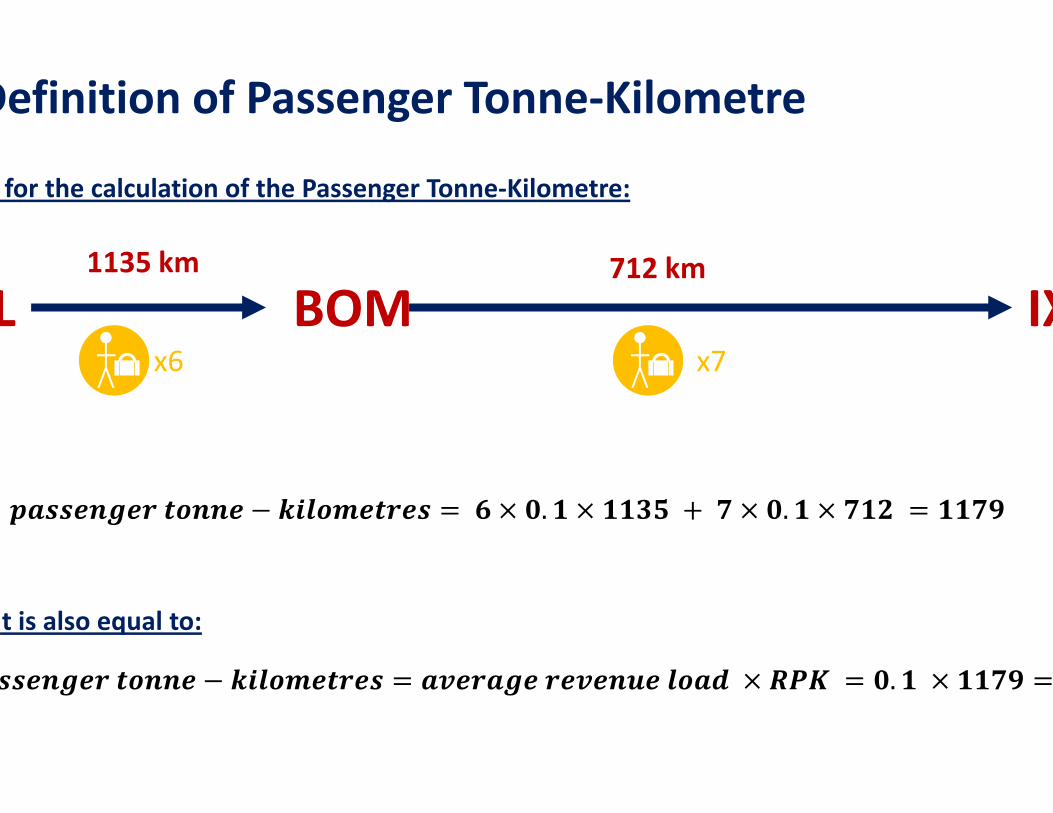
Definition of Passenger Tonne‐Kilometre
er tonne‐kilometres for an airline:he products obtained by multiplying the number of tonnes of passenger revenue load carriedht stage by the corresponding stage distance.
When no data is available, 0.1 tonne is the standard weight suggested by ICAOfor a passenger plus its baggage
Definition of Passenger Tonne‐Kilometre
for the calculation of the Passenger Tonne‐Kilometre:
L BOM IX1135 km 712 km
x6 x7
. .
.
t is also equal to:
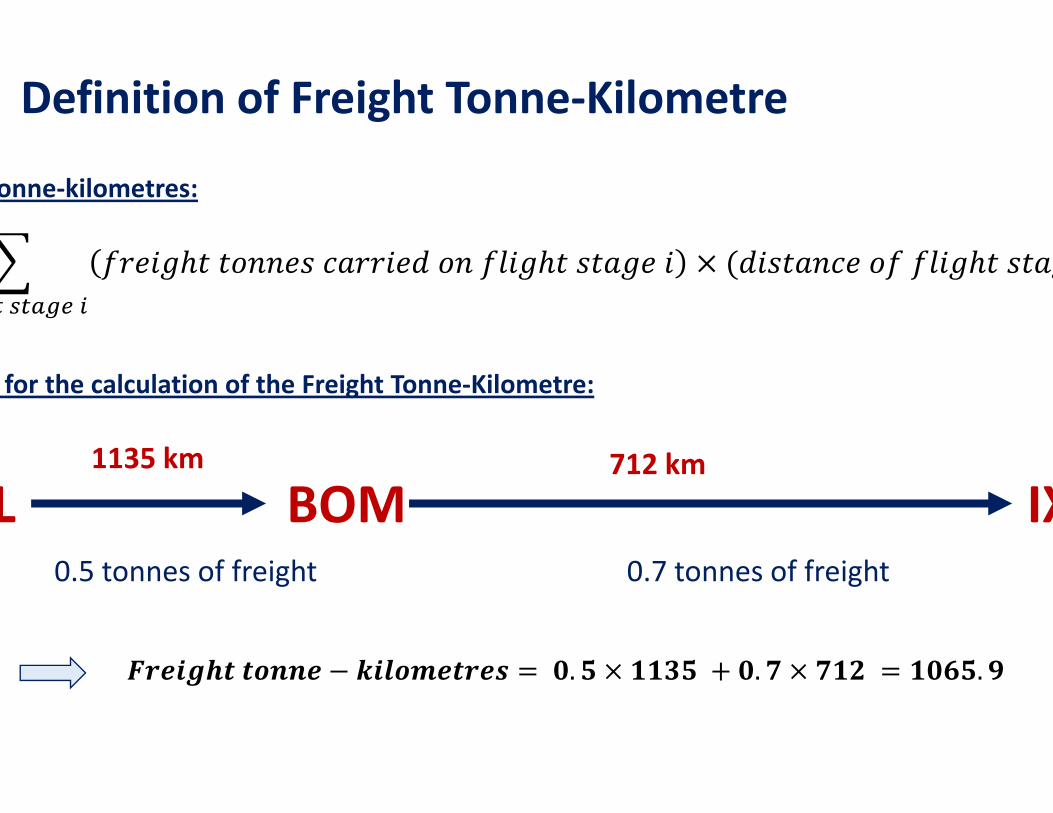
Definition of Freight Tonne‐Kilometre
for the calculation of the Freight Tonne‐Kilometre:
L BOM IX1135 km 712 km
0.5 tonnes of freight 0.7 tonnes of freight
. . .
onne‐kilometres:
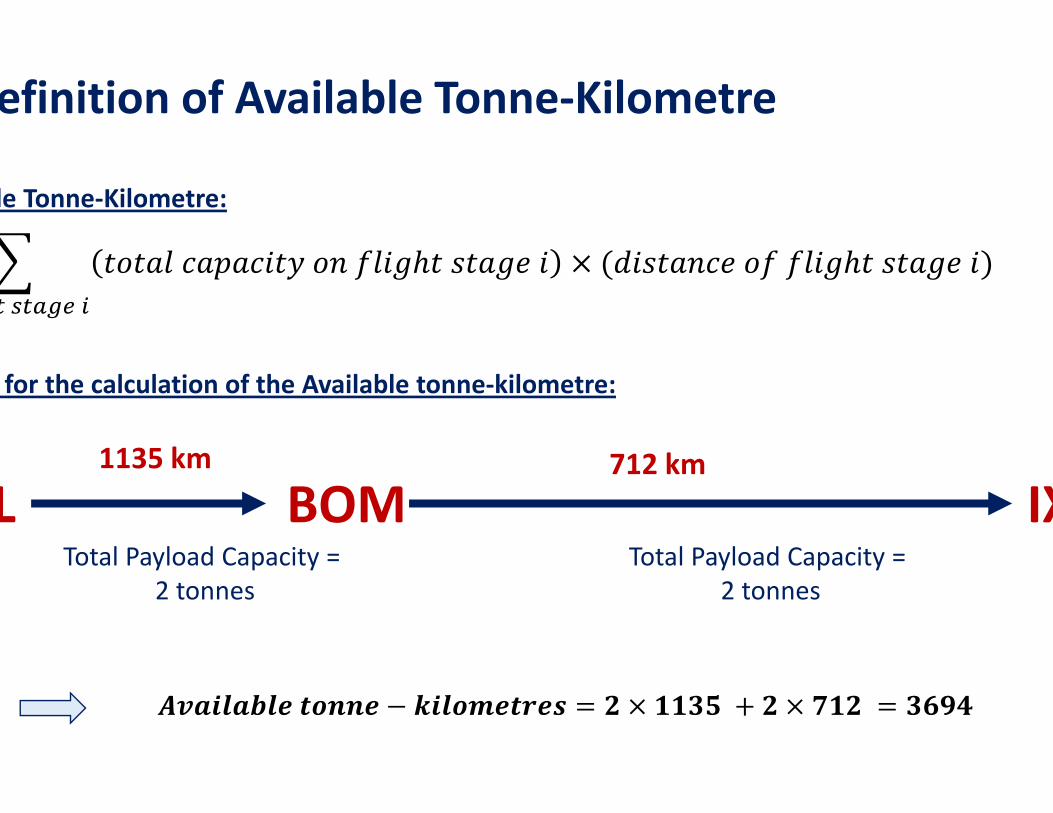
efinition of Available Tonne‐Kilometre
for the calculation of the Available tonne‐kilometre:
L BOM IX1135 km 712 km
Total Payload Capacity =2 tonnes
Total Payload Capacity =2 tonnes
le Tonne‐Kilometre:
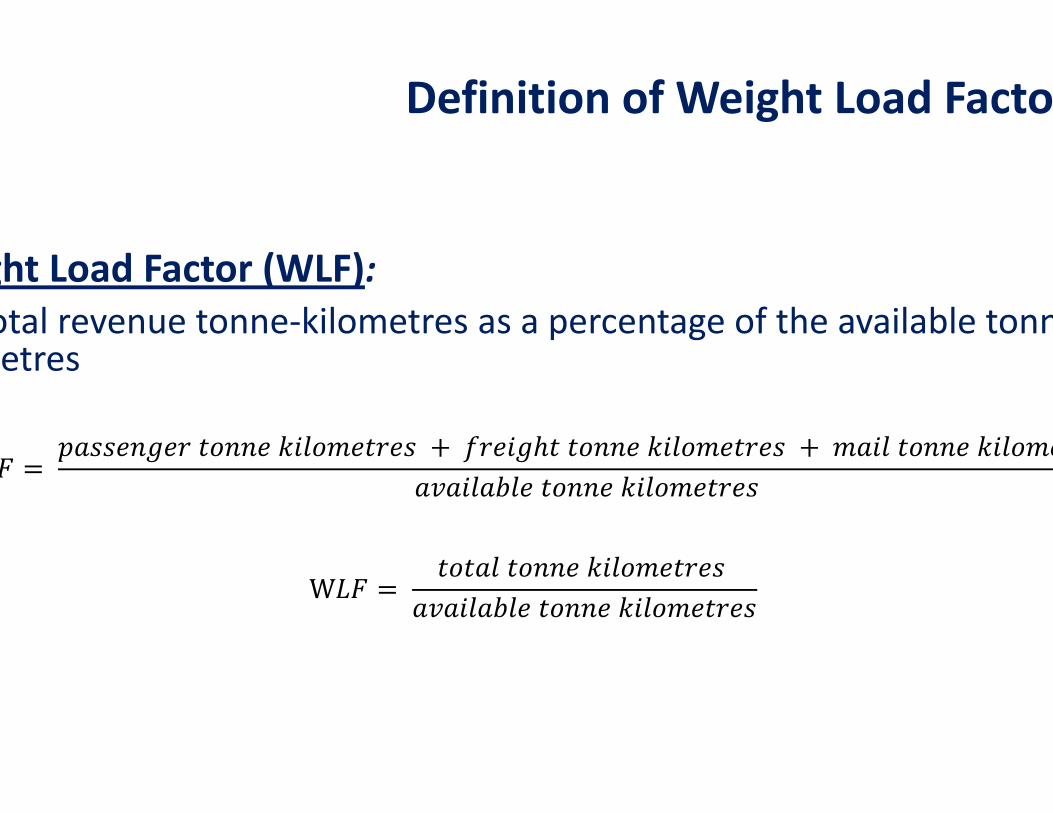
ght Load Factor (WLF): otal revenue tonne‐kilometres as a percentage of the available tonnetres
Definition of Weight Load Facto
W
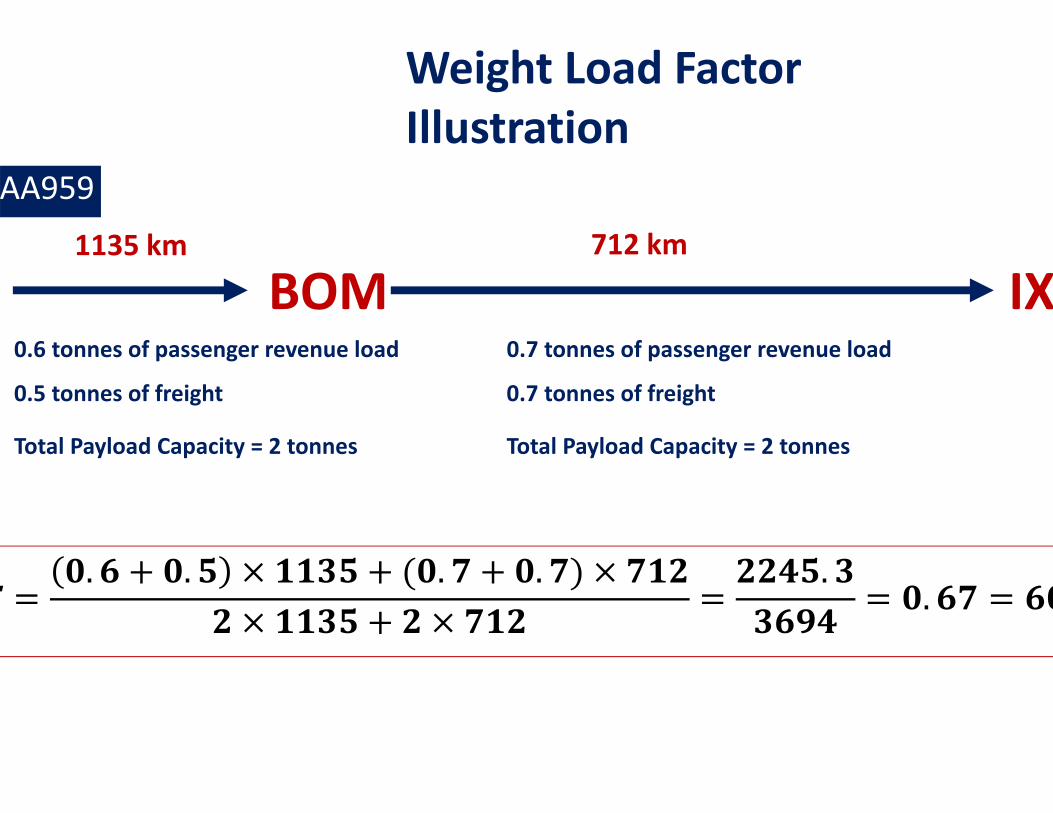
Weight Load FactorIllustration
BOM IX
AA959
1135 km 712 km
Total Payload Capacity = 2 tonnes
0.5 tonnes of freight
0.6 tonnes of passenger revenue load 0.7 tonnes of passenger revenue load
0.7 tonnes of freight
Total Payload Capacity = 2 tonnes
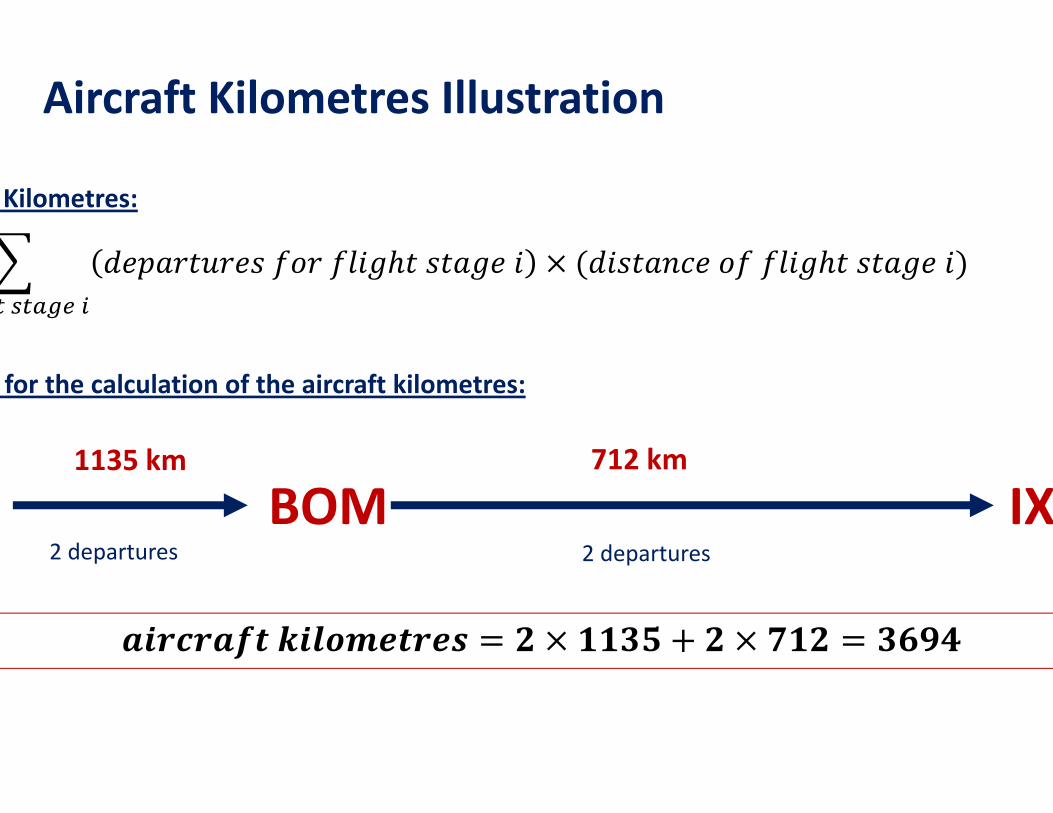
Aircraft Kilometres Illustration
BOM IX1135 km 712 km
2 departures 2 departures
Kilometres:
for the calculation of the aircraft kilometres:
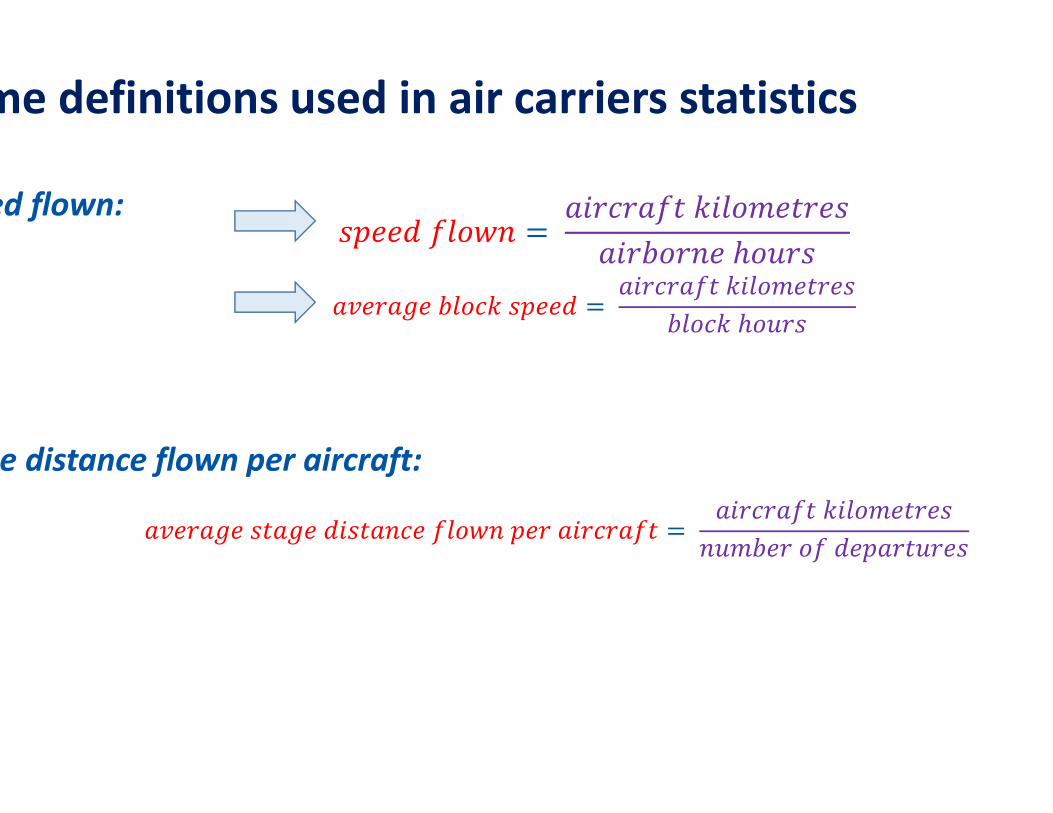
ed flown:
e distance flown per aircraft:
me definitions used in air carriers statistics

THANK YOU