Embed Size (px)
Citation preview
Monthly ReportMarch 2019
Vol. 71 No 3
Deutsche Bundesbank
Wilhelm-Epstein-Strasse 14
60431 Frankfurt am Main
Germany
Postfach 10 06 02
60006 Frankfurt am Main
Germany
Tel.: +49 (0)69 9566 3512
Email: www.bundesbank.de/kontakt
Internet: www.bundesbank.de
Reproduction permitted only if source is stated.
ISSN 0418-8292 (print edition)
ISSN 1862-1325 (online edition)
The German original of this Monthly Report
went to press at 11 a.m. on 15 March 2019.
Publishing schedules for selected statistics can
be downloaded from our website. The statis-
tical data are also published on the website.
The Monthly Report is published by the
Deutsche Bundesbank, Frankfurt am Main, by
virtue of Section 18 of the Bundesbank Act. It is
available to interested parties free of charge.
This is a translation of the original German
language version, which is the sole authorita-
tive text.
Deutsche Bundesbank Monthly Report March 2019 2
Contents
Commentaries .......................................................................................................... 5
Economic conditions ........................................................................................................... 5
The revision of the sub- index for package holidays and its impact on the HICP and
core inflation ...................................................................................................................... 8
Public finances .................................................................................................................... 9
Securities markets ............................................................................................................... 13
Balance of payments ........................................................................................................... 14
German balance of payments in 2018 ............................................................ 17
The drivers of German net exports from the perspective of a DSGE model ......................... 19
On the corporate payout ratio in Germany ......................................................................... 24
The relationship between domestic corporate savings and foreign direct investment,
as well as the role of reinvested earnings ........................................................................... 36
Cash demand in the shadow economy .......................................................... 43
Ceilings for cash payments ................................................................................................. 46
Panel analysis of cash lodgements at Bundesbank branches .............................................. 53
Estimating the domestic demand for banknotes ................................................................. 56
Deutsche Bundesbank Monthly Report
March 2019 3
Statistical Section.................................................................................................... 1•
Key economic data for the euro area .................................................................................. 5•
Overall monetary survey in the euro area ............................................................................ 8•
Consolidated financial statement of the Eurosystem ............................................................ 16•
Banks .................................................................................................................................. 20•
Minimum reserves ............................................................................................................... 42•
Interest rates ....................................................................................................................... 43•
Insurance corporations and pension funds .......................................................................... 48•
Capital market .................................................................................................................... 50•
Financial accounts ............................................................................................................... 54•
Public finances in Germany ................................................................................................. 58•
Economic conditions in Germany ........................................................................................ 66•
External sector .................................................................................................................... 75•
Overview of publications by the Deutsche Bundesbank .......................... 85•
Abbreviations and symbols
e Estimated
p Provisional
pe Partly estimated
r Revised
… Data available at a later date
. Data unknown, not to be published or not meaningful
0 Less than 0.5 but more than nil
– Nil
Discrepancies in the totals are due to rounding.
Deutsche Bundesbank Monthly Report March 2019 4
Commentaries
Economic conditions
Underlying trends
The German economy’s underlying cyclical
trend remained subdued at the beginning of
2019. This was due primarily to industrial activ-
ity continuing to cool. Manufacturing could
thus dampen overall economic growth for the
third consecutive quarter.1 Following the de-
cline in output in the second half of 2018 due
to the introduction of a new emissions test
procedure, major catch- up effects in the auto-
motive sector are not expected for the current
quarter. The downturn is likely to have con-
tinued in other industrial sectors. According to
the ifo Institute, sentiment amongst enterprises
in the manufacturing sector continued to de-
teriorate significantly towards the end of the
period under review. By contrast, the construc-
tion sector and private consumption are prob-
ably buoying growth. The sharp rise in retail
sales indicates that private consumption could
pick up more clearly again. Consumers are
benefiting from the continued positive labour
market and income prospects. Furthermore,
the fiscal measures which entered into force in
the first quarter of 2019 are giving consumers
additional leeway to spend.
Industry
Industrial output was in steep decline in Janu-
ary 2019. It was down by a seasonally adjusted
1¼% on the previous month, which had been
revised upwards, and thus fell short of the
average of the last quarter of 2018 by a similar
figure. This was largely attributable to a fresh
setback in the automotive industry (-5¾%),
which had been hard hit by the introduction of
a new emissions test procedure (Worldwide
harmonised Light Vehicles Test Procedure:
WLTP) in the second half of 2018. Excluding the
automotive sector, industrial output stagnated,
however. The renewed dip in passenger car
output is most likely due largely to production
stoppages caused by a strike at an engine plant
in Hungary. The wage dispute was resolved in
January, however, and it is therefore expected
that the recent losses in passenger car output
will be temporary. This is also indicated by data
on the numbers of manufactured passenger
cars (available to February) provided by the
German Association of the Automotive Indus-
try. According to these data, in seasonally ad-
justed terms, the German automotive industry
was able to recoup recent production losses
and almost match the December level again.
However, output still fell well short of the aver-
age number of units produced in the first half
of 2018. In January, the production of capital
goods declined steeply on the quarter (-1¾%)
overall. By contrast, the output of intermediate
goods (-½%) and consumer goods (-¼%) saw
a significantly smaller contraction.
Industrial new orders dropped substantially in
January 2019 and were down by 2½% on the
previous month in seasonally adjusted terms.
At the same time, the December figure under-
went a similarly large upwards revision, how-
ever. This correction was mainly attributable to
the manufacture of other transport equipment,
which is characterised by large orders. The in-
flow of orders was also down by a substantial
2% on the quarter. In regional terms, the in-
flow of domestic orders was unchanged, but
there were considerably fewer orders from the
euro area and third countries than in the final
quarter of 2018 (-3½% in each case). Looking
at the individual sectors, German manufactur-
ers of machinery, in particular, experienced
weak demand (-5½%). New orders in the auto-
motive sector were also down substantially
(-3%), after a very strong rise in the fourth
German economy still lacklustre as 2019 kicks off
Industrial output dampened through further decline in production of motor vehicles
Sharp fall in industrial new orders
1 However, the uncertain indicator situation, which is re-flected, for instance, in the huge upward revisions to new orders and industrial output for December 2018, make it more difficult to assess current industrial activity.
Deutsche Bundesbank Monthly Report
March 2019 5
quarter of 2018. The decline in orders in this
sector was solely related to the fall in orders
from non- euro area countries, only few of
which were affected by the introduction of the
WLTP test. By contrast, orders of motor vehicles
from Germany and the euro area were up sub-
stantially. This could be an indication that
weaker demand from non- European countries
may be masking the catching- up process in the
automotive sector following WLTP- related pro-
duction stoppages. The inflow of orders in the
capital goods sector was down significantly
overall on the quarter (-2¼%). Intermediate
goods producers had to cope with a similar-
sized decline. By contrast, consumer goods
producers recorded a distinct rise in new orders
(+½%).
Nominal industrial turnover did not follow lack-
lustre industrial output in January 2019, instead
rising markedly on the month after seasonal
adjustment (+½%), with even significantly
stronger growth of 1¾% on the quarter. With
regard to the regional sales markets, the in-
crease is mainly derived from Germany and
from non- euro area countries. By contrast,
sales in the euro area declined slightly. In a
sector breakdown, producers of capital goods
recorded particularly strong sales growth. Ger-
man manufacturers of machinery stood out
here with a very significant increase, mainly in
non- euro area countries. Furthermore, the con-
sumer goods sector also reported substantial
growth in sales. By contrast, intermediate
goods producers sold significantly less in terms
of value. In January 2019, nominal goods ex-
ports remained unchanged on the month after
seasonal adjustment. They rose significantly on
the quarter in both nominal (+1%) and price-
adjusted terms (+1¼%). In January, nominal im-
ports of goods rose steeply on the month and
on the quarter (both +1½%) after seasonal ad-
justment. Excluding price effects, quarter- on-
quarter growth was much stronger (+3%). The
large discrepancy was related to prices for
energy imports, which had fallen significantly
at the end of 2018/ beginning of 2019.
Industrial turnover up markedly in January, goods exports unchanged
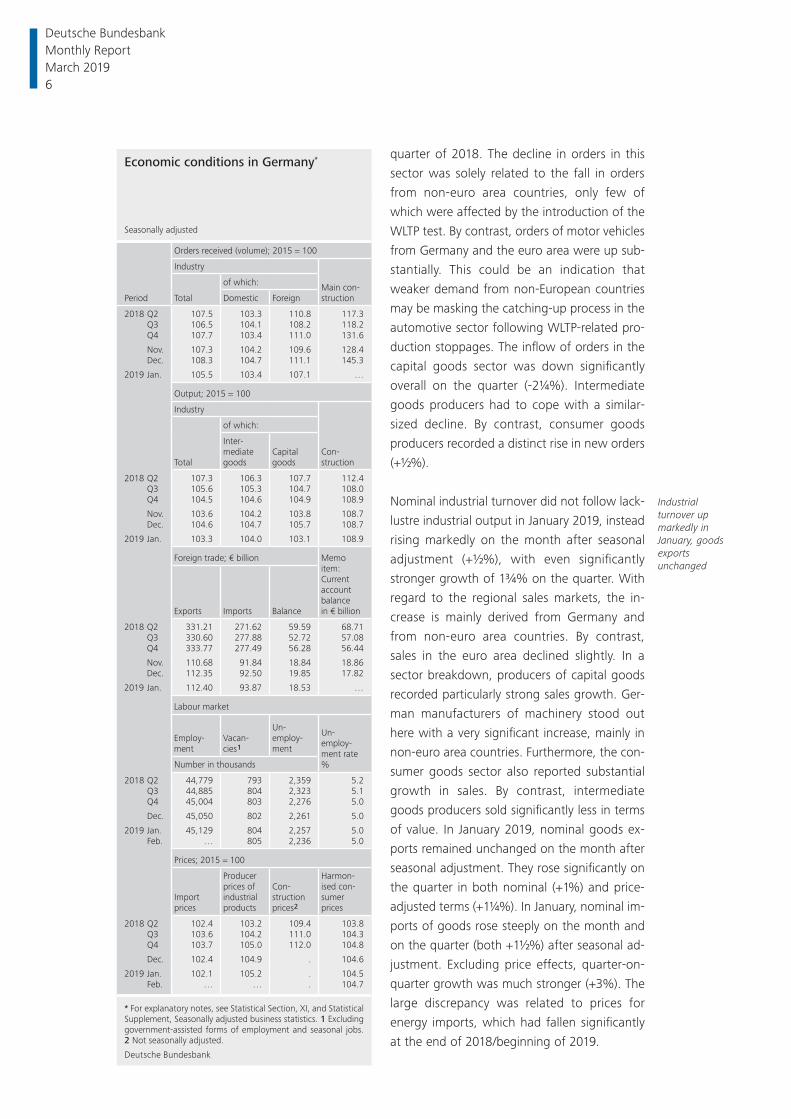
Economic conditions in Germany*
Seasonally adjusted
Period
Orders received (volume); 2015 = 100
Industry
Main con-structionTotal
of which:
Domestic Foreign
2018 Q2 107.5 103.3 110.8 117.3 Q3 106.5 104.1 108.2 118.2 Q4 107.7 103.4 111.0 131.6
Nov. 107.3 104.2 109.6 128.4 Dec. 108.3 104.7 111.1 145.3
2019 Jan. 105.5 103.4 107.1 …
Output; 2015 = 100
Industry
Con-structionTotal
of which:
Inter-mediategoods
Capitalgoods
2018 Q2 107.3 106.3 107.7 112.4 Q3 105.6 105.3 104.7 108.0 Q4 104.5 104.6 104.9 108.9
Nov. 103.6 104.2 103.8 108.7 Dec. 104.6 104.7 105.7 108.7
2019 Jan. 103.3 104.0 103.1 108.9
Foreign trade; € billion Memoitem:Currentaccountbalance in € billionExports Imports Balance
2018 Q2 331.21 271.62 59.59 68.71 Q3 330.60 277.88 52.72 57.08 Q4 333.77 277.49 56.28 56.44
Nov. 110.68 91.84 18.84 18.86 Dec. 112.35 92.50 19.85 17.82
2019 Jan. 112.40 93.87 18.53 …
Labour market
Employ-ment
Vacan-cies1
Un-employ-ment
Un-employ-ment rate%Number in thousands
2018 Q2 44,779 793 2,359 5.2 Q3 44,885 804 2,323 5.1 Q4 45,004 803 2,276 5.0
Dec. 45,050 802 2,261 5.0
2019 Jan. 45,129 804 2,257 5.0 Feb. … 805 2,236 5.0
Prices; 2015 = 100
Importprices
Producerprices ofindustrialproducts
Con-structionprices2
Harmon-ised con-sumerprices
2018 Q2 102.4 103.2 109.4 103.8 Q3 103.6 104.2 111.0 104.3 Q4 103.7 105.0 112.0 104.8
Dec. 102.4 104.9 . 104.6
2019 Jan. 102.1 105.2 . 104.5 Feb. … … . 104.7
* For explanatory notes, see Statistical Section, XI, and Statistical Supplement, Seasonally adjusted business statistics. 1 Excluding government-assisted forms of employment and seasonal jobs. 2 Not seasonally adjusted.
Deutsche Bundesbank
Deutsche Bundesbank Monthly Report March 2019 6
Construction industry
Construction output was up slightly in January
2019, rising by ¼% on the month in seasonally
adjusted terms. It moved sideways compared
with the average of the fourth quarter of 2018.
While activity in the main construction sector
contracted sharply by 3¾%, output in the fin-
ishing trades rose steeply (+3½%). In spite of
the recent decline in activity in the main con-
struction sector, capacity utilisation and the
reach of orders in the sector are still close to
their record highs according to surveys con-
ducted by the ifo Institute. Other economic in-
dicators also suggest that the construction
boom in Germany is continuing. After seasonal
adjustment there was an exceptionally strong
and relatively broad quarter- on- quarter increase
of 11¼% in new orders received by the main
construction sector in the fourth quarter of
2018 – data are available up to this date. This
increase was largely attributable to two major
orders in commercial civil engineering, which
are likely to lead to an expansion in construc-
tion activity only with some time lag. However,
the inflow of orders in housing construction,
which is not as dependent on large orders, was
also up significantly on the previous quarter.
Labour market
The labour market is so far withstanding the
slowdown in economic activity. Employment
showed steep growth at the beginning of the
year. After seasonal adjustment, the total num-
ber of persons in work in January rose by
79,000 on the month, which was significantly
more than in the last months of 2018. Com-
pared to the same month of the previous year,
the increase was 477,000 persons or 1.1%. This
growth was based essentially on the still sub-
stantial expansion in the number of employees
subject to social security contributions, which
rose by as much as 2.2% in 2018. By contrast,
the number of self- employed persons and per-
sons working exclusively in low- paid part- time
jobs continued to go down. All indicators of
labour demand are expansionary. Labour mar-
ket tightness, as can be derived from the ratio
of unemployed to job vacancies or the average
vacancy period, is also still very high.
Registered unemployment was down distinctly
in February, following only a small decline in
January. After seasonal adjustment, 2.24 mil-
lion unemployed persons were registered with
the Federal Employment Agency in February,
21,000 fewer than in January. However, due to
rounding, the unemployment rate remained at
its low level of 5.0%. The number of un-
employed persons was down by 173,000 on
the year. The weaker decline at the beginning
of the year is due to an effect relating to labour
market policy measures. Total underemploy-
ment including persons participating in labour
market policy measures decreased evenly in the
first two months of 2019. The unemployment
barometer of the Institute for Employment
Research (IAB) continued to fall and is now in
neutral territory, which suggests unemploy-
ment will remain largely unchanged in the next
few months.
Prices
In February, crude oil prices continued their re-
covery from the beginning of the year and rose
markedly, mainly due to supply cuts. They were
just over 8% higher than in January, but still
slightly down on the year. As this report went
to press, a barrel of Brent crude oil cost US$67.
The discount on crude oil futures was US$¾
for deliveries six months ahead and US$1½ for
deliveries 12 months ahead.
Import prices were down slightly in January.
This was not only attributable to a clear decline
in energy prices. The import of other goods
also cost slightly less. Nonetheless, industrial
producer prices in domestic sales increased
moderately both excluding and including en-
ergy. The year- on- year change declined to
slightly below 1% for imports and remained at
just above 2½% for producer prices.
Construction output up slightly in January
Steep employment growth at beginning of 2019
Further decline in under-employment
Marked increase in crude oil prices in February
Import prices lower but producer prices nonetheless higher
Deutsche Bundesbank Monthly Report
March 2019 7

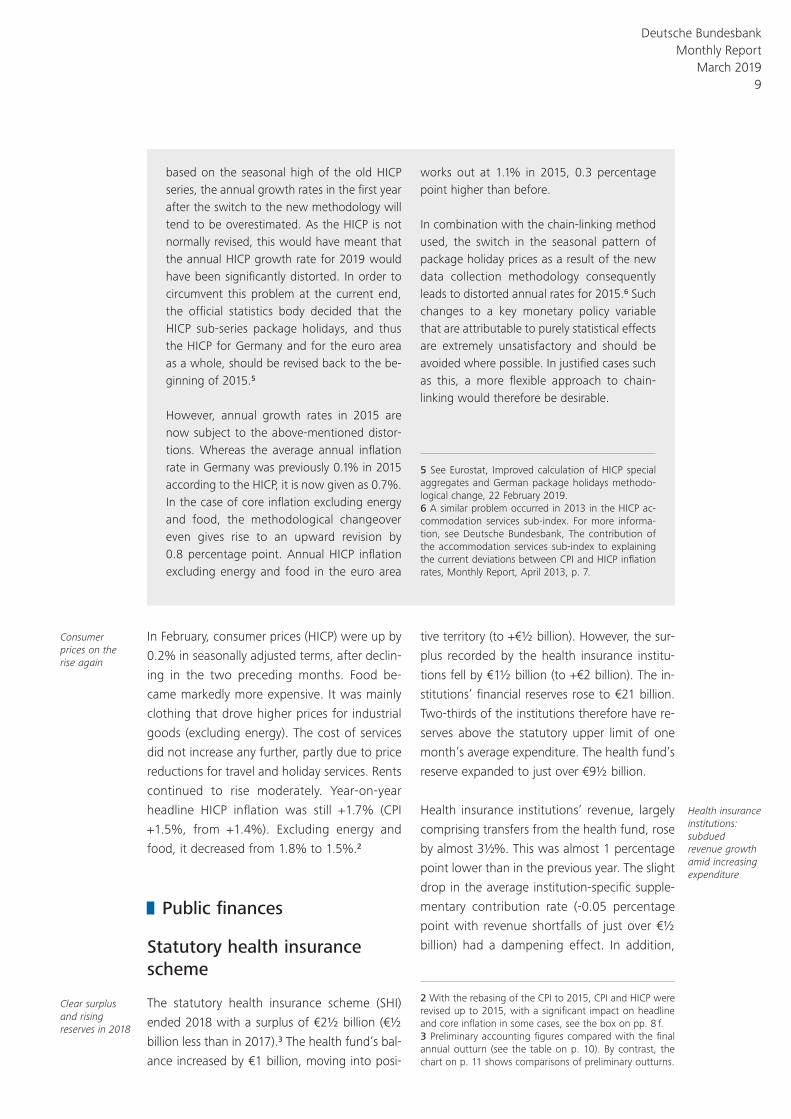
The revision of the sub- index for package holidays and its impact on the HICP and core infl ation
In February 2019, Germany’s Federal Statis-tical Offi ce published the results of the regular revision of the German consumer price index (CPI). With the shift to the new base year 2015, the weighting scheme was, as is cus-tomary, adjusted to refl ect changes in con-sumption habits. In addition, the Statistical Offi ce took the opportunity to undertake a number of methodological adjustments to the way in which pricing statistics are collected. In addition to rents, these amendments affected the prices of package holidays, in particular.1 Previously, this component of consumer prices was based on seasonal weights, i.e. different weights at different times of the year, also taking into account different summer and winter destinations. However, it proved a dis-advantage that it was impossible to interpret price developments particularly during the transition from summer to winter destinations and vice versa; on top of that, the separate
samples meant that it was not possible to compare the price level of summer and winter destinations.2 In order to address these prob-lems, additional year- round holiday destin-ations were included with the revision. This means that it is possible to switch to a pro-cedure where weights are fi xed throughout the year.3 A comparable approach is applied when determining CPI components relating to food, which contain seasonal products.
A comparison of the seasonal fl uctuations in the new series of prices for package holidays with the old series shows that the seasonal peaks are now more pronounced in the sum-mer. By contrast, the December fi gure, which generally marked the annual peak under the old methodology, is signifi cantly lower than the summer peaks under the new method-ology.
The altered seasonal pattern has considerable implications for the calculation of the Har-monised Index of Consumer Prices (HICP), which is, in principle, derived from the same dataset as the CPI. Unlike the CPI, where, for package holidays, the old and new series are chain- linked via the average of the base year, annual chain- linking is conducted using the December fi gure for the HICP.4 Since applying this rule means that the revised series is now
1 For further information on the revision of the con-sumer price index, see Federal Statistical Offi ce, Hinter-grundpapier zur Revision des Verbraucherpreisindex für Deutschland 2019, 21 February 2019, which can be downloaded, in German only, at https:// www.destatis.de/ DE/ PresseService/ Presse/ Pressekonferenzen/ 2019/ HGG_VPI/ HGG_VPI_Uebersicht.html2 See Deutsche Bundesbank, The volatility of the trad-itional core infl ation rate in Germany, Monthly Report, November 2017, pp. 49 ff.3 See, for example, D. Blang (2018), Geänderte Be-rechnungsmethodik für Pauschalreisen und die zukünf-tige Ausweitung durch automatisierte Abfragen, Pre-sentation, 22nd conference “Messung der Preise”, available online, in German only, at https:// www.statistik- berlin- brandenburg.de/ home/ pdf/ preise/ 2018/ 8_Blang_Pauschalreisen.pdf4 Methodological changes may also be introduced for index calculation with the reporting month December.
Revision of the HICP package holidays
and impact on core inflation
Sources: Federal Statistical Office, Eurostat, and Bundesbank calculations. 1 HICP excluding food and energy. Year-on-year percentage change, contribution of package holidays (shown darker) in percentage points.
Deutsche Bundesbank
2012 2013 2014 2015 2016 2017 2018
70
80
90
100
110
120130140
%
– 10
0
+ 10
+ 20
+ 30
+ 40
0
0.5
1.0
1.5
2.0
2.5
2015 = 100, log scale
Revised
Previously
Contribution of package holidays in Germany to core rate1
Lin scale
Year-on-year change
... in the euro area
... in Germany
Deutsche Bundesbank Monthly Report March 2019 8
In February, consumer prices (HICP) were up by
0.2% in seasonally adjusted terms, after declin-
ing in the two preceding months. Food be-
came markedly more expensive. It was mainly
clothing that drove higher prices for industrial
goods (excluding energy). The cost of services
did not increase any further, partly due to price
reductions for travel and holiday services. Rents
continued to rise moderately. Year- on- year
headline HICP inflation was still +1.7% (CPI
+1.5%, from +1.4%). Excluding energy and
food, it decreased from 1.8% to 1.5%.2
Public finances
Statutory health insurance scheme
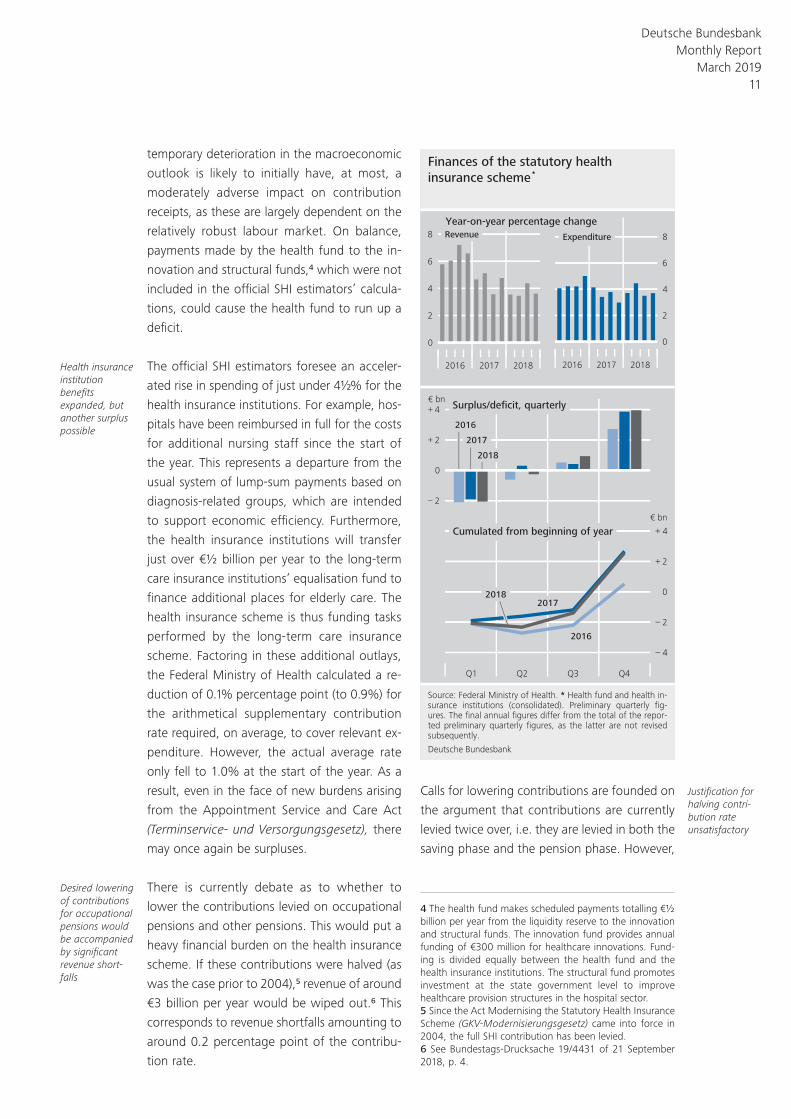
The statutory health insurance scheme (SHI)
ended 2018 with a surplus of €2½ billion (€½
billion less than in 2017).3 The health fund’s bal-
ance increased by €1 billion, moving into posi-
tive territory (to +€½ billion). However, the sur-
plus recorded by the health insurance institu-
tions fell by €1½ billion (to +€2 billion). The in-
stitutions’ financial reserves rose to €21 billion.
Two- thirds of the institutions therefore have re-
serves above the statutory upper limit of one
month’s average expenditure. The health fund’s
reserve expanded to just over €9½ billion.
Health insurance institutions’ revenue, largely
comprising transfers from the health fund, rose
by almost 3½%. This was almost 1 percentage
point lower than in the previous year. The slight
drop in the average institution- specific supple-
mentary contribution rate (-0.05 percentage
point with revenue shortfalls of just over €½
billion) had a dampening effect. In addition,
Consumer prices on the rise again
Clear surplus and rising reserves in 2018
Health insurance institutions: subdued revenue growth amid increasing expenditure
based on the seasonal high of the old HICP series, the annual growth rates in the fi rst year after the switch to the new methodology will tend to be overestimated. As the HICP is not normally revised, this would have meant that the annual HICP growth rate for 2019 would have been signifi cantly distorted. In order to circumvent this problem at the current end, the offi cial statistics body decided that the HICP sub- series package holidays, and thus the HICP for Germany and for the euro area as a whole, should be revised back to the be-ginning of 2015.5
However, annual growth rates in 2015 are now subject to the above- mentioned distor-tions. Whereas the average annual infl ation rate in Germany was previously 0.1% in 2015 according to the HICP, it is now given as 0.7%. In the case of core infl ation excluding energy and food, the methodological changeover even gives rise to an upward revision by 0.8 percentage point. Annual HICP infl ation excluding energy and food in the euro area
works out at 1.1% in 2015, 0.3 percentage point higher than before.
In combination with the chain- linking method used, the switch in the seasonal pattern of package holiday prices as a result of the new data collection methodology consequently leads to distorted annual rates for 2015.6 Such changes to a key monetary policy variable that are attributable to purely statistical effects are extremely unsatisfactory and should be avoided where possible. In justifi ed cases such as this, a more fl exible approach to chain- linking would therefore be desirable.
5 See Eurostat, Improved calculation of HICP special aggregates and German package holidays methodo-logical change, 22 February 2019.6 A similar problem occurred in 2013 in the HICP ac-commodation services sub- index. For more informa-tion, see Deutsche Bundesbank, The contribution of the accommodation services sub- index to explaining the current deviations between CPI and HICP infl ation rates, Monthly Report, April 2013, p. 7.
2 With the rebasing of the CPI to 2015, CPI and HICP were revised up to 2015, with a significant impact on headline and core inflation in some cases, see the box on pp. 8 f.3 Preliminary accounting figures compared with the final annual outturn (see the table on p. 10). By contrast, the chart on p. 11 shows comparisons of preliminary outturns.
Deutsche Bundesbank Monthly Report
March 2019 9
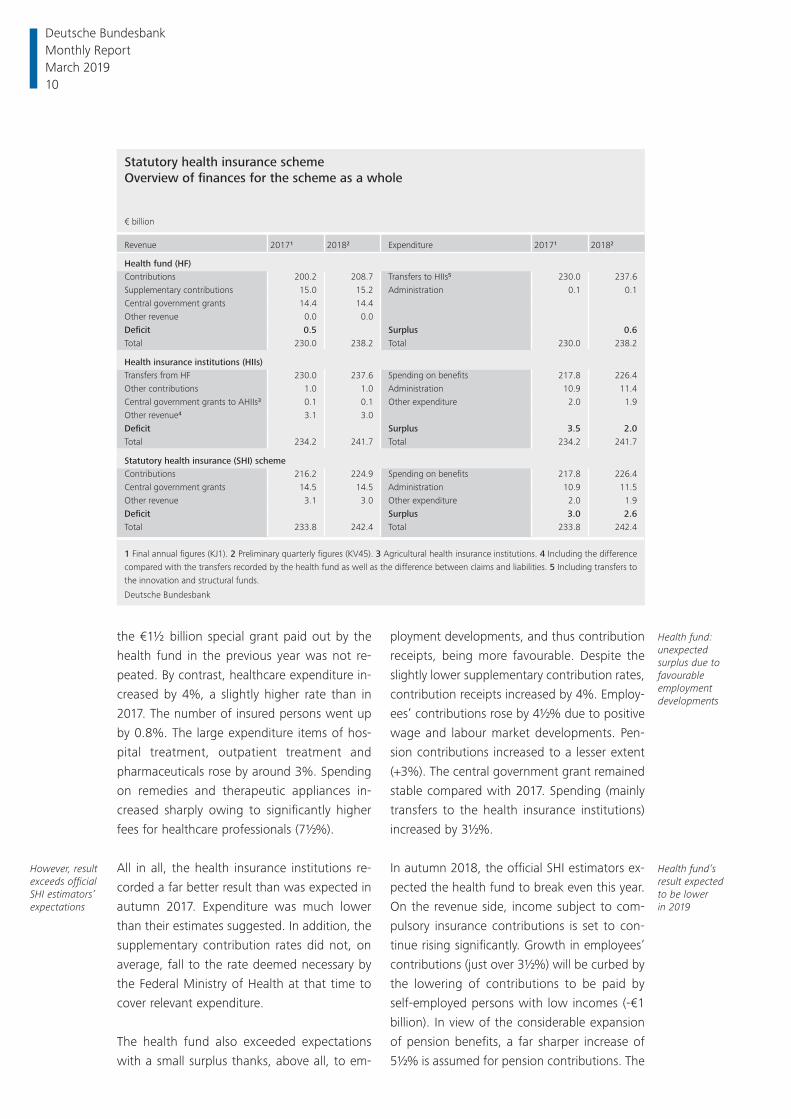
the €1½ billion special grant paid out by the
health fund in the previous year was not re-
peated. By contrast, healthcare expenditure in-
creased by 4%, a slightly higher rate than in
2017. The number of insured persons went up
by 0.8%. The large expenditure items of hos-
pital treatment, outpatient treatment and
pharmaceuticals rose by around 3%. Spending
on remedies and therapeutic appliances in-
creased sharply owing to significantly higher
fees for healthcare professionals (7½%).
All in all, the health insurance institutions re-
corded a far better result than was expected in
autumn 2017. Expenditure was much lower
than their estimates suggested. In addition, the
supplementary contribution rates did not, on
average, fall to the rate deemed necessary by
the Federal Ministry of Health at that time to
cover relevant expenditure.
The health fund also exceeded expectations
with a small surplus thanks, above all, to em-
ployment developments, and thus contribution
receipts, being more favourable. Despite the
slightly lower supplementary contribution rates,
contribution receipts increased by 4%. Employ-
ees’ contributions rose by 4½% due to positive
wage and labour market developments. Pen-
sion contributions increased to a lesser extent
(+3%). The central government grant remained
stable compared with 2017. Spending (mainly
transfers to the health insurance institutions)
increased by 3½%.
In autumn 2018, the official SHI estimators ex-
pected the health fund to break even this year.
On the revenue side, income subject to com-
pulsory insurance contributions is set to con-
tinue rising significantly. Growth in employees’
contributions (just over 3½%) will be curbed by
the lowering of contributions to be paid by
self- employed persons with low incomes (-€1
billion). In view of the considerable expansion
of pension benefits, a far sharper increase of
5½% is assumed for pension contributions. The
However, result exceeds official SHI estimators’ expectations
Health fund: unexpected surplus due to favourable employment developments
Health fund’s result expected to be lower in 2019
Statutory health insurance schemeOverview of fi nances for the scheme as a whole
€ billion
Revenue 20171 20182 Expenditure 20171 20182
Health fund (HF)Contributions 200.2 208.7 Transfers to HIIs5 230.0 237.6Supplementary contributions 15.0 15.2 Administration 0.1 0.1Central government grants 14.4 14.4Other revenue 0.0 0.0Defi cit 0.5 Surplus 0.6Total 230.0 238.2 Total 230.0 238.2
Health insurance institutions (HIIs)Transfers from HF 230.0 237.6 Spending on benefi ts 217.8 226.4Other contributions 1.0 1.0 Administration 10.9 11.4Central government grants to AHIIs3 0.1 0.1 Other expenditure 2.0 1.9Other revenue4 3.1 3.0Defi cit Surplus 3.5 2.0Total 234.2 241.7 Total 234.2 241.7
Statutory health insurance (SHI) schemeContributions 216.2 224.9 Spending on benefi ts 217.8 226.4Central government grants 14.5 14.5 Administration 10.9 11.5Other revenue 3.1 3.0 Other expenditure 2.0 1.9Defi cit Surplus 3.0 2.6Total 233.8 242.4 Total 233.8 242.4
1 Final annual fi gures (KJ1). 2 Preliminary quarterly fi gures (KV45). 3 Agricultural health insurance institutions. 4 Including the difference compared with the transfers recorded by the health fund as well as the difference between claims and liabilities. 5 Including transfers to the innovation and structural funds.
Deutsche Bundesbank
Deutsche Bundesbank Monthly Report March 2019 10
temporary deterioration in the macroeconomic
outlook is likely to initially have, at most, a
moderately adverse impact on contribution
receipts , as these are largely dependent on the
relatively robust labour market. On balance,
payments made by the health fund to the in-
novation and structural funds,4 which were not
included in the official SHI estimators’ calcula-
tions, could cause the health fund to run up a
deficit.
The official SHI estimators foresee an acceler-
ated rise in spending of just under 4½% for the
health insurance institutions. For example, hos-
pitals have been reimbursed in full for the costs
for additional nursing staff since the start of
the year. This represents a departure from the
usual system of lump- sum payments based on
diagnosis-related groups, which are intended
to support economic efficiency. Furthermore,
the health insurance institutions will transfer
just over €½ billion per year to the long- term
care insurance institutions’ equalisation fund to
finance additional places for elderly care. The
health insurance scheme is thus funding tasks
performed by the long- term care insurance
scheme. Factoring in these additional outlays,
the Federal Ministry of Health calculated a re-
duction of 0.1% percentage point (to 0.9%) for
the arithmetical supplementary contribution
rate required, on average, to cover relevant ex-
penditure. However, the actual average rate
only fell to 1.0% at the start of the year. As a
result, even in the face of new burdens arising
from the Appointment Service and Care Act
(Terminservice- und Versorgungsgesetz), there
may once again be surpluses.
There is currently debate as to whether to
lower the contributions levied on occupational
pensions and other pensions. This would put a
heavy financial burden on the health insurance
scheme. If these contributions were halved (as
was the case prior to 2004),5 revenue of around
€3 billion per year would be wiped out.6 This
corresponds to revenue shortfalls amounting to
around 0.2 percentage point of the contribu-
tion rate.
Calls for lowering contributions are founded on
the argument that contributions are currently
levied twice over, i.e. they are levied in both the
saving phase and the pension phase. However,
Health insurance institution benefits expanded, but another surplus possible
Desired lowering of contributions for occupational pensions would be accompanied by significant revenue short-falls
Justification for halving contri-bution rate unsatisfactory
Finances of the statutory health
insurance scheme *
Source: Federal Ministry of Health. * Health fund and health in-surance institutions (consolidated). Preliminary quarterly fig-ures. The final annual figures differ from the total of the repor-ted preliminary quarterly figures, as the latter are not revised subsequently.
Deutsche Bundesbank
Q1 Q2 Q3 Q4
2
0
2
4
–
+
+
– 4
– 2
0
+ 2
+ 4
Surplus/deficit, quarterly
Cumulated from beginning of year
2017
2018
2016
2017
2016
2018
2016 2017 2018
0
2
4
6
8
2016 2017 2018
0
2
4
6
8 Revenue Expenditure
€ bn
Year-on-year percentage change
€ bn
4 The health fund makes scheduled payments totalling €½ billion per year from the liquidity reserve to the innovation and structural funds. The innovation fund provides annual funding of €300 million for healthcare innovations. Fund-ing is divided equally between the health fund and the health insurance institutions. The structural fund promotes investment at the state government level to improve healthcare provision structures in the hospital sector.5 Since the Act Modernising the Statutory Health Insurance Scheme (GKV- Modernisierungsgesetz) came into force in 2004, the full SHI contribution has been levied.6 See Bundestags- Drucksache 19/ 4431 of 21 September 2018, p. 4.
Deutsche Bundesbank Monthly Report
March 2019 11
this occurs in only a few exceptional cases.7 As
a general rule, transfers to institutions for occu-
pational retirement provision (IORPs) and pen-
sion provision top- ups are not subject to SHI
contributions.8 In this respect, it appears logical
to subject occupational pensions and other
pensions, such as deferred compensation, to
contributions and to not lower contributions.
The currently strong financial situation, charac-
terised by surpluses and high reserves, is mask-
ing foreseeable demographic pressure. It may
appear possible to fund benefit increases or
concessions in the short run. However, they
would make the need for unpopular benefit
cuts or raised contribution rates – which will
weigh on macroeconomic development – even
greater in future. It is important to not lose
sight of this in the current debate.
Public long- term care insurance scheme
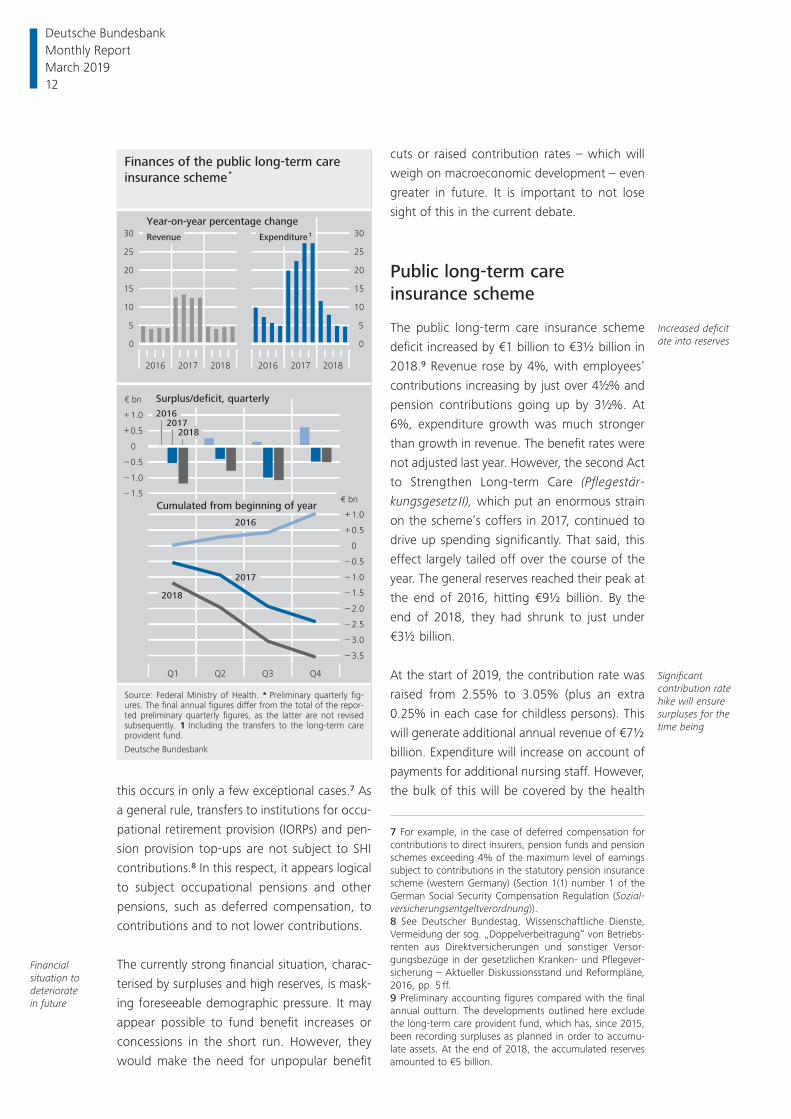
The public long- term care insurance scheme
deficit increased by €1 billion to €3½ billion in
2018.9 Revenue rose by 4%, with employees’
contributions increasing by just over 4½% and
pension contributions going up by 3½%. At
6%, expenditure growth was much stronger
than growth in revenue. The benefit rates were
not adjusted last year. However, the second Act
to Strengthen Long- term Care (Pflegestär-
kungsgesetz II), which put an enormous strain
on the scheme’s coffers in 2017, continued to
drive up spending significantly. That said, this
effect largely tailed off over the course of the
year. The general reserves reached their peak at
the end of 2016, hitting €9½ billion. By the
end of 2018, they had shrunk to just under
€3½ billion.
At the start of 2019, the contribution rate was
raised from 2.55% to 3.05% (plus an extra
0.25% in each case for childless persons). This
will generate additional annual revenue of €7½
billion. Expenditure will increase on account of
payments for additional nursing staff. However,
the bulk of this will be covered by the health
Financial situation to deteriorate in future
Increased deficit ate into reserves
Significant contribution rate hike will ensure surpluses for the time being
Finances of the public long-term care
insurance scheme *
Source: Federal Ministry of Health. * Preliminary quarterly fig-ures. The final annual figures differ from the total of the repor-ted preliminary quarterly figures, as the latter are not revised subsequently. 1 Including the transfers to the long-term care provident fund.
Deutsche Bundesbank
Q1 Q2 Q3 Q4
1.5
1.0
0.5
0
0.5
1.0
–
–
–
+
+
– 3.5
– 3.0
– 2.5
– 2.0
– 1.5
– 1.0
– 0.5
0
+ 0.5
+ 1.0
Surplus/deficit, quarterly
Cumulated from beginning of year
20172018
2016
2016
2018
2017
2016 2017 2018
0
5
10
15
20
25
30
2016 2017 2018
0
5
10
15
20
25
30 Revenue Expenditure 1
€ bn
€ bn
Year-on-year percentage change
7 For example, in the case of deferred compensation for contributions to direct insurers, pension funds and pension schemes exceeding 4% of the maximum level of earnings subject to contributions in the statutory pension insurance scheme (western Germany) (Section 1(1) number 1 of the German Social Security Compensation Regulation (Sozial-versicherungsentgeltverordnung)).8 See Deutscher Bundestag, Wissenschaftliche Dienste, Vermeidung der sog. „Doppelverbeitragung“ von Betriebs-renten aus Direktversicherungen und sonstiger Versor-gungsbezüge in der gesetzlichen Kranken- und Pflegever-sicherung – Aktueller Diskussionsstand und Reformpläne, 2016, pp. 5 ff.9 Preliminary accounting figures compared with the final annual outturn. The developments outlined here exclude the long- term care provident fund, which has, since 2015, been recording surpluses as planned in order to accumu-late assets. At the end of 2018, the accumulated reserves amounted to €5 billion.
Deutsche Bundesbank Monthly Report March 2019 12
insurance institutions in the form of transfers to
the long- term care insurance institutions’
equalisation fund. Overall, a significant surplus
is expected for 2019. In view of the major con-
tribution rate hike, surpluses are envisaged in
the medium term, too. However, the greater
the number of benefit expansions that are
adopted, the faster the pressure stemming
from demographic change to raise contribution
rates will mount.
Securities markets
Bond market
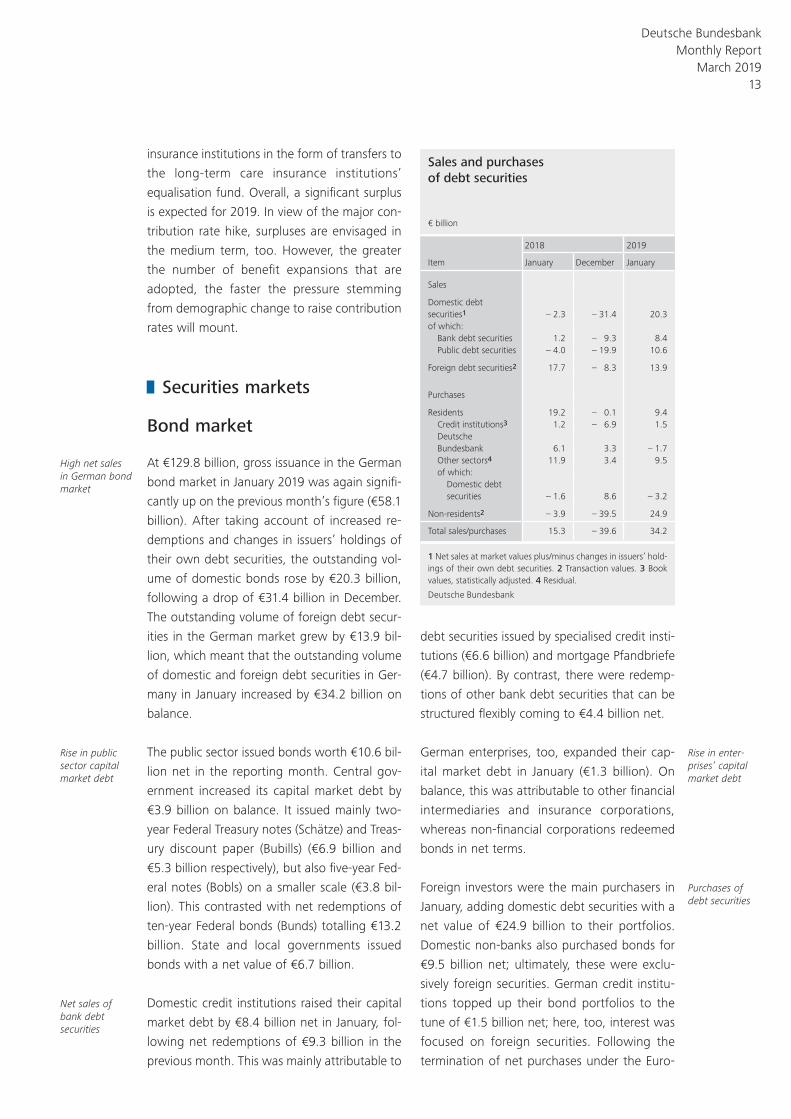
At €129.8 billion, gross issuance in the German
bond market in January 2019 was again signifi-
cantly up on the previous month’s figure (€58.1
billion). After taking account of increased re-
demptions and changes in issuers’ holdings of
their own debt securities, the outstanding vol-
ume of domestic bonds rose by €20.3 billion,
following a drop of €31.4 billion in December.
The outstanding volume of foreign debt secur-
ities in the German market grew by €13.9 bil-
lion, which meant that the outstanding volume
of domestic and foreign debt securities in Ger-
many in January increased by €34.2 billion on
balance.
The public sector issued bonds worth €10.6 bil-
lion net in the reporting month. Central gov-
ernment increased its capital market debt by
€3.9 billion on balance. It issued mainly two-
year Federal Treasury notes (Schätze) and Treas-
ury discount paper (Bubills) (€6.9 billion and
€5.3 billion respectively), but also five- year Fed-
eral notes (Bobls) on a smaller scale (€3.8 bil-
lion). This contrasted with net redemptions of
ten- year Federal bonds (Bunds) totalling €13.2
billion. State and local governments issued
bonds with a net value of €6.7 billion.
Domestic credit institutions raised their capital
market debt by €8.4 billion net in January, fol-
lowing net redemptions of €9.3 billion in the
previous month. This was mainly attributable to
debt securities issued by specialised credit insti-
tutions (€6.6 billion) and mortgage Pfandbriefe
(€4.7 billion). By contrast, there were redemp-
tions of other bank debt securities that can be
structured flexibly coming to €4.4 billion net.
German enterprises, too, expanded their cap-
ital market debt in January (€1.3 billion). On
balance, this was attributable to other financial
intermediaries and insurance corporations,
whereas non- financial corporations redeemed
bonds in net terms.
Foreign investors were the main purchasers in
January, adding domestic debt securities with a
net value of €24.9 billion to their portfolios.
Domestic non- banks also purchased bonds for
€9.5 billion net; ultimately, these were exclu-
sively foreign securities. German credit institu-
tions topped up their bond portfolios to the
tune of €1.5 billion net; here, too, interest was
focused on foreign securities. Following the
termination of net purchases under the Euro-
High net sales in German bond market
Rise in public sector capital market debt
Net sales of bank debt securities
Rise in enter-prises’ capital market debt
Purchases of debt securities
Sales and purchases of debt securities
€ billion
Item
2018 2019
January December January
Sales
Domestic debtsecurities1 – 2.3 – 31.4 20.3of which:
Bank debt securities 1.2 – 9.3 8.4Public debt securities – 4.0 – 19.9 10.6
Foreign debt securities2 17.7 – 8.3 13.9
Purchases
Residents 19.2 – 0.1 9.4Credit institutions3 1.2 – 6.9 1.5Deutsche Bundesbank 6.1 3.3 – 1.7Other sectors4 11.9 3.4 9.5of which:
Domestic debtsecurities – 1.6 8.6 – 3.2
Non-residents2 – 3.9 – 39.5 24.9
Total sales/purchases 15.3 – 39.6 34.2
1 Net sales at market values plus/minus changes in issuers’ hold-ings of their own debt securities. 2 Transaction values. 3 Book values, statistically adjusted. 4 Re sidual.
Deutsche Bundesbank
Deutsche Bundesbank Monthly Report
March 2019 13
system’s asset purchase programmes at the
end of 2018, the Bundesbank’s securities port-
folio was reduced by €1.7 billion net in January
for operational reasons.
Equity market
In the reporting month, domestic enterprises
raised fresh funds of €0.7 billion on balance
from placing new shares in the German equity
market. Net issuance of foreign equities in Ger-
many totalled €3.7 billion in the same period.
Domestic non- banks were the main buyers, ac-
quiring equities worth €6.1 billion on balance.
By contrast, non- resident investors and domes-
tic credit institutions sold equities for €1.6 bil-
lion and €0.1 billion net respectively.
Mutual funds
Domestic mutual funds recorded inflows of
€7.7 billion in January. Specialised funds re-
served for institutional investors were the main
beneficiaries (€6.2 billion). Of the various asset
classes, funds were chiefly invested in mixed
securities- based funds (€5.1 billion) and open-
end real estate funds (€2.4 billion). Foreign mu-
tual funds placed shares worth €3.7 billion in
the German market in January. On balance, do-
mestic non- banks were the sole purchasers of
mutual fund shares in the reporting month
(€13.8 billion). By contrast, there were net sales
of fund shares by domestic credit institutions
and non- resident investors in the amount of
€1.3 billion and €1.1 billion respectively.
Balance of payments
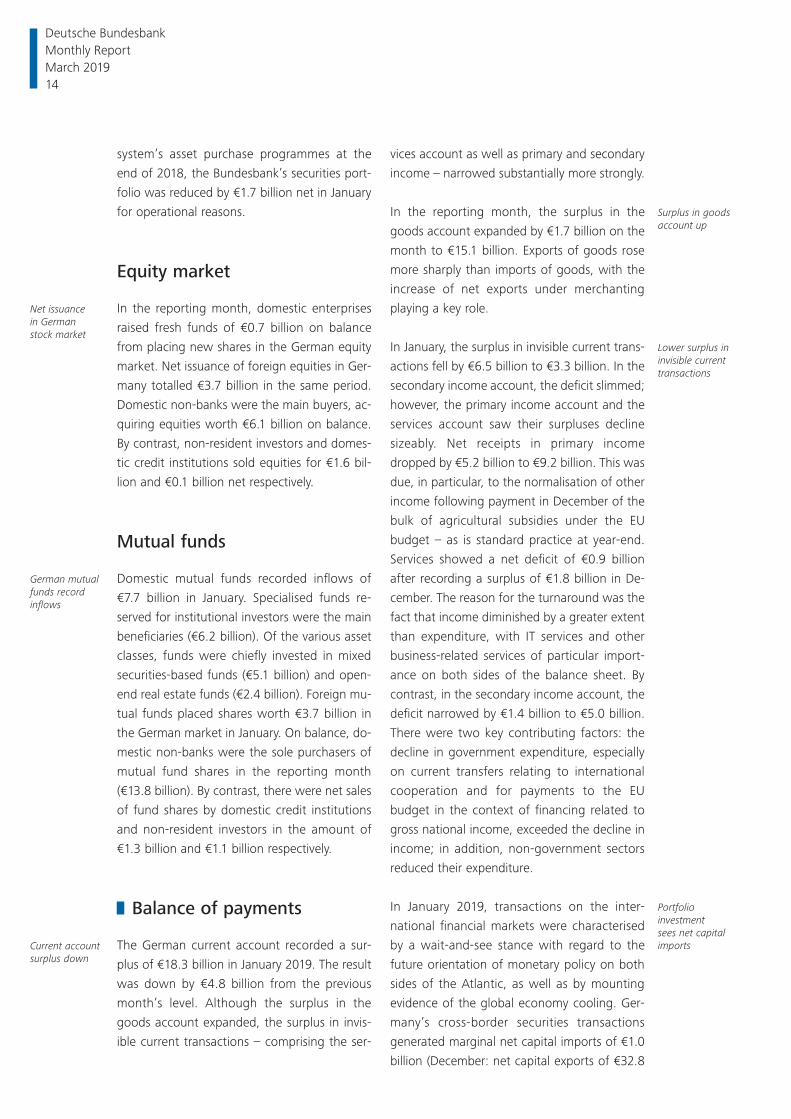
The German current account recorded a sur-
plus of €18.3 billion in January 2019. The result
was down by €4.8 billion from the previous
month’s level. Although the surplus in the
goods account expanded, the surplus in invis-
ible current transactions – comprising the ser-
vices account as well as primary and secondary
income – narrowed substantially more strongly.
In the reporting month, the surplus in the
goods account expanded by €1.7 billion on the
month to €15.1 billion. Exports of goods rose
more sharply than imports of goods, with the
increase of net exports under merchanting
playing a key role.
In January, the surplus in invisible current trans-
actions fell by €6.5 billion to €3.3 billion. In the
secondary income account, the deficit slimmed;
however, the primary income account and the
services account saw their surpluses decline
sizeably. Net receipts in primary income
dropped by €5.2 billion to €9.2 billion. This was
due, in particular, to the normalisation of other
income following payment in December of the
bulk of agricultural subsidies under the EU
budget – as is standard practice at year- end.
Services showed a net deficit of €0.9 billion
after recording a surplus of €1.8 billion in De-
cember. The reason for the turnaround was the
fact that income diminished by a greater extent
than expenditure, with IT services and other
business- related services of particular import-
ance on both sides of the balance sheet. By
contrast, in the secondary income account, the
deficit narrowed by €1.4 billion to €5.0 billion.
There were two key contributing factors: the
decline in government expenditure, especially
on current transfers relating to international
cooperation and for payments to the EU
budget in the context of financing related to
gross national income, exceeded the decline in
income; in addition, non- government sectors
reduced their expenditure.
In January 2019, transactions on the inter-
national financial markets were characterised
by a wait- and- see stance with regard to the
future orientation of monetary policy on both
sides of the Atlantic, as well as by mounting
evidence of the global economy cooling. Ger-
many’s cross- border securities transactions
generated marginal net capital imports of €1.0
billion (December: net capital exports of €32.8
Net issuance in German stock market
German mutual funds record inflows
Current account surplus down
Surplus in goods account up
Lower surplus in invisible current transactions
Portfolio investment sees net capital imports
Deutsche Bundesbank Monthly Report March 2019 14
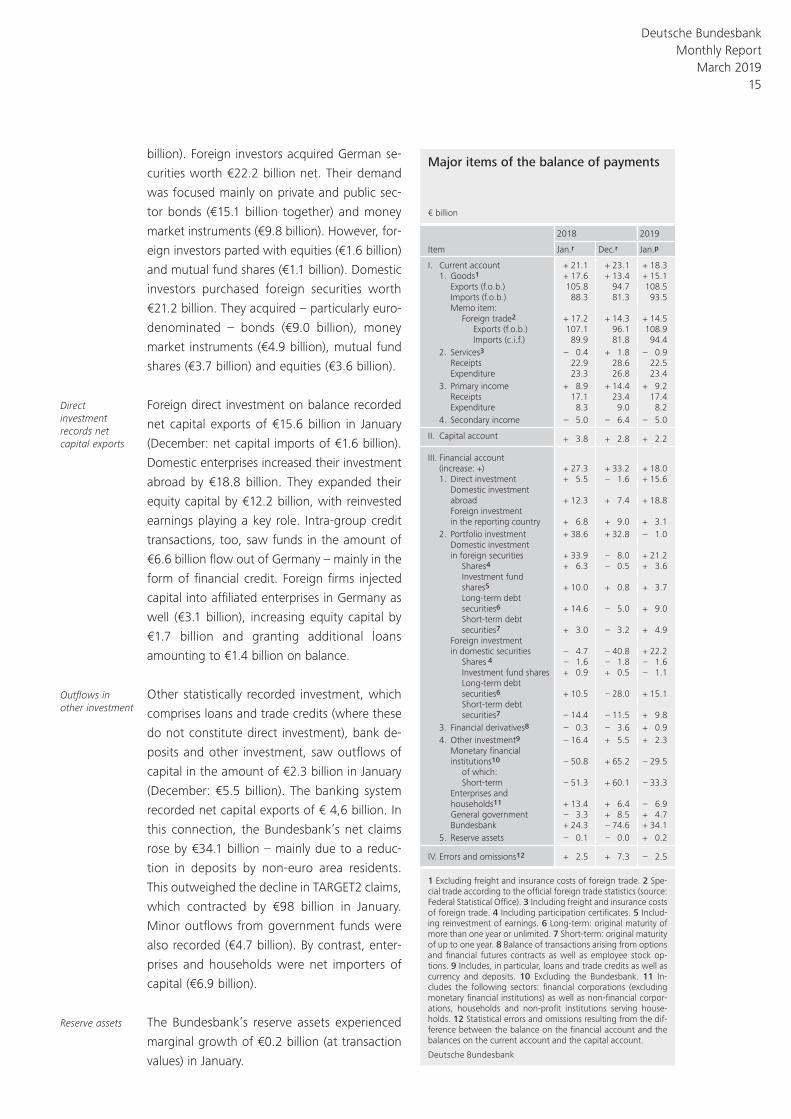
billion). Foreign investors acquired German se-
curities worth €22.2 billion net. Their demand
was focused mainly on private and public sec-
tor bonds (€15.1 billion together) and money
market instruments (€9.8 billion). However, for-
eign investors parted with equities (€1.6 billion)
and mutual fund shares (€1.1 billion). Domestic
investors purchased foreign securities worth
€21.2 billion. They acquired – particularly euro-
denominated – bonds (€9.0 billion), money
market instruments (€4.9 billion), mutual fund
shares (€3.7 billion) and equities (€3.6 billion).
Foreign direct investment on balance recorded
net capital exports of €15.6 billion in January
(December: net capital imports of €1.6 billion).
Domestic enterprises increased their investment
abroad by €18.8 billion. They expanded their
equity capital by €12.2 billion, with reinvested
earnings playing a key role. Intra- group credit
transactions, too, saw funds in the amount of
€6.6 billion flow out of Germany – mainly in the
form of financial credit. Foreign firms injected
capital into affiliated enterprises in Germany as
well (€3.1 billion), increasing equity capital by
€1.7 billion and granting additional loans
amounting to €1.4 billion on balance.
Other statistically recorded investment, which
comprises loans and trade credits (where these
do not constitute direct investment), bank de-
posits and other investment, saw outflows of
capital in the amount of €2.3 billion in January
(December: €5.5 billion). The banking system
recorded net capital exports of € 4,6 billion. In
this connection, the Bundesbank’s net claims
rose by €34.1 billion – mainly due to a reduc-
tion in deposits by non- euro area residents.
This outweighed the decline in TARGET2 claims,
which contracted by €98 billion in January.
Minor outflows from government funds were
also recorded (€4.7 billion). By contrast, enter-
prises and households were net importers of
capital (€6.9 billion).
The Bundesbank’s reserve assets experienced
marginal growth of €0.2 billion (at transaction
values) in January.
Direct investment records net capital exports
Outflows in other investment
Reserve assets
Major items of the balance of payments
€ billion
Item
2018 2019
Jan.r Dec.r Jan.p
I. Current account + 21.1 + 23.1 + 18.31. Goods1 + 17.6 + 13.4 + 15.1
Exports (f.o.b.) 105.8 94.7 108.5Imports (f.o.b.) 88.3 81.3 93.5Memo item:
Foreign trade2 + 17.2 + 14.3 + 14.5Exports (f.o.b.) 107.1 96.1 108.9Imports (c.i.f.) 89.9 81.8 94.4
2. Services3 – 0.4 + 1.8 – 0.9Receipts 22.9 28.6 22.5Expenditure 23.3 26.8 23.4
3. Primary income + 8.9 + 14.4 + 9.2Receipts 17.1 23.4 17.4Expenditure 8.3 9.0 8.2
4. Secondary income – 5.0 – 6.4 – 5.0
II. Capital account + 3.8 + 2.8 + 2.2
III. Financial account (increase: +) + 27.3 + 33.2 + 18.01. Direct investment + 5.5 – 1.6 + 15.6
Domestic investment abroad + 12.3 + 7.4 + 18.8Foreign investment in the reporting country + 6.8 + 9.0 + 3.1
2. Portfolio investment + 38.6 + 32.8 – 1.0Domestic investment in foreign securities + 33.9 – 8.0 + 21.2
Shares4 + 6.3 – 0.5 + 3.6Investment fund shares5 + 10.0 + 0.8 + 3.7Long-term debt securities6 + 14.6 – 5.0 + 9.0Short-term debt securities7 + 3.0 – 3.2 + 4.9
Foreign investment in domestic securities – 4.7 – 40.8 + 22.2
Shares 4 – 1.6 – 1.8 – 1.6Investment fund shares + 0.9 + 0.5 – 1.1Long-term debt securities6 + 10.5 – 28.0 + 15.1Short-term debt securities7 – 14.4 – 11.5 + 9.8
3. Financial derivatives8 – 0.3 – 3.6 + 0.94. Other investment9 – 16.4 + 5.5 + 2.3
Monetary fi nancial institutions10 – 50.8 + 65.2 – 29.5
of which:Short-term – 51.3 + 60.1 – 33.3
Enterprises and households11 + 13.4 + 6.4 – 6.9General government – 3.3 + 8.5 + 4.7Bundesbank + 24.3 – 74.6 + 34.1
5. Reserve assets – 0.1 – 0.0 + 0.2
IV. Errors and omissions12 + 2.5 + 7.3 – 2.5
1 Excluding freight and insurance costs of foreign trade. 2 Spe-cial trade according to the offi cial foreign trade statistics (source: Federal Statistical Offi ce). 3 Including freight and insurance costs of foreign trade. 4 Including participation certifi cates. 5 Includ-ing reinvestment of earnings. 6 Long- term: original maturity of more than one year or unlimited. 7 Short- term: original maturity of up to one year. 8 Balance of transactions arising from options and fi nancial futures contracts as well as employee stock op-tions. 9 Includes, in particular, loans and trade credits as well as currency and deposits. 10 Excluding the Bundesbank. 11 In-cludes the following sectors: fi nancial corporations (excluding monetary fi nancial institutions) as well as non- fi nancial corpor-ations, households and non- profi t institutions serving house-holds. 12 Statistical errors and omissions resulting from the dif-ference between the balance on the fi nancial account and the balances on the current account and the capital account.
Deutsche Bundesbank
Deutsche Bundesbank Monthly Report
March 2019 15

Deutsche Bundesbank Monthly Report March 2019 16
German balance of payments in 2018
In 2018, the German economy’s current account surplus decreased by ¾ percentage point to
7¼% of nominal gross domestic product (GDP). This was due to a sharp decline in the goods
trade surplus, whereas developments in the other sub- accounts tended to push up the surplus.
For instance, the slowdown in global trade growth hampered Germany’s export performance,
while goods imports rose sharply on the back of favourable domestic economic conditions. Fur-
thermore, the steep rise in the price of internationally traded commodities diminished the goods
trade surplus, as in the previous year. In terms of domestic saving and investment decisions, an
increase in private investment against the backdrop of the fairly high aggregate capacity utilisa-
tion in 2018 was one of the main factors dampening Germany’s current account surplus. Mean-
while, national saving as a percentage of GDP continued to increase during the reporting year.
As in previous years, some of these savings flowed abroad as net capital exports. At €225½ bil-
lion, however, this figure was significantly lower than in 2017. The gradual reduction of the
monthly purchase volumes under the Eurosystem’s expanded asset purchase programme (APP)
also led to changes in portfolio investment. For example, foreign investors sold fewer German
debt securities than in the years before; portfolio shifts by German investors in favour of foreign
securities were also less pronounced. The Bundesbank’s TARGET2 claims, which have been
strongly influenced by the APP since 2015, increased only moderately in 2018. Commercial banks’
external liabilities declined over the past year, having risen in 2016 and 2017 – in some instances
as a counterpart to the Bundesbank’s rising TARGET2 claims. In contrast to the global decline in
direct investment flows, German enterprises continued to significantly expand their direct invest-
ment operations last year. On the other hand, Germany was also a sought- after destination for
foreign direct investment (FDI). Euro area countries were the main partners for FDI in both direc-
tions.
Deutsche Bundesbank Monthly Report
March 2019 17
Current account
Underlying trends in the current account
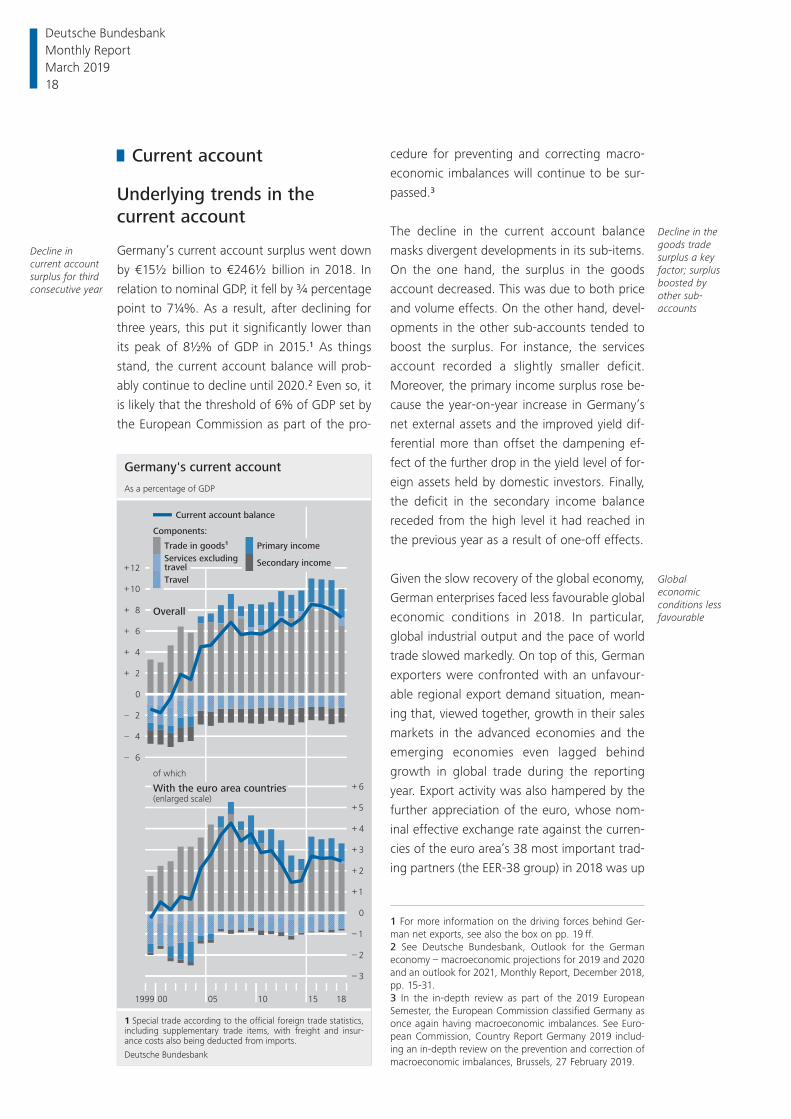
Germany’s current account surplus went down
by €15½ billion to €246½ billion in 2018. In
relation to nominal GDP, it fell by ¾ percentage
point to 7¼%. As a result, after declining for
three years, this put it significantly lower than
its peak of 8½% of GDP in 2015.1 As things
stand, the current account balance will prob-
ably continue to decline until 2020.2 Even so, it
is likely that the threshold of 6% of GDP set by
the European Commission as part of the pro-
cedure for preventing and correcting macro-
economic imbalances will continue to be sur-
passed.3
The decline in the current account balance
masks divergent developments in its sub- items.
On the one hand, the surplus in the goods
account decreased. This was due to both price
and volume effects. On the other hand, devel-
opments in the other sub- accounts tended to
boost the surplus. For instance, the services
account recorded a slightly smaller deficit.
Moreover, the primary income surplus rose be-
cause the year- on- year increase in Germany’s
net external assets and the improved yield dif-
ferential more than offset the dampening ef-
fect of the further drop in the yield level of for-
eign assets held by domestic investors. Finally,
the deficit in the secondary income balance
receded from the high level it had reached in
the previous year as a result of one- off effects.
Given the slow recovery of the global economy,
German enterprises faced less favourable global
economic conditions in 2018. In particular,
global industrial output and the pace of world
trade slowed markedly. On top of this, German
exporters were confronted with an unfavour-
able regional export demand situation, mean-
ing that, viewed together, growth in their sales
markets in the advanced economies and the
emerging economies even lagged behind
growth in global trade during the reporting
year. Export activity was also hampered by the
further appreciation of the euro, whose nom-
inal effective exchange rate against the curren-
cies of the euro area’s 38 most important trad-
ing partners (the EER-38 group) in 2018 was up
Decline in current account surplus for third consecutive year
Decline in the goods trade surplus a key factor; surplus boosted by other sub- accounts
Global economic conditions less favourable
Germany's current account
1 Special trade according to the official foreign trade statistics, including supplementary trade items, with freight and insur-ance costs also being deducted from imports.
Deutsche Bundesbank
1999 00 05 10 15 18
6
4
2
0
2
4
6
8
10
12
–
–
–
+
+
+
+
+
+
As a percentage of GDP
Secondary income
Components:
Trade in goods1
Services excludingtravel
Primary income
– 3
– 2
– 1
0
+ 1
+ 2
+ 3
+ 4
+ 5
+ 6
Travel
of which
With the euro area countries(enlarged scale)
Overall
Current account balance
1 For more information on the driving forces behind Ger-man net exports, see also the box on pp. 19 ff.2 See Deutsche Bundesbank, Outlook for the German economy – macroeconomic projections for 2019 and 2020 and an outlook for 2021, Monthly Report, December 2018, pp. 15-31.3 In the in- depth review as part of the 2019 European Semester , the European Commission classified Germany as once again having macroeconomic imbalances. See Euro-pean Commission, Country Report Germany 2019 includ-ing an in- depth review on the prevention and correction of macroeconomic imbalances, Brussels, 27 February 2019.
Deutsche Bundesbank Monthly Report March 2019 18
The drivers of German net exports from the perspective of a DSGE model
Microfounded dynamic stochastic general
equilibrium (DSGE) models have become
one of the established standard instruments
of macroeconomic analysis.1 Within this
model framework, macroeconomic devel-
opments are the outcome of the individual
behaviour of economic agents. These
agents are assumed to make optimal deci-
sions and to not make systematic errors
when forming expectations.
In a DSGE model developed by the Bundes-
bank which covers a number of economic
regions, it is possible to analyse Germany’s
international trade with other euro area
countries and with countries from the rest
of the world, which are assumed to have an
independent monetary policy.2 With regard
to the analysis of net exports (i.e. the bal-
ance of trade in goods and services), two
core elements of this type of model are of
importance. The fi rst is households’ utility
maximising decisions between current and
future consumption, taking into account
expected income and interest rates. Ac-
cording to this, households expecting their
income situation to worsen in the future
would, for example, already limit their cur-
rent consumption, and this would tend to
increase net exports. The second is that en-
terprises’ investment decisions, which are
also the outcome of an optimisation prob-
lem in the model, play a role in the develop-
ment of net exports. This is because, from a
macroeconomic perspective, net export
surpluses can, for instance, refl ect the reluc-
tance of households and enterprises to con-
sume or invest.
In the model, optimal consumption or in-
vestment decisions are adjusted if unex-
pected developments (shocks) occur. For
example, unexpected and persistently lower
productivity growth could lead to a reduc-
tion in current private consumption, which
tends to increase net exports. Using the es-
timated DSGE model, past cyclical fl uctu-
ations of German net exports can be attrib-
uted to the contributions of the underlying
economic shocks.3
One thing the model does is cover shocks
that originate in the German economy.
These shocks relate to the fi elds of technol-
ogy, savings, investment, public spending
and wages. However, it also identifi es the
contributions of monetary policy shocks in
the euro area, as well as those from com-
bined shocks in the rest of the euro area
and the rest of the world. This breakdown
makes it possible to gauge the importance
1 See, for example, L. Christiano, M. Eichenbaum and M. Trabandt (2018), On DSGE models, Journal of Eco-nomic Perspectives, Vol. 32, pp. 113-140; and Deutsche Bundesbank, Development and application of DSGE models for the German economy, Monthly Report, July 2008, pp. 31-46.2 For a detailed description of the model, see M. Hoff-mann, M. Kliem, M. Krause, S. Moyen and R. Sauer, Rebalancing the euro area: Is wage adjustment in Ger-many the answer?, in preparation for publication as a Deutsche Bundesbank Discussion Paper. For a similar study of the German current account balance, see R. Kollmann, M. Ratto, W. Roeger, J. in’t Veld and L. Vogel (2015), What drives the German current ac-count? And how does it affect other EU Member States?, Economic Policy, Vol. 30, pp. 47-93.3 These contributions include the initial impact of the shocks as well as potential follow- on effects in subse-quent periods. The shock decomposition of net ex-ports, which were the main reason for the increase in the current account surplus in the period since 2000, was carried out relative to gross domestic product (GDP). The other components of the current account balance are primary and secondary income. In add-ition, the ratio of net exports was mean- adjusted prior to the model estimation. The results therefore relate to fl uctuations around the mean ratio of German net ex-ports in the estimation period, which stretches from the second quarter of 1995 to the third quarter of 2018 and thus does not yet include changes as part of the 2018 annual revision.
Deutsche Bundesbank Monthly Report
March 2019 19
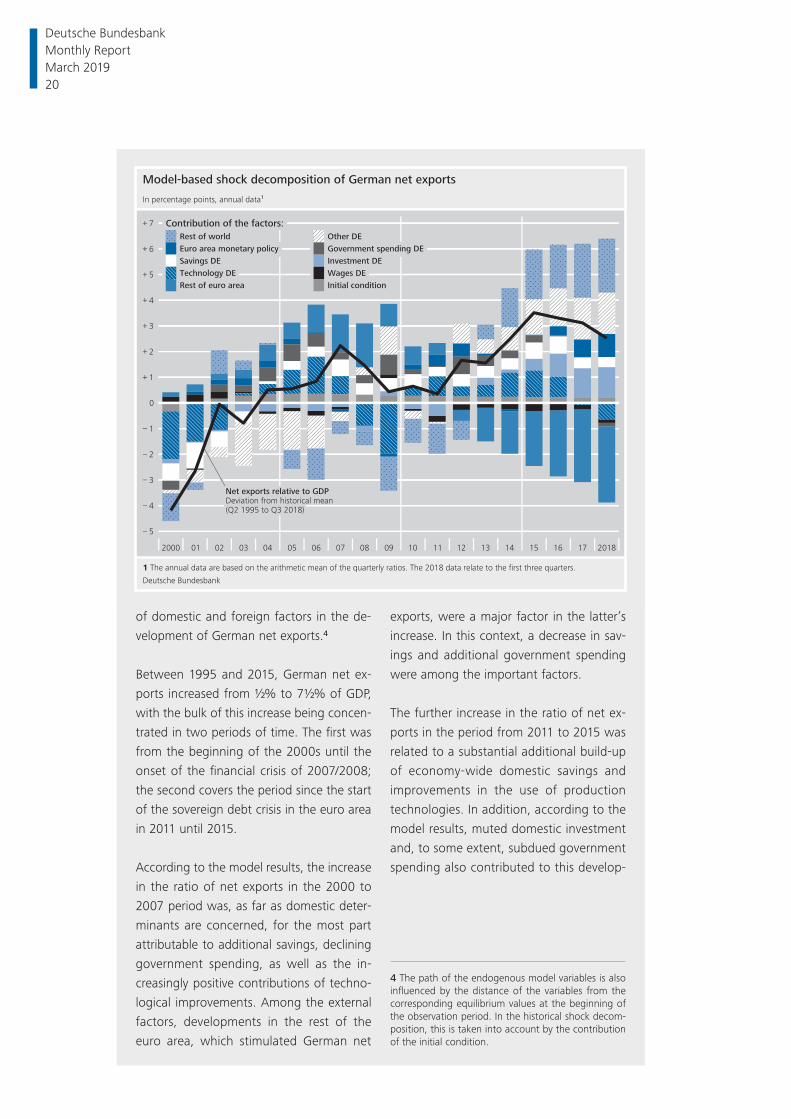
of domestic and foreign factors in the de-
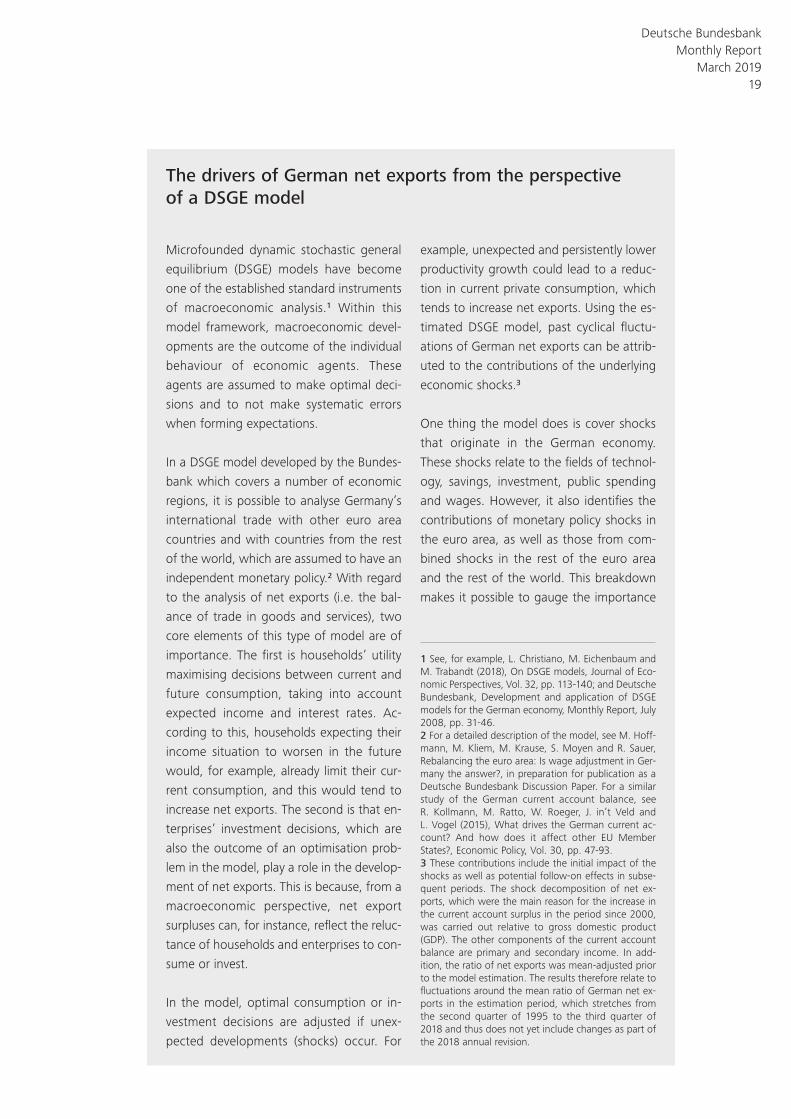
velopment of German net exports.4
Between 1995 and 2015, German net ex-
ports increased from ½% to 7½% of GDP,
with the bulk of this increase being concen-
trated in two periods of time. The fi rst was
from the beginning of the 2000s until the
onset of the fi nancial crisis of 2007/ 2008;
the second covers the period since the start
of the sovereign debt crisis in the euro area
in 2011 until 2015.
According to the model results, the increase
in the ratio of net exports in the 2000 to
2007 period was, as far as domestic deter-
minants are concerned, for the most part
attributable to additional savings, declining
government spending, as well as the in-
creasingly positive contributions of techno-
logical improvements. Among the external
factors, developments in the rest of the
euro area, which stimulated German net
exports, were a major factor in the latter’s
increase. In this context, a decrease in sav-
ings and additional government spending
were among the important factors.
The further increase in the ratio of net ex-
ports in the period from 2011 to 2015 was
related to a substantial additional build- up
of economy- wide domestic savings and
improvements in the use of production
technologies. In addition, according to the
model results, muted domestic investment
and, to some extent, subdued government
spending also contributed to this develop-
4 The path of the endogenous model variables is also infl uenced by the distance of the variables from the corresponding equilibrium values at the beginning of the observation period. In the historical shock decom-position, this is taken into account by the contribution of the initial condition.
Model-based shock decomposition of German net exports
5
4
3
2
1
0
1
2
3
4
5
6
7
–
–
–
–
–
+
+
+
+
+
+
+
In percentage points, annual data1
2000 01 02 03 04 05 06 07 08 09 10 11 12 13 14 15 16 17 2018
1 The annual data are based on the arithmetic mean of the quarterly ratios. The 2018 data relate to the first three quarters.
Deutsche Bundesbank
Initial condition
Rest of world
Rest of euro area
Net exports relative to GDPDeviation from historical mean (Q2 1995 to Q3 2018)
Contribution of the factors:
Other DE
Euro area monetary policy Government spending DE
Savings DE Investment DE
Wages DETechnology DE
Deutsche Bundesbank Monthly Report March 2019 20
ment.5 Other developments in Germany
(Other DE), including changes in the price
mark- up of tradable goods as well as to
the share of tradable goods in overall con-
sumption, also contributed to the increase
in the surplus. The extraordinarily accom-
modative euro area monetary policy in
recent years appears to have led to a slight
increase in the surplus, probably also as a
result of the induced depreciation of the
euro exchange rate. Developments in the
rest of the world also increased the surplus
on balance. As in Germany, changes to the
share of tradable goods in overall con-
sumption as well as risk premium shocks
were of importance here. By contrast,
since the sovereign debt crisis, develop-
ments in the rest of the euro area have in-
creasingly dampened German net exports.
These include comparatively weak invest-
ment activity, higher savings and lower
government spending. In addition, particu-
larly subdued wage growth in Germany
– even before 2011 – seems to have played
almost no role in the increase in net ex-
ports.
Overall, the results presented support the
hypothesis that the large and persistent sur-
plus of German net exports is attributable
to several factors. The accumulation of sav-
ings in Germany is one of the factors that
has contributed to an increasing surplus
over a prolonged period of time. This fi nd-
ing is consistent with the increase in
economy- wide savings, which is attribut-
able to a signifi cant extent to non- fi nancial
corporations.6 Although weak domestic in-
vestment and low government spending
also tended to increase the surplus, their
quantitative effects were smaller. Moreover,
according to the analyses, a considerable
part of the dynamics of German net exports
is attributable to external factors. However,
this development refl ects, at times, partly
offsetting contributions stemming from the
rest of the euro area and the rest of the
world over large stretches of the post-2000
period.
5 The results do not allow a distinction to be made between public and private investment. Furthermore, in light of the strong population growth, the fi nding that the dynamics of domestic investment have been comparatively strong since the fi rst half of 2017 may have also been masked in the shock decomposition due to the per capita perspective chosen. See, for ex-ample, Deutsche Bundesbank, The German economy, Monthly Report, November 2018, pp. 44-53.6 For more information, see pp. 24 ff. and Deutsche Bundesbank, The savings of non- fi nancial corporations in Germany, Monthly Report, March 2018, pp. 20-22.
Deutsche Bundesbank Monthly Report
March 2019 21
by an average of just over 5% on the year. The
euro mainly appreciated against the US dollar
and the Swiss franc, but also against the ren-
minbi and the yen. Germany’s price competi-
tiveness deteriorated somewhat as a result.
Price factors also tended to dampen economic
activity in Germany. For instance, the price of
crude oil, in particular, rose very sharply. A bar-
rel of Brent crude oil cost an average of US$71
in 2018 – just under one- third more than in the
previous year.
Besides the less favourable global economic
environment, in the second half of the year,
problems in the automotive industry stemming
from the introduction of a new EU- wide emis-
sions testing procedure for new motor vehicle
registrations weakened Germany’s export per-
formance.4 Although nominal goods exports
expanded significantly overall, growth was
below average compared to the previous years.
Imports benefited from domestic economic
conditions, which remained positive, although
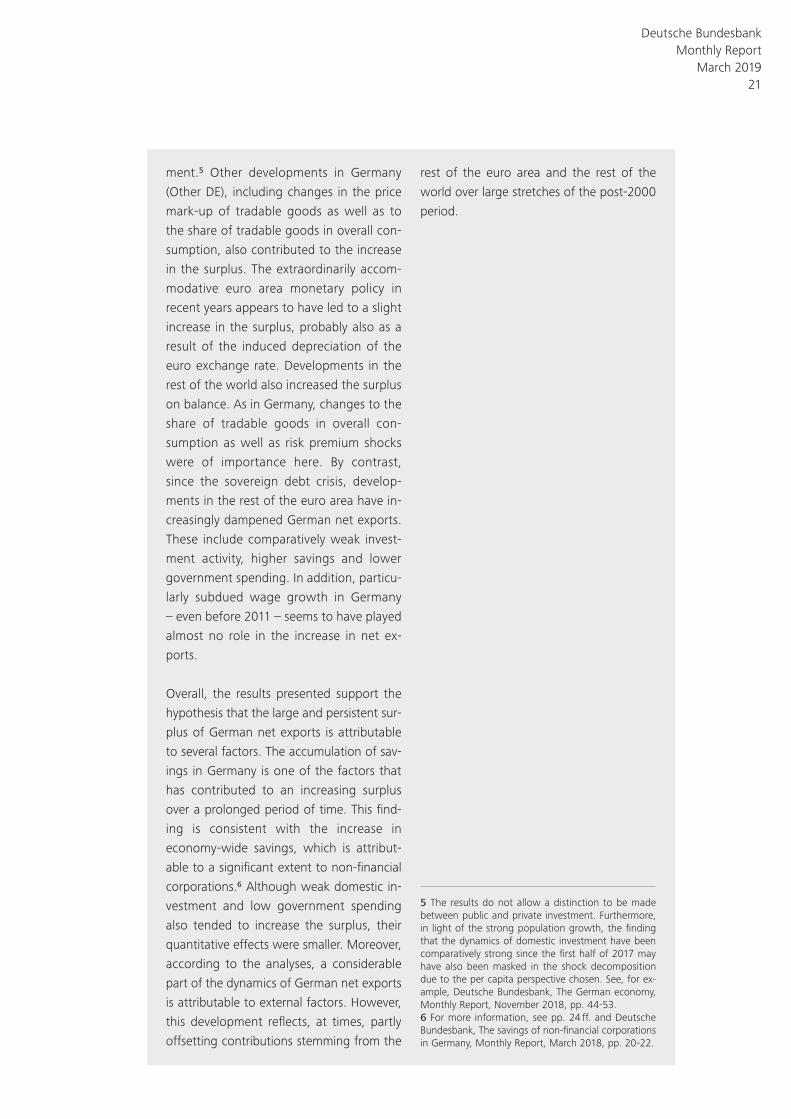
the growth in the volume of imports lagged
slightly behind the figures recorded in the pre-
vious years, in line with the slackening pace of
domestic growth. The increase in the price of
goods imports, which was relatively strong
compared to that of exports, meant that im-
port growth outpaced export growth to an
even greater degree in nominal terms than in
real terms. As a result, the foreign trade bal-
ance decreased significantly in the reporting
year. In purely mathematical terms, volume
effects accounted for roughly two- fifths of the
decline, and price effects for three- fifths.
In regional terms, the current account balance
vis- à- vis other euro area countries fell by ¼ per-
centage point to 2½% of GDP. The decline was
mainly due to a smaller surplus in the goods
account, which overshadowed the reduced
deficit in services trade. The current account
balance vis- à- vis non- euro area countries
dropped by ½ percentage point to 4¾% of
GDP. This was mainly the result of a smaller sur-
plus in the goods account, whose decline in
comparison with the previous year significantly
exceeded the improvement in the primary in-
come balance.
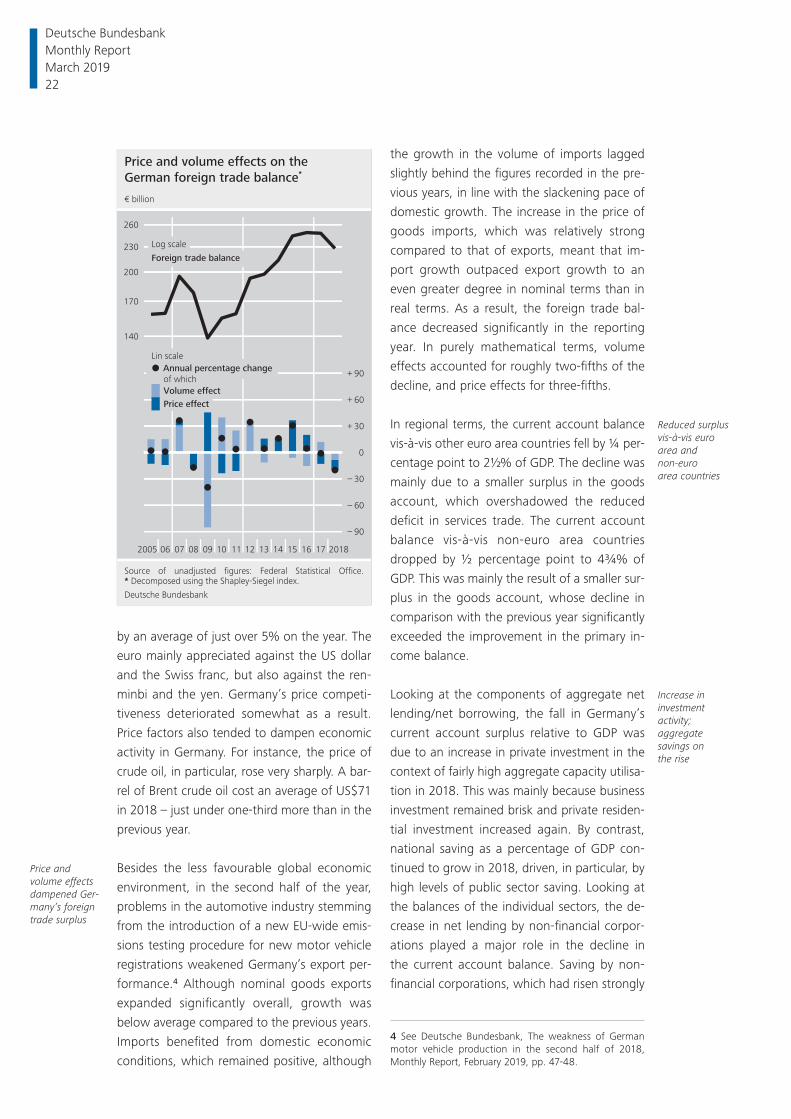
Looking at the components of aggregate net
lending/ net borrowing, the fall in Germany’s
current account surplus relative to GDP was
due to an increase in private investment in the
context of fairly high aggregate capacity utilisa-
tion in 2018. This was mainly because business
investment remained brisk and private residen-
tial investment increased again. By contrast,
national saving as a percentage of GDP con-
tinued to grow in 2018, driven, in particular, by
high levels of public sector saving. Looking at
the balances of the individual sectors, the de-
crease in net lending by non- financial corpor-
ations played a major role in the decline in
the current account balance. Saving by non-
financial corporations, which had risen strongly
Price and volume effects dampened Ger-many’s foreign trade surplus
Reduced surplus vis- à- vis euro area and non-euro area countries
Increase in investment activity; aggregate savings on the rise
Price and volume effects on the
German foreign trade balance*
Source of unadjusted figures: Federal Statistical Office. * Decomposed using the Shapley-Siegel index.
Deutsche Bundesbank
2005 06 07 08 09 10 11 12 13 14 15 16 17 2018
140
170
200
230
260
– 90
– 60
– 30
0
+ 30
+ 60
+ 90
Lin scale
Log scale
Foreign trade balance
€ billion
Price effect
Volume effect
Annual percentage changeof which
4 See Deutsche Bundesbank, The weakness of German motor vehicle production in the second half of 2018, Monthly Report, February 2019, pp. 47-48.
Deutsche Bundesbank Monthly Report March 2019 22
between the early 2000s and 2015, dipped
slightly again in 2018 (see also the box on
pp. 24 ff.). General government net lending
increased considerably last year owing to sharp
rises in social contributions and, above all, tax.
Although significant in absolute terms, net
lending by households remained broadly un-
changed.
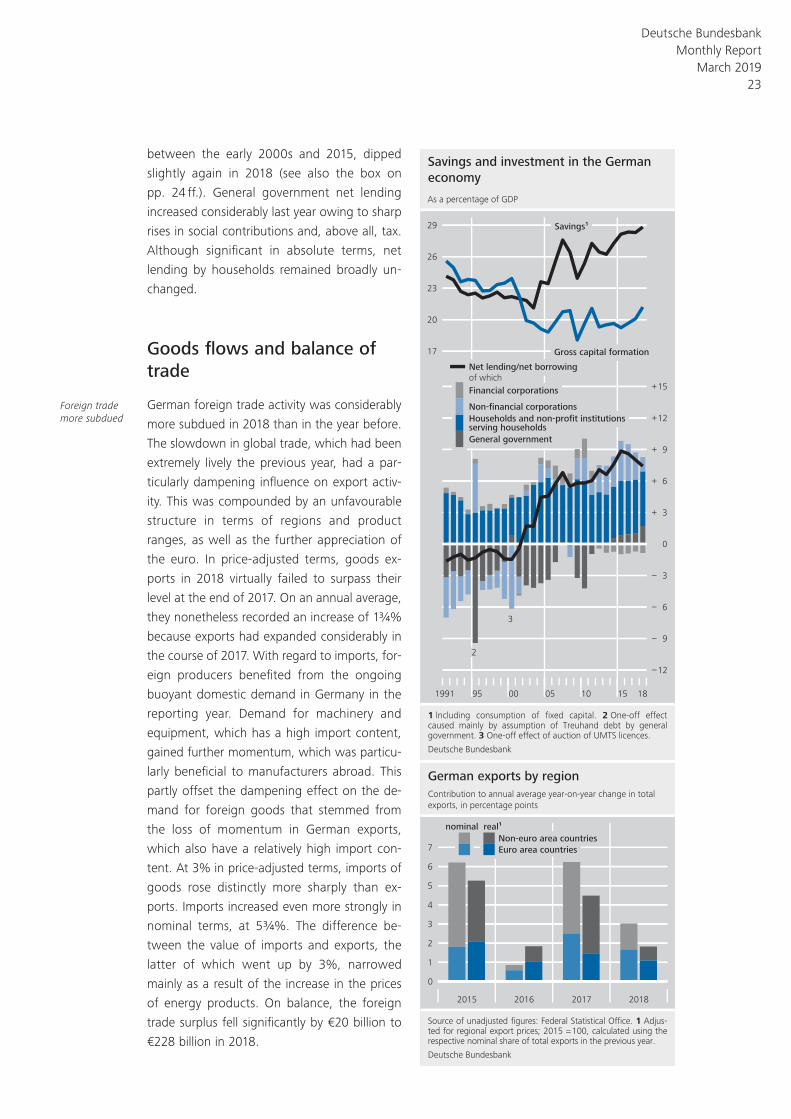
Goods flows and balance of trade
German foreign trade activity was considerably
more subdued in 2018 than in the year before.
The slowdown in global trade, which had been
extremely lively the previous year, had a par-
ticularly dampening influence on export activ-
ity. This was compounded by an unfavourable
structure in terms of regions and product
ranges, as well as the further appreciation of
the euro. In price- adjusted terms, goods ex-
ports in 2018 virtually failed to surpass their
level at the end of 2017. On an annual average,
they nonetheless recorded an increase of 1¾%
because exports had expanded considerably in
the course of 2017. With regard to imports, for-
eign producers benefited from the ongoing
buoyant domestic demand in Germany in the
reporting year. Demand for machinery and
equipment, which has a high import content,
gained further momentum, which was particu-
larly beneficial to manufacturers abroad. This
partly offset the dampening effect on the de-
mand for foreign goods that stemmed from
the loss of momentum in German exports,
which also have a relatively high import con-
tent. At 3% in price- adjusted terms, imports of
goods rose distinctly more sharply than ex-
ports. Imports increased even more strongly in
nominal terms, at 5¾%. The difference be-
tween the value of imports and exports, the
latter of which went up by 3%, narrowed
mainly as a result of the increase in the prices
of energy products. On balance, the foreign
trade surplus fell significantly by €20 billion to
€228 billion in 2018.
Foreign trade more subdued
Savings and investment in the German
economy
1 lncluding consumption of fixed capital. 2 One-off effect caused mainly by assumption of Treuhand debt by general government. 3 One-off effect of auction of UMTS licences.
Deutsche Bundesbank
1991 95 00 05 10 15 18
–12
– 9
– 6
– 3
0
+ 3
+ 6
+ 9
+12
+15
As a percentage of GDP
Households and non-profit institutions serving households
General government
Net lending/net borrowingof which
2
3
17
20
23
26
29
Financial corporations
Non-financial corporations
Savings1
Gross capital formation
German exports by region
Source of unadjusted figures: Federal Statistical Office. 1 Adjus-ted for regional export prices; 2015 = 100, calculated using the respective nominal share of total exports in the previous year.
Deutsche Bundesbank
2015 2016 2017 2018
0
1
2
3
4
5
6
7
Contribution to annual average year-on-year change in total
exports, in percentage points
nominal real1
Non-euro area countries
Euro area countries
Deutsche Bundesbank Monthly Report
March 2019 23
On the corporate payout ratio in Germany
Increased savings of non- fi nancial corpor-ations played a major role in driving Ger-many’s current account surplus to today’s high level.1 One key factor in this develop-ment in purely arithmetical terms, besides the increase in corporate profi tability, has been the lower share of profi ts distributed to corporations’ shareholders.2 The aggre-gate payout ratio of non- fi nancial corpor-ations – measured as distributed income paid relative to net profi ts – has been on the decline since the beginning of the mil-lennium.3 Coming to roughly 95% in 2001, this ratio has since dwindled by around 20 percentage points to 75% on average for the 2014-18 period, according to data reported in Germany’s national accounts.
At the beginning of the last decade, the payout ratio in Germany was far higher than in the other countries of the euro area or European Union. However, neither these economic areas nor Japan, the United King-dom or the United States have seen the average payout ratio decline signifi cantly on balance. This would suggest that, to some extent, the strong contribution which the declining payout ratio of German enter-prises has made to the rise in corporate sav-ings over recent years also refl ects a nor-malisation of sorts by international stand-ards.4
Disaggregated data on the distributions of earnings by German enterprises based on the Bundesbank’s corporate balance sheet statistics suggest that the decline in the payout ratio, rather than being confi ned to any particular size class, legal form or eco-nomic sector, has been a widespread devel-opment across Germany’s corporate sector. While the decline has shown only minor dif-ferences in magnitude across fi rm charac-teristics, large enterprises and stock corpor-
ations generally had lower payout ratios than the other fi rm types. A comparison of the manufacturing and services sectors, on the other hand, showed no noteworthy dif-ferences in terms of the level of the payout ratio or the magnitude of its decline.
Besides descriptive analyses, it is also pos-sible to use econometric estimates to iden-tify which factors have been driving the de-cline in the payout ratio. These estimates subject common theories on the decline in the corporate payout ratio in Germany – includ ing those suggested in the aca-demic literature – to an initial assessment using suitable datasets and methods in each case.
Enterprises looking to deleverage
One possible theory for the decline in the payout ratio is deleveraging by German en-terprises. These had relatively high leverage ratios by international standards at the end of the 1990s and have since made lasting
1 See Deutsche Bundesbank, The German economy’s current account surplus, Annual Report 2013, pp. 39-60.2 See Deutsche Bundesbank, The savings of non- fi nancial corporations in Germany, Monthly Report, March 2018, pp. 20-22.3 Net profi ts based on national accounts data were calculated in line with the net income/ net loss for the fi nancial year fi gures reported in corporations’ income statements – that is to say, as net savings plus distrib-uted income paid. The results look much the same if the payout ratio is modifi ed such that net distributed income (i.e. distributed income paid less distributed in-come received) is used in the numerator or corporate profi ts (i.e. profi ts before taxes and net transfers) are used in the denominator.4 In many advanced economies, non- fi nancial enter-prises’ savings relative to their gross value added have risen strongly since the 1990s. See P. Chen, L. Karabar-bounis and B. Neiman (2017), The global rise of cor-porate saving, Journal of Monetary Economics 89(C), pp. 1-19.
Deutsche Bundesbank Monthly Report March 2019 24
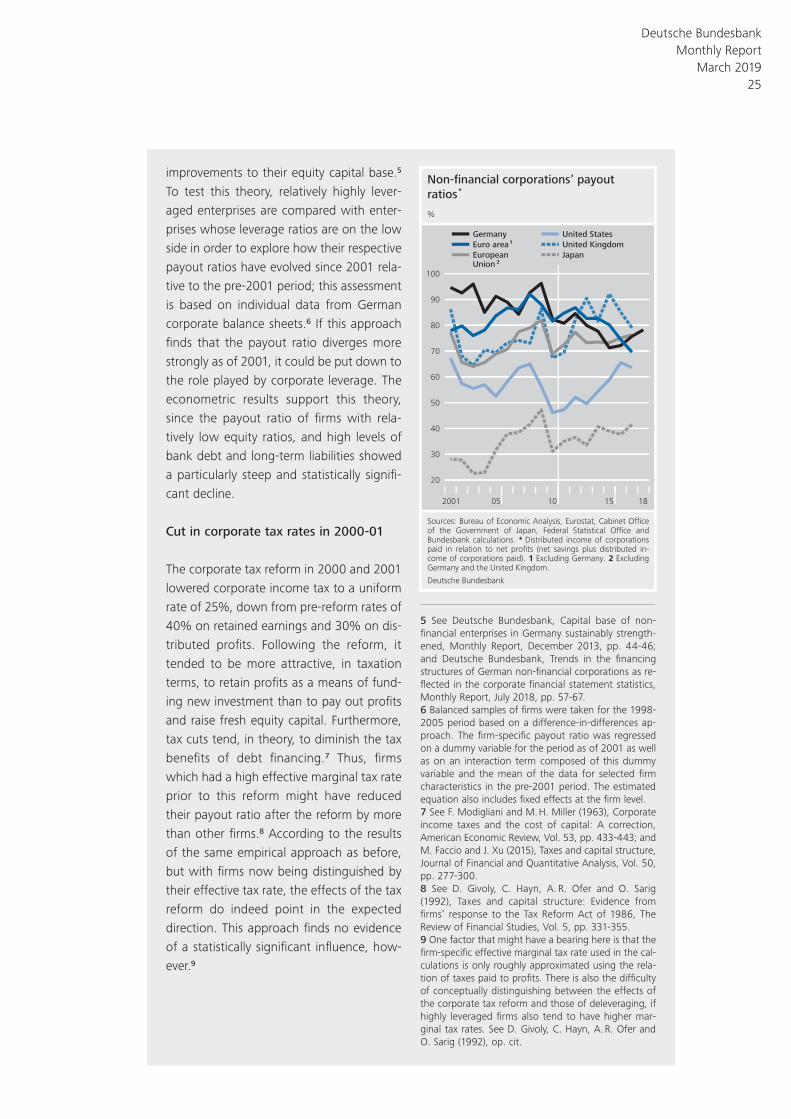
improvements to their equity capital base.5 To test this theory, relatively highly lever-aged enterprises are compared with enter-prises whose leverage ratios are on the low side in order to explore how their respective payout ratios have evolved since 2001 rela-tive to the pre-2001 period; this assessment is based on individual data from German corporate balance sheets.6 If this approach fi nds that the payout ratio diverges more strongly as of 2001, it could be put down to the role played by corporate leverage. The econometric results support this theory, since the payout ratio of fi rms with rela-tively low equity ratios, and high levels of bank debt and long- term liabilities showed a particularly steep and statistically signifi -cant decline.
Cut in corporate tax rates in 2000-01
The corporate tax reform in 2000 and 2001 lowered corporate income tax to a uniform rate of 25%, down from pre- reform rates of 40% on retained earnings and 30% on dis-tributed profi ts. Following the reform, it tended to be more attractive, in taxation terms, to retain profi ts as a means of fund-ing new investment than to pay out profi ts and raise fresh equity capital. Furthermore, tax cuts tend, in theory, to diminish the tax benefi ts of debt fi nancing.7 Thus, fi rms which had a high effective marginal tax rate prior to this reform might have reduced their payout ratio after the reform by more than other fi rms.8 According to the results of the same empirical approach as before, but with fi rms now being distinguished by their effective tax rate, the effects of the tax reform do indeed point in the expected direc tion. This approach fi nds no evidence of a statistically signifi cant infl uence, how-ever.9
5 See Deutsche Bundesbank, Capital base of non- fi nancial enterprises in Germany sustainably strength-ened, Monthly Report, December 2013, pp. 44-46; and Deutsche Bundesbank, Trends in the fi nancing structures of German non- fi nancial corporations as re-fl ected in the corporate fi nancial statement statistics, Monthly Report, July 2018, pp. 57-67.6 Balanced samples of fi rms were taken for the 1998-2005 period based on a difference- in- differences ap-proach. The fi rm- specifi c payout ratio was regressed on a dummy variable for the period as of 2001 as well as on an interaction term composed of this dummy variable and the mean of the data for selected fi rm characteristics in the pre- 2001 period. The estimated equation also includes fi xed effects at the fi rm level.7 See F. Modigliani and M. H. Miller (1963), Corporate income taxes and the cost of capital: A correction, American Economic Review, Vol. 53, pp. 433-443; and M. Faccio and J. Xu (2015), Taxes and capital structure, Journal of Financial and Quantitative Analysis, Vol. 50, pp. 277-300.8 See D. Givoly, C. Hayn, A. R. Ofer and O. Sarig (1992), Taxes and capital structure: Evidence from fi rms’ response to the Tax Reform Act of 1986, The Review of Financial Studies, Vol. 5, pp. 331-355.9 One factor that might have a bearing here is that the fi rm- specifi c effective marginal tax rate used in the cal-culations is only roughly approximated using the rela-tion of taxes paid to profi ts. There is also the diffi culty of conceptually distinguishing between the effects of the corporate tax reform and those of deleveraging, if highly leveraged fi rms also tend to have higher mar-ginal tax rates. See D. Givoly, C. Hayn, A. R. Ofer and O. Sarig (1992), op. cit.
Non-financial corporations’ payout
ratios *
20
30
40
50
60
70
80
90
100
%
2001 05 10 15 18
Sources: Bureau of Economic Analysis, Eurostat, Cabinet Office of the Government of Japan, Federal Statistical Office and Bundesbank calculations. * Distributed income of corporations paid in relation to net profits (net savings plus distributed in-come of corporations paid). 1 Excluding Germany. 2 Excluding Germany and the United Kingdom.
Deutsche Bundesbank
Germany
Euro area 1
EuropeanUnion 2
United States
United Kingdom
Japan
Deutsche Bundesbank Monthly Report
March 2019 25
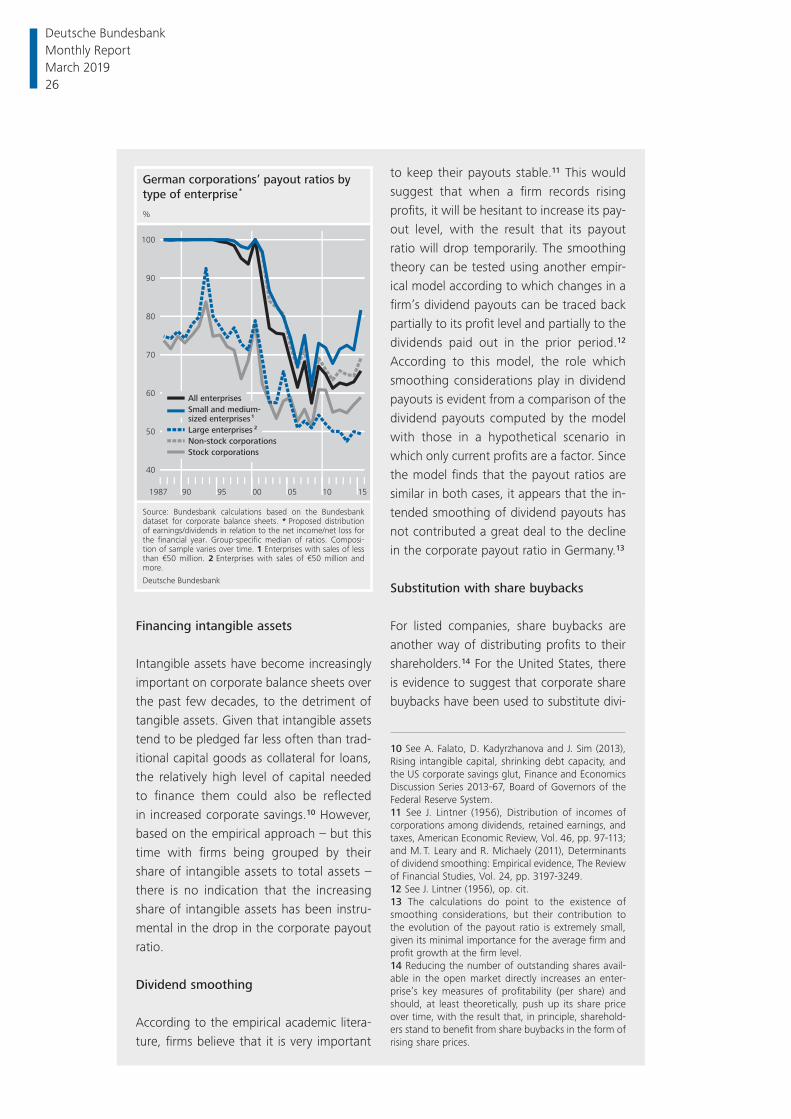
Financing intangible assets
Intangible assets have become increasingly important on corporate balance sheets over the past few decades, to the detriment of tangible assets. Given that intangible assets tend to be pledged far less often than trad-itional capital goods as collateral for loans, the relatively high level of capital needed to fi nance them could also be refl ected in increased corporate savings.10 However, based on the empirical approach – but this time with fi rms being grouped by their share of intangible assets to total assets – there is no indication that the increasing share of intangible assets has been instru-mental in the drop in the corporate payout ratio.
Dividend smoothing
According to the empirical academic litera-ture, fi rms believe that it is very important
to keep their payouts stable.11 This would suggest that when a fi rm records rising profi ts, it will be hesitant to increase its pay-out level, with the result that its payout ratio will drop temporarily. The smoothing theory can be tested using another empir-ical model according to which changes in a fi rm’s dividend payouts can be traced back partially to its profi t level and partially to the dividends paid out in the prior period.12 Accord ing to this model, the role which smoothing considerations play in dividend payouts is evident from a comparison of the dividend payouts computed by the model with those in a hypothetical scenario in which only current profi ts are a factor. Since the model fi nds that the payout ratios are similar in both cases, it appears that the in-tended smoothing of dividend payouts has not contributed a great deal to the decline in the corporate payout ratio in Germany.13
Substitution with share buybacks
For listed companies, share buybacks are another way of distributing profi ts to their shareholders.14 For the United States, there is evidence to suggest that corporate share buybacks have been used to substitute divi-
10 See A. Falato, D. Kadyrzhanova and J. Sim (2013), Rising intangible capital, shrinking debt capacity, and the US corporate savings glut, Finance and Economics Discussion Series 2013-67, Board of Governors of the Federal Reserve System.11 See J. Lintner (1956), Distribution of incomes of corporations among dividends, retained earnings, and taxes, American Economic Review, Vol. 46, pp. 97-113; and M. T. Leary and R. Michaely (2011), Determinants of dividend smoothing: Empirical evidence, The Review of Financial Studies, Vol. 24, pp. 3197-3249.12 See J. Lintner (1956), op. cit.13 The calculations do point to the existence of smoothing considerations, but their contribution to the evolution of the payout ratio is extremely small, given its minimal importance for the average fi rm and profi t growth at the fi rm level.14 Reducing the number of outstanding shares avail-able in the open market directly increases an enter-prise’s key measures of profi tability (per share) and should, at least theoretically, push up its share price over time, with the result that, in principle, sharehold-ers stand to benefi t from share buybacks in the form of rising share prices.
German corporations’ payout ratios by
type of enterprise *
40
50
60
70
80
90
100
%
1987 90 95 00 05 10 15
Source: Bundesbank calculations based on the Bundesbank dataset for corporate balance sheets. * Proposed distribution of earnings/dividends in relation to the net income/net loss for the financial year. Group-specific median of ratios. Composi-tion of sample varies over time. 1 Enterprises with sales of less than €50 million. 2 Enterprises with sales of €50 million and more.
Deutsche Bundesbank
All enterprises
Small and medium-sized enterprises 1
Large enterprises 2
Stock corporations
Non-stock corporations
Deutsche Bundesbank Monthly Report March 2019 26
In regional terms, year- on- year growth in the
value of exports to the most important target
countries and sales regions was generally less
buoyant on average in 2018 than in 2017. This
was also the case in price- adjusted terms, ac-
cording to which exports to the euro area in-
creased by 3% and to countries outside of the
euro area by 1¼%. Viewed over the course of
the year, the relatively weak performance of
price adjusted regional exports in 2018 be-
comes clearer. Although exports to euro area
countries in 2018 rose by 1¾% until the final
quarter in nominal terms compared to the last
quarter of 2017, in price- adjusted terms, they
exceeded this level by just ¼%. Exports to non-
euro area countries grew by a nominal 1¼%
over the same period; however, at last count,
they were nonetheless ½% lower than in the
fourth quarter of 2017 after adjustment for de-
velopments in sales prices.
Turning to nominal exports to EU countries, the
annual average figures showed a particular de-
cline in exports to the United Kingdom. Prod-
uct range effects, the slowdown in growth in
the United Kingdom, and the significant appre-
ciation of the euro against the British pound in
the years before probably had a dampening ef-
fect here. Exports to France were also slightly
down on the year, with the decline in other
transport equipment also playing a role.5 By
contrast, exporters maintained the successful
performance they had achieved in the Nether-
lands and Italy in 2017. The increase in revenue
from German exports to central and eastern
European countries outside the euro area was
higher than average, as in previous years.
The increase in the value of exports to coun-
tries outside the EU was also more subdued on
Weaker rise in price- adjusted exports by region
Loss of momentum in exports to EU countries …
… and to non- EU countries
dend payments, at least in part, since the 1980s.15 To gauge how much share buy-backs have contributed to the decline in the payout ratio in Germany, it is possible to cal-culate a payout ratio adjusted for share buy-backs.16 While there have been some years in which this ratio was considerably higher than the standard measure, the differences were immaterial on average for the 1998-2017 period. Arguably, then, share buybacks did not contribute to the trend decline in the payout ratio in Germany.
Conclusion
In conclusion, out of the fi ve hypotheses in-vestigated in this box, just one – the delev-eraging theory – is identifi ed as having a statistically signifi cant and quantitatively im-portant infl uence on the decline in the pay-out ratio. Given that debt levels in Ger-many’s non- fi nancial corporate sector are
now relatively low by international stand-ards, there is little reason for enterprises to reduce their payout ratios any further.17 Now that enterprises are very soundly cap-italised, it would certainly be plausible for them to further increase the share of profi ts they distribute in the future (as the national accounts data have been indicating since 2015).18
15 See G. Grullon and R. Michaely (2002), Dividends, share repurchases, and the substitution hypothesis, Journal of Finance, Vol. 57, pp. 1649-1684; and D. J. Skinner (2008), The evolving relation between earnings, dividends, and stock repurchases, Journal of Financial Economics, Vol. 87, pp. 582-609.16 Corporate share buybacks are not reported in the sectoral accounts of the national accounts.17 See Deutsche Bundesbank, Recent developments in the indebtedness of the private non- fi nancial sector in selected euro- area countries, Monthly Report, January 2017, pp. 41-58.18 Recent developments in the capitalisation of non- fi nancial corporations in Germany are outlined in Deutsche Bundesbank, German enterprises’ profi tabil-ity and fi nancing in 2017, Monthly Report, December 2018, pp. 33-46.
5 Ships and boats, railway locomotives and rolling stock, as well as aircraft and spacecraft, in particular – especially for the bilateral trade flows of the countries involved in the joint European manufacturing arrangement – play a major role in Germany’s foreign trade in other transport equip-ment.
Deutsche Bundesbank Monthly Report
March 2019 27
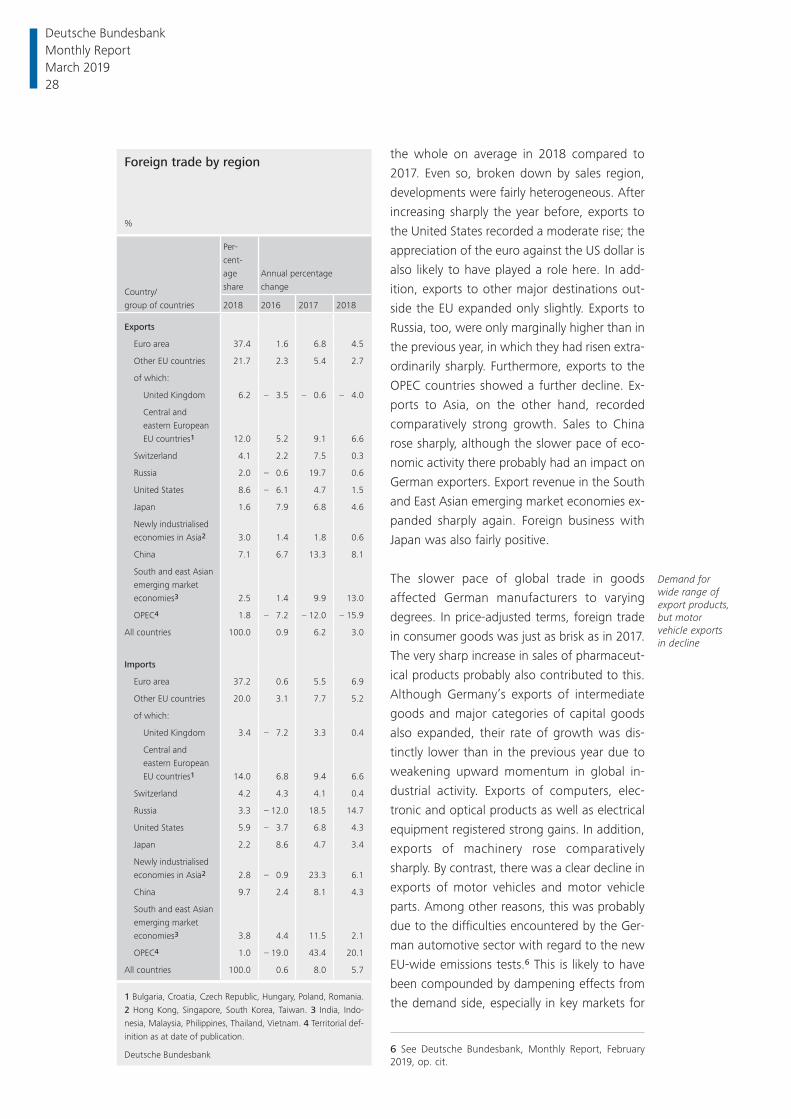
the whole on average in 2018 compared to
2017. Even so, broken down by sales region,
developments were fairly heterogeneous. After
increasing sharply the year before, exports to
the United States recorded a moderate rise; the
appre ciation of the euro against the US dollar is
also likely to have played a role here. In add-
ition, exports to other major destinations out-
side the EU expanded only slightly. Exports to
Russia, too, were only marginally higher than in
the previous year, in which they had risen extra-
ordinarily sharply. Furthermore, exports to the
OPEC countries showed a further decline. Ex-
ports to Asia, on the other hand, recorded
comparatively strong growth. Sales to China
rose sharply, although the slower pace of eco-
nomic activity there probably had an impact on
German exporters. Export revenue in the South
and East Asian emerging market economies ex-
panded sharply again. Foreign business with
Japan was also fairly positive.
The slower pace of global trade in goods
affected German manufacturers to varying
degrees . In price- adjusted terms, foreign trade
in consumer goods was just as brisk as in 2017.
The very sharp increase in sales of pharmaceut-
ical products probably also contributed to this.
Although Germany’s exports of intermediate
goods and major categories of capital goods
also expanded, their rate of growth was dis-
tinctly lower than in the previous year due to
weakening upward momentum in global in-
dustrial activity. Exports of computers, elec-
tronic and optical products as well as electrical
equipment registered strong gains. In addition,
exports of machinery rose comparatively
sharply. By contrast, there was a clear decline in
exports of motor vehicles and motor vehicle
parts. Among other reasons, this was probably
due to the difficulties encountered by the Ger-
man automotive sector with regard to the new
EU- wide emissions tests.6 This is likely to have
been compounded by dampening effects from
the demand side, especially in key markets for
Demand for wide range of export products, but motor vehicle exports in decline
Foreign trade by region
%
Country/group of countries
Per-cent-age share
Annual percentagechange
2018 2016 2017 2018
Exports
Euro area 37.4 1.6 6.8 4.5
Other EU countries 21.7 2.3 5.4 2.7
of which:
United Kingdom 6.2 – 3.5 – 0.6 – 4.0
Central and eastern European EU countries1 12.0 5.2 9.1 6.6
Switzerland 4.1 2.2 7.5 0.3
Russia 2.0 – 0.6 19.7 0.6
United States 8.6 – 6.1 4.7 1.5
Japan 1.6 7.9 6.8 4.6
Newly industrialised economies in Asia2 3.0 1.4 1.8 0.6
China 7.1 6.7 13.3 8.1
South and east Asian emerging market economies3 2.5 1.4 9.9 13.0
OPEC4 1.8 – 7.2 – 12.0 – 15.9
All countries 100.0 0.9 6.2 3.0
Imports
Euro area 37.2 0.6 5.5 6.9
Other EU countries 20.0 3.1 7.7 5.2
of which:
United Kingdom 3.4 – 7.2 3.3 0.4
Central and eastern European EU countries1 14.0 6.8 9.4 6.6
Switzerland 4.2 4.3 4.1 0.4
Russia 3.3 – 12.0 18.5 14.7
United States 5.9 – 3.7 6.8 4.3
Japan 2.2 8.6 4.7 3.4
Newly industrialised economies in Asia2 2.8 – 0.9 23.3 6.1
China 9.7 2.4 8.1 4.3
South and east Asian emerging market economies3 3.8 4.4 11.5 2.1
OPEC4 1.0 – 19.0 43.4 20.1
All countries 100.0 0.6 8.0 5.7
1 Bulgaria, Croatia, Czech Republic, Hungary, Poland, Romania. 2 Hong Kong, Singapore, South Korea, Taiwan. 3 India, Indo-nesia, Malaysia, Philippines, Thailand, Vietnam. 4 Territorial def-inition as at date of publication.
Deutsche Bundesbank 6 See Deutsche Bundesbank, Monthly Report, February 2019, op. cit.
Deutsche Bundesbank Monthly Report March 2019 28
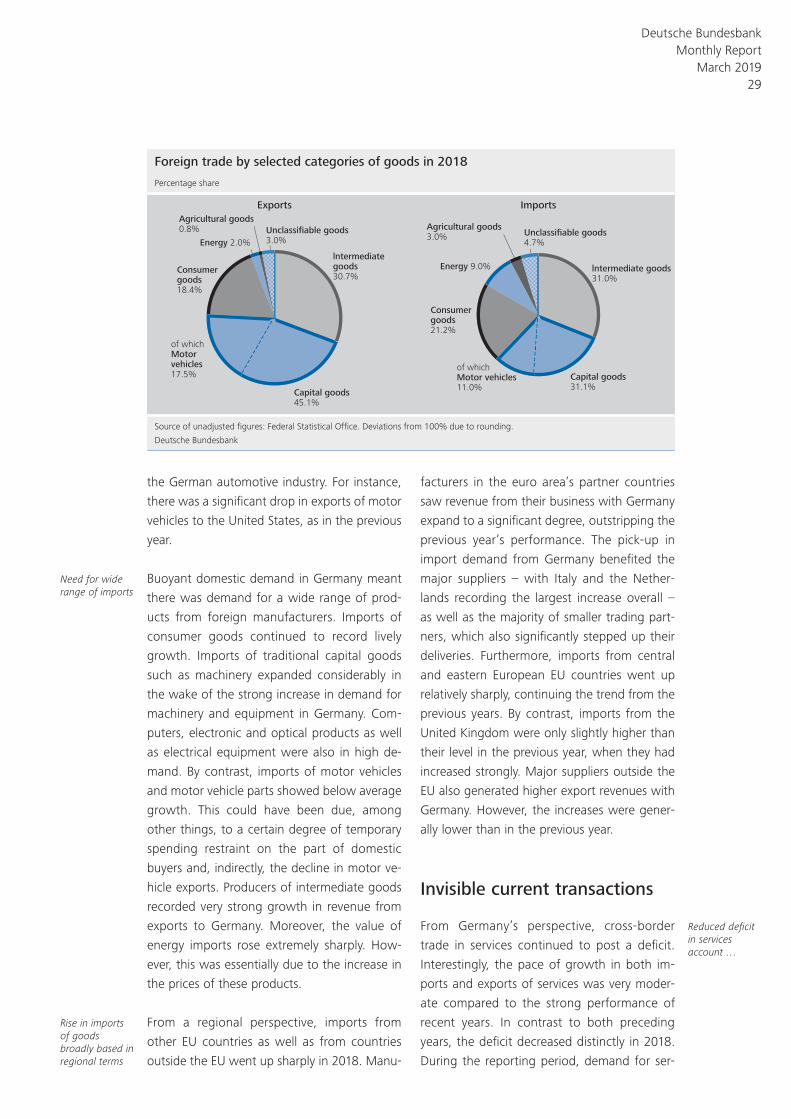
the German automotive industry. For instance,
there was a significant drop in exports of motor
vehicles to the United States, as in the previous
year.
Buoyant domestic demand in Germany meant
there was demand for a wide range of prod-
ucts from foreign manufacturers. Imports of
consumer goods continued to record lively
growth. Imports of traditional capital goods
such as machinery expanded considerably in
the wake of the strong increase in demand for
machinery and equipment in Germany. Com-
puters, electronic and optical products as well
as electrical equipment were also in high de-
mand. By contrast, imports of motor vehicles
and motor vehicle parts showed below average
growth. This could have been due, among
other things, to a certain degree of temporary
spending restraint on the part of domestic
buyers and, indirectly, the decline in motor ve-
hicle exports. Producers of intermediate goods
recorded very strong growth in revenue from
exports to Germany. Moreover, the value of
energy imports rose extremely sharply. How-
ever, this was essentially due to the increase in
the prices of these products.
From a regional perspective, imports from
other EU countries as well as from countries
outside the EU went up sharply in 2018. Manu-
facturers in the euro area’s partner countries
saw revenue from their business with Germany
expand to a significant degree, outstripping the
previous year’s performance. The pick- up in
import demand from Germany benefited the
major suppliers – with Italy and the Nether-
lands recording the largest increase overall –
as well as the majority of smaller trading part-
ners, which also significantly stepped up their
deliveries. Furthermore, imports from central
and eastern European EU countries went up
relatively sharply, continuing the trend from the
previous years. By contrast, imports from the
United Kingdom were only slightly higher than
their level in the previous year, when they had
increased strongly. Major suppliers outside the
EU also generated higher export revenues with
Germany. However, the increases were gener-
ally lower than in the previous year.
Invisible current transactions
From Germany’s perspective, cross- border
trade in services continued to post a deficit.
Interestingly, the pace of growth in both im-
ports and exports of services was very moder-
ate compared to the strong performance of
recent years. In contrast to both preceding
years, the deficit decreased distinctly in 2018.
During the reporting period, demand for ser-
Need for wide range of imports
Rise in imports of goods broadly based in regional terms
Reduced deficit in services account …
Foreign trade by selected categories of goods in 2018
Source of unadjusted figures: Federal Statistical Office. Deviations from 100% due to rounding.
Deutsche Bundesbank
Imports
lntermediategoods30.7%
Capital goods45.1%
of whichMotorvehicles17.5%
Consumergoods18.4%
Energy 2.0%
Agricultural goods0.8% Unclassifiable goods
3.0%
Exports
Agricultural goods3.0%
lntermediate goods31.0%
Energy 9.0%
of whichMotor vehicles11.0%
Unclassifiable goods4.7%
Capital goods31.1%
Consumergoods21.2%
Percentage share
Deutsche Bundesbank Monthly Report
March 2019 29
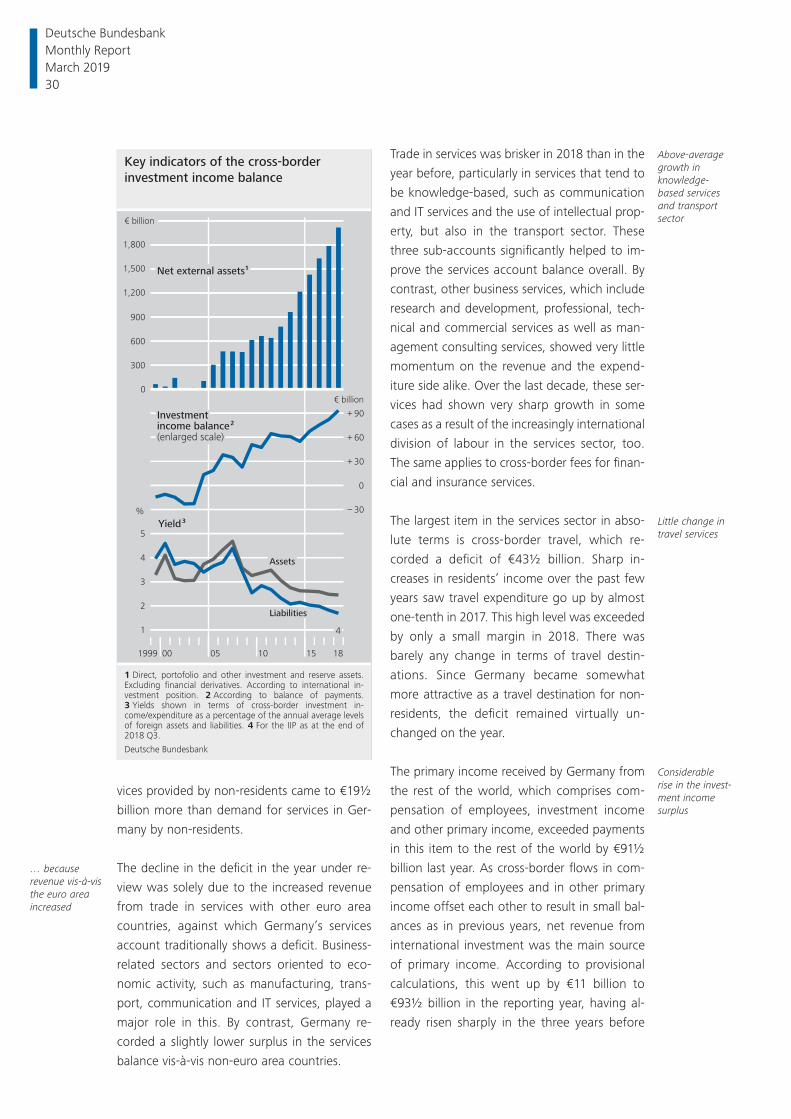
vices provided by non- residents came to €19½
billion more than demand for services in Ger-
many by non- residents.
The decline in the deficit in the year under re-
view was solely due to the increased revenue
from trade in services with other euro area
countries, against which Germany’s services
account traditionally shows a deficit. Business-
related sectors and sectors oriented to eco-
nomic activity, such as manufacturing, trans-
port, communication and IT services, played a
major role in this. By contrast, Germany re-
corded a slightly lower surplus in the services
balance vis- à- vis non- euro area countries.
Trade in services was brisker in 2018 than in the
year before, particularly in services that tend to
be knowledge- based, such as communication
and IT services and the use of intellectual prop-
erty, but also in the transport sector. These
three sub- accounts significantly helped to im-
prove the services account balance overall. By
contrast, other business services, which include
research and development, professional, tech-
nical and commercial services as well as man-
agement consulting services, showed very little
momentum on the revenue and the expend-
iture side alike. Over the last decade, these ser-
vices had shown very sharp growth in some
cases as a result of the increasingly international
division of labour in the services sector, too.
The same applies to cross- border fees for finan-
cial and insurance services.
The largest item in the services sector in abso-
lute terms is cross- border travel, which re-
corded a deficit of €43½ billion. Sharp in-
creases in residents’ income over the past few
years saw travel expenditure go up by almost
one- tenth in 2017. This high level was exceeded
by only a small margin in 2018. There was
barely any change in terms of travel destin-
ations. Since Germany became somewhat
more attractive as a travel destination for non-
residents, the deficit remained virtually un-
changed on the year.
The primary income received by Germany from
the rest of the world, which comprises com-
pensation of employees, investment income
and other primary income, exceeded payments
in this item to the rest of the world by €91½
billion last year. As cross- border flows in com-
pensation of employees and in other primary
income offset each other to result in small bal-
ances as in previous years, net revenue from
international investment was the main source
of primary income. According to provisional
calculations, this went up by €11 billion to
€93½ billion in the reporting year, having al-
ready risen sharply in the three years before
… because revenue vis- à- vis the euro area increased
Above- average growth in knowledge- based services and transport sector
Little change in travel services
Considerable rise in the invest-ment income surplus
Key indicators of the cross-border
investment income balance
1 Direct, portofolio and other investment and reserve assets. Excluding financial derivatives. According to international in-vestment position. 2 According to balance of payments. 3 Yields shown in terms of cross-border investment in-come/expenditure as a percentage of the annual average levels of foreign assets and liabilities. 4 For the IIP as at the end of 2018 Q3.
Deutsche Bundesbank
1999 00 05 10 15 18
– 30
0
+ 30
+ 60
+ 90
€ billion
€ billion
0
300
600
900
1,200
1,500
1,800
%
1
2
3
4
5Yield 3
Net external assets1
Investmentincome balance 2
(enlarged scale)
Assets
Liabilities
4
Deutsche Bundesbank Monthly Report March 2019 30
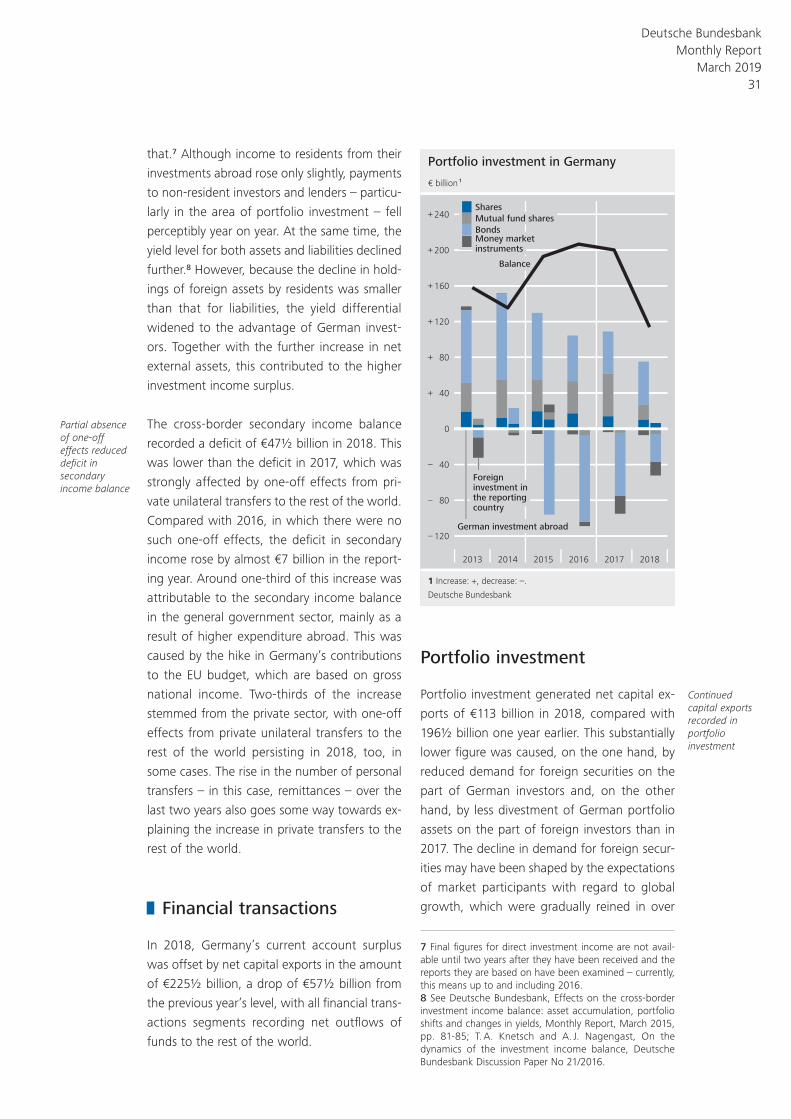
that.7 Although income to residents from their
investments abroad rose only slightly, payments
to non- resident investors and lenders – particu-
larly in the area of portfolio investment – fell
perceptibly year on year. At the same time, the
yield level for both assets and liabilities declined
further.8 However, because the decline in hold-
ings of foreign assets by residents was smaller
than that for liabilities, the yield differential
widened to the advantage of German invest-
ors. Together with the further increase in net
external assets, this contributed to the higher
investment income surplus.
The cross- border secondary income balance
recorded a deficit of €47½ billion in 2018. This
was lower than the deficit in 2017, which was
strongly affected by one- off effects from pri-
vate unilateral transfers to the rest of the world.
Compared with 2016, in which there were no
such one- off effects, the deficit in secondary
income rose by almost €7 billion in the report-
ing year. Around one- third of this increase was
attributable to the secondary income balance
in the general government sector, mainly as a
result of higher expenditure abroad. This was
caused by the hike in Germany’s contributions
to the EU budget, which are based on gross
national income. Two- thirds of the increase
stemmed from the private sector, with one- off
effects from private unilateral transfers to the
rest of the world persisting in 2018, too, in
some cases. The rise in the number of personal
transfers – in this case, remittances – over the
last two years also goes some way towards ex-
plaining the increase in private transfers to the
rest of the world.
Financial transactions
In 2018, Germany’s current account surplus
was offset by net capital exports in the amount
of €225½ billion, a drop of €57½ billion from
the previous year’s level, with all financial trans-
actions segments recording net outflows of
funds to the rest of the world.
Portfolio investment
Portfolio investment generated net capital ex-
ports of €113 billion in 2018, compared with
196½ billion one year earlier. This substantially
lower figure was caused, on the one hand, by
reduced demand for foreign securities on the
part of German investors and, on the other
hand, by less divestment of German portfolio
assets on the part of foreign investors than in
2017. The decline in demand for foreign secur-
ities may have been shaped by the expectations
of market participants with regard to global
growth, which were gradually reined in over
Partial absence of one- off effects reduced deficit in secondary income balance
Continued capital exports recorded in portfolio investment
Portfolio investment in Germany
1 Increase: +, decrease: –.
Deutsche Bundesbank
2013 2014 2015 2016 2017 2018
120
80
40
0
40
80
120
160
200
240
–
–
–
+
+
+
+
+
+
€ billion 1
German investment abroad
Foreign investment in the reporting country
Money market instruments
Bonds
Mutual fund shares
Shares
Balance
7 Final figures for direct investment income are not avail-able until two years after they have been received and the reports they are based on have been examined – currently, this means up to and including 2016.8 See Deutsche Bundesbank, Effects on the cross- border investment income balance: asset accumulation, portfolio shifts and changes in yields, Monthly Report, March 2015, pp. 81-85; T. A. Knetsch and A. J. Nagengast, On the dynamics of the investment income balance, Deutsche Bundesbank Discussion Paper No 21/ 2016.
Deutsche Bundesbank Monthly Report
March 2019 31
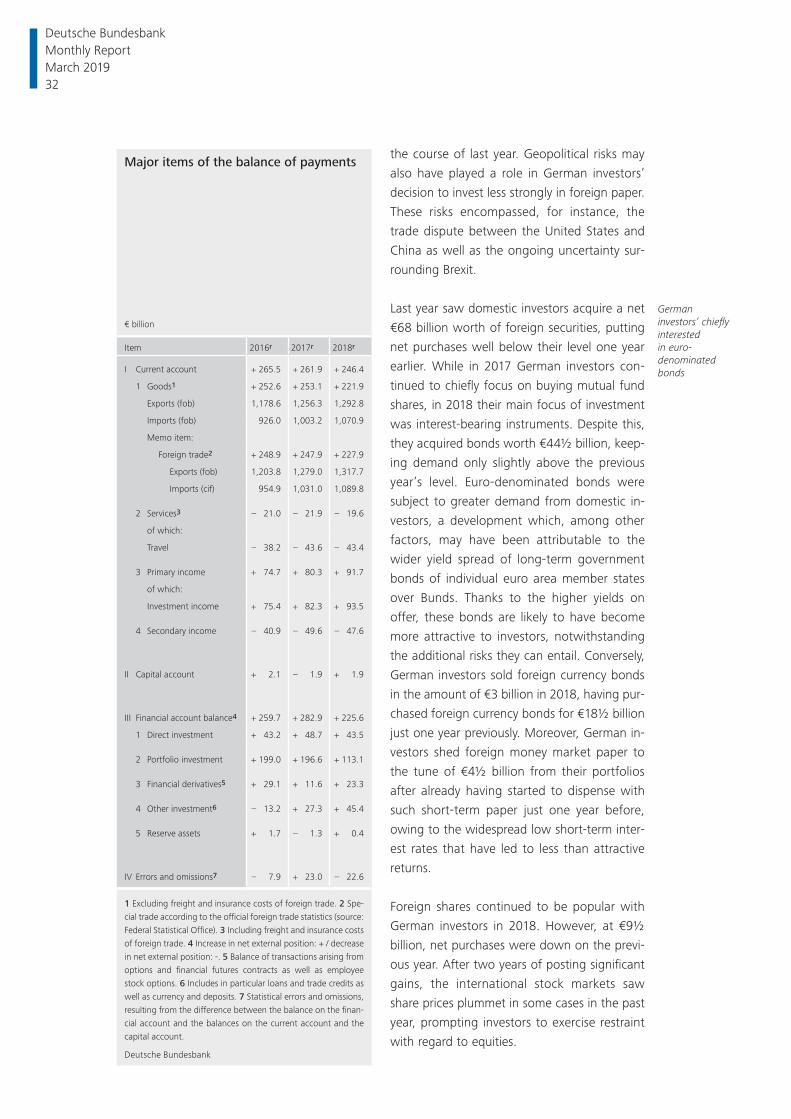
the course of last year. Geopolitical risks may
also have played a role in German investors’
decision to invest less strongly in foreign paper.
These risks encompassed, for instance, the
trade dispute between the United States and
China as well as the ongoing uncertainty sur-
rounding Brexit.
Last year saw domestic investors acquire a net
€68 billion worth of foreign securities, putting
net purchases well below their level one year
earlier. While in 2017 German investors con-
tinued to chiefly focus on buying mutual fund
shares, in 2018 their main focus of investment
was interest- bearing instruments. Despite this,
they acquired bonds worth €44½ billion, keep-
ing demand only slightly above the previous
year’s level. Euro- denominated bonds were
subject to greater demand from domestic in-
vestors, a development which, among other
factors, may have been attributable to the
wider yield spread of long- term government
bonds of individual euro area member states
over Bunds. Thanks to the higher yields on
offer, these bonds are likely to have become
more attractive to investors, notwithstanding
the additional risks they can entail. Conversely,
German investors sold foreign currency bonds
in the amount of €3 billion in 2018, having pur-
chased foreign currency bonds for €18½ billion
just one year previously. Moreover, German in-
vestors shed foreign money market paper to
the tune of €4½ billion from their portfolios
after already having started to dispense with
such short- term paper just one year before,
owing to the widespread low short- term inter-
est rates that have led to less than attractive
returns.
Foreign shares continued to be popular with
German investors in 2018. However, at €9½
billion, net purchases were down on the previ-
ous year. After two years of posting significant
gains, the international stock markets saw
share prices plummet in some cases in the past
year, prompting investors to exercise restraint
with regard to equities.
German investors’ chiefly interested in euro- denominated bonds
Major items of the balance of payments
€ billion
Item 2016r 2017r 2018r
I Current account + 265.5 + 261.9 + 246.4
1 Goods1 + 252.6 + 253.1 + 221.9
Exports (fob) 1,178.6 1,256.3 1,292.8
Imports (fob) 926.0 1,003.2 1,070.9
Memo item:
Foreign trade2 + 248.9 + 247.9 + 227.9
Exports (fob) 1,203.8 1,279.0 1,317.7
Imports (cif) 954.9 1,031.0 1,089.8
2 Services3 – 21.0 – 21.9 – 19.6
of which:
Travel – 38.2 – 43.6 – 43.4
3 Primary income + 74.7 + 80.3 + 91.7
of which:
Investment income + 75.4 + 82.3 + 93.5
4 Secondary income – 40.9 – 49.6 – 47.6
II Capital account + 2.1 – 1.9 + 1.9
III Financial account balance4 + 259.7 + 282.9 + 225.6
1 Direct investment + 43.2 + 48.7 + 43.5
2 Portfolio investment + 199.0 + 196.6 + 113.1
3 Financial derivatives5 + 29.1 + 11.6 + 23.3
4 Other investment6 – 13.2 + 27.3 + 45.4
5 Reserve assets + 1.7 – 1.3 + 0.4
IV Errors and omissions7 – 7.9 + 23.0 – 22.6
1 Excluding freight and insurance costs of foreign trade. 2 Spe-cial trade according to the offi cial foreign trade statistics (source: Federal Statistical Offi ce). 3 Including freight and insurance costs of foreign trade. 4 Increase in net external position: + / decrease in net external position: -. 5 Balance of transactions arising from options and fi nancial futures contracts as well as employee stock options. 6 Includes in particular loans and trade credits as well as currency and deposits. 7 Statistical errors and omissions, resulting from the difference between the balance on the fi nan-cial account and the balances on the current account and the capital account.
Deutsche Bundesbank
Deutsche Bundesbank Monthly Report March 2019 32
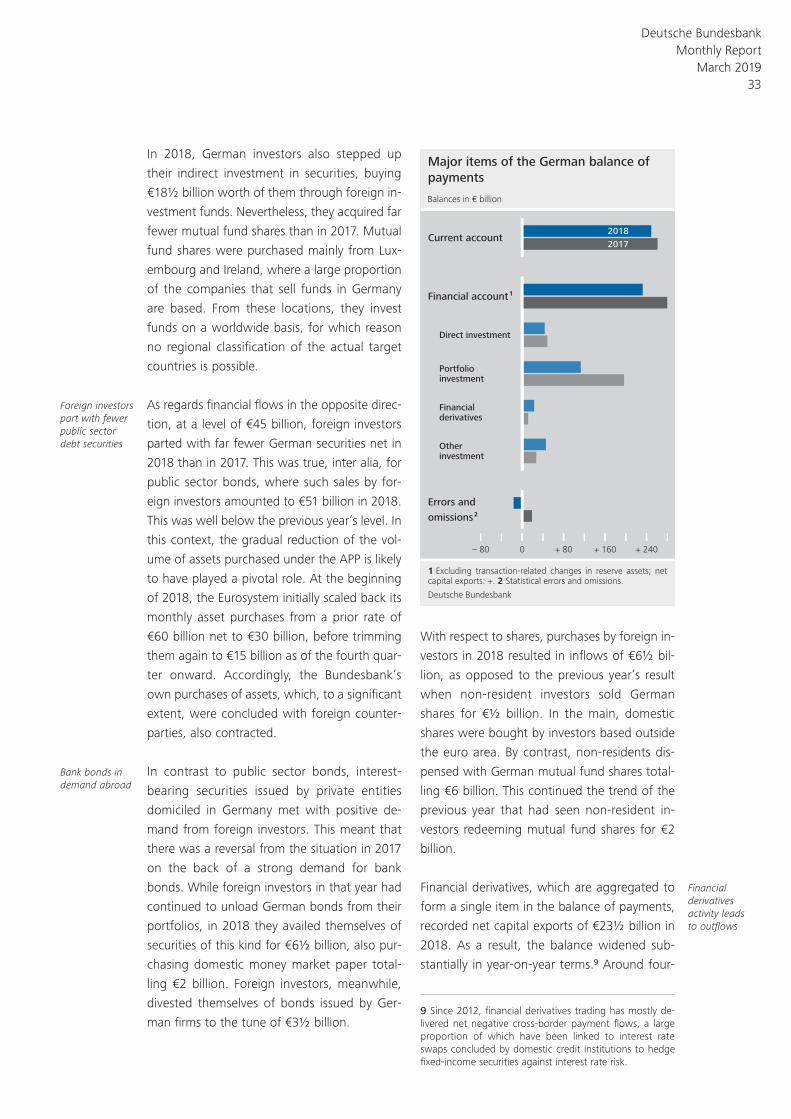
In 2018, German investors also stepped up
their indirect investment in securities, buying
€18½ billion worth of them through foreign in-
vestment funds. Nevertheless, they acquired far
fewer mutual fund shares than in 2017. Mutual
fund shares were purchased mainly from Lux-
embourg and Ireland, where a large proportion
of the companies that sell funds in Germany
are based. From these locations, they invest
funds on a worldwide basis, for which reason
no regional classification of the actual target
countries is possible.
As regards financial flows in the opposite direc-
tion, at a level of €45 billion, foreign investors
parted with far fewer German securities net in
2018 than in 2017. This was true, inter alia, for
public sector bonds, where such sales by for-
eign investors amounted to €51 billion in 2018.
This was well below the previous year’s level. In
this context, the gradual reduction of the vol-
ume of assets purchased under the APP is likely
to have played a pivotal role. At the beginning
of 2018, the Eurosystem initially scaled back its
monthly asset purchases from a prior rate of
€60 billion net to €30 billion, before trimming
them again to €15 billion as of the fourth quar-
ter onward. Accordingly, the Bundesbank’s
own purchases of assets, which, to a significant
extent, were concluded with foreign counter-
parties, also contracted.
In contrast to public sector bonds, interest-
bearing securities issued by private entities
domiciled in Germany met with positive de-
mand from foreign investors. This meant that
there was a reversal from the situation in 2017
on the back of a strong demand for bank
bonds. While foreign investors in that year had
continued to unload German bonds from their
portfolios, in 2018 they availed themselves of
securities of this kind for €6½ billion, also pur-
chasing domestic money market paper total-
ling €2 billion. Foreign investors, meanwhile,
divested themselves of bonds issued by Ger-
man firms to the tune of €3½ billion.
With respect to shares, purchases by foreign in-
vestors in 2018 resulted in inflows of €6½ bil-
lion, as opposed to the previous year’s result
when non- resident investors sold German
shares for €½ billion. In the main, domestic
shares were bought by investors based outside
the euro area. By contrast, non- residents dis-
pensed with German mutual fund shares total-
ling €6 billion. This continued the trend of the
previous year that had seen non- resident in-
vestors redeeming mutual fund shares for €2
billion.
Financial derivatives, which are aggregated to
form a single item in the balance of payments,
recorded net capital exports of €23½ billion in
2018. As a result, the balance widened sub-
stantially in year- on- year terms.9 Around four-
Foreign investors part with fewer public sector debt securities
Bank bonds in demand abroad
Financial derivatives activity leads to outflows
Major items of the German balance of
payments
1 Excluding transaction-related changes in reserve assets; net capital exports: +. 2 Statistical errors and omissions.
Deutsche Bundesbank
– 80 0 + 80 + 160 + 240
Balances in € billion
Current account
Financialderivatives
Otherinvestment
Direct investment
Portfolioinvestment
Errors and
omissions 2
Financial account 1
2018
2017
9 Since 2012, financial derivatives trading has mostly de-livered net negative cross- border payment flows, a large proportion of which have been linked to interest rate swaps concluded by domestic credit institutions to hedge fixed- income securities against interest rate risk.
Deutsche Bundesbank Monthly Report
March 2019 33
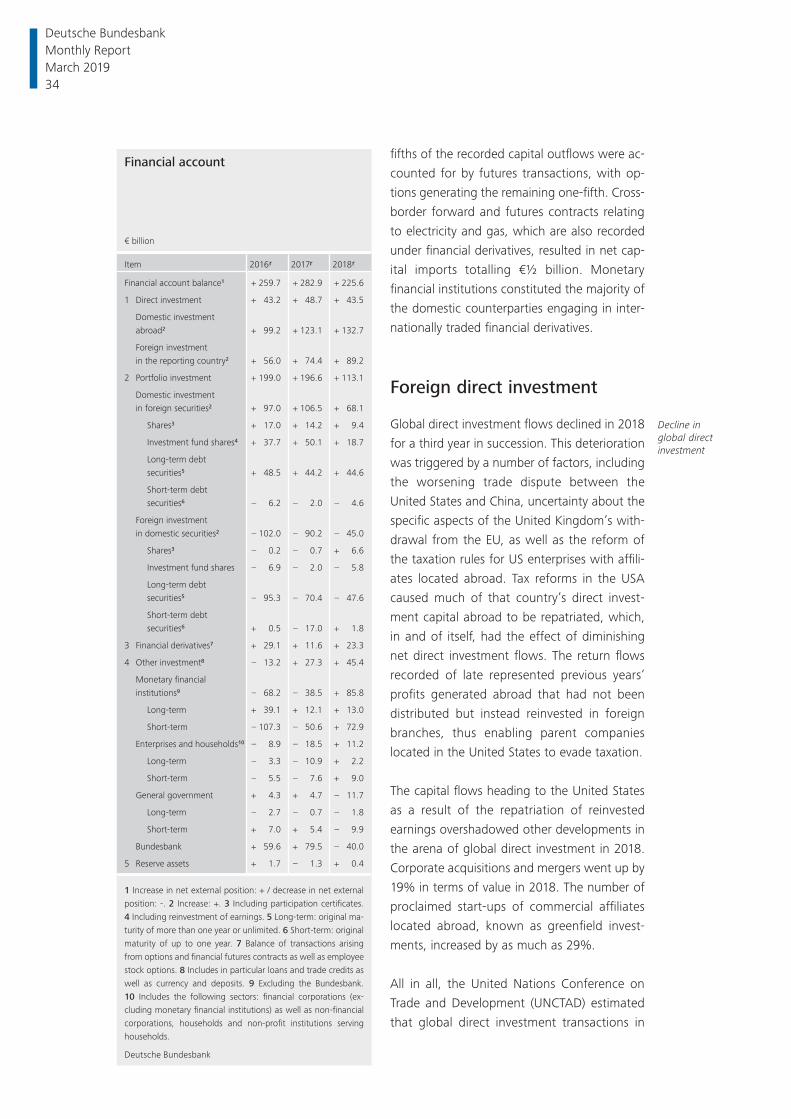
fifths of the recorded capital outflows were ac-
counted for by futures transactions, with op-
tions generating the remaining one- fifth. Cross-
border forward and futures contracts relating
to electricity and gas, which are also recorded
under financial derivatives, resulted in net cap-
ital imports totalling €½ billion. Monetary
finan cial institutions constituted the majority of
the domestic counterparties engaging in inter-
nationally traded financial derivatives.
Foreign direct investment
Global direct investment flows declined in 2018
for a third year in succession. This deterioration
was triggered by a number of factors, including
the worsening trade dispute between the
United States and China, uncertainty about the
specific aspects of the United Kingdom’s with-
drawal from the EU, as well as the reform of
the taxation rules for US enterprises with affili-
ates located abroad. Tax reforms in the USA
caused much of that country’s direct invest-
ment capital abroad to be repatriated, which,
in and of itself, had the effect of diminishing
net direct investment flows. The return flows
recorded of late represented previous years’
profits generated abroad that had not been
distributed but instead reinvested in foreign
branches, thus enabling parent companies
located in the United States to evade taxation.
The capital flows heading to the United States
as a result of the repatriation of reinvested
earnings overshadowed other developments in
the arena of global direct investment in 2018.
Corporate acquisitions and mergers went up by
19% in terms of value in 2018. The number of
proclaimed start- ups of commercial affiliates
located abroad, known as greenfield invest-
ments, increased by as much as 29%.
All in all, the United Nations Conference on
Trade and Development (UNCTAD) estimated
that global direct investment transactions in
Decline in global direct investment
Financial account
€ billion
Item 2016r 2017r 2018r
Financial account balance1 + 259.7 + 282.9 + 225.6
1 Direct investment + 43.2 + 48.7 + 43.5
Domestic investment abroad2 + 99.2 + 123.1 + 132.7
Foreign investment in the reporting country2 + 56.0 + 74.4 + 89.2
2 Portfolio investment + 199.0 + 196.6 + 113.1
Domestic investment in foreign securities2 + 97.0 + 106.5 + 68.1
Shares3 + 17.0 + 14.2 + 9.4
Investment fund shares4 + 37.7 + 50.1 + 18.7
Long-term debt securities5 + 48.5 + 44.2 + 44.6
Short-term debt securities6 – 6.2 – 2.0 – 4.6
Foreign investment in domestic securities2 – 102.0 – 90.2 – 45.0
Shares3 – 0.2 – 0.7 + 6.6
Investment fund shares – 6.9 – 2.0 – 5.8
Long-term debt securities5 – 95.3 – 70.4 – 47.6
Short-term debt securities6 + 0.5 – 17.0 + 1.8
3 Financial derivatives7 + 29.1 + 11.6 + 23.3
4 Other investment8 – 13.2 + 27.3 + 45.4
Monetary fi nancial institutions9 – 68.2 – 38.5 + 85.8
Long-term + 39.1 + 12.1 + 13.0
Short-term – 107.3 – 50.6 + 72.9
Enterprises and households10 – 8.9 – 18.5 + 11.2
Long-term – 3.3 – 10.9 + 2.2
Short-term – 5.5 – 7.6 + 9.0
General government + 4.3 + 4.7 – 11.7
Long-term – 2.7 – 0.7 – 1.8
Short-term + 7.0 + 5.4 – 9.9
Bundesbank + 59.6 + 79.5 – 40.0
5 Reserve assets + 1.7 – 1.3 + 0.4
1 Increase in net external position: + / decrease in net external position: -. 2 Increase: +. 3 Including participation certifi cates. 4 Including reinvestment of earnings. 5 Long- term: original ma-turity of more than one year or unlimited. 6 Short- term: original maturity of up to one year. 7 Balance of transactions arising from options and fi nancial futures contracts as well as employee stock options. 8 Includes in particular loans and trade credits as well as currency and deposits. 9 Excluding the Bundesbank. 10 Includes the following sectors: fi nancial corporations (ex-cluding monetary fi nancial institutions) as well as non- fi nancial corporations, households and non- profi t institutions serving households.
Deutsche Bundesbank
Deutsche Bundesbank Monthly Report March 2019 34
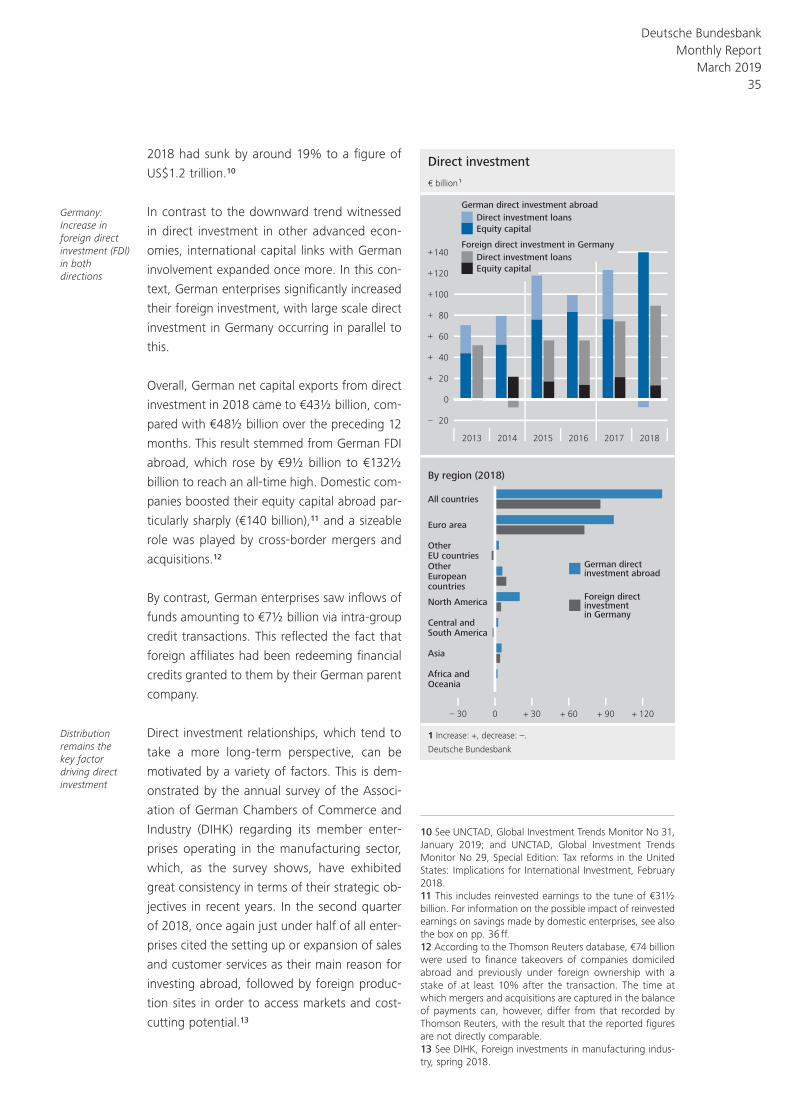
2018 had sunk by around 19% to a figure of
US$1.2 trillion.10
In contrast to the downward trend witnessed
in direct investment in other advanced econ-
omies, international capital links with German
involvement expanded once more. In this con-
text, German enterprises significantly increased
their foreign investment, with large scale direct
investment in Germany occurring in parallel to
this.
Overall, German net capital exports from direct
investment in 2018 came to €43½ billion, com-
pared with €48½ billion over the preceding 12
months. This result stemmed from German FDI
abroad, which rose by €9½ billion to €132½
billion to reach an all- time high. Domestic com-
panies boosted their equity capital abroad par-
ticularly sharply (€140 billion),11 and a sizeable
role was played by cross- border mergers and
acquisitions.12
By contrast, German enterprises saw inflows of
funds amounting to €7½ billion via intra- group
credit transactions. This reflected the fact that
foreign affiliates had been redeeming financial
credits granted to them by their German parent
company.
Direct investment relationships, which tend to
take a more long- term perspective, can be
motivated by a variety of factors. This is dem-
onstrated by the annual survey of the Associ-
ation of German Chambers of Commerce and
Industry (DIHK) regarding its member enter-
prises operating in the manufacturing sector,
which, as the survey shows, have exhibited
great consistency in terms of their strategic ob-
jectives in recent years. In the second quarter
of 2018, once again just under half of all enter-
prises cited the setting up or expansion of sales
and customer services as their main reason for
investing abroad, followed by foreign produc-
tion sites in order to access markets and cost-
cutting potential.13
Germany: Increase in foreign direct investment (FDI) in both directions
Distribution remains the key factor driving direct investment
Direct investment
1 Increase: +, decrease: –.
Deutsche Bundesbank
2013 2014 2015 2016 2017 2018
20
0
20
40
60
80
100
120
140
–
+
+
+
+
+
+
+
– 30 0 + 30 + 60 + 90 + 120
€ billion 1
By region (2018)
German directinvestment abroad
All countries
Euro area
OtherEU countriesOtherEuropean countries
Foreign directinvestmentin Germany
North America
Central andSouth America
Direct investment loans
Asia
Africa andOceania
Equity capital
Foreign direct investment in Germany
German direct investment abroad
Direct investment loans
Equity capital
10 See UNCTAD, Global Investment Trends Monitor No 31, January 2019; and UNCTAD, Global Investment Trends Monitor No 29, Special Edition: Tax reforms in the United States: Implications for International Investment, February 2018.11 This includes reinvested earnings to the tune of €31½ billion. For information on the possible impact of reinvested earnings on savings made by domestic enterprises, see also the box on pp. 36 ff.12 According to the Thomson Reuters database, €74 billion were used to finance takeovers of companies domiciled abroad and previously under foreign ownership with a stake of at least 10% after the transaction. The time at which mergers and acquisitions are captured in the balance of payments can, however, differ from that recorded by Thomson Reuters, with the result that the reported figures are not directly comparable.13 See DIHK, Foreign investments in manufacturing indus-try, spring 2018.
Deutsche Bundesbank Monthly Report
March 2019 35
The relationship between domestic corporate savings and foreign direct investment, as well as the role of reinvested earnings
For years now, “Germans” have been sav-
ing more than they invest. This savings sur-
plus is refl ected in net capital exports. A
sectoral analysis shows that non- fi nancial
corporations play an important role with re-
gard to savings surpluses in Germany, al-
though the positive net lending/ net bor-
rowing position has been declining slightly
since 2016.1 Back in 2001, the difference
between savings and investment was still
negative for non- fi nancial corporations.
From then until 2016, this net lending/ net
borrowing position rose relatively steadily.
In this context, not just funding opportun-
ities via capital markets (e.g. through the
issuance of equities and bonds) were im-
portant but also the low interest rate envir-
onment. It is in this connection that the role
played by foreign direct investment in cor-
porate savings is also discussed.2 This article
examines the extent to which a potential
relationship exists between German foreign
direct investment and the net lending/ net
borrowing position of domestic enterprises,
and the question of what factors affect do-
mestic parent companies’ reinvested earn-
ings with foreign affi liates. Unlike domestic
fi xed asset formation, investment abroad
does not have a direct impact on the do-
mestic savings- investment gap (net lending/
net borrowing). However, foreign direct in-
vestment enterprises usually generate
profi ts that are also refl ected in the parent
company’s profi ts reported in Germany, ir-
respective of whether they are distributed
to the parent company or are retained by
the affi liate.3 The part of the corporate
profi ts that is not distributed but reinvested
represents the savings generated by that
company. At the same time, the retained
earnings of a foreign affi liate increase direct
investment abroad. Hence, an indirect rela-
tionship may come about between foreign
direct investment and the savings by the
German parent company.
Yet looking at the relationship between for-
eign direct investment and corporate sav-
ings purely in accounting terms does not go
far enough. This approach only indicates ex
post that a relationship may potentially exist
– but not necessarily. Since it may be as-
sumed that international enterprises are
characterised by strategic corporate plan-
ning, however, there may also be economic
reasons for the idea that the (planned) cor-
porate savings might be affected by in-
tended foreign direct investment. For ex-
ample, it is conceivable that enterprises
save more specifi cally because they would
like to engage in foreign direct investment.
This hypothesis can be assessed economet-
rically in a number of ways. A Bundesbank
estimate with macroeconomic variables ini-
tially provides no indication of a systematic
correlation between German direct invest-
ment abroad and domestic corporate sav-
ings. However, this does not rule out the
possibility that such a correlation might
exist at the enterprise level. On aggregate,
it is possible that, at the macro level, a sys-
1 See Deutsche Bundesbank, German balance of pay-ments in 2017, Monthly Report, March 2018, p. 20.2 See Project Group Joint Economic Forecast, Joint Economic Forecast Autumn 2017. Upturn remains ro-bust – amid mounting tensions, pp. 65 ff.3 In 2018, the foreign affi liates of German enterprises generated earnings totalling an estimated €92.5 bil-lion. Of this amount, the foreign affi liates retained €31.5 billion and distributed the remainder to the par-ent companies. By comparison, the savings of non- fi nancial corporations in Germany came to €101.6 bil-lion in 2018.
Deutsche Bundesbank Monthly Report March 2019 36
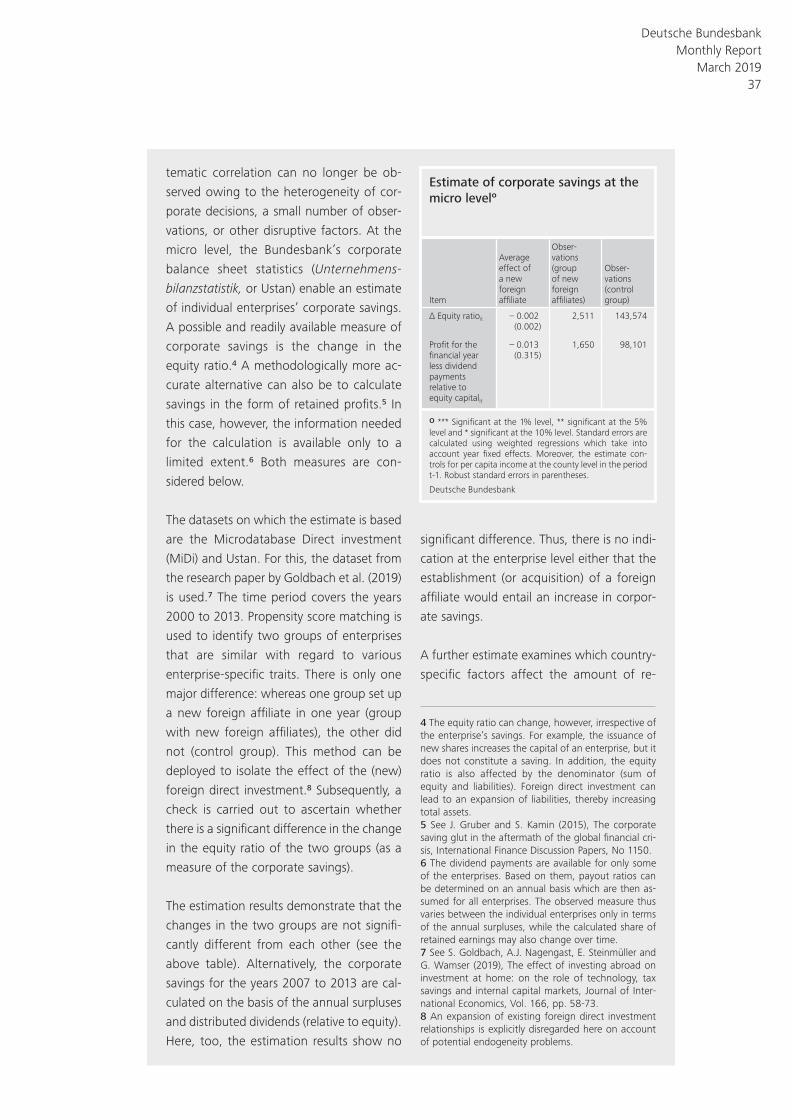
tematic correlation can no longer be ob-
served owing to the heterogeneity of cor-
porate decisions, a small number of obser-
vations, or other disruptive factors. At the
micro level, the Bundesbank’s corporate
balance sheet statistics (Unternehmens-
bilanzstatistik, or Ustan) enable an estimate
of individual enterprises’ corporate savings.
A possible and readily available measure of
corporate savings is the change in the
equity ratio.4 A methodologically more ac-
curate alternative can also be to calculate
savings in the form of retained profi ts.5 In
this case, however, the information needed
for the calculation is available only to a
limited extent.6 Both measures are con-
sidered below.
The datasets on which the estimate is based
are the Microdatabase Direct investment
(MiDi) and Ustan. For this, the dataset from
the research paper by Goldbach et al. (2019)
is used.7 The time period covers the years
2000 to 2013. Propensity score matching is
used to identify two groups of enterprises
that are similar with regard to various
enterprise- specifi c traits. There is only one
major difference: whereas one group set up
a new foreign affi liate in one year (group
with new foreign affi liates), the other did
not (control group). This method can be
deployed to isolate the effect of the (new)
foreign direct investment.8 Subsequently, a
check is carried out to ascertain whether
there is a signifi cant difference in the change
in the equity ratio of the two groups (as a
measure of the corporate savings).
The estimation results demonstrate that the
changes in the two groups are not signifi -
cantly different from each other (see the
above table). Alternatively, the corporate
savings for the years 2007 to 2013 are cal-
culated on the basis of the annual surpluses
and distributed dividends (relative to equity).
Here, too, the estimation results show no
signifi cant difference. Thus, there is no indi-
cation at the enterprise level either that the
establishment (or acquisition) of a foreign
affi liate would entail an increase in corpor-
ate savings.
A further estimate examines which country-
specifi c factors affect the amount of re-
4 The equity ratio can change, however, irrespective of the enterprise’s savings. For example, the issuance of new shares increases the capital of an enterprise, but it does not constitute a saving. In addition, the equity ratio is also affected by the denominator (sum of equity and liabilities). Foreign direct investment can lead to an expansion of liabilities, thereby increasing total assets.5 See J. Gruber and S. Kamin (2015), The corporate saving glut in the aftermath of the global fi nancial cri-sis, International Finance Discussion Papers, No 1150.6 The dividend payments are available for only some of the enterprises. Based on them, payout ratios can be determined on an annual basis which are then as-sumed for all enterprises. The observed measure thus varies between the individual enterprises only in terms of the annual surpluses, while the calculated share of retained earnings may also change over time.7 See S. Goldbach, A.J. Nagengast, E. Steinmüller and G. Wamser (2019), The effect of investing abroad on investment at home: on the role of technology, tax savings and internal capital markets, Journal of Inter-national Economics, Vol. 166, pp. 58-73.8 An expansion of existing foreign direct investment relationships is explicitly disregarded here on account of potential endogeneity problems.
Estimate of corporate savings at the micro levelo
Item
Average effect of a new foreign affi liate
Obser-vations (group of new foreign affi liates )
Obser-vations (control group)
Δ Equity ratioit – 0.002 2,511 143,574(0.002)
Profi t for the fi nancial year less dividend payments relative to equity capitalit
– 0.013 1,650 98,101(0.315)
o *** Signifi cant at the 1% level, ** signifi cant at the 5% level and * signifi cant at the 10% level. Standard errors are calculated using weighted regressions which take into account year fi xed effects. Moreover, the estimate con-trols for per capita income at the county level in the period t-1. Robust standard errors in parentheses.
Deutsche Bundesbank
Deutsche Bundesbank Monthly Report
March 2019 37
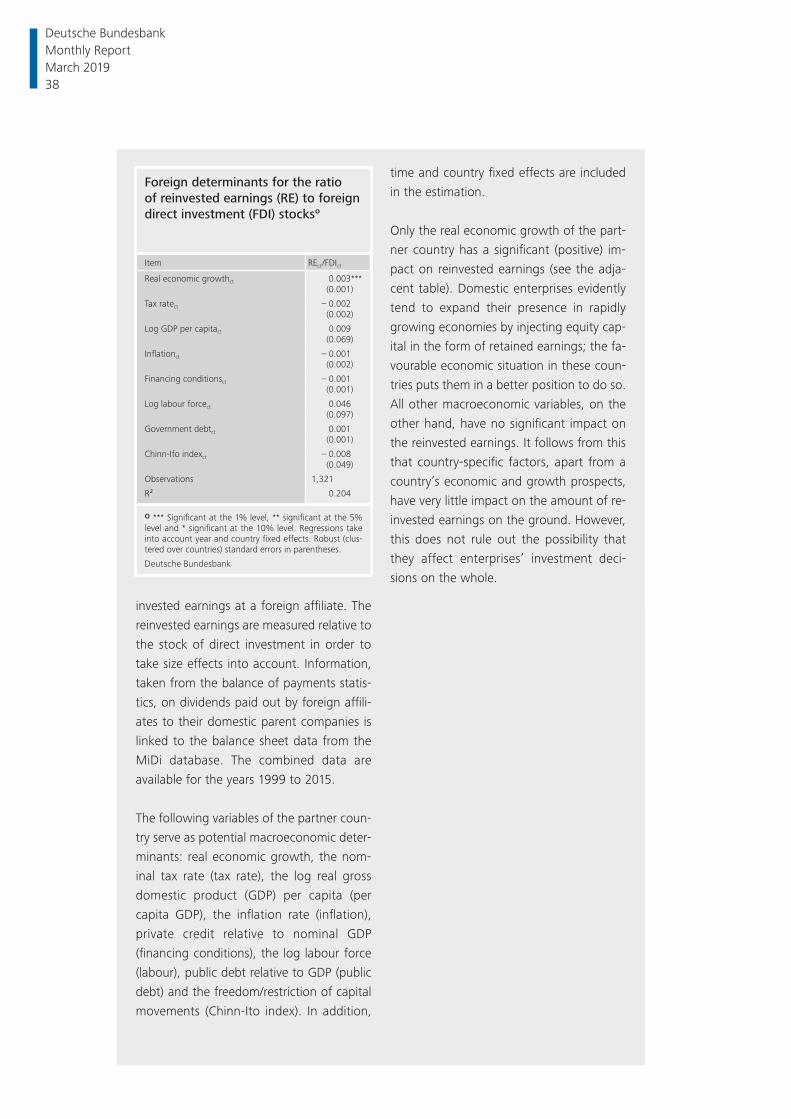
invested earnings at a foreign affi liate. The
reinvested earnings are measured relative to
the stock of direct investment in order to
take size effects into account. Information,
taken from the balance of payments statis-
tics, on dividends paid out by foreign affi li-
ates to their domestic parent companies is
linked to the balance sheet data from the
MiDi database. The combined data are
available for the years 1999 to 2015.
The following variables of the partner coun-
try serve as potential macroeconomic deter-
minants: real economic growth, the nom-
inal tax rate (tax rate), the log real gross
domestic product (GDP) per capita (per
capita GDP), the infl ation rate (infl ation),
private credit relative to nominal GDP
(fi nancing conditions), the log labour force
(labour), public debt relative to GDP (public
debt) and the freedom/ restriction of capital
movements (Chinn- Ito index). In addition,
time and country fi xed effects are included
in the estimation.
Only the real economic growth of the part-
ner country has a signifi cant (positive) im-
pact on reinvested earnings (see the adja-
cent table). Domestic enterprises evidently
tend to expand their presence in rapidly
growing economies by injecting equity cap-
ital in the form of retained earnings; the fa-
vourable economic situation in these coun-
tries puts them in a better position to do so.
All other macroeconomic variables, on the
other hand, have no signifi cant impact on
the reinvested earnings. It follows from this
that country- specifi c factors, apart from a
country’s economic and growth prospects,
have very little impact on the amount of re-
invested earnings on the ground. However,
this does not rule out the possibility that
they affect enterprises’ investment deci-
sions on the whole.
Foreign determinants for the ratio of reinvested earnings (RE) to foreign direct investment (FDI) stockso
Item REct /FDIct
Real economic growthct 0.003***(0.001)
Tax ratect – 0.002(0.002)
Log GDP per capitact 0.009(0.069)
Infl ationct – 0.001(0.002)
Financing conditionsct – 0.001(0.001)
Log labour forcect 0.046(0.097)
Government debtct 0.001(0.001)
Chinn-Ifo indexct – 0.008(0.049)
Observations 1,321
R² 0.204
o *** Signifi cant at the 1% level, ** signifi cant at the 5% level and * signifi cant at the 10% level. Regressions take into account year and country fi xed effects. Robust (clus-tered over countries) standard errors in parentheses.
Deutsche Bundesbank
Deutsche Bundesbank Monthly Report March 2019 38
Of the preferred target regions, the euro area
was able to strengthen its position, according
to the survey, as evidenced by the figures on
direct investment included in the balance of
payments. Together, the other member states
of the euro area accounted for just under two-
thirds of domestic enterprises’ direct invest-
ment. Around three- quarters of German for-
eign investment in the euro area was focused
on the financial centres of the Netherlands, Ire-
land and Luxembourg.14 Meanwhile, the United
Kingdom lost its 2017 standing as the main
destination for German direct investment
among other EU countries and found itself
facing capital withdrawals. As outlined above,
this may be a product of the uncertainty eman-
ating from the UK’s planned Brexit. Outside
Europe, the United States proved to be a major
target country.
Those German enterprises that ramped up their
equity capital abroad came from various
branches of industry. Constituting more than
one- third of the total, providers of professional
and technical services were responsible for the
lion’s share, with holding companies occupying
a prominent position here. Just under one- third
of the equity capital15 was attributable to enter-
prises from the area of financial and insurance
services, and the same amount again was
attrib utable to the manufacturing sector. In the
case of the latter, manufacturers of pharma-
ceutical products, as well as of transport equip-
ment played an instrumental role.
Foreign companies stepped up their provision
of fresh direct investment funds to associated
enterprises domiciled in Germany, channelling
net inflows of €89 billion to them. This repre-
sented an increase of €15 billion compared
with the previous year. As for capital inflows,
intra- group lending (€76 billion) continued to
dominate proceedings and, once again, the
driving force in this regard came from foreign
subsidiaries granting financial credits to their
German parent companies. These totalled €68
billion, thus achieving a new record high. These
reverse flows are often the result of capital
market business involving German enterprises’
financing subsidiaries, whereby securities are
issued abroad and the proceeds are forwarded
to the parent companies in Germany. German
groups evidently took extensive advantage of
the favourable market conditions in the last
year as a way of absorbing funds. Moreover,
foreign owners also boosted the equity capital
they provided to German branches by €13½
billion.
In terms of country of origin, euro area firms
represented the largest component in 2018, at
around 85%, with more than half of all direct
investment inflows to Germany coming from
the Netherlands. Dutch- based financial subsid-
iaries, in particular, provided their German par-
ent companies with capital. In 2018, these
reverse flows also played a decisive role with
respect to capital inflows deriving from Ireland
and the United States. Further significant cap-
ital inflows originated in Switzerland, where,
first and foremost, affiliated companies granted
loans to their German sister companies. By
contrast, Chinese enterprises did not play an
important role as investors in Germany in 2018.
In previous years they had, for the most part,
made investments in foreign countries other
than Germany, despite having executed some
high- profile acquisitions on German turf.
Other investment
Other investment, comprising financial and
trade credits (where these do not constitute a
part of direct investment) as well as bank de-
posits and other assets, resulted in net capital
exports of €45½ billion in 2018, up from €27½
billion in 2017.
Most investment destined for the euro area
Holding companies especially active
Capital inflows in the form of intra- group credit transactions
Most inward direct investment originated in the Netherlands
Net capital exports in other investment
14 The aforementioned countries are major holding loca-tions for internationally active enterprises. As the balance of payments only captures the immediate counterparties of cross- border transactions, it is not possible to identify where the transferred funds are ultimately invested.15 Reinvested earnings cannot be assigned to individual economic sectors and were therefore not taken into ac-count when making this calculation. By the same token, the shares only relate to classifiable net transfers.
Deutsche Bundesbank Monthly Report
March 2019 39
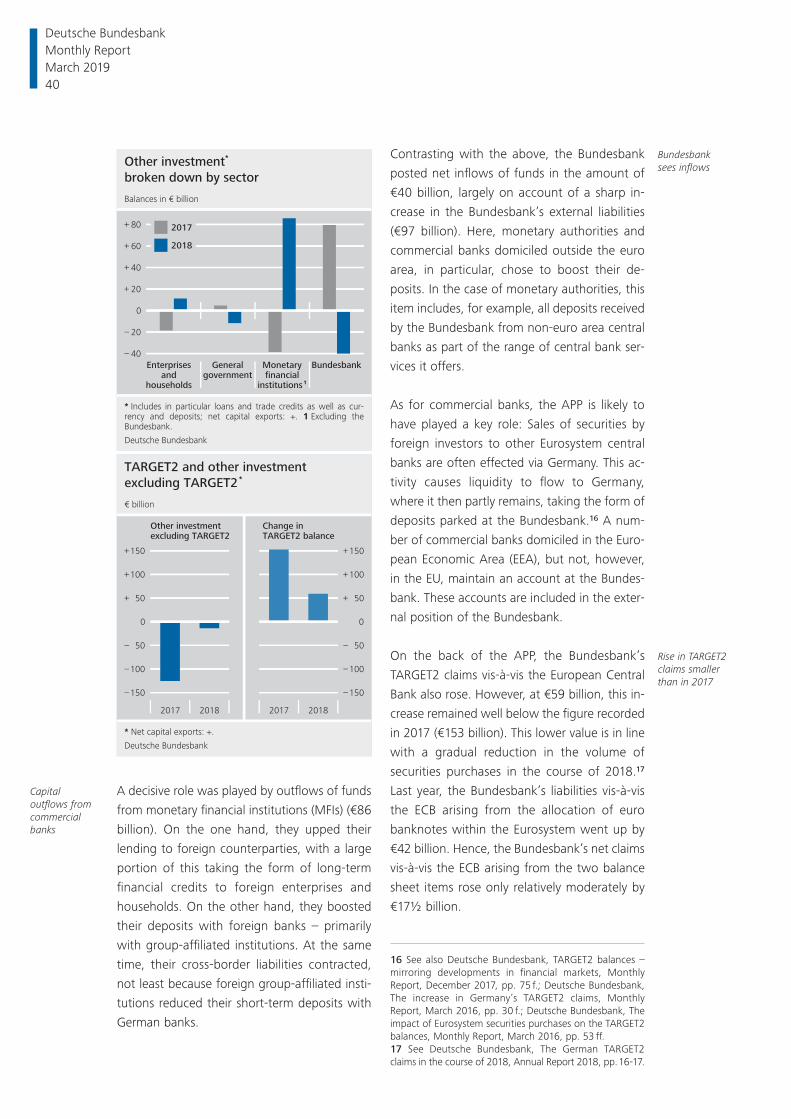
A decisive role was played by outflows of funds
from monetary financial institutions (MFIs) (€86
billion). On the one hand, they upped their
lending to foreign counterparties, with a large
portion of this taking the form of long- term
finan cial credits to foreign enterprises and
households. On the other hand, they boosted
their deposits with foreign banks – primarily
with group- affiliated institutions. At the same
time, their cross- border liabilities contracted,
not least because foreign group- affiliated insti-
tutions reduced their short- term deposits with
German banks.
Contrasting with the above, the Bundesbank
posted net inflows of funds in the amount of
€40 billion, largely on account of a sharp in-
crease in the Bundesbank’s external liabilities
(€97 billion). Here, monetary authorities and
commercial banks domiciled outside the euro
area, in particular, chose to boost their de-
posits. In the case of monetary authorities, this
item includes, for example, all deposits received
by the Bundesbank from non- euro area central
banks as part of the range of central bank ser-
vices it offers.
As for commercial banks, the APP is likely to
have played a key role: Sales of securities by
foreign investors to other Eurosystem central
banks are often effected via Germany. This ac-
tivity causes liquidity to flow to Germany,
where it then partly remains, taking the form of
deposits parked at the Bundesbank.16 A num-
ber of commercial banks domiciled in the Euro-
pean Economic Area (EEA), but not, however,
in the EU, maintain an account at the Bundes-
bank. These accounts are included in the exter-
nal position of the Bundesbank.
On the back of the APP, the Bundesbank’s
TARGET2 claims vis- à- vis the European Central
Bank also rose. However, at €59 billion, this in-
crease remained well below the figure recorded
in 2017 (€153 billion). This lower value is in line
with a gradual reduction in the volume of
secur ities purchases in the course of 2018.17
Last year, the Bundesbank’s liabilities vis- à- vis
the ECB arising from the allocation of euro
banknotes within the Eurosystem went up by
€42 billion. Hence, the Bundesbank’s net claims
vis- à- vis the ECB arising from the two balance
sheet items rose only relatively moderately by
€17½ billion.
Capital outflows from commercial banks
Bundesbank sees inflows
Rise in TARGET2 claims smaller than in 2017
Other investment*
broken down by sector
* Includes in particular loans and trade credits as well as cur-rency and deposits; net capital exports: +. 1 Excluding the Bundesbank.
Deutsche Bundesbank
Balances in € billion
40
20
0
20
40
60
80
–
–
+
+
+
+
Enterprisesand
households
Generalgovernment
BundesbankMonetaryfinancial
institutions 1
2017
2018
TARGET2 and other investment
excluding TARGET2 *
* Net capital exports: +.
Deutsche Bundesbank
2017 2018
150
100
50
0
50
100
150
–
–
–
+
+
+
€ billion
– 150
– 100
– 50
0
+ 50
+100
+150
Other investmentexcluding TARGET2
Change inTARGET2 balance
2017 2018
16 See also Deutsche Bundesbank, TARGET2 balances – mirroring developments in financial markets, Monthly Report , December 2017, pp. 75 f.; Deutsche Bundesbank, The increase in Germany’s TARGET2 claims, Monthly Report , March 2016, pp. 30 f.; Deutsche Bundesbank, The impact of Eurosystem securities purchases on the TARGET2 balances, Monthly Report, March 2016, pp. 53 ff.17 See Deutsche Bundesbank, The German TARGET2 claims in the course of 2018, Annual Report 2018, pp. 16-17.
Deutsche Bundesbank Monthly Report March 2019 40
Non- banks attracted modest net inflows of
funds from abroad over the past year (€½ bil-
lion), reflecting the net inflows accruing to gen-
eral government (€11½ billion). Above all, the
latter reduced its deposits held abroad and
scaled back its cross- border lending. By con-
trast, enterprises and households experienced
outflows of funds (€11 billion). In particular,
they augmented their overnight deposits held
at foreign commercial banks.
Reserve assets
Driven by transactions, the Bundesbank’s re-
serve assets increased by €½ billion in 2018.
This increase was attributable to Germany’s
higher reserve position with the International
Monetary Fund (IMF).
The international reserve holdings are also in-
fluenced by balance sheet adjustments which,
in compliance with internationally agreed ac-
counting standards, are not recognised in the
balance of payments. The revaluation also gen-
erated an increase in 2018 (€6 billion), due in
large part to rising gold prices and the higher
valuation of the securities owing to exchange
rate changes. All in all, the year 2018 saw the
carrying amount of Germany’s reserve assets
climb by €6½ billion to €173 billion as at
31 December 2018.
Non- banks attract net capital imports
Slight increase in reserve assets
Deutsche Bundesbank Monthly Report
March 2019 41

Deutsche Bundesbank Monthly Report March 2019 42
Cash demand in the shadow economy
Cash payments are simple, secure, efficient and anonymous, which is why consumers use cash to
pay for almost three- quarters of their purchases at the point of sale. At the same time, these char-
acteristics also make cash a focal point for potential illegal uses. An oft- voiced opinion in the
public debate is that cash promotes the shadow economy and is used as a means of financing
crime. There are calls for regulatory measures to restrict the use of cash in view of what is pre-
sumed to be its widespread use for illegal purposes. Against this backdrop, the present article
makes an empirical study of the use of cash in the shadow economy as well as in connection with
related areas such as money laundering, terrorist financing and other criminal activities.
The illegal nature of such activities means that it is very difficult to provide hard research- based
evidence about the scale of the cash demand resulting from the shadow economy and criminal-
ity. Empirical studies of the shadow economy are therefore subject to more than average uncer-
tainty, meaning that all results should be interpreted with caution. It is often the case that anec-
dotal evidence is drawn on, taking as its direct starting point the volume of cash in circulation or
the demand for large- denomination banknotes. The currency demand approach is a model
framework for the empirically founded study of the scale of illicit cash usage. Our own economet-
ric estimations adopting this approach examine whether cash lodgements made at the Bundes-
bank’s branches and the estimated domestic demand for euro banknotes in Germany are linked
to activities in the shadow economy.
However, cash is not the sole payment instrument used either in the shadow economy or to
finance crime. As part of the general trend towards digitalisation, alternative payment instru-
ments are gaining significant ground, particularly in connection with settlement via the internet
or darknet.
Deutsche Bundesbank Monthly Report
March 2019 43
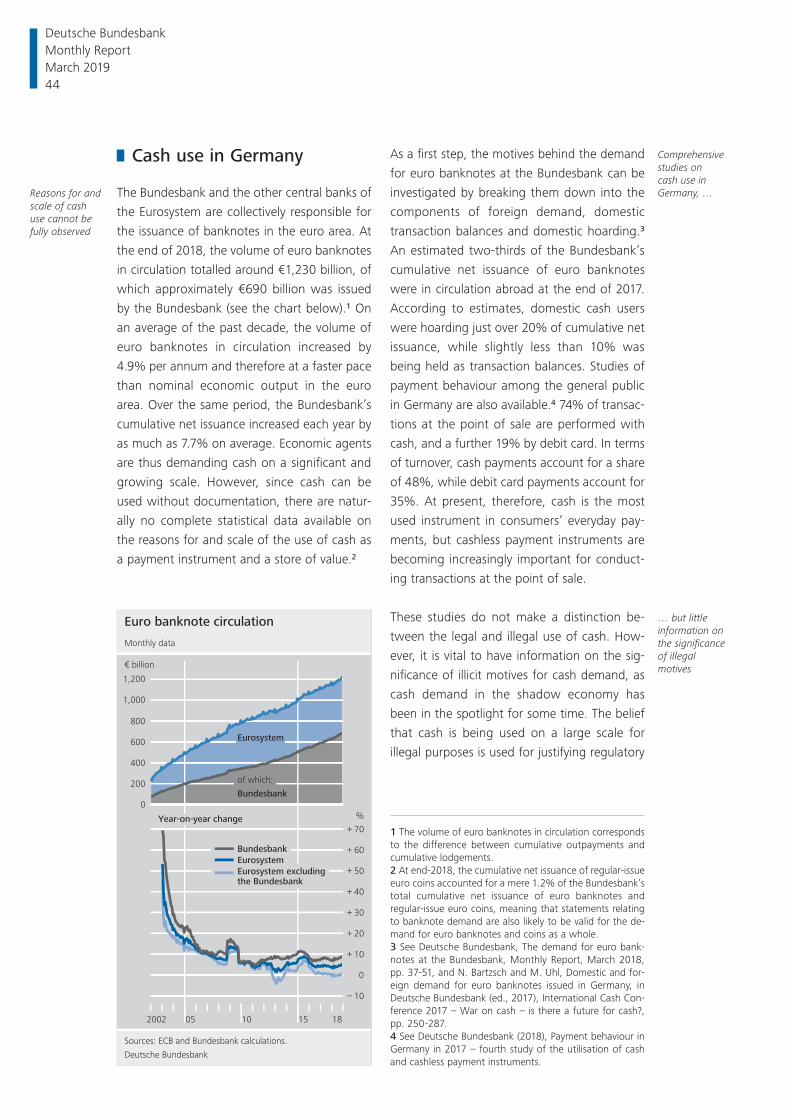
Cash use in Germany
The Bundesbank and the other central banks of
the Eurosystem are collectively responsible for
the issuance of banknotes in the euro area. At
the end of 2018, the volume of euro banknotes
in circulation totalled around €1,230 billion, of
which approximately €690 billion was issued
by the Bundesbank (see the chart below).1 On
an average of the past decade, the volume of
euro banknotes in circulation increased by
4.9% per annum and therefore at a faster pace
than nominal economic output in the euro
area. Over the same period, the Bundesbank’s
cumulative net issuance increased each year by
as much as 7.7% on average. Economic agents
are thus demanding cash on a significant and
growing scale. However, since cash can be
used without documentation, there are natur-
ally no complete statistical data available on
the reasons for and scale of the use of cash as
a payment instrument and a store of value.2
As a first step, the motives behind the demand
for euro banknotes at the Bundesbank can be
investigated by breaking them down into the
components of foreign demand, domestic
transaction balances and domestic hoarding.3
An estimated two- thirds of the Bundesbank’s
cumulative net issuance of euro banknotes
were in circulation abroad at the end of 2017.
According to estimates, domestic cash users
were hoarding just over 20% of cumulative net
issuance, while slightly less than 10% was
being held as transaction balances. Studies of
payment behaviour among the general public
in Germany are also available.4 74% of transac-
tions at the point of sale are performed with
cash, and a further 19% by debit card. In terms
of turnover, cash payments account for a share
of 48%, while debit card payments account for
35%. At present, therefore, cash is the most
used instrument in consumers’ everyday pay-
ments, but cashless payment instruments are
becoming increasingly important for conduct-
ing transactions at the point of sale.
These studies do not make a distinction be-
tween the legal and illegal use of cash. How-
ever, it is vital to have information on the sig-
nificance of illicit motives for cash demand, as
cash demand in the shadow economy has
been in the spotlight for some time. The belief
that cash is being used on a large scale for
illegal purposes is used for justifying regulatory
Reasons for and scale of cash use cannot be fully observed
Comprehensive studies on cash use in Germany , …
… but little information on the significance of illegal motives
Euro banknote circulation
Sources: ECB and Bundesbank calculations.
Deutsche Bundesbank
2002 05 10 15 18
0
200
400
600
800
1,000
1,200
Monthly data
%
€ billion
– 10
0
+ 10
+ 20
+ 30
+ 40
+ 50
+ 60
+ 70
of which:
Bundesbank
Eurosystem
Year-on-year change
Bundesbank
Eurosystem
Eurosystem excluding the Bundesbank
1 The volume of euro banknotes in circulation corresponds to the difference between cumulative outpayments and cumu lative lodgements.2 At end-2018, the cumulative net issuance of regular- issue euro coins accounted for a mere 1.2% of the Bundesbank’s total cumulative net issuance of euro banknotes and regular- issue euro coins, meaning that statements relating to banknote demand are also likely to be valid for the de-mand for euro banknotes and coins as a whole.3 See Deutsche Bundesbank, The demand for euro bank-notes at the Bundesbank, Monthly Report, March 2018, pp. 37-51, and N. Bartzsch and M. Uhl, Domestic and for-eign demand for euro banknotes issued in Germany, in Deutsche Bundesbank (ed., 2017), International Cash Con-ference 2017 – War on cash – is there a future for cash?, pp. 250-287.4 See Deutsche Bundesbank (2018), Payment behaviour in Germany in 2017 – fourth study of the utilisation of cash and cashless payment instruments.
Deutsche Bundesbank Monthly Report March 2019 44
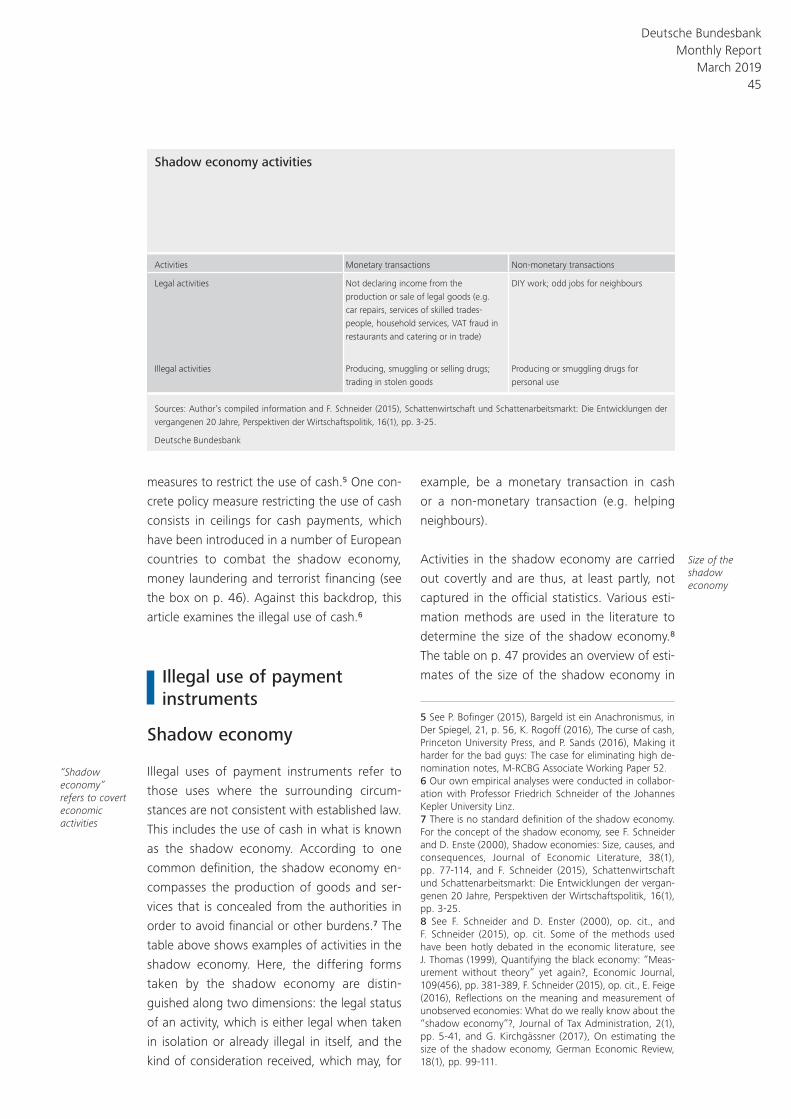
measures to restrict the use of cash.5 One con-
crete policy measure restricting the use of cash
consists in ceilings for cash payments, which
have been introduced in a number of European
countries to combat the shadow economy,
money laundering and terrorist finan cing (see
the box on p. 46). Against this backdrop, this
article examines the illegal use of cash.6
Illegal use of payment instruments
Shadow economy
Illegal uses of payment instruments refer to
those uses where the surrounding circum-
stances are not consistent with established law.
This includes the use of cash in what is known
as the shadow economy. According to one
common definition, the shadow economy en-
compasses the production of goods and ser-
vices that is concealed from the authorities in
order to avoid financial or other burdens.7 The
table above shows examples of activities in the
shadow economy. Here, the differing forms
taken by the shadow economy are distin-
guished along two dimensions: the legal status
of an activity, which is either legal when taken
in isolation or already illegal in itself, and the
kind of consideration received, which may, for
example, be a monetary transaction in cash
or a non- monetary transaction (e.g. helping
neighbours).
Activities in the shadow economy are carried
out covertly and are thus, at least partly, not
captured in the official statistics. Various esti-
mation methods are used in the literature to
determine the size of the shadow economy.8
The table on p. 47 provides an overview of esti-
mates of the size of the shadow economy in
“Shadow economy ” refers to covert economic activities
Size of the shadow economy
Shadow economy activities
Activities Monetary transactions Non-monetary transactions
Legal activities Not declaring income from the production or sale of legal goods (e.g. car repairs, services of skilled trades-people, household services, VAT fraud in restaurants and catering or in trade)
DIY work; odd jobs for neighbours
Illegal activities Producing, smuggling or selling drugs; trading in stolen goods
Producing or smuggling drugs for personal use
Sources: Author’s compiled information and F. Schneider (2015), Schattenwirtschaft und Schattenarbeitsmarkt: Die Entwicklungen der vergangenen 20 Jahre, Perspektiven der Wirtschaftspolitik, 16(1), pp. 3-25.
Deutsche Bundesbank
5 See P. Bofinger (2015), Bargeld ist ein Anachronismus, in Der Spiegel, 21, p. 56, K. Rogoff (2016), The curse of cash, Princeton University Press, and P. Sands (2016), Making it harder for the bad guys: The case for eliminating high de-nomination notes, M- RCBG Associate Working Paper 52.6 Our own empirical analyses were conducted in collabor-ation with Professor Friedrich Schneider of the Johannes Kepler University Linz.7 There is no standard definition of the shadow economy. For the concept of the shadow economy, see F. Schneider and D. Enste (2000), Shadow economies: Size, causes, and consequences, Journal of Economic Literature, 38(1), pp. 77-114, and F. Schneider (2015), Schattenwirtschaft und Schattenarbeitsmarkt: Die Entwicklungen der vergan-genen 20 Jahre, Perspektiven der Wirtschaftspolitik, 16(1), pp. 3-25.8 See F. Schneider and D. Enster (2000), op. cit., and F. Schneider (2015), op. cit. Some of the methods used have been hotly debated in the economic literature, see J. Thomas (1999), Quantifying the black economy: “Meas-urement without theory” yet again?, Economic Journal, 109(456), pp. 381-389, F. Schneider (2015), op. cit., E. Feige (2016), Reflections on the meaning and measurement of unobserved economies: What do we really know about the “shadow economy”?, Journal of Tax Administration, 2(1), pp. 5-41, and G. Kirchgässner (2017), On estimating the size of the shadow economy, German Economic Review, 18(1), pp. 99-111.
Deutsche Bundesbank Monthly Report
March 2019 45
Ceilings for cash payments
Cash payment ceilings are restrictions which limit the amounts that can be paid in cash; above these threshold values it is no longer permissible to conduct transactions in cash, and cashless payment instruments have to be used instead. As cashless payment in-struments are more easily traceable, ceilings for cash payments are designed to help in combating tax evasion in the shadow econ-omy, money laundering and the fi nancing of terrorism.1
So far, 12 EU Member States have intro-duced national restrictions on cash pay-ments which differ, above all, in the amount of the threshold value. The ceilings range at present from €500 in Greece to the equiva-lent of around €15,000 in Poland and Cro-atia. However, the categories of persons as well as the sectors affected by the restric-tions differ from country to country. At present, they chiefl y affect transactions be-tween businesses or transactions between businesses and private individuals. No EU Member State imposes restrictions on the possession of cash. Moreover, in some Member States differing restrictions for resi-dents and non- residents apply. For (tax) residents in France, for example, there has been a cash payment ceiling of €1,000 in force since 2015 (previously €3,000); non- residents, on the other hand, can conduct cash transactions up to €15,000.
The European Commission recently looked into the introduction of an EU- wide stand-ard ceiling for cash payments with the aim of combating the fi nancing of terrorism. The European Commission came to the conclusion that EU- wide cash payment ceil-ings would not, at present, suitably address the problem of terrorist fi nancing and, in June 2018, announced that any plans for an EU- wide restriction on cash payments were not going to be taken any further at the
present time.2 It based its decision on two public consultations it conducted/ commis-sioned3 which also involved affected pro-fessional groups and institutions.4 At just under 95% of those surveyed, a broad ma-jority of the general public came out against an EU restriction on cash payments.5 Doubts about its effectiveness were among the arguments cited by the participants in the survey. All things considered, the European Commission came to the conclusion that ceilings on cash payments will not, as a rule, deter criminals from committing a criminal act, especially in the case of of-fences in connection with tax evasion or terrorist fi nancing.6
When assessing restrictions on cash pay-ments in terms of combating criminal activ-ity, consideration should be given not only to their effectiveness but also to other aspects .7 For instance, the introduction of a ceiling for cash payments represents an encroachment on consumers’ freedom to choose the method of payment and risks a possible loss of confi dence in the currency on the part of the general public.
1 Restrictions on the use of cash are also considered in Deutsche Bundesbank, Policy options for cash pay-ments, Annual Report 2015, pp. 36-38.2 See European Commission (2018), Report from the Commission to the European Parliament and the Council on restrictions on payments in cash.3 See European Commission (2017), Outcome of the open public consultation on potential restrictions on large payments in cash.4 See Ecorys (2017), Study on an EU initiative for a restriction on payments in cash, Final Report.5 This was a self- selected survey and not a representa-tive sample. Of the respondents, 92% came from Austria , France or Germany.6 See European Commission (2018), op. cit.7 Up to now, very few data have been available for an empirical analysis of the effectiveness of cash payment ceilings. International comparisons are also made more diffi cult by the fact that cash payment limits have been introduced, in particular, by countries with a large shadow economy.
Deutsche Bundesbank Monthly Report March 2019 46
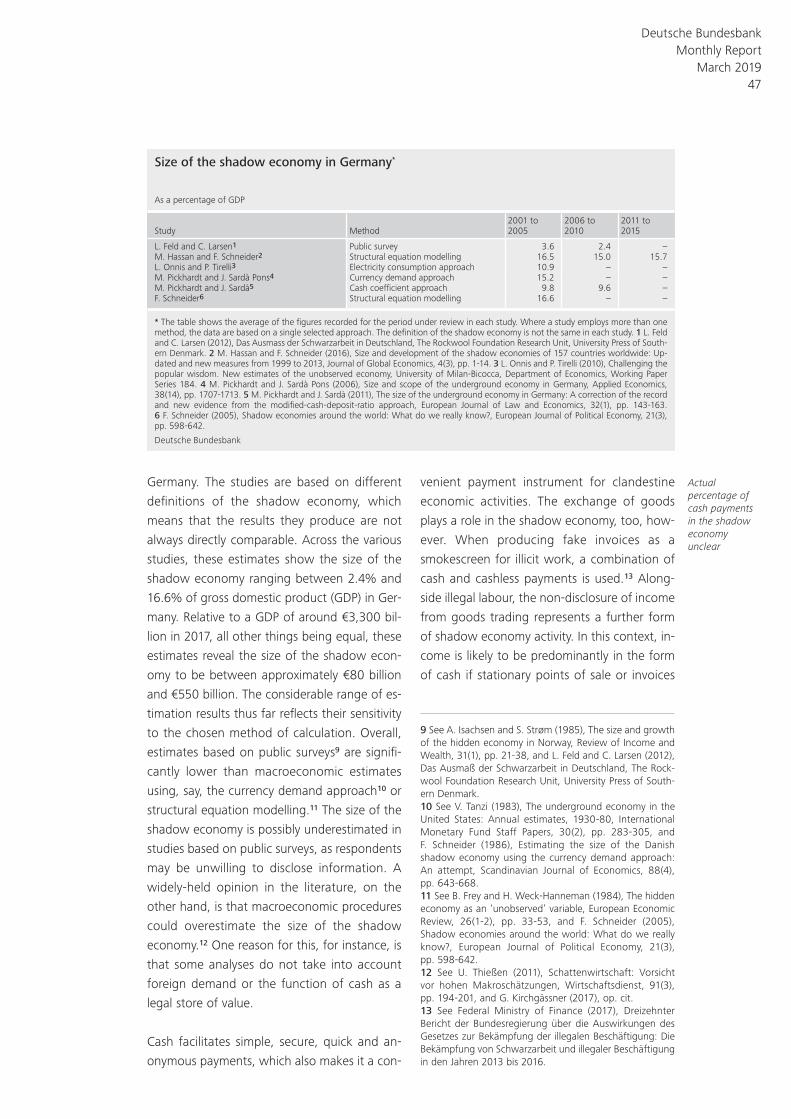
Germany. The studies are based on different
definitions of the shadow economy, which
means that the results they produce are not
always directly comparable. Across the various
studies, these estimates show the size of the
shadow economy ranging between 2.4% and
16.6% of gross domestic product (GDP) in Ger-
many. Relative to a GDP of around €3,300 bil-
lion in 2017, all other things being equal, these
estimates reveal the size of the shadow econ-
omy to be between approximately €80 billion
and €550 billion. The considerable range of es-
timation results thus far reflects their sensitivity
to the chosen method of calculation. Overall,
estimates based on public surveys9 are signifi-
cantly lower than macroeconomic estimates
using, say, the currency demand approach10 or
structural equation modelling.11 The size of the
shadow economy is possibly underestimated in
studies based on public surveys, as respondents
may be unwilling to disclose information. A
widely- held opinion in the literature, on the
other hand, is that macroeconomic procedures
could overestimate the size of the shadow
economy.12 One reason for this, for instance, is
that some analyses do not take into account
foreign demand or the function of cash as a
legal store of value.
Cash facilitates simple, secure, quick and an-
onymous payments, which also makes it a con-
venient payment instrument for clandestine
economic activities. The exchange of goods
plays a role in the shadow economy, too, how-
ever. When producing fake invoices as a
smokescreen for illicit work, a combination of
cash and cashless payments is used.13 Along-
side illegal labour, the non- disclosure of income
from goods trading represents a further form
of shadow economy activity. In this context, in-
come is likely to be predominantly in the form
of cash if stationary points of sale or invoices
Actual percentage of cash payments in the shadow economy unclear
Size of the shadow economy in Germany*
As a percentage of GDP
Study Method2001 to 2005
2006 to 2010
2011 to 2015
L. Feld and C. Larsen1 Public survey 3.6 2.4 –M. Hassan and F. Schneider2 Structural equation modelling 16.5 15.0 15.7L. Onnis and P. Tirelli3 Electricity consumption approach 10.9 – –M. Pickhardt and J. Sardà Pons4 Currency demand approach 15.2 – –M. Pickhardt and J. Sardà5 Cash coeffi cient approach 9.8 9.6 –F. Schneider6 Structural equation modelling 16.6 – –
* The table shows the average of the fi gures recorded for the period under review in each study. Where a study employs more than one method, the data are based on a single selected approach. The defi nition of the shadow economy is not the same in each study. 1 L. Feld and C. Larsen (2012), Das Ausmass der Schwarzarbeit in Deutschland, The Rockwool Foundation Research Unit, University Press of South-ern Denmark. 2 M. Hassan and F. Schneider (2016), Size and development of the shadow economies of 157 countries worldwide: Up-dated and new measures from 1999 to 2013, Journal of Global Economics, 4(3), pp. 1-14. 3 L. Onnis and P. Tirelli (2010), Challenging the popular wisdom. New estimates of the unobserved economy, University of Milan- Bicocca, Department of Economics, Working Paper Series 184. 4 M. Pickhardt and J. Sardà Pons (2006), Size and scope of the underground economy in Germany, Applied Economics, 38(14), pp. 1707-1713. 5 M. Pickhardt and J. Sardà (2011), The size of the underground economy in Germany: A correction of the record and new evidence from the modifi ed- cash- deposit- ratio approach, European Journal of Law and Economics, 32(1), pp. 143-163. 6 F. Schneider (2005), Shadow economies around the world: What do we really know?, European Journal of Political Economy, 21(3), pp. 598-642.
Deutsche Bundesbank
9 See A. Isachsen and S. Strøm (1985), The size and growth of the hidden economy in Norway, Review of Income and Wealth, 31(1), pp. 21-38, and L. Feld and C. Larsen (2012), Das Ausmaß der Schwarzarbeit in Deutschland, The Rock-wool Foundation Research Unit, University Press of South-ern Denmark.10 See V. Tanzi (1983), The underground economy in the United States: Annual estimates, 1930-80, International Monetary Fund Staff Papers, 30(2), pp. 283-305, and F. Schneider (1986), Estimating the size of the Danish shadow economy using the currency demand approach: An attempt, Scandinavian Journal of Economics, 88(4), pp. 643-668.11 See B. Frey and H. Weck- Hanneman (1984), The hidden economy as an ‘unobserved’ variable, European Economic Review, 26(1-2), pp. 33-53, and F. Schneider (2005), Shadow economies around the world: What do we really know?, European Journal of Political Economy, 21(3), pp. 598-642.12 See U. Thießen (2011), Schattenwirtschaft: Vorsicht vor hohen Makroschätzungen, Wirtschaftsdienst, 91(3), pp. 194-201, and G. Kirchgässner (2017), op. cit.13 See Federal Ministry of Finance (2017), Dreizehnter Bericht der Bundesregierung über die Auswirkungen des Gesetzes zur Bekämpfung der illegalen Beschäftigung: Die Bekämpfung von Schwarzarbeit und illegaler Beschäftigung in den Jahren 2013 bis 2016.
Deutsche Bundesbank Monthly Report
March 2019 47
are manipulated in order to evade taxes. Such
illegal goods trading could become increasingly
internet- based given the general trend towards
digitalisation, meaning that these transactions
would be settled without cash. VAT fraud in
online trading supports this view.14 The fact
that the level of online drug trafficking re-
corded by the police in Germany in 2017
showed a 24% increase on the year and ac-
counted for as much as 5% of all recorded of-
fences in this area is a further sign of increasing
digitalisation in the shadow economy.15 Pay-
ments in the shadow economy can also be
made via the official banking system – for ex-
ample, in cases where anonymity is created
through the use of letterbox companies. This
seems to happen often in carousel transactions
involving the transfer of apparently legal money
flows and input tax refunds. Alongside cash,
cashless forms of settlement also play a role in
the shadow economy.
Other potential illegal uses of payment instruments
Further unlawful uses of payment instruments
occur, for example, in connection with un-
declared income from capital (e.g. dividends,
interest),16 property crime (e.g. theft of pay-
ment instruments), various forms of white-
collar crime (e.g. financing, insolvency, labour,
competition and contribution- related offences),
and corruption or cybercrime (e.g. phishing in
online banking). Another term which is often
discussed in connection with criminal activities
is “money laundering”. This refers to illegally
acquired assets – such as illicit earnings from
criminal activities – being channelled into the
legal financial and economic cycles.17 In add-
ition, the rise of Islamist terrorist groups has
thrust the financing of terrorism further into
the spotlight.18 Owing to the sparse availability
of data, however, empirically reliable state-
ments on the scale of these other illegal areas
can be made only to a very limited extent, if at
all.
In some of the areas mentioned, cash plays
only a partial role or is not used at all. In cases
of unreported income from capital, for ex-
ample, illegal money frequently appears to be
channelled into countries which constitute an
attractive destination on account of compara-
tively low rates of taxation, a high level of con-
fidentiality and secrecy and/ or less- developed
financial market supervision/ regulation. It is es-
timated that 8% of the financial wealth of
households worldwide, totalling US $7.6 tril-
lion, is held in such tax havens.19 Corruption
represents another illegal use of payment in-
struments. 70% of all corruption cases re-
corded by police in 2017 were committed using
cash.20 Non- cash benefits or other monetary
assets accounted for just under 7% each. Cash
therefore plays a significant role, although the
use of cash is subject to major fluctuations over
Other areas of crime should also be studied for a holistic analysis of the illegal use of payment instruments
Other payment instruments used alongside cash
14 See A. Kartschall and M. Pohl (2017), Bundesregierung verzichtet auf Hunderte Millionen Euro, comments by M. Steier on the television show “Kontraste“, Rundfunk Berlin- Brandenburg (rbb).15 See Federal Criminal Police Office (2018), Bundeslage-bild Rauschgiftkriminalität 2017.16 Besides illicit work, illegal trading of goods and un-declared income from capital, other forms of tax fraud or evasion are conceivable – for instance, income from the assignment of intangible assets, such as licences or rights. The evasion of other forms of tax, such as corporation tax or local business tax, is also possible, alongside the afore-mentioned evasion of income tax and VAT.17 See J. Walker (1999), How big is global money launder-ing?, Journal of Money Laundering Control, 3(1), pp. 25-37, E. Dreer, W. Riegler and F. Schneider (2006), Geld-wäsche: Formen, Akteure, Größenordnung – und warum die Politik machtlos ist, Gabler, and J. Walker and B. Unger (2009), Measuring global money laundering: “The Walker gravity model”, Review of Law and Economics, 5(2), pp. 821-853.18 Even though the sum total of terrorist financing is, by its very nature, unknown both on a global scale and in terms of Germany alone, a conceptual distinction needs to be made between the financing of individual terrorist attacks and that of entire terrorist groups. Significant sums primar-ily arise in the case of the latter. The planning and imple-mentation costs of the most recent terrorist attacks in Europe are estimated to have been somewhere between less than €2,000 and €82,000. See Ecorys (2017), Study on an EU initiative for a restriction on payments in cash, Final Report.19 See G. Zucman (2013), The missing wealth of nations: Are Europe and the US net debtors or net creditors?, Quar-terly Journal of Economics, 128(3), pp. 1321-1364, and G. Zucman (2014), Taxing across borders: Tracking personal wealth and corporate profits, Journal of Economic Perspec-tives, 28(4), pp. 121-148.20 See Federal Criminal Police Office (2018), Bundeslage-bild Korruption 2017.
Deutsche Bundesbank Monthly Report March 2019 48
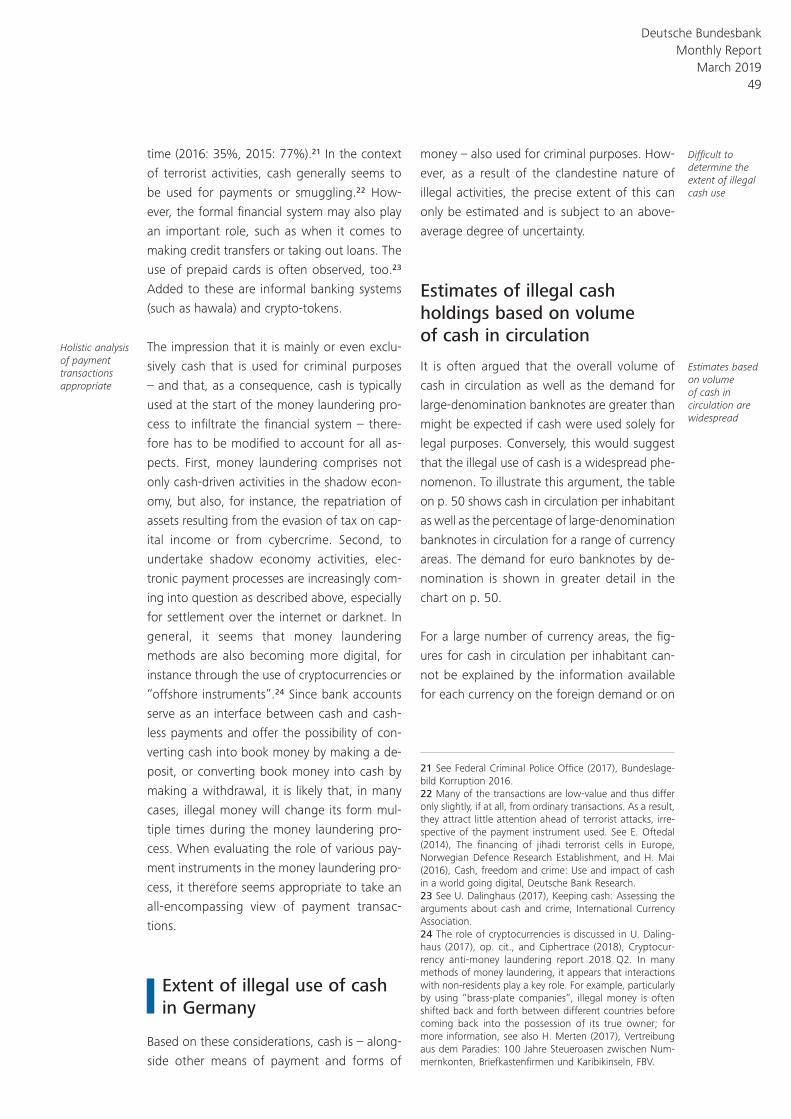
time (2016: 35%, 2015: 77%).21 In the context
of terrorist activities, cash generally seems to
be used for payments or smuggling.22 How-
ever, the formal financial system may also play
an important role, such as when it comes to
making credit transfers or taking out loans. The
use of prepaid cards is often observed, too.23
Added to these are informal banking systems
(such as hawala) and crypto- tokens.
The impression that it is mainly or even exclu-
sively cash that is used for criminal purposes
– and that, as a consequence, cash is typically
used at the start of the money laundering pro-
cess to infiltrate the financial system – there-
fore has to be modified to account for all as-
pects. First, money laundering comprises not
only cash- driven activities in the shadow econ-
omy, but also, for instance, the repatriation of
assets resulting from the evasion of tax on cap-
ital income or from cybercrime. Second, to
undertake shadow economy activities, elec-
tronic payment processes are increasingly com-
ing into question as described above, especially
for settlement over the internet or darknet. In
general, it seems that money laundering
methods are also becoming more digital, for
instance through the use of cryptocurrencies or
“offshore instruments”.24 Since bank accounts
serve as an interface between cash and cash-
less payments and offer the possibility of con-
verting cash into book money by making a de-
posit, or converting book money into cash by
making a withdrawal, it is likely that, in many
cases, illegal money will change its form mul-
tiple times during the money laundering pro-
cess. When evaluating the role of various pay-
ment instruments in the money laundering pro-
cess, it therefore seems appropriate to take an
all- encompassing view of payment transac-
tions.
Extent of illegal use of cash in Germany
Based on these considerations, cash is – along-
side other means of payment and forms of
money – also used for criminal purposes. How-
ever, as a result of the clandestine nature of
illegal activities, the precise extent of this can
only be estimated and is subject to an above-
average degree of uncertainty.
Estimates of illegal cash holdings based on volume of cash in circulation
It is often argued that the overall volume of
cash in circulation as well as the demand for
large- denomination banknotes are greater than
might be expected if cash were used solely for
legal purposes. Conversely, this would suggest
that the illegal use of cash is a widespread phe-
nomenon. To illustrate this argument, the table
on p. 50 shows cash in circulation per inhabitant
as well as the percentage of large- denomination
banknotes in circulation for a range of currency
areas. The demand for euro banknotes by de-
nomination is shown in greater detail in the
chart on p. 50.
For a large number of currency areas, the fig-
ures for cash in circulation per inhabitant can-
not be explained by the information available
for each currency on the foreign demand or on
Holistic analysis of payment transactions appropriate
Difficult to determine the extent of illegal cash use
Estimates based on volume of cash in circulation are widespread
21 See Federal Criminal Police Office (2017), Bundeslage-bild Korruption 2016.22 Many of the transactions are low- value and thus differ only slightly, if at all, from ordinary transactions. As a result, they attract little attention ahead of terrorist attacks, irre-spective of the payment instrument used. See E. Oftedal (2014), The financing of jihadi terrorist cells in Europe, Norwegian Defence Research Establishment, and H. Mai (2016), Cash, freedom and crime: Use and impact of cash in a world going digital, Deutsche Bank Research.23 See U. Dalinghaus (2017), Keeping cash: Assessing the arguments about cash and crime, International Currency Association.24 The role of cryptocurrencies is discussed in U. Daling-haus (2017), op. cit., and Ciphertrace (2018), Cryptocur-rency anti- money laundering report 2018 Q2. In many methods of money laundering, it appears that interactions with non- residents play a key role. For example, particularly by using “brass- plate companies”, illegal money is often shifted back and forth between different countries before coming back into the possession of its true owner; for more information, see also H. Merten (2017), Vertreibung aus dem Paradies: 100 Jahre Steueroasen zwischen Num-mernkonten, Briefkastenfirmen und Karibikinseln, FBV.
Deutsche Bundesbank Monthly Report
March 2019 49
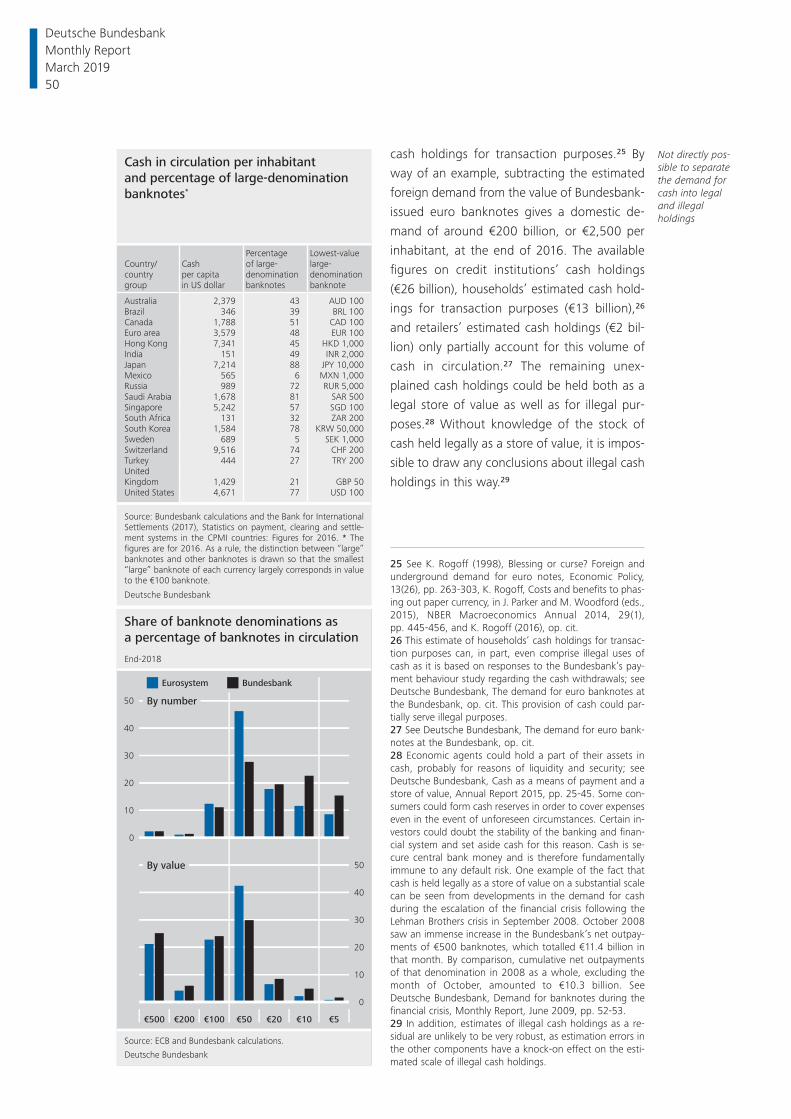
cash holdings for transaction purposes.25 By
way of an example, subtracting the estimated
foreign demand from the value of Bundesbank-
issued euro banknotes gives a domestic de-
mand of around €200 billion, or €2,500 per
inhabitant, at the end of 2016. The available
figures on credit institutions’ cash holdings
(€26 billion), households’ estimated cash hold-
ings for transaction purposes (€13 billion),26
and retailers’ estimated cash holdings (€2 bil-
lion) only partially account for this volume of
cash in circulation.27 The remaining unex-
plained cash holdings could be held both as a
legal store of value as well as for illegal pur-
poses.28 Without knowledge of the stock of
cash held legally as a store of value, it is impos-
sible to draw any conclusions about illegal cash
holdings in this way.29
Not directly pos-sible to separate the demand for cash into legal and illegal holdings
Cash in circulation per inhabitant and percentage of large-denomination banknotes*
Country/country group
Cash per capita in US dollar
Percentage of large- denomination banknotes
Lowest- value large- denomination banknote
Australia 2,379 43 AUD 100Brazil 346 39 BRL 100Canada 1,788 51 CAD 100Euro area 3,579 48 EUR 100Hong Kong 7,341 45 HKD 1,000India 151 49 INR 2,000Japan 7,214 88 JPY 10,000Mexico 565 6 MXN 1,000Russia 989 72 RUR 5,000Saudi Arabia 1,678 81 SAR 500Singapore 5,242 57 SGD 100South Africa 131 32 ZAR 200South Korea 1,584 78 KRW 50,000Sweden 689 5 SEK 1,000Switzerland 9,516 74 CHF 200Turkey 444 27 TRY 200United Kingdom 1,429 21 GBP 50United States 4,671 77 USD 100
Source: Bundesbank calculations and the Bank for International Settlements (2017), Statistics on payment, clearing and settle-ment systems in the CPMI countries: Figures for 2016. * The fi gures are for 2016. As a rule, the distinction between “large” banknotes and other banknotes is drawn so that the smallest “large” banknote of each currency largely corresponds in value to the €100 banknote.
Deutsche Bundesbank
Share of banknote denominations as
a percentage of banknotes in circulation
Source: ECB and Bundesbank calculations.
Deutsche Bundesbank
0
10
20
30
40
50
End-2018
0
10
20
30
40
50
By number
By value
Eurosystem Bundesbank
€10 €5€20€50€100€200€500
25 See K. Rogoff (1998), Blessing or curse? Foreign and underground demand for euro notes, Economic Policy, 13(26), pp. 263-303, K. Rogoff, Costs and benefits to phas-ing out paper currency, in J. Parker and M. Woodford (eds., 2015), NBER Macroeconomics Annual 2014, 29(1), pp. 445-456, and K. Rogoff (2016), op. cit.26 This estimate of households’ cash holdings for transac-tion purposes can, in part, even comprise illegal uses of cash as it is based on responses to the Bundesbank’s pay-ment behaviour study regarding the cash withdrawals; see Deutsche Bundesbank, The demand for euro banknotes at the Bundesbank, op. cit. This provision of cash could par-tially serve illegal purposes.27 See Deutsche Bundesbank, The demand for euro bank-notes at the Bundesbank, op. cit.28 Economic agents could hold a part of their assets in cash, probably for reasons of liquidity and security; see Deutsche Bundesbank, Cash as a means of payment and a store of value, Annual Report 2015, pp. 25-45. Some con-sumers could form cash reserves in order to cover expenses even in the event of unforeseen circumstances. Certain in-vestors could doubt the stability of the banking and finan-cial system and set aside cash for this reason. Cash is se-cure central bank money and is therefore fundamentally immune to any default risk. One example of the fact that cash is held legally as a store of value on a substantial scale can be seen from developments in the demand for cash during the escalation of the financial crisis following the Lehman Brothers crisis in September 2008. October 2008 saw an immense increase in the Bundesbank’s net outpay-ments of €500 banknotes, which totalled €11.4 billion in that month. By comparison, cumulative net outpayments of that denomination in 2008 as a whole, excluding the month of October, amounted to €10.3 billion. See Deutsche Bundesbank, Demand for banknotes during the financial crisis, Monthly Report, June 2009, pp. 52-53.29 In addition, estimates of illegal cash holdings as a re-sidual are unlikely to be very robust, as estimation errors in the other components have a knock- on effect on the esti-mated scale of illegal cash holdings.
Deutsche Bundesbank Monthly Report March 2019 50
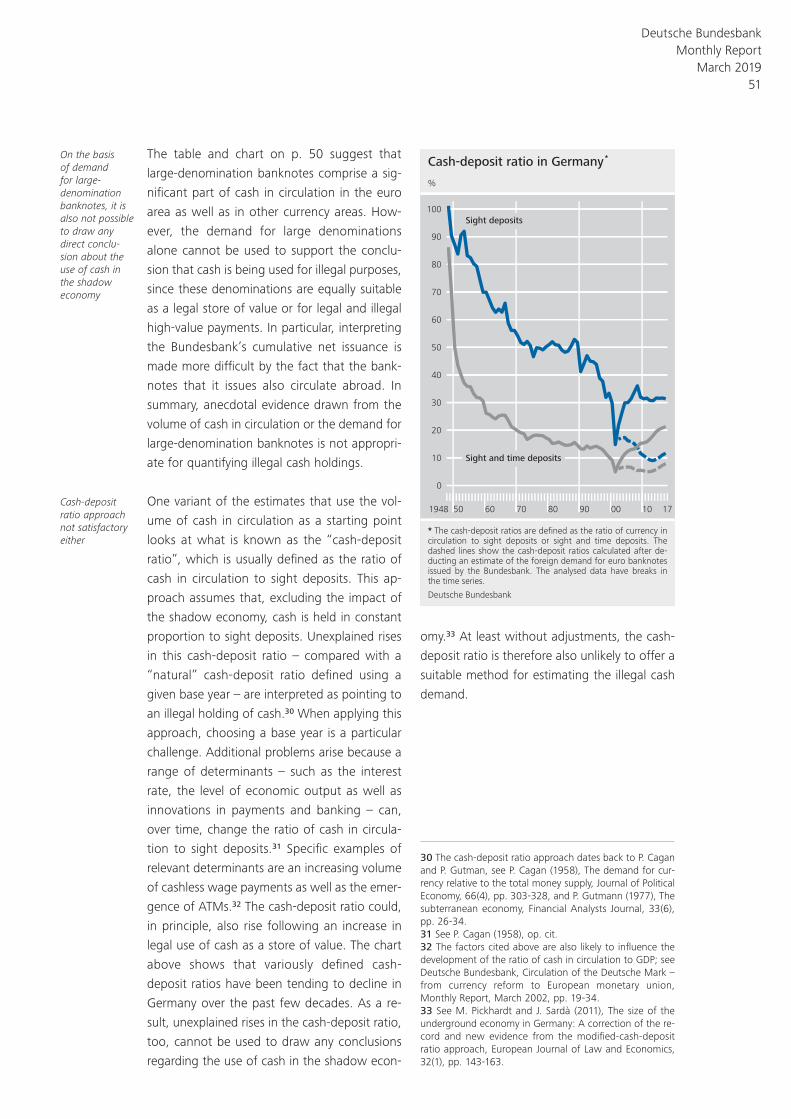
The table and chart on p. 50 suggest that
large- denomination banknotes comprise a sig-
nificant part of cash in circulation in the euro
area as well as in other currency areas. How-
ever, the demand for large denominations
alone cannot be used to support the conclu-
sion that cash is being used for illegal purposes,
since these denominations are equally suitable
as a legal store of value or for legal and illegal
high- value payments. In particular, interpreting
the Bundesbank’s cumulative net issuance is
made more difficult by the fact that the bank-
notes that it issues also circulate abroad. In
summary, anecdotal evidence drawn from the
volume of cash in circulation or the demand for
large- denomination banknotes is not appropri-
ate for quantifying illegal cash holdings.
One variant of the estimates that use the vol-
ume of cash in circulation as a starting point
looks at what is known as the “cash- deposit
ratio”, which is usually defined as the ratio of
cash in circulation to sight deposits. This ap-
proach assumes that, excluding the impact of
the shadow economy, cash is held in constant
proportion to sight deposits. Unexplained rises
in this cash- deposit ratio – compared with a
“natural” cash- deposit ratio defined using a
given base year – are interpreted as pointing to
an illegal holding of cash.30 When applying this
approach, choosing a base year is a particular
challenge. Additional problems arise because a
range of determinants – such as the interest
rate, the level of economic output as well as
innovations in payments and banking – can,
over time, change the ratio of cash in circula-
tion to sight deposits.31 Specific examples of
relevant determinants are an increasing volume
of cashless wage payments as well as the emer-
gence of ATMs.32 The cash- deposit ratio could,
in principle, also rise following an increase in
legal use of cash as a store of value. The chart
above shows that variously defined cash-
deposit ratios have been tending to decline in
Germany over the past few decades. As a re-
sult, unexplained rises in the cash- deposit ratio,
too, cannot be used to draw any conclusions
regarding the use of cash in the shadow econ-
omy.33 At least without adjustments, the cash-
deposit ratio is therefore also unlikely to offer a
suitable method for estimating the illegal cash
demand.
On the basis of demand for large- denomination banknotes, it is also not possible to draw any direct conclu-sion about the use of cash in the shadow economy
Cash- deposit ratio approach not satisfactory either
Cash-deposit ratio in Germany *
* The cash-deposit ratios are defined as the ratio of currency in circulation to sight deposits or sight and time deposits. The dashed lines show the cash-deposit ratios calculated after de-ducting an estimate of the foreign demand for euro banknotes issued by the Bundesbank. The analysed data have breaks in the time series.
Deutsche Bundesbank
1948 50 60 70 80 90 00 10 17
%
0
10
20
30
40
50
60
70
80
90
100Sight deposits
Sight and time deposits
30 The cash- deposit ratio approach dates back to P. Cagan and P. Gutman, see P. Cagan (1958), The demand for cur-rency relative to the total money supply, Journal of Political Economy, 66(4), pp. 303-328, and P. Gutmann (1977), The subterranean economy, Financial Analysts Journal, 33(6), pp. 26-34.31 See P. Cagan (1958), op. cit.32 The factors cited above are also likely to influence the development of the ratio of cash in circulation to GDP; see Deutsche Bundesbank, Circulation of the Deutsche Mark – from currency reform to European monetary union, Monthly Report, March 2002, pp. 19-34.33 See M. Pickhardt and J. Sardà (2011), The size of the underground economy in Germany: A correction of the re-cord and new evidence from the modified- cash- deposit ratio approach, European Journal of Law and Economics, 32(1), pp. 143-163.
Deutsche Bundesbank Monthly Report
March 2019 51
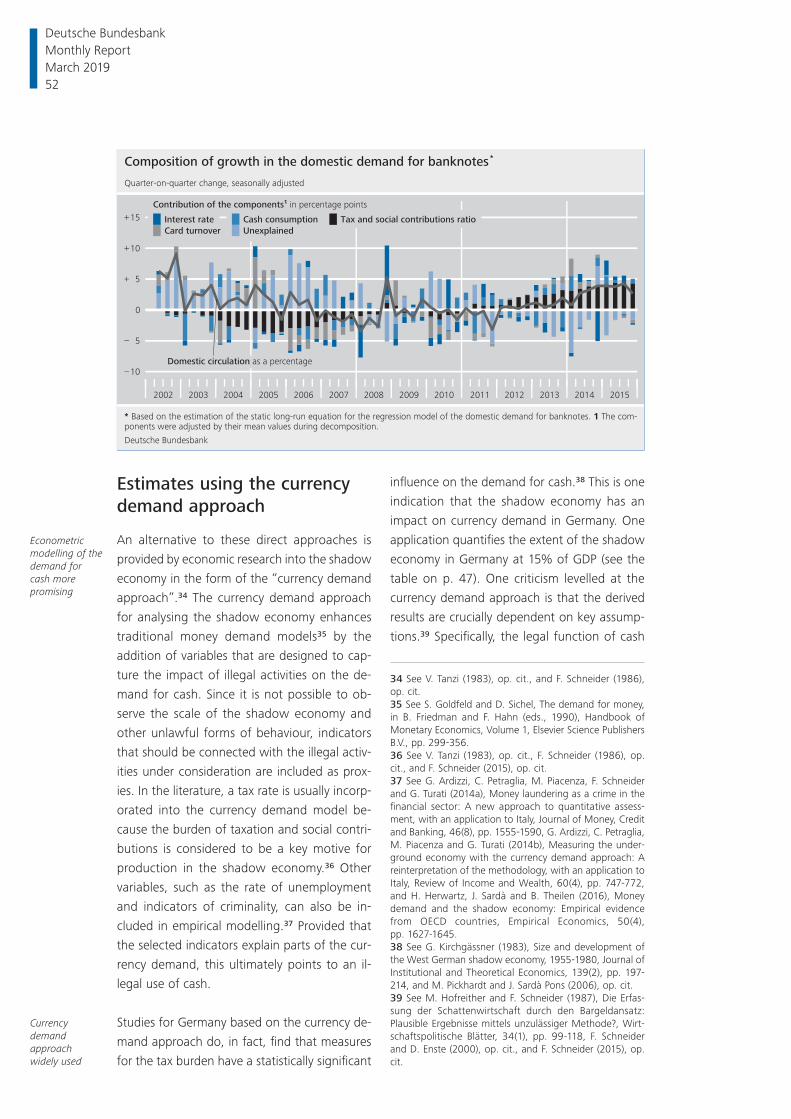
Estimates using the currency demand approach
An alternative to these direct approaches is
provided by economic research into the shadow
economy in the form of the “currency demand
approach”.34 The currency demand approach
for analysing the shadow economy enhances
traditional money demand models35 by the
addition of variables that are designed to cap-
ture the impact of illegal activities on the de-
mand for cash. Since it is not possible to ob-
serve the scale of the shadow economy and
other unlawful forms of behaviour, indicators
that should be connected with the illegal activ-
ities under consideration are included as prox-
ies. In the literature, a tax rate is usually incorp-
orated into the currency demand model be-
cause the burden of taxation and social contri-
butions is considered to be a key motive for
production in the shadow economy.36 Other
variables, such as the rate of unemployment
and indicators of criminality, can also be in-
cluded in empirical modelling.37 Provided that
the selected indicators explain parts of the cur-
rency demand, this ultimately points to an il-
legal use of cash.
Studies for Germany based on the currency de-
mand approach do, in fact, find that measures
for the tax burden have a statistically significant
influence on the demand for cash.38 This is one
indication that the shadow economy has an
impact on currency demand in Germany. One
application quantifies the extent of the shadow
economy in Germany at 15% of GDP (see the
table on p. 47). One criticism levelled at the
currency demand approach is that the derived
results are crucially dependent on key assump-
tions.39 Specifically, the legal function of cash
Econometric modelling of the demand for cash more promising
Currency demand approach widely used
Composition of growth in the domestic demand for banknotes *
* Based on the estimation of the static long-run equation for the regression model of the domestic demand for banknotes. 1 The com-ponents were adjusted by their mean values during decomposition.
Deutsche Bundesbank
2002 2003 2004 2005 2006 2007 2008 2009 2010 2011 2012 2013 2014 2015
10
5
0
5
10
15
–
–
+
+
+
Quarter-on-quarter change, seasonally adjusted
Domestic circulation as a percentage
Contribution of the components1 in percentage points
Interest rate
Card turnover
Cash consumption
Unexplained
Tax and social contributions ratio
34 See V. Tanzi (1983), op. cit., and F. Schneider (1986), op. cit.35 See S. Goldfeld and D. Sichel, The demand for money, in B. Friedman and F. Hahn (eds., 1990), Handbook of Monetary Economics, Volume 1, Elsevier Science Publishers B.V., pp. 299-356.36 See V. Tanzi (1983), op. cit., F. Schneider (1986), op. cit., and F. Schneider (2015), op. cit.37 See G. Ardizzi, C. Petraglia, M. Piacenza, F. Schneider and G. Turati (2014a), Money laundering as a crime in the financial sector: A new approach to quantitative assess-ment, with an application to Italy, Journal of Money, Credit and Banking, 46(8), pp. 1555-1590, G. Ardizzi, C. Petraglia, M. Piacenza and G. Turati (2014b), Measuring the under-ground economy with the currency demand approach: A reinterpretation of the methodology, with an application to Italy, Review of Income and Wealth, 60(4), pp. 747-772, and H. Herwartz, J. Sardà and B. Theilen (2016), Money demand and the shadow economy: Empirical evidence from OECD countries, Empirical Economics, 50(4), pp. 1627-1645.38 See G. Kirchgässner (1983), Size and development of the West German shadow economy, 1955-1980, Journal of Institutional and Theoretical Economics, 139(2), pp. 197-214, and M. Pickhardt and J. Sardà Pons (2006), op. cit.39 See M. Hofreither and F. Schneider (1987), Die Erfas-sung der Schattenwirtschaft durch den Bargeldansatz: Plausible Ergebnisse mittels unzulässiger Methode?, Wirt-schaftspolitische Blätter, 34(1), pp. 99-118, F. Schneider and D. Enste (2000), op. cit., and F. Schneider (2015), op. cit.
Deutsche Bundesbank Monthly Report March 2019 52
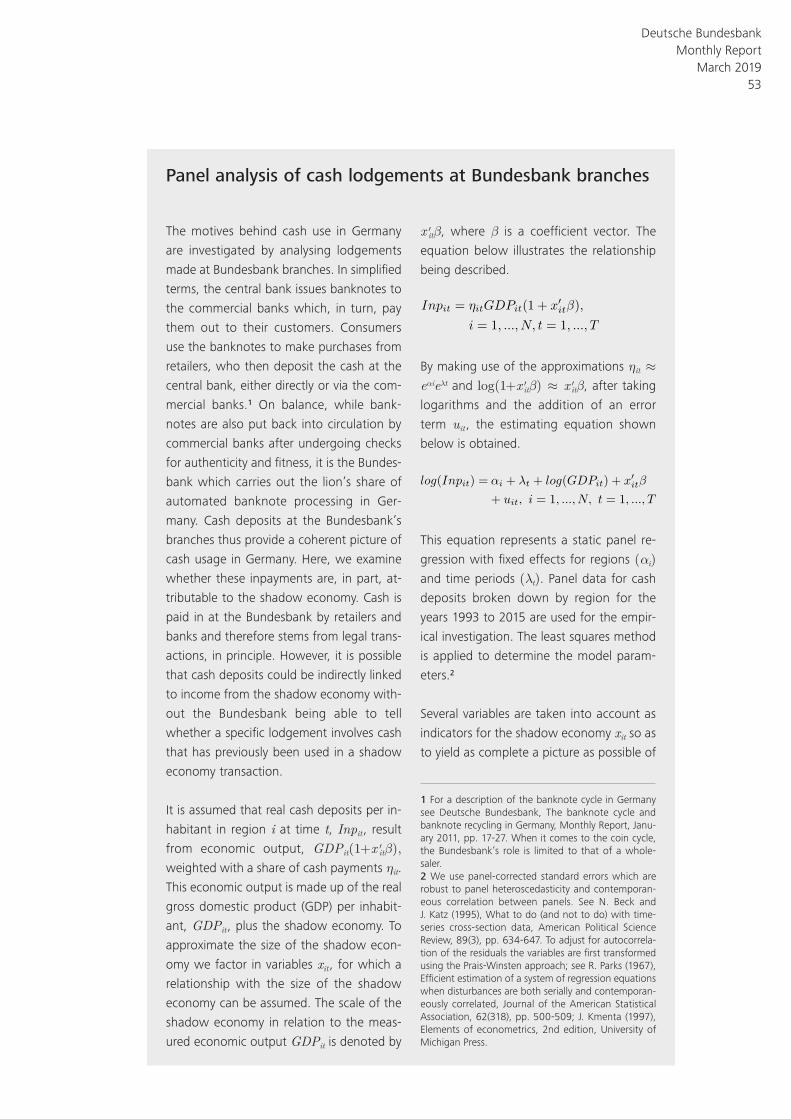
Panel analysis of cash lodgements at Bundesbank branches
The motives behind cash use in Germany
are investigated by analysing lodgements
made at Bundesbank branches. In simplifi ed
terms, the central bank issues banknotes to
the commercial banks which, in turn, pay
them out to their customers. Consumers
use the banknotes to make purchases from
retailers, who then deposit the cash at the
central bank, either directly or via the com-
mercial banks.1 On balance, while bank-
notes are also put back into circulation by
commercial banks after undergoing checks
for authenticity and fi tness, it is the Bundes-
bank which carries out the lion’s share of
automated banknote processing in Ger-
many. Cash deposits at the Bundesbank’s
branches thus provide a coherent picture of
cash usage in Germany. Here, we examine
whether these inpayments are, in part, at-
tributable to the shadow economy. Cash is
paid in at the Bundesbank by retailers and
banks and therefore stems from legal trans-
actions, in principle. However, it is possible
that cash deposits could be indirectly linked
to income from the shadow economy with-
out the Bundesbank being able to tell
whether a specifi c lodgement involves cash
that has previously been used in a shadow
economy transaction.
It is assumed that real cash deposits per in-
habitant in region i at time t, Inpit , result
from economic output, GDPit(1+x ′itβ), weighted with a share of cash payments ηit.
This economic output is made up of the real
gross domestic product (GDP) per inhabit-
ant, GDPit , plus the shadow economy. To
approximate the size of the shadow econ-
omy we factor in variables xit , for which a
relationship with the size of the shadow
economy can be assumed. The scale of the
shadow economy in relation to the meas-
ured economic output GDPit is denoted by
x ′itβ, where β is a coeffi cient vector. The
equation below illustrates the relationship
being described.
Inpit = ⌘itGDPit(1 + x0itβ),
i = 1, ..., N, t = 1, ..., T
By making use of the approximations ηit ≈ eαieλt and log(1+x ′itβ) ≈ x ′itβ, after taking
logarithms and the addition of an error
term uit , the estimating equation shown
below is obtained.
log(Inpit) = ↵i + λt + log(GDPit) + x0itβ
+ uit, i = 1, ..., N, t = 1, ..., T
This equation represents a static panel re-
gression with fi xed effects for regions (αi) and time periods (λt). Panel data for cash
deposits broken down by region for the
years 1993 to 2015 are used for the empir-
ical investigation. The least squares method
is applied to determine the model param-
eters.2
Several variables are taken into account as
indicators for the shadow economy xit so as
to yield as complete a picture as possible of
1 For a description of the banknote cycle in Germany see Deutsche Bundesbank, The banknote cycle and banknote recycling in Germany, Monthly Report, Janu-ary 2011, pp. 17-27. When it comes to the coin cycle, the Bundesbank’s role is limited to that of a whole-saler.2 We use panel- corrected standard errors which are robust to panel heteroscedasticity and contemporan-eous correlation between panels. See N. Beck and J. Katz (1995), What to do (and not to do) with time- series cross- section data, American Political Science Review, 89(3), pp. 634-647. To adjust for autocorrela-tion of the residuals the variables are fi rst transformed using the Prais- Winsten approach; see R. Parks (1967), Effi cient estimation of a system of regression equations when disturbances are both serially and contemporan-eously correlated, Journal of the American Statistical Association, 62(318), pp. 500-509; J. Kmenta (1997), Elements of econometrics, 2nd edition, University of Michigan Press.
Deutsche Bundesbank Monthly Report
March 2019 53
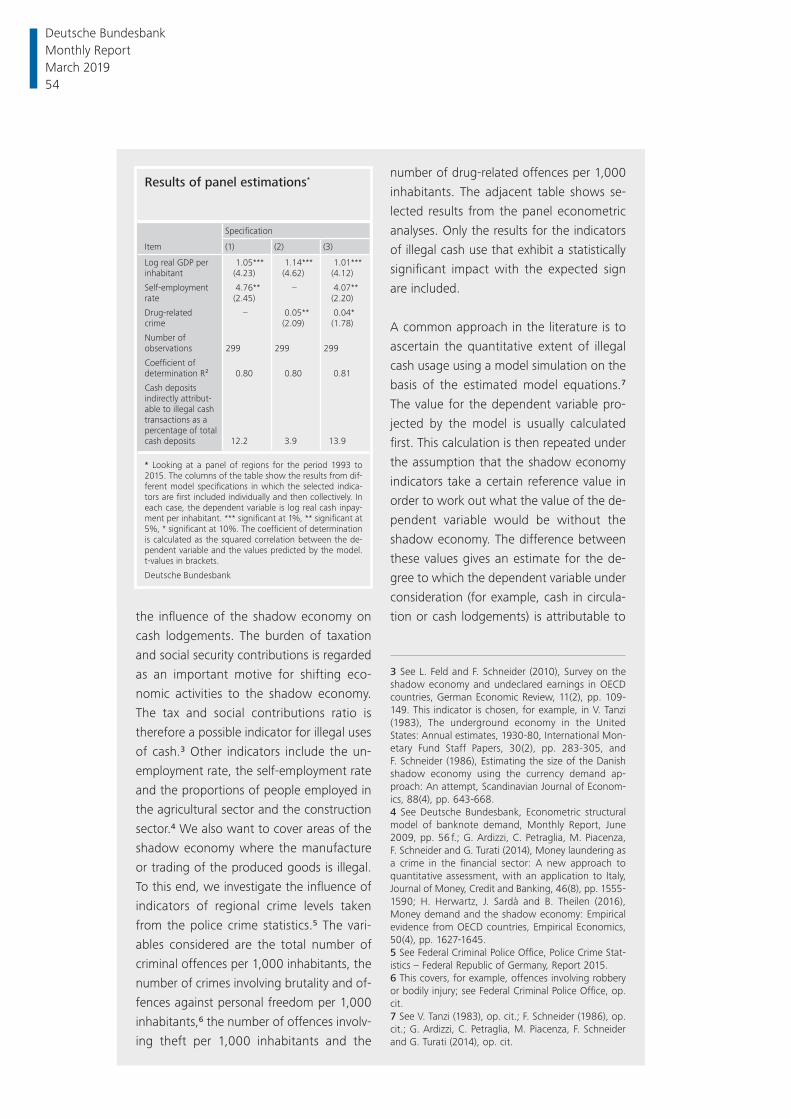
the infl uence of the shadow economy on
cash lodgements. The burden of taxation
and social security contributions is regarded
as an important motive for shifting eco-
nomic activities to the shadow economy.
The tax and social contributions ratio is
therefore a possible indicator for illegal uses
of cash.3 Other indicators include the un-
employment rate, the self- employment rate
and the proportions of people employed in
the agricultural sector and the construction
sector.4 We also want to cover areas of the
shadow economy where the manufacture
or trading of the produced goods is illegal.
To this end, we investigate the infl uence of
indicators of regional crime levels taken
from the police crime statistics.5 The vari-
ables considered are the total number of
criminal offences per 1,000 inhabitants, the
number of crimes involving brutality and of-
fences against personal freedom per 1,000
inhabitants,6 the number of offences involv-
ing theft per 1,000 inhabitants and the
number of drug- related offences per 1,000
inhabitants. The adjacent table shows se-
lected results from the panel econometric
analyses. Only the results for the indicators
of illegal cash use that exhibit a statistically
signifi cant impact with the expected sign
are included.
A common approach in the literature is to
ascertain the quantitative extent of illegal
cash usage using a model simulation on the
basis of the estimated model equations.7
The value for the dependent variable pro-
jected by the model is usually calculated
fi rst. This calculation is then repeated under
the assumption that the shadow economy
indicators take a certain reference value in
order to work out what the value of the de-
pendent variable would be without the
shadow economy. The difference between
these values gives an estimate for the de-
gree to which the dependent variable under
consideration (for example, cash in circula-
tion or cash lodgements) is attributable to
3 See L. Feld and F. Schneider (2010), Survey on the shadow economy and undeclared earnings in OECD countries, German Economic Review, 11(2), pp. 109-149. This indicator is chosen, for example, in V. Tanzi (1983), The underground economy in the United States: Annual estimates, 1930-80, International Mon-etary Fund Staff Papers, 30(2), pp. 283-305, and F. Schneider (1986), Estimating the size of the Danish shadow economy using the currency demand ap-proach: An attempt, Scandinavian Journal of Econom-ics, 88(4), pp. 643-668.4 See Deutsche Bundesbank, Econometric structural model of banknote demand, Monthly Report, June 2009, pp. 56 f.; G. Ardizzi, C. Petraglia, M. Piacenza, F. Schneider and G. Turati (2014), Money laundering as a crime in the fi nancial sector: A new approach to quantitative assessment, with an application to Italy, Journal of Money, Credit and Banking, 46(8), pp. 1555-1590; H. Herwartz, J. Sardà and B. Theilen (2016), Money demand and the shadow economy: Empirical evidence from OECD countries, Empirical Economics, 50(4), pp. 1627-1645.5 See Federal Criminal Police Offi ce, Police Crime Stat-istics – Federal Republic of Germany, Report 2015.6 This covers, for example, offences involving robbery or bodily injury; see Federal Criminal Police Offi ce, op. cit.7 See V. Tanzi (1983), op. cit.; F. Schneider (1986), op. cit.; G. Ardizzi, C. Petraglia, M. Piacenza, F. Schneider and G. Turati (2014), op. cit.
Results of panel estimations*
Item
Specifi cation
(1) (2) (3)
Log real GDP per inhabitant
1.05*** 1.14*** 1.01***(4.23) (4.62) (4.12)
Self-employment rate
4.76** – 4.07**(2.45) (2.20)
Drug-related crime
– 0.05** 0.04*(2.09) (1.78)
Number of observations 299 299 299
Coeffi cient of determination R² 0.80 0.80 0.81
Cash deposits indirectly attribut-able to illegal cash transactions as a percentage of total cash deposits 12.2 3.9 13.9
* Looking at a panel of regions for the period 1993 to 2015. The columns of the table show the results from dif-ferent model specifi cations in which the selected indica-tors are fi rst included individually and then collectively. In each case, the dependent variable is log real cash inpay-ment per inhabitant. *** signifi cant at 1%, ** signifi cant at 5%, * signifi cant at 10%. The coeffi cient of determination is calculated as the squared correlation between the de-pendent variable and the values predicted by the model. t- values in brackets.
Deutsche Bundesbank
Deutsche Bundesbank Monthly Report March 2019 54
as a store of value as well as foreign demand
should also be captured in the currency de-
mand approach. When interpreting the results,
due account should also be taken of the fact
that the currency demand approach can only
investigate the illegal uses of cash that are suf-
ficiently large in scale to be relevant to a na-
tional economy and for which suitable indica-
tor variables are available.
The significance of illegal motives for the use of
cash in Germany is the subject of two new
studies based on the currency demand ap-
proach. A panel econometric analysis looks at
the impact of the illegal use of cash on cash
lodgements at branches of the Bundesbank.
Using a time series econometric regression an-
alysis, the significance of illegal motives for the
domestic demand for banknotes is investi-
gated. Of the nine indicators of illegal cash use
considered in the panel econometric analysis
(see the box on pp. 53 ff.), only the coefficients
of the self- employment rate and the number of
drug- related offences are statistically signifi-
cantly different from zero with the expected
sign.40 Given a 1 percentage point rise in the
self- employment rate or one additional drug-
related offence per 1,000 inhabitants, cash
lodgements would, depending on the specifi-
cation, go up by 4% to 5% and thus also on
an economically significant scale. The box on
pp. 53 ff. discusses the extent to which quanti-
tative estimates of the volume of cash lodge-
ments stemming indirectly from the shadow
economy are reliably possible and what results
are achieved by doing this.
In addition, the use of cash in the shadow
economy is estimated using regression analyses
Two new stud-ies on the significance of illegal motives for cash demand
the shadow economy. The calculated values
for the extent of illegal cash use may de-
pend heavily on the assumptions made and
should be interpreted with caution accord-
ingly. For instance, setting a reference value
for the shadow economy indicators when
there is assumed to be no shadow econ-
omy is an arbitrary exercise to a certain ex-
tent. Despite these limitations, in the inter-
ests of transparent documentation of the
possible model implications, the table on
p. 54 shows the results of a model simula-
tion following the pattern detailed above
for the average share of cash deposits that
can be indirectly attributed to the shadow
economy.8 On balance, averaged across the
regions and time periods included in the
study, around 14% of lodgements can be
indirectly ascribed to the shadow economy.
After conversion, we end up with deposits
of illegal cash totalling around €60 billion
for the year 2015. Conceptually speaking, it
is not possible to determine the size of the
shadow economy on the basis of this value.
One reason for this is that we do not know
how frequently cash is used for transactions
within the shadow economy before it
makes its way into the formal economy.
This estimate for the volume of illegal cash
lodgements would be consistent with high
estimates for the size of the shadow econ-
omy if cash takings in the shadow economy
were primarily and repeatedly reused for
payments in the shadow economy before
being deposited at the Bundesbank via re-
tailers or credit institutions.
8 The calculation is based on a method used in the economic literature; see V. Tanzi (1983), op. cit. The reference value for the shadow economy indicators for which there are only legal cash lodgements is set at zero.
40 The statistical significance of a regression coefficient means that sample data deviate so strongly from the as-sumption that the coefficient is equal to zero (null hypoth-esis) that this hypothesis is rejected in accordance with a predefined rule (significance test). The significance test, however, does not provide any information on the strength of the effect, i.e. the economic significance of the regres-sion coefficient.
Deutsche Bundesbank Monthly Report
March 2019 55
Estimating the domestic demand for banknotes
The contribution of various determinants to
the domestic demand for banknotes can be
captured in econometric models. For this
purpose, the Bundesbank has estimated
dynamic regression models; more specifi c-
ally, autoregressive distributed lag (ARDL)
models.1 The estimates are made using a
real specifi cation and with seasonally ad-
justed data covering the period from the
fi rst quarter of 2002 to the fourth quarter
of 2015 (and, for some variables, to the
second quarter of 2016). The price- adjusted
domestic demand for banknotes to be ex-
plained is the real difference between total
cumulative net issuance of banknotes by
the Bundesbank and estimated foreign de-
mand.2 This analysis focuses on the shadow
economy as an explanatory variable for
banknote demand. An increase in shadow
economy activities should result in a higher
demand for cash. The phenomenon of the
shadow economy has a variety of manifest-
ations that can be modelled using the fol-
lowing proxy variables: tax and social con-
tributions ratio, employment rate in the
agricultural sector, employment rate in the
construction sector, unemployment rate,
self- employment rate, drug- related crimes,
and crimes in total. These variables repre-
sent various aspects of the shadow econ-
omy. The fi rst fi ve of these proxy variables
can be assigned to legal production and are
designated here as the “shadow economy
– legal production” group. The last two
proxy variables represent illegal activities
and form the “shadow economy – illegal”
group. To avoid the problem of omitted
variables, two proxy variables for the shadow
economy were included as regressors in the
starting specifi cation of the estimated
models; one from the “shadow economy
– legal production” group and one from the
“shadow economy – illegal” group.3
The traditional determinants of the demand
for cash are modelled by cash consumption
as a transaction variable and interest rate as
an opportunity cost variable. Cash con-
sumption refers to those categories of pri-
vate consumption that are largely settled in
cash.4 The entire interest rate range is in-
corporated into the analysis by including a
shift parameter from an estimated yield
curve to represent the generally prevailing
interest rate level. Domestic card turnover is
used as a control variable for the substitu-
tion of cash with cashless payment instru-
ments. The impact of card payments on the
demand for banknotes is theoretically un-
certain. Girocards and credit cards are a
substitute for cash payments, although they
are also used to withdraw cash from ATMs.
The impact on demand is twofold: on the
one hand, lower transaction costs for with-
drawing cash reduce the demand for cash.
On the other hand, however, they also
make it easier to access cash, thus boosting
demand.
The model’s starting specifi cation is as fol-
lows:
yt = c+ ↵1yt−1 + ↵2yt−2 + ↵3yt−3
+ ↵4yt−4 + x0tβ1 + x0
t−1β2
+ γ1zprod,t + γ2zprod,t−1 + γ3zillegal,t
+ γ4zillegal,t−1 + ut, t = 1, ..., T
1 No cointegration relationships could be identifi ed.2 See Deutsche Bundesbank, The demand for euro banknotes at the Bundesbank, Monthly Report, March 2018, pp. 37-51.3 Due to the relatively low number of observations, it was decided not to include all seven proxy variables for the shadow economy in the regression equation at the same time.4 These include spending on accommodation and hos-pitality services, clothing and footwear, leisure, enter-tainment and culture, food, beverages and tobacco as well as on other purposes, such as healthcare.
Deutsche Bundesbank Monthly Report March 2019 56
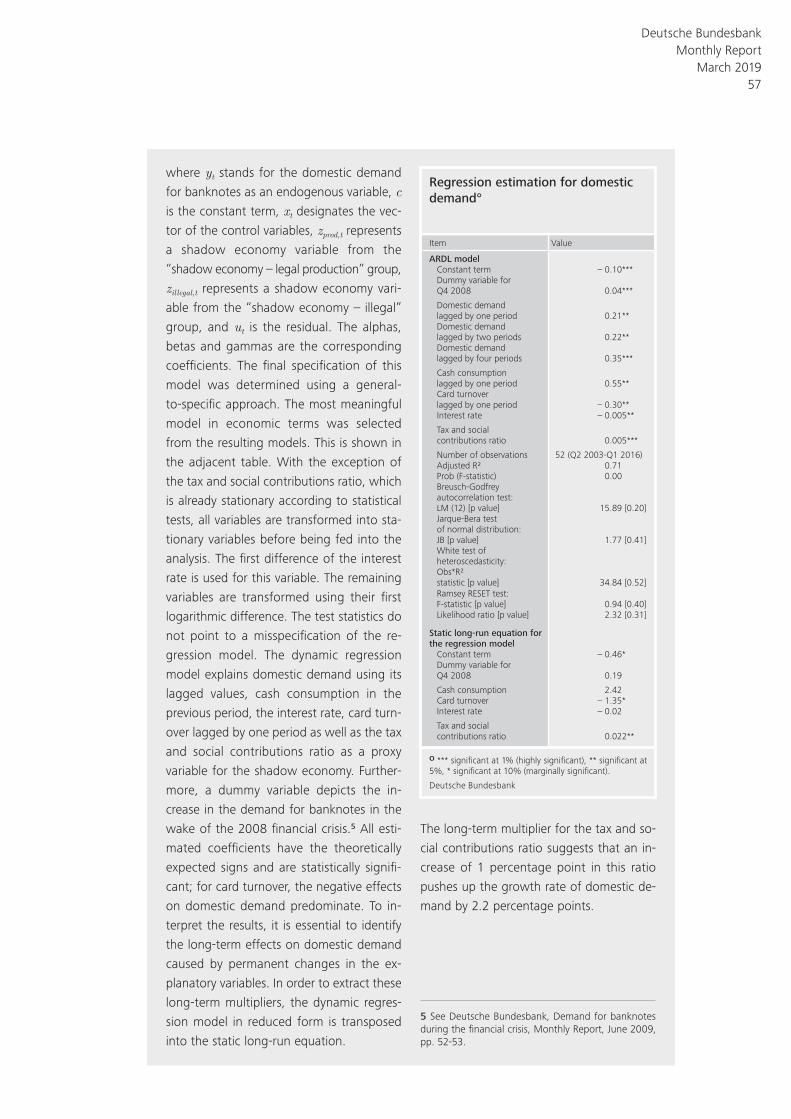
where yt stands for the domestic demand
for banknotes as an endogenous variable, c
is the constant term, xt designates the vec-
tor of the control variables, zprod,t represents
a shadow economy variable from the
“shadow economy – legal production” group,
zillegal,t represents a shadow economy vari-
able from the “shadow economy – illegal”
group, and ut is the residual. The alphas,
betas and gammas are the corresponding
coeffi cients. The fi nal specifi cation of this
model was determined using a general-
to-specifi c approach. The most meaningful
model in economic terms was selected
from the resulting models. This is shown in
the adjacent table. With the exception of
the tax and social contributions ratio, which
is already stationary according to statistical
tests, all variables are transformed into sta-
tionary variables before being fed into the
analysis. The fi rst difference of the interest
rate is used for this variable. The remaining
variables are transformed using their fi rst
logarithmic difference. The test statistics do
not point to a misspecifi cation of the re-
gression model. The dynamic regression
model explains domestic demand using its
lagged values, cash consumption in the
previous period, the interest rate, card turn-
over lagged by one period as well as the tax
and social contributions ratio as a proxy
variable for the shadow economy. Further-
more, a dummy variable depicts the in-
crease in the demand for banknotes in the
wake of the 2008 fi nancial crisis.5 All esti-
mated coeffi cients have the theoretically
expected signs and are statistically signifi -
cant; for card turnover, the negative effects
on domestic demand predominate. To in-
terpret the results, it is essential to identify
the long- term effects on domestic demand
caused by permanent changes in the ex-
planatory variables. In order to extract these
long- term multipliers, the dynamic regres-
sion model in reduced form is transposed
into the static long- run equation.
The long- term multiplier for the tax and so-
cial contributions ratio suggests that an in-
crease of 1 percentage point in this ratio
pushes up the growth rate of domestic de-
mand by 2.2 percentage points.
5 See Deutsche Bundesbank, Demand for banknotes during the fi nancial crisis, Monthly Report, June 2009, pp. 52-53.
Regression estimation for domestic demand°
Item Value
ARDL modelConstant term – 0.10***Dummy variable for Q4 2008 0.04***
Domestic demand lagged by one period 0.21**Domestic demand lagged by two periods 0.22**Domestic demand lagged by four periods 0.35***
Cash consumption lagged by one period 0.55**Card turnover lagged by one period – 0.30**Interest rate – 0.005**
Tax and social contributions ratio 0.005***
Number of observations 52 (Q2 2003-Q1 2016)Adjusted R2 0.71Prob (F-statistic) 0.00Breusch-Godfrey autocorrelation test: LM (12) [p value] 15.89 [0.20]Jarque-Bera test of normal distribution: JB [p value] 1.77 [0.41]White test of heteroscedasticity : Obs*R2
statistic [p value] 34.84 [0.52]Ramsey RESET test: F-statistic [p value] 0.94 [0.40]Likelihood ratio [p value] 2.32 [0.31]
Static long-run equation for the regression model
Constant term – 0.46*Dummy variable for Q4 2008 0.19
Cash consumption 2.42Card turnover – 1.35*Interest rate – 0.02
Tax and social contributions ratio 0.022**
o *** signifi cant at 1% (highly signifi cant), ** signifi cant at 5%, * signifi cant at 10% (marginally signifi cant).
Deutsche Bundesbank
Deutsche Bundesbank Monthly Report
March 2019 57
of the (real) domestic demand for banknotes
(see the box on pp. 56 f.). Accordingly, of the
seven shadow economy proxy variables used,
only the tax and social contributions ratio has a
statistically significant (positive) impact on the
domestic demand for banknotes.41 If there is a
sustained 1 percentage point increase in the
tax and social contributions ratio, the growth
rate of the domestic demand for banknotes
goes up by 2.2 percentage points over the long
term. This long- term multiplier is also econom-
ically significant. The quantitative contributions
of the various determinants can be compared
by decomposing the growth in the domestic
demand for banknotes (see the chart on p. 52).42
Developments in the growth rate of the do-
mestic demand for banknotes can be split into
three phases. It was positive from the launch of
euro cash until the end of 2006, then negative
until the end of 2011, and has been positive
again since then with a tendency to rise. Since
2012, the tax and social contributions ratio has
made the largest contribution to growth in do-
mestic demand, followed by the growth rates
in cash consumption and card payments. This
finding highlights the economic significance of
the tax and social contributions ratio in the do-
mestic demand for banknotes.
Conclusions
Cash payments are made without any technical
devices by simply handing over banknotes and
coins. As a result, cash transactions can be
completed without third parties obtaining
knowledge of the parties involved. By using
cash in their daily lives, members of the general
public can maintain their personal privacy.
However, the anonymity of cash can be ab-
used, for instance, in connection with tax eva-
sion or trading in illegal goods.
This possible role of cash in the shadow econ-
omy, or as a means of funding crime, has been
under increased discussion for some time now.
However, estimating the actual scale on which
cash is being used for illegal purposes repre-
sents a challenge. Direct estimates – such as
those that use the volume of cash in circulation
or the demand for large- denomination bank-
notes to conclude that there is, supposedly, an
extensive illegal use of cash – seem scarcely
appro priate, as they do not take account of
the legal function of cash as a store of value.
Econometric estimates of the cash demand
present a mixed picture overall of the signifi-
cance of the shadow economy for the demand
for cash in Germany. According to the Bundes-
bank’s own empirical studies of the deter-
minants of cash lodgements at Bundesbank
branches as well as of the Bundesbank’s cumu-
lative net issuance of euro banknotes, no more
than a few of the potential indicators of illegal
cash use are significant in each case. These are,
first, the self- employment rate and the number
of drug- related offences, and, second, the tax
and social contributions ratio. Generally, stud-
ies of the shadow economy refer to an unob-
servable variable, which means that the results
can potentially depend to a large degree on
the assumptions made and should be inter-
preted only with caution.
Finally, there remains the question of how far
the shadow economy can be contained by re-
stricting the use of cash. In this regard, there is
still a lack of empirical evidence as to whether
measures such as abolishing large- denomination
banknotes or introducing upper limits for cash
payments would, in fact, be an effective means
of combating tax evasion and other criminal
activities.43
Statistical regression of domestic demand for banknotes on proxy variables for the shadow economy
Anonymity of cash protects personal privacy and allows undesirable uses
Extent of illegal cash use is diffi-cult to estimate
Still no evidence for the effectiveness of restricting cash payments
41 The terms “domestic banknote circulation” and “do-mestic demand for banknotes” have the same meaning, as banknote circulation is determined solely by the demand for banknotes.42 This decomposition of growth is based on the static long- run equation for the domestic demand for banknotes.43 See Deutsche Bundesbank, Policy options for cash pay-ments, Annual Report 2015, pp. 36-38.
Deutsche Bundesbank Monthly Report March 2019 58
Statistical Section
Deutsche Bundesbank Monthly Report
March 2019 1•
Contents
I. Key economic data for the euro area
1. Monetary developments and interest rates .................................................................. 5•
2. External transactions and positions .............................................................................. 5•
3. General economic indicators ....................................................................................... 6•
II. Overall monetary survey in the euro area
1. The money stock and its counterparts ......................................................................... 8•
2. Consolidated balance sheet of monetary financial institutions (MFIs) ........................... 10•
3. Banking system’s liquidity position ............................................................................... 14•
III. Consolidated financial statement of the Eurosystem
1. Assets .......................................................................................................................... 16•
2. Liabilities ..................................................................................................................... 18•
IV. Banks
1. Assets and liabilities of monetary financial institutions (excluding the Bundesbank)
in Germany ................................................................................................................. 20•
2. Principal assets and liabilities of banks (MFIs) in Germany, by category of banks .......... 24•
3. Assets and liabilities of banks (MFIs) in Germany vis-à-vis residents .............................. 26•
4. Assets and liabilities of banks (MFIs) in Germany vis-à-vis non-residents ....................... 28•
5. Lending by banks (MFIs) in Germany to domestic non-banks (non-MFIs) ..................... 30•
6. Lending by banks (MFIs) in Germany to domestic enterprises and households,
housing loans, sectors of economic activity ................................................................. 32•
7. Deposits of domestic non-banks (non-MFIs) at banks (MFIs) in Germany ..................... 34•
8. Deposits of domestic households and non-profit institutions at banks (MFIs) in
Germany ..................................................................................................................... 36•
9. Deposits of domestic government at banks (MFIs) in Germany, by creditor group........ 36•
10. Savings deposits and bank savings bonds of banks (MFIs) in Germany sold to
non-banks (non-MFIs).................................................................................................. 38•
11. Debt securities and money market paper outstanding of banks (MFIs) in Germany ...... 38•
12. Building and loan associations (MFIs) in Germany ........................................................ 39•
13. Assets and liabilities of the foreign branches and foreign subsidiaries of
German banks (MFIs) ................................................................................................... 40•
Deutsche Bundesbank Monthly Report March 2019 2•
V. Minimum reserves
1. Reserve maintenance in the euro area ......................................................................... 42•
2. Reserve maintenance in Germany ................................................................................ 42•
VI. Interest rates
1. ECB interest rates ........................................................................................................ 43•
2. Base rates .................................................................................................................... 43•
3. Eurosystem monetary policy operations allotted through tenders ................................ 43•
4. Money market rates, by month ................................................................................... 43•
5. Interest rates and volumes for outstanding amounts and new business of
German banks (MFIs) ................................................................................................... 44•
VII. Insurance corporations and pension funds
1. Assets .......................................................................................................................... 48•
2. Liabilities ..................................................................................................................... 49•
VIII. Capital market
1. Sales and purchases of debt securities and shares in Germany ..................................... 50•
2. Sales of debt securities issued by residents .................................................................. 51•
3. Amounts outstanding of debt securities issued by residents......................................... 52•
4. Shares in circulation issued by residents ....................................................................... 52•
5. Yields and indices on German securities ...................................................................... 53•
6. Sales and purchases of mutual fund shares in Germany ............................................... 53•
IX. Financial accounts
1. Acquisition of financial assets and external financing of non-financial corporations ..... 54•
2. Financial assets and liabilities of non-financial corporations ......................................... 55•
3. Acquisition of financial assets and external financing of households ............................ 56•
4. Financial assets and liabilities of households ................................................................ 57•
X. Public finances in Germany
1. General government: deficit/surplus and debt level as defined in the Maastricht Treaty .. 58•
2. General government: revenue, expenditure and deficit/surplus as shown in the
national accounts ........................................................................................................ 58•
3. General government: budgetary development ............................................................. 59•
4. Central, state and local government: budgetary development ..................................... 59•
5. Central, state and local government: tax revenue ........................................................ 60•
Deutsche Bundesbank Monthly Report
March 2019 3•
6. Central and state government and European Union: tax revenue, by type ................... 60•
7. Central, state and local government: individual taxes .................................................. 61•
8. German pension insurance scheme: budgetary development and assets ...................... 61•
9. Federal Employment Agency: budgetary development ................................................. 62•
10. Statutory health insurance scheme: budgetary development ....................................... 62•
11. Statutory long-term care insurance scheme: budgetary development .......................... 63•
12. Central government: borrowing in the market ............................................................. 63•
13. General government: debt by creditor ......................................................................... 63•
14. Maastricht debt by instrument..................................................................................... 64•
15. Maastricht debt of central government by instrument and category ............................ 65•
XI. Economic conditions in Germany
1. Origin and use of domestic product, distribution of national income ........................... 66•
2. Output in the production sector .................................................................................. 67•
3. Orders received by industry ......................................................................................... 68•
4. Orders received by construction .................................................................................. 69•
5. Retail trade turnover, sales of motor vehicles ............................................................... 69•
6. Labour market ............................................................................................................. 70•
7. Prices .......................................................................................................................... 71•
8. Households’ income .................................................................................................... 72•
9. Negotiated pay rates (overall economy) ....................................................................... 72•
10. Assets, equity and liabilities of listed non-financial groups ........................................... 73•
11. Revenues and operating income of listed non-financial groups .................................... 74•
XII. External sector
1. Major items of the balance of payments of the euro area ........................................... 75•
2. Major items of the balance of payments of the Federal Republic of Germany .............. 76•
3. Foreign trade (special trade) of the Federal Republic of Germany, by country and
group of countries ....................................................................................................... 77•
4. Services and primary income of the Federal Republic of Germany ................................ 78•
5. Secondary income of the Federal Republic of Germany ............................................... 78•
6. Capital account of the Federal Republic of Germany.................................................... 78•
7. Financial account of the Federal Republic of Germany ................................................. 79•
8. External position of the Bundesbank............................................................................ 80•
9. Assets and liabilities of enterprises in Germany (other than banks) vis-à-vis
non-residents .............................................................................................................. 81•
10. ECB’s euro foreign exchange reference rates of selected currencies ............................. 82•
11. Euro area countries and irrevocable euro conversion rates in the third stage of
Economic and Monetary Union ................................................................................... 82•
12. Effective exchange rates of the euro and indicators of the German economy’s price
competitiveness ........................................................................................................... 83•
Deutsche Bundesbank Monthly Report March 2019 4•
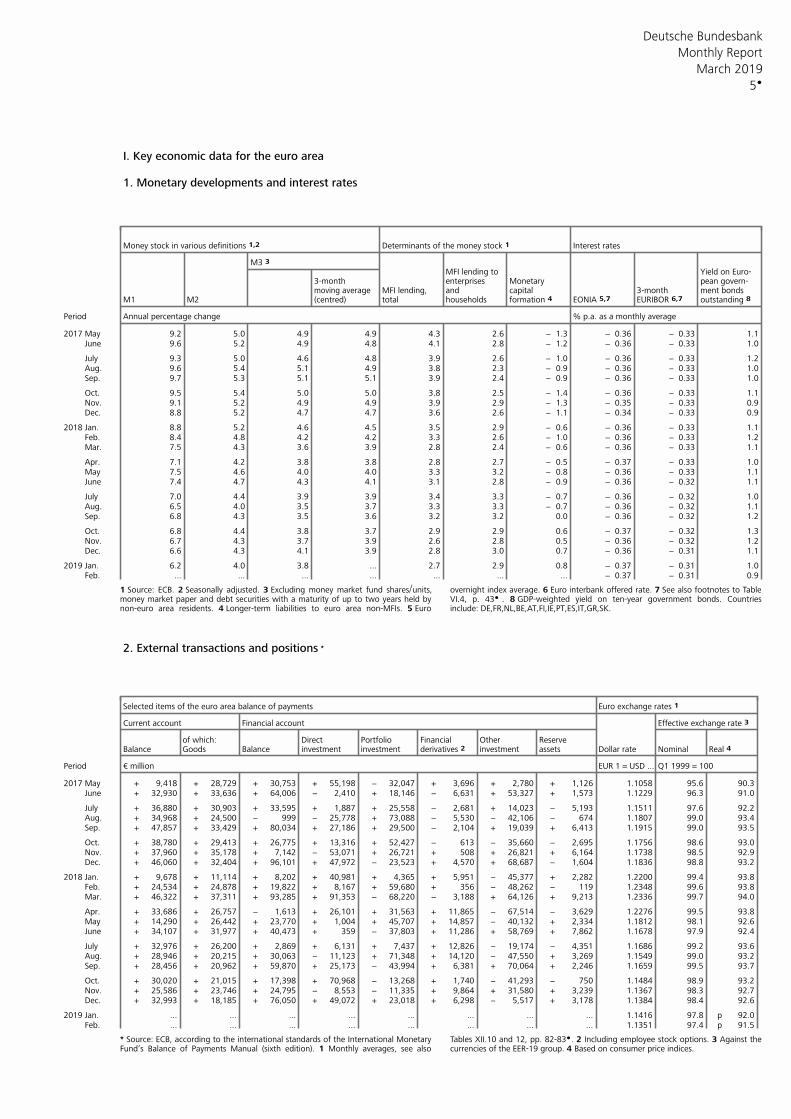
Deutsche Bundesbank
5
Monthly Report
March 2019
I. Key economic data for the euro area 1. Monetary developments and interest rates
Money stock in various definitions 1,2 Determinants of the money stock 1 Interest rates
M3 3 MFI lending to Yield on Euro-
3-month enterprises Monetary pean govern-MFI lending, and capital 3-month ment bondsmoving average
M1 M2 (centred) total households formation 4 EONIA 5,7 EURIBOR 6,7 outstanding 8
Period Annual percentage change % p.a. as a monthly average
2017 May 9.2 5.0 4.9 4.9 4.3 2.6 − 1.3 − 0.36 − 0.33 1.1 June 9.6 5.2 4.9 4.8 4.1 2.8 − 1.2 − 0.36 − 0.33 1.0
July 9.3 5.0 4.6 4.8 3.9 2.6 − 1.0 − 0.36 − 0.33 1.2 Aug. 9.6 5.4 5.1 4.9 3.8 2.3 − 0.9 − 0.36 − 0.33 1.0 Sep. 9.7 5.3 5.1 5.1 3.9 2.4 − 0.9 − 0.36 − 0.33 1.0
Oct. 9.5 5.4 5.0 5.0 3.8 2.5 − 1.4 − 0.36 − 0.33 1.1 Nov. 9.1 5.2 4.9 4.9 3.9 2.9 − 1.3 − 0.35 − 0.33 0.9 Dec. 8.8 5.2 4.7 4.7 3.6 2.6 − 1.1 − 0.34 − 0.33 0.9
2018 Jan. 8.8 5.2 4.6 4.5 3.5 2.9 − 0.6 − 0.36 − 0.33 1.1 Feb. 8.4 4.8 4.2 4.2 3.3 2.6 − 1.0 − 0.36 − 0.33 1.2 Mar. 7.5 4.3 3.6 3.9 2.8 2.4 − 0.6 − 0.36 − 0.33 1.1
Apr. 7.1 4.2 3.8 3.8 2.8 2.7 − 0.5 − 0.37 − 0.33 1.0 May 7.5 4.6 4.0 4.0 3.3 3.2 − 0.8 − 0.36 − 0.33 1.1 June 7.4 4.7 4.3 4.1 3.1 2.8 − 0.9 − 0.36 − 0.32 1.1
July 7.0 4.4 3.9 3.9 3.4 3.3 − 0.7 − 0.36 − 0.32 1.0 Aug. 6.5 4.0 3.5 3.7 3.3 3.3 − 0.7 − 0.36 − 0.32 1.1 Sep. 6.8 4.3 3.5 3.6 3.2 3.2 0.0 − 0.36 − 0.32 1.2
Oct. 6.8 4.4 3.8 3.7 2.9 2.9 0.6 − 0.37 − 0.32 1.3 Nov. 6.7 4.3 3.7 3.9 2.6 2.8 0.5 − 0.36 − 0.32 1.2 Dec. 6.6 4.3 4.1 3.9 2.8 3.0 0.7 − 0.36 − 0.31 1.1
2019 Jan. 6.2 4.0 3.8 ... 2.7 2.9 0.8 − 0.37 − 0.31 1.0 Feb. ... ... ... ... ... ... ... − 0.37 − 0.31 0.9
1 Source: ECB. 2 Seasonally adjusted. 3 Excluding money market fund shares/units, overnight index average. 6 Euro interbank offered rate. 7 See also footnotes to Tablemoney market paper and debt securities with a maturity of up to two years held by VI.4, p. 43 . 8 GDP-weighted yield on ten-year government bonds. Countriesnon-euro area residents. 4 Longer-term liabilities to euro area non-MFIs. 5 Euro include: DE,FR,NL,BE,AT,FI,IE,PT,ES,IT,GR,SK.
2. External transactions and positions *
Selected items of the euro area balance of payments Euro exchange rates 1
Current account Financial account Effective exchange rate 3
of which: Direct Portfolio Financial Other ReserveBalance Goods Balance investment investment investment assets Dollar rate Nominal Real 4 derivatives 2
Period € million Q1 1999 = 100EUR 1 = USD ...
2017 May + 9,418 + 28,729 + 30,753 + 55,198 − 32,047 + 3,696 + 2,780 + 1,126 1.1058 95.6 90.3 June + 32,930 + 33,636 + 64,006 − 2,410 + 18,146 − 6,631 + 53,327 + 1,573 1.1229 96.3 91.0
July + 36,880 + 30,903 + 33,595 + 1,887 + 25,558 − 2,681 + 14,023 − 5,193 1.1511 97.6 92.2 Aug. + 34,968 + 24,500 − 999 − 25,778 + 73,088 − 5,530 − 42,106 − 674 1.1807 99.0 93.4 Sep. + 47,857 + 33,429 + 80,034 + 27,186 + 29,500 − 2,104 + 19,039 + 6,413 1.1915 99.0 93.5
Oct. + 38,780 + 29,413 + 26,775 + 13,316 + 52,427 − 613 − 35,660 − 2,695 1.1756 98.6 93.0 Nov. + 37,960 + 35,178 + 7,142 − 53,071 + 26,721 + 508 + 26,821 + 6,164 1.1738 98.5 92.9 Dec. + 46,060 + 32,404 + 96,101 + 47,972 − 23,523 + 4,570 + 68,687 − 1,604 1.1836 98.8 93.2
2018 Jan. + 9,678 + 11,114 + 8,202 + 40,981 + 4,365 + 5,951 − 45,377 + 2,282 1.2200 99.4 93.8 Feb. + 24,534 + 24,878 + 19,822 + 8,167 + 59,680 + 356 − 48,262 − 119 1.2348 99.6 93.8 Mar. + 46,322 + 37,311 + 93,285 + 91,353 − 68,220 − 3,188 + 64,126 + 9,213 1.2336 99.7 94.0
Apr. + 33,686 + 26,757 − 1,613 + 26,101 + 31,563 + 11,865 − 67,514 − 3,629 1.2276 99.5 93.8 May + 14,290 + 26,442 + 23,770 + 1,004 + 45,707 + 14,857 − 40,132 + 2,334 1.1812 98.1 92.6 June + 34,107 + 31,977 + 40,473 + 359 − 37,803 + 11,286 + 58,769 + 7,862 1.1678 97.9 92.4
July + 32,976 + 26,200 + 2,869 + 6,131 + 7,437 + 12,826 − 19,174 − 4,351 1.1686 99.2 93.6 Aug. + 28,946 + 20,215 + 30,063 − 11,123 + 71,348 + 14,120 − 47,550 + 3,269 1.1549 99.0 93.2 Sep. + 28,456 + 20,962 + 59,870 + 25,173 − 43,994 + 6,381 + 70,064 + 2,246 1.1659 99.5 93.7
Oct. + 30,020 + 21,015 + 17,398 + 70,968 − 13,268 + 1,740 − 41,293 − 750 1.1484 98.9 93.2 Nov. + 25,586 + 23,746 + 24,795 − 8,553 − 11,335 + 9,864 + 31,580 + 3,239 1.1367 98.3 92.7 Dec. + 32,993 + 18,185 + 76,050 + 49,072 + 23,018 + 6,298 − 5,517 + 3,178 1.1384 98.4 92.6
2019 Jan. ... ... ... ... ... ... ... ... 1.1416 97.8 p 92.0 Feb. ... ... ... ... ... ... ... ... 1.1351 97.4 p 91.5
* Source: ECB, according to the international standards of the International Monetary Tables XII.10 and 12, pp. 82-83 . 2 Including employee stock options. 3 Against theFund’s Balance of Payments Manual (sixth edition). 1 Monthly averages, see also currencies of the EER-19 group. 4 Based on consumer price indices.
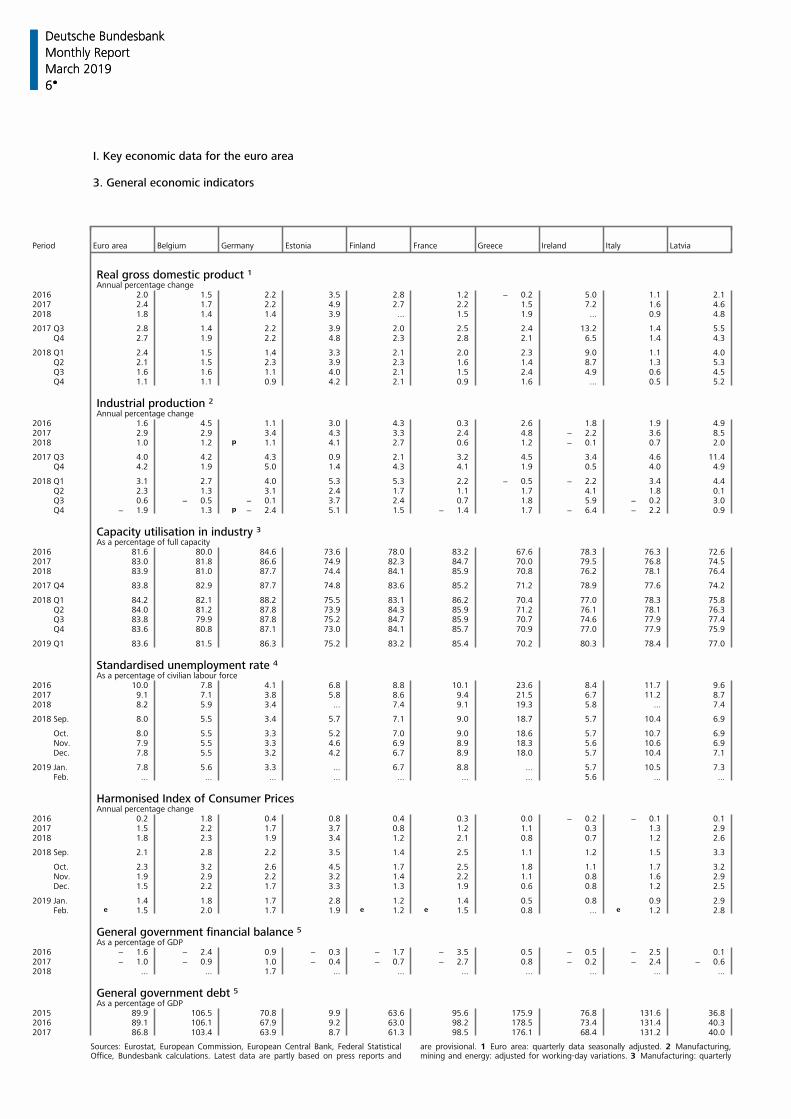
Deutsche Bundesbank
6
Monthly Report
March 2019
I. Key economic data for the euro area
3. General economic indicators
Period Euro area Belgium Germany Estonia Finland France Greece Ireland Italy Latvia
Real gross domestic product 1Annual percentage change
2016 2.0 1.5 2.2 3.5 2.8 1.2 − 0.2 5.0 1.1 2.12017 2.4 1.7 2.2 4.9 2.7 2.2 1.5 7.2 1.6 4.62018 1.8 1.4 1.4 3.9 ... 1.5 1.9 ... 0.9 4.8
2017 Q3 2.8 1.4 2.2 3.9 2.0 2.5 2.4 13.2 1.4 5.5 Q4 2.7 1.9 2.2 4.8 2.3 2.8 2.1 6.5 1.4 4.3
2018 Q1 2.4 1.5 1.4 3.3 2.1 2.0 2.3 9.0 1.1 4.0 Q2 2.1 1.5 2.3 3.9 2.3 1.6 1.4 8.7 1.3 5.3 Q3 1.6 1.6 1.1 4.0 2.1 1.5 2.4 4.9 0.6 4.5 Q4 1.1 1.1 0.9 4.2 2.1 0.9 1.6 ... 0.5 5.2
Industrial production 2 Annual percentage change2016 1.6 4.5 1.1 3.0 4.3 0.3 2.6 1.8 1.9 4.92017 2.9 2.9 3.4 4.3 3.3 2.4 4.8 − 2.2 3.6 8.52018 1.0 1.2 p 1.1 4.1 2.7 0.6 1.2 − 0.1 0.7 2.0
2017 Q3 4.0 4.2 4.3 0.9 2.1 3.2 4.5 3.4 4.6 11.4 Q4 4.2 1.9 5.0 1.4 4.3 4.1 1.9 0.5 4.0 4.9
2018 Q1 3.1 2.7 4.0 5.3 5.3 2.2 − 0.5 − 2.2 3.4 4.4 Q2 2.3 1.3 3.1 2.4 1.7 1.1 1.7 4.1 1.8 0.1 Q3 0.6 − 0.5 − 0.1 3.7 2.4 0.7 1.8 5.9 − 0.2 3.0 Q4 − 1.9 1.3 p − 2.4 5.1 1.5 − 1.4 1.7 − 6.4 − 2.2 0.9
Capacity utilisation in industry 3 As a percentage of full capacity2016 81.6 80.0 84.6 73.6 78.0 83.2 67.6 78.3 76.3 72.62017 83.0 81.8 86.6 74.9 82.3 84.7 70.0 79.5 76.8 74.52018 83.9 81.0 87.7 74.4 84.1 85.9 70.8 76.2 78.1 76.4
2017 Q4 83.8 82.9 87.7 74.8 83.6 85.2 71.2 78.9 77.6 74.2
2018 Q1 84.2 82.1 88.2 75.5 83.1 86.2 70.4 77.0 78.3 75.8 Q2 84.0 81.2 87.8 73.9 84.3 85.9 71.2 76.1 78.1 76.3 Q3 83.8 79.9 87.8 75.2 84.7 85.9 70.7 74.6 77.9 77.4 Q4 83.6 80.8 87.1 73.0 84.1 85.7 70.9 77.0 77.9 75.9
2019 Q1 83.6 81.5 86.3 75.2 83.2 85.4 70.2 80.3 78.4 77.0
Standardised unemployment rate 4 As a percentage of civilian labour force2016 10.0 7.8 4.1 6.8 8.8 10.1 23.6 8.4 11.7 9.62017 9.1 7.1 3.8 5.8 8.6 9.4 21.5 6.7 11.2 8.72018 8.2 5.9 3.4 ... 7.4 9.1 19.3 5.8 ... 7.4
2018 Sep. 8.0 5.5 3.4 5.7 7.1 9.0 18.7 5.7 10.4 6.9
Oct. 8.0 5.5 3.3 5.2 7.0 9.0 18.6 5.7 10.7 6.9 Nov. 7.9 5.5 3.3 4.6 6.9 8.9 18.3 5.6 10.6 6.9 Dec. 7.8 5.5 3.2 4.2 6.7 8.9 18.0 5.7 10.4 7.1
2019 Jan. 7.8 5.6 3.3 ... 6.7 8.8 ... 5.7 10.5 7.3 Feb. ... ... ... ... ... ... ... 5.6 ... ...
Deutsche Bundesbank
6
Monthly Report
March 2019
Harmonised Index of Consumer PricesAnnual percentage change
2016 0.2 1.8 0.4 0.8 0.4 0.3 0.0 − 0.2 − 0.1 0.12017 1.5 2.2 1.7 3.7 0.8 1.2 1.1 0.3 1.3 2.92018 1.8 2.3 1.9 3.4 1.2 2.1 0.8 0.7 1.2 2.6
2018 Sep. 2.1 2.8 2.2 3.5 1.4 2.5 1.1 1.2 1.5 3.3
Oct. 2.3 3.2 2.6 4.5 1.7 2.5 1.8 1.1 1.7 3.2 Nov. 1.9 2.9 2.2 3.2 1.4 2.2 1.1 0.8 1.6 2.9 Dec. 1.5 2.2 1.7 3.3 1.3 1.9 0.6 0.8 1.2 2.5
2019 Jan. 1.4 1.8 1.7 2.8 1.2 1.4 0.5 0.8 0.9 2.9 Feb. e 1.5 2.0 1.7 1.9 e 1.2 e 1.5 0.8 ... e 1.2 2.8
General government financial balance 5 As a percentage of GDP2016 − 1.6 − 2.4 0.9 − 0.3 − 1.7 − 3.5 0.5 − 0.5 − 2.5 0.12017 − 1.0 − 0.9 1.0 − 0.4 − 0.7 − 2.7 0.8 − 0.2 − 2.4 − 0.62018 ... ... 1.7 ... ... ... ... ... ... ...
General government debt 5 As a percentage of GDP2015 89.9 106.5 70.8 9.9 63.6 95.6 175.9 76.8 131.6 36.82016 89.1 106.1 67.9 9.2 63.0 98.2 178.5 73.4 131.4 40.32017 86.8 103.4 63.9 8.7 61.3 98.5 176.1 68.4 131.2 40.0
Sources: Eurostat, European Commission, European Central Bank, Federal Statistical are provisional. 1 Euro area: quarterly data seasonally adjusted. 2 Manufacturing,Office, Bundesbank calculations. Latest data are partly based on press reports and mining and energy: adjusted for working-day variations. 3 Manufacturing: quarterly
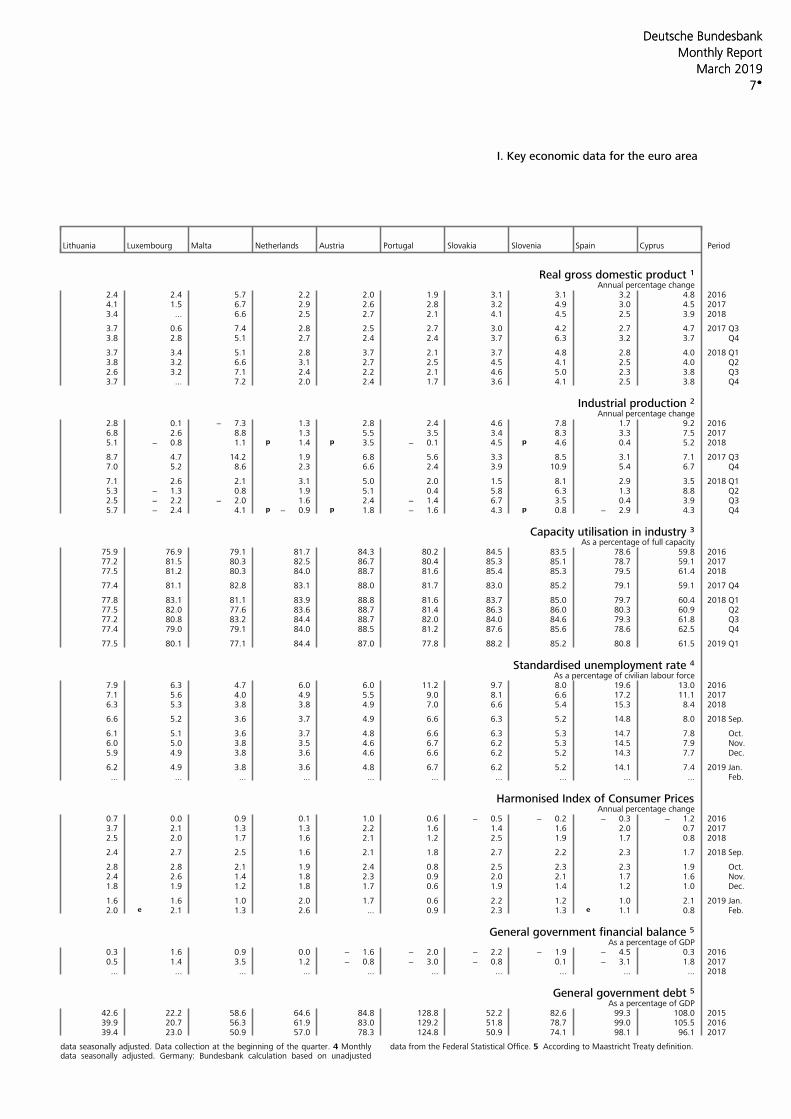
Deutsche Bundesbank
7
Monthly Report
March 2019
I. Key economic data for the euro area
Lithuania Luxembourg Malta Netherlands Austria Portugal Slovakia Slovenia Spain Cyprus Period
Real gross domestic product 1 Annual percentage change
2.4 2.4 5.7 2.2 2.0 1.9 3.1 3.1 3.2 4.8 20164.1 1.5 6.7 2.9 2.6 2.8 3.2 4.9 3.0 4.5 20173.4 ... 6.6 2.5 2.7 2.1 4.1 4.5 2.5 3.9 2018
3.7 0.6 7.4 2.8 2.5 2.7 3.0 4.2 2.7 4.7 2017 Q33.8 2.8 5.1 2.7 2.4 2.4 3.7 6.3 3.2 3.7 Q4
3.7 3.4 5.1 2.8 3.7 2.1 3.7 4.8 2.8 4.0 2018 Q13.8 3.2 6.6 3.1 2.7 2.5 4.5 4.1 2.5 4.0 Q22.6 3.2 7.1 2.4 2.2 2.1 4.6 5.0 2.3 3.8 Q33.7 ... 7.2 2.0 2.4 1.7 3.6 4.1 2.5 3.8 Q4
Industrial production 2Annual percentage change
2.8 0.1 − 7.3 1.3 2.8 2.4 4.6 7.8 1.7 9.2 20166.8 2.6 8.8 1.3 5.5 3.5 3.4 8.3 3.3 7.5 20175.1 − 0.8 1.1 p 1.4 p 3.5 − 0.1 4.5 p 4.6 0.4 5.2 2018
8.7 4.7 14.2 1.9 6.8 5.6 3.3 8.5 3.1 7.1 2017 Q37.0 5.2 8.6 2.3 6.6 2.4 3.9 10.9 5.4 6.7 Q4
7.1 2.6 2.1 3.1 5.0 2.0 1.5 8.1 2.9 3.5 2018 Q15.3 − 1.3 0.8 1.9 5.1 0.4 5.8 6.3 1.3 8.8 Q22.5 − 2.2 − 2.0 1.6 2.4 − 1.4 6.7 3.5 0.4 3.9 Q35.7 − 2.4 4.1 p − 0.9 p 1.8 − 1.6 4.3 p 0.8 − 2.9 4.3 Q4
Capacity utilisation in industry 3As a percentage of full capacity
75.9 76.9 79.1 81.7 84.3 80.2 84.5 83.5 78.6 59.8 201677.2 81.5 80.3 82.5 86.7 80.4 85.3 85.1 78.7 59.1 201777.5 81.2 80.3 84.0 88.7 81.6 85.4 85.3 79.5 61.4 2018
77.4 81.1 82.8 83.1 88.0 81.7 83.0 85.2 79.1 59.1 2017 Q4
77.8 83.1 81.1 83.9 88.8 81.6 83.7 85.0 79.7 60.4 2018 Q177.5 82.0 77.6 83.6 88.7 81.4 86.3 86.0 80.3 60.9 Q277.2 80.8 83.2 84.4 88.7 82.0 84.0 84.6 79.3 61.8 Q377.4 79.0 79.1 84.0 88.5 81.2 87.6 85.6 78.6 62.5 Q4
77.5 80.1 77.1 84.4 87.0 77.8 88.2 85.2 80.8 61.5 2019 Q1
Standardised unemployment rate 4As a percentage of civilian labour force
7.9 6.3 4.7 6.0 6.0 11.2 9.7 8.0 19.6 13.0 20167.1 5.6 4.0 4.9 5.5 9.0 8.1 6.6 17.2 11.1 20176.3 5.3 3.8 3.8 4.9 7.0 6.6 5.4 15.3 8.4 2018
6.6 5.2 3.6 3.7 4.9 6.6 6.3 5.2 14.8 8.0 2018 Sep.
6.1 5.1 3.6 3.7 4.8 6.6 6.3 5.3 14.7 7.8 Oct.6.0 5.0 3.8 3.5 4.6 6.7 6.2 5.3 14.5 7.9 Nov.5.9 4.9 3.8 3.6 4.6 6.6 6.2 5.2 14.3 7.7 Dec.
6.2 4.9 3.8 3.6 4.8 6.7 6.2 5.2 14.1 7.4 2019 Jan.... ... ... ... ... ... ... ... ... ... Feb.
Deutsche Bundesbank
7
Monthly Report
March 2019
Harmonised Index of Consumer Prices Annual percentage change
0.7 0.0 0.9 0.1 1.0 0.6 − 0.5 − 0.2 − 0.3 − 1.2 20163.7 2.1 1.3 1.3 2.2 1.6 1.4 1.6 2.0 0.7 20172.5 2.0 1.7 1.6 2.1 1.2 2.5 1.9 1.7 0.8 2018
2.4 2.7 2.5 1.6 2.1 1.8 2.7 2.2 2.3 1.7 2018 Sep.
2.8 2.8 2.1 1.9 2.4 0.8 2.5 2.3 2.3 1.9 Oct.2.4 2.6 1.4 1.8 2.3 0.9 2.0 2.1 1.7 1.6 Nov.1.8 1.9 1.2 1.8 1.7 0.6 1.9 1.4 1.2 1.0 Dec.
1.6 1.6 1.0 2.0 1.7 0.6 2.2 1.2 1.0 2.1 2019 Jan.2.0 e 2.1 1.3 2.6 ... 0.9 2.3 1.3 e 1.1 0.8 Feb.
General government financial balance 5As a percentage of GDP
0.3 1.6 0.9 0.0 − 1.6 − 2.0 − 2.2 − 1.9 − 4.5 0.3 20160.5 1.4 3.5 1.2 − 0.8 − 3.0 − 0.8 0.1 − 3.1 1.8 2017
... ... ... ... ... ... ... ... ... ... 2018
General government debt 5As a percentage of GDP
42.6 22.2 58.6 64.6 84.8 128.8 52.2 82.6 99.3 108.0 201539.9 20.7 56.3 61.9 83.0 129.2 51.8 78.7 99.0 105.5 201639.4 23.0 50.9 57.0 78.3 124.8 50.9 74.1 98.1 96.1 2017
data seasonally adjusted. Data collection at the beginning of the quarter. 4 Monthly data from the Federal Statistical Office. 5 According to Maastricht Treaty definition. data seasonally adjusted. Germany: Bundesbank calculation based on unadjusted
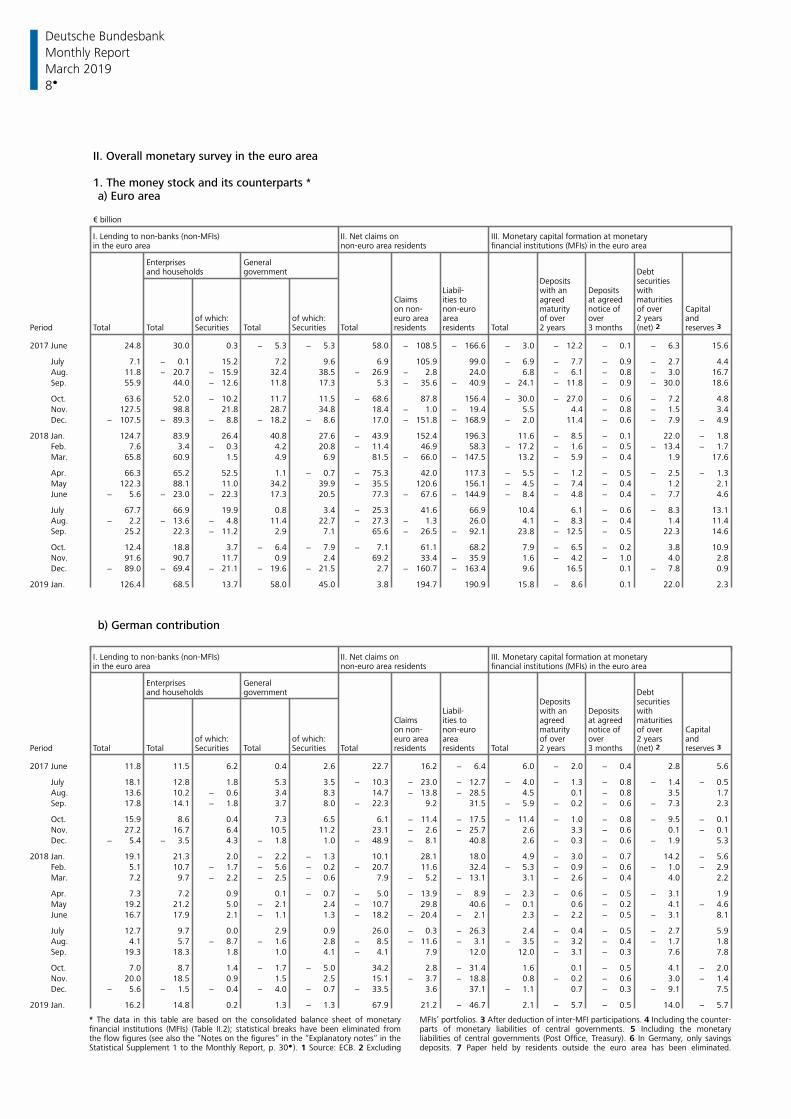
Deutsche Bundesbank
8
Monthly Report
March 2019
II. Overall monetary survey in the euro area
1. The money stock and its counterparts *a) Euro area
€ billion
I. Lending to non-banks (non-MFIs) II. Net claims on III. Monetary capital formation at monetaryin the euro area non-euro area residents financial institutions (MFIs) in the euro area
Enterprises Generaland households government Debt
Deposits securitiesLiabil- with an Deposits with
Claims ities to agreed at agreed maturitieson non- non-euro maturity notice of of over Capital
of which: of which: euro area area of over over 2 years andPeriod Total Total Total Total residents residents Total 2 years 3 months (net) 2 Securities Securities reserves 3
2017 June 24.8 30.0 0.3 − 5.3 − 5.3 58.0 − 108.5 − 166.6 − 3.0 − 12.2 − 0.1 − 6.3 15.6
July 7.1 − 0.1 15.2 7.2 9.6 6.9 105.9 99.0 − 6.9 − 7.7 − 0.9 − 2.7 4.4
Aug. 11.8 − 20.7 − 15.9 32.4 38.5 − 26.9 − 2.8 24.0 6.8 − 6.1 − 0.8 − 3.0 16.7
Sep. 55.9 44.0 − 12.6 11.8 17.3 5.3 − 35.6 − 40.9 − 24.1 − 11.8 − 0.9 − 30.0 18.6
Oct. 63.6 52.0 − 10.2 11.7 11.5 − 68.6 87.8 156.4 − 30.0 − 27.0 − 0.6 − 7.2 4.8
Nov. 127.5 98.8 21.8 28.7 34.8 18.4 − 1.0 − 19.4 5.5 4.4 − 0.8 − 1.5 3.4
Dec. − 107.5 − 89.3 − 8.8 − 18.2 − 8.6 17.0 − 151.8 − 168.9 − 2.0 11.4 − 0.6 − 7.9 − 4.9
2018 Jan. 124.7 83.9 26.4 40.8 27.6 − 43.9 152.4 196.3 11.6 − 8.5 − 0.1 22.0 − 1.8
Feb. 7.6 3.4 − 0.3 4.2 20.8 − 11.4 46.9 58.3 − 17.2 − 1.6 − 0.5 − 13.4 − 1.7
Mar. 65.8 60.9 1.5 4.9 6.9 81.5 − 66.0 − 147.5 13.2 − 5.9 − 0.4 1.9 17.6
Apr. 66.3 65.2 52.5 1.1 − 0.7 − 75.3 42.0 117.3 − 5.5 − 1.2 − 0.5 − 2.5 − 1.3
May 122.3 88.1 11.0 34.2 39.9 − 35.5 120.6 156.1 − 4.5 − 7.4 − 0.4 1.2 2.1
June − 5.6 − 23.0 − 22.3 17.3 20.5 77.3 − 67.6 − 144.9 − 8.4 − 4.8 − 0.4 − 7.7 4.6
July 67.7 66.9 19.9 0.8 3.4 − 25.3 41.6 66.9 10.4 6.1 − 0.6 − 8.3 13.1
Aug. − 2.2 − 13.6 − 4.8 11.4 22.7 − 27.3 − 1.3 26.0 4.1 − 8.3 − 0.4 1.4 11.4
Sep. 25.2 22.3 − 11.2 2.9 7.1 65.6 − 26.5 − 92.1 23.8 − 12.5 − 0.5 22.3 14.6
Oct. 12.4 18.8 3.7 − 6.4 − 7.9 − 7.1 61.1 68.2 7.9 − 6.5 − 0.2 3.8 10.9
Nov. 91.6 90.7 11.7 0.9 2.4 69.2 33.4 − 35.9 1.6 − 4.2 − 1.0 4.0 2.8
Dec. − 89.0 − 69.4 − 21.1 − 19.6 − 21.5 2.7 − 160.7 − 163.4 9.6 16.5 0.1 − 7.8 0.9
2019 Jan. 126.4 68.5 13.7 58.0 45.0 3.8 194.7 190.9 15.8 − 8.6 0.1 22.0 2.3
b) German contribution
I. Lending to non-banks (non-MFIs) II. Net claims on III. Monetary capital formation at monetaryin the euro area non-euro area residents financial institutions (MFIs) in the euro area
Enterprises Generaland households government Debt
Deposits securitiesLiabil- with an Deposits with
Claims ities to agreed at agreed maturitieson non- non-euro maturity notice of of over Capital
of which: of which: euro area area of over over 2 years andPeriod Total Total Total Total residents residents Total 2 years 3 months (net) 2 Securities Securities reserves 3
2017 June 11.8 11.5 6.2 0.4 2.6 22.7 16.2 − 6.4 6.0 − 2.0 − 0.4 2.8 5.6
July 18.1 12.8 1.8 5.3 3.5 − 10.3 − 23.0 − 12.7 − 4.0 − 1.3 − 0.8 − 1.4 − 0.5
Aug. 13.6 10.2 − 0.6 3.4 8.3 14.7 − 13.8 − 28.5 4.5 0.1 − 0.8 3.5 1.7
Sep. 17.8 14.1 − 1.8 3.7 8.0 − 22.3 9.2 31.5 − 5.9 − 0.2 − 0.6 − 7.3 2.3
Oct. 15.9 8.6 0.4 7.3 6.5 6.1 − 11.4 − 17.5 − 11.4 − 1.0 − 0.8 − 9.5 − 0.1
Nov. 27.2 16.7 6.4 10.5 11.2 23.1 − 2.6 − 25.7 2.6 3.3 − 0.6 0.1 − 0.1
Dec. − 5.4 − 3.5 4.3 − 1.8 1.0 − 48.9 − 8.1 40.8 2.6 − 0.3 − 0.6 − 1.9 5.3
2018 Jan. 19.1 21.3 2.0 − 2.2 − 1.3 10.1 28.1 18.0 4.9 − 3.0 − 0.7 14.2 − 5.6
Feb. 5.1 10.7 − 1.7 − 5.6 − 0.2 − 20.7 11.6 32.4 − 5.3 − 0.9 − 0.6 − 1.0 − 2.9
Mar. 7.2 9.7 − 2.2 − 2.5 − 0.6 7.9 − 5.2 − 13.1 3.1 − 2.6 − 0.4 4.0 2.2
Apr. 7.3 7.2 0.9 0.1 − 0.7 − 5.0 − 13.9 − 8.9 − 2.3 − 0.6 − 0.5 − 3.1 1.9
May 19.2 21.2 5.0 − 2.1 2.4 − 10.7 29.8 40.6 − 0.1 0.6 − 0.2 4.1 − 4.6
June 16.7 17.9 2.1 − 1.1 1.3 − 18.2 − 20.4 − 2.1 2.3 − 2.2 − 0.5 − 3.1 8.1
July 12.7 9.7 0.0 2.9 0.9 26.0 − 0.3 − 26.3 2.4 − 0.4 − 0.5 − 2.7 5.9
Aug. 4.1 5.7 − 8.7 − 1.6 2.8 − 8.5 − 11.6 − 3.1 − 3.5 − 3.2 − 0.4 − 1.7 1.8
Sep. 19.3 18.3 1.8 1.0 4.1 − 4.1 7.9 12.0 12.0 − 3.1 − 0.3 7.6 7.8
Oct. 7.0 8.7 1.4 − 1.7 − 5.0 34.2 2.8 − 31.4 1.6 0.1 − 0.5 4.1 − 2.0
Nov. 20.0 18.5 0.9 1.5 2.5 15.1 − 3.7 − 18.8 0.8 − 0.2 − 0.6 3.0 − 1.4
Dec. − 5.6 − 1.5 − 0.4 − 4.0 − 0.7 − 33.5 3.6 37.1 − 1.1 0.7 − 0.3 − 9.1 7.5
2019 Jan. 16.2 14.8 0.2 1.3 − 1.3 67.9 21.2 − 46.7 2.1 − 5.7 − 0.5 14.0 − 5.7
* The data in this table are based on the consolidated balance sheet of monetary MFIs’ portfolios. 3 After deduction of inter-MFI participations. 4 Including the counter-financial institutions (MFIs) (Table II.2); statistical breaks have been eliminated from parts of monetary liabilities of central governments. 5 Including the monetarythe flow figures (see also the “Notes on the figures“ in the “Explanatory notes“ in the liabilities of central governments (Post Office, Treasury). 6 In Germany, only savingsStatistical Supplement 1 to the Monthly Report, p. 30 ). 1 Source: ECB. 2 Excluding deposits. 7 Paper held by residents outside the euro area has been eliminated.
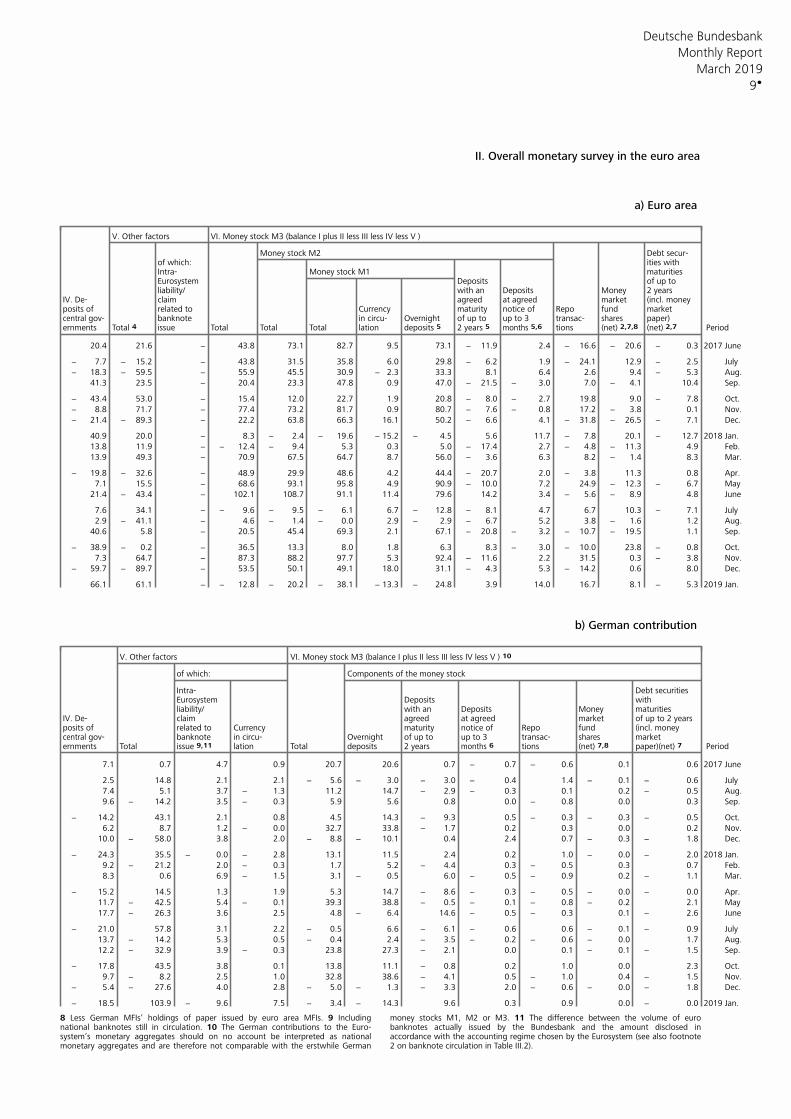
Deutsche Bundesbank
9
Monthly Report
March 2019
II. Overall monetary survey in the euro area
a) Euro area
V. Other factors VI. Money stock M3 (balance I plus II less III less IV less V )
Money stock M2 Debt secur-of which: ities withIntra- Money stock M1 maturitiesEurosystem Deposits of up toliability/ with an Deposits Money 2 years
IV. De- claim agreed at agreed market (incl. moneyposits of related to Currency maturity notice of Repo fund market
banknote in circu- Overnight of up to up to 3 transac- shares paper) central gov-ernments Total 4 issue Total Total Total lation deposits 5 2 years 5 tions (net) 2,7 Period(net) 2,7,8 months 5,6
20.4 21.6 − 43.8 73.1 82.7 9.5 73.1 − 11.9 2.4 − 16.6 − 20.6 − 0.3 2017 June
− 7.7 − 15.2 − 43.8 31.5 35.8 6.0 29.8 − 6.2 1.9 − 24.1 12.9 − 2.5 July
− 18.3 − 59.5 − 55.9 45.5 30.9 − 2.3 33.3 8.1 6.4 2.6 9.4 − 5.3 Aug.
41.3 23.5 − 20.4 23.3 47.8 0.9 47.0 − 21.5 − 3.0 7.0 − 4.1 10.4 Sep.
− 43.4 53.0 − 15.4 12.0 22.7 1.9 20.8 − 8.0 − 2.7 19.8 9.0 − 7.8 Oct.
− 8.8 71.7 − 77.4 73.2 81.7 0.9 80.7 − 7.6 − 0.8 17.2 − 3.8 0.1 Nov.
− 21.4 − 89.3 − 22.2 63.8 66.3 16.1 50.2 − 6.6 4.1 − 31.8 − 26.5 − 7.1 Dec.
40.9 20.0 − 8.3 − 2.4 − 19.6 − 15.2 − 4.5 5.6 11.7 − 7.8 20.1 − 12.7 2018 Jan.
13.8 11.9 − − 12.4 − 9.4 5.3 0.3 5.0 − 17.4 2.7 − 4.8 − 11.3 4.9 Feb.
13.9 49.3 − 70.9 67.5 64.7 8.7 56.0 − 3.6 6.3 8.2 − 1.4 8.3 Mar.
− 19.8 − 32.6 − 48.9 29.9 48.6 4.2 44.4 − 20.7 2.0 − 3.8 11.3 0.8 Apr.
7.1 15.5 − 68.6 93.1 95.8 4.9 90.9 − 10.0 7.2 24.9 − 12.3 − 6.7 May
21.4 − 43.4 − 102.1 108.7 91.1 11.4 79.6 14.2 3.4 − 5.6 − 8.9 4.8 June
7.6 34.1 − − 9.6 − 9.5 − 6.1 6.7 − 12.8 − 8.1 4.7 6.7 10.3 − 7.1 July
2.9 − 41.1 − 4.6 − 1.4 − 0.0 2.9 − 2.9 − 6.7 5.2 3.8 − 1.6 1.2 Aug.
40.6 5.8 − 20.5 45.4 69.3 2.1 67.1 − 20.8 − 3.2 − 10.7 − 19.5 1.1 Sep.
− 38.9 − 0.2 − 36.5 13.3 8.0 1.8 6.3 8.3 − 3.0 − 10.0 23.8 − 0.8 Oct.
7.3 64.7 − 87.3 88.2 97.7 5.3 92.4 − 11.6 2.2 31.5 0.3 − 3.8 Nov.
− 59.7 − 89.7 − 53.5 50.1 49.1 18.0 31.1 − 4.3 5.3 − 14.2 0.6 8.0 Dec.
66.1 61.1 − − 12.8 − 20.2 − 38.1 − 13.3 − 24.8 3.9 14.0 16.7 8.1 − 5.3 2019 Jan.
b) German contribution
V. Other factors VI. Money stock M3 (balance I plus II less III less IV less V ) 10
of which: Components of the money stock
Intra- Debt securitiesEurosystem Deposits withliability/ with an Deposits Money maturities
IV. De- claim agreed at agreed market of up to 2 yearsposits of related to Currency maturity notice of Repo fund (incl. money
banknote in circu- Overnight of up to up to 3 transac- shares market central gov-ernments Total issue 9,11 lation Total deposits 2 years months 6 tions (net) 7,8 paper)(net) 7 Period
7.1 0.7 4.7 0.9 20.7 20.6 0.7 − 0.7 − 0.6 0.1 0.6 2017 June
2.5 14.8 2.1 2.1 − 5.6 − 3.0 − 3.0 − 0.4 1.4 − 0.1 − 0.6 July
7.4 5.1 3.7 − 1.3 11.2 14.7 − 2.9 − 0.3 0.1 0.2 − 0.5 Aug.
9.6 − 14.2 3.5 − 0.3 5.9 5.6 0.8 0.0 − 0.8 0.0 0.3 Sep.
− 14.2 43.1 2.1 0.8 4.5 14.3 − 9.3 0.5 − 0.3 − 0.3 − 0.5 Oct.
6.2 8.7 1.2 − 0.0 32.7 33.8 − 1.7 0.2 0.3 0.0 0.2 Nov.
10.0 − 58.0 3.8 2.0 − 8.8 − 10.1 0.4 2.4 0.7 − 0.3 − 1.8 Dec.
− 24.3 35.5 − 0.0 − 2.8 13.1 11.5 2.4 0.2 1.0 − 0.0 − 2.0 2018 Jan.
9.2 − 21.2 2.0 − 0.3 1.7 5.2 − 4.4 0.3 − 0.5 0.3 0.7 Feb.
8.3 0.6 6.9 − 1.5 3.1 − 0.5 6.0 − 0.5 − 0.9 0.2 − 1.1 Mar.
− 15.2 14.5 1.3 1.9 5.3 14.7 − 8.6 − 0.3 − 0.5 − 0.0 − 0.0 Apr.
11.7 − 42.5 5.4 − 0.1 39.3 38.8 − 0.5 − 0.1 − 0.8 − 0.2 2.1 May
17.7 − 26.3 3.6 2.5 4.8 − 6.4 14.6 − 0.5 − 0.3 0.1 − 2.6 June
− 21.0 57.8 3.1 2.2 − 0.5 6.6 − 6.1 − 0.6 0.6 − 0.1 − 0.9 July
13.7 − 14.2 5.3 0.5 − 0.4 2.4 − 3.5 − 0.2 − 0.6 − 0.0 1.7 Aug.
12.2 − 32.9 3.9 − 0.3 23.8 27.3 − 2.1 0.0 0.1 − 0.1 − 1.5 Sep.
− 17.8 43.5 3.8 0.1 13.8 11.1 − 0.8 0.2 1.0 0.0 2.3 Oct.
9.7 − 8.2 2.5 1.0 32.8 38.6 − 4.1 0.5 − 1.0 0.4 − 1.5 Nov.
− 5.4 − 27.6 4.0 2.8 − 5.0 − 1.3 − 3.3 2.0 − 0.6 − 0.0 − 1.8 Dec.
− 18.5 103.9 − 9.6 7.5 − 3.4 − 14.3 9.6 0.3 0.9 0.0 − 0.0 2019 Jan.
8 Less German MFIs’ holdings of paper issued by euro area MFIs. 9 Including money stocks M1, M2 or M3. 11 The difference between the volume of euronational banknotes still in circulation. 10 The German contributions to the Euro- banknotes actually issued by the Bundesbank and the amount disclosed insystem’s monetary aggregates should on no account be interpreted as national accordance with the accounting regime chosen by the Eurosystem (see also footnotemonetary aggregates and are therefore not comparable with the erstwhile German 2 on banknote circulation in Table III.2).
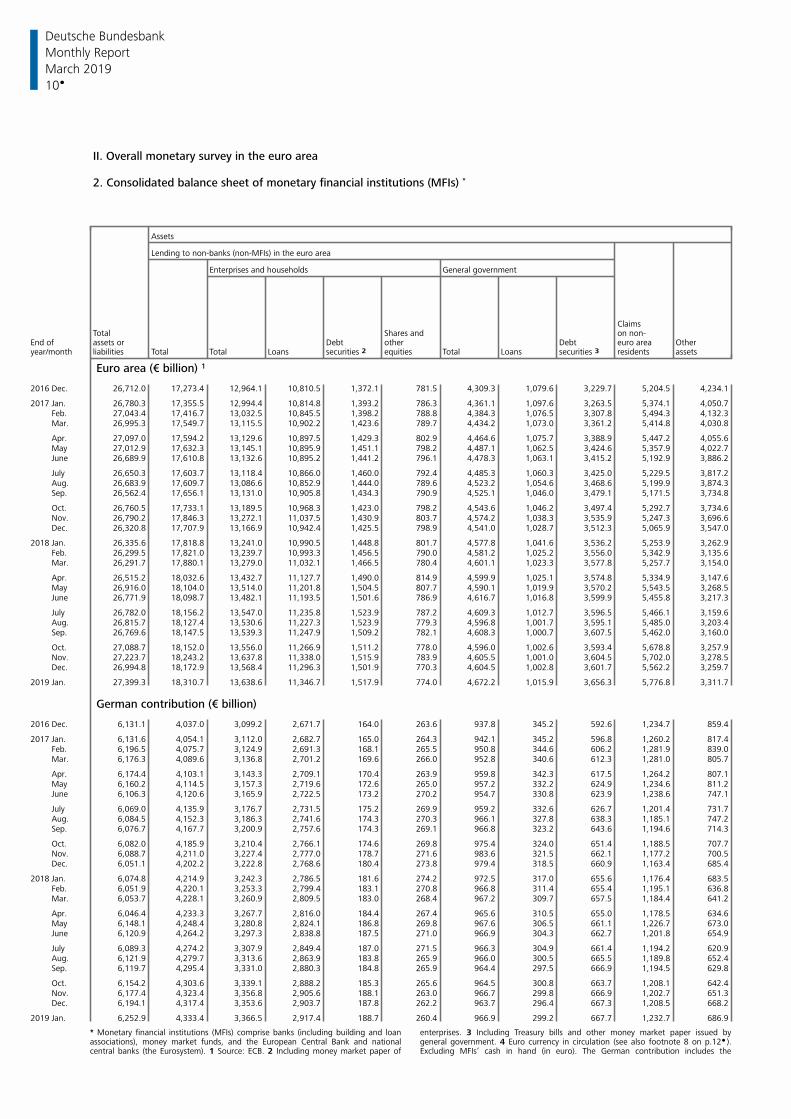
Deutsche Bundesbank
10
Monthly Report
March 2019
II. Overall monetary survey in the euro area
2. Consolidated balance sheet of monetary financial institutions (MFIs) *
Assets
Lending to non-banks (non-MFIs) in the euro area
Enterprises and households General government
ClaimsTotal Shares and on non-
End of assets or Debt other Debt euro area Otheryear/month liabilities Total Total Loans securities 2 equities Total Loans securities 3 residents assets
Euro area (€ billion) 1
2016 Dec. 26,712.0 17,273.4 12,964.1 10,810.5 1,372.1 781.5 4,309.3 1,079.6 3,229.7 5,204.5 4,234.1
2017 Jan. 26,780.3 17,355.5 12,994.4 10,814.8 1,393.2 786.3 4,361.1 1,097.6 3,263.5 5,374.1 4,050.7 Feb. 27,043.4 17,416.7 13,032.5 10,845.5 1,398.2 788.8 4,384.3 1,076.5 3,307.8 5,494.3 4,132.3 Mar. 26,995.3 17,549.7 13,115.5 10,902.2 1,423.6 789.7 4,434.2 1,073.0 3,361.2 5,414.8 4,030.8
Apr. 27,097.0 17,594.2 13,129.6 10,897.5 1,429.3 802.9 4,464.6 1,075.7 3,388.9 5,447.2 4,055.6 May 27,012.9 17,632.3 13,145.1 10,895.9 1,451.1 798.2 4,487.1 1,062.5 3,424.6 5,357.9 4,022.7 June 26,689.9 17,610.8 13,132.6 10,895.2 1,441.2 796.1 4,478.3 1,063.1 3,415.2 5,192.9 3,886.2
July 26,650.3 17,603.7 13,118.4 10,866.0 1,460.0 792.4 4,485.3 1,060.3 3,425.0 5,229.5 3,817.2 Aug. 26,683.9 17,609.7 13,086.6 10,852.9 1,444.0 789.6 4,523.2 1,054.6 3,468.6 5,199.9 3,874.3 Sep. 26,562.4 17,656.1 13,131.0 10,905.8 1,434.3 790.9 4,525.1 1,046.0 3,479.1 5,171.5 3,734.8
Oct. 26,760.5 17,733.1 13,189.5 10,968.3 1,423.0 798.2 4,543.6 1,046.2 3,497.4 5,292.7 3,734.6 Nov. 26,790.2 17,846.3 13,272.1 11,037.5 1,430.9 803.7 4,574.2 1,038.3 3,535.9 5,247.3 3,696.6 Dec. 26,320.8 17,707.9 13,166.9 10,942.4 1,425.5 798.9 4,541.0 1,028.7 3,512.3 5,065.9 3,547.0
2018 Jan. 26,335.6 17,818.8 13,241.0 10,990.5 1,448.8 801.7 4,577.8 1,041.6 3,536.2 5,253.9 3,262.9 Feb. 26,299.5 17,821.0 13,239.7 10,993.3 1,456.5 790.0 4,581.2 1,025.2 3,556.0 5,342.9 3,135.6 Mar. 26,291.7 17,880.1 13,279.0 11,032.1 1,466.5 780.4 4,601.1 1,023.3 3,577.8 5,257.7 3,154.0
Apr. 26,515.2 18,032.6 13,432.7 11,127.7 1,490.0 814.9 4,599.9 1,025.1 3,574.8 5,334.9 3,147.6 May 26,916.0 18,104.0 13,514.0 11,201.8 1,504.5 807.7 4,590.1 1,019.9 3,570.2 5,543.5 3,268.5 June 26,771.9 18,098.7 13,482.1 11,193.5 1,501.6 786.9 4,616.7 1,016.8 3,599.9 5,455.8 3,217.3
July 26,782.0 18,156.2 13,547.0 11,235.8 1,523.9 787.2 4,609.3 1,012.7 3,596.5 5,466.1 3,159.6 Aug. 26,815.7 18,127.4 13,530.6 11,227.3 1,523.9 779.3 4,596.8 1,001.7 3,595.1 5,485.0 3,203.4 Sep. 26,769.6 18,147.5 13,539.3 11,247.9 1,509.2 782.1 4,608.3 1,000.7 3,607.5 5,462.0 3,160.0
Oct. 27,088.7 18,152.0 13,556.0 11,266.9 1,511.2 778.0 4,596.0 1,002.6 3,593.4 5,678.8 3,257.9 Nov. 27,223.7 18,243.2 13,637.8 11,338.0 1,515.9 783.9 4,605.5 1,001.0 3,604.5 5,702.0 3,278.5 Dec. 26,994.8 18,172.9 13,568.4 11,296.3 1,501.9 770.3 4,604.5 1,002.8 3,601.7 5,562.2 3,259.7
2019 Jan. 27,399.3 18,310.7 13,638.6 11,346.7 1,517.9 774.0 4,672.2 1,015.9 3,656.3 5,776.8 3,311.7
German contribution (€ billion)
2016 Dec. 6,131.1 4,037.0 3,099.2 2,671.7 164.0 263.6 937.8 345.2 592.6 1,234.7 859.4
2017 Jan. 6,131.6 4,054.1 3,112.0 2,682.7 165.0 264.3 942.1 345.2 596.8 1,260.2 817.4 Feb. 6,196.5 4,075.7 3,124.9 2,691.3 168.1 265.5 950.8 344.6 606.2 1,281.9 839.0 Mar. 6,176.3 4,089.6 3,136.8 2,701.2 169.6 266.0 952.8 340.6 612.3 1,281.0 805.7
Apr. 6,174.4 4,103.1 3,143.3 2,709.1 170.4 263.9 959.8 342.3 617.5 1,264.2 807.1 May 6,160.2 4,114.5 3,157.3 2,719.6 172.6 265.0 957.2 332.2 624.9 1,234.6 811.2 June 6,106.3 4,120.6 3,165.9 2,722.5 173.2 270.2 954.7 330.8 623.9 1,238.6 747.1
July 6,069.0 4,135.9 3,176.7 2,731.5 175.2 269.9 959.2 332.6 626.7 1,201.4 731.7 Aug. 6,084.5 4,152.3 3,186.3 2,741.6 174.3 270.3 966.1 327.8 638.3 1,185.1 747.2 Sep. 6,076.7 4,167.7 3,200.9 2,757.6 174.3 269.1 966.8 323.2 643.6 1,194.6 714.3
Oct. 6,082.0 4,185.9 3,210.4 2,766.1 174.6 269.8 975.4 324.0 651.4 1,188.5 707.7 Nov. 6,088.7 4,211.0 3,227.4 2,777.0 178.7 271.6 983.6 321.5 662.1 1,177.2 700.5 Dec. 6,051.1 4,202.2 3,222.8 2,768.6 180.4 273.8 979.4 318.5 660.9 1,163.4 685.4
2018 Jan. 6,074.8 4,214.9 3,242.3 2,786.5 181.6 274.2 972.5 317.0 655.6 1,176.4 683.5 Feb. 6,051.9 4,220.1 3,253.3 2,799.4 183.1 270.8 966.8 311.4 655.4 1,195.1 636.8 Mar. 6,053.7 4,228.1 3,260.9 2,809.5 183.0 268.4 967.2 309.7 657.5 1,184.4 641.2
Apr. 6,046.4 4,233.3 3,267.7 2,816.0 184.4 267.4 965.6 310.5 655.0 1,178.5 634.6 May 6,148.1 4,248.4 3,280.8 2,824.1 186.8 269.8 967.6 306.5 661.1 1,226.7 673.0 June 6,120.9 4,264.2 3,297.3 2,838.8 187.5 271.0 966.9 304.3 662.7 1,201.8 654.9
July 6,089.3 4,274.2 3,307.9 2,849.4 187.0 271.5 966.3 304.9 661.4 1,194.2 620.9 Aug. 6,121.9 4,279.7 3,313.6 2,863.9 183.8 265.9 966.0 300.5 665.5 1,189.8 652.4 Sep. 6,119.7 4,295.4 3,331.0 2,880.3 184.8 265.9 964.4 297.5 666.9 1,194.5 629.8
Oct. 6,154.2 4,303.6 3,339.1 2,888.2 185.3 265.6 964.5 300.8 663.7 1,208.1 642.4 Nov. 6,177.4 4,323.4 3,356.8 2,905.6 188.1 263.0 966.7 299.8 666.9 1,202.7 651.3 Dec. 6,194.1 4,317.4 3,353.6 2,903.7 187.8 262.2 963.7 296.4 667.3 1,208.5 668.2
2019 Jan. 6,252.9 4,333.4 3,366.5 2,917.4 188.7 260.4 966.9 299.2 667.7 1,232.7 686.9
* Monetary financial institutions (MFIs) comprise banks (including building and loan enterprises. 3 Including Treasury bills and other money market paper issued byassociations), money market funds, and the European Central Bank and national general government. 4 Euro currency in circulation (see also footnote 8 on p.12 ).central banks (the Eurosystem). 1 Source: ECB. 2 Including money market paper of Excluding MFIs‘ cash in hand (in euro). The German contribution includes the
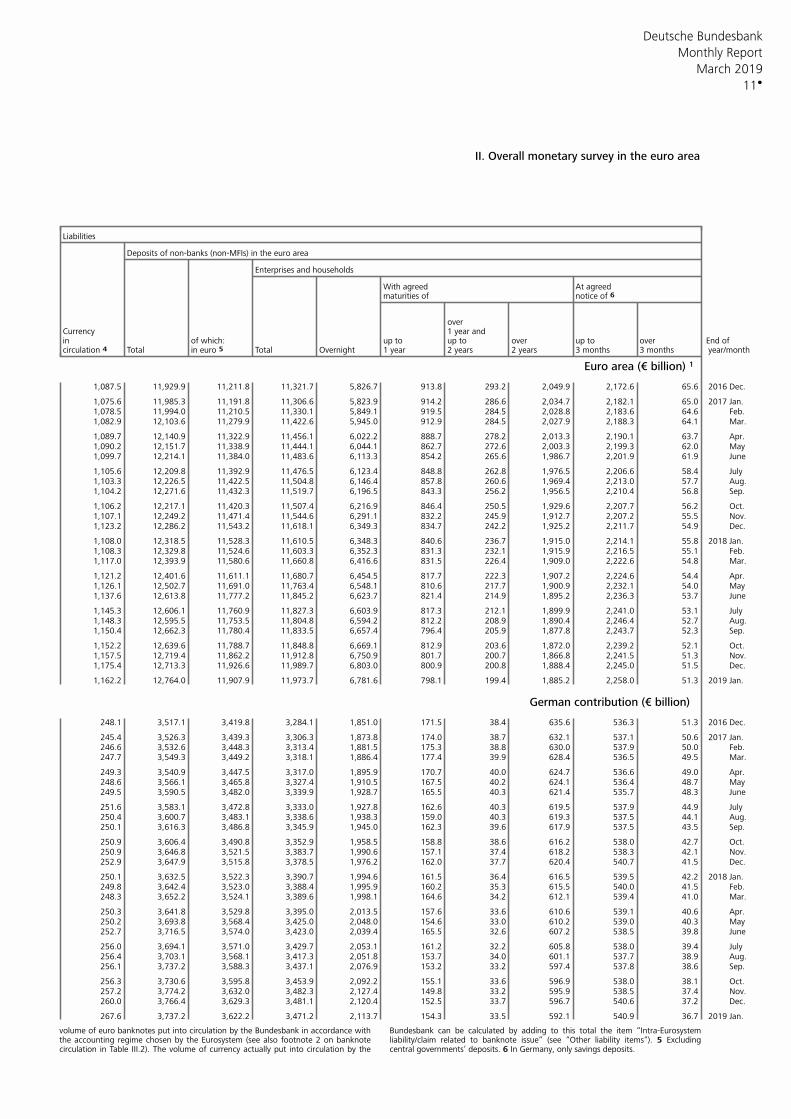
Deutsche Bundesbank
11
Monthly Report
March 2019
II. Overall monetary survey in the euro area
Liabilities
Deposits of non-banks (non-MFIs) in the euro area
Enterprises and households
With agreed At agreedmaturities of notice of 6
overCurrency 1 year andin of which: up to up to over up to over End of
Total in euro 5 Total Overnight 1 year 2 years 2 years 3 months 3 months year/monthcirculation 4
Euro area (€ billion) 1
1,087.5 11,929.9 11,211.8 11,321.7 5,826.7 913.8 293.2 2,049.9 2,172.6 65.6 2016 Dec.
1,075.6 11,985.3 11,191.8 11,306.6 5,823.9 914.2 286.6 2,034.7 2,182.1 65.0 2017 Jan.1,078.5 11,994.0 11,210.5 11,330.1 5,849.1 919.5 284.5 2,028.8 2,183.6 64.6 Feb.1,082.9 12,103.6 11,279.9 11,422.6 5,945.0 912.9 284.5 2,027.9 2,188.3 64.1 Mar.
1,089.7 12,140.9 11,322.9 11,456.1 6,022.2 888.7 278.2 2,013.3 2,190.1 63.7 Apr.1,090.2 12,151.7 11,338.9 11,444.1 6,044.1 862.7 272.6 2,003.3 2,199.3 62.0 May1,099.7 12,214.1 11,384.0 11,483.6 6,113.3 854.2 265.6 1,986.7 2,201.9 61.9 June
1,105.6 12,209.8 11,392.9 11,476.5 6,123.4 848.8 262.8 1,976.5 2,206.6 58.4 July1,103.3 12,226.5 11,422.5 11,504.8 6,146.4 857.8 260.6 1,969.4 2,213.0 57.7 Aug.1,104.2 12,271.6 11,432.3 11,519.7 6,196.5 843.3 256.2 1,956.5 2,210.4 56.8 Sep.
1,106.2 12,217.1 11,420.3 11,507.4 6,216.9 846.4 250.5 1,929.6 2,207.7 56.2 Oct.1,107.1 12,249.2 11,471.4 11,544.6 6,291.1 832.2 245.9 1,912.7 2,207.2 55.5 Nov.1,123.2 12,286.2 11,543.2 11,618.1 6,349.3 834.7 242.2 1,925.2 2,211.7 54.9 Dec.
1,108.0 12,318.5 11,528.3 11,610.5 6,348.3 840.6 236.7 1,915.0 2,214.1 55.8 2018 Jan.1,108.3 12,329.8 11,524.6 11,603.3 6,352.3 831.3 232.1 1,915.9 2,216.5 55.1 Feb.1,117.0 12,393.9 11,580.6 11,660.8 6,416.6 831.5 226.4 1,909.0 2,222.6 54.8 Mar.
1,121.2 12,401.6 11,611.1 11,680.7 6,454.5 817.7 222.3 1,907.2 2,224.6 54.4 Apr.1,126.1 12,502.7 11,691.0 11,763.4 6,548.1 810.6 217.7 1,900.9 2,232.1 54.0 May1,137.6 12,613.8 11,777.2 11,845.2 6,623.7 821.4 214.9 1,895.2 2,236.3 53.7 June
1,145.3 12,606.1 11,760.9 11,827.3 6,603.9 817.3 212.1 1,899.9 2,241.0 53.1 July1,148.3 12,595.5 11,753.5 11,804.8 6,594.2 812.2 208.9 1,890.4 2,246.4 52.7 Aug.1,150.4 12,662.3 11,780.4 11,833.5 6,657.4 796.4 205.9 1,877.8 2,243.7 52.3 Sep.
1,152.2 12,639.6 11,788.7 11,848.8 6,669.1 812.9 203.6 1,872.0 2,239.2 52.1 Oct.1,157.5 12,719.4 11,862.2 11,912.8 6,750.9 801.7 200.7 1,866.8 2,241.5 51.3 Nov.1,175.4 12,713.3 11,926.6 11,989.7 6,803.0 800.9 200.8 1,888.4 2,245.0 51.5 Dec.
1,162.2 12,764.0 11,907.9 11,973.7 6,781.6 798.1 199.4 1,885.2 2,258.0 51.3 2019 Jan.
German contribution (€ billion)
248.1 3,517.1 3,419.8 3,284.1 1,851.0 171.5 38.4 635.6 536.3 51.3 2016 Dec.
245.4 3,526.3 3,439.3 3,306.3 1,873.8 174.0 38.7 632.1 537.1 50.6 2017 Jan.246.6 3,532.6 3,448.3 3,313.4 1,881.5 175.3 38.8 630.0 537.9 50.0 Feb.247.7 3,549.3 3,449.2 3,318.1 1,886.4 177.4 39.9 628.4 536.5 49.5 Mar.
249.3 3,540.9 3,447.5 3,317.0 1,895.9 170.7 40.0 624.7 536.6 49.0 Apr.248.6 3,566.1 3,465.8 3,327.4 1,910.5 167.5 40.2 624.1 536.4 48.7 May249.5 3,590.5 3,482.0 3,339.9 1,928.7 165.5 40.3 621.4 535.7 48.3 June
251.6 3,583.1 3,472.8 3,333.0 1,927.8 162.6 40.3 619.5 537.9 44.9 July250.4 3,600.7 3,483.1 3,338.6 1,938.3 159.0 40.3 619.3 537.5 44.1 Aug.250.1 3,616.3 3,486.8 3,345.9 1,945.0 162.3 39.6 617.9 537.5 43.5 Sep.
250.9 3,606.4 3,490.8 3,352.9 1,958.5 158.8 38.6 616.2 538.0 42.7 Oct.250.9 3,646.8 3,521.5 3,383.7 1,990.6 157.1 37.4 618.2 538.3 42.1 Nov.252.9 3,647.9 3,515.8 3,378.5 1,976.2 162.0 37.7 620.4 540.7 41.5 Dec.
250.1 3,632.5 3,522.3 3,390.7 1,994.6 161.5 36.4 616.5 539.5 42.2 2018 Jan.249.8 3,642.4 3,523.0 3,388.4 1,995.9 160.2 35.3 615.5 540.0 41.5 Feb.248.3 3,652.2 3,524.1 3,389.6 1,998.1 164.6 34.2 612.1 539.4 41.0 Mar.
250.3 3,641.8 3,529.8 3,395.0 2,013.5 157.6 33.6 610.6 539.1 40.6 Apr.250.2 3,693.8 3,568.4 3,425.0 2,048.0 154.6 33.0 610.2 539.0 40.3 May252.7 3,716.5 3,574.0 3,423.0 2,039.4 165.5 32.6 607.2 538.5 39.8 June
256.0 3,694.1 3,571.0 3,429.7 2,053.1 161.2 32.2 605.8 538.0 39.4 July256.4 3,703.1 3,568.1 3,417.3 2,051.8 153.7 34.0 601.1 537.7 38.9 Aug.256.1 3,737.2 3,588.3 3,437.1 2,076.9 153.2 33.2 597.4 537.8 38.6 Sep.
256.3 3,730.6 3,595.8 3,453.9 2,092.2 155.1 33.6 596.9 538.0 38.1 Oct.257.2 3,774.2 3,632.0 3,482.3 2,127.4 149.8 33.2 595.9 538.5 37.4 Nov.260.0 3,766.4 3,629.3 3,481.1 2,120.4 152.5 33.7 596.7 540.6 37.2 Dec.
267.6 3,737.2 3,622.2 3,471.2 2,113.7 154.3 33.5 592.1 540.9 36.7 2019 Jan.
volume of euro banknotes put into circulation by the Bundesbank in accordance with Bundesbank can be calculated by adding to this total the item “Intra-Eurosystemthe accounting regime chosen by the Eurosystem (see also footnote 2 on banknote liability/claim related to banknote issue“ (see “Other liability items“). 5 Excludingcirculation in Table III.2). The volume of currency actually put into circulation by the central governments’ deposits. 6 In Germany, only savings deposits.
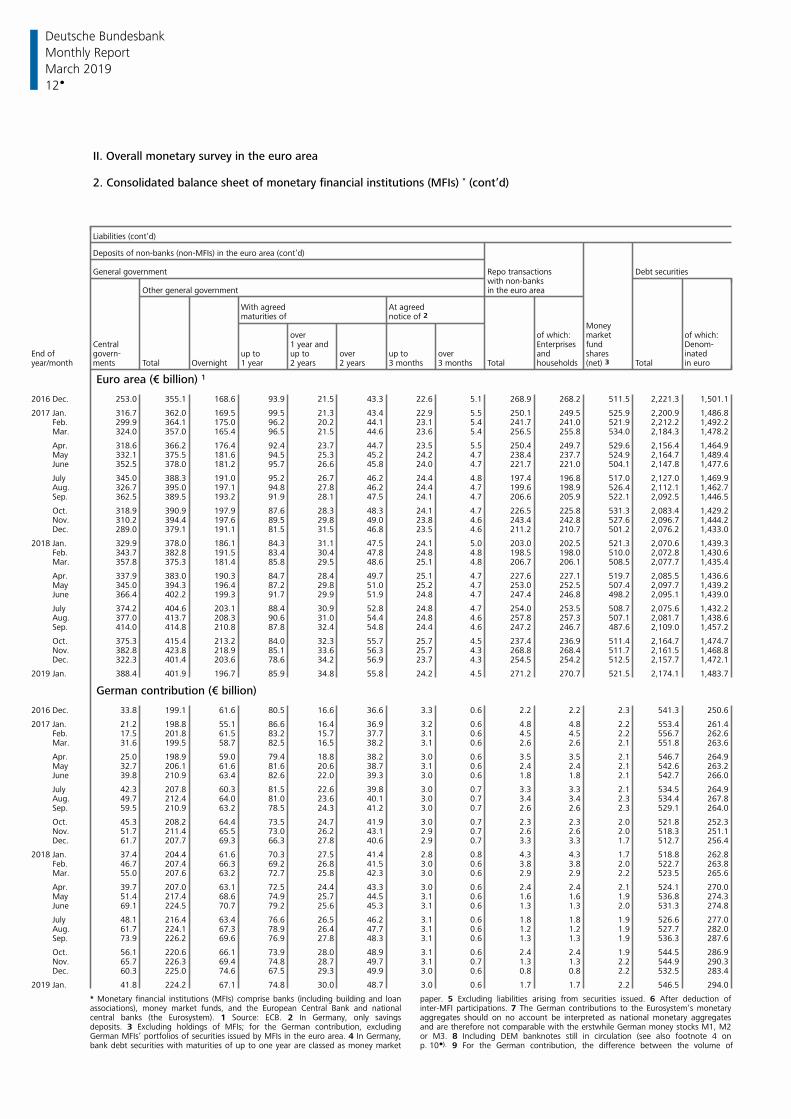
Deutsche Bundesbank
12
Monthly Report
March 2019
II. Overall monetary survey in the euro area
2. Consolidated balance sheet of monetary financial institutions (MFIs) * (cont’d)
Liabilities (cont’d)
Deposits of non-banks (non-MFIs) in the euro area (cont’d)
General government Repo transactions Debt securitieswith non-banks
Other general government in the euro area
With agreed At agreedmaturities of notice of 2
Moneyover of which: market of which:
Central 1 year and Enterprises fund Denom-End of govern- up to up to over up to over and shares inatedyear/month ments Total Overnight 1 year 2 years 2 years 3 months 3 months Total households (net) 3 Total in euro
Euro area (€ billion) 1
2016 Dec. 253.0 355.1 168.6 93.9 21.5 43.3 22.6 5.1 268.9 268.2 511.5 2,221.3 1,501.1
2017 Jan. 316.7 362.0 169.5 99.5 21.3 43.4 22.9 5.5 250.1 249.5 525.9 2,200.9 1,486.8 Feb. 299.9 364.1 175.0 96.2 20.2 44.1 23.1 5.4 241.7 241.0 521.9 2,212.2 1,492.2 Mar. 324.0 357.0 165.4 96.5 21.5 44.6 23.6 5.4 256.5 255.8 534.0 2,184.3 1,478.2
Apr. 318.6 366.2 176.4 92.4 23.7 44.7 23.5 5.5 250.4 249.7 529.6 2,156.4 1,464.9 May 332.1 375.5 181.6 94.5 25.3 45.2 24.2 4.7 238.4 237.7 524.9 2,164.7 1,489.4 June 352.5 378.0 181.2 95.7 26.6 45.8 24.0 4.7 221.7 221.0 504.1 2,147.8 1,477.6
July 345.0 388.3 191.0 95.2 26.7 46.2 24.4 4.8 197.4 196.8 517.0 2,127.0 1,469.9 Aug. 326.7 395.0 197.1 94.8 27.8 46.2 24.4 4.7 199.6 198.9 526.4 2,112.1 1,462.7 Sep. 362.5 389.5 193.2 91.9 28.1 47.5 24.1 4.7 206.6 205.9 522.1 2,092.5 1,446.5
Oct. 318.9 390.9 197.9 87.6 28.3 48.3 24.1 4.7 226.5 225.8 531.3 2,083.4 1,429.2 Nov. 310.2 394.4 197.6 89.5 29.8 49.0 23.8 4.6 243.4 242.8 527.6 2,096.7 1,444.2 Dec. 289.0 379.1 191.1 81.5 31.5 46.8 23.5 4.6 211.2 210.7 501.2 2,076.2 1,433.0
2018 Jan. 329.9 378.0 186.1 84.3 31.1 47.5 24.1 5.0 203.0 202.5 521.3 2,070.6 1,439.3 Feb. 343.7 382.8 191.5 83.4 30.4 47.8 24.8 4.8 198.5 198.0 510.0 2,072.8 1,430.6 Mar. 357.8 375.3 181.4 85.8 29.5 48.6 25.1 4.8 206.7 206.1 508.5 2,077.7 1,435.4
Apr. 337.9 383.0 190.3 84.7 28.4 49.7 25.1 4.7 227.6 227.1 519.7 2,085.5 1,436.6 May 345.0 394.3 196.4 87.2 29.8 51.0 25.2 4.7 253.0 252.5 507.4 2,097.7 1,439.2 June 366.4 402.2 199.3 91.7 29.9 51.9 24.8 4.7 247.4 246.8 498.2 2,095.1 1,439.0
July 374.2 404.6 203.1 88.4 30.9 52.8 24.8 4.7 254.0 253.5 508.7 2,075.6 1,432.2 Aug. 377.0 413.7 208.3 90.6 31.0 54.4 24.8 4.6 257.8 257.3 507.1 2,081.7 1,438.6 Sep. 414.0 414.8 210.8 87.8 32.4 54.8 24.4 4.6 247.2 246.7 487.6 2,109.0 1,457.2
Oct. 375.3 415.4 213.2 84.0 32.3 55.7 25.7 4.5 237.4 236.9 511.4 2,164.7 1,474.7 Nov. 382.8 423.8 218.9 85.1 33.6 56.3 25.7 4.3 268.8 268.4 511.7 2,161.5 1,468.8 Dec. 322.3 401.4 203.6 78.6 34.2 56.9 23.7 4.3 254.5 254.2 512.5 2,157.7 1,472.1
2019 Jan. 388.4 401.9 196.7 85.9 34.8 55.8 24.2 4.5 271.2 270.7 521.5 2,174.1 1,483.7
German contribution (€ billion)
2016 Dec. 33.8 199.1 61.6 80.5 16.6 36.6 3.3 0.6 2.2 2.2 2.3 541.3 250.6
2017 Jan. 21.2 198.8 55.1 86.6 16.4 36.9 3.2 0.6 4.8 4.8 2.2 553.4 261.4 Feb. 17.5 201.8 61.5 83.2 15.7 37.7 3.1 0.6 4.5 4.5 2.2 556.7 262.6 Mar. 31.6 199.5 58.7 82.5 16.5 38.2 3.1 0.6 2.6 2.6 2.1 551.8 263.6
Apr. 25.0 198.9 59.0 79.4 18.8 38.2 3.0 0.6 3.5 3.5 2.1 546.7 264.9 May 32.7 206.1 61.6 81.6 20.6 38.7 3.1 0.6 2.4 2.4 2.1 542.6 263.2 June 39.8 210.9 63.4 82.6 22.0 39.3 3.0 0.6 1.8 1.8 2.1 542.7 266.0
July 42.3 207.8 60.3 81.5 22.6 39.8 3.0 0.7 3.3 3.3 2.1 534.5 264.9 Aug. 49.7 212.4 64.0 81.0 23.6 40.1 3.0 0.7 3.4 3.4 2.3 534.4 267.8 Sep. 59.5 210.9 63.2 78.5 24.3 41.2 3.0 0.7 2.6 2.6 2.3 529.1 264.0
Oct. 45.3 208.2 64.4 73.5 24.7 41.9 3.0 0.7 2.3 2.3 2.0 521.8 252.3 Nov. 51.7 211.4 65.5 73.0 26.2 43.1 2.9 0.7 2.6 2.6 2.0 518.3 251.1 Dec. 61.7 207.7 69.3 66.3 27.8 40.6 2.9 0.7 3.3 3.3 1.7 512.7 256.4
2018 Jan. 37.4 204.4 61.6 70.3 27.5 41.4 2.8 0.8 4.3 4.3 1.7 518.8 262.8 Feb. 46.7 207.4 66.3 69.2 26.8 41.5 3.0 0.6 3.8 3.8 2.0 522.7 263.8 Mar. 55.0 207.6 63.2 72.7 25.8 42.3 3.0 0.6 2.9 2.9 2.2 523.5 265.6
Apr. 39.7 207.0 63.1 72.5 24.4 43.3 3.0 0.6 2.4 2.4 2.1 524.1 270.0 May 51.4 217.4 68.6 74.9 25.7 44.5 3.1 0.6 1.6 1.6 1.9 536.8 274.3 June 69.1 224.5 70.7 79.2 25.6 45.3 3.1 0.6 1.3 1.3 2.0 531.3 274.8
July 48.1 216.4 63.4 76.6 26.5 46.2 3.1 0.6 1.8 1.8 1.9 526.6 277.0 Aug. 61.7 224.1 67.3 78.9 26.4 47.7 3.1 0.6 1.2 1.2 1.9 527.7 282.0 Sep. 73.9 226.2 69.6 76.9 27.8 48.3 3.1 0.6 1.3 1.3 1.9 536.3 287.6
Oct. 56.1 220.6 66.1 73.9 28.0 48.9 3.1 0.6 2.4 2.4 1.9 544.5 286.9 Nov. 65.7 226.3 69.4 74.8 28.7 49.7 3.1 0.7 1.3 1.3 2.2 544.9 290.3 Dec. 60.3 225.0 74.6 67.5 29.3 49.9 3.0 0.6 0.8 0.8 2.2 532.5 283.4
2019 Jan. 41.8 224.2 67.1 74.8 30.0 48.7 3.0 0.6 1.7 1.7 2.2 546.5 294.0
* Monetary financial institutions (MFIs) comprise banks (including building and loan paper. 5 Excluding liabilities arising from securities issued. 6 After deduction ofassociations), money market funds, and the European Central Bank and national inter-MFI participations. 7 The German contributions to the Eurosystem’s monetarycentral banks (the Eurosystem). 1 Source: ECB. 2 In Germany, only savings aggregates should on no account be interpreted as national monetary aggregatesdeposits. 3 Excluding holdings of MFIs; for the German contribution, excluding and are therefore not comparable with the erstwhile German money stocks M1, M2German MFIs’ portfolios of securities issued by MFIs in the euro area. 4 In Germany, or M3. 8 Including DEM banknotes still in circulation (see also footnote 4 onbank debt securities with maturities of up to one year are classed as money market p. 10 ). 9 For the German contribution, the difference between the volume of
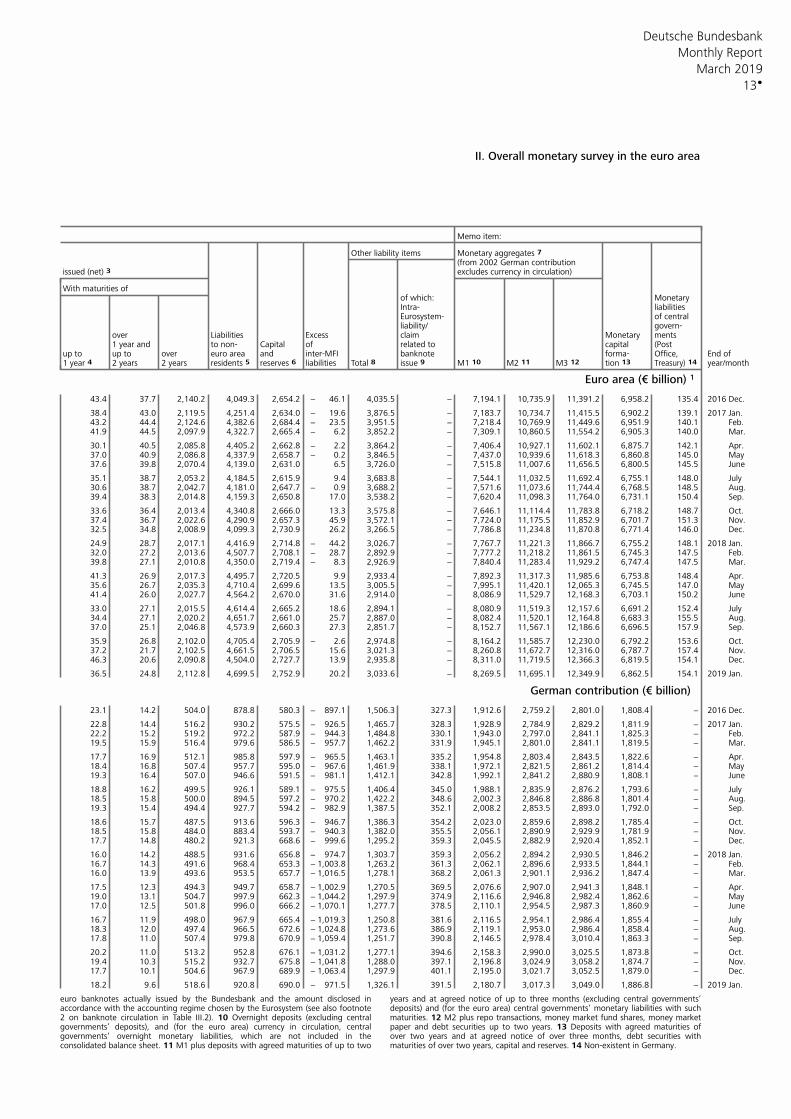
Deutsche Bundesbank
13
Monthly Report
March 2019
II. Overall monetary survey in the euro area
Memo item:
Other liability items Monetary aggregates 7 (from 2002 German contributionissued (net) 3 excludes currency in circulation)
With maturities ofof which: MonetaryIntra- liabilitiesEurosystem- of centralliability/ govern-
over Liabilities Excess claim Monetary ments1 year and to non- Capital of related to capital (Post
up to up to over euro area and inter-MFI banknote forma- Office, End of1 year 4 2 years 2 years residents 5 reserves 6 liabilities Total 8 issue 9 M1 10 M2 11 M3 12 tion 13 year/monthTreasury) 14
Euro area (€ billion) 1
43.4 37.7 2,140.2 4,049.3 2,654.2 − 46.1 4,035.5 − 7,194.1 10,735.9 11,391.2 6,958.2 135.4 2016 Dec.
38.4 43.0 2,119.5 4,251.4 2,634.0 − 19.6 3,876.5 − 7,183.7 10,734.7 11,415.5 6,902.2 139.1 2017 Jan.43.2 44.4 2,124.6 4,382.6 2,684.4 − 23.5 3,951.5 − 7,218.4 10,769.9 11,449.6 6,951.9 140.1 Feb.41.9 44.5 2,097.9 4,322.7 2,665.4 − 6.2 3,852.2 − 7,309.1 10,860.5 11,554.2 6,905.3 140.0 Mar.
30.1 40.5 2,085.8 4,405.2 2,662.8 − 2.2 3,864.2 − 7,406.4 10,927.1 11,602.1 6,875.7 142.1 Apr.37.0 40.9 2,086.8 4,337.9 2,658.7 − 0.2 3,846.5 − 7,437.0 10,939.6 11,618.3 6,860.8 145.0 May37.6 39.8 2,070.4 4,139.0 2,631.0 6.5 3,726.0 − 7,515.8 11,007.6 11,656.5 6,800.5 145.5 June
35.1 38.7 2,053.2 4,184.5 2,615.9 9.4 3,683.8 − 7,544.1 11,032.5 11,692.4 6,755.1 148.0 July30.6 38.7 2,042.7 4,181.0 2,647.7 − 0.9 3,688.2 − 7,571.6 11,073.6 11,744.4 6,768.5 148.5 Aug.39.4 38.3 2,014.8 4,159.3 2,650.8 17.0 3,538.2 − 7,620.4 11,098.3 11,764.0 6,731.1 150.4 Sep.
33.6 36.4 2,013.4 4,340.8 2,666.0 13.3 3,575.8 − 7,646.1 11,114.4 11,783.8 6,718.2 148.7 Oct.37.4 36.7 2,022.6 4,290.9 2,657.3 45.9 3,572.1 − 7,724.0 11,175.5 11,852.9 6,701.7 151.3 Nov.32.5 34.8 2,008.9 4,099.3 2,730.9 26.2 3,266.5 − 7,786.8 11,234.8 11,870.8 6,771.4 146.0 Dec.
24.9 28.7 2,017.1 4,416.9 2,714.8 − 44.2 3,026.7 − 7,767.7 11,221.3 11,866.7 6,755.2 148.1 2018 Jan.32.0 27.2 2,013.6 4,507.7 2,708.1 − 28.7 2,892.9 − 7,777.2 11,218.2 11,861.5 6,745.3 147.5 Feb.39.8 27.1 2,010.8 4,350.0 2,719.4 − 8.3 2,926.9 − 7,840.4 11,283.4 11,929.2 6,747.4 147.5 Mar.
41.3 26.9 2,017.3 4,495.7 2,720.5 9.9 2,933.4 − 7,892.3 11,317.3 11,985.6 6,753.8 148.4 Apr.35.6 26.7 2,035.3 4,710.4 2,699.6 13.5 3,005.5 − 7,995.1 11,420.1 12,065.3 6,745.5 147.0 May41.4 26.0 2,027.7 4,564.2 2,670.0 31.6 2,914.0 − 8,086.9 11,529.7 12,168.3 6,703.1 150.2 June
33.0 27.1 2,015.5 4,614.4 2,665.2 18.6 2,894.1 − 8,080.9 11,519.3 12,157.6 6,691.2 152.4 July34.4 27.1 2,020.2 4,651.7 2,661.0 25.7 2,887.0 − 8,082.4 11,520.1 12,164.8 6,683.3 155.5 Aug.37.0 25.1 2,046.8 4,573.9 2,660.3 27.3 2,851.7 − 8,152.7 11,567.1 12,186.6 6,696.5 157.9 Sep.
35.9 26.8 2,102.0 4,705.4 2,705.9 − 2.6 2,974.8 − 8,164.2 11,585.7 12,230.0 6,792.2 153.6 Oct.37.2 21.7 2,102.5 4,661.5 2,706.5 15.6 3,021.3 − 8,260.8 11,672.7 12,316.0 6,787.7 157.4 Nov.46.3 20.6 2,090.8 4,504.0 2,727.7 13.9 2,935.8 − 8,311.0 11,719.5 12,366.3 6,819.5 154.1 Dec.
36.5 24.8 2,112.8 4,699.5 2,752.9 20.2 3,033.6 − 8,269.5 11,695.1 12,349.9 6,862.5 154.1 2019 Jan.
German contribution (€ billion)
23.1 14.2 504.0 878.8 580.3 − 897.1 1,506.3 327.3 1,912.6 2,759.2 2,801.0 1,808.4 − 2016 Dec.
22.8 14.4 516.2 930.2 575.5 − 926.5 1,465.7 328.3 1,928.9 2,784.9 2,829.2 1,811.9 − 2017 Jan.22.2 15.2 519.2 972.2 587.9 − 944.3 1,484.8 330.1 1,943.0 2,797.0 2,841.1 1,825.3 − Feb.19.5 15.9 516.4 979.6 586.5 − 957.7 1,462.2 331.9 1,945.1 2,801.0 2,841.1 1,819.5 − Mar.
17.7 16.9 512.1 985.8 597.9 − 965.5 1,463.1 335.2 1,954.8 2,803.4 2,843.5 1,822.6 − Apr.18.4 16.8 507.4 957.7 595.0 − 967.6 1,461.9 338.1 1,972.1 2,821.5 2,861.2 1,814.4 − May19.3 16.4 507.0 946.6 591.5 − 981.1 1,412.1 342.8 1,992.1 2,841.2 2,880.9 1,808.1 − June
18.8 16.2 499.5 926.1 589.1 − 975.5 1,406.4 345.0 1,988.1 2,835.9 2,876.2 1,793.6 − July18.5 15.8 500.0 894.5 597.2 − 970.2 1,422.2 348.6 2,002.3 2,846.8 2,886.8 1,801.4 − Aug.19.3 15.4 494.4 927.7 594.2 − 982.9 1,387.5 352.1 2,008.2 2,853.5 2,893.0 1,792.0 − Sep.
18.6 15.7 487.5 913.6 596.3 − 946.7 1,386.3 354.2 2,023.0 2,859.6 2,898.2 1,785.4 − Oct.18.5 15.8 484.0 883.4 593.7 − 940.3 1,382.0 355.5 2,056.1 2,890.9 2,929.9 1,781.9 − Nov.17.7 14.8 480.2 921.3 668.6 − 999.6 1,295.2 359.3 2,045.5 2,882.9 2,920.4 1,852.1 − Dec.
16.0 14.2 488.5 931.6 656.8 − 974.7 1,303.7 359.3 2,056.2 2,894.2 2,930.5 1,846.2 − 2018 Jan.16.7 14.3 491.6 968.4 653.3 − 1,003.8 1,263.2 361.3 2,062.1 2,896.6 2,933.5 1,844.1 − Feb.16.0 13.9 493.6 953.5 657.7 − 1,016.5 1,278.1 368.2 2,061.3 2,901.1 2,936.2 1,847.4 − Mar.
17.5 12.3 494.3 949.7 658.7 − 1,002.9 1,270.5 369.5 2,076.6 2,907.0 2,941.3 1,848.1 − Apr.19.0 13.1 504.7 997.9 662.3 − 1,044.2 1,297.9 374.9 2,116.6 2,946.8 2,982.4 1,862.6 − May17.0 12.5 501.8 996.0 666.2 − 1,070.1 1,277.7 378.5 2,110.1 2,954.5 2,987.3 1,860.9 − June
16.7 11.9 498.0 967.9 665.4 − 1,019.3 1,250.8 381.6 2,116.5 2,954.1 2,986.4 1,855.4 − July18.3 12.0 497.4 966.5 672.6 − 1,024.8 1,273.6 386.9 2,119.1 2,953.0 2,986.4 1,858.4 − Aug.17.8 11.0 507.4 979.8 670.9 − 1,059.4 1,251.7 390.8 2,146.5 2,978.4 3,010.4 1,863.3 − Sep.
20.2 11.0 513.2 952.8 676.1 − 1,031.2 1,277.1 394.6 2,158.3 2,990.0 3,025.5 1,873.8 − Oct.19.4 10.3 515.2 932.7 675.8 − 1,041.8 1,288.0 397.1 2,196.8 3,024.9 3,058.2 1,874.7 − Nov.17.7 10.1 504.6 967.9 689.9 − 1,063.4 1,297.9 401.1 2,195.0 3,021.7 3,052.5 1,879.0 − Dec.
18.2 9.6 518.6 920.8 690.0 − 971.5 1,326.1 391.5 2,180.7 3,017.3 3,049.0 1,886.8 − 2019 Jan.
euro banknotes actually issued by the Bundesbank and the amount disclosed in years and at agreed notice of up to three months (excluding central governments’accordance with the accounting regime chosen by the Eurosystem (see also footnote deposits) and (for the euro area) central governments’ monetary liabilities with such2 on banknote circulation in Table III.2). 10 Overnight deposits (excluding central maturities. 12 M2 plus repo transactions, money market fund shares, money marketgovernments’ deposits), and (for the euro area) currency in circulation, central paper and debt securities up to two years. 13 Deposits with agreed maturities ofgovernments’ overnight monetary liabilities, which are not included in the over two years and at agreed notice of over three months, debt securities withconsolidated balance sheet. 11 M1 plus deposits with agreed maturities of up to two maturities of over two years, capital and reserves. 14 Non-existent in Germany.
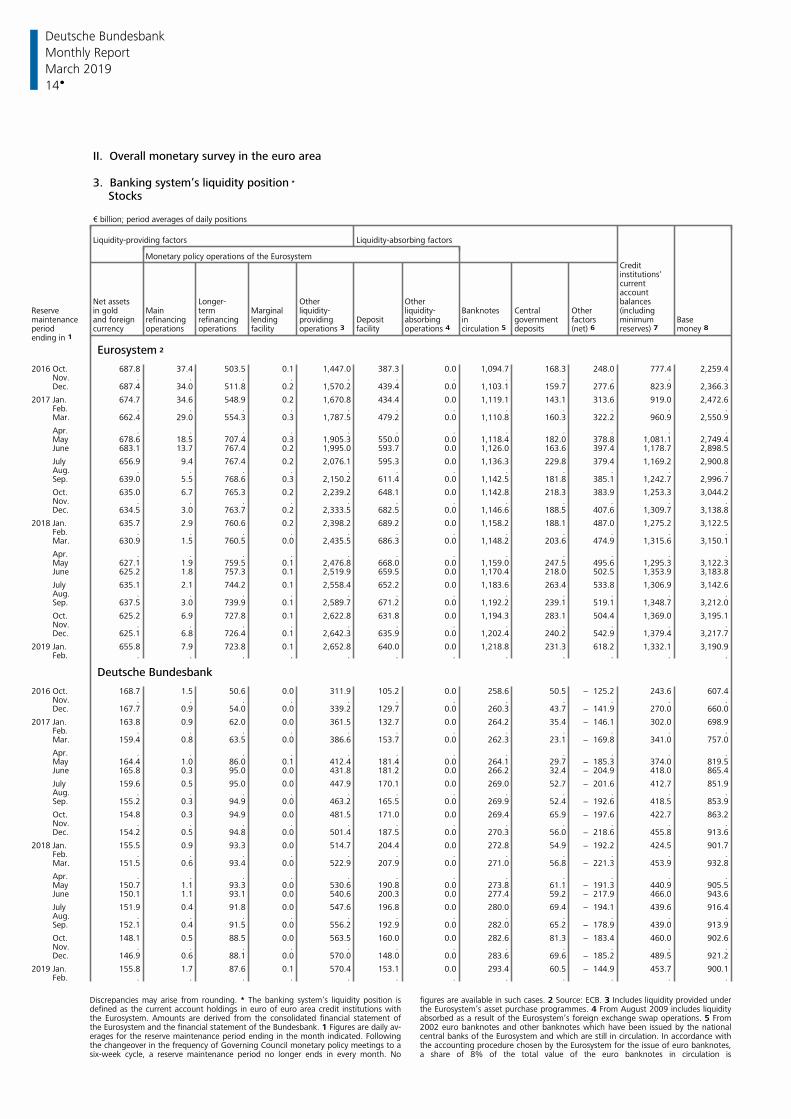
Deutsche Bundesbank
14
Monthly Report
March 2019
II. Overall monetary survey in the euro area
3. Banking system’s liquidity position *
Stocks
€ billion; period averages of daily positions
Liquidity-providing factors Liquidity-absorbing factors
Monetary policy operations of the EurosystemCreditinstitutions‘currentaccount
Net assets Longer- Other Other balancesReserve in gold Main term Marginal liquidity- liquidity- Banknotes Central Other (includingmaintenance and foreign refinancing refinancing lending providing Deposit absorbing in government factors minimum Baseperiod currency operations operations facility facility deposits (net) 6 reserves) 7 money 8 operations 3 operations 4 circulation 5 ending in 1
Eurosystem 2
2016 Oct. 687.8 37.4 503.5 0.1 1,447.0 387.3 0.0 1,094.7 168.3 248.0 777.4 2,259.4 Nov. . . . . . . . . . . . . Dec. 687.4 34.0 511.8 0.2 1,570.2 439.4 0.0 1,103.1 159.7 277.6 823.9 2,366.3
2017 Jan. 674.7 34.6 548.9 0.2 1,670.8 434.4 0.0 1,119.1 143.1 313.6 919.0 2,472.6 Feb. . . . . . . . . . . . . Mar. 662.4 29.0 554.3 0.3 1,787.5 479.2 0.0 1,110.8 160.3 322.2 960.9 2,550.9
Apr. . . . . . . . . . . . . May 678.6 18.5 707.4 0.3 1,905.3 550.0 0.0 1,118.4 182.0 378.8 1,081.1 2,749.4 June 683.1 13.7 767.4 0.2 1,995.0 593.7 0.0 1,126.0 163.6 397.4 1,178.7 2,898.5
July 656.9 9.4 767.4 0.2 2,076.1 595.3 0.0 1,136.3 229.8 379.4 1,169.2 2,900.8 Aug. . . . . . . . . . . . . Sep. 639.0 5.5 768.6 0.3 2,150.2 611.4 0.0 1,142.5 181.8 385.1 1,242.7 2,996.7
Oct. 635.0 6.7 765.3 0.2 2,239.2 648.1 0.0 1,142.8 218.3 383.9 1,253.3 3,044.2 Nov. . . . . . . . . . . . . Dec. 634.5 3.0 763.7 0.2 2,333.5 682.5 0.0 1,146.6 188.5 407.6 1,309.7 3,138.8
2018 Jan. 635.7 2.9 760.6 0.2 2,398.2 689.2 0.0 1,158.2 188.1 487.0 1,275.2 3,122.5 Feb. . . . . . . . . . . . . Mar. 630.9 1.5 760.5 0.0 2,435.5 686.3 0.0 1,148.2 203.6 474.9 1,315.6 3,150.1
Apr. . . . . . . . . . . . . May 627.1 1.9 759.5 0.1 2,476.8 668.0 0.0 1,159.0 247.5 495.6 1,295.3 3,122.3 June 625.2 1.8 757.3 0.1 2,519.9 659.5 0.0 1,170.4 218.0 502.5 1,353.9 3,183.8
July 635.1 2.1 744.2 0.1 2,558.4 652.2 0.0 1,183.6 263.4 533.8 1,306.9 3,142.6 Aug. . . . . . . . . . . . . Sep. 637.5 3.0 739.9 0.1 2,589.7 671.2 0.0 1,192.2 239.1 519.1 1,348.7 3,212.0
Oct. 625.2 6.9 727.8 0.1 2,622.8 631.8 0.0 1,194.3 283.1 504.4 1,369.0 3,195.1 Nov. . . . . . . . . . . . . Dec. 625.1 6.8 726.4 0.1 2,642.3 635.9 0.0 1,202.4 240.2 542.9 1,379.4 3,217.7
2019 Jan. 655.8 7.9 723.8 0.1 2,652.8 640.0 0.0 1,218.8 231.3 618.2 1,332.1 3,190.9 Feb. . . . . . . . . . . . .
Deutsche Bundesbank
2016 Oct. 168.7 1.5 50.6 0.0 311.9 105.2 0.0 258.6 50.5 − 125.2 243.6 607.4 Nov. . . . . . . . . . . . . Dec. 167.7 0.9 54.0 0.0 339.2 129.7 0.0 260.3 43.7 − 141.9 270.0 660.0
2017 Jan. 163.8 0.9 62.0 0.0 361.5 132.7 0.0 264.2 35.4 − 146.1 302.0 698.9 Feb. . . . . . . . . . . . . Mar. 159.4 0.8 63.5 0.0 386.6 153.7 0.0 262.3 23.1 − 169.8 341.0 757.0
Apr. . . . . . . . . . . . . May 164.4 1.0 86.0 0.1 412.4 181.4 0.0 264.1 29.7 − 185.3 374.0 819.5 June 165.8 0.3 95.0 0.0 431.8 181.2 0.0 266.2 32.4 − 204.9 418.0 865.4
July 159.6 0.5 95.0 0.0 447.9 170.1 0.0 269.0 52.7 − 201.6 412.7 851.9 Aug. . . . . . . . . . . . . Sep. 155.2 0.3 94.9 0.0 463.2 165.5 0.0 269.9 52.4 − 192.6 418.5 853.9
Oct. 154.8 0.3 94.9 0.0 481.5 171.0 0.0 269.4 65.9 − 197.6 422.7 863.2 Nov. . . . . . . . . . . . . Dec. 154.2 0.5 94.8 0.0 501.4 187.5 0.0 270.3 56.0 − 218.6 455.8 913.6
2018 Jan. 155.5 0.9 93.3 0.0 514.7 204.4 0.0 272.8 54.9 − 192.2 424.5 901.7 Feb. . . . . . . . . . . . . Mar. 151.5 0.6 93.4 0.0 522.9 207.9 0.0 271.0 56.8 − 221.3 453.9 932.8
Apr. . . . . . . . . . . . . May 150.7 1.1 93.3 0.0 530.6 190.8 0.0 273.8 61.1 − 191.3 440.9 905.5 June 150.1 1.1 93.1 0.0 540.6 200.3 0.0 277.4 59.2 − 217.9 466.0 943.6
July 151.9 0.4 91.8 0.0 547.6 196.8 0.0 280.0 69.4 − 194.1 439.6 916.4 Aug. . . . . . . . . . . . . Sep. 152.1 0.4 91.5 0.0 556.2 192.9 0.0 282.0 65.2 − 178.9 439.0 913.9
Oct. 148.1 0.5 88.5 0.0 563.5 160.0 0.0 282.6 81.3 − 183.4 460.0 902.6 Nov. . . . . . . . . . . . . Dec. 146.9 0.6 88.1 0.0 570.0 148.0 0.0 283.6 69.6 − 185.2 489.5 921.2
2019 Jan. 155.8 1.7 87.6 0.1 570.4 153.1 0.0 293.4 60.5 − 144.9 453.7 900.1 Feb. . . . . . . . . . . . .
Discrepancies may arise from rounding. * The banking system’s liquidity position is figures are available in such cases. 2 Source: ECB. 3 Includes liquidity provided underdefined as the current account holdings in euro of euro area credit institutions with the Eurosystem’s asset purchase programmes. 4 From August 2009 includes liquiditythe Eurosystem. Amounts are derived from the consolidated financial statement of absorbed as a result of the Eurosystem’s foreign exchange swap operations. 5 Fromthe Eurosystem and the financial statement of the Bundesbank. 1 Figures are daily av- 2002 euro banknotes and other banknotes which have been issued by the nationalerages for the reserve maintenance period ending in the month indicated. Following central banks of the Eurosystem and which are still in circulation. In accordance withthe changeover in the frequency of Governing Council monetary policy meetings to a the accounting procedure chosen by the Eurosystem for the issue of euro banknotes,six-week cycle, a reserve maintenance period no longer ends in every month. No a share of 8% of the total value of the euro banknotes in circulation is
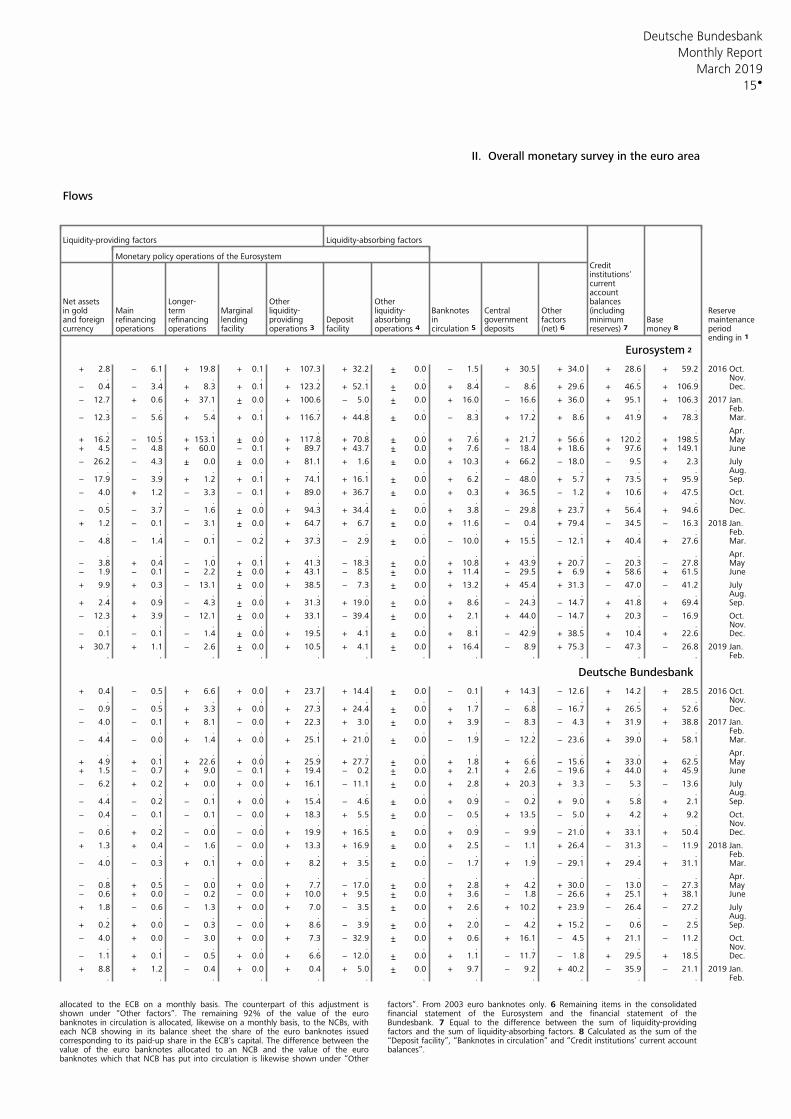
Deutsche Bundesbank
15
Monthly Report
March 2019
II. Overall monetary survey in the euro area
Flows
Liquidity-providing factors Liquidity-absorbing factors
Monetary policy operations of the EurosystemCreditinstitutions‘currentaccount
Net assets Longer- Other Other balancesin gold Main term Marginal liquidity- liquidity- Banknotes Central Other (including Reserveand foreign refinancing refinancing lending providing Deposit absorbing in government factors minimum Base maintenancecurrency operations operations facility facility deposits (net) 6 reserves) 7 money 8 periodoperations 3 operations 4 circulation 5
ending in 1
Eurosystem 2
+ 2.8 − 6.1 + 19.8 + 0.1 + 107.3 + 32.2 + 0.0 − 1.5 + 30.5 + 34.0 + 28.6 + 59.2 2016 Oct.
. . . . . . . . . . . . Nov.− 0.4 − 3.4 + 8.3 + 0.1 + 123.2 + 52.1 + 0.0 + 8.4 − 8.6 + 29.6 + 46.5 + 106.9 Dec.
− 12.7 + 0.6 + 37.1 + 0.0 + 100.6 − 5.0 + 0.0 + 16.0 − 16.6 + 36.0 + 95.1 + 106.3 2017 Jan.. . . . . . . . . . . . Feb.
− 12.3 − 5.6 + 5.4 + 0.1 + 116.7 + 44.8 + 0.0 − 8.3 + 17.2 + 8.6 + 41.9 + 78.3 Mar.
. . . . . . . . . . . . Apr.+ 16.2 − 10.5 + 153.1 + 0.0 + 117.8 + 70.8 + 0.0 + 7.6 + 21.7 + 56.6 + 120.2 + 198.5 May+ 4.5 − 4.8 + 60.0 − 0.1 + 89.7 + 43.7 + 0.0 + 7.6 − 18.4 + 18.6 + 97.6 + 149.1 June
− 26.2 − 4.3 + 0.0 + 0.0 + 81.1 + 1.6 + 0.0 + 10.3 + 66.2 − 18.0 − 9.5 + 2.3 July. . . . . . . . . . . . Aug.
− 17.9 − 3.9 + 1.2 + 0.1 + 74.1 + 16.1 + 0.0 + 6.2 − 48.0 + 5.7 + 73.5 + 95.9 Sep.
− 4.0 + 1.2 − 3.3 − 0.1 + 89.0 + 36.7 + 0.0 + 0.3 + 36.5 − 1.2 + 10.6 + 47.5 Oct.. . . . . . . . . . . . Nov.
− 0.5 − 3.7 − 1.6 + 0.0 + 94.3 + 34.4 + 0.0 + 3.8 − 29.8 + 23.7 + 56.4 + 94.6 Dec.
+ 1.2 − 0.1 − 3.1 + 0.0 + 64.7 + 6.7 + 0.0 + 11.6 − 0.4 + 79.4 − 34.5 − 16.3 2018 Jan.. . . . . . . . . . . . Feb.
− 4.8 − 1.4 − 0.1 − 0.2 + 37.3 − 2.9 + 0.0 − 10.0 + 15.5 − 12.1 + 40.4 + 27.6 Mar.
. . . . . . . . . . . . Apr.− 3.8 + 0.4 − 1.0 + 0.1 + 41.3 − 18.3 + 0.0 + 10.8 + 43.9 + 20.7 − 20.3 − 27.8 May− 1.9 − 0.1 − 2.2 + 0.0 + 43.1 − 8.5 + 0.0 + 11.4 − 29.5 + 6.9 + 58.6 + 61.5 June
+ 9.9 + 0.3 − 13.1 + 0.0 + 38.5 − 7.3 + 0.0 + 13.2 + 45.4 + 31.3 − 47.0 − 41.2 July. . . . . . . . . . . . Aug.
+ 2.4 + 0.9 − 4.3 + 0.0 + 31.3 + 19.0 + 0.0 + 8.6 − 24.3 − 14.7 + 41.8 + 69.4 Sep.
− 12.3 + 3.9 − 12.1 + 0.0 + 33.1 − 39.4 + 0.0 + 2.1 + 44.0 − 14.7 + 20.3 − 16.9 Oct.. . . . . . . . . . . . Nov.
− 0.1 − 0.1 − 1.4 + 0.0 + 19.5 + 4.1 + 0.0 + 8.1 − 42.9 + 38.5 + 10.4 + 22.6 Dec.
+ 30.7 + 1.1 − 2.6 + 0.0 + 10.5 + 4.1 + 0.0 + 16.4 − 8.9 + 75.3 − 47.3 − 26.8 2019 Jan.. . . . . . . . . . . . Feb.
Deutsche Bundesbank
+ 0.4 − 0.5 + 6.6 + 0.0 + 23.7 + 14.4 + 0.0 − 0.1 + 14.3 − 12.6 + 14.2 + 28.5 2016 Oct.. . . . . . . . . . . . Nov.
− 0.9 − 0.5 + 3.3 + 0.0 + 27.3 + 24.4 + 0.0 + 1.7 − 6.8 − 16.7 + 26.5 + 52.6 Dec.
− 4.0 − 0.1 + 8.1 − 0.0 + 22.3 + 3.0 + 0.0 + 3.9 − 8.3 − 4.3 + 31.9 + 38.8 2017 Jan.. . . . . . . . . . . . Feb.
− 4.4 − 0.0 + 1.4 + 0.0 + 25.1 + 21.0 + 0.0 − 1.9 − 12.2 − 23.6 + 39.0 + 58.1 Mar.
. . . . . . . . . . . . Apr.+ 4.9 + 0.1 + 22.6 + 0.0 + 25.9 + 27.7 + 0.0 + 1.8 + 6.6 − 15.6 + 33.0 + 62.5 May+ 1.5 − 0.7 + 9.0 − 0.1 + 19.4 − 0.2 + 0.0 + 2.1 + 2.6 − 19.6 + 44.0 + 45.9 June
− 6.2 + 0.2 + 0.0 + 0.0 + 16.1 − 11.1 + 0.0 + 2.8 + 20.3 + 3.3 − 5.3 − 13.6 July. . . . . . . . . . . . Aug.
− 4.4 − 0.2 − 0.1 + 0.0 + 15.4 − 4.6 + 0.0 + 0.9 − 0.2 + 9.0 + 5.8 + 2.1 Sep.
− 0.4 − 0.1 − 0.1 − 0.0 + 18.3 + 5.5 + 0.0 − 0.5 + 13.5 − 5.0 + 4.2 + 9.2 Oct.. . . . . . . . . . . . Nov.
− 0.6 + 0.2 − 0.0 − 0.0 + 19.9 + 16.5 + 0.0 + 0.9 − 9.9 − 21.0 + 33.1 + 50.4 Dec.
+ 1.3 + 0.4 − 1.6 − 0.0 + 13.3 + 16.9 + 0.0 + 2.5 − 1.1 + 26.4 − 31.3 − 11.9 2018 Jan.. . . . . . . . . . . . Feb.
− 4.0 − 0.3 + 0.1 + 0.0 + 8.2 + 3.5 + 0.0 − 1.7 + 1.9 − 29.1 + 29.4 + 31.1 Mar.
. . . . . . . . . . . . Apr.− 0.8 + 0.5 − 0.0 + 0.0 + 7.7 − 17.0 + 0.0 + 2.8 + 4.2 + 30.0 − 13.0 − 27.3 May− 0.6 + 0.0 − 0.2 − 0.0 + 10.0 + 9.5 + 0.0 + 3.6 − 1.8 − 26.6 + 25.1 + 38.1 June
+ 1.8 − 0.6 − 1.3 + 0.0 + 7.0 − 3.5 + 0.0 + 2.6 + 10.2 + 23.9 − 26.4 − 27.2 July. . . . . . . . . . . . Aug.
+ 0.2 + 0.0 − 0.3 − 0.0 + 8.6 − 3.9 + 0.0 + 2.0 − 4.2 + 15.2 − 0.6 − 2.5 Sep.
− 4.0 + 0.0 − 3.0 + 0.0 + 7.3 − 32.9 + 0.0 + 0.6 + 16.1 − 4.5 + 21.1 − 11.2 Oct.. . . . . . . . . . . . Nov.
− 1.1 + 0.1 − 0.5 + 0.0 + 6.6 − 12.0 + 0.0 + 1.1 − 11.7 − 1.8 + 29.5 + 18.5 Dec.
+ 8.8 + 1.2 − 0.4 + 0.0 + 0.4 + 5.0 + 0.0 + 9.7 − 9.2 + 40.2 − 35.9 − 21.1 2019 Jan.. . . . . . . . . . . . Feb.
allocated to the ECB on a monthly basis. The counterpart of this adjustment is factors”. From 2003 euro banknotes only. 6 Remaining items in the consolidatedshown under “Other factors”. The remaining 92% of the value of the euro financial statement of the Eurosystem and the financial statement of thebanknotes in circulation is allocated, likewise on a monthly basis, to the NCBs, with Bundesbank. 7 Equal to the difference between the sum of liquidity-providingeach NCB showing in its balance sheet the share of the euro banknotes issued factors and the sum of liquidity-absorbing factors. 8 Calculated as the sum of thecorresponding to its paid-up share in the ECB’s capital. The difference between the “Deposit facility”, “Banknotes in circulation” and “Credit institutions’ current accountvalue of the euro banknotes allocated to an NCB and the value of the euro balances”. banknotes which that NCB has put into circulation is likewise shown under “Other
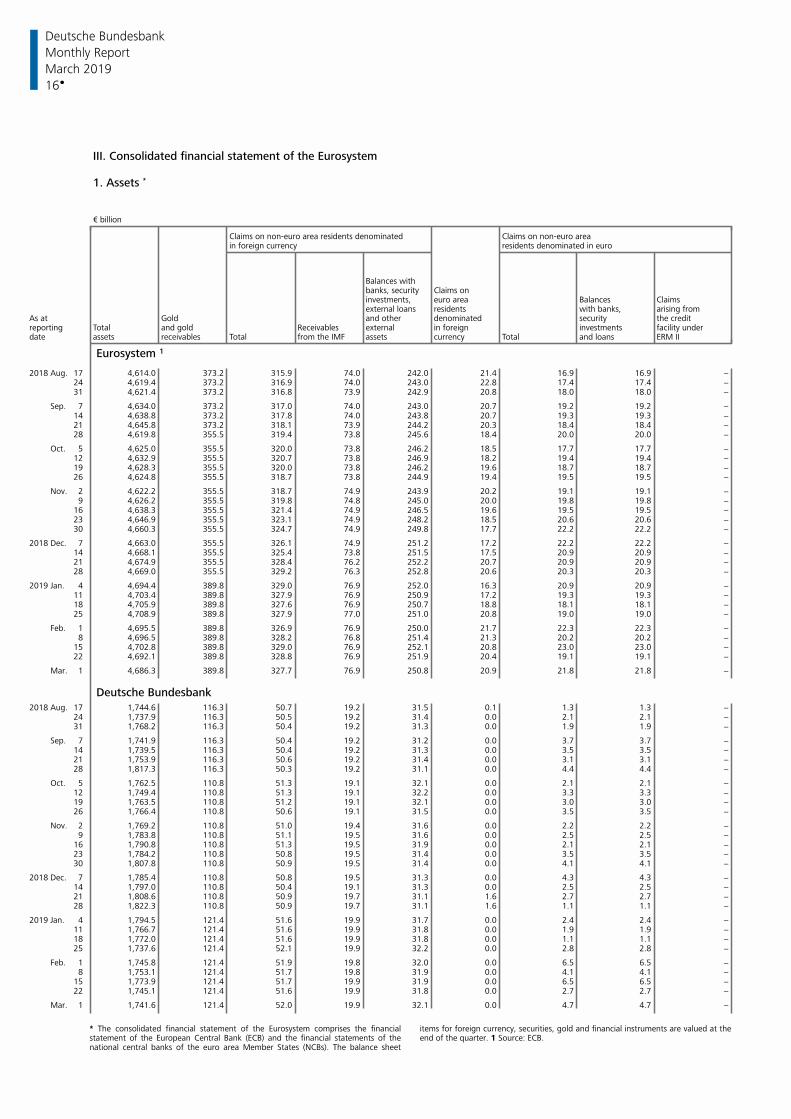
Deutsche Bundesbank
16
Monthly Report
March 2019
III. Consolidated financial statement of the Eurosystem
1. Assets *
€ billion
Claims on non-euro areaClaims on non-euro area residents denominatedin foreign currency residents denominated in euro
Balances withClaims onbanks, security
investments, euro area Balances Claimsexternal loans residents with banks, arising from
As at Gold and other denominated security the creditreporting Total and gold Receivables external in foreign investments facility underdate assets receivables Total from the IMF assets currency Total and loans ERM II
Eurosystem 1
2018 Aug. 17 4,614.0 373.2 315.9 74.0 242.0 21.4 16.9 16.9 − 24 4,619.4 373.2 316.9 74.0 243.0 22.8 17.4 17.4 − 31 4,621.4 373.2 316.8 73.9 242.9 20.8 18.0 18.0 −
Sep. 7 4,634.0 373.2 317.0 74.0 243.0 20.7 19.2 19.2 − 14 4,638.8 373.2 317.8 74.0 243.8 20.7 19.3 19.3 − 21 4,645.8 373.2 318.1 73.9 244.2 20.3 18.4 18.4 − 28 4,619.8 355.5 319.4 73.8 245.6 18.4 20.0 20.0 −
Oct. 5 4,625.0 355.5 320.0 73.8 246.2 18.5 17.7 17.7 − 12 4,632.9 355.5 320.7 73.8 246.9 18.2 19.4 19.4 − 19 4,628.3 355.5 320.0 73.8 246.2 19.6 18.7 18.7 − 26 4,624.8 355.5 318.7 73.8 244.9 19.4 19.5 19.5 −
Nov. 2 4,622.2 355.5 318.7 74.9 243.9 20.2 19.1 19.1 − 9 4,626.2 355.5 319.8 74.8 245.0 20.0 19.8 19.8 − 16 4,638.3 355.5 321.4 74.9 246.5 19.6 19.5 19.5 − 23 4,646.9 355.5 323.1 74.9 248.2 18.5 20.6 20.6 − 30 4,660.3 355.5 324.7 74.9 249.8 17.7 22.2 22.2 −
2018 Dec. 7 4,663.0 355.5 326.1 74.9 251.2 17.2 22.2 22.2 − 14 4,668.1 355.5 325.4 73.8 251.5 17.5 20.9 20.9 − 21 4,674.9 355.5 328.4 76.2 252.2 20.7 20.9 20.9 − 28 4,669.0 355.5 329.2 76.3 252.8 20.6 20.3 20.3 −
2019 Jan. 4 4,694.4 389.8 329.0 76.9 252.0 16.3 20.9 20.9 − 11 4,703.4 389.8 327.9 76.9 250.9 17.2 19.3 19.3 − 18 4,705.9 389.8 327.6 76.9 250.7 18.8 18.1 18.1 − 25 4,708.9 389.8 327.9 77.0 251.0 20.8 19.0 19.0 −
Feb. 1 4,695.5 389.8 326.9 76.9 250.0 21.7 22.3 22.3 − 8 4,696.5 389.8 328.2 76.8 251.4 21.3 20.2 20.2 − 15 4,702.8 389.8 329.0 76.9 252.1 20.8 23.0 23.0 − 22 4,692.1 389.8 328.8 76.9 251.9 20.4 19.1 19.1 −
Mar. 1 4,686.3 389.8 327.7 76.9 250.8 20.9 21.8 21.8 −
Deutsche Bundesbank2018 Aug. 17 1,744.6 116.3 50.7 19.2 31.5 0.1 1.3 1.3 − 24 1,737.9 116.3 50.5 19.2 31.4 0.0 2.1 2.1 − 31 1,768.2 116.3 50.4 19.2 31.3 0.0 1.9 1.9 −
Sep. 7 1,741.9 116.3 50.4 19.2 31.2 0.0 3.7 3.7 − 14 1,739.5 116.3 50.4 19.2 31.3 0.0 3.5 3.5 − 21 1,753.9 116.3 50.6 19.2 31.4 0.0 3.1 3.1 − 28 1,817.3 116.3 50.3 19.2 31.1 0.0 4.4 4.4 −
Oct. 5 1,762.5 110.8 51.3 19.1 32.1 0.0 2.1 2.1 − 12 1,749.4 110.8 51.3 19.1 32.2 0.0 3.3 3.3 − 19 1,763.5 110.8 51.2 19.1 32.1 0.0 3.0 3.0 − 26 1,766.4 110.8 50.6 19.1 31.5 0.0 3.5 3.5 −
Nov. 2 1,769.2 110.8 51.0 19.4 31.6 0.0 2.2 2.2 − 9 1,783.8 110.8 51.1 19.5 31.6 0.0 2.5 2.5 − 16 1,790.8 110.8 51.3 19.5 31.9 0.0 2.1 2.1 − 23 1,784.2 110.8 50.8 19.5 31.4 0.0 3.5 3.5 − 30 1,807.8 110.8 50.9 19.5 31.4 0.0 4.1 4.1 −
2018 Dec. 7 1,785.4 110.8 50.8 19.5 31.3 0.0 4.3 4.3 − 14 1,797.0 110.8 50.4 19.1 31.3 0.0 2.5 2.5 − 21 1,808.6 110.8 50.9 19.7 31.1 1.6 2.7 2.7 − 28 1,822.3 110.8 50.9 19.7 31.1 1.6 1.1 1.1 −
2019 Jan. 4 1,794.5 121.4 51.6 19.9 31.7 0.0 2.4 2.4 − 11 1,766.7 121.4 51.6 19.9 31.8 0.0 1.9 1.9 − 18 1,772.0 121.4 51.6 19.9 31.8 0.0 1.1 1.1 − 25 1,737.6 121.4 52.1 19.9 32.2 0.0 2.8 2.8 −
Feb. 1 1,745.8 121.4 51.9 19.8 32.0 0.0 6.5 6.5 − 8 1,753.1 121.4 51.7 19.8 31.9 0.0 4.1 4.1 − 15 1,773.9 121.4 51.7 19.9 31.9 0.0 6.5 6.5 − 22 1,745.1 121.4 51.6 19.9 31.8 0.0 2.7 2.7 −
Mar. 1 1,741.6 121.4 52.0 19.9 32.1 0.0 4.7 4.7 −
* The consolidated financial statement of the Eurosystem comprises the financial items for foreign currency, securities, gold and financial instruments are valued at thestatement of the European Central Bank (ECB) and the financial statements of the end of the quarter. 1 Source: ECB. national central banks of the euro area Member States (NCBs). The balance sheet
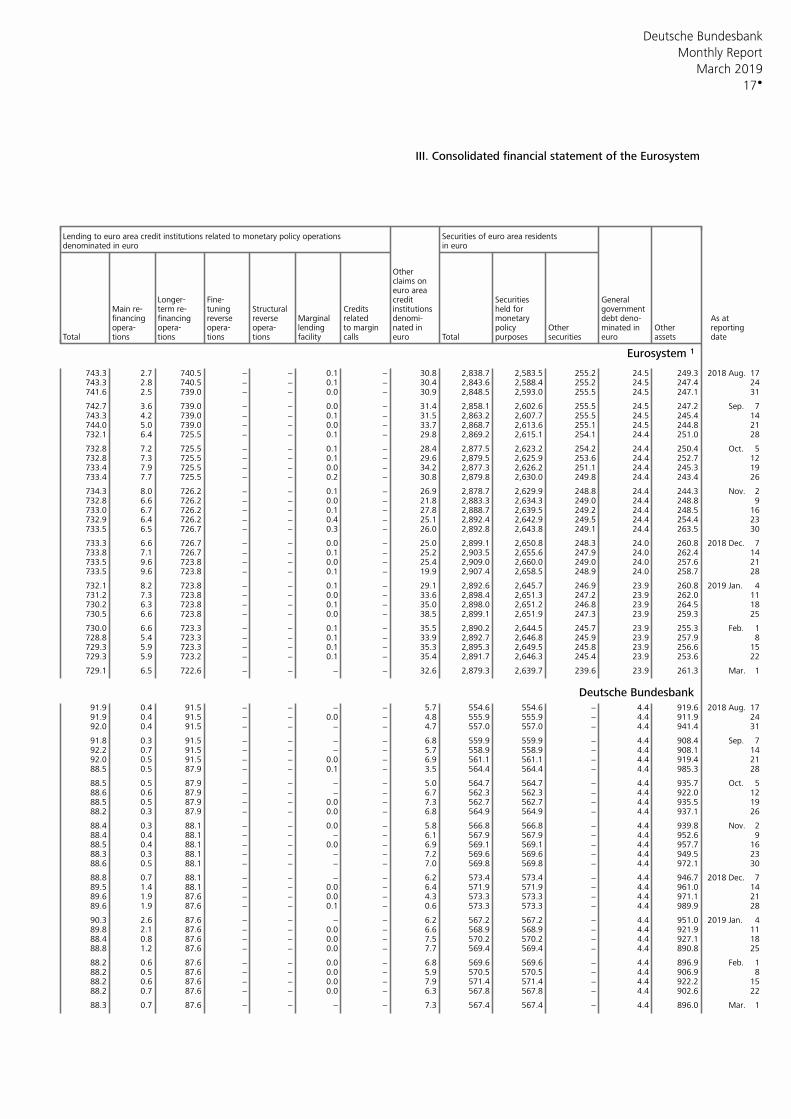
Deutsche Bundesbank
17
Monthly Report
March 2019
III. Consolidated financial statement of the Eurosystem
Lending to euro area credit institutions related to monetary policy operations Securities of euro area residentsdenominated in euro in euro
Other claims on euro area
Longer- Fine- credit Securities GeneralMain re- term re- tuning Structural Credits institutions held for governmentfinancing financing reverse reverse Marginal related denomi- monetary debt deno- As atopera- opera- opera- opera- lending to margin nated in policy Other minated in Other reporting
Total tions tions tions tions facility calls euro Total purposes securities euro assets date
Eurosystem 1
743.3 2.7 740.5 − − 0.1 − 30.8 2,838.7 2,583.5 255.2 24.5 249.3 2018 Aug. 17743.3 2.8 740.5 − − 0.1 − 30.4 2,843.6 2,588.4 255.2 24.5 247.4 24741.6 2.5 739.0 − − 0.0 − 30.9 2,848.5 2,593.0 255.5 24.5 247.1 31
742.7 3.6 739.0 − − 0.0 − 31.4 2,858.1 2,602.6 255.5 24.5 247.2 Sep. 7743.3 4.2 739.0 − − 0.1 − 31.5 2,863.2 2,607.7 255.5 24.5 245.4 14744.0 5.0 739.0 − − 0.0 − 33.7 2,868.7 2,613.6 255.1 24.5 244.8 21732.1 6.4 725.5 − − 0.1 − 29.8 2,869.2 2,615.1 254.1 24.4 251.0 28
732.8 7.2 725.5 − − 0.1 − 28.4 2,877.5 2,623.2 254.2 24.4 250.4 Oct. 5732.8 7.3 725.5 − − 0.1 − 29.6 2,879.5 2,625.9 253.6 24.4 252.7 12733.4 7.9 725.5 − − 0.0 − 34.2 2,877.3 2,626.2 251.1 24.4 245.3 19733.4 7.7 725.5 − − 0.2 − 30.8 2,879.8 2,630.0 249.8 24.4 243.4 26
734.3 8.0 726.2 − − 0.1 − 26.9 2,878.7 2,629.9 248.8 24.4 244.3 Nov. 2732.8 6.6 726.2 − − 0.0 − 21.8 2,883.3 2,634.3 249.0 24.4 248.8 9733.0 6.7 726.2 − − 0.1 − 27.8 2,888.7 2,639.5 249.2 24.4 248.5 16732.9 6.4 726.2 − − 0.4 − 25.1 2,892.4 2,642.9 249.5 24.4 254.4 23733.5 6.5 726.7 − − 0.3 − 26.0 2,892.8 2,643.8 249.1 24.4 263.5 30
733.3 6.6 726.7 − − 0.0 − 25.0 2,899.1 2,650.8 248.3 24.0 260.8 2018 Dec. 7733.8 7.1 726.7 − − 0.1 − 25.2 2,903.5 2,655.6 247.9 24.0 262.4 14733.5 9.6 723.8 − − 0.0 − 25.4 2,909.0 2,660.0 249.0 24.0 257.6 21733.5 9.6 723.8 − − 0.1 − 19.9 2,907.4 2,658.5 248.9 24.0 258.7 28
732.1 8.2 723.8 − − 0.1 − 29.1 2,892.6 2,645.7 246.9 23.9 260.8 2019 Jan. 4731.2 7.3 723.8 − − 0.0 − 33.6 2,898.4 2,651.3 247.2 23.9 262.0 11730.2 6.3 723.8 − − 0.1 − 35.0 2,898.0 2,651.2 246.8 23.9 264.5 18730.5 6.6 723.8 − − 0.0 − 38.5 2,899.1 2,651.9 247.3 23.9 259.3 25
730.0 6.6 723.3 − − 0.1 − 35.5 2,890.2 2,644.5 245.7 23.9 255.3 Feb. 1728.8 5.4 723.3 − − 0.1 − 33.9 2,892.7 2,646.8 245.9 23.9 257.9 8729.3 5.9 723.3 − − 0.1 − 35.3 2,895.3 2,649.5 245.8 23.9 256.6 15729.3 5.9 723.2 − − 0.1 − 35.4 2,891.7 2,646.3 245.4 23.9 253.6 22
729.1 6.5 722.6 − − − − 32.6 2,879.3 2,639.7 239.6 23.9 261.3 Mar. 1
Deutsche Bundesbank91.9 0.4 91.5 − − − − 5.7 554.6 554.6 − 4.4 919.6 2018 Aug. 1791.9 0.4 91.5 − − 0.0 − 4.8 555.9 555.9 − 4.4 911.9 2492.0 0.4 91.5 − − − − 4.7 557.0 557.0 − 4.4 941.4 31
91.8 0.3 91.5 − − − − 6.8 559.9 559.9 − 4.4 908.4 Sep. 792.2 0.7 91.5 − − − − 5.7 558.9 558.9 − 4.4 908.1 1492.0 0.5 91.5 − − 0.0 − 6.9 561.1 561.1 − 4.4 919.4 2188.5 0.5 87.9 − − 0.1 − 3.5 564.4 564.4 − 4.4 985.3 28
88.5 0.5 87.9 − − − − 5.0 564.7 564.7 − 4.4 935.7 Oct. 588.6 0.6 87.9 − − − − 6.7 562.3 562.3 − 4.4 922.0 1288.5 0.5 87.9 − − 0.0 − 7.3 562.7 562.7 − 4.4 935.5 1988.2 0.3 87.9 − − 0.0 − 6.8 564.9 564.9 − 4.4 937.1 26
88.4 0.3 88.1 − − 0.0 − 5.8 566.8 566.8 − 4.4 939.8 Nov. 288.4 0.4 88.1 − − − − 6.1 567.9 567.9 − 4.4 952.6 988.5 0.4 88.1 − − 0.0 − 6.9 569.1 569.1 − 4.4 957.7 1688.3 0.3 88.1 − − − − 7.2 569.6 569.6 − 4.4 949.5 2388.6 0.5 88.1 − − − − 7.0 569.8 569.8 − 4.4 972.1 30
88.8 0.7 88.1 − − − − 6.2 573.4 573.4 − 4.4 946.7 2018 Dec. 789.5 1.4 88.1 − − 0.0 − 6.4 571.9 571.9 − 4.4 961.0 1489.6 1.9 87.6 − − 0.0 − 4.3 573.3 573.3 − 4.4 971.1 2189.6 1.9 87.6 − − 0.1 − 0.6 573.3 573.3 − 4.4 989.9 28
90.3 2.6 87.6 − − − − 6.2 567.2 567.2 − 4.4 951.0 2019 Jan. 489.8 2.1 87.6 − − 0.0 − 6.6 568.9 568.9 − 4.4 921.9 1188.4 0.8 87.6 − − 0.0 − 7.5 570.2 570.2 − 4.4 927.1 1888.8 1.2 87.6 − − 0.0 − 7.7 569.4 569.4 − 4.4 890.8 25
88.2 0.6 87.6 − − 0.0 − 6.8 569.6 569.6 − 4.4 896.9 Feb. 188.2 0.5 87.6 − − 0.0 − 5.9 570.5 570.5 − 4.4 906.9 888.2 0.6 87.6 − − 0.0 − 7.9 571.4 571.4 − 4.4 922.2 1588.2 0.7 87.6 − − 0.0 − 6.3 567.8 567.8 − 4.4 902.6 22
88.3 0.7 87.6 − − − − 7.3 567.4 567.4 − 4.4 896.0 Mar. 1
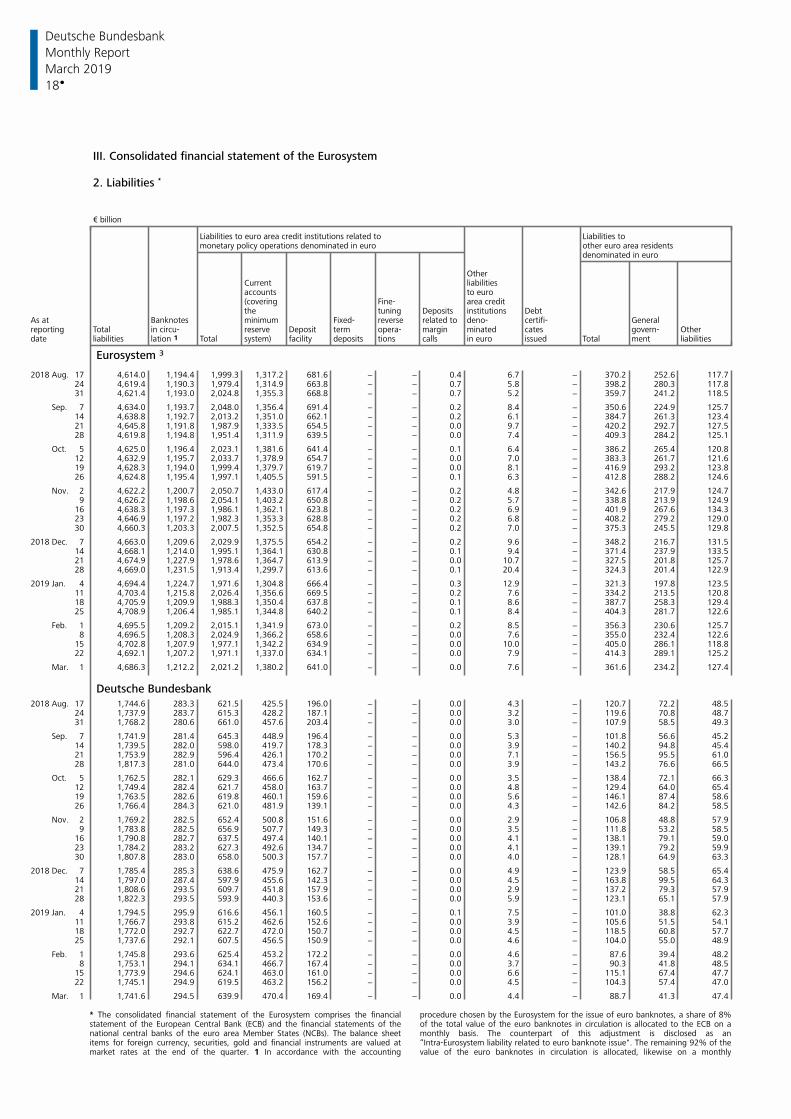
Deutsche Bundesbank
18
Monthly Report
March 2019
III. Consolidated financial statement of the Eurosystem
2. Liabilities *
€ billion
Liabilities to euro area credit institutions related to Liabilities tomonetary policy operations denominated in euro other euro area residents
denominated in euro
OtherCurrent liabilitiesaccounts to euro(covering Fine- area creditthe tuning Deposits institutions Debt
As at Banknotes minimum Fixed- reverse deno- certifi- Generalrelated toreporting Total in circu- reserve Deposit term opera- margin minated cates govern- Otherdate liabilities lation 1 Total system) facility deposits tions calls in euro issued Total ment liabilities
Eurosystem 3
2018 Aug. 17 4,614.0 1,194.4 1,999.3 1,317.2 681.6 − − 0.4 6.7 − 370.2 252.6 117.7 24 4,619.4 1,190.3 1,979.4 1,314.9 663.8 − − 0.7 5.8 − 398.2 280.3 117.8 31 4,621.4 1,193.0 2,024.8 1,355.3 668.8 − − 0.7 5.2 − 359.7 241.2 118.5
Sep. 7 4,634.0 1,193.7 2,048.0 1,356.4 691.4 − − 0.2 8.4 − 350.6 224.9 125.7 14 4,638.8 1,192.7 2,013.2 1,351.0 662.1 − − 0.2 6.1 − 384.7 261.3 123.4 21 4,645.8 1,191.8 1,987.9 1,333.5 654.5 − − 0.0 9.7 − 420.2 292.7 127.5 28 4,619.8 1,194.8 1,951.4 1,311.9 639.5 − − 0.0 7.4 − 409.3 284.2 125.1
Oct. 5 4,625.0 1,196.4 2,023.1 1,381.6 641.4 − − 0.1 6.4 − 386.2 265.4 120.8 12 4,632.9 1,195.7 2,033.7 1,378.9 654.7 − − 0.0 7.0 − 383.3 261.7 121.6 19 4,628.3 1,194.0 1,999.4 1,379.7 619.7 − − 0.0 8.1 − 416.9 293.2 123.8 26 4,624.8 1,195.4 1,997.1 1,405.5 591.5 − − 0.1 6.3 − 412.8 288.2 124.6
Nov. 2 4,622.2 1,200.7 2,050.7 1,433.0 617.4 − − 0.2 4.8 − 342.6 217.9 124.7 9 4,626.2 1,198.6 2,054.1 1,403.2 650.8 − − 0.2 5.7 − 338.8 213.9 124.9 16 4,638.3 1,197.3 1,986.1 1,362.1 623.8 − − 0.2 6.9 − 401.9 267.6 134.3 23 4,646.9 1,197.2 1,982.3 1,353.3 628.8 − − 0.2 6.8 − 408.2 279.2 129.0 30 4,660.3 1,203.3 2,007.5 1,352.5 654.8 − − 0.2 7.0 − 375.3 245.5 129.8
2018 Dec. 7 4,663.0 1,209.6 2,029.9 1,375.5 654.2 − − 0.2 9.6 − 348.2 216.7 131.5 14 4,668.1 1,214.0 1,995.1 1,364.1 630.8 − − 0.1 9.4 − 371.4 237.9 133.5 21 4,674.9 1,227.9 1,978.6 1,364.7 613.9 − − 0.0 10.7 − 327.5 201.8 125.7 28 4,669.0 1,231.5 1,913.4 1,299.7 613.6 − − 0.1 20.4 − 324.3 201.4 122.9
2019 Jan. 4 4,694.4 1,224.7 1,971.6 1,304.8 666.4 − − 0.3 12.9 − 321.3 197.8 123.5 11 4,703.4 1,215.8 2,026.4 1,356.6 669.5 − − 0.2 7.6 − 334.2 213.5 120.8 18 4,705.9 1,209.9 1,988.3 1,350.4 637.8 − − 0.1 8.6 − 387.7 258.3 129.4 25 4,708.9 1,206.4 1,985.1 1,344.8 640.2 − − 0.1 8.4 − 404.3 281.7 122.6
Feb. 1 4,695.5 1,209.2 2,015.1 1,341.9 673.0 − − 0.2 8.5 − 356.3 230.6 125.7 8 4,696.5 1,208.3 2,024.9 1,366.2 658.6 − − 0.0 7.6 − 355.0 232.4 122.6 15 4,702.8 1,207.9 1,977.1 1,342.2 634.9 − − 0.0 10.0 − 405.0 286.1 118.8 22 4,692.1 1,207.2 1,971.1 1,337.0 634.1 − − 0.0 7.9 − 414.3 289.1 125.2
Mar. 1 4,686.3 1,212.2 2,021.2 1,380.2 641.0 − − 0.0 7.6 − 361.6 234.2 127.4
Deutsche Bundesbank2018 Aug. 17 1,744.6 283.3 621.5 425.5 196.0 − − 0.0 4.3 − 120.7 72.2 48.5 24 1,737.9 283.7 615.3 428.2 187.1 − − 0.0 3.2 − 119.6 70.8 48.7 31 1,768.2 280.6 661.0 457.6 203.4 − − 0.0 3.0 − 107.9 58.5 49.3
Sep. 7 1,741.9 281.4 645.3 448.9 196.4 − − 0.0 5.3 − 101.8 56.6 45.2 14 1,739.5 282.0 598.0 419.7 178.3 − − 0.0 3.9 − 140.2 94.8 45.4 21 1,753.9 282.9 596.4 426.1 170.2 − − 0.0 7.1 − 156.5 95.5 61.0 28 1,817.3 281.0 644.0 473.4 170.6 − − 0.0 3.9 − 143.2 76.6 66.5
Oct. 5 1,762.5 282.1 629.3 466.6 162.7 − − 0.0 3.5 − 138.4 72.1 66.3 12 1,749.4 282.4 621.7 458.0 163.7 − − 0.0 4.8 − 129.4 64.0 65.4 19 1,763.5 282.6 619.8 460.1 159.6 − − 0.0 5.6 − 146.1 87.4 58.6 26 1,766.4 284.3 621.0 481.9 139.1 − − 0.0 4.3 − 142.6 84.2 58.5
Nov. 2 1,769.2 282.5 652.4 500.8 151.6 − − 0.0 2.9 − 106.8 48.8 57.9 9 1,783.8 282.5 656.9 507.7 149.3 − − 0.0 3.5 − 111.8 53.2 58.5 16 1,790.8 282.7 637.5 497.4 140.1 − − 0.0 4.1 − 138.1 79.1 59.0 23 1,784.2 283.2 627.3 492.6 134.7 − − 0.0 4.1 − 139.1 79.2 59.9 30 1,807.8 283.0 658.0 500.3 157.7 − − 0.0 4.0 − 128.1 64.9 63.3
2018 Dec. 7 1,785.4 285.3 638.6 475.9 162.7 − − 0.0 4.9 − 123.9 58.5 65.4 14 1,797.0 287.4 597.9 455.6 142.3 − − 0.0 4.5 − 163.8 99.5 64.3 21 1,808.6 293.5 609.7 451.8 157.9 − − 0.0 2.9 − 137.2 79.3 57.9 28 1,822.3 293.5 593.9 440.3 153.6 − − 0.0 5.9 − 123.1 65.1 57.9
2019 Jan. 4 1,794.5 295.9 616.6 456.1 160.5 − − 0.1 7.5 − 101.0 38.8 62.3 11 1,766.7 293.8 615.2 462.6 152.6 − − 0.0 3.9 − 105.6 51.5 54.1 18 1,772.0 292.7 622.7 472.0 150.7 − − 0.0 4.5 − 118.5 60.8 57.7 25 1,737.6 292.1 607.5 456.5 150.9 − − 0.0 4.6 − 104.0 55.0 48.9
Feb. 1 1,745.8 293.6 625.4 453.2 172.2 − − 0.0 4.6 − 87.6 39.4 48.2 8 1,753.1 294.1 634.1 466.7 167.4 − − 0.0 3.7 − 90.3 41.8 48.5 15 1,773.9 294.6 624.1 463.0 161.0 − − 0.0 6.6 − 115.1 67.4 47.7 22 1,745.1 294.9 619.5 463.2 156.2 − − 0.0 4.5 − 104.3 57.4 47.0
Mar. 1 1,741.6 294.5 639.9 470.4 169.4 − − 0.0 4.4 − 88.7 41.3 47.4
* The consolidated financial statement of the Eurosystem comprises the financial procedure chosen by the Eurosystem for the issue of euro banknotes, a share of 8%statement of the European Central Bank (ECB) and the financial statements of the of the total value of the euro banknotes in circulation is allocated to the ECB on anational central banks of the euro area Member States (NCBs). The balance sheet monthly basis. The counterpart of this adjustment is disclosed as anitems for foreign currency, securities, gold and financial instruments are valued at “Intra-Eurosystem liability related to euro banknote issue". The remaining 92% of themarket rates at the end of the quarter. 1 In accordance with the accounting value of the euro banknotes in circulation is allocated, likewise on a monthly
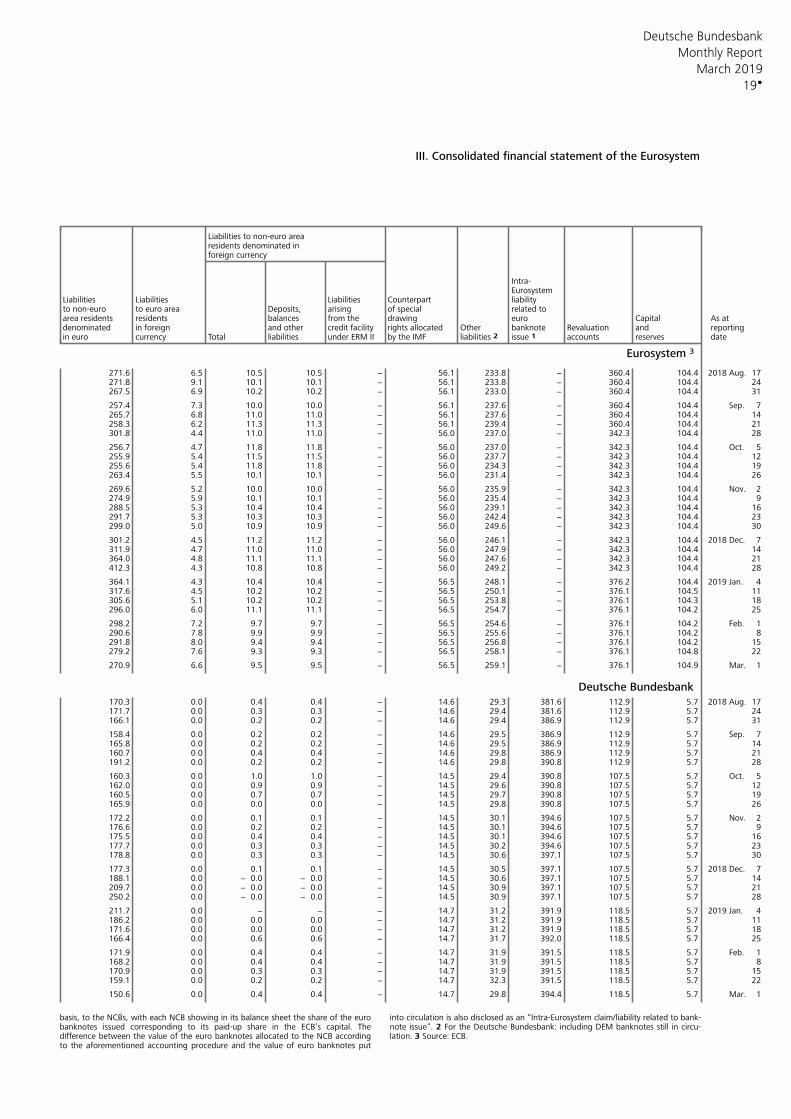
Deutsche Bundesbank
19
Monthly Report
March 2019
III. Consolidated financial statement of the Eurosystem
Liabilities to non-euro arearesidents denominated inforeign currency
Intra- Eurosystem
Liabilities Liabilities Liabilities Counterpart liability to non-euro to euro area Deposits, arising of special related to area residents residents balances from the drawing euro Capital As atdenominated in foreign and other rights allocated Other banknote Revaluation and reportingcredit facilityin euro currency Total liabilities under ERM II by the IMF issue 1 accounts reserves dateliabilities 2
Eurosystem 3
271.6 6.5 10.5 10.5 − 56.1 233.8 − 360.4 104.4 2018 Aug. 17271.8 9.1 10.1 10.1 − 56.1 233.8 − 360.4 104.4 24267.5 6.9 10.2 10.2 − 56.1 233.0 − 360.4 104.4 31
257.4 7.3 10.0 10.0 − 56.1 237.6 − 360.4 104.4 Sep. 7265.7 6.8 11.0 11.0 − 56.1 237.6 − 360.4 104.4 14258.3 6.2 11.3 11.3 − 56.1 239.4 − 360.4 104.4 21301.8 4.4 11.0 11.0 − 56.0 237.0 − 342.3 104.4 28
256.7 4.7 11.8 11.8 − 56.0 237.0 − 342.3 104.4 Oct. 5255.9 5.4 11.5 11.5 − 56.0 237.7 − 342.3 104.4 12255.6 5.4 11.8 11.8 − 56.0 234.3 − 342.3 104.4 19263.4 5.5 10.1 10.1 − 56.0 231.4 − 342.3 104.4 26
269.6 5.2 10.0 10.0 − 56.0 235.9 − 342.3 104.4 Nov. 2274.9 5.9 10.1 10.1 − 56.0 235.4 − 342.3 104.4 9288.5 5.3 10.4 10.4 − 56.0 239.1 − 342.3 104.4 16291.7 5.3 10.3 10.3 − 56.0 242.4 − 342.3 104.4 23299.0 5.0 10.9 10.9 − 56.0 249.6 − 342.3 104.4 30
301.2 4.5 11.2 11.2 − 56.0 246.1 − 342.3 104.4 2018 Dec. 7311.9 4.7 11.0 11.0 − 56.0 247.9 − 342.3 104.4 14364.0 4.8 11.1 11.1 − 56.0 247.6 − 342.3 104.4 21412.3 4.3 10.8 10.8 − 56.0 249.2 − 342.3 104.4 28
364.1 4.3 10.4 10.4 − 56.5 248.1 − 376.2 104.4 2019 Jan. 4317.6 4.5 10.2 10.2 − 56.5 250.1 − 376.1 104.5 11305.6 5.1 10.2 10.2 − 56.5 253.8 − 376.1 104.3 18296.0 6.0 11.1 11.1 − 56.5 254.7 − 376.1 104.2 25
298.2 7.2 9.7 9.7 − 56.5 254.6 − 376.1 104.2 Feb. 1290.6 7.8 9.9 9.9 − 56.5 255.6 − 376.1 104.2 8291.8 8.0 9.4 9.4 − 56.5 256.8 − 376.1 104.2 15279.2 7.6 9.3 9.3 − 56.5 258.1 − 376.1 104.8 22
270.9 6.6 9.5 9.5 − 56.5 259.1 − 376.1 104.9 Mar. 1
Deutsche Bundesbank170.3 0.0 0.4 0.4 − 14.6 29.3 381.6 112.9 5.7 2018 Aug. 17171.7 0.0 0.3 0.3 − 14.6 29.4 381.6 112.9 5.7 24166.1 0.0 0.2 0.2 − 14.6 29.4 386.9 112.9 5.7 31
158.4 0.0 0.2 0.2 − 14.6 29.5 386.9 112.9 5.7 Sep. 7165.8 0.0 0.2 0.2 − 14.6 29.5 386.9 112.9 5.7 14160.7 0.0 0.4 0.4 − 14.6 29.8 386.9 112.9 5.7 21191.2 0.0 0.2 0.2 − 14.6 29.8 390.8 112.9 5.7 28
160.3 0.0 1.0 1.0 − 14.5 29.4 390.8 107.5 5.7 Oct. 5162.0 0.0 0.9 0.9 − 14.5 29.6 390.8 107.5 5.7 12160.5 0.0 0.7 0.7 − 14.5 29.7 390.8 107.5 5.7 19165.9 0.0 0.0 0.0 − 14.5 29.8 390.8 107.5 5.7 26
172.2 0.0 0.1 0.1 − 14.5 30.1 394.6 107.5 5.7 Nov. 2176.6 0.0 0.2 0.2 − 14.5 30.1 394.6 107.5 5.7 9175.5 0.0 0.4 0.4 − 14.5 30.1 394.6 107.5 5.7 16177.7 0.0 0.3 0.3 − 14.5 30.2 394.6 107.5 5.7 23178.8 0.0 0.3 0.3 − 14.5 30.6 397.1 107.5 5.7 30
177.3 0.0 0.1 0.1 − 14.5 30.5 397.1 107.5 5.7 2018 Dec. 7188.1 0.0 − 0.0 − 0.0 − 14.5 30.6 397.1 107.5 5.7 14209.7 0.0 − 0.0 − 0.0 − 14.5 30.9 397.1 107.5 5.7 21250.2 0.0 − 0.0 − 0.0 − 14.5 30.9 397.1 107.5 5.7 28
211.7 0.0 − − − 14.7 31.2 391.9 118.5 5.7 2019 Jan. 4186.2 0.0 0.0 0.0 − 14.7 31.2 391.9 118.5 5.7 11171.6 0.0 0.0 0.0 − 14.7 31.2 391.9 118.5 5.7 18166.4 0.0 0.6 0.6 − 14.7 31.7 392.0 118.5 5.7 25
171.9 0.0 0.4 0.4 − 14.7 31.9 391.5 118.5 5.7 Feb. 1168.2 0.0 0.4 0.4 − 14.7 31.9 391.5 118.5 5.7 8170.9 0.0 0.3 0.3 − 14.7 31.9 391.5 118.5 5.7 15159.1 0.0 0.2 0.2 − 14.7 32.3 391.5 118.5 5.7 22
150.6 0.0 0.4 0.4 − 14.7 29.8 394.4 118.5 5.7 Mar. 1
basis, to the NCBs, with each NCB showing in its balance sheet the share of the euro into circulation is also disclosed as an “Intra-Eurosystem claim/liability related to bank-banknotes issued corresponding to its paid-up share in the ECB’s capital. The note issue“. 2 For the Deutsche Bundesbank: including DEM banknotes still in circu-difference between the value of the euro banknotes allocated to the NCB according lation. 3 Source: ECB. to the aforementioned accounting procedure and the value of euro banknotes put
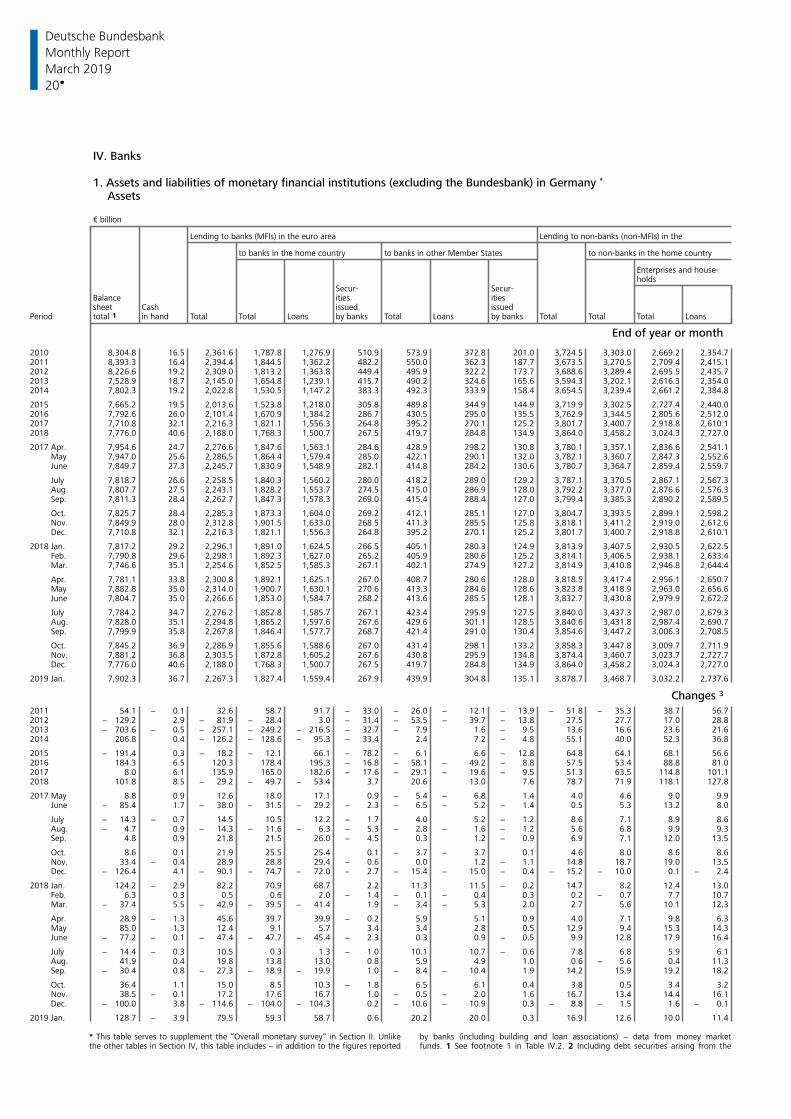
Deutsche Bundesbank
20
Monthly Report
March 2019
IV. Banks
1. Assets and liabilities of monetary financial institutions (excluding the Bundesbank) in Germany *
Assets
€ billion
Lending to banks (MFIs) in the euro area Lending to non-banks (non-MFIs) in the
to banks in the home country to banks in other Member States to non-banks in the home country
Enterprises and house-holds
Secur- Secur-Balance ities itiessheet Cash issued issued
Period total 1 in hand Total Total Loans by banks Total Loans by banks Total Total Total Loans
End of year or month
2010 8,304.8 16.5 2,361.6 1,787.8 1,276.9 510.9 573.9 372.8 201.0 3,724.5 3,303.0 2,669.2 2,354.72011 8,393.3 16.4 2,394.4 1,844.5 1,362.2 482.2 550.0 362.3 187.7 3,673.5 3,270.5 2,709.4 2,415.12012 8,226.6 19.2 2,309.0 1,813.2 1,363.8 449.4 495.9 322.2 173.7 3,688.6 3,289.4 2,695.5 2,435.72013 7,528.9 18.7 2,145.0 1,654.8 1,239.1 415.7 490.2 324.6 165.6 3,594.3 3,202.1 2,616.3 2,354.02014 7,802.3 19.2 2,022.8 1,530.5 1,147.2 383.3 492.3 333.9 158.4 3,654.5 3,239.4 2,661.2 2,384.8
2015 7,665.2 19.5 2,013.6 1,523.8 1,218.0 305.8 489.8 344.9 144.9 3,719.9 3,302.5 2,727.4 2,440.02016 7,792.6 26.0 2,101.4 1,670.9 1,384.2 286.7 430.5 295.0 135.5 3,762.9 3,344.5 2,805.6 2,512.02017 7,710.8 32.1 2,216.3 1,821.1 1,556.3 264.8 395.2 270.1 125.2 3,801.7 3,400.7 2,918.8 2,610.12018 7,776.0 40.6 2,188.0 1,768.3 1,500.7 267.5 419.7 284.8 134.9 3,864.0 3,458.2 3,024.3 2,727.0
2017 Apr. 7,954.6 24.7 2,276.6 1,847.6 1,563.1 284.6 428.9 298.2 130.8 3,780.1 3,357.1 2,836.6 2,541.1 May 7,947.0 25.6 2,286.5 1,864.4 1,579.4 285.0 422.1 290.1 132.0 3,782.1 3,360.7 2,847.3 2,552.6 June 7,849.7 27.3 2,245.7 1,830.9 1,548.9 282.1 414.8 284.2 130.6 3,780.7 3,364.7 2,859.4 2,559.7
July 7,818.7 26.6 2,258.5 1,840.3 1,560.2 280.0 418.2 289.0 129.2 3,787.1 3,370.5 2,867.1 2,567.3 Aug. 7,807.7 27.5 2,243.1 1,828.2 1,553.7 274.5 415.0 286.9 128.0 3,792.2 3,377.0 2,876.6 2,576.3 Sep. 7,811.3 28.4 2,262.7 1,847.3 1,578.3 269.0 415.4 288.4 127.0 3,799.4 3,385.3 2,890.2 2,589.5
Oct. 7,825.7 28.4 2,285.3 1,873.3 1,604.0 269.2 412.1 285.1 127.0 3,804.7 3,393.5 2,899.1 2,598.2 Nov. 7,849.9 28.0 2,312.8 1,901.5 1,633.0 268.5 411.3 285.5 125.8 3,818.1 3,411.2 2,919.0 2,612.6 Dec. 7,710.8 32.1 2,216.3 1,821.1 1,556.3 264.8 395.2 270.1 125.2 3,801.7 3,400.7 2,918.8 2,610.1
2018 Jan. 7,817.2 29.2 2,296.1 1,891.0 1,624.5 266.5 405.1 280.3 124.9 3,813.9 3,407.5 2,930.5 2,622.5 Feb. 7,790.8 29.6 2,298.1 1,892.3 1,627.0 265.2 405.9 280.6 125.2 3,814.1 3,406.5 2,938.1 2,633.4 Mar. 7,746.6 35.1 2,254.6 1,852.5 1,585.3 267.1 402.1 274.9 127.2 3,814.9 3,410.8 2,946.8 2,644.4
Apr. 7,781.1 33.8 2,300.8 1,892.1 1,625.1 267.0 408.7 280.6 128.0 3,818.5 3,417.4 2,956.1 2,650.7 May 7,882.8 35.0 2,314.0 1,900.7 1,630.1 270.6 413.3 284.6 128.6 3,823.8 3,418.9 2,963.0 2,656.6 June 7,804.7 35.0 2,266.6 1,853.0 1,584.7 268.2 413.6 285.5 128.1 3,832.7 3,430.8 2,979.9 2,672.2
July 7,784.2 34.7 2,276.2 1,852.8 1,585.7 267.1 423.4 295.9 127.5 3,840.0 3,437.3 2,987.0 2,679.3 Aug. 7,828.0 35.1 2,294.8 1,865.2 1,597.6 267.6 429.6 301.1 128.5 3,840.6 3,431.8 2,987.4 2,690.7 Sep. 7,799.9 35.8 2,267.8 1,846.4 1,577.7 268.7 421.4 291.0 130.4 3,854.6 3,447.2 3,006.3 2,708.5
Oct. 7,845.2 36.9 2,286.9 1,855.6 1,588.6 267.0 431.4 298.1 133.2 3,858.3 3,447.8 3,009.7 2,711.9 Nov. 7,881.2 36.8 2,303.5 1,872.8 1,605.2 267.6 430.8 295.9 134.8 3,874.4 3,460.7 3,023.7 2,727.7 Dec. 7,776.0 40.6 2,188.0 1,768.3 1,500.7 267.5 419.7 284.8 134.9 3,864.0 3,458.2 3,024.3 2,727.0
2019 Jan. 7,902.3 36.7 2,267.3 1,827.4 1,559.4 267.9 439.9 304.8 135.1 3,878.7 3,468.7 3,032.2 2,737.6
Changes 3
2011 54.1 − 0.1 32.6 58.7 91.7 − 33.0 − 26.0 − 12.1 − 13.9 − 51.8 − 35.3 38.7 56.72012 − 129.2 2.9 − 81.9 − 28.4 3.0 − 31.4 − 53.5 − 39.7 − 13.8 27.5 27.7 17.0 28.82013 − 703.6 − 0.5 − 257.1 − 249.2 − 216.5 − 32.7 − 7.9 1.6 − 9.5 13.6 16.6 23.6 21.62014 206.8 0.4 − 126.2 − 128.6 − 95.3 − 33.4 2.4 7.2 − 4.8 55.1 40.0 52.3 36.8
2015 − 191.4 0.3 − 18.2 − 12.1 66.1 − 78.2 − 6.1 6.6 − 12.8 64.8 64.1 68.1 56.62016 184.3 6.5 120.3 178.4 195.3 − 16.8 − 58.1 − 49.2 − 8.8 57.5 53.4 88.8 81.02017 8.0 6.1 135.9 165.0 182.6 − 17.6 − 29.1 − 19.6 − 9.5 51.3 63.5 114.8 101.12018 101.8 8.5 − 29.2 − 49.7 − 53.4 3.7 20.6 13.0 7.6 78.7 71.9 118.1 127.8
2017 May 8.8 0.9 12.6 18.0 17.1 0.9 − 5.4 − 6.8 1.4 4.0 4.6 9.0 9.9 June − 85.4 1.7 − 38.0 − 31.5 − 29.2 − 2.3 − 6.5 − 5.2 − 1.4 0.5 5.3 13.2 8.0
July − 14.3 − 0.7 14.5 10.5 12.2 − 1.7 4.0 5.2 − 1.2 8.6 7.1 8.9 8.6 Aug. − 4.7 0.9 − 14.3 − 11.6 − 6.3 − 5.3 − 2.8 − 1.6 − 1.2 5.6 6.8 9.9 9.3 Sep. 4.8 0.9 21.8 21.5 26.0 − 4.5 0.3 1.2 − 0.9 6.9 7.1 12.0 13.5
Oct. 8.6 0.1 21.9 25.5 25.4 0.1 − 3.7 − 3.7 0.1 4.6 8.0 8.6 8.6 Nov. 33.4 − 0.4 28.9 28.8 29.4 − 0.6 0.0 1.2 − 1.1 14.8 18.7 19.0 13.5 Dec. − 126.4 4.1 − 90.1 − 74.7 − 72.0 − 2.7 − 15.4 − 15.0 − 0.4 − 15.2 − 10.0 0.1 − 2.4
2018 Jan. 124.2 − 2.9 82.2 70.9 68.7 2.2 11.3 11.5 − 0.2 14.7 8.2 12.4 13.0 Feb. 6.3 0.3 0.5 0.6 2.0 − 1.4 − 0.1 − 0.4 0.3 0.2 − 0.7 7.7 10.7 Mar. − 37.4 5.5 − 42.9 − 39.5 − 41.4 1.9 − 3.4 − 5.3 2.0 2.7 5.6 10.1 12.3
Apr. 28.9 − 1.3 45.6 39.7 39.9 − 0.2 5.9 5.1 0.9 4.0 7.1 9.8 6.3 May 85.0 1.3 12.4 9.1 5.7 3.4 3.4 2.8 0.5 12.9 9.4 15.3 14.3 June − 77.2 − 0.1 − 47.4 − 47.7 − 45.4 − 2.3 0.3 0.9 − 0.5 9.9 12.8 17.9 16.4
July − 14.4 − 0.3 10.5 0.3 1.3 − 1.0 10.1 10.7 − 0.6 7.8 6.8 5.9 6.1 Aug. 41.9 0.4 19.8 13.8 13.0 0.8 5.9 4.9 1.0 0.6 − 5.6 0.4 11.3 Sep. − 30.4 0.8 − 27.3 − 18.9 − 19.9 1.0 − 8.4 − 10.4 1.9 14.2 15.9 19.2 18.2
Oct. 36.4 1.1 15.0 8.5 10.3 − 1.8 6.5 6.1 0.4 3.8 0.5 3.4 3.2 Nov. 38.5 − 0.1 17.2 17.6 16.7 1.0 − 0.5 − 2.0 1.6 16.7 13.4 14.4 16.1 Dec. − 100.0 3.8 − 114.6 − 104.0 − 104.3 0.2 − 10.6 − 10.9 0.3 − 8.8 − 1.5 1.6 − 0.1
2019 Jan. 128.7 − 3.9 79.5 59.3 58.7 0.6 20.2 20.0 0.3 16.9 12.6 10.0 11.4
* This table serves to supplement the “Overall monetary survey“ in Section II. Unlike by banks (including building and loan associations) − data from money marketthe other tables in Section IV, this table includes − in addition to the figures reported funds. 1 See footnote 1 in Table IV.2. 2 Including debt securities arising from the
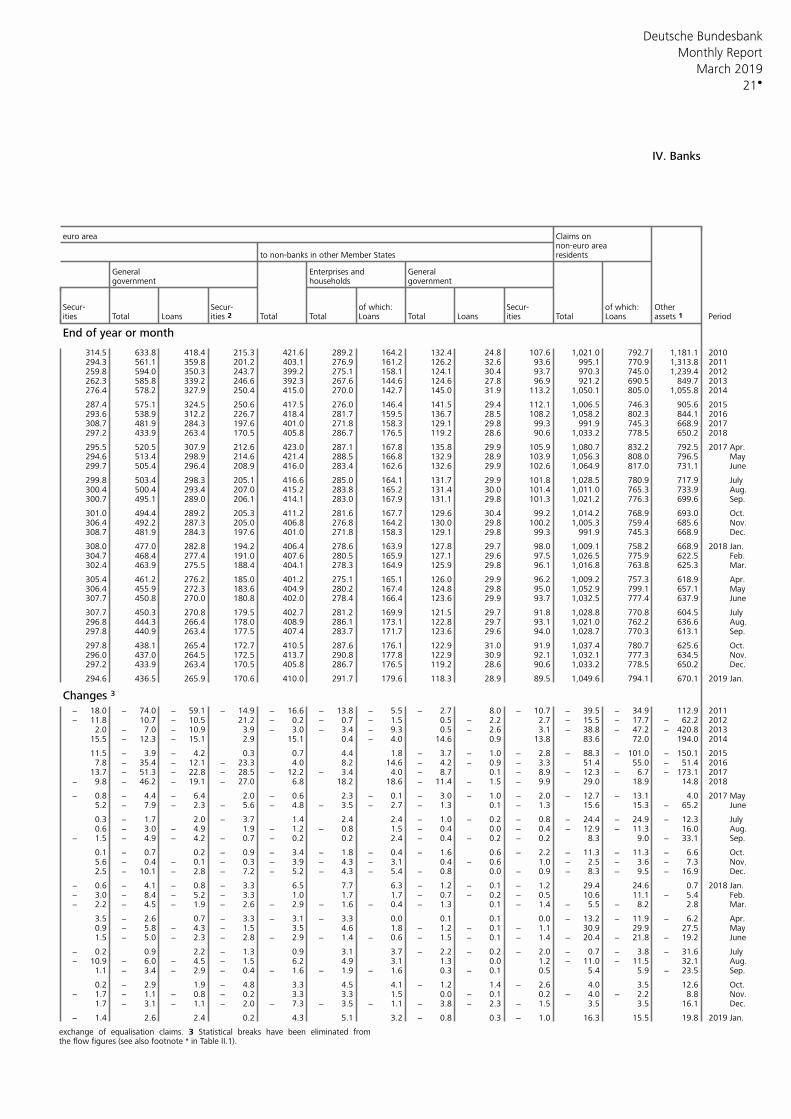
Deutsche Bundesbank
21
Monthly Report
March 2019
IV. Banks
euro area Claims onnon-euro area
to non-banks in other Member States residents
General Enterprises and General government households government
Secur- Secur- of which: Secur- of which: Otherities Total Loans ities 2 Total Total Loans Total Loans ities Total Loans assets 1 Period
End of year or month
314.5 633.8 418.4 215.3 421.6 289.2 164.2 132.4 24.8 107.6 1,021.0 792.7 1,181.1 2010294.3 561.1 359.8 201.2 403.1 276.9 161.2 126.2 32.6 93.6 995.1 770.9 1,313.8 2011259.8 594.0 350.3 243.7 399.2 275.1 158.1 124.1 30.4 93.7 970.3 745.0 1,239.4 2012262.3 585.8 339.2 246.6 392.3 267.6 144.6 124.6 27.8 96.9 921.2 690.5 849.7 2013276.4 578.2 327.9 250.4 415.0 270.0 142.7 145.0 31.9 113.2 1,050.1 805.0 1,055.8 2014
287.4 575.1 324.5 250.6 417.5 276.0 146.4 141.5 29.4 112.1 1,006.5 746.3 905.6 2015293.6 538.9 312.2 226.7 418.4 281.7 159.5 136.7 28.5 108.2 1,058.2 802.3 844.1 2016308.7 481.9 284.3 197.6 401.0 271.8 158.3 129.1 29.8 99.3 991.9 745.3 668.9 2017297.2 433.9 263.4 170.5 405.8 286.7 176.5 119.2 28.6 90.6 1,033.2 778.5 650.2 2018
295.5 520.5 307.9 212.6 423.0 287.1 167.8 135.8 29.9 105.9 1,080.7 832.2 792.5 2017 Apr.294.6 513.4 298.9 214.6 421.4 288.5 166.8 132.9 28.9 103.9 1,056.3 808.0 796.5 May299.7 505.4 296.4 208.9 416.0 283.4 162.6 132.6 29.9 102.6 1,064.9 817.0 731.1 June
299.8 503.4 298.3 205.1 416.6 285.0 164.1 131.7 29.9 101.8 1,028.5 780.9 717.9 July300.4 500.4 293.4 207.0 415.2 283.8 165.2 131.4 30.0 101.4 1,011.0 765.3 733.9 Aug.300.7 495.1 289.0 206.1 414.1 283.0 167.9 131.1 29.8 101.3 1,021.2 776.3 699.6 Sep.
301.0 494.4 289.2 205.3 411.2 281.6 167.7 129.6 30.4 99.2 1,014.2 768.9 693.0 Oct.306.4 492.2 287.3 205.0 406.8 276.8 164.2 130.0 29.8 100.2 1,005.3 759.4 685.6 Nov.308.7 481.9 284.3 197.6 401.0 271.8 158.3 129.1 29.8 99.3 991.9 745.3 668.9 Dec.
308.0 477.0 282.8 194.2 406.4 278.6 163.9 127.8 29.7 98.0 1,009.1 758.2 668.9 2018 Jan.304.7 468.4 277.4 191.0 407.6 280.5 165.9 127.1 29.6 97.5 1,026.5 775.9 622.5 Feb.302.4 463.9 275.5 188.4 404.1 278.3 164.9 125.9 29.8 96.1 1,016.8 763.8 625.3 Mar.
305.4 461.2 276.2 185.0 401.2 275.1 165.1 126.0 29.9 96.2 1,009.2 757.3 618.9 Apr.306.4 455.9 272.3 183.6 404.9 280.2 167.4 124.8 29.8 95.0 1,052.9 799.1 657.1 May307.7 450.8 270.0 180.8 402.0 278.4 166.4 123.6 29.9 93.7 1,032.5 777.4 637.9 June
307.7 450.3 270.8 179.5 402.7 281.2 169.9 121.5 29.7 91.8 1,028.8 770.8 604.5 July296.8 444.3 266.4 178.0 408.9 286.1 173.1 122.8 29.7 93.1 1,021.0 762.2 636.6 Aug.297.8 440.9 263.4 177.5 407.4 283.7 171.7 123.6 29.6 94.0 1,028.7 770.3 613.1 Sep.
297.8 438.1 265.4 172.7 410.5 287.6 176.1 122.9 31.0 91.9 1,037.4 780.7 625.6 Oct.296.0 437.0 264.5 172.5 413.7 290.8 177.8 122.9 30.9 92.1 1,032.1 777.3 634.5 Nov.297.2 433.9 263.4 170.5 405.8 286.7 176.5 119.2 28.6 90.6 1,033.2 778.5 650.2 Dec.
294.6 436.5 265.9 170.6 410.0 291.7 179.6 118.3 28.9 89.5 1,049.6 794.1 670.1 2019 Jan.
Changes 3
− 18.0 − 74.0 − 59.1 − 14.9 − 16.6 − 13.8 − 5.5 − 2.7 8.0 − 10.7 − 39.5 − 34.9 112.9 2011− 11.8 10.7 − 10.5 21.2 − 0.2 − 0.7 − 1.5 0.5 − 2.2 2.7 − 15.5 − 17.7 − 62.2 2012
2.0 − 7.0 − 10.9 3.9 − 3.0 − 3.4 − 9.3 0.5 − 2.6 3.1 − 38.8 − 47.2 − 420.8 201315.5 − 12.3 − 15.1 2.9 15.1 0.4 − 4.0 14.6 0.9 13.8 83.6 72.0 194.0 2014
11.5 − 3.9 − 4.2 0.3 0.7 4.4 1.8 − 3.7 − 1.0 − 2.8 − 88.3 − 101.0 − 150.1 20157.8 − 35.4 − 12.1 − 23.3 4.0 8.2 14.6 − 4.2 − 0.9 − 3.3 51.4 55.0 − 51.4 2016
13.7 − 51.3 − 22.8 − 28.5 − 12.2 − 3.4 4.0 − 8.7 0.1 − 8.9 − 12.3 − 6.7 − 173.1 2017− 9.8 − 46.2 − 19.1 − 27.0 6.8 18.2 18.6 − 11.4 − 1.5 − 9.9 29.0 18.9 14.8 2018
− 0.8 − 4.4 − 6.4 2.0 − 0.6 2.3 − 0.1 − 3.0 − 1.0 − 2.0 − 12.7 − 13.1 4.0 2017 May5.2 − 7.9 − 2.3 − 5.6 − 4.8 − 3.5 − 2.7 − 1.3 0.1 − 1.3 15.6 15.3 − 65.2 June
0.3 − 1.7 2.0 − 3.7 1.4 2.4 2.4 − 1.0 − 0.2 − 0.8 − 24.4 − 24.9 − 12.3 July0.6 − 3.0 − 4.9 1.9 − 1.2 − 0.8 1.5 − 0.4 0.0 − 0.4 − 12.9 − 11.3 16.0 Aug.
− 1.5 − 4.9 − 4.2 − 0.7 − 0.2 0.2 2.4 − 0.4 − 0.2 − 0.2 8.3 9.0 − 33.1 Sep.
0.1 − 0.7 0.2 − 0.9 − 3.4 − 1.8 − 0.4 − 1.6 0.6 − 2.2 − 11.3 − 11.3 − 6.6 Oct.5.6 − 0.4 − 0.1 − 0.3 − 3.9 − 4.3 − 3.1 0.4 − 0.6 1.0 − 2.5 − 3.6 − 7.3 Nov.2.5 − 10.1 − 2.8 − 7.2 − 5.2 − 4.3 − 5.4 − 0.8 0.0 − 0.9 − 8.3 − 9.5 − 16.9 Dec.
− 0.6 − 4.1 − 0.8 − 3.3 6.5 7.7 6.3 − 1.2 − 0.1 − 1.2 29.4 24.6 0.7 2018 Jan.− 3.0 − 8.4 − 5.2 − 3.3 1.0 1.7 1.7 − 0.7 − 0.2 − 0.5 10.6 11.1 − 5.4 Feb.− 2.2 − 4.5 − 1.9 − 2.6 − 2.9 − 1.6 − 0.4 − 1.3 0.1 − 1.4 − 5.5 − 8.2 2.8 Mar.
3.5 − 2.6 0.7 − 3.3 − 3.1 − 3.3 0.0 0.1 0.1 0.0 − 13.2 − 11.9 − 6.2 Apr.0.9 − 5.8 − 4.3 − 1.5 3.5 4.6 1.8 − 1.2 − 0.1 − 1.1 30.9 29.9 27.5 May1.5 − 5.0 − 2.3 − 2.8 − 2.9 − 1.4 − 0.6 − 1.5 − 0.1 − 1.4 − 20.4 − 21.8 − 19.2 June
− 0.2 0.9 2.2 − 1.3 0.9 3.1 3.7 − 2.2 − 0.2 − 2.0 − 0.7 − 3.8 − 31.6 July− 10.9 − 6.0 − 4.5 − 1.5 6.2 4.9 3.1 1.3 0.0 1.2 − 11.0 − 11.5 32.1 Aug.
1.1 − 3.4 − 2.9 − 0.4 − 1.6 − 1.9 − 1.6 0.3 − 0.1 0.5 5.4 5.9 − 23.5 Sep.
0.2 − 2.9 1.9 − 4.8 3.3 4.5 4.1 − 1.2 1.4 − 2.6 4.0 3.5 12.6 Oct.− 1.7 − 1.1 − 0.8 − 0.2 3.3 3.3 1.5 0.0 − 0.1 0.2 − 4.0 − 2.2 8.8 Nov.
1.7 − 3.1 − 1.1 − 2.0 − 7.3 − 3.5 − 1.1 − 3.8 − 2.3 − 1.5 3.5 3.5 16.1 Dec.
− 1.4 2.6 2.4 0.2 4.3 5.1 3.2 − 0.8 0.3 − 1.0 16.3 15.5 19.8 2019 Jan.
exchange of equalisation claims. 3 Statistical breaks have been eliminated fromthe flow figures (see also footnote * in Table II.1).
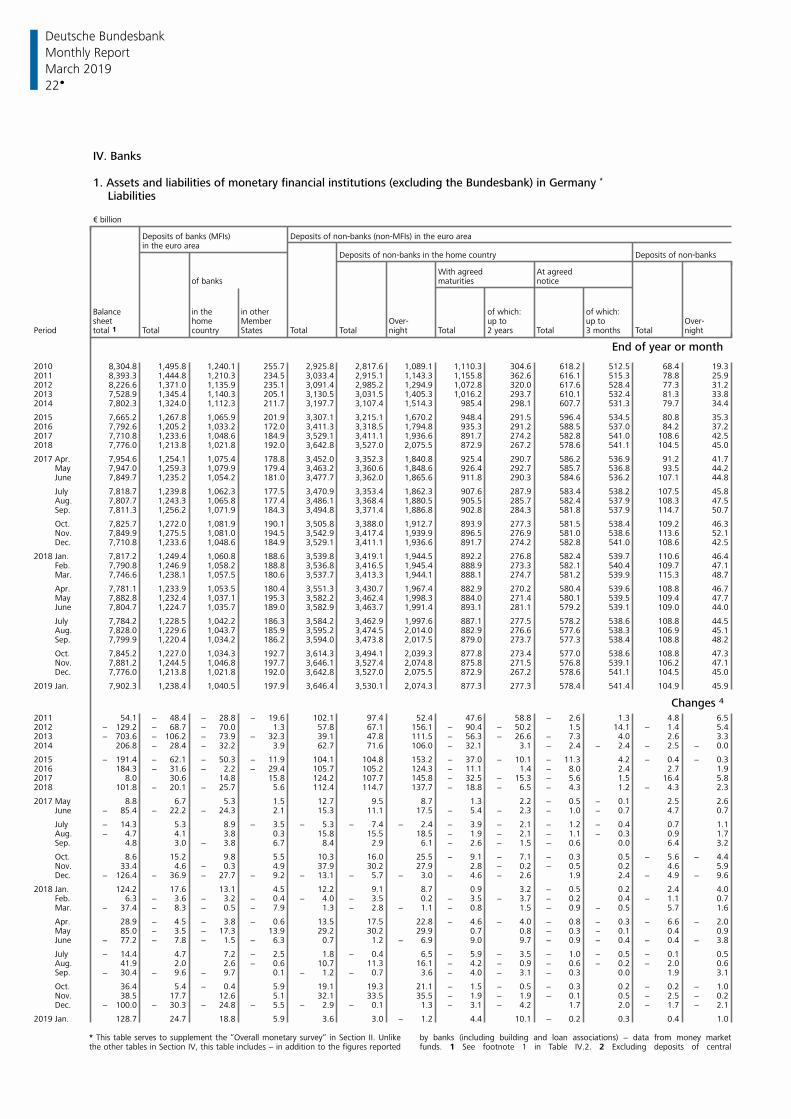
Deutsche Bundesbank
22
Monthly Report
March 2019
IV. Banks
1. Assets and liabilities of monetary financial institutions (excluding the Bundesbank) in Germany *
Liabilities
€ billion
Deposits of banks (MFIs) Deposits of non-banks (non-MFIs) in the euro areain the euro area
Deposits of non-banks in the home country Deposits of non-banks
With agreed At agreedof banks maturities notice
Balance in the in other of which: of which:sheet home Member Over- up to up to Over-
Period total 1 Total country States Total Total night Total 2 years Total 3 months Total night
End of year or month
2010 8,304.8 1,495.8 1,240.1 255.7 2,925.8 2,817.6 1,089.1 1,110.3 304.6 618.2 512.5 68.4 19.32011 8,393.3 1,444.8 1,210.3 234.5 3,033.4 2,915.1 1,143.3 1,155.8 362.6 616.1 515.3 78.8 25.92012 8,226.6 1,371.0 1,135.9 235.1 3,091.4 2,985.2 1,294.9 1,072.8 320.0 617.6 528.4 77.3 31.22013 7,528.9 1,345.4 1,140.3 205.1 3,130.5 3,031.5 1,405.3 1,016.2 293.7 610.1 532.4 81.3 33.82014 7,802.3 1,324.0 1,112.3 211.7 3,197.7 3,107.4 1,514.3 985.4 298.1 607.7 531.3 79.7 34.4
2015 7,665.2 1,267.8 1,065.9 201.9 3,307.1 3,215.1 1,670.2 948.4 291.5 596.4 534.5 80.8 35.32016 7,792.6 1,205.2 1,033.2 172.0 3,411.3 3,318.5 1,794.8 935.3 291.2 588.5 537.0 84.2 37.22017 7,710.8 1,233.6 1,048.6 184.9 3,529.1 3,411.1 1,936.6 891.7 274.2 582.8 541.0 108.6 42.52018 7,776.0 1,213.8 1,021.8 192.0 3,642.8 3,527.0 2,075.5 872.9 267.2 578.6 541.1 104.5 45.0
2017 Apr. 7,954.6 1,254.1 1,075.4 178.8 3,452.0 3,352.3 1,840.8 925.4 290.7 586.2 536.9 91.2 41.7 May 7,947.0 1,259.3 1,079.9 179.4 3,463.2 3,360.6 1,848.6 926.4 292.7 585.7 536.8 93.5 44.2 June 7,849.7 1,235.2 1,054.2 181.0 3,477.7 3,362.0 1,865.6 911.8 290.3 584.6 536.2 107.1 44.8
July 7,818.7 1,239.8 1,062.3 177.5 3,470.9 3,353.4 1,862.3 907.6 287.9 583.4 538.2 107.5 45.8 Aug. 7,807.7 1,243.3 1,065.8 177.4 3,486.1 3,368.4 1,880.5 905.5 285.7 582.4 537.9 108.3 47.5 Sep. 7,811.3 1,256.2 1,071.9 184.3 3,494.8 3,371.4 1,886.8 902.8 284.3 581.8 537.9 114.7 50.7
Oct. 7,825.7 1,272.0 1,081.9 190.1 3,505.8 3,388.0 1,912.7 893.9 277.3 581.5 538.4 109.2 46.3 Nov. 7,849.9 1,275.5 1,081.0 194.5 3,542.9 3,417.4 1,939.9 896.5 276.9 581.0 538.6 113.6 52.1 Dec. 7,710.8 1,233.6 1,048.6 184.9 3,529.1 3,411.1 1,936.6 891.7 274.2 582.8 541.0 108.6 42.5
2018 Jan. 7,817.2 1,249.4 1,060.8 188.6 3,539.8 3,419.1 1,944.5 892.2 276.8 582.4 539.7 110.6 46.4 Feb. 7,790.8 1,246.9 1,058.2 188.8 3,536.8 3,416.5 1,945.4 888.9 273.3 582.1 540.4 109.7 47.1 Mar. 7,746.6 1,238.1 1,057.5 180.6 3,537.7 3,413.3 1,944.1 888.1 274.7 581.2 539.9 115.3 48.7
Apr. 7,781.1 1,233.9 1,053.5 180.4 3,551.3 3,430.7 1,967.4 882.9 270.2 580.4 539.6 108.8 46.7 May 7,882.8 1,232.4 1,037.1 195.3 3,582.2 3,462.4 1,998.3 884.0 271.4 580.1 539.5 109.4 47.7 June 7,804.7 1,224.7 1,035.7 189.0 3,582.9 3,463.7 1,991.4 893.1 281.1 579.2 539.1 109.0 44.0
July 7,784.2 1,228.5 1,042.2 186.3 3,584.2 3,462.9 1,997.6 887.1 277.5 578.2 538.6 108.8 44.5 Aug. 7,828.0 1,229.6 1,043.7 185.9 3,595.2 3,474.5 2,014.0 882.9 276.6 577.6 538.3 106.9 45.1 Sep. 7,799.9 1,220.4 1,034.2 186.2 3,594.0 3,473.8 2,017.5 879.0 273.7 577.3 538.4 108.8 48.2
Oct. 7,845.2 1,227.0 1,034.3 192.7 3,614.3 3,494.1 2,039.3 877.8 273.4 577.0 538.6 108.8 47.3 Nov. 7,881.2 1,244.5 1,046.8 197.7 3,646.1 3,527.4 2,074.8 875.8 271.5 576.8 539.1 106.2 47.1 Dec. 7,776.0 1,213.8 1,021.8 192.0 3,642.8 3,527.0 2,075.5 872.9 267.2 578.6 541.1 104.5 45.0
2019 Jan. 7,902.3 1,238.4 1,040.5 197.9 3,646.4 3,530.1 2,074.3 877.3 277.3 578.4 541.4 104.9 45.9
Changes 4
2011 54.1 − 48.4 − 28.8 − 19.6 102.1 97.4 52.4 47.6 58.8 − 2.6 1.3 4.8 6.52012 − 129.2 − 68.7 − 70.0 1.3 57.8 67.1 156.1 − 90.4 − 50.2 1.5 14.1 − 1.4 5.42013 − 703.6 − 106.2 − 73.9 − 32.3 39.1 47.8 111.5 − 56.3 − 26.6 − 7.3 4.0 2.6 3.32014 206.8 − 28.4 − 32.2 3.9 62.7 71.6 106.0 − 32.1 3.1 − 2.4 − 2.4 − 2.5 − 0.0
2015 − 191.4 − 62.1 − 50.3 − 11.9 104.1 104.8 153.2 − 37.0 − 10.1 − 11.3 4.2 − 0.4 − 0.32016 184.3 − 31.6 − 2.2 − 29.4 105.7 105.2 124.3 − 11.1 1.4 − 8.0 2.4 2.7 1.92017 8.0 30.6 14.8 15.8 124.2 107.7 145.8 − 32.5 − 15.3 − 5.6 1.5 16.4 5.82018 101.8 − 20.1 − 25.7 5.6 112.4 114.7 137.7 − 18.8 − 6.5 − 4.3 1.2 − 4.3 2.3
2017 May 8.8 6.7 5.3 1.5 12.7 9.5 8.7 1.3 2.2 − 0.5 − 0.1 2.5 2.6 June − 85.4 − 22.2 − 24.3 2.1 15.3 11.1 17.5 − 5.4 − 2.3 − 1.0 − 0.7 4.7 0.7
July − 14.3 5.3 8.9 − 3.5 − 5.3 − 7.4 − 2.4 − 3.9 − 2.1 − 1.2 − 0.4 0.7 1.1 Aug. − 4.7 4.1 3.8 0.3 15.8 15.5 18.5 − 1.9 − 2.1 − 1.1 − 0.3 0.9 1.7 Sep. 4.8 3.0 − 3.8 6.7 8.4 2.9 6.1 − 2.6 − 1.5 − 0.6 0.0 6.4 3.2
Oct. 8.6 15.2 9.8 5.5 10.3 16.0 25.5 − 9.1 − 7.1 − 0.3 0.5 − 5.6 − 4.4 Nov. 33.4 4.6 − 0.3 4.9 37.9 30.2 27.9 2.8 − 0.2 − 0.5 0.2 4.6 5.9 Dec. − 126.4 − 36.9 − 27.7 − 9.2 − 13.1 − 5.7 − 3.0 − 4.6 − 2.6 1.9 2.4 − 4.9 − 9.6
2018 Jan. 124.2 17.6 13.1 4.5 12.2 9.1 8.7 0.9 3.2 − 0.5 0.2 2.4 4.0 Feb. 6.3 − 3.6 − 3.2 − 0.4 − 4.0 − 3.5 0.2 − 3.5 − 3.7 − 0.2 0.4 − 1.1 0.7 Mar. − 37.4 − 8.3 − 0.5 − 7.9 1.3 − 2.8 − 1.1 − 0.8 1.5 − 0.9 − 0.5 5.7 1.6
Apr. 28.9 − 4.5 − 3.8 − 0.6 13.5 17.5 22.8 − 4.6 − 4.0 − 0.8 − 0.3 − 6.6 − 2.0 May 85.0 − 3.5 − 17.3 13.9 29.2 30.2 29.9 0.7 0.8 − 0.3 − 0.1 0.4 0.9 June − 77.2 − 7.8 − 1.5 − 6.3 0.7 1.2 − 6.9 9.0 9.7 − 0.9 − 0.4 − 0.4 − 3.8
July − 14.4 4.7 7.2 − 2.5 1.8 − 0.4 6.5 − 5.9 − 3.5 − 1.0 − 0.5 − 0.1 0.5 Aug. 41.9 2.0 2.6 − 0.6 10.7 11.3 16.1 − 4.2 − 0.9 − 0.6 − 0.2 − 2.0 0.6 Sep. − 30.4 − 9.6 − 9.7 0.1 − 1.2 − 0.7 3.6 − 4.0 − 3.1 − 0.3 0.0 1.9 3.1
Oct. 36.4 5.4 − 0.4 5.9 19.1 19.3 21.1 − 1.5 − 0.5 − 0.3 0.2 − 0.2 − 1.0 Nov. 38.5 17.7 12.6 5.1 32.1 33.5 35.5 − 1.9 − 1.9 − 0.1 0.5 − 2.5 − 0.2 Dec. − 100.0 − 30.3 − 24.8 − 5.5 − 2.9 − 0.1 1.3 − 3.1 − 4.2 1.7 2.0 − 1.7 − 2.1
2019 Jan. 128.7 24.7 18.8 5.9 3.6 3.0 − 1.2 4.4 10.1 − 0.2 0.3 0.4 1.0
* This table serves to supplement the “Overall monetary survey“ in Section II. Unlike by banks (including building and loan associations) − data from money marketthe other tables in Section IV, this table includes − in addition to the figures reported funds. 1 See footnote 1 in Table IV.2. 2 Excluding deposits of central
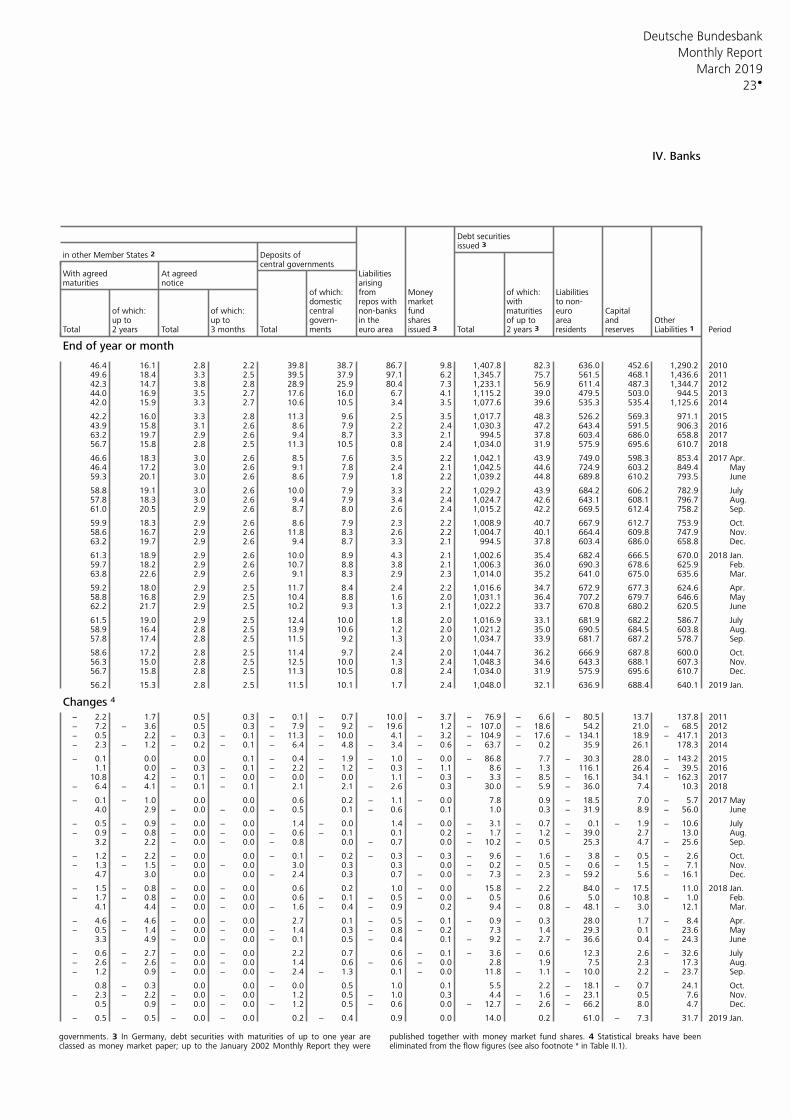
Deutsche Bundesbank
23
Monthly Report
March 2019
IV. Banks
Debt securitiesissued 3
in other Member States 2 Deposits ofcentral governments
With agreed At agreed Liabilitiesmaturities notice arising
of which: from Money of which: Liabilitiesdomestic market with to non-repos with
of which: of which: central non-banks fund euro Capitalmaturitiesup to up to govern- in the shares of up to area and Other
Total 2 years Total 3 months Total ments euro area issued 3 Total reserves Period2 years 3 residents Liabilities 1
End of year or month
46.4 16.1 2.8 2.2 39.8 38.7 86.7 9.8 1,407.8 82.3 636.0 452.6 1,290.2 201049.6 18.4 3.3 2.5 39.5 37.9 97.1 6.2 1,345.7 75.7 561.5 468.1 1,436.6 201142.3 14.7 3.8 2.8 28.9 25.9 80.4 7.3 1,233.1 56.9 611.4 487.3 1,344.7 201244.0 16.9 3.5 2.7 17.6 16.0 6.7 4.1 1,115.2 39.0 479.5 503.0 944.5 201342.0 15.9 3.3 2.7 10.6 10.5 3.4 3.5 1,077.6 39.6 535.3 535.4 1,125.6 2014
42.2 16.0 3.3 2.8 11.3 9.6 2.5 3.5 1,017.7 48.3 526.2 569.3 971.1 201543.9 15.8 3.1 2.6 8.6 7.9 2.2 2.4 1,030.3 47.2 643.4 591.5 906.3 201663.2 19.7 2.9 2.6 9.4 8.7 3.3 2.1 994.5 37.8 603.4 686.0 658.8 201756.7 15.8 2.8 2.5 11.3 10.5 0.8 2.4 1,034.0 31.9 575.9 695.6 610.7 2018
46.6 18.3 3.0 2.6 8.5 7.6 3.5 2.2 1,042.1 43.9 749.0 598.3 853.4 2017 Apr.46.4 17.2 3.0 2.6 9.1 7.8 2.4 2.1 1,042.5 44.6 724.9 603.2 849.4 May59.3 20.1 3.0 2.6 8.6 7.9 1.8 2.2 1,039.2 44.8 689.8 610.2 793.5 June
58.8 19.1 3.0 2.6 10.0 7.9 3.3 2.2 1,029.2 43.9 684.2 606.2 782.9 July57.8 18.3 3.0 2.6 9.4 7.9 3.4 2.4 1,024.7 42.6 643.1 608.1 796.7 Aug.61.0 20.5 2.9 2.6 8.7 8.0 2.6 2.4 1,015.2 42.2 669.5 612.4 758.2 Sep.
59.9 18.3 2.9 2.6 8.6 7.9 2.3 2.2 1,008.9 40.7 667.9 612.7 753.9 Oct.58.6 16.7 2.9 2.6 11.8 8.3 2.6 2.2 1,004.7 40.1 664.4 609.8 747.9 Nov.63.2 19.7 2.9 2.6 9.4 8.7 3.3 2.1 994.5 37.8 603.4 686.0 658.8 Dec.
61.3 18.9 2.9 2.6 10.0 8.9 4.3 2.1 1,002.6 35.4 682.4 666.5 670.0 2018 Jan.59.7 18.2 2.9 2.6 10.7 8.8 3.8 2.1 1,006.3 36.0 690.3 678.6 625.9 Feb.63.8 22.6 2.9 2.6 9.1 8.3 2.9 2.3 1,014.0 35.2 641.0 675.0 635.6 Mar.
59.2 18.0 2.9 2.5 11.7 8.4 2.4 2.2 1,016.6 34.7 672.9 677.3 624.6 Apr.58.8 16.8 2.9 2.5 10.4 8.8 1.6 2.0 1,031.1 36.4 707.2 679.7 646.6 May62.2 21.7 2.9 2.5 10.2 9.3 1.3 2.1 1,022.2 33.7 670.8 680.2 620.5 June
61.5 19.0 2.9 2.5 12.4 10.0 1.8 2.0 1,016.9 33.1 681.9 682.2 586.7 July58.9 16.4 2.8 2.5 13.9 10.6 1.2 2.0 1,021.2 35.0 690.5 684.5 603.8 Aug.57.8 17.4 2.8 2.5 11.5 9.2 1.3 2.0 1,034.7 33.9 681.7 687.2 578.7 Sep.
58.6 17.2 2.8 2.5 11.4 9.7 2.4 2.0 1,044.7 36.2 666.9 687.8 600.0 Oct.56.3 15.0 2.8 2.5 12.5 10.0 1.3 2.4 1,048.3 34.6 643.3 688.1 607.3 Nov.56.7 15.8 2.8 2.5 11.3 10.5 0.8 2.4 1,034.0 31.9 575.9 695.6 610.7 Dec.
56.2 15.3 2.8 2.5 11.5 10.1 1.7 2.4 1,048.0 32.1 636.9 688.4 640.1 2019 Jan.
Changes 4
− 2.2 1.7 0.5 0.3 − 0.1 − 0.7 10.0 − 3.7 − 76.9 − 6.6 − 80.5 13.7 137.8 2011− 7.2 − 3.6 0.5 0.3 − 7.9 − 9.2 − 19.6 1.2 − 107.0 − 18.6 54.2 21.0 − 68.5 2012− 0.5 2.2 − 0.3 − 0.1 − 11.3 − 10.0 4.1 − 3.2 − 104.9 − 17.6 − 134.1 18.9 − 417.1 2013− 2.3 − 1.2 − 0.2 − 0.1 − 6.4 − 4.8 − 3.4 − 0.6 − 63.7 − 0.2 35.9 26.1 178.3 2014
− 0.1 0.0 0.0 0.1 − 0.4 − 1.9 − 1.0 − 0.0 − 86.8 7.7 − 30.3 28.0 − 143.2 20151.1 0.0 − 0.3 − 0.1 − 2.2 − 1.2 − 0.3 − 1.1 8.6 − 1.3 116.1 26.4 − 39.5 2016
10.8 4.2 − 0.1 − 0.0 − 0.0 − 0.0 1.1 − 0.3 − 3.3 − 8.5 − 16.1 34.1 − 162.3 2017− 6.4 − 4.1 − 0.1 − 0.1 2.1 2.1 − 2.6 0.3 30.0 − 5.9 − 36.0 7.4 10.3 2018
− 0.1 − 1.0 0.0 0.0 0.6 0.2 − 1.1 − 0.0 7.8 0.9 − 18.5 7.0 − 5.7 2017 May4.0 2.9 − 0.0 − 0.0 − 0.5 0.1 − 0.6 0.1 1.0 0.3 − 31.9 8.9 − 56.0 June
− 0.5 − 0.9 − 0.0 − 0.0 1.4 − 0.0 1.4 − 0.0 − 3.1 − 0.7 − 0.1 − 1.9 − 10.6 July− 0.9 − 0.8 − 0.0 − 0.0 − 0.6 − 0.1 0.1 0.2 − 1.7 − 1.2 − 39.0 2.7 13.0 Aug.
3.2 2.2 − 0.0 − 0.0 − 0.8 0.0 − 0.7 0.0 − 10.2 − 0.5 25.3 4.7 − 25.6 Sep.
− 1.2 − 2.2 − 0.0 0.0 − 0.1 − 0.2 − 0.3 − 0.3 − 9.6 − 1.6 − 3.8 − 0.5 − 2.6 Oct.− 1.3 − 1.5 − 0.0 − 0.0 3.0 0.3 0.3 0.0 − 0.2 − 0.5 − 0.6 − 1.5 − 7.1 Nov.
4.7 3.0 0.0 0.0 − 2.4 0.3 0.7 − 0.0 − 7.3 − 2.3 − 59.2 5.6 − 16.1 Dec.
− 1.5 − 0.8 − 0.0 − 0.0 0.6 0.2 1.0 − 0.0 15.8 − 2.2 84.0 − 17.5 11.0 2018 Jan.− 1.7 − 0.8 − 0.0 − 0.0 0.6 − 0.1 − 0.5 − 0.0 − 0.5 0.6 5.0 10.8 − 1.0 Feb.
4.1 4.4 − 0.0 − 0.0 − 1.6 − 0.4 − 0.9 0.2 9.4 − 0.8 − 48.1 − 3.0 12.1 Mar.
− 4.6 − 4.6 − 0.0 − 0.0 2.7 0.1 − 0.5 − 0.1 − 0.9 − 0.3 28.0 1.7 − 8.4 Apr.− 0.5 − 1.4 − 0.0 − 0.0 − 1.4 0.3 − 0.8 − 0.2 7.3 1.4 29.3 0.1 23.6 May
3.3 4.9 − 0.0 − 0.0 − 0.1 0.5 − 0.4 0.1 − 9.2 − 2.7 − 36.6 0.4 − 24.3 June
− 0.6 − 2.7 − 0.0 − 0.0 2.2 0.7 0.6 − 0.1 − 3.6 − 0.6 12.3 2.6 − 32.6 July− 2.6 − 2.6 − 0.0 − 0.0 1.4 0.6 − 0.6 − 0.0 2.8 1.9 7.5 2.3 17.3 Aug.− 1.2 0.9 − 0.0 − 0.0 − 2.4 − 1.3 0.1 − 0.0 11.8 − 1.1 − 10.0 2.2 − 23.7 Sep.
0.8 − 0.3 0.0 0.0 − 0.0 0.5 1.0 0.1 5.5 2.2 − 18.1 − 0.7 24.1 Oct.− 2.3 − 2.2 − 0.0 − 0.0 1.2 0.5 − 1.0 0.3 4.4 − 1.6 − 23.1 0.5 7.6 Nov.
0.5 0.9 − 0.0 − 0.0 − 1.2 0.5 − 0.6 0.0 − 12.7 − 2.6 − 66.2 8.0 4.7 Dec.
− 0.5 − 0.5 − 0.0 − 0.0 0.2 − 0.4 0.9 0.0 14.0 0.2 61.0 − 7.3 31.7 2019 Jan.
governments. 3 In Germany, debt securities with maturities of up to one year are published together with money market fund shares. 4 Statistical breaks have beenclassed as money market paper; up to the January 2002 Monthly Report they were eliminated from the flow figures (see also footnote * in Table II.1).
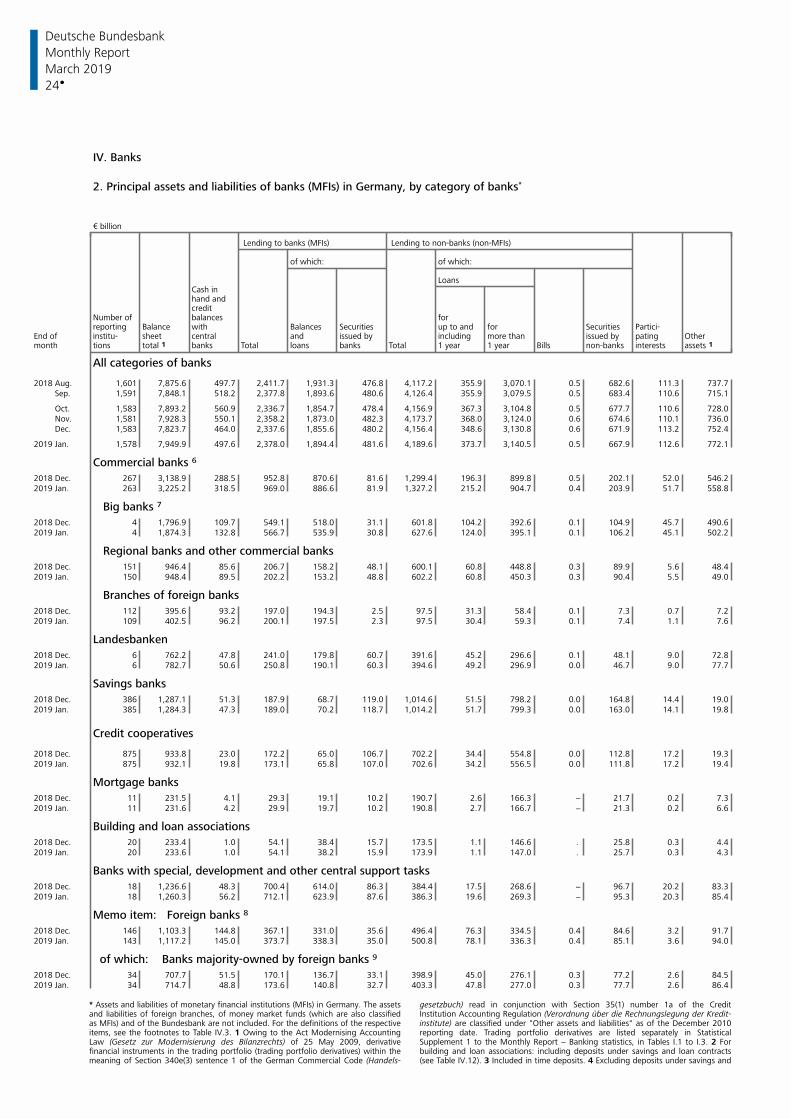
Deutsche Bundesbank
24
Monthly Report
March 2019
IV. Banks
2. Principal assets and liabilities of banks (MFIs) in Germany, by category of banks*
€ billion
Lending to banks (MFIs) Lending to non-banks (non-MFIs) of which: of which:
Loans Cash in hand and creditNumber of balances forreporting Balance with Balances up to and for Partici-Securities Securities
End of institu- sheet central and issued by including more than issued by pating Othermonth tions total 1 banks Total loans banks Total 1 year 1 year Bills non-banks interests assets 1
All categories of banks
2018 Aug. 1,601 7,875.6 497.7 2,411.7 1,931.3 476.8 4,117.2 355.9 3,070.1 0.5 682.6 111.3 737.7 Sep. 1,591 7,848.1 518.2 2,377.8 1,893.6 480.6 4,126.4 355.9 3,079.5 0.5 683.4 110.6 715.1
Oct. 1,583 7,893.2 560.9 2,336.7 1,854.7 478.4 4,156.9 367.3 3,104.8 0.5 677.7 110.6 728.0 Nov. 1,581 7,928.3 550.1 2,358.2 1,873.0 482.3 4,173.7 368.0 3,124.0 0.6 674.6 110.1 736.0 Dec. 1,583 7,823.7 464.0 2,337.6 1,855.6 480.2 4,156.4 348.6 3,130.8 0.6 671.9 113.2 752.4
2019 Jan. 1,578 7,949.9 497.6 2,378.0 1,894.4 481.6 4,189.6 373.7 3,140.5 0.5 667.9 112.6 772.1
Commercial banks 6
2018 Dec. 267 3,138.9 288.5 952.8 870.6 81.6 1,299.4 196.3 899.8 0.5 202.1 52.0 546.22019 Jan. 263 3,225.2 318.5 969.0 886.6 81.9 1,327.2 215.2 904.7 0.4 203.9 51.7 558.8
Big banks 7
2018 Dec. 4 1,796.9 109.7 549.1 518.0 31.1 601.8 104.2 392.6 0.1 104.9 45.7 490.62019 Jan. 4 1,874.3 132.8 566.7 535.9 30.8 627.6 124.0 395.1 0.1 106.2 45.1 502.2
Regional banks and other commercial banks
2018 Dec. 151 946.4 85.6 206.7 158.2 48.1 600.1 60.8 448.8 0.3 89.9 5.6 48.42019 Jan. 150 948.4 89.5 202.2 153.2 48.8 602.2 60.8 450.3 0.3 90.4 5.5 49.0
Branches of foreign banks
2018 Dec. 112 395.6 93.2 197.0 194.3 2.5 97.5 31.3 58.4 0.1 7.3 0.7 7.22019 Jan. 109 402.5 96.2 200.1 197.5 2.3 97.5 30.4 59.3 0.1 7.4 1.1 7.6
Landesbanken
2018 Dec. 6 762.2 47.8 241.0 179.8 60.7 391.6 45.2 296.6 0.1 48.1 9.0 72.82019 Jan. 6 782.7 50.6 250.8 190.1 60.3 394.6 49.2 296.9 0.0 46.7 9.0 77.7
Savings banks
2018 Dec. 386 1,287.1 51.3 187.9 68.7 119.0 1,014.6 51.5 798.2 0.0 164.8 14.4 19.02019 Jan. 385 1,284.3 47.3 189.0 70.2 118.7 1,014.2 51.7 799.3 0.0 163.0 14.1 19.8
Credit cooperatives
2018 Dec. 875 933.8 23.0 172.2 65.0 106.7 702.2 34.4 554.8 0.0 112.8 17.2 19.32019 Jan. 875 932.1 19.8 173.1 65.8 107.0 702.6 34.2 556.5 0.0 111.8 17.2 19.4
Mortgage banks
2018 Dec. 11 231.5 4.1 29.3 19.1 10.2 190.7 2.6 166.3 − 21.7 0.2 7.32019 Jan. 11 231.6 4.2 29.9 19.7 10.2 190.8 2.7 166.7 − 21.3 0.2 6.6
Building and loan associations
2018 Dec. 20 233.4 1.0 54.1 38.4 15.7 173.5 1.1 146.6 . 25.8 0.3 4.42019 Jan. 20 233.6 1.0 54.1 38.2 15.9 173.9 1.1 147.0 . 25.7 0.3 4.3
Banks with special, development and other central support tasks
2018 Dec. 18 1,236.6 48.3 700.4 614.0 86.3 384.4 17.5 268.6 − 96.7 20.2 83.32019 Jan. 18 1,260.3 56.2 712.1 623.9 87.6 386.3 19.6 269.3 − 95.3 20.3 85.4
Memo item: Foreign banks 8
2018 Dec. 146 1,103.3 144.8 367.1 331.0 35.6 496.4 76.3 334.5 0.4 84.6 3.2 91.72019 Jan. 143 1,117.2 145.0 373.7 338.3 35.0 500.8 78.1 336.3 0.4 85.1 3.6 94.0
of which: Banks majority-owned by foreign banks 9
2018 Dec. 34 707.7 51.5 170.1 136.7 33.1 398.9 45.0 276.1 0.3 77.2 2.6 84.52019 Jan. 34 714.7 48.8 173.6 140.8 32.7 403.3 47.8 277.0 0.3 77.7 2.6 86.4
* Assets and liabilities of monetary financial institutions (MFIs) in Germany. The assets gesetzbuch) read in conjunction with Section 35(1) number 1a of the Creditand liabilities of foreign branches, of money market funds (which are also classified Institution Accounting Regulation (Verordnung über die Rechnungslegung der Kredit-as MFIs) and of the Bundesbank are not included. For the definitions of the respective institute) are classified under "Other assets and liabilities" as of the December 2010items, see the footnotes to Table IV.3. 1 Owing to the Act Modernising Accounting reporting date. Trading portfolio derivatives are listed separately in StatisticalLaw (Gesetz zur Modernisierung des Bilanzrechts) of 25 May 2009, derivative Supplement 1 to the Monthly Report − Banking statistics, in Tables I.1 to I.3. 2 Forfinancial instruments in the trading portfolio (trading portfolio derivatives) within the building and loan associations: including deposits under savings and loan contractsmeaning of Section 340e(3) sentence 1 of the German Commercial Code (Handels- (see Table IV.12). 3 Included in time deposits. 4 Excluding deposits under savings and
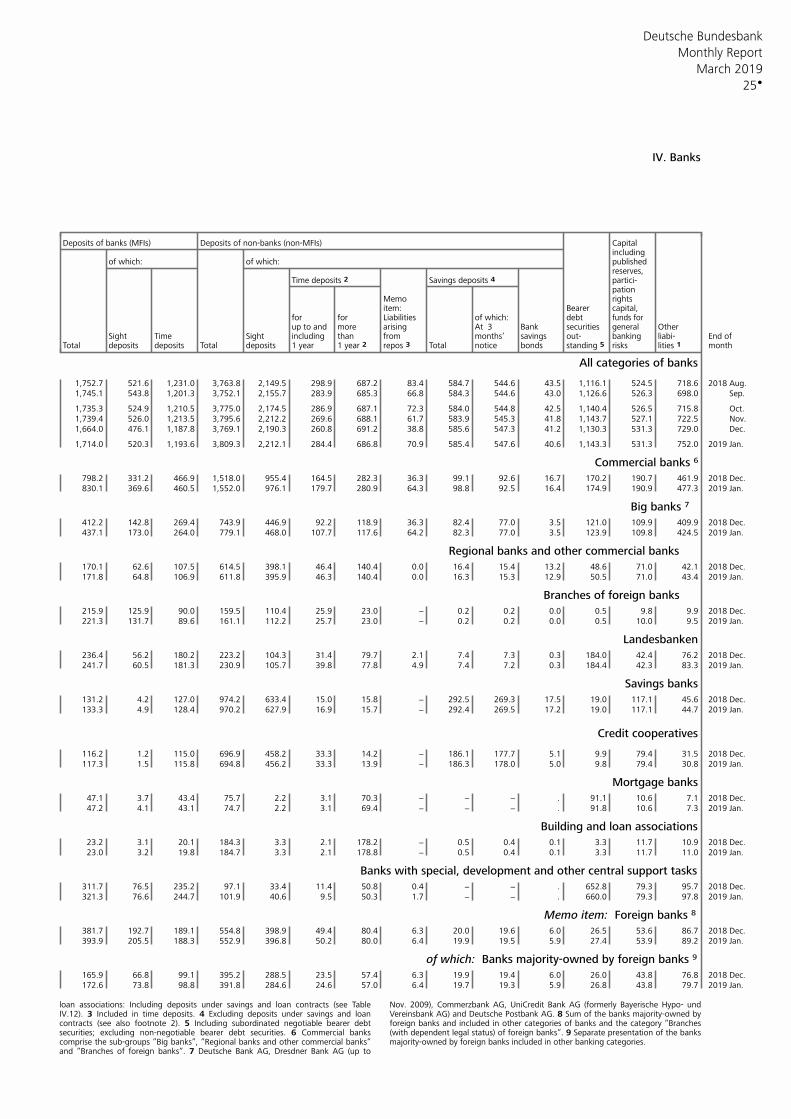
Deutsche Bundesbank
25
Monthly Report
March 2019
IV. Banks
Deposits of banks (MFIs) Deposits of non-banks (non-MFIs) Capital including
of which: of which: publishedreserves,
Time deposits 2 Savings deposits 4 partici-pation
Memo rightsitem: Bearer capital,
for for of which: debtLiabilities funds forup to and more arising At 3 Bank general Othersecurities
Sight Time Sight including than from savings out- banking liabi- End ofmonths’Total deposits deposits Total deposits 1 year 1 year 2 repos 3 Total notice bonds risks lities 1 monthstanding 5
All categories of banks
1,752.7 521.6 1,231.0 3,763.8 2,149.5 298.9 687.2 83.4 584.7 544.6 43.5 1,116.1 524.5 718.6 2018 Aug.1,745.1 543.8 1,201.3 3,752.1 2,155.7 283.9 685.3 66.8 584.3 544.6 43.0 1,126.6 526.3 698.0 Sep.
1,735.3 524.9 1,210.5 3,775.0 2,174.5 286.9 687.1 72.3 584.0 544.8 42.5 1,140.4 526.5 715.8 Oct.1,739.4 526.0 1,213.5 3,795.6 2,212.2 269.6 688.1 61.7 583.9 545.3 41.8 1,143.7 527.1 722.5 Nov.1,664.0 476.1 1,187.8 3,769.1 2,190.3 260.8 691.2 38.8 585.6 547.3 41.2 1,130.3 531.3 729.0 Dec.
1,714.0 520.3 1,193.6 3,809.3 2,212.1 284.4 686.8 70.9 585.4 547.6 40.6 1,143.3 531.3 752.0 2019 Jan.
Commercial banks 6
798.2 331.2 466.9 1,518.0 955.4 164.5 282.3 36.3 99.1 92.6 16.7 170.2 190.7 461.9 2018 Dec.830.1 369.6 460.5 1,552.0 976.1 179.7 280.9 64.3 98.8 92.5 16.4 174.9 190.9 477.3 2019 Jan.
Big banks 7
412.2 142.8 269.4 743.9 446.9 92.2 118.9 36.3 82.4 77.0 3.5 121.0 109.9 409.9 2018 Dec.437.1 173.0 264.0 779.1 468.0 107.7 117.6 64.2 82.3 77.0 3.5 123.9 109.8 424.5 2019 Jan.
Regional banks and other commercial banks
170.1 62.6 107.5 614.5 398.1 46.4 140.4 0.0 16.4 15.4 13.2 48.6 71.0 42.1 2018 Dec.171.8 64.8 106.9 611.8 395.9 46.3 140.4 0.0 16.3 15.3 12.9 50.5 71.0 43.4 2019 Jan.
Branches of foreign banks
215.9 125.9 90.0 159.5 110.4 25.9 23.0 − 0.2 0.2 0.0 0.5 9.8 9.9 2018 Dec.221.3 131.7 89.6 161.1 112.2 25.7 23.0 − 0.2 0.2 0.0 0.5 10.0 9.5 2019 Jan.
Landesbanken
236.4 56.2 180.2 223.2 104.3 31.4 79.7 2.1 7.4 7.3 0.3 184.0 42.4 76.2 2018 Dec.241.7 60.5 181.3 230.9 105.7 39.8 77.8 4.9 7.4 7.2 0.3 184.4 42.3 83.3 2019 Jan.
Savings banks
131.2 4.2 127.0 974.2 633.4 15.0 15.8 − 292.5 269.3 17.5 19.0 117.1 45.6 2018 Dec.133.3 4.9 128.4 970.2 627.9 16.9 15.7 − 292.4 269.5 17.2 19.0 117.1 44.7 2019 Jan.
Credit cooperatives
116.2 1.2 115.0 696.9 458.2 33.3 14.2 − 186.1 177.7 5.1 9.9 79.4 31.5 2018 Dec.117.3 1.5 115.8 694.8 456.2 33.3 13.9 − 186.3 178.0 5.0 9.8 79.4 30.8 2019 Jan.
Mortgage banks
47.1 3.7 43.4 75.7 2.2 3.1 70.3 − − − . 91.1 10.6 7.1 2018 Dec.47.2 4.1 43.1 74.7 2.2 3.1 69.4 − − − . 91.8 10.6 7.3 2019 Jan.
Building and loan associations
23.2 3.1 20.1 184.3 3.3 2.1 178.2 − 0.5 0.4 0.1 3.3 11.7 10.9 2018 Dec.23.0 3.2 19.8 184.7 3.3 2.1 178.8 − 0.5 0.4 0.1 3.3 11.7 11.0 2019 Jan.
Banks with special, development and other central support tasks
311.7 76.5 235.2 97.1 33.4 11.4 50.8 0.4 − − . 652.8 79.3 95.7 2018 Dec.321.3 76.6 244.7 101.9 40.6 9.5 50.3 1.7 − − . 660.0 79.3 97.8 2019 Jan.
Memo item: Foreign banks 8
381.7 192.7 189.1 554.8 398.9 49.4 80.4 6.3 20.0 19.6 6.0 26.5 53.6 86.7 2018 Dec.393.9 205.5 188.3 552.9 396.8 50.2 80.0 6.4 19.9 19.5 5.9 27.4 53.9 89.2 2019 Jan.
of which: Banks majority-owned by foreign banks 9
165.9 66.8 99.1 395.2 288.5 23.5 57.4 6.3 19.9 19.4 6.0 26.0 43.8 76.8 2018 Dec.172.6 73.8 98.8 391.8 284.6 24.6 57.0 6.4 19.7 19.3 5.9 26.8 43.8 79.7 2019 Jan.
loan associations: Including deposits under savings and loan contracts (see Table Nov. 2009), Commerzbank AG, UniCredit Bank AG (formerly Bayerische Hypo- undIV.12). 3 Included in time deposits. 4 Excluding deposits under savings and loan Vereinsbank AG) and Deutsche Postbank AG. 8 Sum of the banks majority-owned bycontracts (see also footnote 2). 5 Including subordinated negotiable bearer debt foreign banks and included in other categories of banks and the category ”Branchessecurities; excluding non-negotiable bearer debt securities. 6 Commercial banks (with dependent legal status) of foreign banks”. 9 Separate presentation of the bankscomprise the sub-groups ”Big banks”, ”Regional banks and other commercial banks” majority-owned by foreign banks included in other banking categories. and ”Branches of foreign banks”. 7 Deutsche Bank AG, Dresdner Bank AG (up to
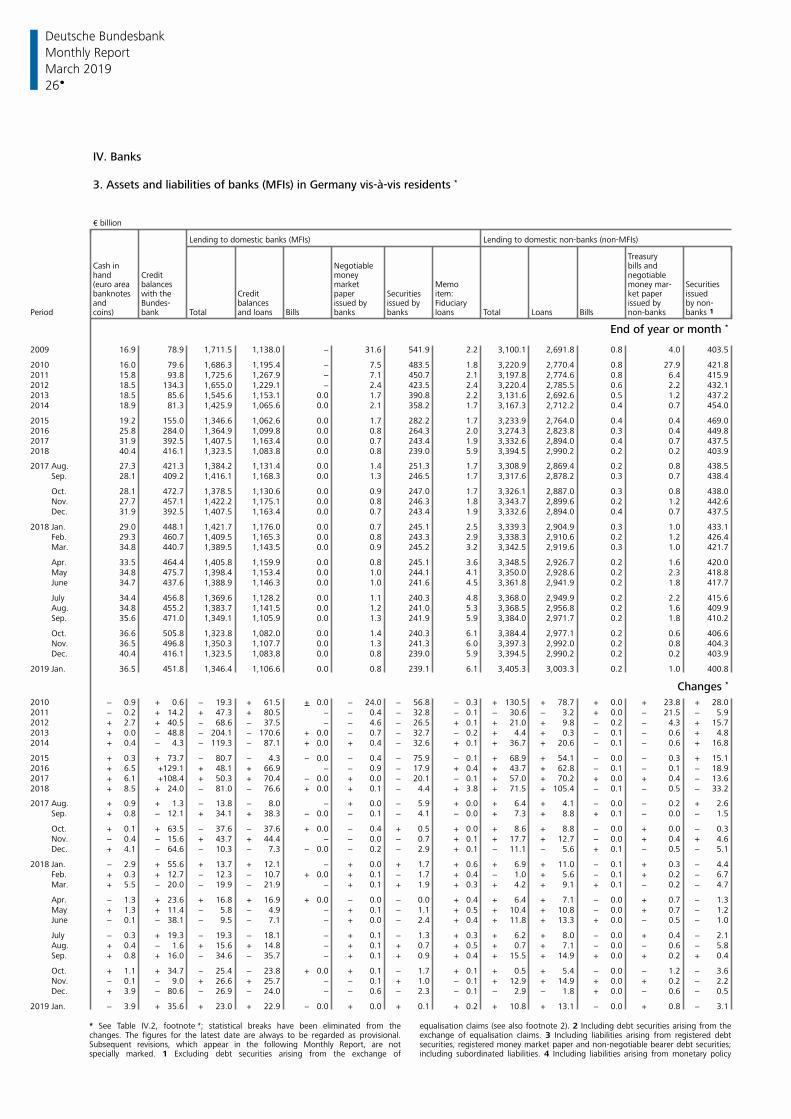
Deutsche Bundesbank
26
Monthly Report
March 2019
IV. Banks
3. Assets and liabilities of banks (MFIs) in Germany vis-à-vis residents *
€ billion
Lending to domestic banks (MFIs) Lending to domestic non-banks (non-MFIs)
TreasuryCash in Negotiable bills andhand Credit money negotiable
balances market Memo money mar-(euro area Securitiesbanknotes with the Credit paper item: ket paper issuedSecuritiesand Bundes- balances issued by issued by Fiduciary issued by by non-
Period coins) bank Total and loans Bills banks banks loans Total Loans Bills non-banks banks 1
End of year or month *
2009 16.9 78.9 1,711.5 1,138.0 − 31.6 541.9 2.2 3,100.1 2,691.8 0.8 4.0 403.5
2010 16.0 79.6 1,686.3 1,195.4 − 7.5 483.5 1.8 3,220.9 2,770.4 0.8 27.9 421.82011 15.8 93.8 1,725.6 1,267.9 − 7.1 450.7 2.1 3,197.8 2,774.6 0.8 6.4 415.92012 18.5 134.3 1,655.0 1,229.1 − 2.4 423.5 2.4 3,220.4 2,785.5 0.6 2.2 432.12013 18.5 85.6 1,545.6 1,153.1 0.0 1.7 390.8 2.2 3,131.6 2,692.6 0.5 1.2 437.22014 18.9 81.3 1,425.9 1,065.6 0.0 2.1 358.2 1.7 3,167.3 2,712.2 0.4 0.7 454.0
2015 19.2 155.0 1,346.6 1,062.6 0.0 1.7 282.2 1.7 3,233.9 2,764.0 0.4 0.4 469.02016 25.8 284.0 1,364.9 1,099.8 0.0 0.8 264.3 2.0 3,274.3 2,823.8 0.3 0.4 449.82017 31.9 392.5 1,407.5 1,163.4 0.0 0.7 243.4 1.9 3,332.6 2,894.0 0.4 0.7 437.52018 40.4 416.1 1,323.5 1,083.8 0.0 0.8 239.0 5.9 3,394.5 2,990.2 0.2 0.2 403.9
2017 Aug. 27.3 421.3 1,384.2 1,131.4 0.0 1.4 251.3 1.7 3,308.9 2,869.4 0.2 0.8 438.5 Sep. 28.1 409.2 1,416.1 1,168.3 0.0 1.3 246.5 1.7 3,317.6 2,878.2 0.3 0.7 438.4
Oct. 28.1 472.7 1,378.5 1,130.6 0.0 0.9 247.0 1.7 3,326.1 2,887.0 0.3 0.8 438.0 Nov. 27.7 457.1 1,422.2 1,175.1 0.0 0.8 246.3 1.8 3,343.7 2,899.6 0.2 1.2 442.6 Dec. 31.9 392.5 1,407.5 1,163.4 0.0 0.7 243.4 1.9 3,332.6 2,894.0 0.4 0.7 437.5
2018 Jan. 29.0 448.1 1,421.7 1,176.0 0.0 0.7 245.1 2.5 3,339.3 2,904.9 0.3 1.0 433.1 Feb. 29.3 460.7 1,409.5 1,165.3 0.0 0.8 243.3 2.9 3,338.3 2,910.6 0.2 1.2 426.4 Mar. 34.8 440.7 1,389.5 1,143.5 0.0 0.9 245.2 3.2 3,342.5 2,919.6 0.3 1.0 421.7
Apr. 33.5 464.4 1,405.8 1,159.9 0.0 0.8 245.1 3.6 3,348.5 2,926.7 0.2 1.6 420.0 May 34.8 475.7 1,398.4 1,153.4 0.0 1.0 244.1 4.1 3,350.0 2,928.6 0.2 2.3 418.8 June 34.7 437.6 1,388.9 1,146.3 0.0 1.0 241.6 4.5 3,361.8 2,941.9 0.2 1.8 417.7
July 34.4 456.8 1,369.6 1,128.2 0.0 1.1 240.3 4.8 3,368.0 2,949.9 0.2 2.2 415.6 Aug. 34.8 455.2 1,383.7 1,141.5 0.0 1.2 241.0 5.3 3,368.5 2,956.8 0.2 1.6 409.9 Sep. 35.6 471.0 1,349.1 1,105.9 0.0 1.3 241.9 5.9 3,384.0 2,971.7 0.2 1.8 410.2
Oct. 36.6 505.8 1,323.8 1,082.0 0.0 1.4 240.3 6.1 3,384.4 2,977.1 0.2 0.6 406.6 Nov. 36.5 496.8 1,350.3 1,107.7 0.0 1.3 241.3 6.0 3,397.3 2,992.0 0.2 0.8 404.3 Dec. 40.4 416.1 1,323.5 1,083.8 0.0 0.8 239.0 5.9 3,394.5 2,990.2 0.2 0.2 403.9
2019 Jan. 36.5 451.8 1,346.4 1,106.6 0.0 0.8 239.1 6.1 3,405.3 3,003.3 0.2 1.0 400.8
Changes *
2010 − 0.9 + 0.6 − 19.3 + 61.5 + 0.0 − 24.0 − 56.8 − 0.3 + 130.5 + 78.7 + 0.0 + 23.8 + 28.02011 − 0.2 + 14.2 + 47.3 + 80.5 − − 0.4 − 32.8 − 0.1 − 30.6 − 3.2 + 0.0 − 21.5 − 5.92012 + 2.7 + 40.5 − 68.6 − 37.5 − − 4.6 − 26.5 + 0.1 + 21.0 + 9.8 − 0.2 − 4.3 + 15.72013 + 0.0 − 48.8 − 204.1 − 170.6 + 0.0 − 0.7 − 32.7 − 0.2 + 4.4 + 0.3 − 0.1 − 0.6 + 4.82014 + 0.4 − 4.3 − 119.3 − 87.1 + 0.0 + 0.4 − 32.6 + 0.1 + 36.7 + 20.6 − 0.1 − 0.6 + 16.8
2015 + 0.3 + 73.7 − 80.7 − 4.3 − 0.0 − 0.4 − 75.9 − 0.1 + 68.9 + 54.1 − 0.0 − 0.3 + 15.12016 + 6.5 +129.1 + 48.1 + 66.9 − − 0.9 − 17.9 + 0.4 + 43.7 + 62.8 − 0.1 − 0.1 − 18.92017 + 6.1 +108.4 + 50.3 + 70.4 − 0.0 + 0.0 − 20.1 − 0.1 + 57.0 + 70.2 + 0.0 + 0.4 − 13.62018 + 8.5 + 24.0 − 81.0 − 76.6 + 0.0 + 0.1 − 4.4 + 3.8 + 71.5 + 105.4 − 0.1 − 0.5 − 33.2
2017 Aug. + 0.9 + 1.3 − 13.8 − 8.0 − + 0.0 − 5.9 + 0.0 + 6.4 + 4.1 − 0.0 − 0.2 + 2.6 Sep. + 0.8 − 12.1 + 34.1 + 38.3 − 0.0 − 0.1 − 4.1 − 0.0 + 7.3 + 8.8 + 0.1 − 0.0 − 1.5
Oct. + 0.1 + 63.5 − 37.6 − 37.6 + 0.0 − 0.4 + 0.5 + 0.0 + 8.6 + 8.8 − 0.0 + 0.0 − 0.3 Nov. − 0.4 − 15.6 + 43.7 + 44.4 − − 0.0 − 0.7 + 0.1 + 17.7 + 12.7 − 0.0 + 0.4 + 4.6 Dec. + 4.1 − 64.6 − 10.3 − 7.3 − 0.0 − 0.2 − 2.9 + 0.1 − 11.1 − 5.6 + 0.1 − 0.5 − 5.1
2018 Jan. − 2.9 + 55.6 + 13.7 + 12.1 − + 0.0 + 1.7 + 0.6 + 6.9 + 11.0 − 0.1 + 0.3 − 4.4 Feb. + 0.3 + 12.7 − 12.3 − 10.7 + 0.0 + 0.1 − 1.7 + 0.4 − 1.0 + 5.6 − 0.1 + 0.2 − 6.7 Mar. + 5.5 − 20.0 − 19.9 − 21.9 − + 0.1 + 1.9 + 0.3 + 4.2 + 9.1 + 0.1 − 0.2 − 4.7
Apr. − 1.3 + 23.6 + 16.8 + 16.9 + 0.0 − 0.0 − 0.0 + 0.4 + 6.4 + 7.1 − 0.0 + 0.7 − 1.3 May + 1.3 + 11.4 − 5.8 − 4.9 − + 0.1 − 1.1 + 0.5 + 10.4 + 10.8 − 0.0 + 0.7 − 1.2 June − 0.1 − 38.1 − 9.5 − 7.1 − + 0.0 − 2.4 + 0.4 + 11.8 + 13.3 + 0.0 − 0.5 − 1.0
July − 0.3 + 19.3 − 19.3 − 18.1 − + 0.1 − 1.3 + 0.3 + 6.2 + 8.0 − 0.0 + 0.4 − 2.1 Aug. + 0.4 − 1.6 + 15.6 + 14.8 − + 0.1 + 0.7 + 0.5 + 0.7 + 7.1 − 0.0 − 0.6 − 5.8 Sep. + 0.8 + 16.0 − 34.6 − 35.7 − + 0.1 + 0.9 + 0.4 + 15.5 + 14.9 + 0.0 + 0.2 + 0.4
Oct. + 1.1 + 34.7 − 25.4 − 23.8 + 0.0 + 0.1 − 1.7 + 0.1 + 0.5 + 5.4 − 0.0 − 1.2 − 3.6 Nov. − 0.1 − 9.0 + 26.6 + 25.7 − − 0.1 + 1.0 − 0.1 + 12.9 + 14.9 + 0.0 + 0.2 − 2.2 Dec. + 3.9 − 80.6 − 26.9 − 24.0 − − 0.6 − 2.3 − 0.1 − 2.9 − 1.8 + 0.0 − 0.6 − 0.5
2019 Jan. − 3.9 + 35.6 + 23.0 + 22.9 − 0.0 + 0.0 + 0.1 + 0.2 + 10.8 + 13.1 − 0.0 + 0.8 − 3.1
* See Table IV.2, footnote *; statistical breaks have been eliminated from the equalisation claims (see also footnote 2). 2 Including debt securities arising from thechanges. The figures for the latest date are always to be regarded as provisional. exchange of equalisation claims. 3 Including liabilities arising from registered debtSubsequent revisions, which appear in the following Monthly Report, are not securities, registered money market paper and non-negotiable bearer debt securities;specially marked. 1 Excluding debt securities arising from the exchange of including subordinated liabilities. 4 Including liabilities arising from monetary policy
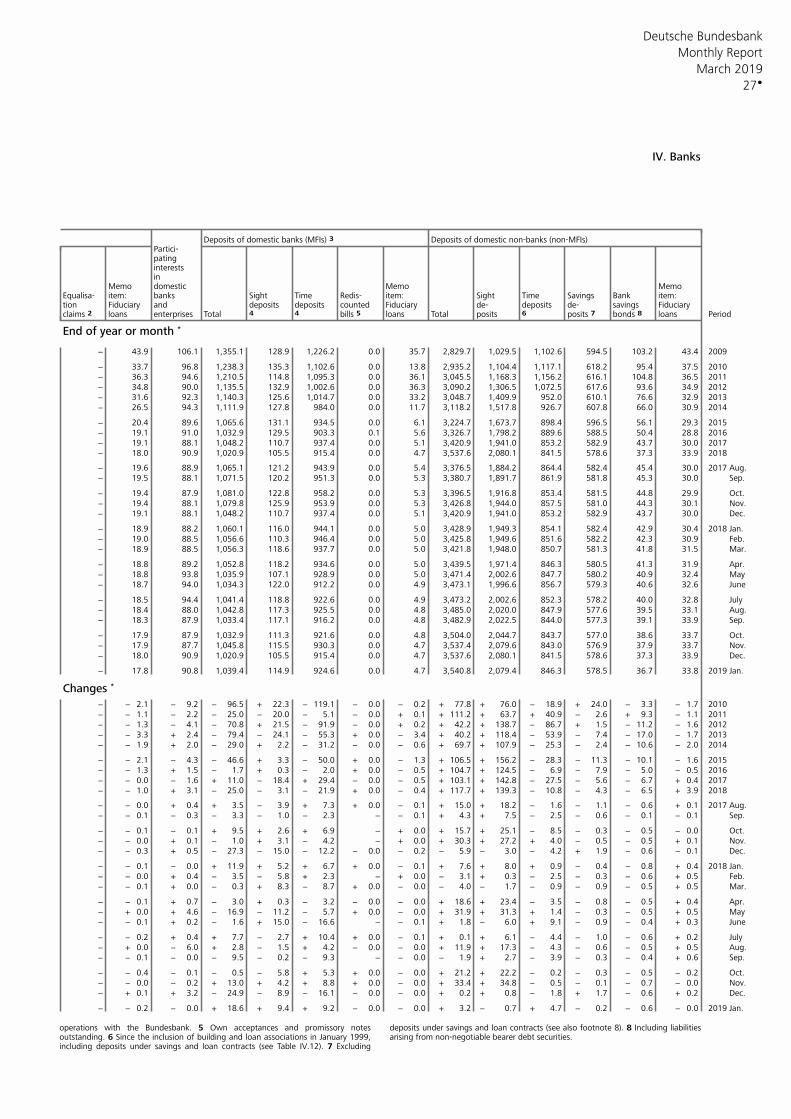
Deutsche Bundesbank
27
Monthly Report
March 2019
IV. Banks
Deposits of domestic banks (MFIs) 3 Deposits of domestic non-banks (non-MFIs)Partici-patinginterestsin
Memo domestic Memo MemoEqualisa- item: banks Sight Time Redis- item: Sight Time Savings Bank item:tion Fiduciary and deposits deposits counted Fiduciary de- deposits de- savings Fiduciaryclaims 2 loans Total 4 4 bills 5 loans Total posits 6 posits 7 bonds 8 loans Periodenterprises
End of year or month *
− 43.9 106.1 1,355.1 128.9 1,226.2 0.0 35.7 2,829.7 1,029.5 1,102.6 594.5 103.2 43.4 2009
− 33.7 96.8 1,238.3 135.3 1,102.6 0.0 13.8 2,935.2 1,104.4 1,117.1 618.2 95.4 37.5 2010− 36.3 94.6 1,210.5 114.8 1,095.3 0.0 36.1 3,045.5 1,168.3 1,156.2 616.1 104.8 36.5 2011− 34.8 90.0 1,135.5 132.9 1,002.6 0.0 36.3 3,090.2 1,306.5 1,072.5 617.6 93.6 34.9 2012− 31.6 92.3 1,140.3 125.6 1,014.7 0.0 33.2 3,048.7 1,409.9 952.0 610.1 76.6 32.9 2013− 26.5 94.3 1,111.9 127.8 984.0 0.0 11.7 3,118.2 1,517.8 926.7 607.8 66.0 30.9 2014
− 20.4 89.6 1,065.6 131.1 934.5 0.0 6.1 3,224.7 1,673.7 898.4 596.5 56.1 29.3 2015− 19.1 91.0 1,032.9 129.5 903.3 0.1 5.6 3,326.7 1,798.2 889.6 588.5 50.4 28.8 2016− 19.1 88.1 1,048.2 110.7 937.4 0.0 5.1 3,420.9 1,941.0 853.2 582.9 43.7 30.0 2017− 18.0 90.9 1,020.9 105.5 915.4 0.0 4.7 3,537.6 2,080.1 841.5 578.6 37.3 33.9 2018
− 19.6 88.9 1,065.1 121.2 943.9 0.0 5.4 3,376.5 1,884.2 864.4 582.4 45.4 30.0 2017 Aug.− 19.5 88.1 1,071.5 120.2 951.3 0.0 5.3 3,380.7 1,891.7 861.9 581.8 45.3 30.0 Sep.
− 19.4 87.9 1,081.0 122.8 958.2 0.0 5.3 3,396.5 1,916.8 853.4 581.5 44.8 29.9 Oct.− 19.4 88.1 1,079.8 125.9 953.9 0.0 5.3 3,426.8 1,944.0 857.5 581.0 44.3 30.1 Nov.− 19.1 88.1 1,048.2 110.7 937.4 0.0 5.1 3,420.9 1,941.0 853.2 582.9 43.7 30.0 Dec.
− 18.9 88.2 1,060.1 116.0 944.1 0.0 5.0 3,428.9 1,949.3 854.1 582.4 42.9 30.4 2018 Jan.− 19.0 88.5 1,056.6 110.3 946.4 0.0 5.0 3,425.8 1,949.6 851.6 582.2 42.3 30.9 Feb.− 18.9 88.5 1,056.3 118.6 937.7 0.0 5.0 3,421.8 1,948.0 850.7 581.3 41.8 31.5 Mar.
− 18.8 89.2 1,052.8 118.2 934.6 0.0 5.0 3,439.5 1,971.4 846.3 580.5 41.3 31.9 Apr.− 18.8 93.8 1,035.9 107.1 928.9 0.0 5.0 3,471.4 2,002.6 847.7 580.2 40.9 32.4 May− 18.7 94.0 1,034.3 122.0 912.2 0.0 4.9 3,473.1 1,996.6 856.7 579.3 40.6 32.6 June
− 18.5 94.4 1,041.4 118.8 922.6 0.0 4.9 3,473.2 2,002.6 852.3 578.2 40.0 32.8 July− 18.4 88.0 1,042.8 117.3 925.5 0.0 4.8 3,485.0 2,020.0 847.9 577.6 39.5 33.1 Aug.− 18.3 87.9 1,033.4 117.1 916.2 0.0 4.8 3,482.9 2,022.5 844.0 577.3 39.1 33.9 Sep.
− 17.9 87.9 1,032.9 111.3 921.6 0.0 4.8 3,504.0 2,044.7 843.7 577.0 38.6 33.7 Oct.− 17.9 87.7 1,045.8 115.5 930.3 0.0 4.7 3,537.4 2,079.6 843.0 576.9 37.9 33.7 Nov.− 18.0 90.9 1,020.9 105.5 915.4 0.0 4.7 3,537.6 2,080.1 841.5 578.6 37.3 33.9 Dec.
− 17.8 90.8 1,039.4 114.9 924.6 0.0 4.7 3,540.8 2,079.4 846.3 578.5 36.7 33.8 2019 Jan.
Changes *
− − 2.1 − 9.2 − 96.5 + 22.3 − 119.1 − 0.0 − 0.2 + 77.8 + 76.0 − 18.9 + 24.0 − 3.3 − 1.7 2010− − 1.1 − 2.2 − 25.0 − 20.0 − 5.1 − 0.0 + 0.1 + 111.2 + 63.7 + 40.9 − 2.6 + 9.3 − 1.1 2011− − 1.3 − 4.1 − 70.8 + 21.5 − 91.9 − 0.0 + 0.2 + 42.2 + 138.7 − 86.7 + 1.5 − 11.2 − 1.6 2012− − 3.3 + 2.4 − 79.4 − 24.1 − 55.3 + 0.0 − 3.4 + 40.2 + 118.4 − 53.9 − 7.4 − 17.0 − 1.7 2013− − 1.9 + 2.0 − 29.0 + 2.2 − 31.2 − 0.0 − 0.6 + 69.7 + 107.9 − 25.3 − 2.4 − 10.6 − 2.0 2014
− − 2.1 − 4.3 − 46.6 + 3.3 − 50.0 + 0.0 − 1.3 + 106.5 + 156.2 − 28.3 − 11.3 − 10.1 − 1.6 2015− − 1.3 + 1.5 − 1.7 + 0.3 − 2.0 + 0.0 − 0.5 + 104.7 + 124.5 − 6.9 − 7.9 − 5.0 − 0.5 2016− − 0.0 − 1.6 + 11.0 − 18.4 + 29.4 − 0.0 − 0.5 + 103.1 + 142.8 − 27.5 − 5.6 − 6.7 + 0.4 2017− − 1.0 + 3.1 − 25.0 − 3.1 − 21.9 + 0.0 − 0.4 + 117.7 + 139.3 − 10.8 − 4.3 − 6.5 + 3.9 2018
− − 0.0 + 0.4 + 3.5 − 3.9 + 7.3 + 0.0 − 0.1 + 15.0 + 18.2 − 1.6 − 1.1 − 0.6 + 0.1 2017 Aug.− − 0.1 − 0.3 − 3.3 − 1.0 − 2.3 − − 0.1 + 4.3 + 7.5 − 2.5 − 0.6 − 0.1 − 0.1 Sep.
− − 0.1 − 0.1 + 9.5 + 2.6 + 6.9 − + 0.0 + 15.7 + 25.1 − 8.5 − 0.3 − 0.5 − 0.0 Oct.− − 0.0 + 0.1 − 1.0 + 3.1 − 4.2 − + 0.0 + 30.3 + 27.2 + 4.0 − 0.5 − 0.5 + 0.1 Nov.− − 0.3 + 0.5 − 27.3 − 15.0 − 12.2 − 0.0 − 0.2 − 5.9 − 3.0 − 4.2 + 1.9 − 0.6 − 0.1 Dec.
− − 0.1 − 0.0 + 11.9 + 5.2 + 6.7 + 0.0 − 0.1 + 7.6 + 8.0 + 0.9 − 0.4 − 0.8 + 0.4 2018 Jan.− − 0.0 + 0.4 − 3.5 − 5.8 + 2.3 − + 0.0 − 3.1 + 0.3 − 2.5 − 0.3 − 0.6 + 0.5 Feb.− − 0.1 + 0.0 − 0.3 + 8.3 − 8.7 + 0.0 − 0.0 − 4.0 − 1.7 − 0.9 − 0.9 − 0.5 + 0.5 Mar.
− − 0.1 + 0.7 − 3.0 + 0.3 − 3.2 − 0.0 − 0.0 + 18.6 + 23.4 − 3.5 − 0.8 − 0.5 + 0.4 Apr.− + 0.0 + 4.6 − 16.9 − 11.2 − 5.7 + 0.0 − 0.0 + 31.9 + 31.3 + 1.4 − 0.3 − 0.5 + 0.5 May− − 0.1 + 0.2 − 1.6 + 15.0 − 16.6 − − 0.1 + 1.8 − 6.0 + 9.1 − 0.9 − 0.4 + 0.3 June
− − 0.2 + 0.4 + 7.7 − 2.7 + 10.4 + 0.0 − 0.1 + 0.1 + 6.1 − 4.4 − 1.0 − 0.6 + 0.2 July− + 0.0 − 6.0 + 2.8 − 1.5 + 4.2 − 0.0 − 0.0 + 11.9 + 17.3 − 4.3 − 0.6 − 0.5 + 0.5 Aug.− − 0.1 − 0.0 − 9.5 − 0.2 − 9.3 − − 0.0 − 1.9 + 2.7 − 3.9 − 0.3 − 0.4 + 0.6 Sep.
− − 0.4 − 0.1 − 0.5 − 5.8 + 5.3 + 0.0 − 0.0 + 21.2 + 22.2 − 0.2 − 0.3 − 0.5 − 0.2 Oct.− − 0.0 − 0.2 + 13.0 + 4.2 + 8.8 + 0.0 − 0.0 + 33.4 + 34.8 − 0.5 − 0.1 − 0.7 − 0.0 Nov.− + 0.1 + 3.2 − 24.9 − 8.9 − 16.1 − 0.0 − 0.0 + 0.2 + 0.8 − 1.8 + 1.7 − 0.6 + 0.2 Dec.
− − 0.2 − 0.0 + 18.6 + 9.4 + 9.2 − 0.0 − 0.0 + 3.2 − 0.7 + 4.7 − 0.2 − 0.6 − 0.0 2019 Jan.
operations with the Bundesbank. 5 Own acceptances and promissory notes deposits under savings and loan contracts (see also footnote 8). 8 Including liabilitiesoutstanding. 6 Since the inclusion of building and loan associations in January 1999, arising from non-negotiable bearer debt securities. including deposits under savings and loan contracts (see Table IV.12). 7 Excluding
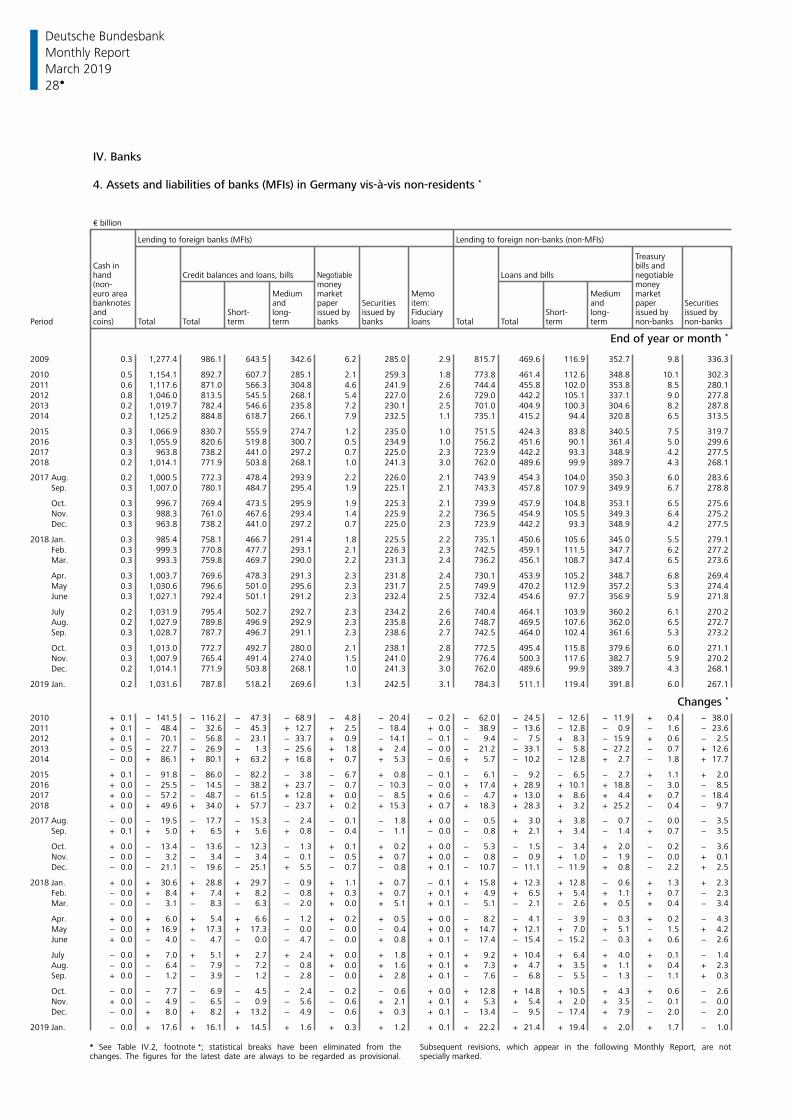
Deutsche Bundesbank
28
Monthly Report
March 2019
IV. Banks
4. Assets and liabilities of banks (MFIs) in Germany vis-à-vis non-residents *
€ billion
Lending to foreign banks (MFIs) Lending to foreign non-banks (non-MFIs)
TreasuryCash in bills andhand Loans and bills negotiableCredit balances and loans, bills Negotiable(non- money moneyeuro area Medium market Memo Medium marketbanknotes and paper Securities item: and paper Securitiesand Short- long- issued by issued by Fiduciary Short- long- issued by issued by
Period coins) Total Total term term banks banks loans Total Total term term non-banks non-banks
End of year or month *
2009 0.3 1,277.4 986.1 643.5 342.6 6.2 285.0 2.9 815.7 469.6 116.9 352.7 9.8 336.3
2010 0.5 1,154.1 892.7 607.7 285.1 2.1 259.3 1.8 773.8 461.4 112.6 348.8 10.1 302.32011 0.6 1,117.6 871.0 566.3 304.8 4.6 241.9 2.6 744.4 455.8 102.0 353.8 8.5 280.12012 0.8 1,046.0 813.5 545.5 268.1 5.4 227.0 2.6 729.0 442.2 105.1 337.1 9.0 277.82013 0.2 1,019.7 782.4 546.6 235.8 7.2 230.1 2.5 701.0 404.9 100.3 304.6 8.2 287.82014 0.2 1,125.2 884.8 618.7 266.1 7.9 232.5 1.1 735.1 415.2 94.4 320.8 6.5 313.5
2015 0.3 1,066.9 830.7 555.9 274.7 1.2 235.0 1.0 751.5 424.3 83.8 340.5 7.5 319.72016 0.3 1,055.9 820.6 519.8 300.7 0.5 234.9 1.0 756.2 451.6 90.1 361.4 5.0 299.62017 0.3 963.8 738.2 441.0 297.2 0.7 225.0 2.3 723.9 442.2 93.3 348.9 4.2 277.52018 0.2 1,014.1 771.9 503.8 268.1 1.0 241.3 3.0 762.0 489.6 99.9 389.7 4.3 268.1
2017 Aug. 0.2 1,000.5 772.3 478.4 293.9 2.2 226.0 2.1 743.9 454.3 104.0 350.3 6.0 283.6 Sep. 0.3 1,007.0 780.1 484.7 295.4 1.9 225.1 2.1 743.3 457.8 107.9 349.9 6.7 278.8
Oct. 0.3 996.7 769.4 473.5 295.9 1.9 225.3 2.1 739.9 457.9 104.8 353.1 6.5 275.6 Nov. 0.3 988.3 761.0 467.6 293.4 1.4 225.9 2.2 736.5 454.9 105.5 349.3 6.4 275.2 Dec. 0.3 963.8 738.2 441.0 297.2 0.7 225.0 2.3 723.9 442.2 93.3 348.9 4.2 277.5
2018 Jan. 0.3 985.4 758.1 466.7 291.4 1.8 225.5 2.2 735.1 450.6 105.6 345.0 5.5 279.1 Feb. 0.3 999.3 770.8 477.7 293.1 2.1 226.3 2.3 742.5 459.1 111.5 347.7 6.2 277.2 Mar. 0.3 993.3 759.8 469.7 290.0 2.2 231.3 2.4 736.2 456.1 108.7 347.4 6.5 273.6
Apr. 0.3 1,003.7 769.6 478.3 291.3 2.3 231.8 2.4 730.1 453.9 105.2 348.7 6.8 269.4 May 0.3 1,030.6 796.6 501.0 295.6 2.3 231.7 2.5 749.9 470.2 112.9 357.2 5.3 274.4 June 0.3 1,027.1 792.4 501.1 291.2 2.3 232.4 2.5 732.4 454.6 97.7 356.9 5.9 271.8
July 0.2 1,031.9 795.4 502.7 292.7 2.3 234.2 2.6 740.4 464.1 103.9 360.2 6.1 270.2 Aug. 0.2 1,027.9 789.8 496.9 292.9 2.3 235.8 2.6 748.7 469.5 107.6 362.0 6.5 272.7 Sep. 0.3 1,028.7 787.7 496.7 291.1 2.3 238.6 2.7 742.5 464.0 102.4 361.6 5.3 273.2
Oct. 0.3 1,013.0 772.7 492.7 280.0 2.1 238.1 2.8 772.5 495.4 115.8 379.6 6.0 271.1 Nov. 0.3 1,007.9 765.4 491.4 274.0 1.5 241.0 2.9 776.4 500.3 117.6 382.7 5.9 270.2 Dec. 0.2 1,014.1 771.9 503.8 268.1 1.0 241.3 3.0 762.0 489.6 99.9 389.7 4.3 268.1
2019 Jan. 0.2 1,031.6 787.8 518.2 269.6 1.3 242.5 3.1 784.3 511.1 119.4 391.8 6.0 267.1
Changes *
2010 + 0.1 − 141.5 − 116.2 − 47.3 − 68.9 − 4.8 − 20.4 − 0.2 − 62.0 − 24.5 − 12.6 − 11.9 + 0.4 − 38.02011 + 0.1 − 48.4 − 32.6 − 45.3 + 12.7 + 2.5 − 18.4 + 0.0 − 38.9 − 13.6 − 12.8 − 0.9 − 1.6 − 23.62012 + 0.1 − 70.1 − 56.8 − 23.1 − 33.7 + 0.9 − 14.1 − 0.1 − 9.4 − 7.5 + 8.3 − 15.9 + 0.6 − 2.52013 − 0.5 − 22.7 − 26.9 − 1.3 − 25.6 + 1.8 + 2.4 − 0.0 − 21.2 − 33.1 − 5.8 − 27.2 − 0.7 + 12.62014 − 0.0 + 86.1 + 80.1 + 63.2 + 16.8 + 0.7 + 5.3 − 0.6 + 5.7 − 10.2 − 12.8 + 2.7 − 1.8 + 17.7
2015 + 0.1 − 91.8 − 86.0 − 82.2 − 3.8 − 6.7 + 0.8 − 0.1 − 6.1 − 9.2 − 6.5 − 2.7 + 1.1 + 2.02016 + 0.0 − 25.5 − 14.5 − 38.2 + 23.7 − 0.7 − 10.3 − 0.0 + 17.4 + 28.9 + 10.1 + 18.8 − 3.0 − 8.52017 + 0.0 − 57.2 − 48.7 − 61.5 + 12.8 + 0.0 − 8.5 + 0.6 − 4.7 + 13.0 + 8.6 + 4.4 + 0.7 − 18.42018 + 0.0 + 49.6 + 34.0 + 57.7 − 23.7 + 0.2 + 15.3 + 0.7 + 18.3 + 28.3 + 3.2 + 25.2 − 0.4 − 9.7
2017 Aug. − 0.0 − 19.5 − 17.7 − 15.3 − 2.4 − 0.1 − 1.8 + 0.0 − 0.5 + 3.0 + 3.8 − 0.7 − 0.0 − 3.5 Sep. + 0.1 + 5.0 + 6.5 + 5.6 + 0.8 − 0.4 − 1.1 − 0.0 − 0.8 + 2.1 + 3.4 − 1.4 + 0.7 − 3.5
Oct. + 0.0 − 13.4 − 13.6 − 12.3 − 1.3 + 0.1 + 0.2 + 0.0 − 5.3 − 1.5 − 3.4 + 2.0 − 0.2 − 3.6 Nov. − 0.0 − 3.2 − 3.4 − 3.4 − 0.1 − 0.5 + 0.7 + 0.0 − 0.8 − 0.9 + 1.0 − 1.9 − 0.0 + 0.1 Dec. − 0.0 − 21.1 − 19.6 − 25.1 + 5.5 − 0.7 − 0.8 + 0.1 − 10.7 − 11.1 − 11.9 + 0.8 − 2.2 + 2.5
2018 Jan. + 0.0 + 30.6 + 28.8 + 29.7 − 0.9 + 1.1 + 0.7 − 0.1 + 15.8 + 12.3 + 12.8 − 0.6 + 1.3 + 2.3 Feb. − 0.0 + 8.4 + 7.4 + 8.2 − 0.8 + 0.3 + 0.7 + 0.1 + 4.9 + 6.5 + 5.4 + 1.1 + 0.7 − 2.3 Mar. − 0.0 − 3.1 − 8.3 − 6.3 − 2.0 + 0.0 + 5.1 + 0.1 − 5.1 − 2.1 − 2.6 + 0.5 + 0.4 − 3.4
Apr. + 0.0 + 6.0 + 5.4 + 6.6 − 1.2 + 0.2 + 0.5 + 0.0 − 8.2 − 4.1 − 3.9 − 0.3 + 0.2 − 4.3 May − 0.0 + 16.9 + 17.3 + 17.3 − 0.0 − 0.0 − 0.4 + 0.0 + 14.7 + 12.1 + 7.0 + 5.1 − 1.5 + 4.2 June + 0.0 − 4.0 − 4.7 − 0.0 − 4.7 − 0.0 + 0.8 + 0.1 − 17.4 − 15.4 − 15.2 − 0.3 + 0.6 − 2.6
July − 0.0 + 7.0 + 5.1 + 2.7 + 2.4 + 0.0 + 1.8 + 0.1 + 9.2 + 10.4 + 6.4 + 4.0 + 0.1 − 1.4 Aug. − 0.0 − 6.4 − 7.9 − 7.2 − 0.8 + 0.0 + 1.6 + 0.1 + 7.3 + 4.7 + 3.5 + 1.1 + 0.4 + 2.3 Sep. + 0.0 − 1.2 − 3.9 − 1.2 − 2.8 − 0.0 + 2.8 + 0.1 − 7.6 − 6.8 − 5.5 − 1.3 − 1.1 + 0.3
Oct. − 0.0 − 7.7 − 6.9 − 4.5 − 2.4 − 0.2 − 0.6 + 0.0 + 12.8 + 14.8 + 10.5 + 4.3 + 0.6 − 2.6 Nov. + 0.0 − 4.9 − 6.5 − 0.9 − 5.6 − 0.6 + 2.1 + 0.1 + 5.3 + 5.4 + 2.0 + 3.5 − 0.1 − 0.0 Dec. − 0.0 + 8.0 + 8.2 + 13.2 − 4.9 − 0.6 + 0.3 + 0.1 − 13.4 − 9.5 − 17.4 + 7.9 − 2.0 − 2.0
2019 Jan. − 0.0 + 17.6 + 16.1 + 14.5 + 1.6 + 0.3 + 1.2 + 0.1 + 22.2 + 21.4 + 19.4 + 2.0 + 1.7 − 1.0
* See Table IV.2, footnote *; statistical breaks have been eliminated from the Subsequent revisions, which appear in the following Monthly Report, are notchanges. The figures for the latest date are always to be regarded as provisional. specially marked.
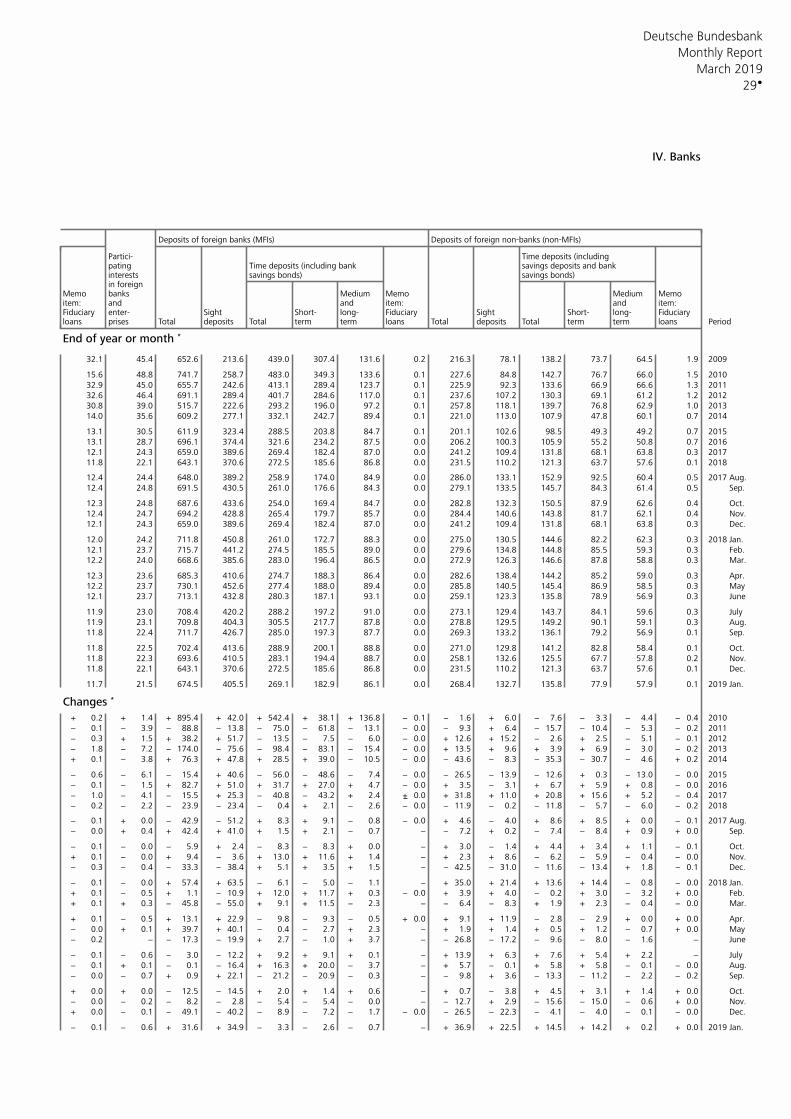
Deutsche Bundesbank
29
Monthly Report
March 2019
IV. Banks
Deposits of foreign banks (MFIs) Deposits of foreign non-banks (non-MFIs)
Partici- Time deposits (includingpating Time deposits (including bank savings deposits and bankinterests savings bonds) savings bonds)in foreign
Memo banks Medium Memo Medium Memoitem: and and item: and item:Fiduciary enter- Sight Short- long- Fiduciary Sight Short- long- Fiduciaryloans prises Total deposits Total term term loans Total deposits Total term term loans Period
End of year or month *
32.1 45.4 652.6 213.6 439.0 307.4 131.6 0.2 216.3 78.1 138.2 73.7 64.5 1.9 2009
15.6 48.8 741.7 258.7 483.0 349.3 133.6 0.1 227.6 84.8 142.7 76.7 66.0 1.5 201032.9 45.0 655.7 242.6 413.1 289.4 123.7 0.1 225.9 92.3 133.6 66.9 66.6 1.3 201132.6 46.4 691.1 289.4 401.7 284.6 117.0 0.1 237.6 107.2 130.3 69.1 61.2 1.2 201230.8 39.0 515.7 222.6 293.2 196.0 97.2 0.1 257.8 118.1 139.7 76.8 62.9 1.0 201314.0 35.6 609.2 277.1 332.1 242.7 89.4 0.1 221.0 113.0 107.9 47.8 60.1 0.7 2014
13.1 30.5 611.9 323.4 288.5 203.8 84.7 0.1 201.1 102.6 98.5 49.3 49.2 0.7 201513.1 28.7 696.1 374.4 321.6 234.2 87.5 0.0 206.2 100.3 105.9 55.2 50.8 0.7 201612.1 24.3 659.0 389.6 269.4 182.4 87.0 0.0 241.2 109.4 131.8 68.1 63.8 0.3 201711.8 22.1 643.1 370.6 272.5 185.6 86.8 0.0 231.5 110.2 121.3 63.7 57.6 0.1 2018
12.4 24.4 648.0 389.2 258.9 174.0 84.9 0.0 286.0 133.1 152.9 92.5 60.4 0.5 2017 Aug.12.4 24.8 691.5 430.5 261.0 176.6 84.3 0.0 279.1 133.5 145.7 84.3 61.4 0.5 Sep.
12.3 24.8 687.6 433.6 254.0 169.4 84.7 0.0 282.8 132.3 150.5 87.9 62.6 0.4 Oct.12.4 24.7 694.2 428.8 265.4 179.7 85.7 0.0 284.4 140.6 143.8 81.7 62.1 0.4 Nov.12.1 24.3 659.0 389.6 269.4 182.4 87.0 0.0 241.2 109.4 131.8 68.1 63.8 0.3 Dec.
12.0 24.2 711.8 450.8 261.0 172.7 88.3 0.0 275.0 130.5 144.6 82.2 62.3 0.3 2018 Jan.12.1 23.7 715.7 441.2 274.5 185.5 89.0 0.0 279.6 134.8 144.8 85.5 59.3 0.3 Feb.12.2 24.0 668.6 385.6 283.0 196.4 86.5 0.0 272.9 126.3 146.6 87.8 58.8 0.3 Mar.
12.3 23.6 685.3 410.6 274.7 188.3 86.4 0.0 282.6 138.4 144.2 85.2 59.0 0.3 Apr.12.2 23.7 730.1 452.6 277.4 188.0 89.4 0.0 285.8 140.5 145.4 86.9 58.5 0.3 May12.1 23.7 713.1 432.8 280.3 187.1 93.1 0.0 259.1 123.3 135.8 78.9 56.9 0.3 June
11.9 23.0 708.4 420.2 288.2 197.2 91.0 0.0 273.1 129.4 143.7 84.1 59.6 0.3 July11.9 23.1 709.8 404.3 305.5 217.7 87.8 0.0 278.8 129.5 149.2 90.1 59.1 0.3 Aug.11.8 22.4 711.7 426.7 285.0 197.3 87.7 0.0 269.3 133.2 136.1 79.2 56.9 0.1 Sep.
11.8 22.5 702.4 413.6 288.9 200.1 88.8 0.0 271.0 129.8 141.2 82.8 58.4 0.1 Oct.11.8 22.3 693.6 410.5 283.1 194.4 88.7 0.0 258.1 132.6 125.5 67.7 57.8 0.2 Nov.11.8 22.1 643.1 370.6 272.5 185.6 86.8 0.0 231.5 110.2 121.3 63.7 57.6 0.1 Dec.
11.7 21.5 674.5 405.5 269.1 182.9 86.1 0.0 268.4 132.7 135.8 77.9 57.9 0.1 2019 Jan.
Changes *
+ 0.2 + 1.4 + 895.4 + 42.0 + 542.4 + 38.1 + 136.8 − 0.1 − 1.6 + 6.0 − 7.6 − 3.3 − 4.4 − 0.4 2010− 0.1 − 3.9 − 88.8 − 13.8 − 75.0 − 61.8 − 13.1 − 0.0 − 9.3 + 6.4 − 15.7 − 10.4 − 5.3 − 0.2 2011− 0.3 + 1.5 + 38.2 + 51.7 − 13.5 − 7.5 − 6.0 − 0.0 + 12.6 + 15.2 − 2.6 + 2.5 − 5.1 − 0.1 2012− 1.8 − 7.2 − 174.0 − 75.6 − 98.4 − 83.1 − 15.4 − 0.0 + 13.5 + 9.6 + 3.9 + 6.9 − 3.0 − 0.2 2013+ 0.1 − 3.8 + 76.3 + 47.8 + 28.5 + 39.0 − 10.5 − 0.0 − 43.6 − 8.3 − 35.3 − 30.7 − 4.6 + 0.2 2014
− 0.6 − 6.1 − 15.4 + 40.6 − 56.0 − 48.6 − 7.4 − 0.0 − 26.5 − 13.9 − 12.6 + 0.3 − 13.0 − 0.0 2015− 0.1 − 1.5 + 82.7 + 51.0 + 31.7 + 27.0 + 4.7 − 0.0 + 3.5 − 3.1 + 6.7 + 5.9 + 0.8 − 0.0 2016− 1.0 − 4.1 − 15.5 + 25.3 − 40.8 − 43.2 + 2.4 + 0.0 + 31.8 + 11.0 + 20.8 + 15.6 + 5.2 − 0.4 2017− 0.2 − 2.2 − 23.9 − 23.4 − 0.4 + 2.1 − 2.6 − 0.0 − 11.9 − 0.2 − 11.8 − 5.7 − 6.0 − 0.2 2018
− 0.1 + 0.0 − 42.9 − 51.2 + 8.3 + 9.1 − 0.8 − 0.0 + 4.6 − 4.0 + 8.6 + 8.5 + 0.0 − 0.1 2017 Aug.− 0.0 + 0.4 + 42.4 + 41.0 + 1.5 + 2.1 − 0.7 − − 7.2 + 0.2 − 7.4 − 8.4 + 0.9 + 0.0 Sep.
− 0.1 − 0.0 − 5.9 + 2.4 − 8.3 − 8.3 + 0.0 − + 3.0 − 1.4 + 4.4 + 3.4 + 1.1 − 0.1 Oct.+ 0.1 − 0.0 + 9.4 − 3.6 + 13.0 + 11.6 + 1.4 − + 2.3 + 8.6 − 6.2 − 5.9 − 0.4 − 0.0 Nov.− 0.3 − 0.4 − 33.3 − 38.4 + 5.1 + 3.5 + 1.5 − − 42.5 − 31.0 − 11.6 − 13.4 + 1.8 − 0.1 Dec.
− 0.1 − 0.0 + 57.4 + 63.5 − 6.1 − 5.0 − 1.1 − + 35.0 + 21.4 + 13.6 + 14.4 − 0.8 − 0.0 2018 Jan.+ 0.1 − 0.5 + 1.1 − 10.9 + 12.0 + 11.7 + 0.3 − 0.0 + 3.9 + 4.0 − 0.2 + 3.0 − 3.2 + 0.0 Feb.+ 0.1 + 0.3 − 45.8 − 55.0 + 9.1 + 11.5 − 2.3 − − 6.4 − 8.3 + 1.9 + 2.3 − 0.4 − 0.0 Mar.
+ 0.1 − 0.5 + 13.1 + 22.9 − 9.8 − 9.3 − 0.5 + 0.0 + 9.1 + 11.9 − 2.8 − 2.9 + 0.0 + 0.0 Apr.− 0.0 + 0.1 + 39.7 + 40.1 − 0.4 − 2.7 + 2.3 − + 1.9 + 1.4 + 0.5 + 1.2 − 0.7 + 0.0 May− 0.2 − − 17.3 − 19.9 + 2.7 − 1.0 + 3.7 − − 26.8 − 17.2 − 9.6 − 8.0 − 1.6 − June
− 0.1 − 0.6 − 3.0 − 12.2 + 9.2 + 9.1 + 0.1 − + 13.9 + 6.3 + 7.6 + 5.4 + 2.2 − July− 0.1 + 0.1 − 0.1 − 16.4 + 16.3 + 20.0 − 3.7 − + 5.7 − 0.1 + 5.8 + 5.8 − 0.1 − 0.0 Aug.− 0.0 − 0.7 + 0.9 + 22.1 − 21.2 − 20.9 − 0.3 − − 9.8 + 3.6 − 13.3 − 11.2 − 2.2 − 0.2 Sep.
+ 0.0 + 0.0 − 12.5 − 14.5 + 2.0 + 1.4 + 0.6 − + 0.7 − 3.8 + 4.5 + 3.1 + 1.4 + 0.0 Oct.− 0.0 − 0.2 − 8.2 − 2.8 − 5.4 − 5.4 − 0.0 − − 12.7 + 2.9 − 15.6 − 15.0 − 0.6 + 0.0 Nov.+ 0.0 − 0.1 − 49.1 − 40.2 − 8.9 − 7.2 − 1.7 − 0.0 − 26.5 − 22.3 − 4.1 − 4.0 − 0.1 − 0.0 Dec.
− 0.1 − 0.6 + 31.6 + 34.9 − 3.3 − 2.6 − 0.7 − + 36.9 + 22.5 + 14.5 + 14.2 + 0.2 + 0.0 2019 Jan.
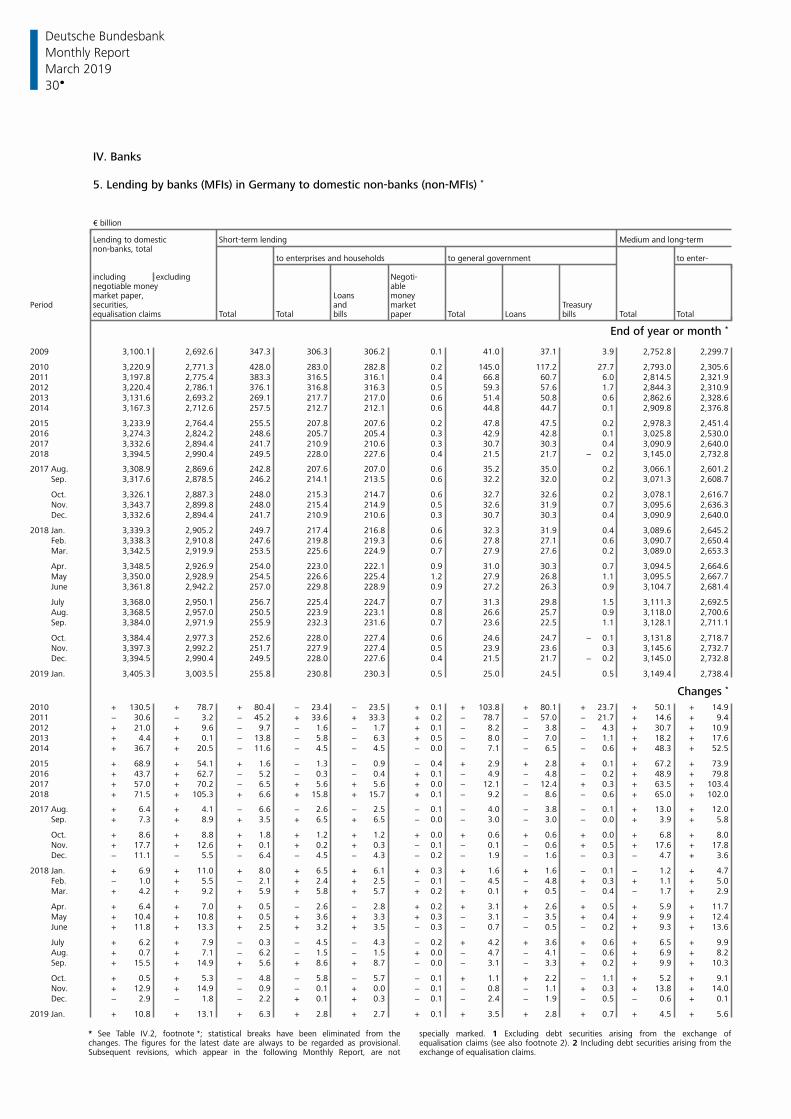
Deutsche Bundesbank
30
Monthly Report
March 2019
IV. Banks
5. Lending by banks (MFIs) in Germany to domestic non-banks (non-MFIs) *
€ billion
Lending to domestic Short-term lending Medium and long-termnon-banks, total
to enterprises and households to general government to enter-
including excluding Negoti-negotiable money ablemarket paper, Loans money
Period securities, and market Treasuryequalisation claims Total Total bills paper Total Loans bills Total Total
End of year or month *
2009 3,100.1 2,692.6 347.3 306.3 306.2 0.1 41.0 37.1 3.9 2,752.8 2,299.7
2010 3,220.9 2,771.3 428.0 283.0 282.8 0.2 145.0 117.2 27.7 2,793.0 2,305.62011 3,197.8 2,775.4 383.3 316.5 316.1 0.4 66.8 60.7 6.0 2,814.5 2,321.92012 3,220.4 2,786.1 376.1 316.8 316.3 0.5 59.3 57.6 1.7 2,844.3 2,310.92013 3,131.6 2,693.2 269.1 217.7 217.0 0.6 51.4 50.8 0.6 2,862.6 2,328.62014 3,167.3 2,712.6 257.5 212.7 212.1 0.6 44.8 44.7 0.1 2,909.8 2,376.8
2015 3,233.9 2,764.4 255.5 207.8 207.6 0.2 47.8 47.5 0.2 2,978.3 2,451.42016 3,274.3 2,824.2 248.6 205.7 205.4 0.3 42.9 42.8 0.1 3,025.8 2,530.02017 3,332.6 2,894.4 241.7 210.9 210.6 0.3 30.7 30.3 0.4 3,090.9 2,640.02018 3,394.5 2,990.4 249.5 228.0 227.6 0.4 21.5 21.7 − 0.2 3,145.0 2,732.8
2017 Aug. 3,308.9 2,869.6 242.8 207.6 207.0 0.6 35.2 35.0 0.2 3,066.1 2,601.2 Sep. 3,317.6 2,878.5 246.2 214.1 213.5 0.6 32.2 32.0 0.2 3,071.3 2,608.7
Oct. 3,326.1 2,887.3 248.0 215.3 214.7 0.6 32.7 32.6 0.2 3,078.1 2,616.7 Nov. 3,343.7 2,899.8 248.0 215.4 214.9 0.5 32.6 31.9 0.7 3,095.6 2,636.3 Dec. 3,332.6 2,894.4 241.7 210.9 210.6 0.3 30.7 30.3 0.4 3,090.9 2,640.0
2018 Jan. 3,339.3 2,905.2 249.7 217.4 216.8 0.6 32.3 31.9 0.4 3,089.6 2,645.2 Feb. 3,338.3 2,910.8 247.6 219.8 219.3 0.6 27.8 27.1 0.6 3,090.7 2,650.4 Mar. 3,342.5 2,919.9 253.5 225.6 224.9 0.7 27.9 27.6 0.2 3,089.0 2,653.3
Apr. 3,348.5 2,926.9 254.0 223.0 222.1 0.9 31.0 30.3 0.7 3,094.5 2,664.6 May 3,350.0 2,928.9 254.5 226.6 225.4 1.2 27.9 26.8 1.1 3,095.5 2,667.7 June 3,361.8 2,942.2 257.0 229.8 228.9 0.9 27.2 26.3 0.9 3,104.7 2,681.4
July 3,368.0 2,950.1 256.7 225.4 224.7 0.7 31.3 29.8 1.5 3,111.3 2,692.5 Aug. 3,368.5 2,957.0 250.5 223.9 223.1 0.8 26.6 25.7 0.9 3,118.0 2,700.6 Sep. 3,384.0 2,971.9 255.9 232.3 231.6 0.7 23.6 22.5 1.1 3,128.1 2,711.1
Oct. 3,384.4 2,977.3 252.6 228.0 227.4 0.6 24.6 24.7 − 0.1 3,131.8 2,718.7 Nov. 3,397.3 2,992.2 251.7 227.9 227.4 0.5 23.9 23.6 0.3 3,145.6 2,732.7 Dec. 3,394.5 2,990.4 249.5 228.0 227.6 0.4 21.5 21.7 − 0.2 3,145.0 2,732.8
2019 Jan. 3,405.3 3,003.5 255.8 230.8 230.3 0.5 25.0 24.5 0.5 3,149.4 2,738.4
Changes *
2010 + 130.5 + 78.7 + 80.4 − 23.4 − 23.5 + 0.1 + 103.8 + 80.1 + 23.7 + 50.1 + 14.92011 − 30.6 − 3.2 − 45.2 + 33.6 + 33.3 + 0.2 − 78.7 − 57.0 − 21.7 + 14.6 + 9.42012 + 21.0 + 9.6 − 9.7 − 1.6 − 1.7 + 0.1 − 8.2 − 3.8 − 4.3 + 30.7 + 10.92013 + 4.4 + 0.1 − 13.8 − 5.8 − 6.3 + 0.5 − 8.0 − 7.0 − 1.1 + 18.2 + 17.62014 + 36.7 + 20.5 − 11.6 − 4.5 − 4.5 − 0.0 − 7.1 − 6.5 − 0.6 + 48.3 + 52.5
2015 + 68.9 + 54.1 + 1.6 − 1.3 − 0.9 − 0.4 + 2.9 + 2.8 + 0.1 + 67.2 + 73.92016 + 43.7 + 62.7 − 5.2 − 0.3 − 0.4 + 0.1 − 4.9 − 4.8 − 0.2 + 48.9 + 79.82017 + 57.0 + 70.2 − 6.5 + 5.6 + 5.6 + 0.0 − 12.1 − 12.4 + 0.3 + 63.5 + 103.42018 + 71.5 + 105.3 + 6.6 + 15.8 + 15.7 + 0.1 − 9.2 − 8.6 − 0.6 + 65.0 + 102.0
2017 Aug. + 6.4 + 4.1 − 6.6 − 2.6 − 2.5 − 0.1 − 4.0 − 3.8 − 0.1 + 13.0 + 12.0 Sep. + 7.3 + 8.9 + 3.5 + 6.5 + 6.5 − 0.0 − 3.0 − 3.0 − 0.0 + 3.9 + 5.8
Oct. + 8.6 + 8.8 + 1.8 + 1.2 + 1.2 + 0.0 + 0.6 + 0.6 + 0.0 + 6.8 + 8.0 Nov. + 17.7 + 12.6 + 0.1 + 0.2 + 0.3 − 0.1 − 0.1 − 0.6 + 0.5 + 17.6 + 17.8 Dec. − 11.1 − 5.5 − 6.4 − 4.5 − 4.3 − 0.2 − 1.9 − 1.6 − 0.3 − 4.7 + 3.6
2018 Jan. + 6.9 + 11.0 + 8.0 + 6.5 + 6.1 + 0.3 + 1.6 + 1.6 − 0.1 − 1.2 + 4.7 Feb. − 1.0 + 5.5 − 2.1 + 2.4 + 2.5 − 0.1 − 4.5 − 4.8 + 0.3 + 1.1 + 5.0 Mar. + 4.2 + 9.2 + 5.9 + 5.8 + 5.7 + 0.2 + 0.1 + 0.5 − 0.4 − 1.7 + 2.9
Apr. + 6.4 + 7.0 + 0.5 − 2.6 − 2.8 + 0.2 + 3.1 + 2.6 + 0.5 + 5.9 + 11.7 May + 10.4 + 10.8 + 0.5 + 3.6 + 3.3 + 0.3 − 3.1 − 3.5 + 0.4 + 9.9 + 12.4 June + 11.8 + 13.3 + 2.5 + 3.2 + 3.5 − 0.3 − 0.7 − 0.5 − 0.2 + 9.3 + 13.6
July + 6.2 + 7.9 − 0.3 − 4.5 − 4.3 − 0.2 + 4.2 + 3.6 + 0.6 + 6.5 + 9.9 Aug. + 0.7 + 7.1 − 6.2 − 1.5 − 1.5 + 0.0 − 4.7 − 4.1 − 0.6 + 6.9 + 8.2 Sep. + 15.5 + 14.9 + 5.6 + 8.6 + 8.7 − 0.0 − 3.1 − 3.3 + 0.2 + 9.9 + 10.3
Oct. + 0.5 + 5.3 − 4.8 − 5.8 − 5.7 − 0.1 + 1.1 + 2.2 − 1.1 + 5.2 + 9.1 Nov. + 12.9 + 14.9 − 0.9 − 0.1 + 0.0 − 0.1 − 0.8 − 1.1 + 0.3 + 13.8 + 14.0 Dec. − 2.9 − 1.8 − 2.2 + 0.1 + 0.3 − 0.1 − 2.4 − 1.9 − 0.5 − 0.6 + 0.1
2019 Jan. + 10.8 + 13.1 + 6.3 + 2.8 + 2.7 + 0.1 + 3.5 + 2.8 + 0.7 + 4.5 + 5.6
* See Table IV.2, footnote *; statistical breaks have been eliminated from the specially marked. 1 Excluding debt securities arising from the exchange ofchanges. The figures for the latest date are always to be regarded as provisional. equalisation claims (see also footnote 2). 2 Including debt securities arising from theSubsequent revisions, which appear in the following Monthly Report, are not exchange of equalisation claims.
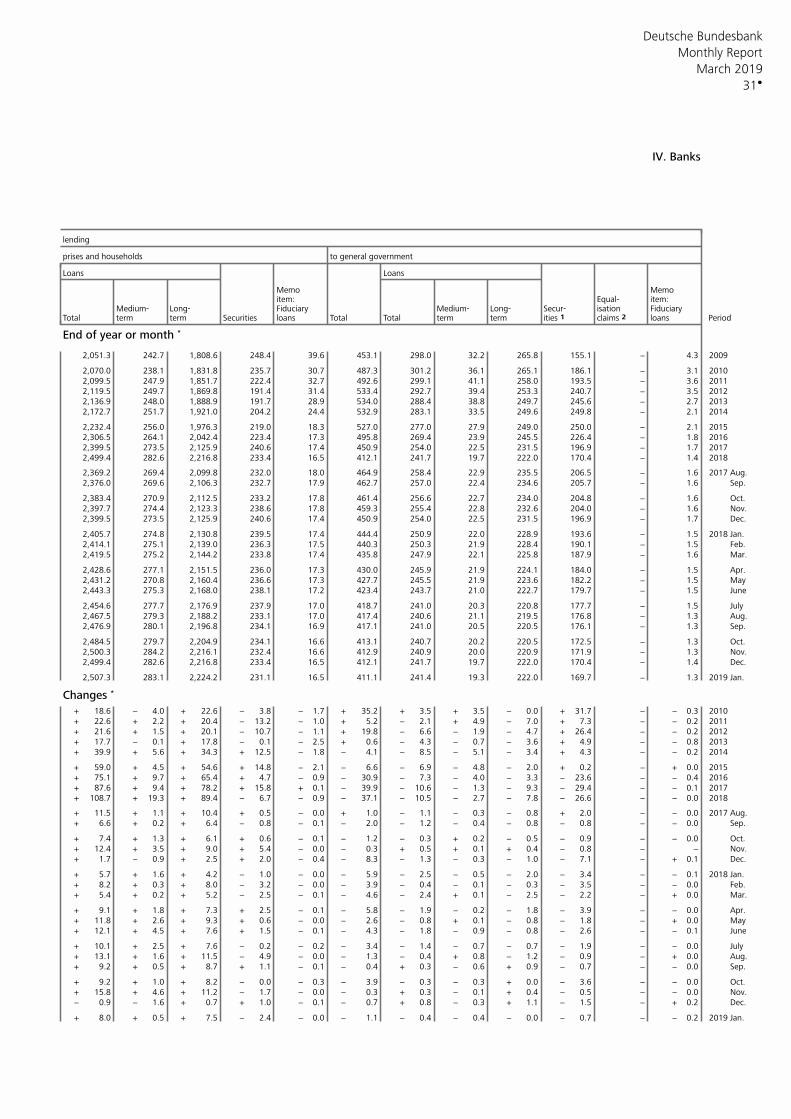
Deutsche Bundesbank
31
Monthly Report
March 2019
IV. Banks
lending
prises and households to general government
Loans Loans
Memo Memoitem: Equal- item:
Medium- Long- Fiduciary Medium- Long- Secur- isation FiduciaryTotal term term loans Total Total term term ities 1 claims 2 loans PeriodSecurities
End of year or month *
2,051.3 242.7 1,808.6 248.4 39.6 453.1 298.0 32.2 265.8 155.1 − 4.3 2009
2,070.0 238.1 1,831.8 235.7 30.7 487.3 301.2 36.1 265.1 186.1 − 3.1 20102,099.5 247.9 1,851.7 222.4 32.7 492.6 299.1 41.1 258.0 193.5 − 3.6 20112,119.5 249.7 1,869.8 191.4 31.4 533.4 292.7 39.4 253.3 240.7 − 3.5 20122,136.9 248.0 1,888.9 191.7 28.9 534.0 288.4 38.8 249.7 245.6 − 2.7 20132,172.7 251.7 1,921.0 204.2 24.4 532.9 283.1 33.5 249.6 249.8 − 2.1 2014
2,232.4 256.0 1,976.3 219.0 18.3 527.0 277.0 27.9 249.0 250.0 − 2.1 20152,306.5 264.1 2,042.4 223.4 17.3 495.8 269.4 23.9 245.5 226.4 − 1.8 20162,399.5 273.5 2,125.9 240.6 17.4 450.9 254.0 22.5 231.5 196.9 − 1.7 20172,499.4 282.6 2,216.8 233.4 16.5 412.1 241.7 19.7 222.0 170.4 − 1.4 2018
2,369.2 269.4 2,099.8 232.0 18.0 464.9 258.4 22.9 235.5 206.5 − 1.6 2017 Aug.2,376.0 269.6 2,106.3 232.7 17.9 462.7 257.0 22.4 234.6 205.7 − 1.6 Sep.
2,383.4 270.9 2,112.5 233.2 17.8 461.4 256.6 22.7 234.0 204.8 − 1.6 Oct.2,397.7 274.4 2,123.3 238.6 17.8 459.3 255.4 22.8 232.6 204.0 − 1.6 Nov.2,399.5 273.5 2,125.9 240.6 17.4 450.9 254.0 22.5 231.5 196.9 − 1.7 Dec.
2,405.7 274.8 2,130.8 239.5 17.4 444.4 250.9 22.0 228.9 193.6 − 1.5 2018 Jan.2,414.1 275.1 2,139.0 236.3 17.5 440.3 250.3 21.9 228.4 190.1 − 1.5 Feb.2,419.5 275.2 2,144.2 233.8 17.4 435.8 247.9 22.1 225.8 187.9 − 1.6 Mar.
2,428.6 277.1 2,151.5 236.0 17.3 430.0 245.9 21.9 224.1 184.0 − 1.5 Apr.2,431.2 270.8 2,160.4 236.6 17.3 427.7 245.5 21.9 223.6 182.2 − 1.5 May2,443.3 275.3 2,168.0 238.1 17.2 423.4 243.7 21.0 222.7 179.7 − 1.5 June
2,454.6 277.7 2,176.9 237.9 17.0 418.7 241.0 20.3 220.8 177.7 − 1.5 July2,467.5 279.3 2,188.2 233.1 17.0 417.4 240.6 21.1 219.5 176.8 − 1.3 Aug.2,476.9 280.1 2,196.8 234.1 16.9 417.1 241.0 20.5 220.5 176.1 − 1.3 Sep.
2,484.5 279.7 2,204.9 234.1 16.6 413.1 240.7 20.2 220.5 172.5 − 1.3 Oct.2,500.3 284.2 2,216.1 232.4 16.6 412.9 240.9 20.0 220.9 171.9 − 1.3 Nov.2,499.4 282.6 2,216.8 233.4 16.5 412.1 241.7 19.7 222.0 170.4 − 1.4 Dec.
2,507.3 283.1 2,224.2 231.1 16.5 411.1 241.4 19.3 222.0 169.7 − 1.3 2019 Jan.
Changes *
+ 18.6 − 4.0 + 22.6 − 3.8 − 1.7 + 35.2 + 3.5 + 3.5 − 0.0 + 31.7 − − 0.3 2010+ 22.6 + 2.2 + 20.4 − 13.2 − 1.0 + 5.2 − 2.1 + 4.9 − 7.0 + 7.3 − − 0.2 2011+ 21.6 + 1.5 + 20.1 − 10.7 − 1.1 + 19.8 − 6.6 − 1.9 − 4.7 + 26.4 − − 0.2 2012+ 17.7 − 0.1 + 17.8 − 0.1 − 2.5 + 0.6 − 4.3 − 0.7 − 3.6 + 4.9 − − 0.8 2013+ 39.9 + 5.6 + 34.3 + 12.5 − 1.8 − 4.1 − 8.5 − 5.1 − 3.4 + 4.3 − − 0.2 2014
+ 59.0 + 4.5 + 54.6 + 14.8 − 2.1 − 6.6 − 6.9 − 4.8 − 2.0 + 0.2 − + 0.0 2015+ 75.1 + 9.7 + 65.4 + 4.7 − 0.9 − 30.9 − 7.3 − 4.0 − 3.3 − 23.6 − − 0.4 2016+ 87.6 + 9.4 + 78.2 + 15.8 + 0.1 − 39.9 − 10.6 − 1.3 − 9.3 − 29.4 − − 0.1 2017+ 108.7 + 19.3 + 89.4 − 6.7 − 0.9 − 37.1 − 10.5 − 2.7 − 7.8 − 26.6 − − 0.0 2018
+ 11.5 + 1.1 + 10.4 + 0.5 − 0.0 + 1.0 − 1.1 − 0.3 − 0.8 + 2.0 − − 0.0 2017 Aug.+ 6.6 + 0.2 + 6.4 − 0.8 − 0.1 − 2.0 − 1.2 − 0.4 − 0.8 − 0.8 − − 0.0 Sep.
+ 7.4 + 1.3 + 6.1 + 0.6 − 0.1 − 1.2 − 0.3 + 0.2 − 0.5 − 0.9 − − 0.0 Oct.+ 12.4 + 3.5 + 9.0 + 5.4 − 0.0 − 0.3 + 0.5 + 0.1 + 0.4 − 0.8 − − Nov.+ 1.7 − 0.9 + 2.5 + 2.0 − 0.4 − 8.3 − 1.3 − 0.3 − 1.0 − 7.1 − + 0.1 Dec.
+ 5.7 + 1.6 + 4.2 − 1.0 − 0.0 − 5.9 − 2.5 − 0.5 − 2.0 − 3.4 − − 0.1 2018 Jan.+ 8.2 + 0.3 + 8.0 − 3.2 − 0.0 − 3.9 − 0.4 − 0.1 − 0.3 − 3.5 − − 0.0 Feb.+ 5.4 + 0.2 + 5.2 − 2.5 − 0.1 − 4.6 − 2.4 + 0.1 − 2.5 − 2.2 − + 0.0 Mar.
+ 9.1 + 1.8 + 7.3 + 2.5 − 0.1 − 5.8 − 1.9 − 0.2 − 1.8 − 3.9 − − 0.0 Apr.+ 11.8 + 2.6 + 9.3 + 0.6 − 0.0 − 2.6 − 0.8 + 0.1 − 0.8 − 1.8 − + 0.0 May+ 12.1 + 4.5 + 7.6 + 1.5 − 0.1 − 4.3 − 1.8 − 0.9 − 0.8 − 2.6 − − 0.1 June
+ 10.1 + 2.5 + 7.6 − 0.2 − 0.2 − 3.4 − 1.4 − 0.7 − 0.7 − 1.9 − − 0.0 July+ 13.1 + 1.6 + 11.5 − 4.9 − 0.0 − 1.3 − 0.4 + 0.8 − 1.2 − 0.9 − + 0.0 Aug.+ 9.2 + 0.5 + 8.7 + 1.1 − 0.1 − 0.4 + 0.3 − 0.6 + 0.9 − 0.7 − − 0.0 Sep.
+ 9.2 + 1.0 + 8.2 − 0.0 − 0.3 − 3.9 − 0.3 − 0.3 + 0.0 − 3.6 − − 0.0 Oct.+ 15.8 + 4.6 + 11.2 − 1.7 − 0.0 − 0.3 + 0.3 − 0.1 + 0.4 − 0.5 − − 0.0 Nov.− 0.9 − 1.6 + 0.7 + 1.0 − 0.1 − 0.7 + 0.8 − 0.3 + 1.1 − 1.5 − + 0.2 Dec.
+ 8.0 + 0.5 + 7.5 − 2.4 − 0.0 − 1.1 − 0.4 − 0.4 − 0.0 − 0.7 − − 0.2 2019 Jan.
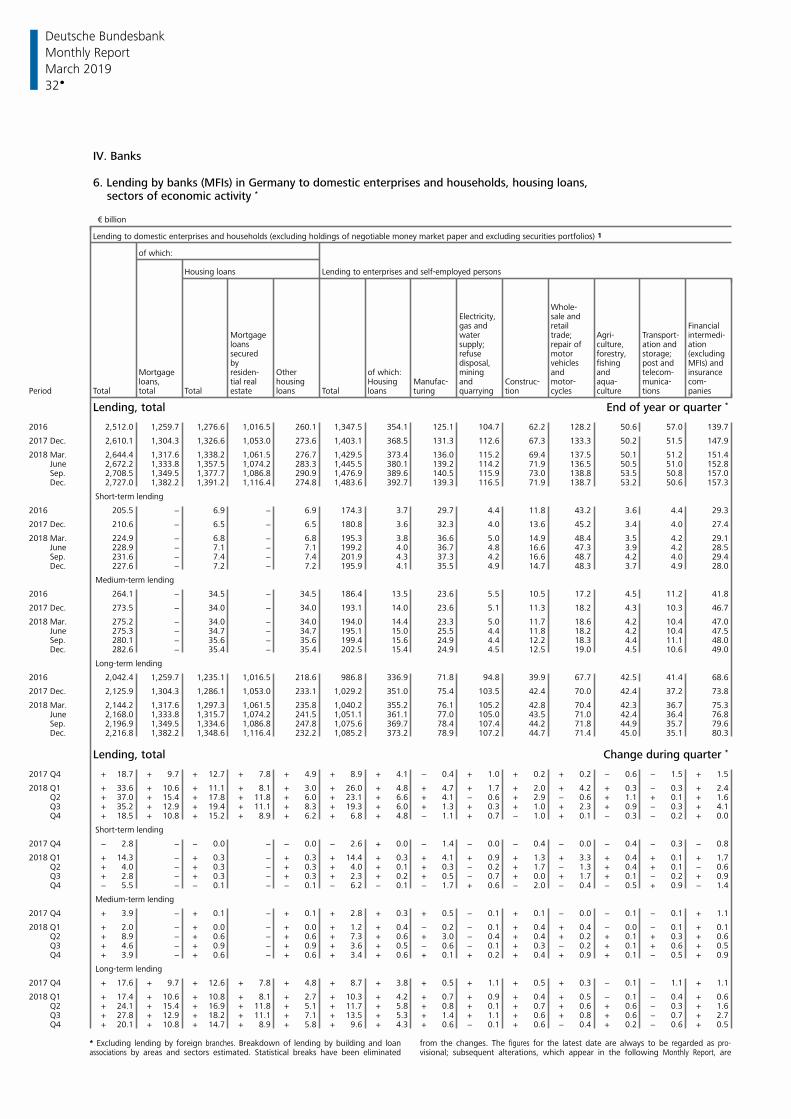
Deutsche Bundesbank
32
Monthly Report
March 2019
IV. Banks
6. Lending by banks (MFIs) in Germany to domestic enterprises and households, housing loans, sectors of economic activity *
€ billion
Lending to domestic enterprises and households (excluding holdings of negotiable money market paper and excluding securities portfolios) 1
of which:
Housing loans Lending to enterprises and self-employed persons
Whole-sale andElectricity,
gas and retail FinancialMortgage water trade; Agri- Transport- intermedi-loans supply; repair of culture, ation and ationsecured refuse motor forestry, storage; (excludingby disposal, vehicles fishing post and MFIs) and
Mortgage residen- Other of which: mining and and telecom- insuranceloans, tial real housing Housing Manufac- and Construc- motor- aqua- munica- com-
Period Total total Total estate loans Total loans turing quarrying tion cycles culture tions panies
Lending, total End of year or quarter *
2016 2,512.0 1,259.7 1,276.6 1,016.5 260.1 1,347.5 354.1 125.1 104.7 62.2 128.2 50.6 57.0 139.7
2017 Dec. 2,610.1 1,304.3 1,326.6 1,053.0 273.6 1,403.1 368.5 131.3 112.6 67.3 133.3 50.2 51.5 147.9
2018 Mar. 2,644.4 1,317.6 1,338.2 1,061.5 276.7 1,429.5 373.4 136.0 115.2 69.4 137.5 50.1 51.2 151.4 June 2,672.2 1,333.8 1,357.5 1,074.2 283.3 1,445.5 380.1 139.2 114.2 71.9 136.5 50.5 51.0 152.8 Sep. 2,708.5 1,349.5 1,377.7 1,086.8 290.9 1,476.9 389.6 140.5 115.9 73.0 138.8 53.5 50.8 157.0 Dec. 2,727.0 1,382.2 1,391.2 1,116.4 274.8 1,483.6 392.7 139.3 116.5 71.9 138.7 53.2 50.6 157.3
Short-term lending
2016 205.5 − 6.9 − 6.9 174.3 3.7 29.7 4.4 11.8 43.2 3.6 4.4 29.3
2017 Dec. 210.6 − 6.5 − 6.5 180.8 3.6 32.3 4.0 13.6 45.2 3.4 4.0 27.4
2018 Mar. 224.9 − 6.8 − 6.8 195.3 3.8 36.6 5.0 14.9 48.4 3.5 4.2 29.1 June 228.9 − 7.1 − 7.1 199.2 4.0 36.7 4.8 16.6 47.3 3.9 4.2 28.5 Sep. 231.6 − 7.4 − 7.4 201.9 4.3 37.3 4.2 16.6 48.7 4.2 4.0 29.4 Dec. 227.6 − 7.2 − 7.2 195.9 4.1 35.5 4.9 14.7 48.3 3.7 4.9 28.0
Medium-term lending
2016 264.1 − 34.5 − 34.5 186.4 13.5 23.6 5.5 10.5 17.2 4.5 11.2 41.8
2017 Dec. 273.5 − 34.0 − 34.0 193.1 14.0 23.6 5.1 11.3 18.2 4.3 10.3 46.7
2018 Mar. 275.2 − 34.0 − 34.0 194.0 14.4 23.3 5.0 11.7 18.6 4.2 10.4 47.0 June 275.3 − 34.7 − 34.7 195.1 15.0 25.5 4.4 11.8 18.2 4.2 10.4 47.5 Sep. 280.1 − 35.6 − 35.6 199.4 15.6 24.9 4.4 12.2 18.3 4.4 11.1 48.0 Dec. 282.6 − 35.4 − 35.4 202.5 15.4 24.9 4.5 12.5 19.0 4.5 10.6 49.0
Long-term lending
2016 2,042.4 1,259.7 1,235.1 1,016.5 218.6 986.8 336.9 71.8 94.8 39.9 67.7 42.5 41.4 68.6
2017 Dec. 2,125.9 1,304.3 1,286.1 1,053.0 233.1 1,029.2 351.0 75.4 103.5 42.4 70.0 42.4 37.2 73.8
2018 Mar. 2,144.2 1,317.6 1,297.3 1,061.5 235.8 1,040.2 355.2 76.1 105.2 42.8 70.4 42.3 36.7 75.3 June 2,168.0 1,333.8 1,315.7 1,074.2 241.5 1,051.1 361.1 77.0 105.0 43.5 71.0 42.4 36.4 76.8 Sep. 2,196.9 1,349.5 1,334.6 1,086.8 247.8 1,075.6 369.7 78.4 107.4 44.2 71.8 44.9 35.7 79.6 Dec. 2,216.8 1,382.2 1,348.6 1,116.4 232.2 1,085.2 373.2 78.9 107.2 44.7 71.4 45.0 35.1 80.3
Lending, total Change during quarter *
2017 Q4 + 18.7 + 9.7 + 12.7 + 7.8 + 4.9 + 8.9 + 4.1 − 0.4 + 1.0 + 0.2 + 0.2 − 0.6 − 1.5 + 1.5
2018 Q1 + 33.6 + 10.6 + 11.1 + 8.1 + 3.0 + 26.0 + 4.8 + 4.7 + 1.7 + 2.0 + 4.2 + 0.3 − 0.3 + 2.4 Q2 + 37.0 + 15.4 + 17.8 + 11.8 + 6.0 + 23.1 + 6.6 + 4.1 − 0.6 + 2.9 − 0.6 + 1.1 + 0.1 + 1.6 Q3 + 35.2 + 12.9 + 19.4 + 11.1 + 8.3 + 19.3 + 6.0 + 1.3 + 0.3 + 1.0 + 2.3 + 0.9 − 0.3 + 4.1 Q4 + 18.5 + 10.8 + 15.2 + 8.9 + 6.2 + 6.8 + 4.8 − 1.1 + 0.7 − 1.0 + 0.1 − 0.3 − 0.2 + 0.0
Short-term lending
2017 Q4 − 2.8 − − 0.0 − − 0.0 − 2.6 + 0.0 − 1.4 − 0.0 − 0.4 − 0.0 − 0.4 − 0.3 − 0.8
2018 Q1 + 14.3 − + 0.3 − + 0.3 + 14.4 + 0.3 + 4.1 + 0.9 + 1.3 + 3.3 + 0.4 + 0.1 + 1.7 Q2 + 4.0 − + 0.3 − + 0.3 + 4.0 + 0.1 + 0.3 − 0.2 + 1.7 − 1.3 + 0.4 + 0.1 − 0.6 Q3 + 2.8 − + 0.3 − + 0.3 + 2.3 + 0.2 + 0.5 − 0.7 + 0.0 + 1.7 + 0.1 − 0.2 + 0.9 Q4 − 5.5 − − 0.1 − − 0.1 − 6.2 − 0.1 − 1.7 + 0.6 − 2.0 − 0.4 − 0.5 + 0.9 − 1.4
Medium-term lending
2017 Q4 + 3.9 − + 0.1 − + 0.1 + 2.8 + 0.3 + 0.5 − 0.1 + 0.1 − 0.0 − 0.1 − 0.1 + 1.1
2018 Q1 + 2.0 − + 0.0 − + 0.0 + 1.2 + 0.4 − 0.2 − 0.1 + 0.4 + 0.4 − 0.0 − 0.1 + 0.1 Q2 + 8.9 − + 0.6 − + 0.6 + 7.3 + 0.6 + 3.0 − 0.4 + 0.4 + 0.2 + 0.1 + 0.3 + 0.6 Q3 + 4.6 − + 0.9 − + 0.9 + 3.6 + 0.5 − 0.6 − 0.1 + 0.3 − 0.2 + 0.1 + 0.6 + 0.5 Q4 + 3.9 − + 0.6 − + 0.6 + 3.4 + 0.6 + 0.1 + 0.2 + 0.4 + 0.9 + 0.1 − 0.5 + 0.9
Long-term lending
2017 Q4 + 17.6 + 9.7 + 12.6 + 7.8 + 4.8 + 8.7 + 3.8 + 0.5 + 1.1 + 0.5 + 0.3 − 0.1 − 1.1 + 1.1
2018 Q1 + 17.4 + 10.6 + 10.8 + 8.1 + 2.7 + 10.3 + 4.2 + 0.7 + 0.9 + 0.4 + 0.5 − 0.1 − 0.4 + 0.6 Q2 + 24.1 + 15.4 + 16.9 + 11.8 + 5.1 + 11.7 + 5.8 + 0.8 + 0.1 + 0.7 + 0.6 + 0.6 − 0.3 + 1.6 Q3 + 27.8 + 12.9 + 18.2 + 11.1 + 7.1 + 13.5 + 5.3 + 1.4 + 1.1 + 0.6 + 0.8 + 0.6 − 0.7 + 2.7 Q4 + 20.1 + 10.8 + 14.7 + 8.9 + 5.8 + 9.6 + 4.3 + 0.6 − 0.1 + 0.6 − 0.4 + 0.2 − 0.6 + 0.5
* Excluding lending by foreign branches. Breakdown of lending by building and loan from the changes. The figures for the latest date are always to be regarded as pro-associations by areas and sectors estimated. Statistical breaks have been eliminated visional; subsequent alterations, which appear in the following Monthly Report, are
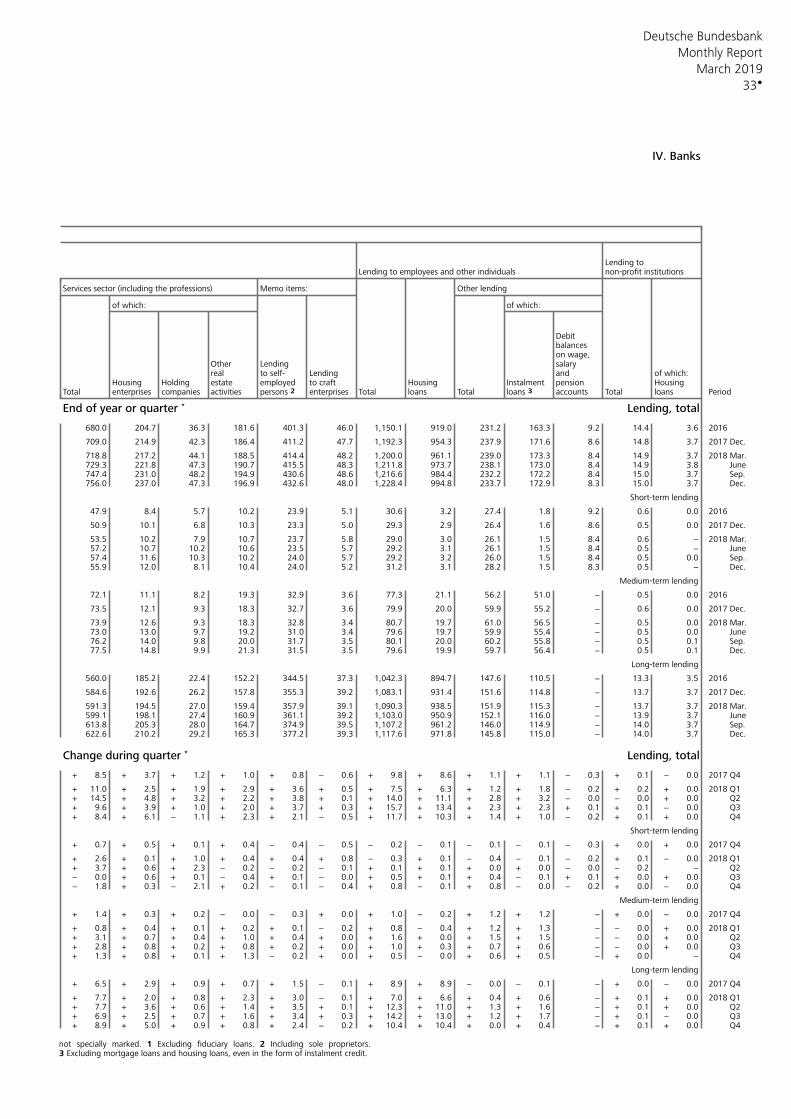
Deutsche Bundesbank
33
Monthly Report
March 2019
IV. Banks
Lending to Lending to employees and other individuals non-profit institutions
Memo items: Other lendingServices sector (including the professions)
of which: of which:
Debitbalanceson wage,
Other Lending salaryreal to self- Lending and of which:
Housing Holding estate employed to craft Housing pension HousingInstalmentTotal companies Total loans Total loans 3 accounts Total loans Periodenterprises activities persons 2 enterprises
End of year or quarter * Lending, total
680.0 204.7 36.3 181.6 401.3 46.0 1,150.1 919.0 231.2 163.3 9.2 14.4 3.6 2016
709.0 214.9 42.3 186.4 411.2 47.7 1,192.3 954.3 237.9 171.6 8.6 14.8 3.7 2017 Dec.
718.8 217.2 44.1 188.5 414.4 48.2 1,200.0 961.1 239.0 173.3 8.4 14.9 3.7 2018 Mar.729.3 221.8 47.3 190.7 415.5 48.3 1,211.8 973.7 238.1 173.0 8.4 14.9 3.8 June747.4 231.0 48.2 194.9 430.6 48.6 1,216.6 984.4 232.2 172.2 8.4 15.0 3.7 Sep.756.0 237.0 47.3 196.9 432.6 48.0 1,228.4 994.8 233.7 172.9 8.3 15.0 3.7 Dec.
Short-term lending
47.9 8.4 5.7 10.2 23.9 5.1 30.6 3.2 27.4 1.8 9.2 0.6 0.0 2016
50.9 10.1 6.8 10.3 23.3 5.0 29.3 2.9 26.4 1.6 8.6 0.5 0.0 2017 Dec.
53.5 10.2 7.9 10.7 23.7 5.8 29.0 3.0 26.1 1.5 8.4 0.6 − 2018 Mar.57.2 10.7 10.2 10.6 23.5 5.7 29.2 3.1 26.1 1.5 8.4 0.5 − June57.4 11.6 10.3 10.2 24.0 5.7 29.2 3.2 26.0 1.5 8.4 0.5 0.0 Sep.55.9 12.0 8.1 10.4 24.0 5.2 31.2 3.1 28.2 1.5 8.3 0.5 − Dec.
Medium-term lending
72.1 11.1 8.2 19.3 32.9 3.6 77.3 21.1 56.2 51.0 − 0.5 0.0 2016
73.5 12.1 9.3 18.3 32.7 3.6 79.9 20.0 59.9 55.2 − 0.6 0.0 2017 Dec.
73.9 12.6 9.3 18.3 32.8 3.4 80.7 19.7 61.0 56.5 − 0.5 0.0 2018 Mar.73.0 13.0 9.7 19.2 31.0 3.4 79.6 19.7 59.9 55.4 − 0.5 0.0 June76.2 14.0 9.8 20.0 31.7 3.5 80.1 20.0 60.2 55.8 − 0.5 0.1 Sep.77.5 14.8 9.9 21.3 31.5 3.5 79.6 19.9 59.7 56.4 − 0.5 0.1 Dec.
Long-term lending
560.0 185.2 22.4 152.2 344.5 37.3 1,042.3 894.7 147.6 110.5 − 13.3 3.5 2016
584.6 192.6 26.2 157.8 355.3 39.2 1,083.1 931.4 151.6 114.8 − 13.7 3.7 2017 Dec.
591.3 194.5 27.0 159.4 357.9 39.1 1,090.3 938.5 151.9 115.3 − 13.7 3.7 2018 Mar.599.1 198.1 27.4 160.9 361.1 39.2 1,103.0 950.9 152.1 116.0 − 13.9 3.7 June613.8 205.3 28.0 164.7 374.9 39.5 1,107.2 961.2 146.0 114.9 − 14.0 3.7 Sep.622.6 210.2 29.2 165.3 377.2 39.3 1,117.6 971.8 145.8 115.0 − 14.0 3.7 Dec.
Change during quarter * Lending, total
+ 8.5 + 3.7 + 1.2 + 1.0 + 0.8 − 0.6 + 9.8 + 8.6 + 1.1 + 1.1 − 0.3 + 0.1 − 0.0 2017 Q4
+ 11.0 + 2.5 + 1.9 + 2.9 + 3.6 + 0.5 + 7.5 + 6.3 + 1.2 + 1.8 − 0.2 + 0.2 + 0.0 2018 Q1+ 14.5 + 4.8 + 3.2 + 2.2 + 3.8 + 0.1 + 14.0 + 11.1 + 2.8 + 3.2 − 0.0 − 0.0 + 0.0 Q2+ 9.6 + 3.9 + 1.0 + 2.0 + 3.7 + 0.3 + 15.7 + 13.4 + 2.3 + 2.3 + 0.1 + 0.1 − 0.0 Q3+ 8.4 + 6.1 − 1.1 + 2.3 + 2.1 − 0.5 + 11.7 + 10.3 + 1.4 + 1.0 − 0.2 + 0.1 + 0.0 Q4
Short-term lending
+ 0.7 + 0.5 + 0.1 + 0.4 − 0.4 − 0.5 − 0.2 − 0.1 − 0.1 − 0.1 − 0.3 + 0.0 + 0.0 2017 Q4
+ 2.6 + 0.1 + 1.0 + 0.4 + 0.4 + 0.8 − 0.3 + 0.1 − 0.4 − 0.1 − 0.2 + 0.1 − 0.0 2018 Q1+ 3.7 + 0.6 + 2.3 − 0.2 − 0.2 − 0.1 + 0.1 + 0.1 + 0.0 + 0.0 − 0.0 − 0.2 − Q2− 0.0 + 0.6 + 0.1 − 0.4 + 0.1 − 0.0 + 0.5 + 0.1 + 0.4 − 0.1 + 0.1 + 0.0 + 0.0 Q3− 1.8 + 0.3 − 2.1 + 0.2 − 0.1 − 0.4 + 0.8 − 0.1 + 0.8 − 0.0 − 0.2 + 0.0 − 0.0 Q4
Medium-term lending
+ 1.4 + 0.3 + 0.2 − 0.0 − 0.3 + 0.0 + 1.0 − 0.2 + 1.2 + 1.2 − + 0.0 − 0.0 2017 Q4
+ 0.8 + 0.4 + 0.1 + 0.2 + 0.1 − 0.2 + 0.8 − 0.4 + 1.2 + 1.3 − − 0.0 + 0.0 2018 Q1+ 3.1 + 0.7 + 0.4 + 1.0 + 0.4 + 0.0 + 1.6 + 0.0 + 1.5 + 1.5 − − 0.0 + 0.0 Q2+ 2.8 + 0.8 + 0.2 + 0.8 + 0.2 + 0.0 + 1.0 + 0.3 + 0.7 + 0.6 − − 0.0 + 0.0 Q3+ 1.3 + 0.8 + 0.1 + 1.3 − 0.2 + 0.0 + 0.5 − 0.0 + 0.6 + 0.5 − + 0.0 − Q4
Long-term lending
+ 6.5 + 2.9 + 0.9 + 0.7 + 1.5 − 0.1 + 8.9 + 8.9 − 0.0 − 0.1 − + 0.0 − 0.0 2017 Q4
+ 7.7 + 2.0 + 0.8 + 2.3 + 3.0 − 0.1 + 7.0 + 6.6 + 0.4 + 0.6 − + 0.1 + 0.0 2018 Q1+ 7.7 + 3.6 + 0.6 + 1.4 + 3.5 + 0.1 + 12.3 + 11.0 + 1.3 + 1.6 − + 0.1 + 0.0 Q2+ 6.9 + 2.5 + 0.7 + 1.6 + 3.4 + 0.3 + 14.2 + 13.0 + 1.2 + 1.7 − + 0.1 − 0.0 Q3+ 8.9 + 5.0 + 0.9 + 0.8 + 2.4 − 0.2 + 10.4 + 10.4 + 0.0 + 0.4 − + 0.1 + 0.0 Q4
not specially marked. 1 Excluding fiduciary loans. 2 Including sole proprietors.3 Excluding mortgage loans and housing loans, even in the form of instalment credit.
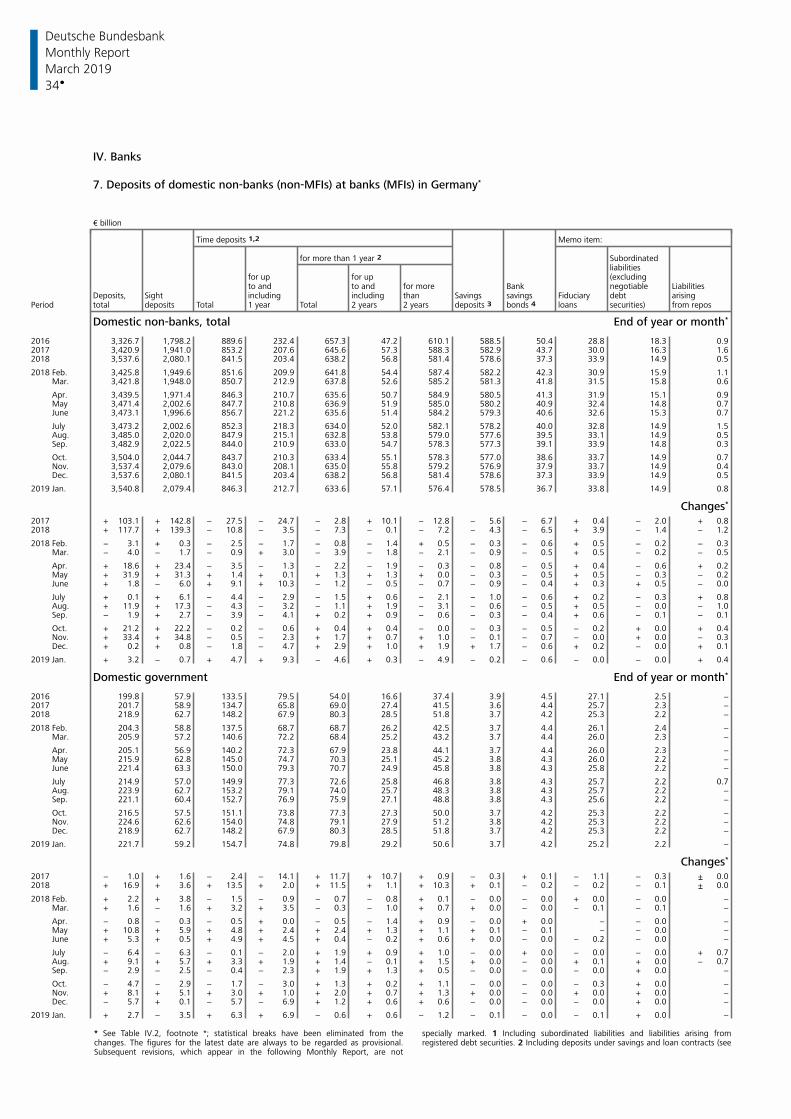
Deutsche Bundesbank
34
Monthly Report
March 2019
IV. Banks
7. Deposits of domestic non-banks (non-MFIs) at banks (MFIs) in Germany*
€ billion
Time deposits 1,2 Memo item:
for more than 1 year 2 Subordinated liabilities
for up for up (excludingto and to and for more Bank negotiable Liabilities
Deposits, Sight including including than Savings savings Fiduciary debt arisingPeriod total deposits Total 1 year Total 2 years 2 years bonds 4 loans securities) from reposdeposits 3
Domestic non-banks, total End of year or month*
2016 3,326.7 1,798.2 889.6 232.4 657.3 47.2 610.1 588.5 50.4 28.8 18.3 0.92017 3,420.9 1,941.0 853.2 207.6 645.6 57.3 588.3 582.9 43.7 30.0 16.3 1.62018 3,537.6 2,080.1 841.5 203.4 638.2 56.8 581.4 578.6 37.3 33.9 14.9 0.5
2018 Feb. 3,425.8 1,949.6 851.6 209.9 641.8 54.4 587.4 582.2 42.3 30.9 15.9 1.1 Mar. 3,421.8 1,948.0 850.7 212.9 637.8 52.6 585.2 581.3 41.8 31.5 15.8 0.6
Apr. 3,439.5 1,971.4 846.3 210.7 635.6 50.7 584.9 580.5 41.3 31.9 15.1 0.9 May 3,471.4 2,002.6 847.7 210.8 636.9 51.9 585.0 580.2 40.9 32.4 14.8 0.7 June 3,473.1 1,996.6 856.7 221.2 635.6 51.4 584.2 579.3 40.6 32.6 15.3 0.7
July 3,473.2 2,002.6 852.3 218.3 634.0 52.0 582.1 578.2 40.0 32.8 14.9 1.5 Aug. 3,485.0 2,020.0 847.9 215.1 632.8 53.8 579.0 577.6 39.5 33.1 14.9 0.5 Sep. 3,482.9 2,022.5 844.0 210.9 633.0 54.7 578.3 577.3 39.1 33.9 14.8 0.3
Oct. 3,504.0 2,044.7 843.7 210.3 633.4 55.1 578.3 577.0 38.6 33.7 14.9 0.7 Nov. 3,537.4 2,079.6 843.0 208.1 635.0 55.8 579.2 576.9 37.9 33.7 14.9 0.4 Dec. 3,537.6 2,080.1 841.5 203.4 638.2 56.8 581.4 578.6 37.3 33.9 14.9 0.5
2019 Jan. 3,540.8 2,079.4 846.3 212.7 633.6 57.1 576.4 578.5 36.7 33.8 14.9 0.8
Changes*
2017 + 103.1 + 142.8 − 27.5 − 24.7 − 2.8 + 10.1 − 12.8 − 5.6 − 6.7 + 0.4 − 2.0 + 0.82018 + 117.7 + 139.3 − 10.8 − 3.5 − 7.3 − 0.1 − 7.2 − 4.3 − 6.5 + 3.9 − 1.4 − 1.2
2018 Feb. − 3.1 + 0.3 − 2.5 − 1.7 − 0.8 − 1.4 + 0.5 − 0.3 − 0.6 + 0.5 − 0.2 − 0.3 Mar. − 4.0 − 1.7 − 0.9 + 3.0 − 3.9 − 1.8 − 2.1 − 0.9 − 0.5 + 0.5 − 0.2 − 0.5
Apr. + 18.6 + 23.4 − 3.5 − 1.3 − 2.2 − 1.9 − 0.3 − 0.8 − 0.5 + 0.4 − 0.6 + 0.2 May + 31.9 + 31.3 + 1.4 + 0.1 + 1.3 + 1.3 + 0.0 − 0.3 − 0.5 + 0.5 − 0.3 − 0.2 June + 1.8 − 6.0 + 9.1 + 10.3 − 1.2 − 0.5 − 0.7 − 0.9 − 0.4 + 0.3 + 0.5 − 0.0
July + 0.1 + 6.1 − 4.4 − 2.9 − 1.5 + 0.6 − 2.1 − 1.0 − 0.6 + 0.2 − 0.3 + 0.8 Aug. + 11.9 + 17.3 − 4.3 − 3.2 − 1.1 + 1.9 − 3.1 − 0.6 − 0.5 + 0.5 − 0.0 − 1.0 Sep. − 1.9 + 2.7 − 3.9 − 4.1 + 0.2 + 0.9 − 0.6 − 0.3 − 0.4 + 0.6 − 0.1 − 0.1
Oct. + 21.2 + 22.2 − 0.2 − 0.6 + 0.4 + 0.4 − 0.0 − 0.3 − 0.5 − 0.2 + 0.0 + 0.4 Nov. + 33.4 + 34.8 − 0.5 − 2.3 + 1.7 + 0.7 + 1.0 − 0.1 − 0.7 − 0.0 + 0.0 − 0.3 Dec. + 0.2 + 0.8 − 1.8 − 4.7 + 2.9 + 1.0 + 1.9 + 1.7 − 0.6 + 0.2 − 0.0 + 0.1
2019 Jan. + 3.2 − 0.7 + 4.7 + 9.3 − 4.6 + 0.3 − 4.9 − 0.2 − 0.6 − 0.0 − 0.0 + 0.4
Domestic government End of year or month*
2016 199.8 57.9 133.5 79.5 54.0 16.6 37.4 3.9 4.5 27.1 2.5 −2017 201.7 58.9 134.7 65.8 69.0 27.4 41.5 3.6 4.4 25.7 2.3 −2018 218.9 62.7 148.2 67.9 80.3 28.5 51.8 3.7 4.2 25.3 2.2 −
2018 Feb. 204.3 58.8 137.5 68.7 68.7 26.2 42.5 3.7 4.4 26.1 2.4 − Mar. 205.9 57.2 140.6 72.2 68.4 25.2 43.2 3.7 4.4 26.0 2.3 −
Apr. 205.1 56.9 140.2 72.3 67.9 23.8 44.1 3.7 4.4 26.0 2.3 − May 215.9 62.8 145.0 74.7 70.3 25.1 45.2 3.8 4.3 26.0 2.2 − June 221.4 63.3 150.0 79.3 70.7 24.9 45.8 3.8 4.3 25.8 2.2 −
July 214.9 57.0 149.9 77.3 72.6 25.8 46.8 3.8 4.3 25.7 2.2 0.7 Aug. 223.9 62.7 153.2 79.1 74.0 25.7 48.3 3.8 4.3 25.7 2.2 − Sep. 221.1 60.4 152.7 76.9 75.9 27.1 48.8 3.8 4.3 25.6 2.2 −
Oct. 216.5 57.5 151.1 73.8 77.3 27.3 50.0 3.7 4.2 25.3 2.2 − Nov. 224.6 62.6 154.0 74.8 79.1 27.9 51.2 3.8 4.2 25.3 2.2 − Dec. 218.9 62.7 148.2 67.9 80.3 28.5 51.8 3.7 4.2 25.3 2.2 −
2019 Jan. 221.7 59.2 154.7 74.8 79.8 29.2 50.6 3.7 4.2 25.2 2.2 −
Changes*
2017 − 1.0 + 1.6 − 2.4 − 14.1 + 11.7 + 10.7 + 0.9 − 0.3 + 0.1 − 1.1 − 0.3 + 0.02018 + 16.9 + 3.6 + 13.5 + 2.0 + 11.5 + 1.1 + 10.3 + 0.1 − 0.2 − 0.2 − 0.1 + 0.0
2018 Feb. + 2.2 + 3.8 − 1.5 − 0.9 − 0.7 − 0.8 + 0.1 − 0.0 − 0.0 + 0.0 − 0.0 − Mar. + 1.6 − 1.6 + 3.2 + 3.5 − 0.3 − 1.0 + 0.7 + 0.0 − 0.0 − 0.1 − 0.1 −
Apr. − 0.8 − 0.3 − 0.5 + 0.0 − 0.5 − 1.4 + 0.9 − 0.0 + 0.0 − − 0.0 − May + 10.8 + 5.9 + 4.8 + 2.4 + 2.4 + 1.3 + 1.1 + 0.1 − 0.1 − − 0.0 − June + 5.3 + 0.5 + 4.9 + 4.5 + 0.4 − 0.2 + 0.6 + 0.0 − 0.0 − 0.2 − 0.0 −
July − 6.4 − 6.3 − 0.1 − 2.0 + 1.9 + 0.9 + 1.0 − 0.0 + 0.0 − 0.0 − 0.0 + 0.7 Aug. + 9.1 + 5.7 + 3.3 + 1.9 + 1.4 − 0.1 + 1.5 + 0.0 − 0.0 + 0.1 + 0.0 − 0.7 Sep. − 2.9 − 2.5 − 0.4 − 2.3 + 1.9 + 1.3 + 0.5 − 0.0 − 0.0 − 0.0 + 0.0 −
Oct. − 4.7 − 2.9 − 1.7 − 3.0 + 1.3 + 0.2 + 1.1 − 0.0 − 0.0 − 0.3 + 0.0 − Nov. + 8.1 + 5.1 + 3.0 + 1.0 + 2.0 + 0.7 + 1.3 + 0.0 − 0.0 + 0.0 + 0.0 − Dec. − 5.7 + 0.1 − 5.7 − 6.9 + 1.2 + 0.6 + 0.6 − 0.0 − 0.0 − 0.0 + 0.0 −
2019 Jan. + 2.7 − 3.5 + 6.3 + 6.9 − 0.6 + 0.6 − 1.2 − 0.1 − 0.0 − 0.1 + 0.0 −
* See Table IV.2, footnote *; statistical breaks have been eliminated from the specially marked. 1 Including subordinated liabilities and liabilities arising fromchanges. The figures for the latest date are always to be regarded as provisional. registered debt securities. 2 Including deposits under savings and loan contracts (seeSubsequent revisions, which appear in the following Monthly Report, are not
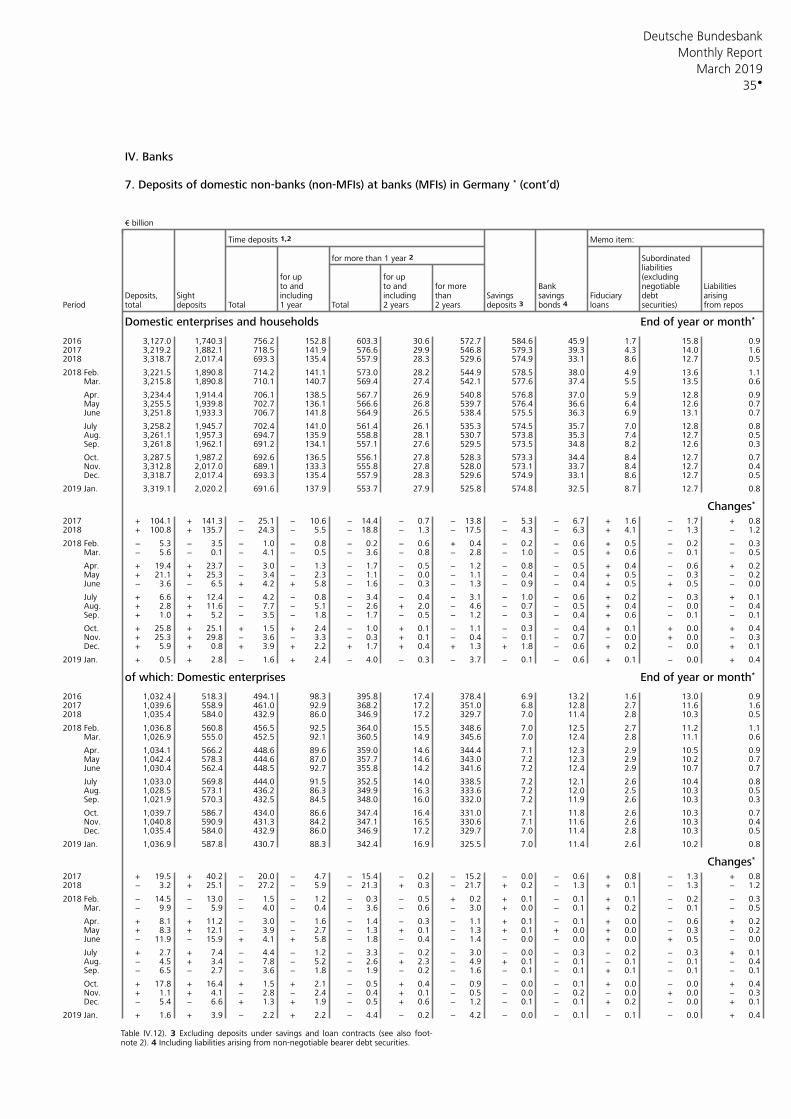
Deutsche Bundesbank
35
Monthly Report
March 2019
IV. Banks
7. Deposits of domestic non-banks (non-MFIs) at banks (MFIs) in Germany * (cont’d)
€ billion
Time deposits 1,2 Memo item:
for more than 1 year 2 Subordinated liabilities
for up for up (excludingto and to and for more Bank negotiable Liabilities
Deposits, Sight including including than Savings savings Fiduciary debt arisingPeriod total deposits Total 1 year Total 2 years 2 years bonds 4 loans securities) from reposdeposits 3
Domestic enterprises and households End of year or month*
2016 3,127.0 1,740.3 756.2 152.8 603.3 30.6 572.7 584.6 45.9 1.7 15.8 0.92017 3,219.2 1,882.1 718.5 141.9 576.6 29.9 546.8 579.3 39.3 4.3 14.0 1.62018 3,318.7 2,017.4 693.3 135.4 557.9 28.3 529.6 574.9 33.1 8.6 12.7 0.5
2018 Feb. 3,221.5 1,890.8 714.2 141.1 573.0 28.2 544.9 578.5 38.0 4.9 13.6 1.1 Mar. 3,215.8 1,890.8 710.1 140.7 569.4 27.4 542.1 577.6 37.4 5.5 13.5 0.6
Apr. 3,234.4 1,914.4 706.1 138.5 567.7 26.9 540.8 576.8 37.0 5.9 12.8 0.9 May 3,255.5 1,939.8 702.7 136.1 566.6 26.8 539.7 576.4 36.6 6.4 12.6 0.7 June 3,251.8 1,933.3 706.7 141.8 564.9 26.5 538.4 575.5 36.3 6.9 13.1 0.7
July 3,258.2 1,945.7 702.4 141.0 561.4 26.1 535.3 574.5 35.7 7.0 12.8 0.8 Aug. 3,261.1 1,957.3 694.7 135.9 558.8 28.1 530.7 573.8 35.3 7.4 12.7 0.5 Sep. 3,261.8 1,962.1 691.2 134.1 557.1 27.6 529.5 573.5 34.8 8.2 12.6 0.3
Oct. 3,287.5 1,987.2 692.6 136.5 556.1 27.8 528.3 573.3 34.4 8.4 12.7 0.7 Nov. 3,312.8 2,017.0 689.1 133.3 555.8 27.8 528.0 573.1 33.7 8.4 12.7 0.4 Dec. 3,318.7 2,017.4 693.3 135.4 557.9 28.3 529.6 574.9 33.1 8.6 12.7 0.5
2019 Jan. 3,319.1 2,020.2 691.6 137.9 553.7 27.9 525.8 574.8 32.5 8.7 12.7 0.8
Changes*
2017 + 104.1 + 141.3 − 25.1 − 10.6 − 14.4 − 0.7 − 13.8 − 5.3 − 6.7 + 1.6 − 1.7 + 0.82018 + 100.8 + 135.7 − 24.3 − 5.5 − 18.8 − 1.3 − 17.5 − 4.3 − 6.3 + 4.1 − 1.3 − 1.2
2018 Feb. − 5.3 − 3.5 − 1.0 − 0.8 − 0.2 − 0.6 + 0.4 − 0.2 − 0.6 + 0.5 − 0.2 − 0.3 Mar. − 5.6 − 0.1 − 4.1 − 0.5 − 3.6 − 0.8 − 2.8 − 1.0 − 0.5 + 0.6 − 0.1 − 0.5
Apr. + 19.4 + 23.7 − 3.0 − 1.3 − 1.7 − 0.5 − 1.2 − 0.8 − 0.5 + 0.4 − 0.6 + 0.2 May + 21.1 + 25.3 − 3.4 − 2.3 − 1.1 − 0.0 − 1.1 − 0.4 − 0.4 + 0.5 − 0.3 − 0.2 June − 3.6 − 6.5 + 4.2 + 5.8 − 1.6 − 0.3 − 1.3 − 0.9 − 0.4 + 0.5 + 0.5 − 0.0
July + 6.6 + 12.4 − 4.2 − 0.8 − 3.4 − 0.4 − 3.1 − 1.0 − 0.6 + 0.2 − 0.3 + 0.1 Aug. + 2.8 + 11.6 − 7.7 − 5.1 − 2.6 + 2.0 − 4.6 − 0.7 − 0.5 + 0.4 − 0.0 − 0.4 Sep. + 1.0 + 5.2 − 3.5 − 1.8 − 1.7 − 0.5 − 1.2 − 0.3 − 0.4 + 0.6 − 0.1 − 0.1
Oct. + 25.8 + 25.1 + 1.5 + 2.4 − 1.0 + 0.1 − 1.1 − 0.3 − 0.4 + 0.1 + 0.0 + 0.4 Nov. + 25.3 + 29.8 − 3.6 − 3.3 − 0.3 + 0.1 − 0.4 − 0.1 − 0.7 − 0.0 + 0.0 − 0.3 Dec. + 5.9 + 0.8 + 3.9 + 2.2 + 1.7 + 0.4 + 1.3 + 1.8 − 0.6 + 0.2 − 0.0 + 0.1
2019 Jan. + 0.5 + 2.8 − 1.6 + 2.4 − 4.0 − 0.3 − 3.7 − 0.1 − 0.6 + 0.1 − 0.0 + 0.4
of which: Domestic enterprises End of year or month*
2016 1,032.4 518.3 494.1 98.3 395.8 17.4 378.4 6.9 13.2 1.6 13.0 0.92017 1,039.6 558.9 461.0 92.9 368.2 17.2 351.0 6.8 12.8 2.7 11.6 1.62018 1,035.4 584.0 432.9 86.0 346.9 17.2 329.7 7.0 11.4 2.8 10.3 0.5
2018 Feb. 1,036.8 560.8 456.5 92.5 364.0 15.5 348.6 7.0 12.5 2.7 11.2 1.1 Mar. 1,026.9 555.0 452.5 92.1 360.5 14.9 345.6 7.0 12.4 2.8 11.1 0.6
Apr. 1,034.1 566.2 448.6 89.6 359.0 14.6 344.4 7.1 12.3 2.9 10.5 0.9 May 1,042.4 578.3 444.6 87.0 357.7 14.6 343.0 7.2 12.3 2.9 10.2 0.7 June 1,030.4 562.4 448.5 92.7 355.8 14.2 341.6 7.2 12.4 2.9 10.7 0.7
July 1,033.0 569.8 444.0 91.5 352.5 14.0 338.5 7.2 12.1 2.6 10.4 0.8 Aug. 1,028.5 573.1 436.2 86.3 349.9 16.3 333.6 7.2 12.0 2.5 10.3 0.5 Sep. 1,021.9 570.3 432.5 84.5 348.0 16.0 332.0 7.2 11.9 2.6 10.3 0.3
Oct. 1,039.7 586.7 434.0 86.6 347.4 16.4 331.0 7.1 11.8 2.6 10.3 0.7 Nov. 1,040.8 590.9 431.3 84.2 347.1 16.5 330.6 7.1 11.6 2.6 10.3 0.4 Dec. 1,035.4 584.0 432.9 86.0 346.9 17.2 329.7 7.0 11.4 2.8 10.3 0.5
2019 Jan. 1,036.9 587.8 430.7 88.3 342.4 16.9 325.5 7.0 11.4 2.6 10.2 0.8
Changes*
2017 + 19.5 + 40.2 − 20.0 − 4.7 − 15.4 − 0.2 − 15.2 − 0.0 − 0.6 + 0.8 − 1.3 + 0.82018 − 3.2 + 25.1 − 27.2 − 5.9 − 21.3 + 0.3 − 21.7 + 0.2 − 1.3 + 0.1 − 1.3 − 1.2
2018 Feb. − 14.5 − 13.0 − 1.5 − 1.2 − 0.3 − 0.5 + 0.2 + 0.1 − 0.1 + 0.1 − 0.2 − 0.3 Mar. − 9.9 − 5.9 − 4.0 − 0.4 − 3.6 − 0.6 − 3.0 + 0.0 − 0.1 + 0.2 − 0.1 − 0.5
Apr. + 8.1 + 11.2 − 3.0 − 1.6 − 1.4 − 0.3 − 1.1 + 0.1 − 0.1 + 0.0 − 0.6 + 0.2 May + 8.3 + 12.1 − 3.9 − 2.7 − 1.3 + 0.1 − 1.3 + 0.1 + 0.0 + 0.0 − 0.3 − 0.2 June − 11.9 − 15.9 + 4.1 + 5.8 − 1.8 − 0.4 − 1.4 − 0.0 − 0.0 + 0.0 + 0.5 − 0.0
July + 2.7 + 7.4 − 4.4 − 1.2 − 3.3 − 0.2 − 3.0 − 0.0 − 0.3 − 0.2 − 0.3 + 0.1 Aug. − 4.5 + 3.4 − 7.8 − 5.2 − 2.6 + 2.3 − 4.9 + 0.1 − 0.1 − 0.1 − 0.1 − 0.4 Sep. − 6.5 − 2.7 − 3.6 − 1.8 − 1.9 − 0.2 − 1.6 − 0.1 − 0.1 + 0.1 − 0.1 − 0.1
Oct. + 17.8 + 16.4 + 1.5 + 2.1 − 0.5 + 0.4 − 0.9 − 0.0 − 0.1 + 0.0 − 0.0 + 0.4 Nov. + 1.1 + 4.1 − 2.8 − 2.4 − 0.4 + 0.1 − 0.5 − 0.0 − 0.2 − 0.0 + 0.0 − 0.3 Dec. − 5.4 − 6.6 + 1.3 + 1.9 − 0.5 + 0.6 − 1.2 − 0.1 − 0.1 + 0.2 − 0.0 + 0.1
2019 Jan. + 1.6 + 3.9 − 2.2 + 2.2 − 4.4 − 0.2 − 4.2 − 0.0 − 0.1 − 0.1 − 0.0 + 0.4
Table IV.12). 3 Excluding deposits under savings and loan contracts (see also foot- note 2). 4 Including liabilities arising from non-negotiable bearer debt securities.
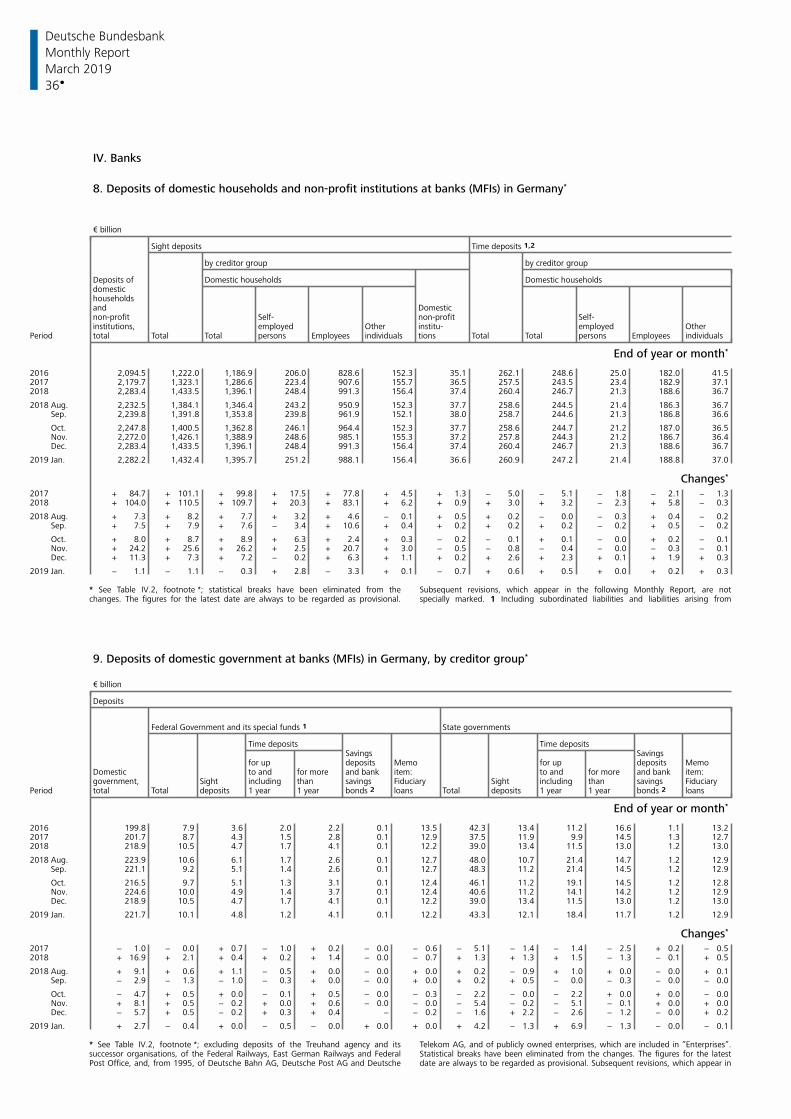
Deutsche Bundesbank
36
Monthly Report
March 2019
IV. Banks
8. Deposits of domestic households and non-profit institutions at banks (MFIs) in Germany*
€ billion
Sight deposits Time deposits 1,2
by creditor group by creditor group
Deposits of Domestic households Domestic householdsdomestichouseholdsand Domesticnon-profit Self- non-profit Self-
employed Other institu- employed Otherinstitutions,Period total Total Total persons Employees tions Total Total persons Employeesindividuals individuals
End of year or month*
2016 2,094.5 1,222.0 1,186.9 206.0 828.6 152.3 35.1 262.1 248.6 25.0 182.0 41.52017 2,179.7 1,323.1 1,286.6 223.4 907.6 155.7 36.5 257.5 243.5 23.4 182.9 37.12018 2,283.4 1,433.5 1,396.1 248.4 991.3 156.4 37.4 260.4 246.7 21.3 188.6 36.7
2018 Aug. 2,232.5 1,384.1 1,346.4 243.2 950.9 152.3 37.7 258.6 244.5 21.4 186.3 36.7 Sep. 2,239.8 1,391.8 1,353.8 239.8 961.9 152.1 38.0 258.7 244.6 21.3 186.8 36.6
Oct. 2,247.8 1,400.5 1,362.8 246.1 964.4 152.3 37.7 258.6 244.7 21.2 187.0 36.5 Nov. 2,272.0 1,426.1 1,388.9 248.6 985.1 155.3 37.2 257.8 244.3 21.2 186.7 36.4 Dec. 2,283.4 1,433.5 1,396.1 248.4 991.3 156.4 37.4 260.4 246.7 21.3 188.6 36.7
2019 Jan. 2,282.2 1,432.4 1,395.7 251.2 988.1 156.4 36.6 260.9 247.2 21.4 188.8 37.0
Changes*
2017 + 84.7 + 101.1 + 99.8 + 17.5 + 77.8 + 4.5 + 1.3 − 5.0 − 5.1 − 1.8 − 2.1 − 1.32018 + 104.0 + 110.5 + 109.7 + 20.3 + 83.1 + 6.2 + 0.9 + 3.0 + 3.2 − 2.3 + 5.8 − 0.3
2018 Aug. + 7.3 + 8.2 + 7.7 + 3.2 + 4.6 − 0.1 + 0.5 + 0.2 − 0.0 − 0.3 + 0.4 − 0.2 Sep. + 7.5 + 7.9 + 7.6 − 3.4 + 10.6 + 0.4 + 0.2 + 0.2 + 0.2 − 0.2 + 0.5 − 0.2
Oct. + 8.0 + 8.7 + 8.9 + 6.3 + 2.4 + 0.3 − 0.2 − 0.1 + 0.1 − 0.0 + 0.2 − 0.1 Nov. + 24.2 + 25.6 + 26.2 + 2.5 + 20.7 + 3.0 − 0.5 − 0.8 − 0.4 − 0.0 − 0.3 − 0.1 Dec. + 11.3 + 7.3 + 7.2 − 0.2 + 6.3 + 1.1 + 0.2 + 2.6 + 2.3 + 0.1 + 1.9 + 0.3
2019 Jan. − 1.1 − 1.1 − 0.3 + 2.8 − 3.3 + 0.1 − 0.7 + 0.6 + 0.5 + 0.0 + 0.2 + 0.3
* See Table IV.2, footnote *; statistical breaks have been eliminated from the Subsequent revisions, which appear in the following Monthly Report, are notchanges. The figures for the latest date are always to be regarded as provisional. specially marked. 1 Including subordinated liabilities and liabilities arising from
9. Deposits of domestic government at banks (MFIs) in Germany, by creditor group*
€ billion
Deposits
Federal Government and its special funds 1 State governments
Time deposits Time depositsSavings Savings
for up deposits Memo for up deposits MemoDomestic to and for more and bank item: to and for more and bank item:government, Sight including than savings Fiduciary Sight including than savings Fiduciary
Period total Total deposits 1 year 1 year bonds 2 loans Total deposits 1 year 1 year bonds 2 loans
End of year or month*
2016 199.8 7.9 3.6 2.0 2.2 0.1 13.5 42.3 13.4 11.2 16.6 1.1 13.22017 201.7 8.7 4.3 1.5 2.8 0.1 12.9 37.5 11.9 9.9 14.5 1.3 12.72018 218.9 10.5 4.7 1.7 4.1 0.1 12.2 39.0 13.4 11.5 13.0 1.2 13.0
2018 Aug. 223.9 10.6 6.1 1.7 2.6 0.1 12.7 48.0 10.7 21.4 14.7 1.2 12.9 Sep. 221.1 9.2 5.1 1.4 2.6 0.1 12.7 48.3 11.2 21.4 14.5 1.2 12.9
Oct. 216.5 9.7 5.1 1.3 3.1 0.1 12.4 46.1 11.2 19.1 14.5 1.2 12.8 Nov. 224.6 10.0 4.9 1.4 3.7 0.1 12.4 40.6 11.2 14.1 14.2 1.2 12.9 Dec. 218.9 10.5 4.7 1.7 4.1 0.1 12.2 39.0 13.4 11.5 13.0 1.2 13.0
2019 Jan. 221.7 10.1 4.8 1.2 4.1 0.1 12.2 43.3 12.1 18.4 11.7 1.2 12.9
Changes*
2017 − 1.0 − 0.0 + 0.7 − 1.0 + 0.2 − 0.0 − 0.6 − 5.1 − 1.4 − 1.4 − 2.5 + 0.2 − 0.52018 + 16.9 + 2.1 + 0.4 + 0.2 + 1.4 − 0.0 − 0.7 + 1.3 + 1.3 + 1.5 − 1.3 − 0.1 + 0.5
2018 Aug. + 9.1 + 0.6 + 1.1 − 0.5 + 0.0 − 0.0 + 0.0 + 0.2 − 0.9 + 1.0 + 0.0 − 0.0 + 0.1 Sep. − 2.9 − 1.3 − 1.0 − 0.3 + 0.0 − 0.0 + 0.0 + 0.2 + 0.5 − 0.0 − 0.3 − 0.0 − 0.0
Oct. − 4.7 + 0.5 + 0.0 − 0.1 + 0.5 − 0.0 − 0.3 − 2.2 − 0.0 − 2.2 + 0.0 + 0.0 − 0.0 Nov. + 8.1 + 0.5 − 0.2 + 0.0 + 0.6 − 0.0 − 0.0 − 5.4 − 0.2 − 5.1 − 0.1 + 0.0 + 0.0 Dec. − 5.7 + 0.5 − 0.2 + 0.3 + 0.4 − − 0.2 − 1.6 + 2.2 − 2.6 − 1.2 − 0.0 + 0.2
2019 Jan. + 2.7 − 0.4 + 0.0 − 0.5 − 0.0 + 0.0 + 0.0 + 4.2 − 1.3 + 6.9 − 1.3 − 0.0 − 0.1
* See Table IV.2, footnote *; excluding deposits of the Treuhand agency and its Telekom AG, and of publicly owned enterprises, which are included in ”Enterprises”.successor organisations, of the Federal Railways, East German Railways and Federal Statistical breaks have been eliminated from the changes. The figures for the latestPost Office, and, from 1995, of Deutsche Bahn AG, Deutsche Post AG and Deutsche date are always to be regarded as provisional. Subsequent revisions, which appear in
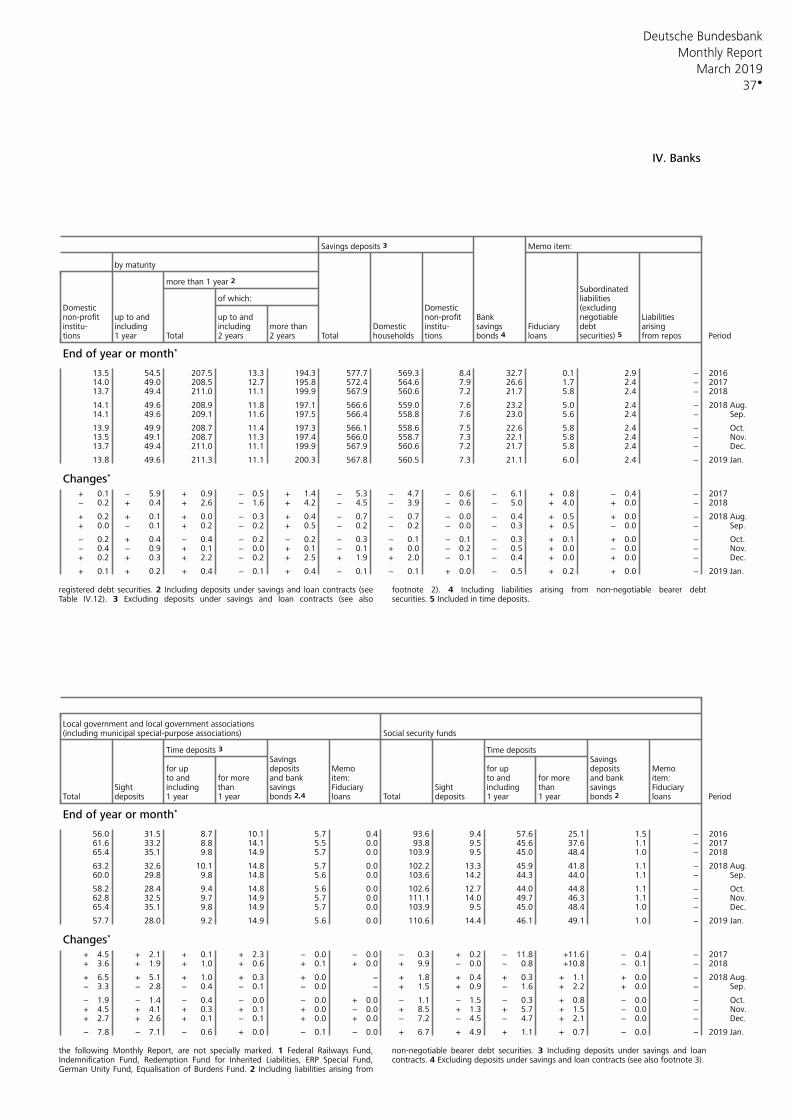
Deutsche Bundesbank
37
Monthly Report
March 2019
IV. Banks
Savings deposits 3 Memo item:
by maturity
more than 1 year 2 Subordinated
of which: liabilitiesDomestic Domestic (excluding
up to and up to and Bank negotiable Liabilitiesnon-profit non-profitinstitu- including including more than Domestic institu- savings Fiduciary debt arisingtions 1 year Total 2 years 2 years Total tions bonds 4 loans from repos Periodhouseholds securities) 5
End of year or month*
13.5 54.5 207.5 13.3 194.3 577.7 569.3 8.4 32.7 0.1 2.9 − 201614.0 49.0 208.5 12.7 195.8 572.4 564.6 7.9 26.6 1.7 2.4 − 201713.7 49.4 211.0 11.1 199.9 567.9 560.6 7.2 21.7 5.8 2.4 − 2018
14.1 49.6 208.9 11.8 197.1 566.6 559.0 7.6 23.2 5.0 2.4 − 2018 Aug.14.1 49.6 209.1 11.6 197.5 566.4 558.8 7.6 23.0 5.6 2.4 − Sep.
13.9 49.9 208.7 11.4 197.3 566.1 558.6 7.5 22.6 5.8 2.4 − Oct.13.5 49.1 208.7 11.3 197.4 566.0 558.7 7.3 22.1 5.8 2.4 − Nov.13.7 49.4 211.0 11.1 199.9 567.9 560.6 7.2 21.7 5.8 2.4 − Dec.
13.8 49.6 211.3 11.1 200.3 567.8 560.5 7.3 21.1 6.0 2.4 − 2019 Jan.
Changes*
+ 0.1 − 5.9 + 0.9 − 0.5 + 1.4 − 5.3 − 4.7 − 0.6 − 6.1 + 0.8 − 0.4 − 2017− 0.2 + 0.4 + 2.6 − 1.6 + 4.2 − 4.5 − 3.9 − 0.6 − 5.0 + 4.0 + 0.0 − 2018
+ 0.2 + 0.1 + 0.0 − 0.3 + 0.4 − 0.7 − 0.7 − 0.0 − 0.4 + 0.5 + 0.0 − 2018 Aug.+ 0.0 − 0.1 + 0.2 − 0.2 + 0.5 − 0.2 − 0.2 − 0.0 − 0.3 + 0.5 − 0.0 − Sep.
− 0.2 + 0.4 − 0.4 − 0.2 − 0.2 − 0.3 − 0.1 − 0.1 − 0.3 + 0.1 + 0.0 − Oct.− 0.4 − 0.9 + 0.1 − 0.0 + 0.1 − 0.1 + 0.0 − 0.2 − 0.5 + 0.0 − 0.0 − Nov.+ 0.2 + 0.3 + 2.2 − 0.2 + 2.5 + 1.9 + 2.0 − 0.1 − 0.4 + 0.0 + 0.0 − Dec.
+ 0.1 + 0.2 + 0.4 − 0.1 + 0.4 − 0.1 − 0.1 + 0.0 − 0.5 + 0.2 + 0.0 − 2019 Jan.
registered debt securities. 2 Including deposits under savings and loan contracts (see footnote 2). 4 Including liabilities arising from non-negotiable bearer debtTable IV.12). 3 Excluding deposits under savings and loan contracts (see also securities. 5 Included in time deposits.
Local government and local government associations(including municipal special-purpose associations) Social security funds
Time deposits 3 Time depositsSavings Savings
for up deposits Memo for up deposits Memoto and for more and bank item: to and for more and bank item:
Sight including than savings Fiduciary Sight including than savings FiduciaryTotal deposits 1 year 1 year bonds 2,4 loans Total deposits 1 year 1 year bonds 2 loans Period
End of year or month*
56.0 31.5 8.7 10.1 5.7 0.4 93.6 9.4 57.6 25.1 1.5 − 201661.6 33.2 8.8 14.1 5.5 0.0 93.8 9.5 45.6 37.6 1.1 − 201765.4 35.1 9.8 14.9 5.7 0.0 103.9 9.5 45.0 48.4 1.0 − 2018
63.2 32.6 10.1 14.8 5.7 0.0 102.2 13.3 45.9 41.8 1.1 − 2018 Aug.60.0 29.8 9.8 14.8 5.6 0.0 103.6 14.2 44.3 44.0 1.1 − Sep.
58.2 28.4 9.4 14.8 5.6 0.0 102.6 12.7 44.0 44.8 1.1 − Oct.62.8 32.5 9.7 14.9 5.7 0.0 111.1 14.0 49.7 46.3 1.1 − Nov.65.4 35.1 9.8 14.9 5.7 0.0 103.9 9.5 45.0 48.4 1.0 − Dec.
57.7 28.0 9.2 14.9 5.6 0.0 110.6 14.4 46.1 49.1 1.0 − 2019 Jan.
Changes*
+ 4.5 + 2.1 + 0.1 + 2.3 − 0.0 − 0.0 − 0.3 + 0.2 − 11.8 +11.6 − 0.4 − 2017+ 3.6 + 1.9 + 1.0 + 0.6 + 0.1 + 0.0 + 9.9 − 0.0 − 0.8 +10.8 − 0.1 − 2018
+ 6.5 + 5.1 + 1.0 + 0.3 + 0.0 − + 1.8 + 0.4 + 0.3 + 1.1 + 0.0 − 2018 Aug.− 3.3 − 2.8 − 0.4 − 0.1 − 0.0 − + 1.5 + 0.9 − 1.6 + 2.2 + 0.0 − Sep.
− 1.9 − 1.4 − 0.4 − 0.0 − 0.0 + 0.0 − 1.1 − 1.5 − 0.3 + 0.8 − 0.0 − Oct.+ 4.5 + 4.1 + 0.3 + 0.1 + 0.0 − 0.0 + 8.5 + 1.3 + 5.7 + 1.5 − 0.0 − Nov.+ 2.7 + 2.6 + 0.1 − 0.1 + 0.0 + 0.0 − 7.2 − 4.5 − 4.7 + 2.1 − 0.0 − Dec.
− 7.8 − 7.1 − 0.6 + 0.0 − 0.1 − 0.0 + 6.7 + 4.9 + 1.1 + 0.7 − 0.0 − 2019 Jan.
the following Monthly Report, are not specially marked. 1 Federal Railways Fund, non-negotiable bearer debt securities. 3 Including deposits under savings and loanIndemnification Fund, Redemption Fund for Inherited Liabilities, ERP Special Fund, contracts. 4 Excluding deposits under savings and loan contracts (see also footnote 3). German Unity Fund, Equalisation of Burdens Fund. 2 Including liabilities arising from
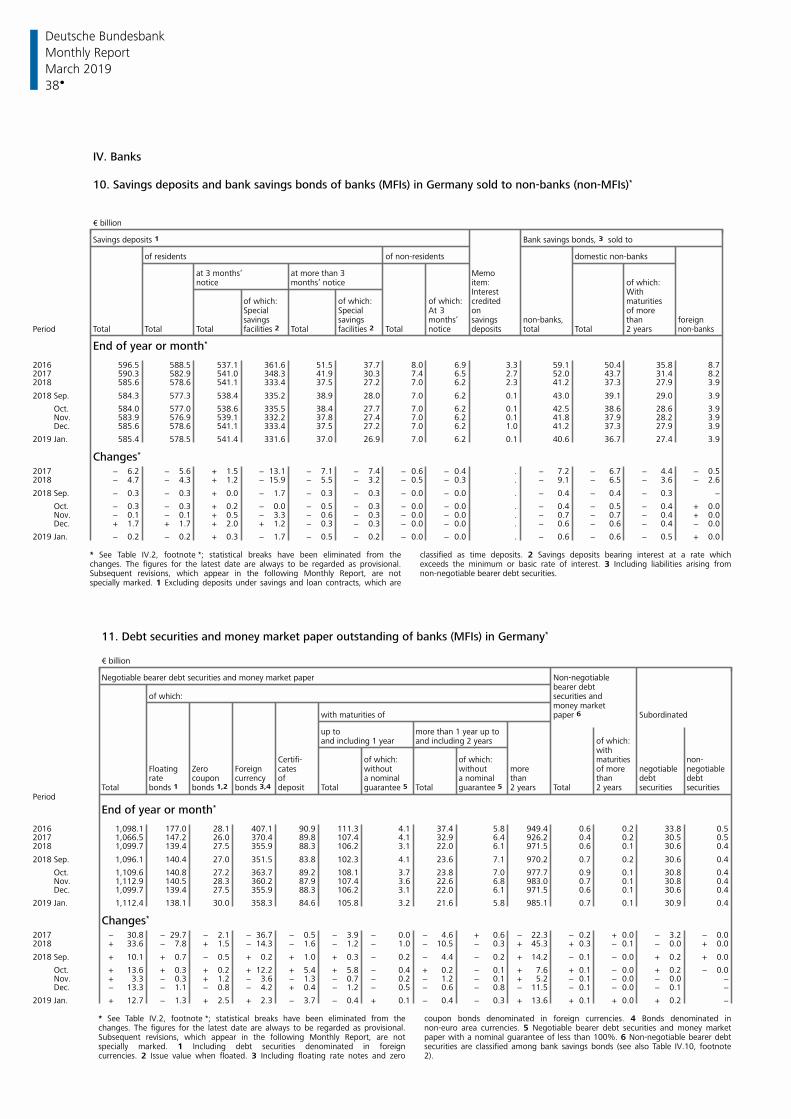
Deutsche Bundesbank
38
Monthly Report
March 2019
IV. Banks
10. Savings deposits and bank savings bonds of banks (MFIs) in Germany sold to non-banks (non-MFIs)*
€ billion
Savings deposits 1 Bank savings bonds, 3 sold to
of residents of non-residents domestic non-banks
at 3 months’ at more than 3 Memonotice months’ notice item: of which:
Interest Withof which: of which: of which: credited maturitiesSpecial Special At 3 on of moresavings savings savings non-banks, than foreignmonths’
Period Total Total Total Total Total notice deposits total Total 2 yearsfacilities 2 facilities 2 non-banks
End of year or month*
2016 596.5 588.5 537.1 361.6 51.5 37.7 8.0 6.9 3.3 59.1 50.4 35.8 8.72017 590.3 582.9 541.0 348.3 41.9 30.3 7.4 6.5 2.7 52.0 43.7 31.4 8.22018 585.6 578.6 541.1 333.4 37.5 27.2 7.0 6.2 2.3 41.2 37.3 27.9 3.9
2018 Sep. 584.3 577.3 538.4 335.2 38.9 28.0 7.0 6.2 0.1 43.0 39.1 29.0 3.9
Oct. 584.0 577.0 538.6 335.5 38.4 27.7 7.0 6.2 0.1 42.5 38.6 28.6 3.9 Nov. 583.9 576.9 539.1 332.2 37.8 27.4 7.0 6.2 0.1 41.8 37.9 28.2 3.9 Dec. 585.6 578.6 541.1 333.4 37.5 27.2 7.0 6.2 1.0 41.2 37.3 27.9 3.9
2019 Jan. 585.4 578.5 541.4 331.6 37.0 26.9 7.0 6.2 0.1 40.6 36.7 27.4 3.9
Changes*
2017 − 6.2 − 5.6 + 1.5 − 13.1 − 7.1 − 7.4 − 0.6 − 0.4 . − 7.2 − 6.7 − 4.4 − 0.52018 − 4.7 − 4.3 + 1.2 − 15.9 − 5.5 − 3.2 − 0.5 − 0.3 . − 9.1 − 6.5 − 3.6 − 2.6
2018 Sep. − 0.3 − 0.3 + 0.0 − 1.7 − 0.3 − 0.3 − 0.0 − 0.0 . − 0.4 − 0.4 − 0.3 −
Oct. − 0.3 − 0.3 + 0.2 − 0.0 − 0.5 − 0.3 − 0.0 − 0.0 . − 0.4 − 0.5 − 0.4 + 0.0 Nov. − 0.1 − 0.1 + 0.5 − 3.3 − 0.6 − 0.3 − 0.0 − 0.0 . − 0.7 − 0.7 − 0.4 + 0.0 Dec. + 1.7 + 1.7 + 2.0 + 1.2 − 0.3 − 0.3 − 0.0 − 0.0 . − 0.6 − 0.6 − 0.4 − 0.0
2019 Jan. − 0.2 − 0.2 + 0.3 − 1.7 − 0.5 − 0.2 − 0.0 − 0.0 . − 0.6 − 0.6 − 0.5 + 0.0
* See Table IV.2, footnote *; statistical breaks have been eliminated from the classified as time deposits. 2 Savings deposits bearing interest at a rate whichchanges. The figures for the latest date are always to be regarded as provisional. exceeds the minimum or basic rate of interest. 3 Including liabilities arising fromSubsequent revisions, which appear in the following Monthly Report, are not non-negotiable bearer debt securities. specially marked. 1 Excluding deposits under savings and loan contracts, which are
11. Debt securities and money market paper outstanding of banks (MFIs) in Germany*
€ billion
Negotiable bearer debt securities and money market paper Non-negotiablebearer debt
of which: securities andmoney market
with maturities of paper 6 Subordinated
up to more than 1 year up toand including 1 year and including 2 years of which:
withCertifi- of which: of which: non-maturities
Floating Zero Foreign cates without without more of more negotiable negotiablerate coupon currency of a nominal a nominal than than debt debt
Total bonds 1 deposit Total Total 2 years Total 2 years securities securitiesbonds 1,2 bonds 3,4 guarantee 5 guarantee 5 Period
End of year or month*
2016 1,098.1 177.0 28.1 407.1 90.9 111.3 4.1 37.4 5.8 949.4 0.6 0.2 33.8 0.52017 1,066.5 147.2 26.0 370.4 89.8 107.4 4.1 32.9 6.4 926.2 0.4 0.2 30.5 0.52018 1,099.7 139.4 27.5 355.9 88.3 106.2 3.1 22.0 6.1 971.5 0.6 0.1 30.6 0.4
2018 Sep. 1,096.1 140.4 27.0 351.5 83.8 102.3 4.1 23.6 7.1 970.2 0.7 0.2 30.6 0.4
Oct. 1,109.6 140.8 27.2 363.7 89.2 108.1 3.7 23.8 7.0 977.7 0.9 0.1 30.8 0.4 Nov. 1,112.9 140.5 28.3 360.2 87.9 107.4 3.6 22.6 6.8 983.0 0.7 0.1 30.8 0.4 Dec. 1,099.7 139.4 27.5 355.9 88.3 106.2 3.1 22.0 6.1 971.5 0.6 0.1 30.6 0.4
2019 Jan. 1,112.4 138.1 30.0 358.3 84.6 105.8 3.2 21.6 5.8 985.1 0.7 0.1 30.9 0.4
Changes*
2017 − 30.8 − 29.7 − 2.1 − 36.7 − 0.5 − 3.9 − 0.0 − 4.6 + 0.6 − 22.3 − 0.2 + 0.0 − 3.2 − 0.02018 + 33.6 − 7.8 + 1.5 − 14.3 − 1.6 − 1.2 − 1.0 − 10.5 − 0.3 + 45.3 + 0.3 − 0.1 − 0.0 + 0.0
2018 Sep. + 10.1 + 0.7 − 0.5 + 0.2 + 1.0 + 0.3 − 0.2 − 4.4 − 0.2 + 14.2 − 0.1 − 0.0 + 0.2 + 0.0
Oct. + 13.6 + 0.3 + 0.2 + 12.2 + 5.4 + 5.8 − 0.4 + 0.2 − 0.1 + 7.6 + 0.1 − 0.0 + 0.2 − 0.0 Nov. + 3.3 − 0.3 + 1.2 − 3.6 − 1.3 − 0.7 − 0.2 − 1.2 − 0.1 + 5.2 − 0.1 − 0.0 − 0.0 − Dec. − 13.3 − 1.1 − 0.8 − 4.2 + 0.4 − 1.2 − 0.5 − 0.6 − 0.8 − 11.5 − 0.1 − 0.0 − 0.1 −
2019 Jan. + 12.7 − 1.3 + 2.5 + 2.3 − 3.7 − 0.4 + 0.1 − 0.4 − 0.3 + 13.6 + 0.1 + 0.0 + 0.2 −
* See Table IV.2, footnote *; statistical breaks have been eliminated from the coupon bonds denominated in foreign currencies. 4 Bonds denominated inchanges. The figures for the latest date are always to be regarded as provisional. non-euro area currencies. 5 Negotiable bearer debt securities and money marketSubsequent revisions, which appear in the following Monthly Report, are not paper with a nominal guarantee of less than 100%. 6 Non-negotiable bearer debtspecially marked. 1 Including debt securities denominated in foreign securities are classified among bank savings bonds (see also Table IV.10, footnotecurrencies. 2 Issue value when floated. 3 Including floating rate notes and zero 2).
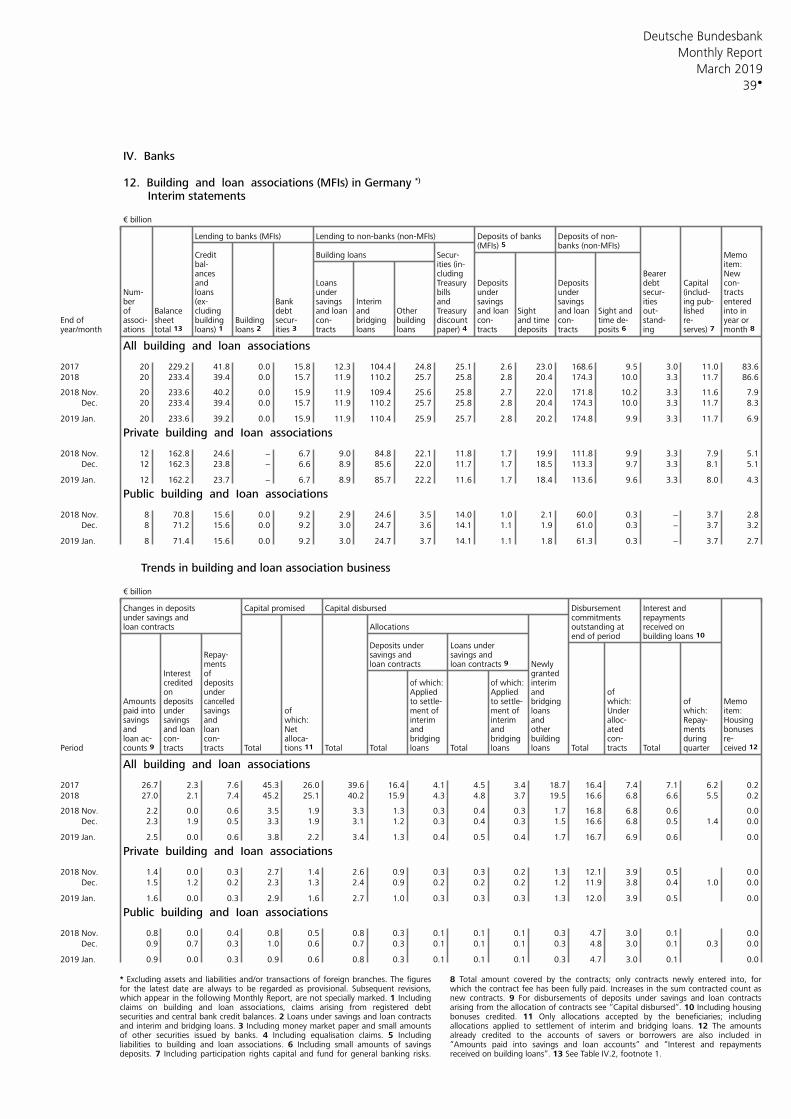
Deutsche Bundesbank
39
Monthly Report
March 2019
IV. Banks 12. Building and loan associations (MFIs) in Germany *)
Interim statements € billion
Lending to banks (MFIs) Lending to non-banks (non-MFIs) Deposits of banks Deposits of non-(MFIs) 5 banks (non-MFIs)
Credit Building loans Secur- Memobal- item:ities (in-ances cluding Bearer Newand Loans Treasury Deposits Deposits debt Capital con-
Num- loans under bills under under secur- (includ- tractsber (ex- Bank savings Interim and savings savings ities ing pub- enteredof Balance cluding debt and loan and Other Treasury and loan Sight and loan Sight and out- lished into in
End of sheet building Building secur- con- bridging building discount con- and time con- time de- stand- re- year orassoci-year/month ations loans 2 ities 3 tracts loans loans tracts deposits tracts posits 6 ing month 8 total 13 loans) 1 paper) 4 serves) 7
All building and loan associations
2017 20 229.2 41.8 0.0 15.8 12.3 104.4 24.8 25.1 2.6 23.0 168.6 9.5 3.0 11.0 83.6
2018 20 233.4 39.4 0.0 15.7 11.9 110.2 25.7 25.8 2.8 20.4 174.3 10.0 3.3 11.7 86.6
2018 Nov. 20 233.6 40.2 0.0 15.9 11.9 109.4 25.6 25.8 2.7 22.0 171.8 10.2 3.3 11.6 7.9
Dec. 20 233.4 39.4 0.0 15.7 11.9 110.2 25.7 25.8 2.8 20.4 174.3 10.0 3.3 11.7 8.3
2019 Jan. 20 233.6 39.2 0.0 15.9 11.9 110.4 25.9 25.7 2.8 20.2 174.8 9.9 3.3 11.7 6.9
Private building and Ioan associations
2018 Nov. 12 162.8 24.6 − 6.7 9.0 84.8 22.1 11.8 1.7 19.9 111.8 9.9 3.3 7.9 5.1
Dec. 12 162.3 23.8 − 6.6 8.9 85.6 22.0 11.7 1.7 18.5 113.3 9.7 3.3 8.1 5.1
2019 Jan. 12 162.2 23.7 − 6.7 8.9 85.7 22.2 11.6 1.7 18.4 113.6 9.6 3.3 8.0 4.3
Public building and Ioan associations
2018 Nov. 8 70.8 15.6 0.0 9.2 2.9 24.6 3.5 14.0 1.0 2.1 60.0 0.3 − 3.7 2.8
Dec. 8 71.2 15.6 0.0 9.2 3.0 24.7 3.6 14.1 1.1 1.9 61.0 0.3 − 3.7 3.2
2019 Jan. 8 71.4 15.6 0.0 9.2 3.0 24.7 3.7 14.1 1.1 1.8 61.3 0.3 − 3.7 2.7
Trends in building and loan association business
€ billion
Changes in deposits Capital promised Capital disbursed Disbursement Interest andunder savings and commitments repaymentsloan contracts Allocations outstanding at received on
end of period building loans 10 Deposits under Loans under
Repay- savings and savings andments loan contracts loan contracts 9 Newly
Interest of grantedcredited deposits interimof which: of which:on under Applied Applied and of
Amounts deposits bridging which: of Memocancelled to settle- to settle-under savings of ment of ment of loans Under which: item:paid into
savings savings and which: interim interim and alloc- Repay- Housingand and loan loan Net and and other ated ments bonusesloan ac- con- con- alloca- bridging bridging building con- during re-
Period tracts tracts Total Total Total loans Total loans loans Total tracts Total quartercounts 9 tions 11 ceived 12
All building and loan associations
2017 26.7 2.3 7.6 45.3 26.0 39.6 16.4 4.1 4.5 3.4 18.7 16.4 7.4 7.1 6.2 0.2
2018 27.0 2.1 7.4 45.2 25.1 40.2 15.9 4.3 4.8 3.7 19.5 16.6 6.8 6.6 5.5 0.2
2018 Nov. 2.2 0.0 0.6 3.5 1.9 3.3 1.3 0.3 0.4 0.3 1.7 16.8 6.8 0.6 0.0
Dec. 2.3 1.9 0.5 3.3 1.9 3.1 1.2 0.3 0.4 0.3 1.5 16.6 6.8 0.5 1.4 0.0
2019 Jan. 2.5 0.0 0.6 3.8 2.2 3.4 1.3 0.4 0.5 0.4 1.7 16.7 6.9 0.6 0.0
Private building and Ioan associations
2018 Nov. 1.4 0.0 0.3 2.7 1.4 2.6 0.9 0.3 0.3 0.2 1.3 12.1 3.9 0.5 0.0
Dec. 1.5 1.2 0.2 2.3 1.3 2.4 0.9 0.2 0.2 0.2 1.2 11.9 3.8 0.4 1.0 0.0
2019 Jan. 1.6 0.0 0.3 2.9 1.6 2.7 1.0 0.3 0.3 0.3 1.3 12.0 3.9 0.5 0.0
Public building and Ioan associations
2018 Nov. 0.8 0.0 0.4 0.8 0.5 0.8 0.3 0.1 0.1 0.1 0.3 4.7 3.0 0.1 0.0
Dec. 0.9 0.7 0.3 1.0 0.6 0.7 0.3 0.1 0.1 0.1 0.3 4.8 3.0 0.1 0.3 0.0
2019 Jan. 0.9 0.0 0.3 0.9 0.6 0.8 0.3 0.1 0.1 0.1 0.3 4.7 3.0 0.1 0.0
* Excluding assets and liabilities and/or transactions of foreign branches. The figures 8 Total amount covered by the contracts; only contracts newly entered into, forfor the latest date are always to be regarded as provisional. Subsequent revisions, which the contract fee has been fully paid. Increases in the sum contracted count aswhich appear in the following Monthly Report, are not specially marked. 1 Including new contracts. 9 For disbursements of deposits under savings and loan contractsclaims on building and loan associations, claims arising from registered debt arising from the allocation of contracts see “Capital disbursed“. 10 Including housingsecurities and central bank credit balances. 2 Loans under savings and loan contracts bonuses credited. 11 Only allocations accepted by the beneficiaries; includingand interim and bridging loans. 3 Including money market paper and small amounts allocations applied to settlement of interim and bridging loans. 12 The amountsof other securities issued by banks. 4 Including equalisation claims. 5 Including already credited to the accounts of savers or borrowers are also included inliabilities to building and loan associations. 6 Including small amounts of savings “Amounts paid into savings and loan accounts“ and “Interest and repaymentsdeposits. 7 Including participation rights capital and fund for general banking risks. received on building loans“. 13 See Table IV.2, footnote 1.
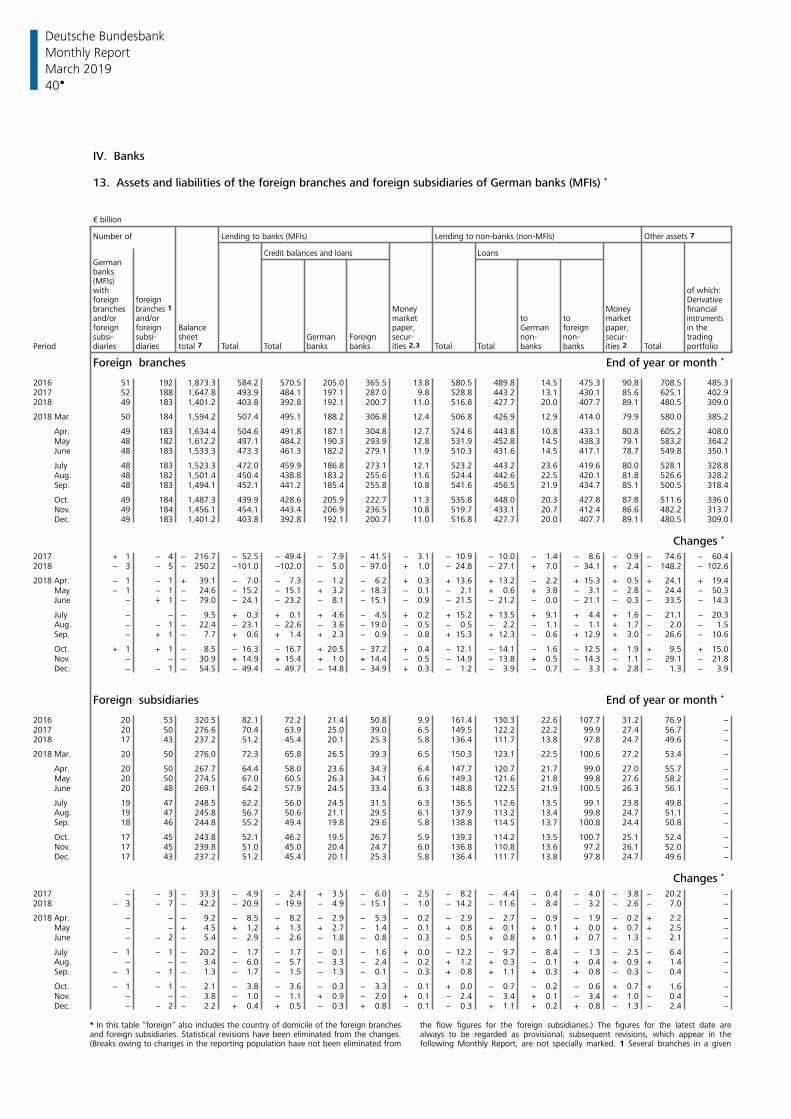
Deutsche Bundesbank
40
Monthly Report
March 2019
IV. Banks
13. Assets and liabilities of the foreign branches and foreign subsidiaries of German banks (MFIs) *
€ billion
Number of Lending to banks (MFIs) Lending to non-banks (non-MFIs) Other assets 7
LoansCredit balances and loansGerman banks(MFIs) with of which:foreign foreign Derivativebranches Money Money financialbranches 1 and/or and/or market to to market instrumentsforeign foreign Balance paper, German foreign paper, in thesubsi- subsi- sheet German Foreign secur- non- non- secur- trading
Period diaries diaries total 7 Total Total banks banks Total Total banks banks ities 2 Total portfolioities 2,3
Foreign branches End of year or month *
2016 51 192 1,873.3 584.2 570.5 205.0 365.5 13.8 580.5 489.8 14.5 475.3 90.8 708.5 485.32017 52 188 1,647.8 493.9 484.1 197.1 287.0 9.8 528.8 443.2 13.1 430.1 85.6 625.1 402.92018 49 183 1,401.2 403.8 392.8 192.1 200.7 11.0 516.8 427.7 20.0 407.7 89.1 480.5 309.0
2018 Mar. 50 184 1,594.2 507.4 495.1 188.2 306.8 12.4 506.8 426.9 12.9 414.0 79.9 580.0 385.2
Apr. 49 183 1,634.4 504.6 491.8 187.1 304.8 12.7 524.6 443.8 10.8 433.1 80.8 605.2 408.0 May 48 182 1,612.2 497.1 484.2 190.3 293.9 12.8 531.9 452.8 14.5 438.3 79.1 583.2 364.2 June 48 183 1,533.3 473.3 461.3 182.2 279.1 11.9 510.3 431.6 14.5 417.1 78.7 549.8 350.1
July 48 183 1,523.3 472.0 459.9 186.8 273.1 12.1 523.2 443.2 23.6 419.6 80.0 528.1 328.8 Aug. 48 182 1,501.4 450.4 438.8 183.2 255.6 11.6 524.4 442.6 22.5 420.1 81.8 526.6 328.2 Sep. 48 183 1,494.1 452.1 441.2 185.4 255.8 10.8 541.6 456.5 21.9 434.7 85.1 500.5 318.4
Oct. 49 184 1,487.3 439.9 428.6 205.9 222.7 11.3 535.8 448.0 20.3 427.8 87.8 511.6 336.0 Nov. 49 184 1,456.1 454.1 443.4 206.9 236.5 10.8 519.7 433.1 20.7 412.4 86.6 482.2 313.7 Dec. 49 183 1,401.2 403.8 392.8 192.1 200.7 11.0 516.8 427.7 20.0 407.7 89.1 480.5 309.0
Changes *
2017 + 1 − 4 − 216.7 − 52.5 − 49.4 − 7.9 − 41.5 − 3.1 − 10.9 − 10.0 − 1.4 − 8.6 − 0.9 − 74.6 − 60.42018 − 3 − 5 − 250.2 −101.0 −102.0 − 5.0 − 97.0 + 1.0 − 24.8 − 27.1 + 7.0 − 34.1 + 2.4 − 148.2 − 102.6
2018 Apr. − 1 − 1 + 39.1 − 7.0 − 7.3 − 1.2 − 6.2 + 0.3 + 13.6 + 13.2 − 2.2 + 15.3 + 0.5 + 24.1 + 19.4 May − 1 − 1 − 24.6 − 15.2 − 15.1 + 3.2 − 18.3 − 0.1 − 2.1 + 0.6 + 3.8 − 3.1 − 2.8 − 24.4 − 50.3 June − + 1 − 79.0 − 24.1 − 23.2 − 8.1 − 15.1 − 0.9 − 21.5 − 21.2 − 0.0 − 21.1 − 0.3 − 33.5 − 14.3
July − − − 9.5 + 0.3 + 0.1 + 4.6 − 4.5 + 0.2 + 15.2 + 13.5 + 9.1 + 4.4 + 1.6 − 21.1 − 20.3 Aug. − − 1 − 22.4 − 23.1 − 22.6 − 3.6 − 19.0 − 0.5 − 0.5 − 2.2 − 1.1 − 1.1 + 1.7 − 2.0 − 1.5 Sep. − + 1 − 7.7 + 0.6 + 1.4 + 2.3 − 0.9 − 0.8 + 15.3 + 12.3 − 0.6 + 12.9 + 3.0 − 26.6 − 10.6
Oct. + 1 + 1 − 8.5 − 16.3 − 16.7 + 20.5 − 37.2 + 0.4 − 12.1 − 14.1 − 1.6 − 12.5 + 1.9 + 9.5 + 15.0 Nov. − − − 30.9 + 14.9 + 15.4 + 1.0 + 14.4 − 0.5 − 14.9 − 13.8 + 0.5 − 14.3 − 1.1 − 29.1 − 21.8 Dec. − − 1 − 54.5 − 49.4 − 49.7 − 14.8 − 34.9 + 0.3 − 1.2 − 3.9 − 0.7 − 3.3 + 2.8 − 1.3 − 3.9
Foreign subsidiaries End of year or month *
2016 20 53 320.5 82.1 72.2 21.4 50.8 9.9 161.4 130.3 22.6 107.7 31.2 76.9 −2017 20 50 276.6 70.4 63.9 25.0 39.0 6.5 149.5 122.2 22.2 99.9 27.4 56.7 −2018 17 43 237.2 51.2 45.4 20.1 25.3 5.8 136.4 111.7 13.8 97.8 24.7 49.6 −
2018 Mar. 20 50 276.0 72.3 65.8 26.5 39.3 6.5 150.3 123.1 22.5 100.6 27.2 53.4 −
Apr. 20 50 267.7 64.4 58.0 23.6 34.3 6.4 147.7 120.7 21.7 99.0 27.0 55.7 − May 20 50 274.5 67.0 60.5 26.3 34.1 6.6 149.3 121.6 21.8 99.8 27.6 58.2 − June 20 48 269.1 64.2 57.9 24.5 33.4 6.3 148.8 122.5 21.9 100.5 26.3 56.1 −
July 19 47 248.5 62.2 56.0 24.5 31.5 6.3 136.5 112.6 13.5 99.1 23.8 49.8 − Aug. 19 47 245.8 56.7 50.6 21.1 29.5 6.1 137.9 113.2 13.4 99.8 24.7 51.1 − Sep. 18 46 244.8 55.2 49.4 19.8 29.6 5.8 138.8 114.5 13.7 100.8 24.4 50.8 −
Oct. 17 45 243.8 52.1 46.2 19.5 26.7 5.9 139.3 114.2 13.5 100.7 25.1 52.4 − Nov. 17 45 239.8 51.0 45.0 20.4 24.7 6.0 136.8 110.8 13.6 97.2 26.1 52.0 − Dec. 17 43 237.2 51.2 45.4 20.1 25.3 5.8 136.4 111.7 13.8 97.8 24.7 49.6 −
Changes *
2017 − − 3 − 33.3 − 4.9 − 2.4 + 3.5 − 6.0 − 2.5 − 8.2 − 4.4 − 0.4 − 4.0 − 3.8 − 20.2 −2018 − 3 − 7 − 42.2 − 20.9 − 19.9 − 4.9 − 15.1 − 1.0 − 14.2 − 11.6 − 8.4 − 3.2 − 2.6 − 7.0 −
2018 Apr. − − − 9.2 − 8.5 − 8.2 − 2.9 − 5.3 − 0.2 − 2.9 − 2.7 − 0.9 − 1.9 − 0.2 + 2.2 − May − − + 4.5 + 1.2 + 1.3 + 2.7 − 1.4 − 0.1 + 0.8 + 0.1 + 0.1 + 0.0 + 0.7 + 2.5 − June − − 2 − 5.4 − 2.9 − 2.6 − 1.8 − 0.8 − 0.3 − 0.5 + 0.8 + 0.1 + 0.7 − 1.3 − 2.1 −
July − 1 − 1 − 20.2 − 1.7 − 1.7 − 0.1 − 1.6 + 0.0 − 12.2 − 9.7 − 8.4 − 1.3 − 2.5 − 6.4 − Aug. − − − 3.4 − 6.0 − 5.7 − 3.3 − 2.4 − 0.2 + 1.2 + 0.3 − 0.1 + 0.4 + 0.9 + 1.4 − Sep. − 1 − 1 − 1.3 − 1.7 − 1.5 − 1.3 − 0.1 − 0.3 + 0.8 + 1.1 + 0.3 + 0.8 − 0.3 − 0.4 −
Oct. − 1 − 1 − 2.1 − 3.8 − 3.6 − 0.3 − 3.3 − 0.1 + 0.0 − 0.7 − 0.2 − 0.6 + 0.7 + 1.6 − Nov. − − − 3.8 − 1.0 − 1.1 + 0.9 − 2.0 + 0.1 − 2.4 − 3.4 + 0.1 − 3.4 + 1.0 − 0.4 − Dec. − − 2 − 2.2 + 0.4 + 0.5 − 0.3 + 0.8 − 0.1 − 0.3 + 1.1 + 0.2 + 0.8 − 1.3 − 2.4 −
* In this table “foreign“ also includes the country of domicile of the foreign branches the flow figures for the foreign subsidiaries.) The figures for the latest date areand foreign subsidiaries. Statistical revisions have been eliminated from the changes. always to be regarded as provisional; subsequent revisions, which appear in the(Breaks owing to changes in the reporting population have not been eliminated from following Monthly Report, are not specially marked. 1 Several branches in a given
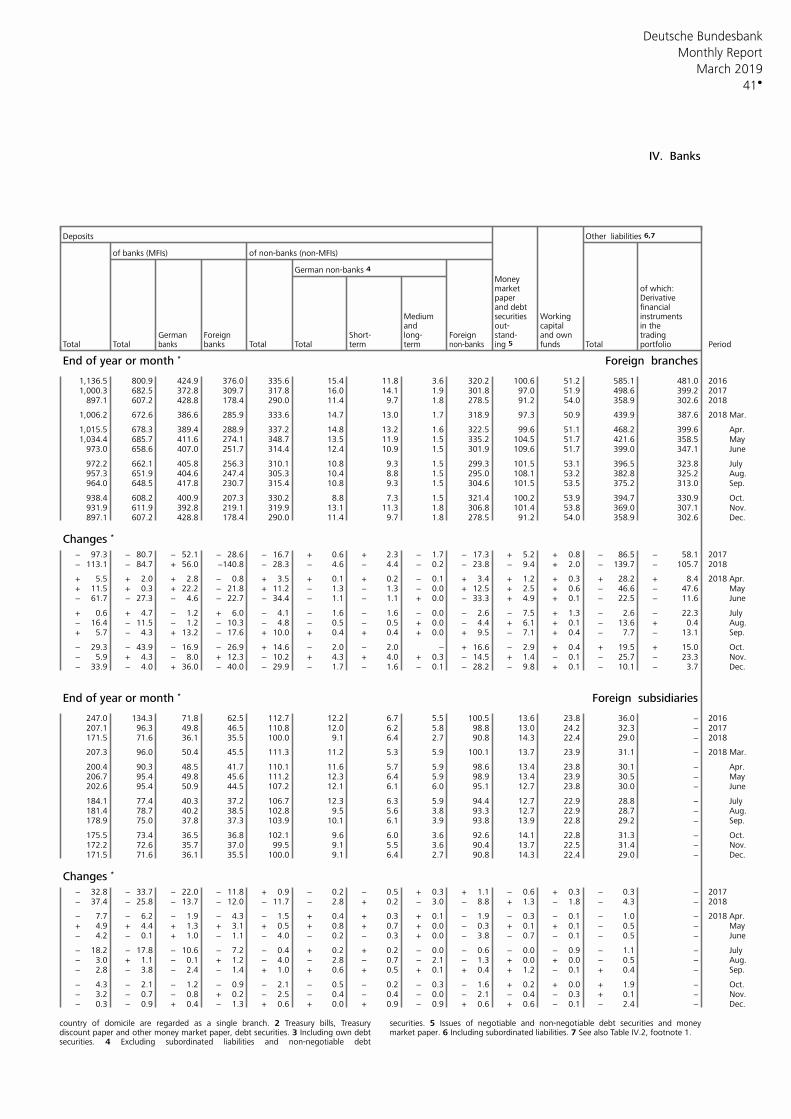
Deutsche Bundesbank
41
Monthly Report
March 2019
IV. Banks
Deposits Other liabilities 6,7
of banks (MFIs) of non-banks (non-MFIs)
German non-banks 4 Moneymarket of which:paper Derivativeand debt financial
Medium Working instrumentssecuritiesand out- capital in the
German Foreign Short- long- Foreign stand- and own tradingTotal Total banks Total Total term term ing 5 funds Total portfolio Periodbanks non-banks
End of year or month * Foreign branches
1,136.5 800.9 424.9 376.0 335.6 15.4 11.8 3.6 320.2 100.6 51.2 585.1 481.0 20161,000.3 682.5 372.8 309.7 317.8 16.0 14.1 1.9 301.8 97.0 51.9 498.6 399.2 2017
897.1 607.2 428.8 178.4 290.0 11.4 9.7 1.8 278.5 91.2 54.0 358.9 302.6 2018
1,006.2 672.6 386.6 285.9 333.6 14.7 13.0 1.7 318.9 97.3 50.9 439.9 387.6 2018 Mar.
1,015.5 678.3 389.4 288.9 337.2 14.8 13.2 1.6 322.5 99.6 51.1 468.2 399.6 Apr.1,034.4 685.7 411.6 274.1 348.7 13.5 11.9 1.5 335.2 104.5 51.7 421.6 358.5 May
973.0 658.6 407.0 251.7 314.4 12.4 10.9 1.5 301.9 109.6 51.7 399.0 347.1 June
972.2 662.1 405.8 256.3 310.1 10.8 9.3 1.5 299.3 101.5 53.1 396.5 323.8 July957.3 651.9 404.6 247.4 305.3 10.4 8.8 1.5 295.0 108.1 53.2 382.8 325.2 Aug.964.0 648.5 417.8 230.7 315.4 10.8 9.3 1.5 304.6 101.5 53.5 375.2 313.0 Sep.
938.4 608.2 400.9 207.3 330.2 8.8 7.3 1.5 321.4 100.2 53.9 394.7 330.9 Oct.931.9 611.9 392.8 219.1 319.9 13.1 11.3 1.8 306.8 101.4 53.8 369.0 307.1 Nov.897.1 607.2 428.8 178.4 290.0 11.4 9.7 1.8 278.5 91.2 54.0 358.9 302.6 Dec.
Changes *
− 97.3 − 80.7 − 52.1 − 28.6 − 16.7 + 0.6 + 2.3 − 1.7 − 17.3 + 5.2 + 0.8 − 86.5 − 58.1 2017− 113.1 − 84.7 + 56.0 −140.8 − 28.3 − 4.6 − 4.4 − 0.2 − 23.8 − 9.4 + 2.0 − 139.7 − 105.7 2018
+ 5.5 + 2.0 + 2.8 − 0.8 + 3.5 + 0.1 + 0.2 − 0.1 + 3.4 + 1.2 + 0.3 + 28.2 + 8.4 2018 Apr.+ 11.5 + 0.3 + 22.2 − 21.8 + 11.2 − 1.3 − 1.3 − 0.0 + 12.5 + 2.5 + 0.6 − 46.6 − 47.6 May− 61.7 − 27.3 − 4.6 − 22.7 − 34.4 − 1.1 − 1.1 + 0.0 − 33.3 + 4.9 + 0.1 − 22.5 − 11.6 June
+ 0.6 + 4.7 − 1.2 + 6.0 − 4.1 − 1.6 − 1.6 − 0.0 − 2.6 − 7.5 + 1.3 − 2.6 − 22.3 July− 16.4 − 11.5 − 1.2 − 10.3 − 4.8 − 0.5 − 0.5 + 0.0 − 4.4 + 6.1 + 0.1 − 13.6 + 0.4 Aug.+ 5.7 − 4.3 + 13.2 − 17.6 + 10.0 + 0.4 + 0.4 + 0.0 + 9.5 − 7.1 + 0.4 − 7.7 − 13.1 Sep.
− 29.3 − 43.9 − 16.9 − 26.9 + 14.6 − 2.0 − 2.0 − + 16.6 − 2.9 + 0.4 + 19.5 + 15.0 Oct.− 5.9 + 4.3 − 8.0 + 12.3 − 10.2 + 4.3 + 4.0 + 0.3 − 14.5 + 1.4 − 0.1 − 25.7 − 23.3 Nov.− 33.9 − 4.0 + 36.0 − 40.0 − 29.9 − 1.7 − 1.6 − 0.1 − 28.2 − 9.8 + 0.1 − 10.1 − 3.7 Dec.
End of year or month * Foreign subsidiaries
247.0 134.3 71.8 62.5 112.7 12.2 6.7 5.5 100.5 13.6 23.8 36.0 − 2016207.1 96.3 49.8 46.5 110.8 12.0 6.2 5.8 98.8 13.0 24.2 32.3 − 2017171.5 71.6 36.1 35.5 100.0 9.1 6.4 2.7 90.8 14.3 22.4 29.0 − 2018
207.3 96.0 50.4 45.5 111.3 11.2 5.3 5.9 100.1 13.7 23.9 31.1 − 2018 Mar.
200.4 90.3 48.5 41.7 110.1 11.6 5.7 5.9 98.6 13.4 23.8 30.1 − Apr.206.7 95.4 49.8 45.6 111.2 12.3 6.4 5.9 98.9 13.4 23.9 30.5 − May202.6 95.4 50.9 44.5 107.2 12.1 6.1 6.0 95.1 12.7 23.8 30.0 − June
184.1 77.4 40.3 37.2 106.7 12.3 6.3 5.9 94.4 12.7 22.9 28.8 − July181.4 78.7 40.2 38.5 102.8 9.5 5.6 3.8 93.3 12.7 22.9 28.7 − Aug.178.9 75.0 37.8 37.3 103.9 10.1 6.1 3.9 93.8 13.9 22.8 29.2 − Sep.
175.5 73.4 36.5 36.8 102.1 9.6 6.0 3.6 92.6 14.1 22.8 31.3 − Oct.172.2 72.6 35.7 37.0 99.5 9.1 5.5 3.6 90.4 13.7 22.5 31.4 − Nov.171.5 71.6 36.1 35.5 100.0 9.1 6.4 2.7 90.8 14.3 22.4 29.0 − Dec.
Changes *
− 32.8 − 33.7 − 22.0 − 11.8 + 0.9 − 0.2 − 0.5 + 0.3 + 1.1 − 0.6 + 0.3 − 0.3 − 2017− 37.4 − 25.8 − 13.7 − 12.0 − 11.7 − 2.8 + 0.2 − 3.0 − 8.8 + 1.3 − 1.8 − 4.3 − 2018
− 7.7 − 6.2 − 1.9 − 4.3 − 1.5 + 0.4 + 0.3 + 0.1 − 1.9 − 0.3 − 0.1 − 1.0 − 2018 Apr.+ 4.9 + 4.4 + 1.3 + 3.1 + 0.5 + 0.8 + 0.7 + 0.0 − 0.3 + 0.1 + 0.1 − 0.5 − May− 4.2 − 0.1 + 1.0 − 1.1 − 4.0 − 0.2 − 0.3 + 0.0 − 3.8 − 0.7 − 0.1 − 0.5 − June
− 18.2 − 17.8 − 10.6 − 7.2 − 0.4 + 0.2 + 0.2 − 0.0 − 0.6 − 0.0 − 0.9 − 1.1 − July− 3.0 + 1.1 − 0.1 + 1.2 − 4.0 − 2.8 − 0.7 − 2.1 − 1.3 + 0.0 + 0.0 − 0.5 − Aug.− 2.8 − 3.8 − 2.4 − 1.4 + 1.0 + 0.6 + 0.5 + 0.1 + 0.4 + 1.2 − 0.1 + 0.4 − Sep.
− 4.3 − 2.1 − 1.2 − 0.9 − 2.1 − 0.5 − 0.2 − 0.3 − 1.6 + 0.2 + 0.0 + 1.9 − Oct.− 3.2 − 0.7 − 0.8 + 0.2 − 2.5 − 0.4 − 0.4 − 0.0 − 2.1 − 0.4 − 0.3 + 0.1 − Nov.− 0.3 − 0.9 + 0.4 − 1.3 + 0.6 + 0.0 + 0.9 − 0.9 + 0.6 + 0.6 − 0.1 − 2.4 − Dec.
country of domicile are regarded as a single branch. 2 Treasury bills, Treasury securities. 5 Issues of negotiable and non-negotiable debt securities and moneydiscount paper and other money market paper, debt securities. 3 Including own debt market paper. 6 Including subordinated liabilities. 7 See also Table IV.2, footnote 1. securities. 4 Excluding subordinated liabilities and non-negotiable debt
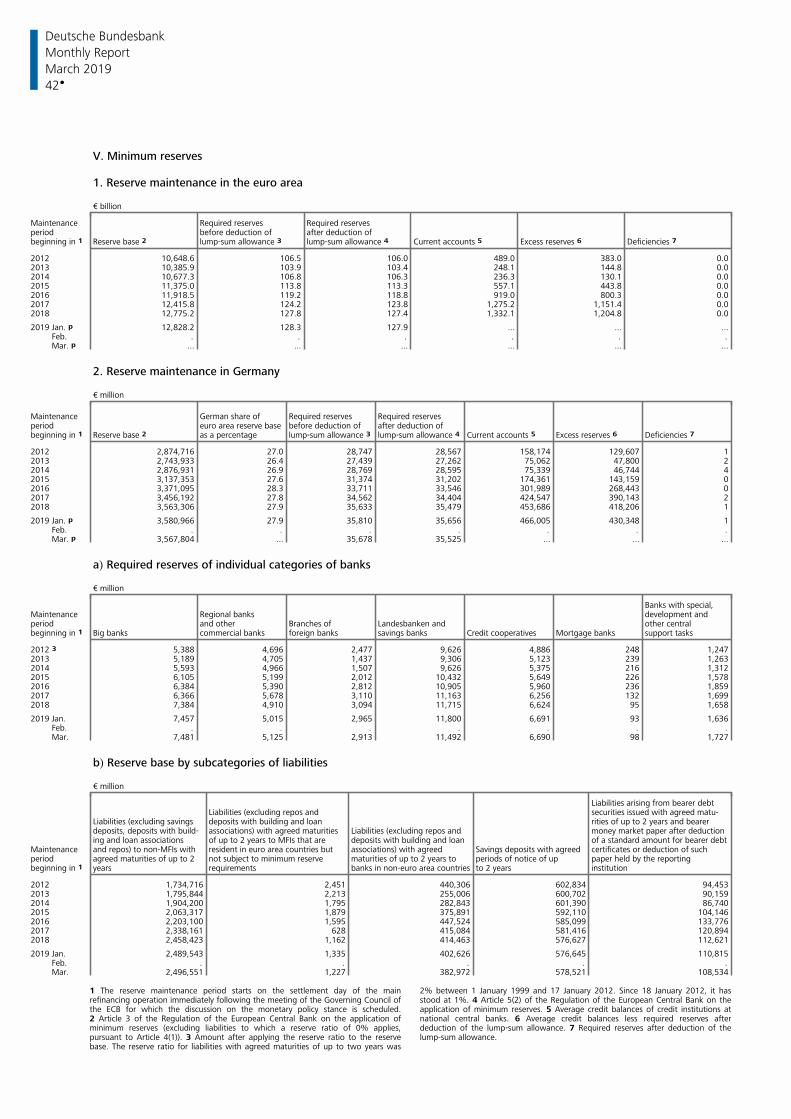
Deutsche Bundesbank
42
Monthly Report
March 2019
V. Minimum reserves
1. Reserve maintenance in the euro area
€ billion
Maintenance Required reserves Required reservesperiod before deduction of after deduction of
Reserve base 2 lump-sum allowance 3 lump-sum allowance 4 Current accounts 5 Excess reserves 6 Deficiencies 7 beginning in 1
2012 10,648.6 106.5 106.0 489.0 383.0 0.02013 10,385.9 103.9 103.4 248.1 144.8 0.02014 10,677.3 106.8 106.3 236.3 130.1 0.02015 11,375.0 113.8 113.3 557.1 443.8 0.02016 11,918.5 119.2 118.8 919.0 800.3 0.02017 12,415.8 124.2 123.8 1,275.2 1,151.4 0.02018 12,775.2 127.8 127.4 1,332.1 1,204.8 0.0
2019 Jan. p 12,828.2 128.3 127.9 ... ... ... Feb. . . . . . . Mar. p ... ... ... ... ... ...
2. Reserve maintenance in Germany
€ million
Maintenance German share of Required reserves Required reservesperiod before deduction of after deduction ofeuro area reserve base
Reserve base 2 as a percentage Current accounts 5 Excess reserves 6 Deficiencies 7 beginning in 1 lump-sum allowance 3 lump-sum allowance 4
2012 2,874,716 27.0 28,747 28,567 158,174 129,607 12013 2,743,933 26.4 27,439 27,262 75,062 47,800 22014 2,876,931 26.9 28,769 28,595 75,339 46,744 42015 3,137,353 27.6 31,374 31,202 174,361 143,159 02016 3,371,095 28.3 33,711 33,546 301,989 268,443 02017 3,456,192 27.8 34,562 34,404 424,547 390,143 22018 3,563,306 27.9 35,633 35,479 453,686 418,206 1
2019 Jan. p 3,580,966 27.9 35,810 35,656 466,005 430,348 1 Feb. . . . . . . . Mar. p 3,567,804 ... 35,678 35,525 ... ... ...
a) Required reserves of individual categories of banks
€ million
Banks with special,Maintenance Regional banks development andperiod and other Branches of Landesbanken and other central
Big banks commercial banks foreign banks savings banks Credit cooperatives Mortgage banks support tasksbeginning in 1
2012 3 5,388 4,696 2,477 9,626 4,886 248 1,2472013 5,189 4,705 1,437 9,306 5,123 239 1,2632014 5,593 4,966 1,507 9,626 5,375 216 1,3122015 6,105 5,199 2,012 10,432 5,649 226 1,5782016 6,384 5,390 2,812 10,905 5,960 236 1,8592017 6,366 5,678 3,110 11,163 6,256 132 1,6992018 7,384 4,910 3,094 11,715 6,624 95 1,658
2019 Jan. 7,457 5,015 2,965 11,800 6,691 93 1,636 Feb. . . . . . . . Mar. 7,481 5,125 2,913 11,492 6,690 98 1,727
b) Reserve base by subcategories of liabilities
€ million
Liabilities arising from bearer debtLiabilities (excluding repos and securities issued with agreed matu-deposits with building and loanLiabilities (excluding savings rities of up to 2 years and bearer
deposits, deposits with build- associations) with agreed maturities Liabilities (excluding repos and money market paper after deductioning and loan associations of up to 2 years to MFIs that are deposits with building and loan of a standard amount for bearer debt
Maintenance associations) with agreedand repos) to non-MFIs with resident in euro area countries but Savings deposits with agreed certificates or deduction of suchperiod not subject to minimum reserve periods of notice of up paper held by the reportingagreed maturities of up to 2 maturities of up to 2 years to
years requirements to 2 years institutionbeginning in 1 banks in non-euro area countries
2012 1,734,716 2,451 440,306 602,834 94,4532013 1,795,844 2,213 255,006 600,702 90,1592014 1,904,200 1,795 282,843 601,390 86,7402015 2,063,317 1,879 375,891 592,110 104,1462016 2,203,100 1,595 447,524 585,099 133,7762017 2,338,161 628 415,084 581,416 120,8942018 2,458,423 1,162 414,463 576,627 112,621
2019 Jan. 2,489,543 1,335 402,626 576,645 110,815 Feb. . . . . . Mar. 2,496,551 1,227 382,972 578,521 108,534
1 The reserve maintenance period starts on the settlement day of the main 2% between 1 January 1999 and 17 January 2012. Since 18 January 2012, it hasrefinancing operation immediately following the meeting of the Governing Council of stood at 1%. 4 Article 5(2) of the Regulation of the European Central Bank on thethe ECB for which the discussion on the monetary policy stance is scheduled. application of minimum reserves. 5 Average credit balances of credit institutions at2 Article 3 of the Regulation of the European Central Bank on the application of national central banks. 6 Average credit balances less required reserves afterminimum reserves (excluding liabilities to which a reserve ratio of 0% applies, deduction of the lump-sum allowance. 7 Required reserves after deduction of thepursuant to Article 4(1)). 3 Amount after applying the reserve ratio to the reserve lump-sum allowance. base. The reserve ratio for liabilities with agreed maturities of up to two years was
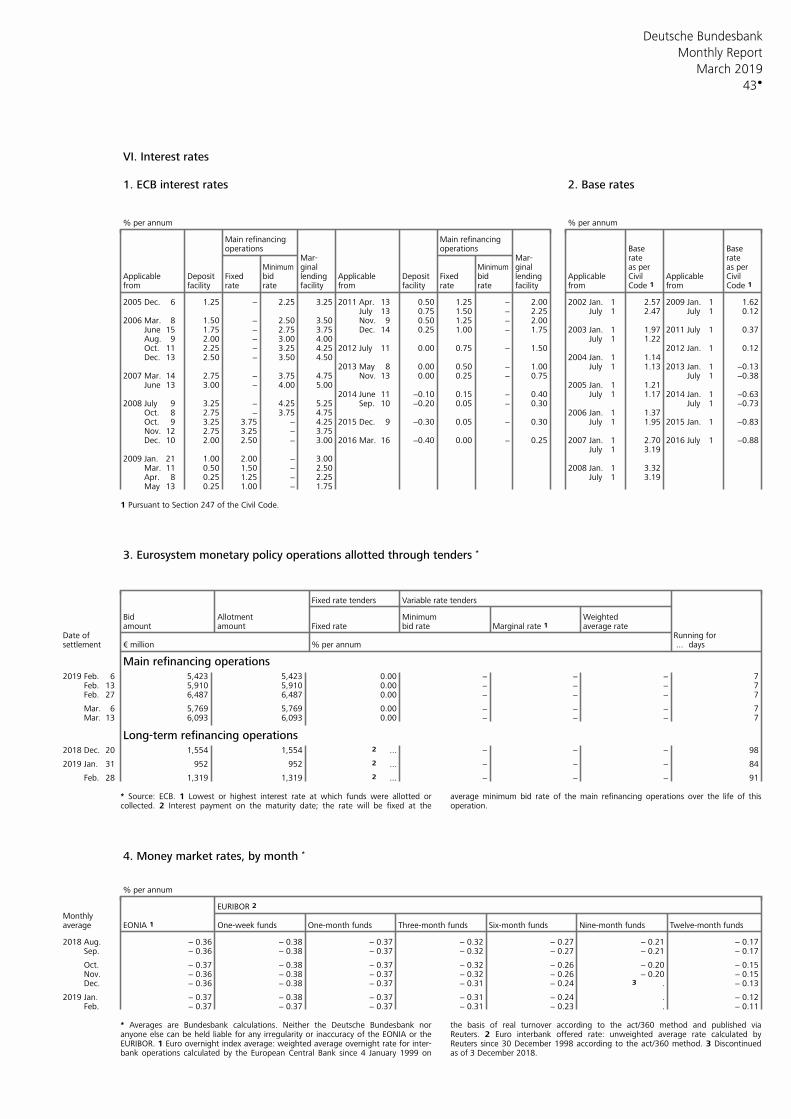
Deutsche Bundesbank
43
Monthly Report
March 2019
VI. Interest rates
1. ECB interest rates 2. Base rates
% per annum % per annum
Main refinancing Main refinancingoperations operations Base Base
Mar- Mar- rate rateginal ginal as per as perMinimum Minimum
Applicable Deposit Fixed bid lending Applicable Deposit Fixed bid lending Applicable Civil Applicable Civilfrom facility rate rate facility from facility rate rate facility from Code 1 from Code 1
2005 Dec. 6 1.25 − 2.25 3.25 2011 Apr. 13 0.50 1.25 − 2.00 2002 Jan. 1 2.57 2009 Jan. 1 1.62 July 13 0.75 1.50 − 2.25 July 1 2.47 July 1 0.12
2006 Mar. 8 1.50 − 2.50 3.50 Nov. 9 0.50 1.25 − 2.00 June 15 1.75 − 2.75 3.75 Dec. 14 0.25 1.00 − 1.75 2003 Jan. 1 1.97 2011 July 1 0.37 Aug. 9 2.00 − 3.00 4.00 July 1 1.22 Oct. 11 2.25 − 3.25 4.25 2012 July 11 0.00 0.75 − 1.50 2012 Jan. 1 0.12 Dec. 13 2.50 − 3.50 4.50 2004 Jan. 1 1.14
2013 May 8 0.00 0.50 − 1.00 July 1 1.13 2013 Jan. 1 −0.132007 Mar. 14 2.75 − 3.75 4.75 Nov. 13 0.00 0.25 − 0.75 July 1 −0.38 June 13 3.00 − 4.00 5.00 2005 Jan. 1 1.21
2014 June 11 −0.10 0.15 − 0.40 July 1 1.17 2014 Jan. 1 −0.632008 July 9 3.25 − 4.25 5.25 Sep. 10 −0.20 0.05 − 0.30 July 1 −0.73 Oct. 8 2.75 − 3.75 4.75 2006 Jan. 1 1.37 Oct. 9 3.25 3.75 − 4.25 2015 Dec. 9 −0.30 0.05 − 0.30 July 1 1.95 2015 Jan. 1 −0.83 Nov. 12 2.75 3.25 − 3.75 Dec. 10 2.00 2.50 − 3.00 2016 Mar. 16 −0.40 0.00 − 0.25 2007 Jan. 1 2.70 2016 July 1 −0.88
July 1 3.192009 Jan. 21 1.00 2.00 − 3.00 Mar. 11 0.50 1.50 − 2.50 2008 Jan. 1 3.32 Apr. 8 0.25 1.25 − 2.25 July 1 3.19 May 13 0.25 1.00 − 1.75
1 Pursuant to Section 247 of the Civil Code.
3. Eurosystem monetary policy operations allotted through tenders *
Fixed rate tenders Variable rate tenders
Bid Allotment Minimum Weightedamount amount Fixed rate bid rate Marginal rate 1 average rate
Date of Running forsettlement € million % per annum ... days
Main refinancing operations2019 Feb. 6 5,423 5,423 0.00 − − − 7 Feb. 13 5,910 5,910 0.00 − − − 7 Feb. 27 6,487 6,487 0.00 − − − 7
Mar. 6 5,769 5,769 0.00 − − − 7 Mar. 13 6,093 6,093 0.00 − − − 7
Long-term refinancing operations2018 Dec. 20 1,554 1,554 2 ... − − − 98
2019 Jan. 31 952 952 2 ... − − − 84
Feb. 28 1,319 1,319 2 ... − − − 91
* Source: ECB. 1 Lowest or highest interest rate at which funds were allotted or average minimum bid rate of the main refinancing operations over the life of thiscollected. 2 Interest payment on the maturity date; the rate will be fixed at the operation.
4. Money market rates, by month *
% per annum
EURIBOR 2 Monthlyaverage EONIA 1 One-week funds One-month funds Three-month funds Six-month funds Nine-month funds Twelve-month funds
2018 Aug. − 0.36 − 0.38 − 0.37 − 0.32 − 0.27 − 0.21 − 0.17 Sep. − 0.36 − 0.38 − 0.37 − 0.32 − 0.27 − 0.21 − 0.17
Oct. − 0.37 − 0.38 − 0.37 − 0.32 − 0.26 − 0.20 − 0.15 Nov. − 0.36 − 0.38 − 0.37 − 0.32 − 0.26 − 0.20 − 0.15 Dec. − 0.36 − 0.38 − 0.37 − 0.31 − 0.24 3 . − 0.13
2019 Jan. − 0.37 − 0.38 − 0.37 − 0.31 − 0.24 . − 0.12 Feb. − 0.37 − 0.37 − 0.37 − 0.31 − 0.23 . − 0.11
* Averages are Bundesbank calculations. Neither the Deutsche Bundesbank nor the basis of real turnover according to the act/360 method and published viaanyone else can be held liable for any irregularity or inaccuracy of the EONIA or the Reuters. 2 Euro interbank offered rate: unweighted average rate calculated byEURIBOR. 1 Euro overnight index average: weighted average overnight rate for inter- Reuters since 30 December 1998 according to the act/360 method. 3 Discontinuedbank operations calculated by the European Central Bank since 4 January 1999 on as of 3 December 2018.
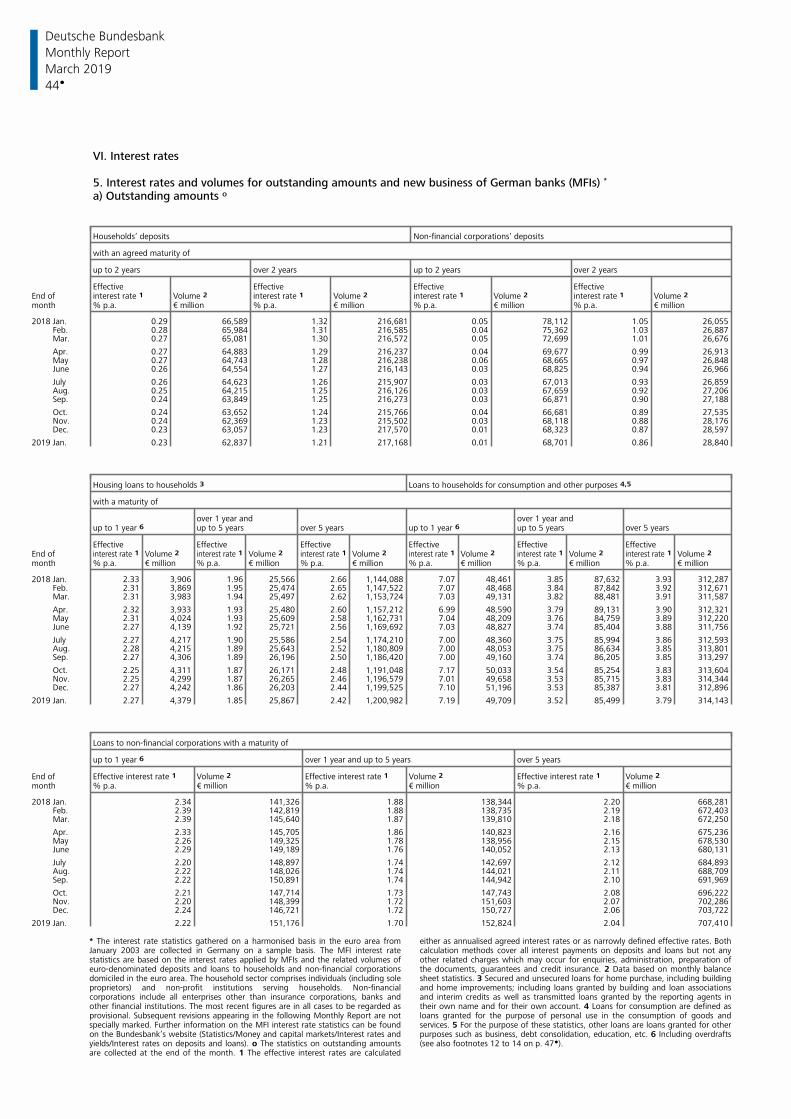
Deutsche Bundesbank
44
Monthly Report
March 2019
VI. Interest rates
5. Interest rates and volumes for outstanding amounts and new business of German banks (MFIs) *
a) Outstanding amounts o
Households’ deposits Non-financial corporations’ deposits
with an agreed maturity of
up to 2 years over 2 years up to 2 years over 2 years
Effective Effective Effective EffectiveEnd of interest rate 1 Volume 2 interest rate 1 Volume 2 interest rate 1 Volume 2 interest rate 1 Volume 2 month % p.a. € million % p.a. € million % p.a. € million % p.a. € million
2018 Jan. 0.29 66,589 1.32 216,681 0.05 78,112 1.05 26,055 Feb. 0.28 65,984 1.31 216,585 0.04 75,362 1.03 26,887 Mar. 0.27 65,081 1.30 216,572 0.05 72,699 1.01 26,676
Apr. 0.27 64,883 1.29 216,237 0.04 69,677 0.99 26,913 May 0.27 64,743 1.28 216,238 0.06 68,665 0.97 26,848 June 0.26 64,554 1.27 216,143 0.03 68,825 0.94 26,966
July 0.26 64,623 1.26 215,907 0.03 67,013 0.93 26,859 Aug. 0.25 64,215 1.25 216,126 0.03 67,659 0.92 27,206 Sep. 0.24 63,849 1.25 216,273 0.03 66,871 0.90 27,188
Oct. 0.24 63,652 1.24 215,766 0.04 66,681 0.89 27,535 Nov. 0.24 62,369 1.23 215,502 0.03 68,118 0.88 28,176 Dec. 0.23 63,057 1.23 217,570 0.01 68,323 0.87 28,597
2019 Jan. 0.23 62,837 1.21 217,168 0.01 68,701 0.86 28,840
Housing loans to households 3 Loans to households for consumption and other purposes 4,5
with a maturity of
over 1 year and over 1 year andup to 1 year 6 up to 5 years over 5 years up to 1 year 6 up to 5 years over 5 years
Effective Effective Effective Effective Effective EffectiveEnd of Volume 2 Volume 2 Volume 2 Volume 2 Volume 2 Volume 2 interest rate 1 interest rate 1 interest rate 1 interest rate 1 interest rate 1 interest rate 1 month % p.a. % p.a. % p.a. % p.a. % p.a. % p.a.€ million € million € million € million € million € million
2018 Jan. 2.33 3,906 1.96 25,566 2.66 1,144,088 7.07 48,461 3.85 87,632 3.93 312,287 Feb. 2.31 3,869 1.95 25,474 2.65 1,147,522 7.07 48,468 3.84 87,842 3.92 312,671 Mar. 2.31 3,983 1.94 25,497 2.62 1,153,724 7.03 49,131 3.82 88,481 3.91 311,587
Apr. 2.32 3,933 1.93 25,480 2.60 1,157,212 6.99 48,590 3.79 89,131 3.90 312,321 May 2.31 4,024 1.93 25,609 2.58 1,162,731 7.04 48,209 3.76 84,759 3.89 312,220 June 2.27 4,139 1.92 25,721 2.56 1,169,692 7.03 48,827 3.74 85,404 3.88 311,756
July 2.27 4,217 1.90 25,586 2.54 1,174,210 7.00 48,360 3.75 85,994 3.86 312,593 Aug. 2.28 4,215 1.89 25,643 2.52 1,180,809 7.00 48,053 3.75 86,634 3.85 313,801 Sep. 2.27 4,306 1.89 26,196 2.50 1,186,420 7.00 49,160 3.74 86,205 3.85 313,297
Oct. 2.25 4,311 1.87 26,171 2.48 1,191,048 7.17 50,033 3.54 85,254 3.83 313,604 Nov. 2.25 4,299 1.87 26,265 2.46 1,196,579 7.01 49,658 3.53 85,715 3.83 314,344 Dec. 2.27 4,242 1.86 26,203 2.44 1,199,525 7.10 51,196 3.53 85,387 3.81 312,896
2019 Jan. 2.27 4,379 1.85 25,867 2.42 1,200,982 7.19 49,709 3.52 85,499 3.79 314,143
Loans to non-financial corporations with a maturity of
up to 1 year 6 over 1 year and up to 5 years over 5 years
End of Volume 2 Volume 2 Volume 2 Effective interest rate 1 Effective interest rate 1 Effective interest rate 1 month % p.a. € million % p.a. € million % p.a. € million
2018 Jan. 2.34 141,326 1.88 138,344 2.20 668,281 Feb. 2.39 142,819 1.88 138,735 2.19 672,403 Mar. 2.39 145,640 1.87 139,810 2.18 672,250
Apr. 2.33 145,705 1.86 140,823 2.16 675,236 May 2.26 149,325 1.78 138,956 2.15 678,530 June 2.29 149,189 1.76 140,052 2.13 680,131
July 2.20 148,897 1.74 142,697 2.12 684,893 Aug. 2.22 148,026 1.74 144,021 2.11 688,709 Sep. 2.22 150,891 1.74 144,942 2.10 691,969
Oct. 2.21 147,714 1.73 147,743 2.08 696,222 Nov. 2.20 148,399 1.72 151,603 2.07 702,286 Dec. 2.24 146,721 1.72 150,727 2.06 703,722
2019 Jan. 2.22 151,176 1.70 152,824 2.04 707,410
* The interest rate statistics gathered on a harmonised basis in the euro area from either as annualised agreed interest rates or as narrowly defined effective rates. BothJanuary 2003 are collected in Germany on a sample basis. The MFI interest rate calculation methods cover all interest payments on deposits and loans but not anystatistics are based on the interest rates applied by MFIs and the related volumes of other related charges which may occur for enquiries, administration, preparation ofeuro-denominated deposits and loans to households and non-financial corporations the documents, guarantees and credit insurance. 2 Data based on monthly balancedomiciled in the euro area. The household sector comprises individuals (including sole sheet statistics. 3 Secured and unsecured loans for home purchase, including buildingproprietors) and non-profit institutions serving households. Non-financial and home improvements; including loans granted by building and loan associationscorporations include all enterprises other than insurance corporations, banks and and interim credits as well as transmitted loans granted by the reporting agents inother financial institutions. The most recent figures are in all cases to be regarded as their own name and for their own account. 4 Loans for consumption are defined asprovisional. Subsequent revisions appearing in the following Monthly Report are not loans granted for the purpose of personal use in the consumption of goods andspecially marked. Further information on the MFI interest rate statistics can be found services. 5 For the purpose of these statistics, other loans are loans granted for otheron the Bundesbank’s website (Statistics/Money and capital markets/Interest rates and purposes such as business, debt consolidation, education, etc. 6 Including overdraftsyields/Interest rates on deposits and loans). o The statistics on outstanding amounts (see also footnotes 12 to 14 on p. 47 ). are collected at the end of the month. 1 The effective interest rates are calculated
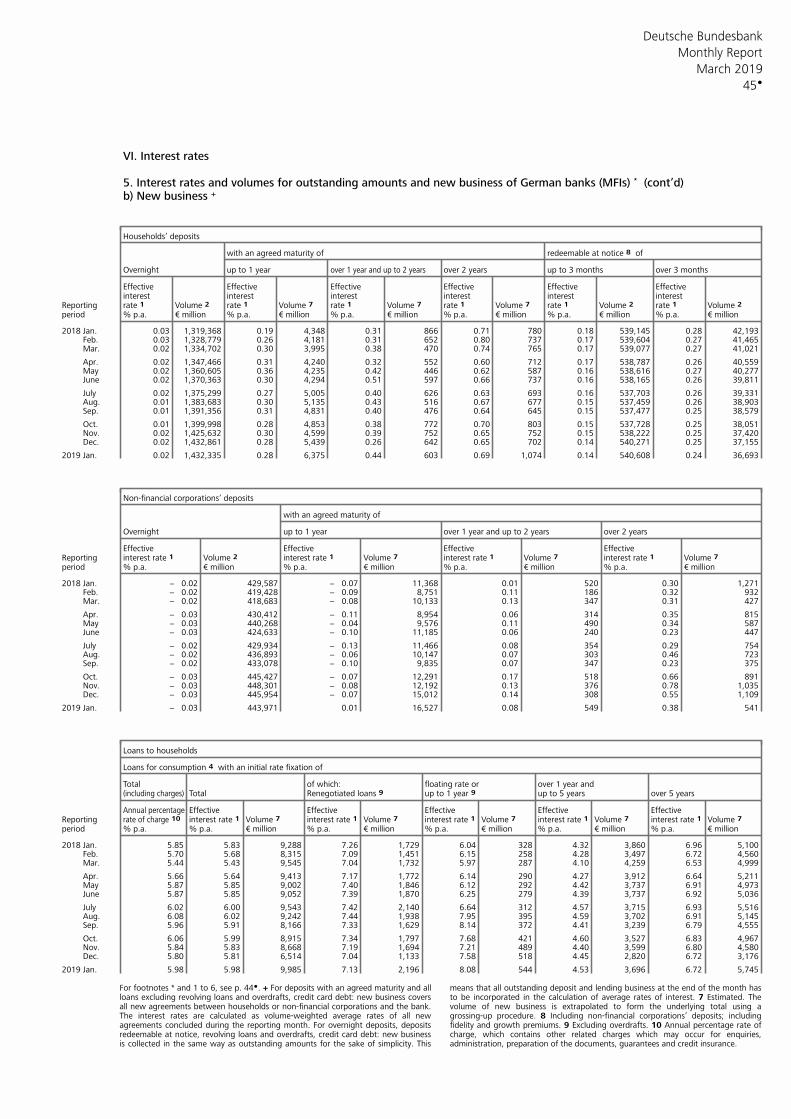
Deutsche Bundesbank
45
Monthly Report
March 2019
VI. Interest rates
5. Interest rates and volumes for outstanding amounts and new business of German banks (MFIs) * (cont’d)b) New business +
Households’ deposits
with an agreed maturity of redeemable at notice 8 of
Overnight up to 1 year over 2 years up to 3 months over 3 monthsover 1 year and up to 2 years
Effective Effective Effective Effective Effective Effectiveinterest interest interest interest interest interest
Reporting rate 1 Volume 2 rate 1 Volume 7 rate 1 Volume 7 rate 1 Volume 7 rate 1 Volume 2 rate 1 Volume 2 period % p.a. % p.a. % p.a. % p.a. % p.a. % p.a.€ million € million € million € million € million € million
2018 Jan. 0.03 1,319,368 0.19 4,348 0.31 866 0.71 780 0.18 539,145 0.28 42,193 Feb. 0.03 1,328,779 0.26 4,181 0.31 652 0.80 737 0.17 539,604 0.27 41,465 Mar. 0.02 1,334,702 0.30 3,995 0.38 470 0.74 765 0.17 539,077 0.27 41,021
Apr. 0.02 1,347,466 0.31 4,240 0.32 552 0.60 712 0.17 538,787 0.26 40,559 May 0.02 1,360,605 0.36 4,235 0.42 446 0.62 587 0.16 538,616 0.27 40,277 June 0.02 1,370,363 0.30 4,294 0.51 597 0.66 737 0.16 538,165 0.26 39,811
July 0.02 1,375,299 0.27 5,005 0.40 626 0.63 693 0.16 537,703 0.26 39,331 Aug. 0.01 1,383,683 0.30 5,135 0.43 516 0.67 677 0.15 537,459 0.26 38,903 Sep. 0.01 1,391,356 0.31 4,831 0.40 476 0.64 645 0.15 537,477 0.25 38,579
Oct. 0.01 1,399,998 0.28 4,853 0.38 772 0.70 803 0.15 537,728 0.25 38,051 Nov. 0.02 1,425,632 0.30 4,599 0.39 752 0.65 752 0.15 538,222 0.25 37,420 Dec. 0.02 1,432,861 0.28 5,439 0.26 642 0.65 702 0.14 540,271 0.25 37,155
2019 Jan. 0.02 1,432,335 0.28 6,375 0.44 603 0.69 1,074 0.14 540,608 0.24 36,693
Non-financial corporations’ deposits
with an agreed maturity of
Overnight up to 1 year over 1 year and up to 2 years over 2 years
Effective Effective Effective EffectiveReporting interest rate 1 Volume 2 interest rate 1 Volume 7 interest rate 1 Volume 7 interest rate 1 Volume 7 period % p.a. € million % p.a. € million % p.a. € million % p.a. € million
2018 Jan. − 0.02 429,587 − 0.07 11,368 0.01 520 0.30 1,271 Feb. − 0.02 419,428 − 0.09 8,751 0.11 186 0.32 932 Mar. − 0.02 418,683 − 0.08 10,133 0.13 347 0.31 427
Apr. − 0.03 430,412 − 0.11 8,954 0.06 314 0.35 815 May − 0.03 440,268 − 0.04 9,576 0.11 490 0.34 587 June − 0.03 424,633 − 0.10 11,185 0.06 240 0.23 447
July − 0.02 429,934 − 0.13 11,466 0.08 354 0.29 754 Aug. − 0.02 436,893 − 0.06 10,147 0.07 303 0.46 723 Sep. − 0.02 433,078 − 0.10 9,835 0.07 347 0.23 375
Oct. − 0.03 445,427 − 0.07 12,291 0.17 518 0.66 891 Nov. − 0.03 448,301 − 0.08 12,192 0.13 376 0.78 1,035 Dec. − 0.03 445,954 − 0.07 15,012 0.14 308 0.55 1,109
2019 Jan. − 0.03 443,971 0.01 16,527 0.08 549 0.38 541
Loans to households
Loans for consumption 4 with an initial rate fixation of
Total of which: floating rate or over 1 year andTotal Renegotiated loans 9 up to 1 year 9 up to 5 years over 5 years(including charges)
Effective Effective Effective Effective EffectiveAnnual percentageReporting Volume 7 Volume 7 Volume 7 Volume 7 Volume 7 rate of charge 10 interest rate 1 interest rate 1 interest rate 1 interest rate 1 interest rate 1 period % p.a. % p.a. € million % p.a. € million % p.a. % p.a. % p.a.€ million € million € million
2018 Jan. 5.85 5.83 9,288 7.26 1,729 6.04 328 4.32 3,860 6.96 5,100 Feb. 5.70 5.68 8,315 7.09 1,451 6.15 258 4.28 3,497 6.72 4,560 Mar. 5.44 5.43 9,545 7.04 1,732 5.97 287 4.10 4,259 6.53 4,999
Apr. 5.66 5.64 9,413 7.17 1,772 6.14 290 4.27 3,912 6.64 5,211 May 5.87 5.85 9,002 7.40 1,846 6.12 292 4.42 3,737 6.91 4,973 June 5.87 5.85 9,052 7.39 1,870 6.25 279 4.39 3,737 6.92 5,036
July 6.02 6.00 9,543 7.42 2,140 6.64 312 4.57 3,715 6.93 5,516 Aug. 6.08 6.02 9,242 7.44 1,938 7.95 395 4.59 3,702 6.91 5,145 Sep. 5.96 5.91 8,166 7.33 1,629 8.14 372 4.41 3,239 6.79 4,555
Oct. 6.06 5.99 8,915 7.34 1,797 7.68 421 4.60 3,527 6.83 4,967 Nov. 5.84 5.83 8,668 7.19 1,694 7.21 489 4.40 3,599 6.80 4,580 Dec. 5.80 5.81 6,514 7.04 1,133 7.58 518 4.45 2,820 6.72 3,176
2019 Jan. 5.98 5.98 9,985 7.13 2,196 8.08 544 4.53 3,696 6.72 5,745
For footnotes * and 1 to 6, see p. 44 . + For deposits with an agreed maturity and all means that all outstanding deposit and lending business at the end of the month hasloans excluding revolving loans and overdrafts, credit card debt: new business covers to be incorporated in the calculation of average rates of interest. 7 Estimated. Theall new agreements between households or non-financial corporations and the bank. volume of new business is extrapolated to form the underlying total using aThe interest rates are calculated as volume-weighted average rates of all new grossing-up procedure. 8 Including non-financial corporations’ deposits; includingagreements concluded during the reporting month. For overnight deposits, deposits fidelity and growth premiums. 9 Excluding overdrafts. 10 Annual percentage rate ofredeemable at notice, revolving loans and overdrafts, credit card debt: new business charge, which contains other related charges which may occur for enquiries,is collected in the same way as outstanding amounts for the sake of simplicity. This administration, preparation of the documents, guarantees and credit insurance.
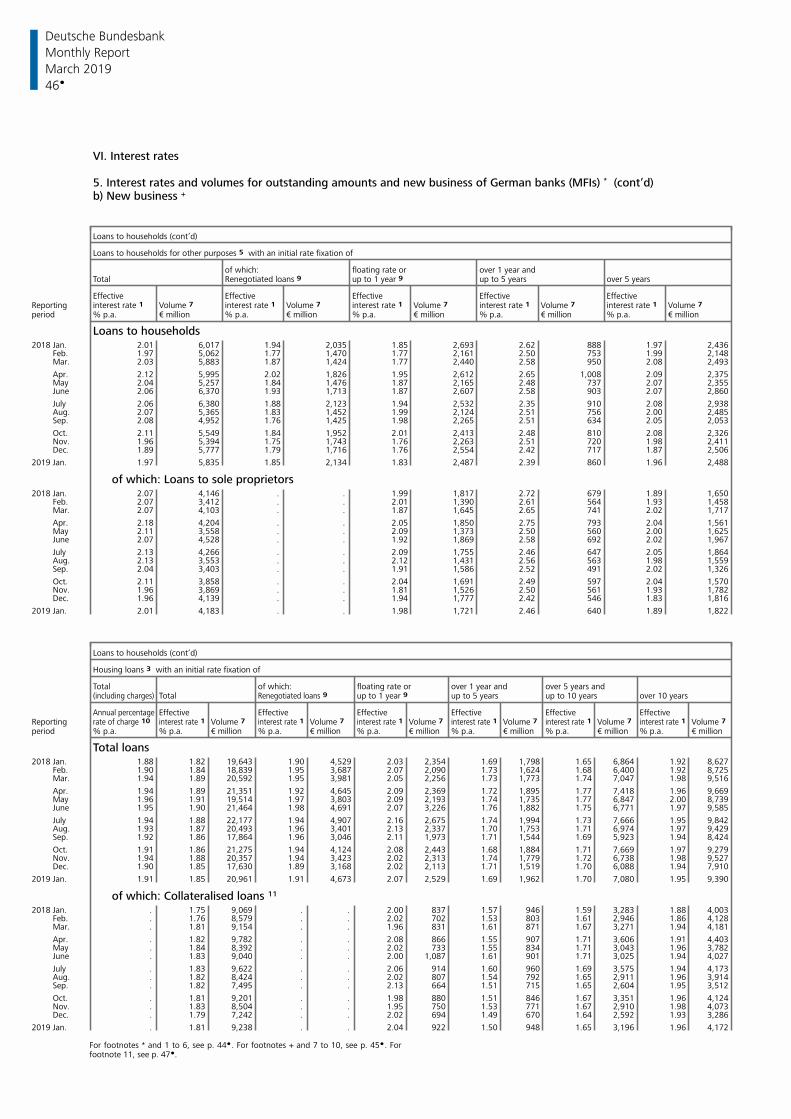
Deutsche Bundesbank
46
Monthly Report
March 2019
VI. Interest rates
5. Interest rates and volumes for outstanding amounts and new business of German banks (MFIs) * (cont’d)b) New business +
Loans to households (cont’d)
Loans to households for other purposes 5 with an initial rate fixation of
of which: floating rate or over 1 year andTotal Renegotiated loans 9 up to 1 year 9 up to 5 years over 5 years
Effective Effective Effective Effective EffectiveReporting Volume 7 Volume 7 Volume 7 Volume 7 Volume 7 interest rate 1 interest rate 1 interest rate 1 interest rate 1 interest rate 1 period % p.a. € million % p.a. € million % p.a. € million % p.a. € million % p.a. € million
Loans to households2018 Jan. 2.01 6,017 1.94 2,035 1.85 2,693 2.62 888 1.97 2,436 Feb. 1.97 5,062 1.77 1,470 1.77 2,161 2.50 753 1.99 2,148 Mar. 2.03 5,883 1.87 1,424 1.77 2,440 2.58 950 2.08 2,493
Apr. 2.12 5,995 2.02 1,826 1.95 2,612 2.65 1,008 2.09 2,375 May 2.04 5,257 1.84 1,476 1.87 2,165 2.48 737 2.07 2,355 June 2.06 6,370 1.93 1,713 1.87 2,607 2.58 903 2.07 2,860
July 2.06 6,380 1.88 2,123 1.94 2,532 2.35 910 2.08 2,938 Aug. 2.07 5,365 1.83 1,452 1.99 2,124 2.51 756 2.00 2,485 Sep. 2.08 4,952 1.76 1,425 1.98 2,265 2.51 634 2.05 2,053
Oct. 2.11 5,549 1.84 1,952 2.01 2,413 2.48 810 2.08 2,326 Nov. 1.96 5,394 1.75 1,743 1.76 2,263 2.51 720 1.98 2,411 Dec. 1.89 5,777 1.79 1,716 1.76 2,554 2.42 717 1.87 2,506
2019 Jan. 1.97 5,835 1.85 2,134 1.83 2,487 2.39 860 1.96 2,488
of which: Loans to sole proprietors2018 Jan. 2.07 4,146 . . 1.99 1,817 2.72 679 1.89 1,650 Feb. 2.07 3,412 . . 2.01 1,390 2.61 564 1.93 1,458 Mar. 2.07 4,103 . . 1.87 1,645 2.65 741 2.02 1,717
Apr. 2.18 4,204 . . 2.05 1,850 2.75 793 2.04 1,561 May 2.11 3,558 . . 2.09 1,373 2.50 560 2.00 1,625 June 2.07 4,528 . . 1.92 1,869 2.58 692 2.02 1,967
July 2.13 4,266 . . 2.09 1,755 2.46 647 2.05 1,864 Aug. 2.13 3,553 . . 2.12 1,431 2.56 563 1.98 1,559 Sep. 2.04 3,403 . . 1.91 1,586 2.52 491 2.02 1,326
Oct. 2.11 3,858 . . 2.04 1,691 2.49 597 2.04 1,570 Nov. 1.96 3,869 . . 1.81 1,526 2.50 561 1.93 1,782 Dec. 1.96 4,139 . . 1.94 1,777 2.42 546 1.83 1,816
2019 Jan. 2.01 4,183 . . 1.98 1,721 2.46 640 1.89 1,822
Loans to households (cont’d)
Housing loans 3 with an initial rate fixation of
Total of which: floating rate or over 1 year and over 5 years andTotal up to 1 year 9 up to 5 years up to 10 years over 10 years(including charges) Renegotiated loans 9
Effective Effective Effective Effective Effective EffectiveAnnual percentageReporting Volume 7 Volume 7 rate of charge 10 interest rate 1 interest rate 1 interest rate 1 Volume 7 interest rate 1 Volume 7 interest rate 1 Volume 7 interest rate 1 Volume 7 period % p.a. % p.a. % p.a. % p.a. % p.a. % p.a. % p.a.€ million € million € million € million € million € million
Total loans2018 Jan. 1.88 1.82 19,643 1.90 4,529 2.03 2,354 1.69 1,798 1.65 6,864 1.92 8,627 Feb. 1.90 1.84 18,839 1.95 3,687 2.07 2,090 1.73 1,624 1.68 6,400 1.92 8,725 Mar. 1.94 1.89 20,592 1.95 3,981 2.05 2,256 1.73 1,773 1.74 7,047 1.98 9,516
Apr. 1.94 1.89 21,351 1.92 4,645 2.09 2,369 1.72 1,895 1.77 7,418 1.96 9,669 May 1.96 1.91 19,514 1.97 3,803 2.09 2,193 1.74 1,735 1.77 6,847 2.00 8,739 June 1.95 1.90 21,464 1.98 4,691 2.07 3,226 1.76 1,882 1.75 6,771 1.97 9,585
July 1.94 1.88 22,177 1.94 4,907 2.16 2,675 1.74 1,994 1.73 7,666 1.95 9,842 Aug. 1.93 1.87 20,493 1.96 3,401 2.13 2,337 1.70 1,753 1.71 6,974 1.97 9,429 Sep. 1.92 1.86 17,864 1.96 3,046 2.11 1,973 1.71 1,544 1.69 5,923 1.94 8,424
Oct. 1.91 1.86 21,275 1.94 4,124 2.08 2,443 1.68 1,884 1.71 7,669 1.97 9,279 Nov. 1.94 1.88 20,357 1.94 3,423 2.02 2,313 1.74 1,779 1.72 6,738 1.98 9,527 Dec. 1.90 1.85 17,630 1.89 3,168 2.02 2,113 1.71 1,519 1.70 6,088 1.94 7,910
2019 Jan. 1.91 1.85 20,961 1.91 4,673 2.07 2,529 1.69 1,962 1.70 7,080 1.95 9,390
of which: Collateralised loans 11
2018 Jan. . 1.75 9,069 . . 2.00 837 1.57 946 1.59 3,283 1.88 4,003 Feb. . 1.76 8,579 . . 2.02 702 1.53 803 1.61 2,946 1.86 4,128 Mar. . 1.81 9,154 . . 1.96 831 1.61 871 1.67 3,271 1.94 4,181
Apr. . 1.82 9,782 . . 2.08 866 1.55 907 1.71 3,606 1.91 4,403 May . 1.84 8,392 . . 2.02 733 1.55 834 1.71 3,043 1.96 3,782 June . 1.83 9,040 . . 2.00 1,087 1.61 901 1.71 3,025 1.94 4,027
July . 1.83 9,622 . . 2.06 914 1.60 960 1.69 3,575 1.94 4,173 Aug. . 1.82 8,424 . . 2.02 807 1.54 792 1.65 2,911 1.96 3,914 Sep. . 1.82 7,495 . . 2.13 664 1.51 715 1.65 2,604 1.95 3,512
Oct. . 1.81 9,201 . . 1.98 880 1.51 846 1.67 3,351 1.96 4,124 Nov. . 1.83 8,504 . . 1.95 750 1.53 771 1.67 2,910 1.98 4,073 Dec. . 1.79 7,242 . . 2.02 694 1.49 670 1.64 2,592 1.93 3,286
2019 Jan. . 1.81 9,238 . . 2.04 922 1.50 948 1.65 3,196 1.96 4,172
For footnotes * and 1 to 6, see p. 44 . For footnotes + and 7 to 10, see p. 45 . For footnote 11, see p. 47 .
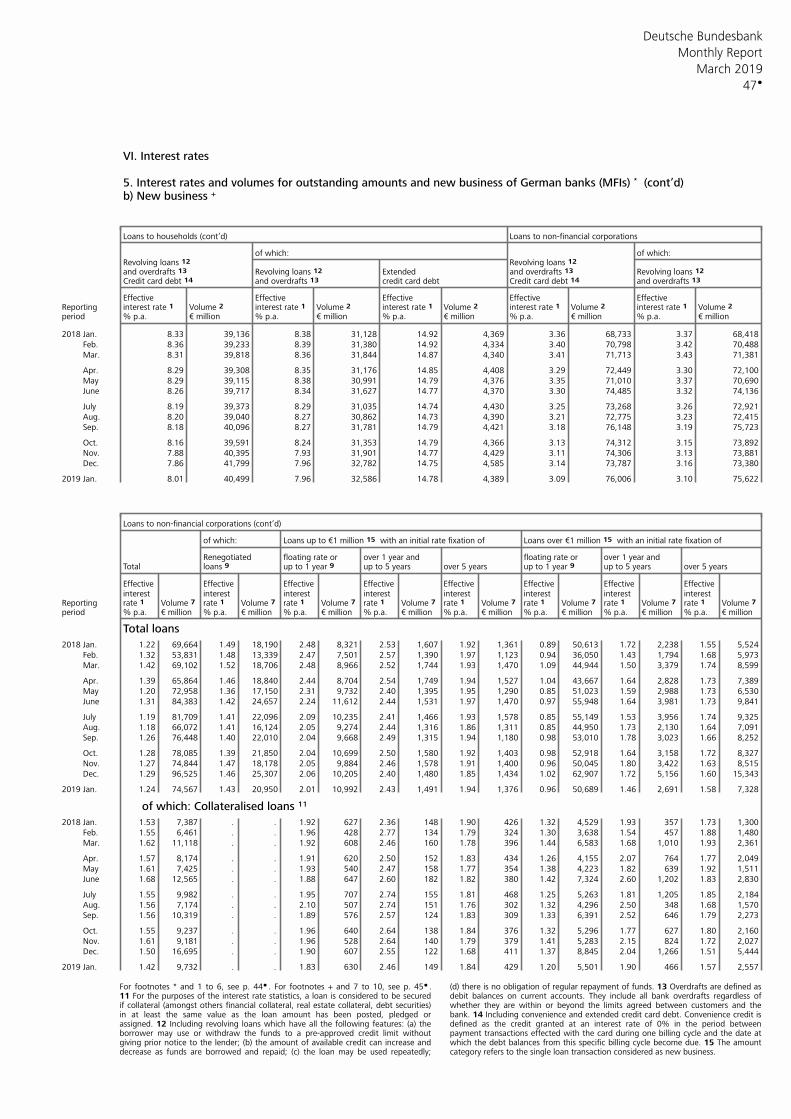
Deutsche Bundesbank
47
Monthly Report
March 2019
VI. Interest rates
5. Interest rates and volumes for outstanding amounts and new business of German banks (MFIs) * (cont’d)b) New business +
Loans to households (cont’d) Loans to non-financial corporations
of which: of which:Revolving loans 12 Revolving loans 12 and overdrafts 13 Revolving loans 12 Extended and overdrafts 13 Revolving loans 12 Credit card debt 14 and overdrafts 13 credit card debt Credit card debt 14 and overdrafts 13
Effective Effective Effective Effective EffectiveReporting Volume 2 Volume 2 Volume 2 Volume 2 Volume 2 interest rate 1 interest rate 1 interest rate 1 interest rate 1 interest rate 1 period % p.a. € million % p.a. € million % p.a. € million % p.a. € million % p.a. € million
2018 Jan. 8.33 39,136 8.38 31,128 14.92 4,369 3.36 68,733 3.37 68,418 Feb. 8.36 39,233 8.39 31,380 14.92 4,334 3.40 70,798 3.42 70,488 Mar. 8.31 39,818 8.36 31,844 14.87 4,340 3.41 71,713 3.43 71,381
Apr. 8.29 39,308 8.35 31,176 14.85 4,408 3.29 72,449 3.30 72,100 May 8.29 39,115 8.38 30,991 14.79 4,376 3.35 71,010 3.37 70,690 June 8.26 39,717 8.34 31,627 14.77 4,370 3.30 74,485 3.32 74,136
July 8.19 39,373 8.29 31,035 14.74 4,430 3.25 73,268 3.26 72,921 Aug. 8.20 39,040 8.27 30,862 14.73 4,390 3.21 72,775 3.23 72,415 Sep. 8.18 40,096 8.27 31,781 14.79 4,421 3.18 76,148 3.19 75,723
Oct. 8.16 39,591 8.24 31,353 14.79 4,366 3.13 74,312 3.15 73,892 Nov. 7.88 40,395 7.93 31,901 14.77 4,429 3.11 74,306 3.13 73,881 Dec. 7.86 41,799 7.96 32,782 14.75 4,585 3.14 73,787 3.16 73,380
2019 Jan. 8.01 40,499 7.96 32,586 14.78 4,389 3.09 76,006 3.10 75,622
Loans to non-financial corporations (cont’d)
of which: Loans up to €1 million 15 with an initial rate fixation of Loans over €1 million 15 with an initial rate fixation of
Renegotiated floating rate or over 1 year and floating rate or over 1 year andTotal loans 9 up to 1 year 9 up to 5 years over 5 years up to 1 year 9 up to 5 years over 5 years
Effective Effective Effective Effective Effective Effective Effective Effectiveinterest interest interest interest interest interest interest interest
Reporting rate 1 rate 1 rate 1 rate 1 rate 1 rate 1 rate 1 rate 1 Volume 7 Volume 7 Volume 7 Volume 7 Volume 7 Volume 7 Volume 7 Volume 7 period % p.a. % p.a. % p.a. % p.a. % p.a. % p.a. % p.a. % p.a.€ million € million € million € million € million € million € million € million
Total loans
2018 Jan. 1.22 69,664 1.49 18,190 2.48 8,321 2.53 1,607 1.92 1,361 0.89 50,613 1.72 2,238 1.55 5,524 Feb. 1.32 53,831 1.48 13,339 2.47 7,501 2.57 1,390 1.97 1,123 0.94 36,050 1.43 1,794 1.68 5,973 Mar. 1.42 69,102 1.52 18,706 2.48 8,966 2.52 1,744 1.93 1,470 1.09 44,944 1.50 3,379 1.74 8,599
Apr. 1.39 65,864 1.46 18,840 2.44 8,704 2.54 1,749 1.94 1,527 1.04 43,667 1.64 2,828 1.73 7,389 May 1.20 72,958 1.36 17,150 2.31 9,732 2.40 1,395 1.95 1,290 0.85 51,023 1.59 2,988 1.73 6,530 June 1.31 84,383 1.42 24,657 2.24 11,612 2.44 1,531 1.97 1,470 0.97 55,948 1.64 3,981 1.73 9,841
July 1.19 81,709 1.41 22,096 2.09 10,235 2.41 1,466 1.93 1,578 0.85 55,149 1.53 3,956 1.74 9,325 Aug. 1.18 66,072 1.41 16,124 2.05 9,274 2.44 1,316 1.86 1,311 0.85 44,950 1.73 2,130 1.64 7,091 Sep. 1.26 76,448 1.40 22,010 2.04 9,668 2.49 1,315 1.94 1,180 0.98 53,010 1.78 3,023 1.66 8,252
Oct. 1.28 78,085 1.39 21,850 2.04 10,699 2.50 1,580 1.92 1,403 0.98 52,918 1.64 3,158 1.72 8,327 Nov. 1.27 74,844 1.47 18,178 2.05 9,884 2.46 1,578 1.91 1,400 0.96 50,045 1.80 3,422 1.63 8,515 Dec. 1.29 96,525 1.46 25,307 2.06 10,205 2.40 1,480 1.85 1,434 1.02 62,907 1.72 5,156 1.60 15,343
2019 Jan. 1.24 74,567 1.43 20,950 2.01 10,992 2.43 1,491 1.94 1,376 0.96 50,689 1.46 2,691 1.58 7,328
of which: Collateralised loans 11
2018 Jan. 1.53 7,387 . . 1.92 627 2.36 148 1.90 426 1.32 4,529 1.93 357 1.73 1,300 Feb. 1.55 6,461 . . 1.96 428 2.77 134 1.79 324 1.30 3,638 1.54 457 1.88 1,480 Mar. 1.62 11,118 . . 1.92 608 2.46 160 1.78 396 1.44 6,583 1.68 1,010 1.93 2,361
Apr. 1.57 8,174 . . 1.91 620 2.50 152 1.83 434 1.26 4,155 2.07 764 1.77 2,049 May 1.61 7,425 . . 1.93 540 2.47 158 1.77 354 1.38 4,223 1.82 639 1.92 1,511 June 1.68 12,565 . . 1.88 647 2.60 182 1.82 380 1.42 7,324 2.60 1,202 1.83 2,830
July 1.55 9,982 . . 1.95 707 2.74 155 1.81 468 1.25 5,263 1.81 1,205 1.85 2,184 Aug. 1.56 7,174 . . 2.10 507 2.74 151 1.76 302 1.32 4,296 2.50 348 1.68 1,570 Sep. 1.56 10,319 . . 1.89 576 2.57 124 1.83 309 1.33 6,391 2.52 646 1.79 2,273
Oct. 1.55 9,237 . . 1.96 640 2.64 138 1.84 376 1.32 5,296 1.77 627 1.80 2,160 Nov. 1.61 9,181 . . 1.96 528 2.64 140 1.79 379 1.41 5,283 2.15 824 1.72 2,027 Dec. 1.50 16,695 . . 1.90 607 2.55 122 1.68 411 1.37 8,845 2.04 1,266 1.51 5,444
2019 Jan. 1.42 9,732 . . 1.83 630 2.46 149 1.84 429 1.20 5,501 1.90 466 1.57 2,557
For footnotes * and 1 to 6, see p. 44 . For footnotes + and 7 to 10, see p. 45 . (d) there is no obligation of regular repayment of funds. 13 Overdrafts are defined as11 For the purposes of the interest rate statistics, a loan is considered to be secured debit balances on current accounts. They include all bank overdrafts regardless ofif collateral (amongst others financial collateral, real estate collateral, debt securities) whether they are within or beyond the limits agreed between customers and thein at least the same value as the loan amount has been posted, pledged or bank. 14 Including convenience and extended credit card debt. Convenience credit isassigned. 12 Including revolving loans which have all the following features: (a) the defined as the credit granted at an interest rate of 0% in the period betweenborrower may use or withdraw the funds to a pre-approved credit limit without payment transactions effected with the card during one billing cycle and the date atgiving prior notice to the lender; (b) the amount of available credit can increase and which the debt balances from this specific billing cycle become due. 15 The amountdecrease as funds are borrowed and repaid; (c) the loan may be used repeatedly; category refers to the single loan transaction considered as new business.
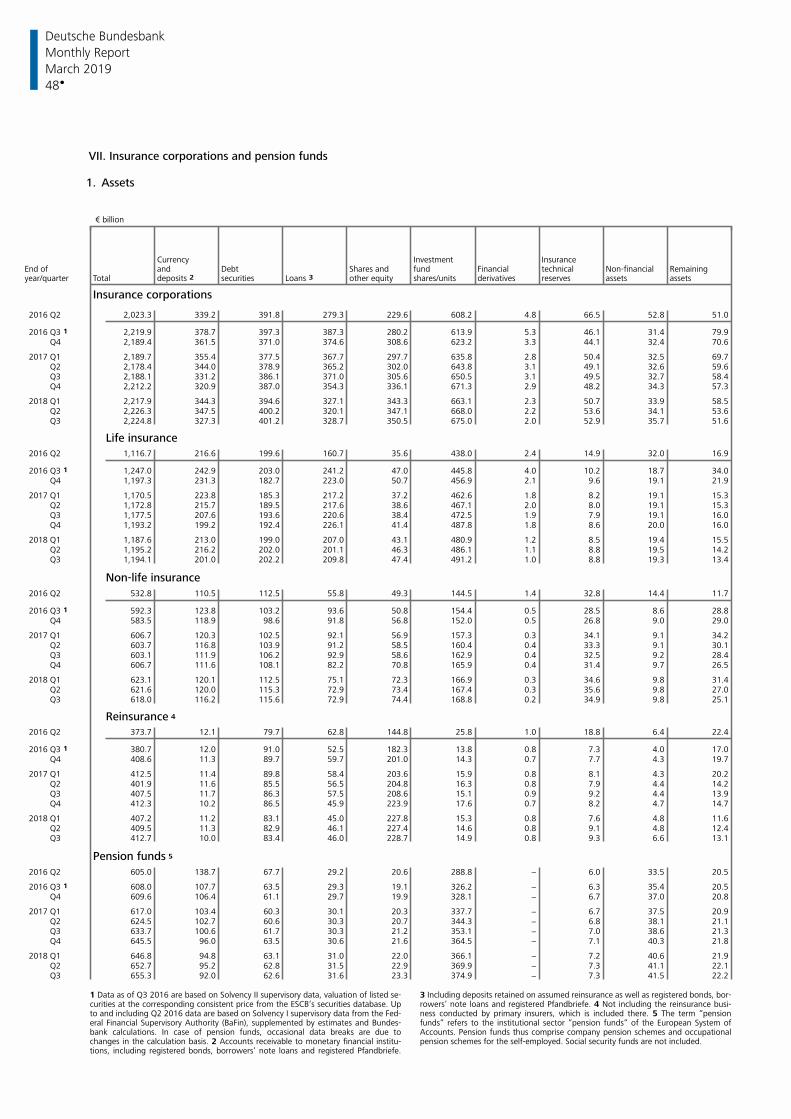
Deutsche Bundesbank
48
Monthly Report
March 2019
VII. Insurance corporations and pension funds 1. Assets € billion
Currency Investment InsuranceEnd of and Debt Shares and fund Financial technical Non-financial Remainingyear/quarter Total deposits 2 securities Loans 3 other equity shares/units derivatives reserves assets assets
Insurance corporations
2016 Q2 2,023.3 339.2 391.8 279.3 229.6 608.2 4.8 66.5 52.8 51.0
2016 Q3 1 2,219.9 378.7 397.3 387.3 280.2 613.9 5.3 46.1 31.4 79.9 Q4 2,189.4 361.5 371.0 374.6 308.6 623.2 3.3 44.1 32.4 70.6
2017 Q1 2,189.7 355.4 377.5 367.7 297.7 635.8 2.8 50.4 32.5 69.7 Q2 2,178.4 344.0 378.9 365.2 302.0 643.8 3.1 49.1 32.6 59.6 Q3 2,188.1 331.2 386.1 371.0 305.6 650.5 3.1 49.5 32.7 58.4 Q4 2,212.2 320.9 387.0 354.3 336.1 671.3 2.9 48.2 34.3 57.3
2018 Q1 2,217.9 344.3 394.6 327.1 343.3 663.1 2.3 50.7 33.9 58.5 Q2 2,226.3 347.5 400.2 320.1 347.1 668.0 2.2 53.6 34.1 53.6 Q3 2,224.8 327.3 401.2 328.7 350.5 675.0 2.0 52.9 35.7 51.6
Life insurance
2016 Q2 1,116.7 216.6 199.6 160.7 35.6 438.0 2.4 14.9 32.0 16.9
2016 Q3 1 1,247.0 242.9 203.0 241.2 47.0 445.8 4.0 10.2 18.7 34.0 Q4 1,197.3 231.3 182.7 223.0 50.7 456.9 2.1 9.6 19.1 21.9
2017 Q1 1,170.5 223.8 185.3 217.2 37.2 462.6 1.8 8.2 19.1 15.3 Q2 1,172.8 215.7 189.5 217.6 38.6 467.1 2.0 8.0 19.1 15.3 Q3 1,177.5 207.6 193.6 220.6 38.4 472.5 1.9 7.9 19.1 16.0 Q4 1,193.2 199.2 192.4 226.1 41.4 487.8 1.8 8.6 20.0 16.0
2018 Q1 1,187.6 213.0 199.0 207.0 43.1 480.9 1.2 8.5 19.4 15.5 Q2 1,195.2 216.2 202.0 201.1 46.3 486.1 1.1 8.8 19.5 14.2 Q3 1,194.1 201.0 202.2 209.8 47.4 491.2 1.0 8.8 19.3 13.4
Non-life insurance
2016 Q2 532.8 110.5 112.5 55.8 49.3 144.5 1.4 32.8 14.4 11.7
2016 Q3 1 592.3 123.8 103.2 93.6 50.8 154.4 0.5 28.5 8.6 28.8 Q4 583.5 118.9 98.6 91.8 56.8 152.0 0.5 26.8 9.0 29.0
2017 Q1 606.7 120.3 102.5 92.1 56.9 157.3 0.3 34.1 9.1 34.2 Q2 603.7 116.8 103.9 91.2 58.5 160.4 0.4 33.3 9.1 30.1 Q3 603.1 111.9 106.2 92.9 58.6 162.9 0.4 32.5 9.2 28.4 Q4 606.7 111.6 108.1 82.2 70.8 165.9 0.4 31.4 9.7 26.5
2018 Q1 623.1 120.1 112.5 75.1 72.3 166.9 0.3 34.6 9.8 31.4 Q2 621.6 120.0 115.3 72.9 73.4 167.4 0.3 35.6 9.8 27.0 Q3 618.0 116.2 115.6 72.9 74.4 168.8 0.2 34.9 9.8 25.1
Reinsurance 4
2016 Q2 373.7 12.1 79.7 62.8 144.8 25.8 1.0 18.8 6.4 22.4
2016 Q3 1 380.7 12.0 91.0 52.5 182.3 13.8 0.8 7.3 4.0 17.0 Q4 408.6 11.3 89.7 59.7 201.0 14.3 0.7 7.7 4.3 19.7
2017 Q1 412.5 11.4 89.8 58.4 203.6 15.9 0.8 8.1 4.3 20.2 Q2 401.9 11.6 85.5 56.5 204.8 16.3 0.8 7.9 4.4 14.2 Q3 407.5 11.7 86.3 57.5 208.6 15.1 0.9 9.2 4.4 13.9 Q4 412.3 10.2 86.5 45.9 223.9 17.6 0.7 8.2 4.7 14.7
2018 Q1 407.2 11.2 83.1 45.0 227.8 15.3 0.8 7.6 4.8 11.6 Q2 409.5 11.3 82.9 46.1 227.4 14.6 0.8 9.1 4.8 12.4 Q3 412.7 10.0 83.4 46.0 228.7 14.9 0.8 9.3 6.6 13.1
Pension funds 5
2016 Q2 605.0 138.7 67.7 29.2 20.6 288.8 − 6.0 33.5 20.5
2016 Q3 1 608.0 107.7 63.5 29.3 19.1 326.2 − 6.3 35.4 20.5 Q4 609.6 106.4 61.1 29.7 19.9 328.1 − 6.7 37.0 20.8
2017 Q1 617.0 103.4 60.3 30.1 20.3 337.7 − 6.7 37.5 20.9 Q2 624.5 102.7 60.6 30.3 20.7 344.3 − 6.8 38.1 21.1 Q3 633.7 100.6 61.7 30.3 21.2 353.1 − 7.0 38.6 21.3 Q4 645.5 96.0 63.5 30.6 21.6 364.5 − 7.1 40.3 21.8
2018 Q1 646.8 94.8 63.1 31.0 22.0 366.1 − 7.2 40.6 21.9 Q2 652.7 95.2 62.8 31.5 22.9 369.9 − 7.3 41.1 22.1 Q3 655.3 92.0 62.6 31.6 23.3 374.9 − 7.3 41.5 22.2
1 Data as of Q3 2016 are based on Solvency II supervisory data, valuation of listed se- 3 Including deposits retained on assumed reinsurance as well as registered bonds, bor-curities at the corresponding consistent price from the ESCB’s securities database. Up rowers’ note loans and registered Pfandbriefe. 4 Not including the reinsurance busi-to and including Q2 2016 data are based on Solvency I supervisory data from the Fed- ness conducted by primary insurers, which is included there. 5 The term “pensioneral Financial Supervisory Authority (BaFin), supplemented by estimates and Bundes- funds“ refers to the institutional sector “pension funds“ of the European System ofbank calculations. In case of pension funds, occasional data breaks are due to Accounts. Pension funds thus comprise company pension schemes and occupationalchanges in the calculation basis. 2 Accounts receivable to monetary financial institu- pension schemes for the self-employed. Social security funds are not included. tions, including registered bonds, borrowers’ note loans and registered Pfandbriefe.
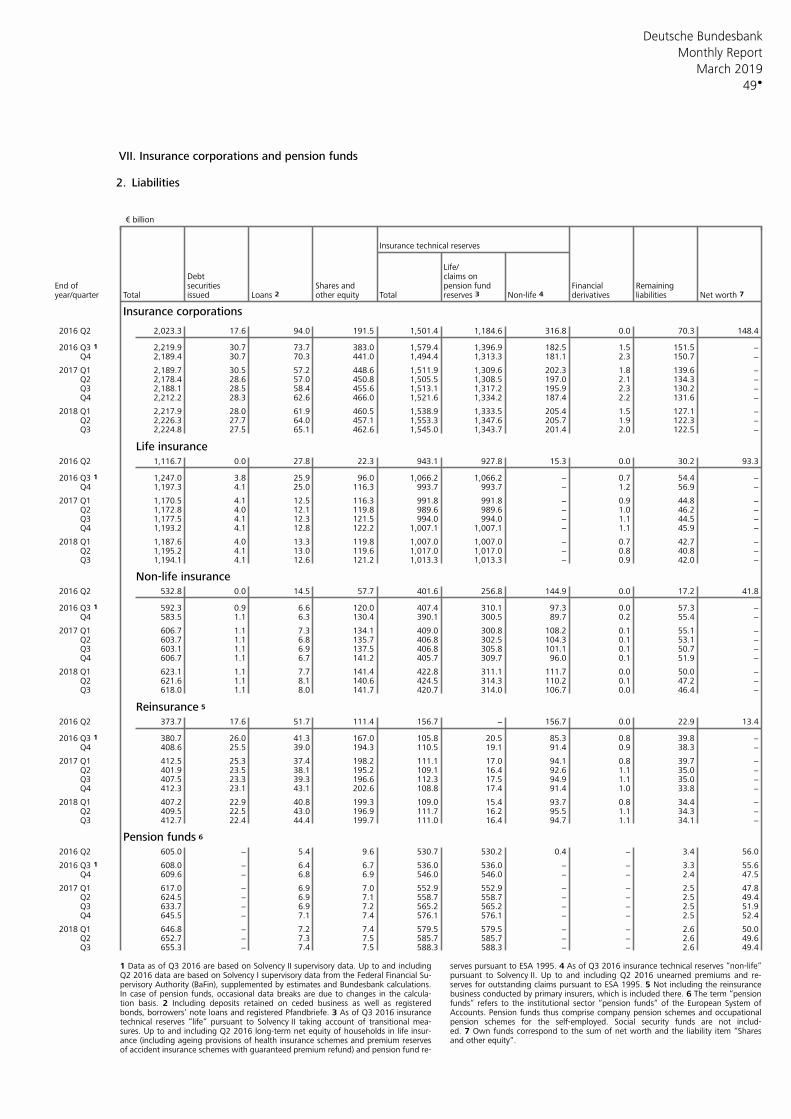
Deutsche Bundesbank
49
Monthly Report
March 2019
VII. Insurance corporations and pension funds 2. Liabilities € billion
Insurance technical reserves
Life/Debt claims on
End of securities Shares and pension fund Financial Remainingyear/quarter Total issued Loans 2 other equity Total reserves 3 Non-life 4 derivatives liabilities Net worth 7
Insurance corporations
2016 Q2 2,023.3 17.6 94.0 191.5 1,501.4 1,184.6 316.8 0.0 70.3 148.4
2016 Q3 1 2,219.9 30.7 73.7 383.0 1,579.4 1,396.9 182.5 1.5 151.5 − Q4 2,189.4 30.7 70.3 441.0 1,494.4 1,313.3 181.1 2.3 150.7 −
2017 Q1 2,189.7 30.5 57.2 448.6 1,511.9 1,309.6 202.3 1.8 139.6 − Q2 2,178.4 28.6 57.0 450.8 1,505.5 1,308.5 197.0 2.1 134.3 − Q3 2,188.1 28.5 58.4 455.6 1,513.1 1,317.2 195.9 2.3 130.2 − Q4 2,212.2 28.3 62.6 466.0 1,521.6 1,334.2 187.4 2.2 131.6 −
2018 Q1 2,217.9 28.0 61.9 460.5 1,538.9 1,333.5 205.4 1.5 127.1 − Q2 2,226.3 27.7 64.0 457.1 1,553.3 1,347.6 205.7 1.9 122.3 − Q3 2,224.8 27.5 65.1 462.6 1,545.0 1,343.7 201.4 2.0 122.5 −
Life insurance2016 Q2 1,116.7 0.0 27.8 22.3 943.1 927.8 15.3 0.0 30.2 93.3
2016 Q3 1 1,247.0 3.8 25.9 96.0 1,066.2 1,066.2 − 0.7 54.4 − Q4 1,197.3 4.1 25.0 116.3 993.7 993.7 − 1.2 56.9 −
2017 Q1 1,170.5 4.1 12.5 116.3 991.8 991.8 − 0.9 44.8 − Q2 1,172.8 4.0 12.1 119.8 989.6 989.6 − 1.0 46.2 − Q3 1,177.5 4.1 12.3 121.5 994.0 994.0 − 1.1 44.5 − Q4 1,193.2 4.1 12.8 122.2 1,007.1 1,007.1 − 1.1 45.9 −
2018 Q1 1,187.6 4.0 13.3 119.8 1,007.0 1,007.0 − 0.7 42.7 − Q2 1,195.2 4.1 13.0 119.6 1,017.0 1,017.0 − 0.8 40.8 − Q3 1,194.1 4.1 12.6 121.2 1,013.3 1,013.3 − 0.9 42.0 −
Non-life insurance2016 Q2 532.8 0.0 14.5 57.7 401.6 256.8 144.9 0.0 17.2 41.8
2016 Q3 1 592.3 0.9 6.6 120.0 407.4 310.1 97.3 0.0 57.3 − Q4 583.5 1.1 6.3 130.4 390.1 300.5 89.7 0.2 55.4 −
2017 Q1 606.7 1.1 7.3 134.1 409.0 300.8 108.2 0.1 55.1 − Q2 603.7 1.1 6.8 135.7 406.8 302.5 104.3 0.1 53.1 − Q3 603.1 1.1 6.9 137.5 406.8 305.8 101.1 0.1 50.7 − Q4 606.7 1.1 6.7 141.2 405.7 309.7 96.0 0.1 51.9 −
2018 Q1 623.1 1.1 7.7 141.4 422.8 311.1 111.7 0.0 50.0 − Q2 621.6 1.1 8.1 140.6 424.5 314.3 110.2 0.1 47.2 − Q3 618.0 1.1 8.0 141.7 420.7 314.0 106.7 0.0 46.4 −
Reinsurance 5
2016 Q2 373.7 17.6 51.7 111.4 156.7 − 156.7 0.0 22.9 13.4
2016 Q3 1 380.7 26.0 41.3 167.0 105.8 20.5 85.3 0.8 39.8 − Q4 408.6 25.5 39.0 194.3 110.5 19.1 91.4 0.9 38.3 −
2017 Q1 412.5 25.3 37.4 198.2 111.1 17.0 94.1 0.8 39.7 − Q2 401.9 23.5 38.1 195.2 109.1 16.4 92.6 1.1 35.0 − Q3 407.5 23.3 39.3 196.6 112.3 17.5 94.9 1.1 35.0 − Q4 412.3 23.1 43.1 202.6 108.8 17.4 91.4 1.0 33.8 −
2018 Q1 407.2 22.9 40.8 199.3 109.0 15.4 93.7 0.8 34.4 − Q2 409.5 22.5 43.0 196.9 111.7 16.2 95.5 1.1 34.3 − Q3 412.7 22.4 44.4 199.7 111.0 16.4 94.7 1.1 34.1 −
Pension funds 6
2016 Q2 605.0 − 5.4 9.6 530.7 530.2 0.4 − 3.4 56.0
2016 Q3 1 608.0 − 6.4 6.7 536.0 536.0 − − 3.3 55.6 Q4 609.6 − 6.8 6.9 546.0 546.0 − − 2.4 47.5
2017 Q1 617.0 − 6.9 7.0 552.9 552.9 − − 2.5 47.8 Q2 624.5 − 6.9 7.1 558.7 558.7 − − 2.5 49.4 Q3 633.7 − 6.9 7.2 565.2 565.2 − − 2.5 51.9 Q4 645.5 − 7.1 7.4 576.1 576.1 − − 2.5 52.4
2018 Q1 646.8 − 7.2 7.4 579.5 579.5 − − 2.6 50.0 Q2 652.7 − 7.3 7.5 585.7 585.7 − − 2.6 49.6 Q3 655.3 − 7.4 7.5 588.3 588.3 − − 2.6 49.4
1 Data as of Q3 2016 are based on Solvency II supervisory data. Up to and including serves pursuant to ESA 1995. 4 As of Q3 2016 insurance technical reserves “non-life“Q2 2016 data are based on Solvency I supervisory data from the Federal Financial Su- pursuant to Solvency II. Up to and including Q2 2016 unearned premiums and re-pervisory Authority (BaFin), supplemented by estimates and Bundesbank calculations. serves for outstanding claims pursuant to ESA 1995. 5 Not including the reinsuranceIn case of pension funds, occasional data breaks are due to changes in the calcula- business conducted by primary insurers, which is included there. 6 The term “pensiontion basis. 2 Including deposits retained on ceded business as well as registered funds“ refers to the institutional sector “pension funds“ of the European System ofbonds, borrowers’ note loans and registered Pfandbriefe. 3 As of Q3 2016 insurance Accounts. Pension funds thus comprise company pension schemes and occupationaltechnical reserves “life“ pursuant to Solvency II taking account of transitional mea- pension schemes for the self-employed. Social security funds are not includ-sures. Up to and including Q2 2016 long-term net equity of households in life insur- ed. 7 Own funds correspond to the sum of net worth and the liability item “Sharesance (including ageing provisions of health insurance schemes and premium reserves and other equity“. of accident insurance schemes with guaranteed premium refund) and pension fund re-
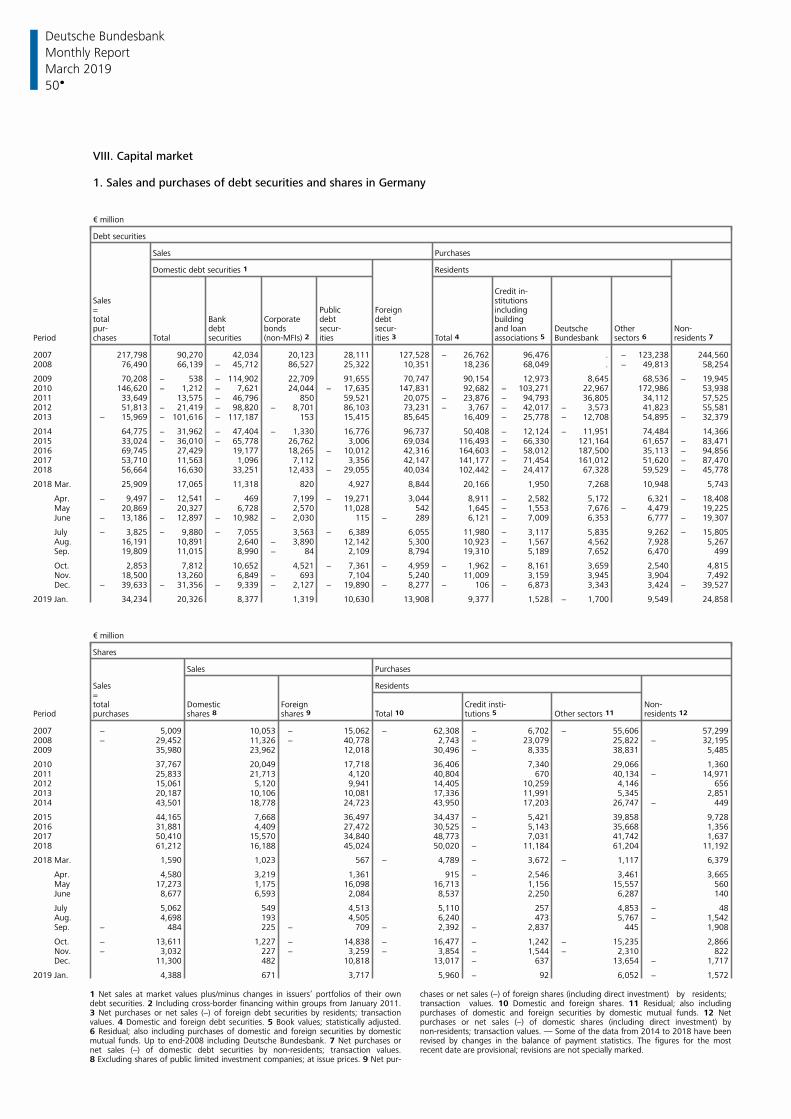
Deutsche Bundesbank
50
Monthly Report
March 2019
VIII. Capital market
1. Sales and purchases of debt securities and shares in Germany
€ million
Debt securities
Sales Purchases
Domestic debt securities 1 Residents
Credit in-Sales stitutions= Public Foreign includingtotal Bank Corporate debt debt buildingpur- debt bonds secur- secur- and loan Deutsche Other Non-
Period chases Total securities ities ities 3 Total 4 Bundesbank sectors 6 residents 7 (non-MFIs) 2 associations 5
2007 217,798 90,270 42,034 20,123 28,111 127,528 − 26,762 96,476 . − 123,238 244,5602008 76,490 66,139 − 45,712 86,527 25,322 10,351 18,236 68,049 . − 49,813 58,254
2009 70,208 − 538 − 114,902 22,709 91,655 70,747 90,154 12,973 8,645 68,536 − 19,9452010 146,620 − 1,212 − 7,621 24,044 − 17,635 147,831 92,682 − 103,271 22,967 172,986 53,9382011 33,649 13,575 − 46,796 850 59,521 20,075 − 23,876 − 94,793 36,805 34,112 57,5252012 51,813 − 21,419 − 98,820 − 8,701 86,103 73,231 − 3,767 − 42,017 − 3,573 41,823 55,5812013 − 15,969 − 101,616 − 117,187 153 15,415 85,645 16,409 − 25,778 − 12,708 54,895 − 32,379
2014 64,775 − 31,962 − 47,404 − 1,330 16,776 96,737 50,408 − 12,124 − 11,951 74,484 14,3662015 33,024 − 36,010 − 65,778 26,762 3,006 69,034 116,493 − 66,330 121,164 61,657 − 83,4712016 69,745 27,429 19,177 18,265 − 10,012 42,316 164,603 − 58,012 187,500 35,113 − 94,8562017 53,710 11,563 1,096 7,112 3,356 42,147 141,177 − 71,454 161,012 51,620 − 87,4702018 56,664 16,630 33,251 12,433 − 29,055 40,034 102,442 − 24,417 67,328 59,529 − 45,778
2018 Mar. 25,909 17,065 11,318 820 4,927 8,844 20,166 1,950 7,268 10,948 5,743
Apr. − 9,497 − 12,541 − 469 7,199 − 19,271 3,044 8,911 − 2,582 5,172 6,321 − 18,408 May 20,869 20,327 6,728 2,570 11,028 542 1,645 − 1,553 7,676 − 4,479 19,225 June − 13,186 − 12,897 − 10,982 − 2,030 115 − 289 6,121 − 7,009 6,353 6,777 − 19,307
July − 3,825 − 9,880 − 7,055 3,563 − 6,389 6,055 11,980 − 3,117 5,835 9,262 − 15,805 Aug. 16,191 10,891 2,640 − 3,890 12,142 5,300 10,923 − 1,567 4,562 7,928 5,267 Sep. 19,809 11,015 8,990 − 84 2,109 8,794 19,310 5,189 7,652 6,470 499
Oct. 2,853 7,812 10,652 4,521 − 7,361 − 4,959 − 1,962 − 8,161 3,659 2,540 4,815 Nov. 18,500 13,260 6,849 − 693 7,104 5,240 11,009 3,159 3,945 3,904 7,492 Dec. − 39,633 − 31,356 − 9,339 − 2,127 − 19,890 − 8,277 − 106 − 6,873 3,343 3,424 − 39,527
2019 Jan. 34,234 20,326 8,377 1,319 10,630 13,908 9,377 1,528 − 1,700 9,549 24,858
€ million
Shares
Sales Purchases
Sales Residents=total Domestic Foreign Credit insti- Non-
Period purchases shares 8 shares 9 Total 10 tutions 5 Other sectors 11 residents 12
2007 − 5,009 10,053 − 15,062 − 62,308 − 6,702 − 55,606 57,2992008 − 29,452 11,326 − 40,778 2,743 − 23,079 25,822 − 32,1952009 35,980 23,962 12,018 30,496 − 8,335 38,831 5,485
2010 37,767 20,049 17,718 36,406 7,340 29,066 1,3602011 25,833 21,713 4,120 40,804 670 40,134 − 14,9712012 15,061 5,120 9,941 14,405 10,259 4,146 6562013 20,187 10,106 10,081 17,336 11,991 5,345 2,8512014 43,501 18,778 24,723 43,950 17,203 26,747 − 449
2015 44,165 7,668 36,497 34,437 − 5,421 39,858 9,7282016 31,881 4,409 27,472 30,525 − 5,143 35,668 1,3562017 50,410 15,570 34,840 48,773 7,031 41,742 1,6372018 61,212 16,188 45,024 50,020 − 11,184 61,204 11,192
2018 Mar. 1,590 1,023 567 − 4,789 − 3,672 − 1,117 6,379
Apr. 4,580 3,219 1,361 915 − 2,546 3,461 3,665 May 17,273 1,175 16,098 16,713 1,156 15,557 560 June 8,677 6,593 2,084 8,537 2,250 6,287 140
July 5,062 549 4,513 5,110 257 4,853 − 48 Aug. 4,698 193 4,505 6,240 473 5,767 − 1,542 Sep. − 484 225 − 709 − 2,392 − 2,837 445 1,908
Oct. − 13,611 1,227 − 14,838 − 16,477 − 1,242 − 15,235 2,866 Nov. − 3,032 227 − 3,259 − 3,854 − 1,544 − 2,310 822 Dec. 11,300 482 10,818 13,017 − 637 13,654 − 1,717
2019 Jan. 4,388 671 3,717 5,960 − 92 6,052 − 1,572
1 Net sales at market values plus/minus changes in issuers’ portfolios of their own chases or net sales (−) of foreign shares (including direct investment) by residents; debt securities. 2 Including cross-border financing within groups from January 2011. transaction values. 10 Domestic and foreign shares. 11 Residual; also including3 Net purchases or net sales (−) of foreign debt securities by residents; transaction purchases of domestic and foreign securities by domestic mutual funds. 12 Netvalues. 4 Domestic and foreign debt securities. 5 Book values; statistically adjusted. purchases or net sales (−) of domestic shares (including direct investment) by6 Residual; also including purchases of domestic and foreign securities by domestic non-residents; transaction values. — Some of the data from 2014 to 2018 have beenmutual funds. Up to end-2008 including Deutsche Bundesbank. 7 Net purchases or revised by changes in the balance of payment statistics. The figures for the mostnet sales (−) of domestic debt securities by non-residents; transaction values. recent date are provisional; revisions are not specially marked. 8 Excluding shares of public limited investment companies; at issue prices. 9 Net pur-
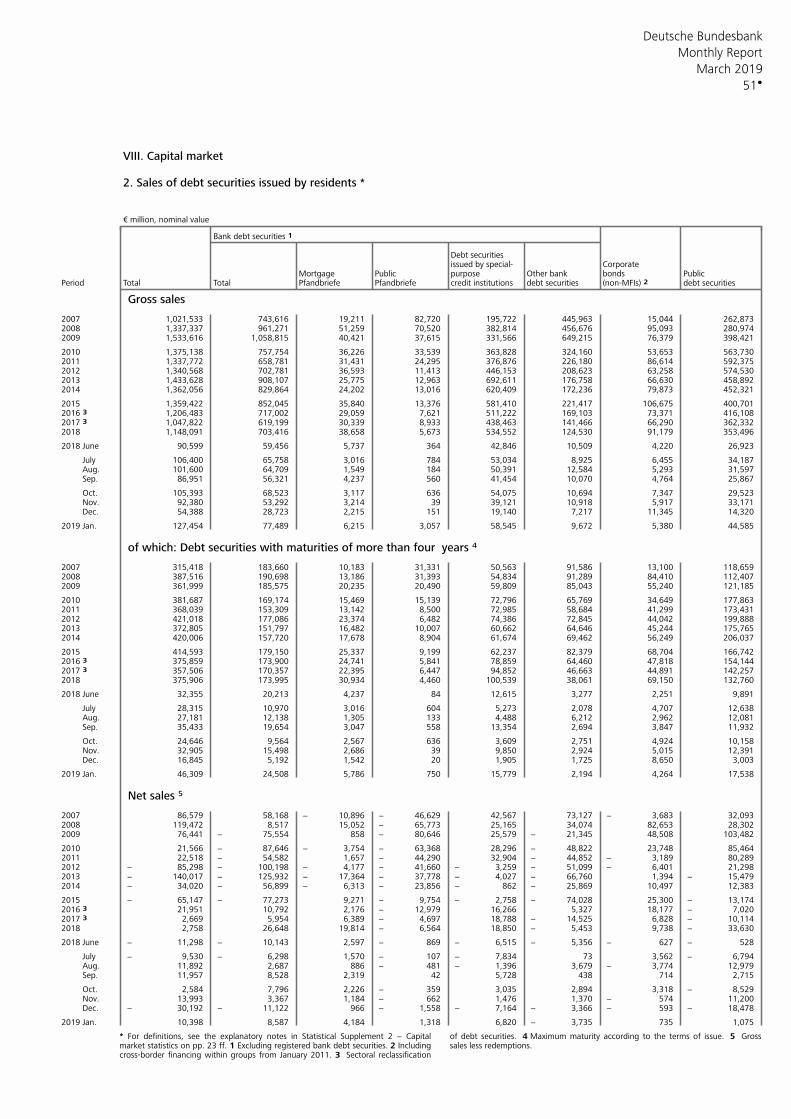
Deutsche Bundesbank
51
Monthly Report
March 2019
VIII. Capital market
2. Sales of debt securities issued by residents *
€ million, nominal value
Bank debt securities 1
Debt securitiesCorporateissued by special-
Mortgage Public purpose Other bank bonds PublicPeriod Total Total Pfandbriefe Pfandbriefe debt securities (non-MFIs) 2 debt securitiescredit institutions
Gross sales
2007 1,021,533 743,616 19,211 82,720 195,722 445,963 15,044 262,8732008 1,337,337 961,271 51,259 70,520 382,814 456,676 95,093 280,9742009 1,533,616 1,058,815 40,421 37,615 331,566 649,215 76,379 398,421
2010 1,375,138 757,754 36,226 33,539 363,828 324,160 53,653 563,7302011 1,337,772 658,781 31,431 24,295 376,876 226,180 86,614 592,3752012 1,340,568 702,781 36,593 11,413 446,153 208,623 63,258 574,5302013 1,433,628 908,107 25,775 12,963 692,611 176,758 66,630 458,8922014 1,362,056 829,864 24,202 13,016 620,409 172,236 79,873 452,321
2015 1,359,422 852,045 35,840 13,376 581,410 221,417 106,675 400,7012016 3 1,206,483 717,002 29,059 7,621 511,222 169,103 73,371 416,1082017 3 1,047,822 619,199 30,339 8,933 438,463 141,466 66,290 362,3322018 1,148,091 703,416 38,658 5,673 534,552 124,530 91,179 353,496
2018 June 90,599 59,456 5,737 364 42,846 10,509 4,220 26,923
July 106,400 65,758 3,016 784 53,034 8,925 6,455 34,187 Aug. 101,600 64,709 1,549 184 50,391 12,584 5,293 31,597 Sep. 86,951 56,321 4,237 560 41,454 10,070 4,764 25,867
Oct. 105,393 68,523 3,117 636 54,075 10,694 7,347 29,523 Nov. 92,380 53,292 3,214 39 39,121 10,918 5,917 33,171 Dec. 54,388 28,723 2,215 151 19,140 7,217 11,345 14,320
2019 Jan. 127,454 77,489 6,215 3,057 58,545 9,672 5,380 44,585
of which: Debt securities with maturities of more than four years 4
2007 315,418 183,660 10,183 31,331 50,563 91,586 13,100 118,6592008 387,516 190,698 13,186 31,393 54,834 91,289 84,410 112,4072009 361,999 185,575 20,235 20,490 59,809 85,043 55,240 121,185
2010 381,687 169,174 15,469 15,139 72,796 65,769 34,649 177,8632011 368,039 153,309 13,142 8,500 72,985 58,684 41,299 173,4312012 421,018 177,086 23,374 6,482 74,386 72,845 44,042 199,8882013 372,805 151,797 16,482 10,007 60,662 64,646 45,244 175,7652014 420,006 157,720 17,678 8,904 61,674 69,462 56,249 206,037
2015 414,593 179,150 25,337 9,199 62,237 82,379 68,704 166,7422016 3 375,859 173,900 24,741 5,841 78,859 64,460 47,818 154,1442017 3 357,506 170,357 22,395 6,447 94,852 46,663 44,891 142,2572018 375,906 173,995 30,934 4,460 100,539 38,061 69,150 132,760
2018 June 32,355 20,213 4,237 84 12,615 3,277 2,251 9,891
July 28,315 10,970 3,016 604 5,273 2,078 4,707 12,638 Aug. 27,181 12,138 1,305 133 4,488 6,212 2,962 12,081 Sep. 35,433 19,654 3,047 558 13,354 2,694 3,847 11,932
Oct. 24,646 9,564 2,567 636 3,609 2,751 4,924 10,158 Nov. 32,905 15,498 2,686 39 9,850 2,924 5,015 12,391 Dec. 16,845 5,192 1,542 20 1,905 1,725 8,650 3,003
2019 Jan. 46,309 24,508 5,786 750 15,779 2,194 4,264 17,538
Net sales 5
2007 86,579 58,168 − 10,896 − 46,629 42,567 73,127 − 3,683 32,0932008 119,472 8,517 15,052 − 65,773 25,165 34,074 82,653 28,3022009 76,441 − 75,554 858 − 80,646 25,579 − 21,345 48,508 103,482
2010 21,566 − 87,646 − 3,754 − 63,368 28,296 − 48,822 23,748 85,4642011 22,518 − 54,582 1,657 − 44,290 32,904 − 44,852 − 3,189 80,2892012 − 85,298 − 100,198 − 4,177 − 41,660 − 3,259 − 51,099 − 6,401 21,2982013 − 140,017 − 125,932 − 17,364 − 37,778 − 4,027 − 66,760 1,394 − 15,4792014 − 34,020 − 56,899 − 6,313 − 23,856 − 862 − 25,869 10,497 12,383
2015 − 65,147 − 77,273 9,271 − 9,754 − 2,758 − 74,028 25,300 − 13,1742016 3 21,951 10,792 2,176 − 12,979 16,266 5,327 18,177 − 7,0202017 3 2,669 5,954 6,389 − 4,697 18,788 − 14,525 6,828 − 10,1142018 2,758 26,648 19,814 − 6,564 18,850 − 5,453 9,738 − 33,630
2018 June − 11,298 − 10,143 2,597 − 869 − 6,515 − 5,356 − 627 − 528
July − 9,530 − 6,298 1,570 − 107 − 7,834 73 3,562 − 6,794 Aug. 11,892 2,687 886 − 481 − 1,396 3,679 − 3,774 12,979 Sep. 11,957 8,528 2,319 42 5,728 438 714 2,715
Oct. 2,584 7,796 2,226 − 359 3,035 2,894 3,318 − 8,529 Nov. 13,993 3,367 1,184 − 662 1,476 1,370 − 574 11,200 Dec. − 30,192 − 11,122 966 − 1,558 − 7,164 − 3,366 − 593 − 18,478
2019 Jan. 10,398 8,587 4,184 1,318 6,820 − 3,735 735 1,075
* For definitions, see the explanatory notes in Statistical Supplement 2 − Capital of debt securities. 4 Maximum maturity according to the terms of issue. 5 Grossmarket statistics on pp. 23 ff. 1 Excluding registered bank debt securities. 2 Including sales less redemptions. cross-border financing within groups from January 2011. 3 Sectoral reclassification
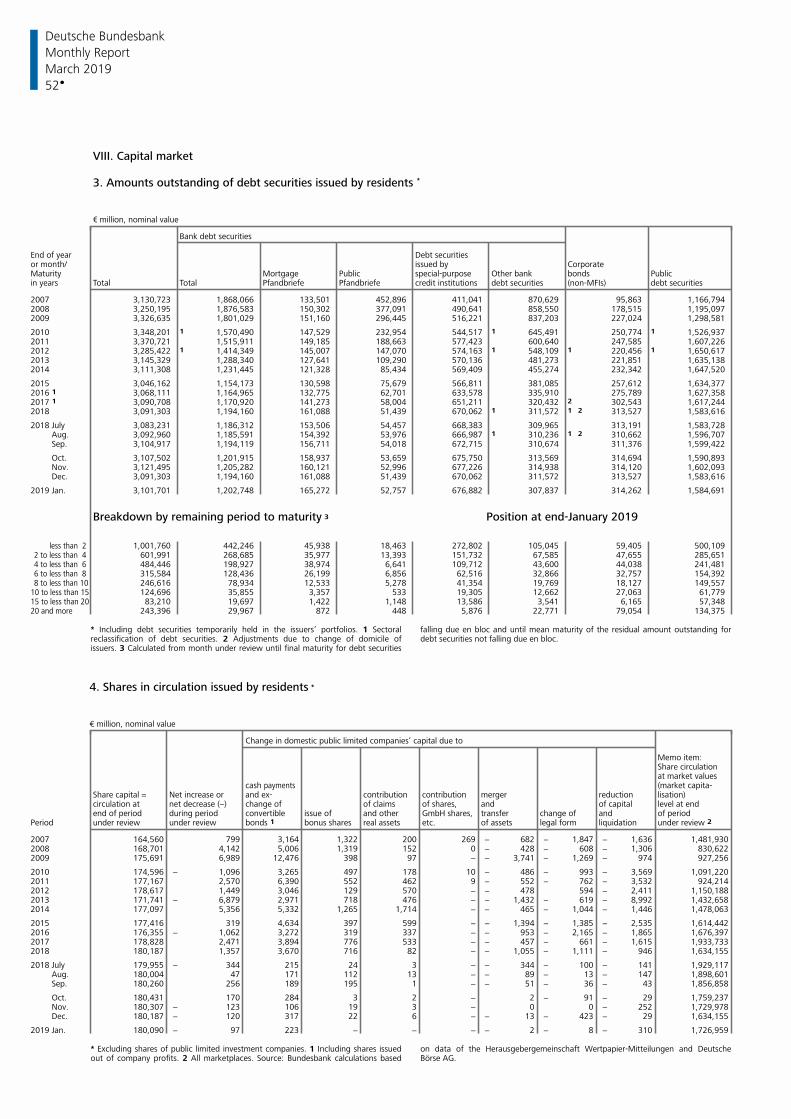
Deutsche Bundesbank
52
Monthly Report
March 2019
VIII. Capital market
3. Amounts outstanding of debt securities issued by residents *
€ million, nominal value
Bank debt securities End of year Debt securitiesor month/ issued by CorporateMaturity Mortgage Public special-purpose Other bank bonds Publicin years Total Total Pfandbriefe Pfandbriefe credit institutions debt securities (non-MFIs) debt securities
2007 3,130,723 1,868,066 133,501 452,896 411,041 870,629 95,863 1,166,7942008 3,250,195 1,876,583 150,302 377,091 490,641 858,550 178,515 1,195,0972009 3,326,635 1,801,029 151,160 296,445 516,221 837,203 227,024 1,298,581
2010 3,348,201 1 1,570,490 147,529 232,954 544,517 1 645,491 250,774 1 1,526,9372011 3,370,721 1,515,911 149,185 188,663 577,423 600,640 247,585 1,607,2262012 3,285,422 1 1,414,349 145,007 147,070 574,163 1 548,109 1 220,456 1 1,650,6172013 3,145,329 1,288,340 127,641 109,290 570,136 481,273 221,851 1,635,1382014 3,111,308 1,231,445 121,328 85,434 569,409 455,274 232,342 1,647,520
2015 3,046,162 1,154,173 130,598 75,679 566,811 381,085 257,612 1,634,3772016 1 3,068,111 1,164,965 132,775 62,701 633,578 335,910 275,789 1,627,3582017 1 3,090,708 1,170,920 141,273 58,004 651,211 320,432 2 302,543 1,617,2442018 3,091,303 1,194,160 161,088 51,439 670,062 1 311,572 1 2 313,527 1,583,616
2018 July 3,083,231 1,186,312 153,506 54,457 668,383 309,965 313,191 1,583,728 Aug. 3,092,960 1,185,591 154,392 53,976 666,987 1 310,236 1 2 310,662 1,596,707 Sep. 3,104,917 1,194,119 156,711 54,018 672,715 310,674 311,376 1,599,422
Oct. 3,107,502 1,201,915 158,937 53,659 675,750 313,569 314,694 1,590,893 Nov. 3,121,495 1,205,282 160,121 52,996 677,226 314,938 314,120 1,602,093 Dec. 3,091,303 1,194,160 161,088 51,439 670,062 311,572 313,527 1,583,616
2019 Jan. 3,101,701 1,202,748 165,272 52,757 676,882 307,837 314,262 1,584,691
Breakdown by remaining period to maturity 3 Position at end-January 2019
1,001,760 442,246 45,938 18,463 272,802 105,045 59,405 500,109 less than 2601,991 268,685 35,977 13,393 151,732 67,585 47,655 285,6512 to less than 4484,446 198,927 38,974 6,641 109,712 43,600 44,038 241,4814 to less than 6315,584 128,436 26,199 6,856 62,516 32,866 32,757 154,3926 to less than 8246,616 78,934 12,533 5,278 41,354 19,769 18,127 149,5578 to less than 10124,696 35,855 3,357 533 19,305 12,662 27,063 61,77910 to less than 1583,210 19,697 1,422 1,148 13,586 3,541 6,165 57,34815 to less than 20
243,396 29,967 872 448 5,876 22,771 79,054 134,37520 and more
* Including debt securities temporarily held in the issuers’ portfolios. 1 Sectoral falling due en bloc and until mean maturity of the residual amount outstanding forreclassification of debt securities. 2 Adjustments due to change of domicile of debt securities not falling due en bloc. issuers. 3 Calculated from month under review until final maturity for debt securities
4. Shares in circulation issued by residents *
€ million, nominal value
Change in domestic public limited companies’ capital due to
Memo item:Share circulationat market values(market capita-cash payments
Share capital = Net increase or and ex- contribution contribution merger reduction lisation)circulation at net decrease (−) change of of claims of shares, and of capital level at endend of period during period convertible issue of and other GmbH shares, transfer change of and of period
Period under review under review bonds 1 bonus shares real assets etc. of assets legal form liquidation under review 2
2007 164,560 799 3,164 1,322 200 269 − 682 − 1,847 − 1,636 1,481,9302008 168,701 4,142 5,006 1,319 152 0 − 428 − 608 − 1,306 830,6222009 175,691 6,989 12,476 398 97 − − 3,741 − 1,269 − 974 927,256
2010 174,596 − 1,096 3,265 497 178 10 − 486 − 993 − 3,569 1,091,2202011 177,167 2,570 6,390 552 462 9 − 552 − 762 − 3,532 924,2142012 178,617 1,449 3,046 129 570 − − 478 594 − 2,411 1,150,1882013 171,741 − 6,879 2,971 718 476 − − 1,432 − 619 − 8,992 1,432,6582014 177,097 5,356 5,332 1,265 1,714 − − 465 − 1,044 − 1,446 1,478,063
2015 177,416 319 4,634 397 599 − − 1,394 − 1,385 − 2,535 1,614,4422016 176,355 − 1,062 3,272 319 337 − − 953 − 2,165 − 1,865 1,676,3972017 178,828 2,471 3,894 776 533 − − 457 − 661 − 1,615 1,933,7332018 180,187 1,357 3,670 716 82 − − 1,055 − 1,111 − 946 1,634,155
2018 July 179,955 − 344 215 24 3 − − 344 − 100 − 141 1,929,117 Aug. 180,004 47 171 112 13 − − 89 − 13 − 147 1,898,601 Sep. 180,260 256 189 195 1 − − 51 − 36 − 43 1,856,858
Oct. 180,431 170 284 3 2 − 2 − 91 − 29 1,759,237 Nov. 180,307 − 123 106 19 3 − 0 0 − 252 1,729,978 Dec. 180,187 − 120 317 22 6 − − 13 − 423 − 29 1,634,155
2019 Jan. 180,090 − 97 223 − − − − 2 − 8 − 310 1,726,959
* Excluding shares of public limited investment companies. 1 Including shares issued on data of the Herausgebergemeinschaft Wertpapier-Mitteilungen and Deutscheout of company profits. 2 All marketplaces. Source: Bundesbank calculations based Börse AG.
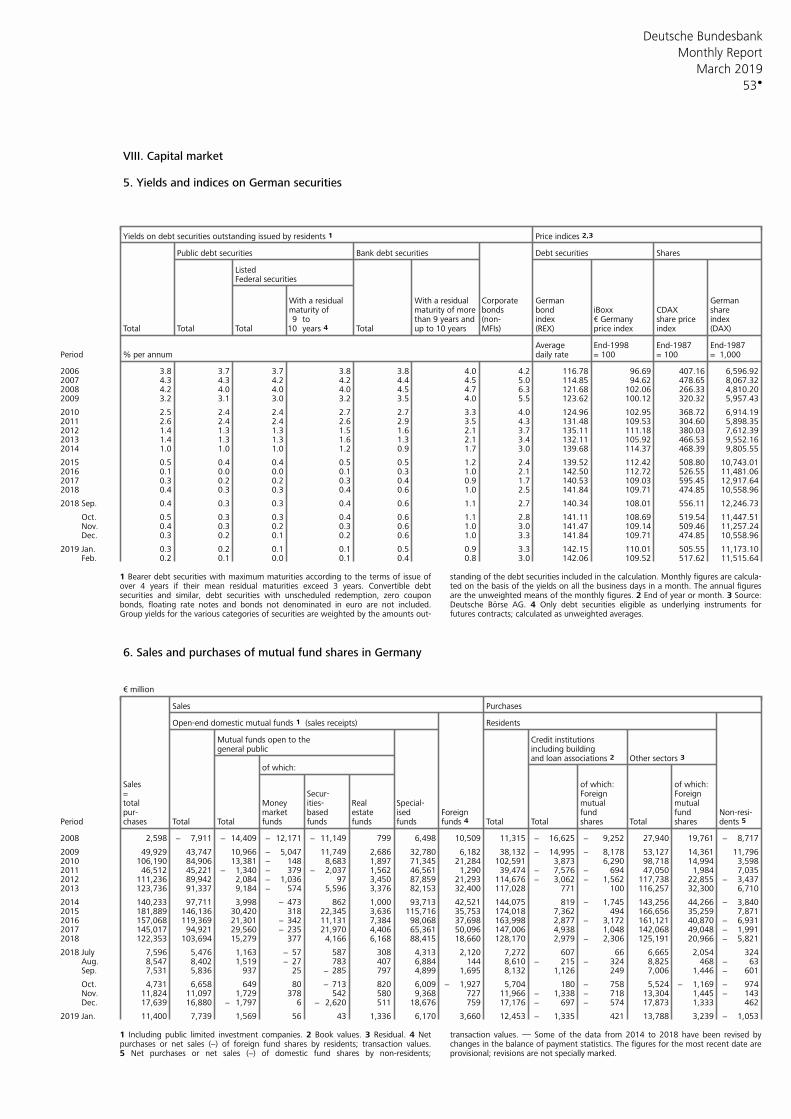
Deutsche Bundesbank
53
Monthly Report
March 2019
VIII. Capital market
5. Yields and indices on German securities
Yields on debt securities outstanding issued by residents 1 Price indices 2,3
Public debt securities Bank debt securities Debt securities Shares
ListedFederal securities
Corporate German GermanWith a residualWith a residualmaturity of bonds bond iBoxx CDAX sharematurity of more9 to (non- index share price indexthan 9 years and € Germany
Total Total Total 10 years 4 Total up to 10 years MFIs) (REX) price index index (DAX)
Average End-1998 End-1987 End-1987Period % per annum daily rate = 100 = 100 = 1,000
2006 3.8 3.7 3.7 3.8 3.8 4.0 4.2 116.78 96.69 407.16 6,596.922007 4.3 4.3 4.2 4.2 4.4 4.5 5.0 114.85 94.62 478.65 8,067.322008 4.2 4.0 4.0 4.0 4.5 4.7 6.3 121.68 102.06 266.33 4,810.202009 3.2 3.1 3.0 3.2 3.5 4.0 5.5 123.62 100.12 320.32 5,957.43
2010 2.5 2.4 2.4 2.7 2.7 3.3 4.0 124.96 102.95 368.72 6,914.192011 2.6 2.4 2.4 2.6 2.9 3.5 4.3 131.48 109.53 304.60 5,898.352012 1.4 1.3 1.3 1.5 1.6 2.1 3.7 135.11 111.18 380.03 7,612.392013 1.4 1.3 1.3 1.6 1.3 2.1 3.4 132.11 105.92 466.53 9,552.162014 1.0 1.0 1.0 1.2 0.9 1.7 3.0 139.68 114.37 468.39 9,805.55
2015 0.5 0.4 0.4 0.5 0.5 1.2 2.4 139.52 112.42 508.80 10,743.012016 0.1 0.0 0.0 0.1 0.3 1.0 2.1 142.50 112.72 526.55 11,481.062017 0.3 0.2 0.2 0.3 0.4 0.9 1.7 140.53 109.03 595.45 12,917.642018 0.4 0.3 0.3 0.4 0.6 1.0 2.5 141.84 109.71 474.85 10,558.96
2018 Sep. 0.4 0.3 0.3 0.4 0.6 1.1 2.7 140.34 108.01 556.11 12,246.73
Oct. 0.5 0.3 0.3 0.4 0.6 1.1 2.8 141.11 108.69 519.54 11,447.51 Nov. 0.4 0.3 0.2 0.3 0.6 1.0 3.0 141.47 109.14 509.46 11,257.24 Dec. 0.3 0.2 0.1 0.2 0.6 1.0 3.3 141.84 109.71 474.85 10,558.96
2019 Jan. 0.3 0.2 0.1 0.1 0.5 0.9 3.3 142.15 110.01 505.55 11,173.10 Feb. 0.2 0.1 0.0 0.1 0.4 0.8 3.0 142.06 109.52 517.62 11,515.64
1 Bearer debt securities with maximum maturities according to the terms of issue of standing of the debt securities included in the calculation. Monthly figures are calcula-over 4 years if their mean residual maturities exceed 3 years. Convertible debt ted on the basis of the yields on all the business days in a month. The annual figuressecurities and similar, debt securities with unscheduled redemption, zero coupon are the unweighted means of the monthly figures. 2 End of year or month. 3 Source:bonds, floating rate notes and bonds not denominated in euro are not included. Deutsche Börse AG. 4 Only debt securities eligible as underlying instruments forGroup yields for the various categories of securities are weighted by the amounts out- futures contracts; calculated as unweighted averages.
6. Sales and purchases of mutual fund shares in Germany
€ million
Sales Purchases
Open-end domestic mutual funds 1 (sales receipts) Residents
Mutual funds open to the Credit institutionsgeneral public including building
Other sectors 3 and loan associations 2 of which:
Sales of which: of which:= Secur- Foreign Foreigntotal Money ities- Real Special- mutual mutualpur- market based estate ised Foreign fund fund Non-resi-
Period chases Total Total funds funds funds funds funds 4 Total Total shares Total shares dents 5
2008 2,598 − 7,911 − 14,409 − 12,171 − 11,149 799 6,498 10,509 11,315 − 16,625 − 9,252 27,940 19,761 − 8,717
2009 49,929 43,747 10,966 − 5,047 11,749 2,686 32,780 6,182 38,132 − 14,995 − 8,178 53,127 14,361 11,7962010 106,190 84,906 13,381 − 148 8,683 1,897 71,345 21,284 102,591 3,873 6,290 98,718 14,994 3,5982011 46,512 45,221 − 1,340 − 379 − 2,037 1,562 46,561 1,290 39,474 − 7,576 − 694 47,050 1,984 7,0352012 111,236 89,942 2,084 − 1,036 97 3,450 87,859 21,293 114,676 − 3,062 − 1,562 117,738 22,855 − 3,4372013 123,736 91,337 9,184 − 574 5,596 3,376 82,153 32,400 117,028 771 100 116,257 32,300 6,710
2014 140,233 97,711 3,998 − 473 862 1,000 93,713 42,521 144,075 819 − 1,745 143,256 44,266 − 3,8402015 181,889 146,136 30,420 318 22,345 3,636 115,716 35,753 174,018 7,362 494 166,656 35,259 7,8712016 157,068 119,369 21,301 − 342 11,131 7,384 98,068 37,698 163,998 2,877 − 3,172 161,121 40,870 − 6,9312017 145,017 94,921 29,560 − 235 21,970 4,406 65,361 50,096 147,006 4,938 1,048 142,068 49,048 − 1,9912018 122,353 103,694 15,279 377 4,166 6,168 88,415 18,660 128,170 2,979 − 2,306 125,191 20,966 − 5,821
2018 July 7,596 5,476 1,163 − 57 587 308 4,313 2,120 7,272 607 66 6,665 2,054 324 Aug. 8,547 8,402 1,519 − 27 783 407 6,884 144 8,610 − 215 − 324 8,825 468 − 63 Sep. 7,531 5,836 937 25 − 285 797 4,899 1,695 8,132 1,126 249 7,006 1,446 − 601
Oct. 4,731 6,658 649 80 − 713 820 6,009 − 1,927 5,704 180 − 758 5,524 − 1,169 − 974 Nov. 11,824 11,097 1,729 378 542 580 9,368 727 11,966 − 1,338 − 718 13,304 1,445 − 143 Dec. 17,639 16,880 − 1,797 6 − 2,620 511 18,676 759 17,176 − 697 − 574 17,873 1,333 462
2019 Jan. 11,400 7,739 1,569 56 43 1,336 6,170 3,660 12,453 − 1,335 421 13,788 3,239 − 1,053
1 Including public limited investment companies. 2 Book values. 3 Residual. 4 Net transaction values. — Some of the data from 2014 to 2018 have been revised bypurchases or net sales (−) of foreign fund shares by residents; transaction values. changes in the balance of payment statistics. The figures for the most recent date are5 Net purchases or net sales (−) of domestic fund shares by non-residents; provisional; revisions are not specially marked.
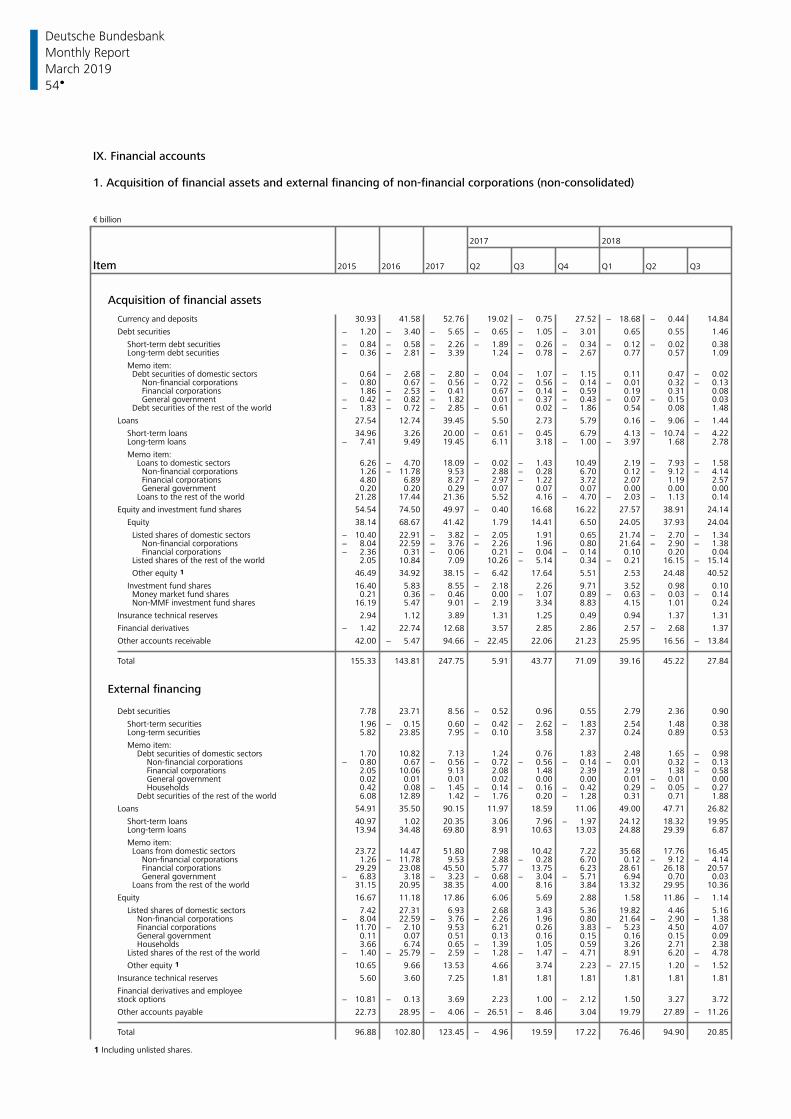
Deutsche Bundesbank
54
Monthly Report
March 2019
IX. Financial accounts
1. Acquisition of financial assets and external financing of non-financial corporations (non-consolidated) € billion
2017 2018
Item 2015 2016 2017 Q2 Q3 Q4 Q1 Q2 Q3
Acquisition of financial assets
Currency and deposits 30.93 41.58 52.76 19.02 − 0.75 27.52 − 18.68 − 0.44 14.84
Debt securities − 1.20 − 3.40 − 5.65 − 0.65 − 1.05 − 3.01 0.65 0.55 1.46
Short-term debt securities − 0.84 − 0.58 − 2.26 − 1.89 − 0.26 − 0.34 − 0.12 − 0.02 0.38Long-term debt securities − 0.36 − 2.81 − 3.39 1.24 − 0.78 − 2.67 0.77 0.57 1.09
Memo item:Debt securities of domestic sectors 0.64 − 2.68 − 2.80 − 0.04 − 1.07 − 1.15 0.11 0.47 − 0.02
Non-financial corporations − 0.80 0.67 − 0.56 − 0.72 − 0.56 − 0.14 − 0.01 0.32 − 0.13Financial corporations 1.86 − 2.53 − 0.41 0.67 − 0.14 − 0.59 0.19 0.31 0.08General government − 0.42 − 0.82 − 1.82 0.01 − 0.37 − 0.43 − 0.07 − 0.15 0.03
Debt securities of the rest of the world − 1.83 − 0.72 − 2.85 − 0.61 0.02 − 1.86 0.54 0.08 1.48
Loans 27.54 12.74 39.45 5.50 2.73 5.79 0.16 − 9.06 − 1.44
Short-term loans 34.96 3.26 20.00 − 0.61 − 0.45 6.79 4.13 − 10.74 − 4.22Long-term loans − 7.41 9.49 19.45 6.11 3.18 − 1.00 − 3.97 1.68 2.78
Memo item:Loans to domestic sectors 6.26 − 4.70 18.09 − 0.02 − 1.43 10.49 2.19 − 7.93 − 1.58
Non-financial corporations 1.26 − 11.78 9.53 2.88 − 0.28 6.70 0.12 − 9.12 − 4.14Financial corporations 4.80 6.89 8.27 − 2.97 − 1.22 3.72 2.07 1.19 2.57General government 0.20 0.20 0.29 0.07 0.07 0.07 0.00 0.00 0.00
Loans to the rest of the world 21.28 17.44 21.36 5.52 4.16 − 4.70 − 2.03 − 1.13 0.14
Equity and investment fund shares 54.54 74.50 49.97 − 0.40 16.68 16.22 27.57 38.91 24.14
Equity 38.14 68.67 41.42 1.79 14.41 6.50 24.05 37.93 24.04
Listed shares of domestic sectors − 10.40 22.91 − 3.82 − 2.05 1.91 0.65 21.74 − 2.70 − 1.34Non-financial corporations − 8.04 22.59 − 3.76 − 2.26 1.96 0.80 21.64 − 2.90 − 1.38Financial corporations − 2.36 0.31 − 0.06 0.21 − 0.04 − 0.14 0.10 0.20 0.04
Listed shares of the rest of the world 2.05 10.84 7.09 10.26 − 5.14 0.34 − 0.21 16.15 − 15.14
Other equity 1 46.49 34.92 38.15 − 6.42 17.64 5.51 2.53 24.48 40.52
Investment fund shares 16.40 5.83 8.55 − 2.18 2.26 9.71 3.52 0.98 0.10Money market fund shares 0.21 0.36 − 0.46 0.00 − 1.07 0.89 − 0.63 − 0.03 − 0.14Non-MMF investment fund shares 16.19 5.47 9.01 − 2.19 3.34 8.83 4.15 1.01 0.24
Insurance technical reserves 2.94 1.12 3.89 1.31 1.25 0.49 0.94 1.37 1.31
Financial derivatives − 1.42 22.74 12.68 3.57 2.85 2.86 2.57 − 2.68 1.37
Other accounts receivable 42.00 − 5.47 94.66 − 22.45 22.06 21.23 25.95 16.56 − 13.84
Total 155.33 143.81 247.75 5.91 43.77 71.09 39.16 45.22 27.84
External financing
Debt securities 7.78 23.71 8.56 − 0.52 0.96 0.55 2.79 2.36 0.90
Short-term securities 1.96 − 0.15 0.60 − 0.42 − 2.62 − 1.83 2.54 1.48 0.38Long-term securities 5.82 23.85 7.95 − 0.10 3.58 2.37 0.24 0.89 0.53
Memo item:Debt securities of domestic sectors 1.70 10.82 7.13 1.24 0.76 1.83 2.48 1.65 − 0.98
Non-financial corporations − 0.80 0.67 − 0.56 − 0.72 − 0.56 − 0.14 − 0.01 0.32 − 0.13Financial corporations 2.05 10.06 9.13 2.08 1.48 2.39 2.19 1.38 − 0.58General government 0.02 0.01 0.01 0.02 0.00 0.00 0.01 − 0.01 0.00Households 0.42 0.08 − 1.45 − 0.14 − 0.16 − 0.42 0.29 − 0.05 − 0.27
Debt securities of the rest of the world 6.08 12.89 1.42 − 1.76 0.20 − 1.28 0.31 0.71 1.88
Loans 54.91 35.50 90.15 11.97 18.59 11.06 49.00 47.71 26.82
Short-term loans 40.97 1.02 20.35 3.06 7.96 − 1.97 24.12 18.32 19.95Long-term loans 13.94 34.48 69.80 8.91 10.63 13.03 24.88 29.39 6.87
Memo item:Loans from domestic sectors 23.72 14.47 51.80 7.98 10.42 7.22 35.68 17.76 16.45
Non-financial corporations 1.26 − 11.78 9.53 2.88 − 0.28 6.70 0.12 − 9.12 − 4.14Financial corporations 29.29 23.08 45.50 5.77 13.75 6.23 28.61 26.18 20.57General government − 6.83 3.18 − 3.23 − 0.68 − 3.04 − 5.71 6.94 0.70 0.03
Loans from the rest of the world 31.15 20.95 38.35 4.00 8.16 3.84 13.32 29.95 10.36
Equity 16.67 11.18 17.86 6.06 5.69 2.88 1.58 11.86 − 1.14
Listed shares of domestic sectors 7.42 27.31 6.93 2.68 3.43 5.36 19.82 4.46 5.16Non-financial corporations − 8.04 22.59 − 3.76 − 2.26 1.96 0.80 21.64 − 2.90 − 1.38Financial corporations 11.70 − 2.10 9.53 6.21 0.26 3.83 − 5.23 4.50 4.07General government 0.11 0.07 0.51 0.13 0.16 0.15 0.16 0.15 0.09Households 3.66 6.74 0.65 − 1.39 1.05 0.59 3.26 2.71 2.38
Listed shares of the rest of the world − 1.40 − 25.79 − 2.59 − 1.28 − 1.47 − 4.71 8.91 6.20 − 4.78
Other equity 1 10.65 9.66 13.53 4.66 3.74 2.23 − 27.15 1.20 − 1.52
Insurance technical reserves 5.60 3.60 7.25 1.81 1.81 1.81 1.81 1.81 1.81
Financial derivatives and employeestock options − 10.81 − 0.13 3.69 2.23 1.00 − 2.12 1.50 3.27 3.72
Other accounts payable 22.73 28.95 − 4.06 − 26.51 − 8.46 3.04 19.79 27.89 − 11.26
Total 96.88 102.80 123.45 − 4.96 19.59 17.22 76.46 94.90 20.85
1 Including unlisted shares.
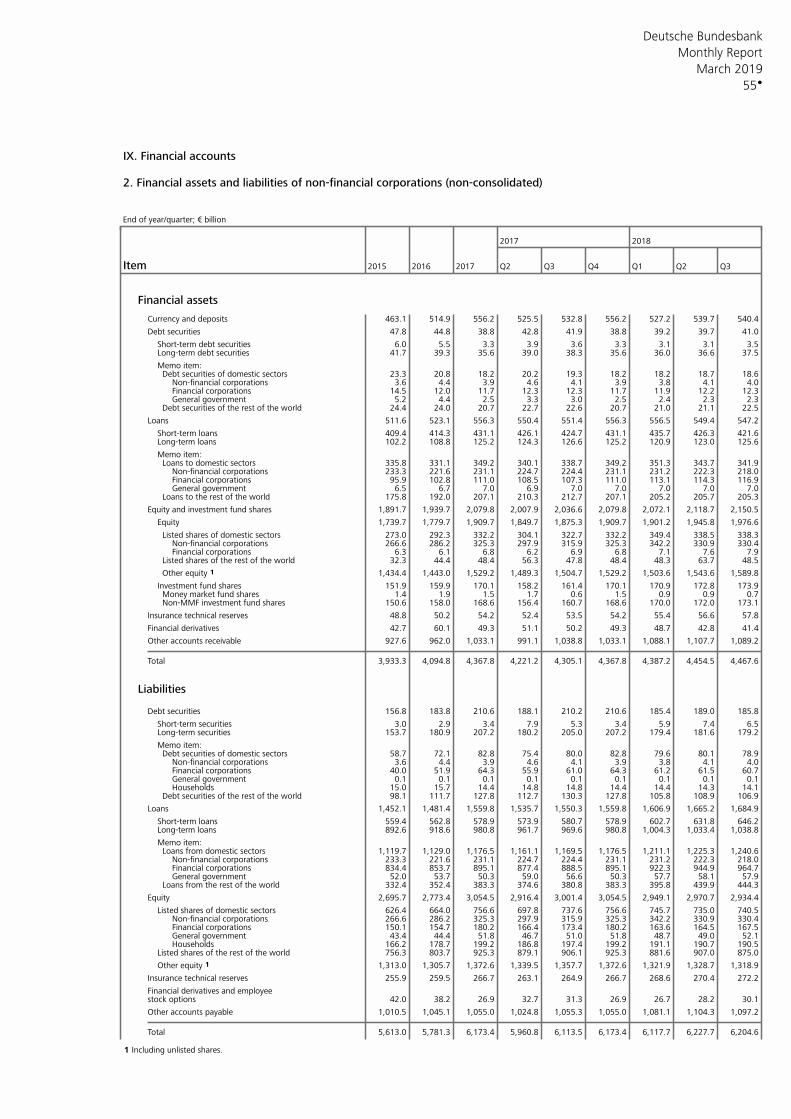
Deutsche Bundesbank
55
Monthly Report
March 2019
IX. Financial accounts
2. Financial assets and liabilities of non-financial corporations (non-consolidated) End of year/quarter; € billion
2017 2018
Item 2015 2016 2017 Q2 Q3 Q4 Q1 Q2 Q3
Financial assets
Currency and deposits 463.1 514.9 556.2 525.5 532.8 556.2 527.2 539.7 540.4
Debt securities 47.8 44.8 38.8 42.8 41.9 38.8 39.2 39.7 41.0
Short-term debt securities 6.0 5.5 3.3 3.9 3.6 3.3 3.1 3.1 3.5Long-term debt securities 41.7 39.3 35.6 39.0 38.3 35.6 36.0 36.6 37.5
Memo item:Debt securities of domestic sectors 23.3 20.8 18.2 20.2 19.3 18.2 18.2 18.7 18.6
Non-financial corporations 3.6 4.4 3.9 4.6 4.1 3.9 3.8 4.1 4.0Financial corporations 14.5 12.0 11.7 12.3 12.3 11.7 11.9 12.2 12.3General government 5.2 4.4 2.5 3.3 3.0 2.5 2.4 2.3 2.3
Debt securities of the rest of the world 24.4 24.0 20.7 22.7 22.6 20.7 21.0 21.1 22.5
Loans 511.6 523.1 556.3 550.4 551.4 556.3 556.5 549.4 547.2
Short-term loans 409.4 414.3 431.1 426.1 424.7 431.1 435.7 426.3 421.6Long-term loans 102.2 108.8 125.2 124.3 126.6 125.2 120.9 123.0 125.6
Memo item:Loans to domestic sectors 335.8 331.1 349.2 340.1 338.7 349.2 351.3 343.7 341.9
Non-financial corporations 233.3 221.6 231.1 224.7 224.4 231.1 231.2 222.3 218.0Financial corporations 95.9 102.8 111.0 108.5 107.3 111.0 113.1 114.3 116.9General government 6.5 6.7 7.0 6.9 7.0 7.0 7.0 7.0 7.0
Loans to the rest of the world 175.8 192.0 207.1 210.3 212.7 207.1 205.2 205.7 205.3
Equity and investment fund shares 1,891.7 1,939.7 2,079.8 2,007.9 2,036.6 2,079.8 2,072.1 2,118.7 2,150.5
Equity 1,739.7 1,779.7 1,909.7 1,849.7 1,875.3 1,909.7 1,901.2 1,945.8 1,976.6
Listed shares of domestic sectors 273.0 292.3 332.2 304.1 322.7 332.2 349.4 338.5 338.3Non-financial corporations 266.6 286.2 325.3 297.9 315.9 325.3 342.2 330.9 330.4Financial corporations 6.3 6.1 6.8 6.2 6.9 6.8 7.1 7.6 7.9
Listed shares of the rest of the world 32.3 44.4 48.4 56.3 47.8 48.4 48.3 63.7 48.5
Other equity 1 1,434.4 1,443.0 1,529.2 1,489.3 1,504.7 1,529.2 1,503.6 1,543.6 1,589.8
Investment fund shares 151.9 159.9 170.1 158.2 161.4 170.1 170.9 172.8 173.9Money market fund shares 1.4 1.9 1.5 1.7 0.6 1.5 0.9 0.9 0.7Non-MMF investment fund shares 150.6 158.0 168.6 156.4 160.7 168.6 170.0 172.0 173.1
Insurance technical reserves 48.8 50.2 54.2 52.4 53.5 54.2 55.4 56.6 57.8
Financial derivatives 42.7 60.1 49.3 51.1 50.2 49.3 48.7 42.8 41.4
Other accounts receivable 927.6 962.0 1,033.1 991.1 1,038.8 1,033.1 1,088.1 1,107.7 1,089.2
Total 3,933.3 4,094.8 4,367.8 4,221.2 4,305.1 4,367.8 4,387.2 4,454.5 4,467.6
Liabilities
Debt securities 156.8 183.8 210.6 188.1 210.2 210.6 185.4 189.0 185.8
Short-term securities 3.0 2.9 3.4 7.9 5.3 3.4 5.9 7.4 6.5Long-term securities 153.7 180.9 207.2 180.2 205.0 207.2 179.4 181.6 179.2
Memo item:Debt securities of domestic sectors 58.7 72.1 82.8 75.4 80.0 82.8 79.6 80.1 78.9
Non-financial corporations 3.6 4.4 3.9 4.6 4.1 3.9 3.8 4.1 4.0Financial corporations 40.0 51.9 64.3 55.9 61.0 64.3 61.2 61.5 60.7General government 0.1 0.1 0.1 0.1 0.1 0.1 0.1 0.1 0.1Households 15.0 15.7 14.4 14.8 14.8 14.4 14.4 14.3 14.1
Debt securities of the rest of the world 98.1 111.7 127.8 112.7 130.3 127.8 105.8 108.9 106.9
Loans 1,452.1 1,481.4 1,559.8 1,535.7 1,550.3 1,559.8 1,606.9 1,665.2 1,684.9
Short-term loans 559.4 562.8 578.9 573.9 580.7 578.9 602.7 631.8 646.2Long-term loans 892.6 918.6 980.8 961.7 969.6 980.8 1,004.3 1,033.4 1,038.8
Memo item:Loans from domestic sectors 1,119.7 1,129.0 1,176.5 1,161.1 1,169.5 1,176.5 1,211.1 1,225.3 1,240.6
Non-financial corporations 233.3 221.6 231.1 224.7 224.4 231.1 231.2 222.3 218.0Financial corporations 834.4 853.7 895.1 877.4 888.5 895.1 922.3 944.9 964.7General government 52.0 53.7 50.3 59.0 56.6 50.3 57.7 58.1 57.9
Loans from the rest of the world 332.4 352.4 383.3 374.6 380.8 383.3 395.8 439.9 444.3
Equity 2,695.7 2,773.4 3,054.5 2,916.4 3,001.4 3,054.5 2,949.1 2,970.7 2,934.4
Listed shares of domestic sectors 626.4 664.0 756.6 697.8 737.6 756.6 745.7 735.0 740.5Non-financial corporations 266.6 286.2 325.3 297.9 315.9 325.3 342.2 330.9 330.4Financial corporations 150.1 154.7 180.2 166.4 173.4 180.2 163.6 164.5 167.5General government 43.4 44.4 51.8 46.7 51.0 51.8 48.7 49.0 52.1Households 166.2 178.7 199.2 186.8 197.4 199.2 191.1 190.7 190.5
Listed shares of the rest of the world 756.3 803.7 925.3 879.1 906.1 925.3 881.6 907.0 875.0
Other equity 1 1,313.0 1,305.7 1,372.6 1,339.5 1,357.7 1,372.6 1,321.9 1,328.7 1,318.9
Insurance technical reserves 255.9 259.5 266.7 263.1 264.9 266.7 268.6 270.4 272.2
Financial derivatives and employeestock options 42.0 38.2 26.9 32.7 31.3 26.9 26.7 28.2 30.1
Other accounts payable 1,010.5 1,045.1 1,055.0 1,024.8 1,055.3 1,055.0 1,081.1 1,104.3 1,097.2
Total 5,613.0 5,781.3 6,173.4 5,960.8 6,113.5 6,173.4 6,117.7 6,227.7 6,204.6
1 Including unlisted shares.
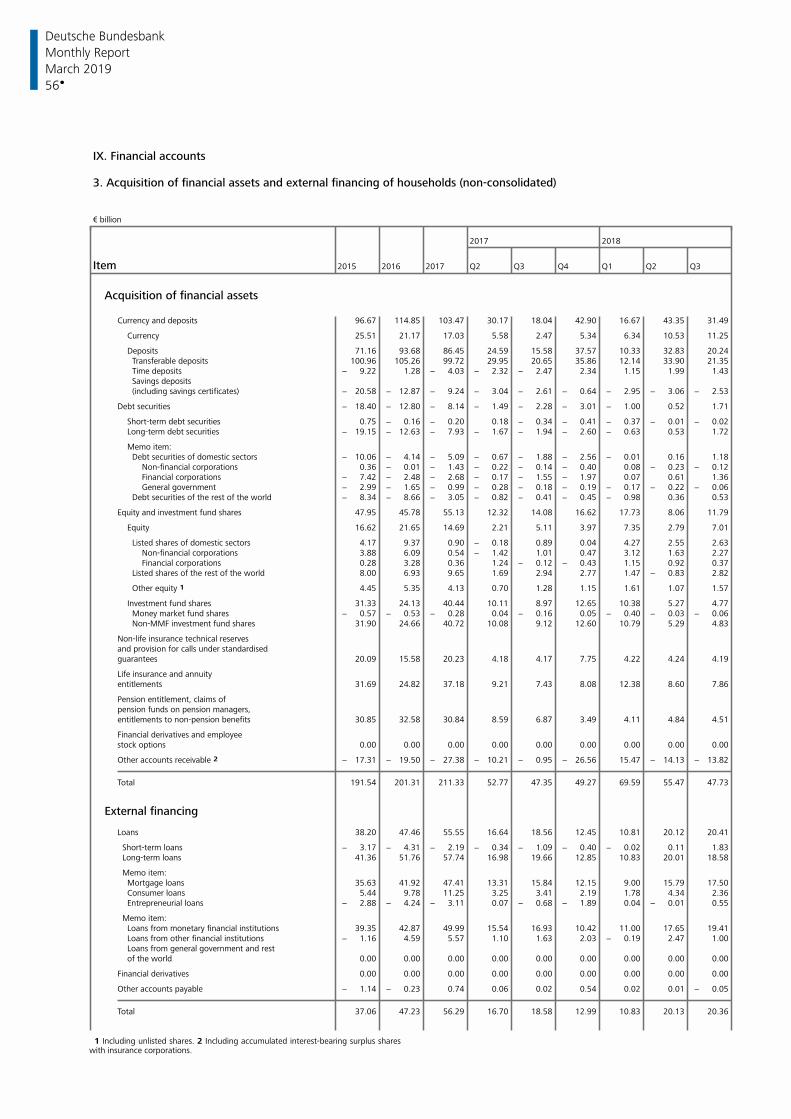
Deutsche Bundesbank
56
Monthly Report
March 2019
IX. Financial accounts
3. Acquisition of financial assets and external financing of households (non-consolidated) € billion
2017 2018
Item 2015 2016 2017 Q2 Q3 Q4 Q1 Q2 Q3
Acquisition of financial assets
Currency and deposits 96.67 114.85 103.47 30.17 18.04 42.90 16.67 43.35 31.49
Currency 25.51 21.17 17.03 5.58 2.47 5.34 6.34 10.53 11.25
Deposits 71.16 93.68 86.45 24.59 15.58 37.57 10.33 32.83 20.24Transferable deposits 100.96 105.26 99.72 29.95 20.65 35.86 12.14 33.90 21.35Time deposits − 9.22 1.28 − 4.03 − 2.32 − 2.47 2.34 1.15 1.99 1.43Savings deposits(including savings certificates) − 20.58 − 12.87 − 9.24 − 3.04 − 2.61 − 0.64 − 2.95 − 3.06 − 2.53
Debt securities − 18.40 − 12.80 − 8.14 − 1.49 − 2.28 − 3.01 − 1.00 0.52 1.71
Short-term debt securities 0.75 − 0.16 − 0.20 0.18 − 0.34 − 0.41 − 0.37 − 0.01 − 0.02Long-term debt securities − 19.15 − 12.63 − 7.93 − 1.67 − 1.94 − 2.60 − 0.63 0.53 1.72
Memo item:Debt securities of domestic sectors − 10.06 − 4.14 − 5.09 − 0.67 − 1.88 − 2.56 − 0.01 0.16 1.18
Non-financial corporations 0.36 − 0.01 − 1.43 − 0.22 − 0.14 − 0.40 0.08 − 0.23 − 0.12Financial corporations − 7.42 − 2.48 − 2.68 − 0.17 − 1.55 − 1.97 0.07 0.61 1.36General government − 2.99 − 1.65 − 0.99 − 0.28 − 0.18 − 0.19 − 0.17 − 0.22 − 0.06
Debt securities of the rest of the world − 8.34 − 8.66 − 3.05 − 0.82 − 0.41 − 0.45 − 0.98 0.36 0.53
Equity and investment fund shares 47.95 45.78 55.13 12.32 14.08 16.62 17.73 8.06 11.79
Equity 16.62 21.65 14.69 2.21 5.11 3.97 7.35 2.79 7.01
Listed shares of domestic sectors 4.17 9.37 0.90 − 0.18 0.89 0.04 4.27 2.55 2.63Non-financial corporations 3.88 6.09 0.54 − 1.42 1.01 0.47 3.12 1.63 2.27Financial corporations 0.28 3.28 0.36 1.24 − 0.12 − 0.43 1.15 0.92 0.37
Listed shares of the rest of the world 8.00 6.93 9.65 1.69 2.94 2.77 1.47 − 0.83 2.82
Other equity 1 4.45 5.35 4.13 0.70 1.28 1.15 1.61 1.07 1.57
Investment fund shares 31.33 24.13 40.44 10.11 8.97 12.65 10.38 5.27 4.77Money market fund shares − 0.57 − 0.53 − 0.28 0.04 − 0.16 0.05 − 0.40 − 0.03 − 0.06Non-MMF investment fund shares 31.90 24.66 40.72 10.08 9.12 12.60 10.79 5.29 4.83
Non-life insurance technical reservesand provision for calls under standardisedguarantees 20.09 15.58 20.23 4.18 4.17 7.75 4.22 4.24 4.19
Life insurance and annuityentitlements 31.69 24.82 37.18 9.21 7.43 8.08 12.38 8.60 7.86
Pension entitlement, claims ofpension funds on pension managers,entitlements to non-pension benefits 30.85 32.58 30.84 8.59 6.87 3.49 4.11 4.84 4.51
Financial derivatives and employeestock options 0.00 0.00 0.00 0.00 0.00 0.00 0.00 0.00 0.00
Other accounts receivable 2 − 17.31 − 19.50 − 27.38 − 10.21 − 0.95 − 26.56 15.47 − 14.13 − 13.82
Total 191.54 201.31 211.33 52.77 47.35 49.27 69.59 55.47 47.73
External financing
Loans 38.20 47.46 55.55 16.64 18.56 12.45 10.81 20.12 20.41
Short-term loans − 3.17 − 4.31 − 2.19 − 0.34 − 1.09 − 0.40 − 0.02 0.11 1.83Long-term loans 41.36 51.76 57.74 16.98 19.66 12.85 10.83 20.01 18.58
Memo item:Mortgage loans 35.63 41.92 47.41 13.31 15.84 12.15 9.00 15.79 17.50Consumer loans 5.44 9.78 11.25 3.25 3.41 2.19 1.78 4.34 2.36Entrepreneurial loans − 2.88 − 4.24 − 3.11 0.07 − 0.68 − 1.89 0.04 − 0.01 0.55
Memo item:Loans from monetary financial institutions 39.35 42.87 49.99 15.54 16.93 10.42 11.00 17.65 19.41Loans from other financial institutions − 1.16 4.59 5.57 1.10 1.63 2.03 − 0.19 2.47 1.00Loans from general government and restof the world 0.00 0.00 0.00 0.00 0.00 0.00 0.00 0.00 0.00
Financial derivatives 0.00 0.00 0.00 0.00 0.00 0.00 0.00 0.00 0.00
Other accounts payable − 1.14 − 0.23 0.74 0.06 0.02 0.54 0.02 0.01 − 0.05
Total 37.06 47.23 56.29 16.70 18.58 12.99 10.83 20.13 20.36
1 Including unlisted shares. 2 Including accumulated interest-bearing surplus shares with insurance corporations.
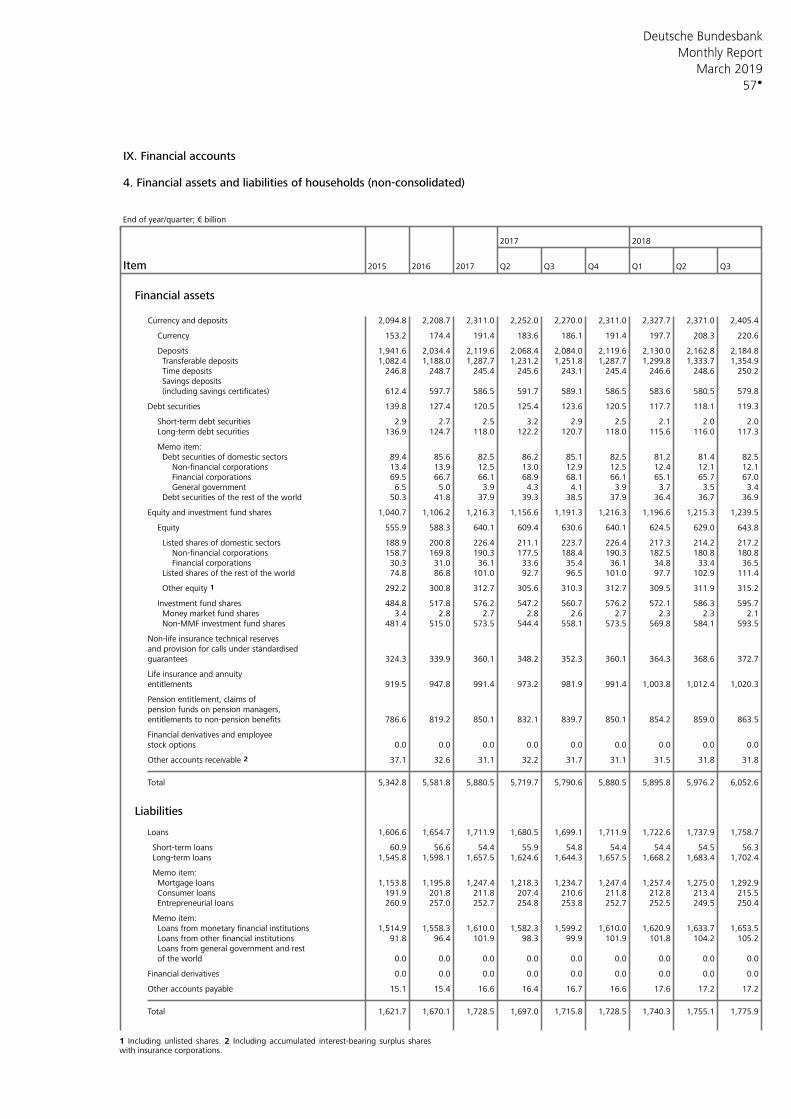
Deutsche Bundesbank
57
Monthly Report
March 2019
IX. Financial accounts
4. Financial assets and liabilities of households (non-consolidated) End of year/quarter; € billion
2017 2018
Item 2015 2016 2017 Q2 Q3 Q4 Q1 Q2 Q3
Financial assets
Currency and deposits 2,094.8 2,208.7 2,311.0 2,252.0 2,270.0 2,311.0 2,327.7 2,371.0 2,405.4
Currency 153.2 174.4 191.4 183.6 186.1 191.4 197.7 208.3 220.6
Deposits 1,941.6 2,034.4 2,119.6 2,068.4 2,084.0 2,119.6 2,130.0 2,162.8 2,184.8Transferable deposits 1,082.4 1,188.0 1,287.7 1,231.2 1,251.8 1,287.7 1,299.8 1,333.7 1,354.9Time deposits 246.8 248.7 245.4 245.6 243.1 245.4 246.6 248.6 250.2Savings deposits(including savings certificates) 612.4 597.7 586.5 591.7 589.1 586.5 583.6 580.5 579.8
Debt securities 139.8 127.4 120.5 125.4 123.6 120.5 117.7 118.1 119.3
Short-term debt securities 2.9 2.7 2.5 3.2 2.9 2.5 2.1 2.0 2.0Long-term debt securities 136.9 124.7 118.0 122.2 120.7 118.0 115.6 116.0 117.3
Memo item:Debt securities of domestic sectors 89.4 85.6 82.5 86.2 85.1 82.5 81.2 81.4 82.5
Non-financial corporations 13.4 13.9 12.5 13.0 12.9 12.5 12.4 12.1 12.1Financial corporations 69.5 66.7 66.1 68.9 68.1 66.1 65.1 65.7 67.0General government 6.5 5.0 3.9 4.3 4.1 3.9 3.7 3.5 3.4
Debt securities of the rest of the world 50.3 41.8 37.9 39.3 38.5 37.9 36.4 36.7 36.9
Equity and investment fund shares 1,040.7 1,106.2 1,216.3 1,156.6 1,191.3 1,216.3 1,196.6 1,215.3 1,239.5
Equity 555.9 588.3 640.1 609.4 630.6 640.1 624.5 629.0 643.8
Listed shares of domestic sectors 188.9 200.8 226.4 211.1 223.7 226.4 217.3 214.2 217.2Non-financial corporations 158.7 169.8 190.3 177.5 188.4 190.3 182.5 180.8 180.8Financial corporations 30.3 31.0 36.1 33.6 35.4 36.1 34.8 33.4 36.5
Listed shares of the rest of the world 74.8 86.8 101.0 92.7 96.5 101.0 97.7 102.9 111.4
Other equity 1 292.2 300.8 312.7 305.6 310.3 312.7 309.5 311.9 315.2
Investment fund shares 484.8 517.8 576.2 547.2 560.7 576.2 572.1 586.3 595.7Money market fund shares 3.4 2.8 2.7 2.8 2.6 2.7 2.3 2.3 2.1Non-MMF investment fund shares 481.4 515.0 573.5 544.4 558.1 573.5 569.8 584.1 593.5
Non-life insurance technical reservesand provision for calls under standardisedguarantees 324.3 339.9 360.1 348.2 352.3 360.1 364.3 368.6 372.7
Life insurance and annuityentitlements 919.5 947.8 991.4 973.2 981.9 991.4 1,003.8 1,012.4 1,020.3
Pension entitlement, claims ofpension funds on pension managers,entitlements to non-pension benefits 786.6 819.2 850.1 832.1 839.7 850.1 854.2 859.0 863.5
Financial derivatives and employeestock options 0.0 0.0 0.0 0.0 0.0 0.0 0.0 0.0 0.0
Other accounts receivable 2 37.1 32.6 31.1 32.2 31.7 31.1 31.5 31.8 31.8
Total 5,342.8 5,581.8 5,880.5 5,719.7 5,790.6 5,880.5 5,895.8 5,976.2 6,052.6
Liabilities
Loans 1,606.6 1,654.7 1,711.9 1,680.5 1,699.1 1,711.9 1,722.6 1,737.9 1,758.7
Short-term loans 60.9 56.6 54.4 55.9 54.8 54.4 54.4 54.5 56.3Long-term loans 1,545.8 1,598.1 1,657.5 1,624.6 1,644.3 1,657.5 1,668.2 1,683.4 1,702.4
Memo item:Mortgage loans 1,153.8 1,195.8 1,247.4 1,218.3 1,234.7 1,247.4 1,257.4 1,275.0 1,292.9Consumer loans 191.9 201.8 211.8 207.4 210.6 211.8 212.8 213.4 215.5Entrepreneurial loans 260.9 257.0 252.7 254.8 253.8 252.7 252.5 249.5 250.4
Memo item:Loans from monetary financial institutions 1,514.9 1,558.3 1,610.0 1,582.3 1,599.2 1,610.0 1,620.9 1,633.7 1,653.5Loans from other financial institutions 91.8 96.4 101.9 98.3 99.9 101.9 101.8 104.2 105.2Loans from general government and restof the world 0.0 0.0 0.0 0.0 0.0 0.0 0.0 0.0 0.0
Financial derivatives 0.0 0.0 0.0 0.0 0.0 0.0 0.0 0.0 0.0
Other accounts payable 15.1 15.4 16.6 16.4 16.7 16.6 17.6 17.2 17.2
Total 1,621.7 1,670.1 1,728.5 1,697.0 1,715.8 1,728.5 1,740.3 1,755.1 1,775.9
1 Including unlisted shares. 2 Including accumulated interest-bearing surplus shares with insurance corporations.
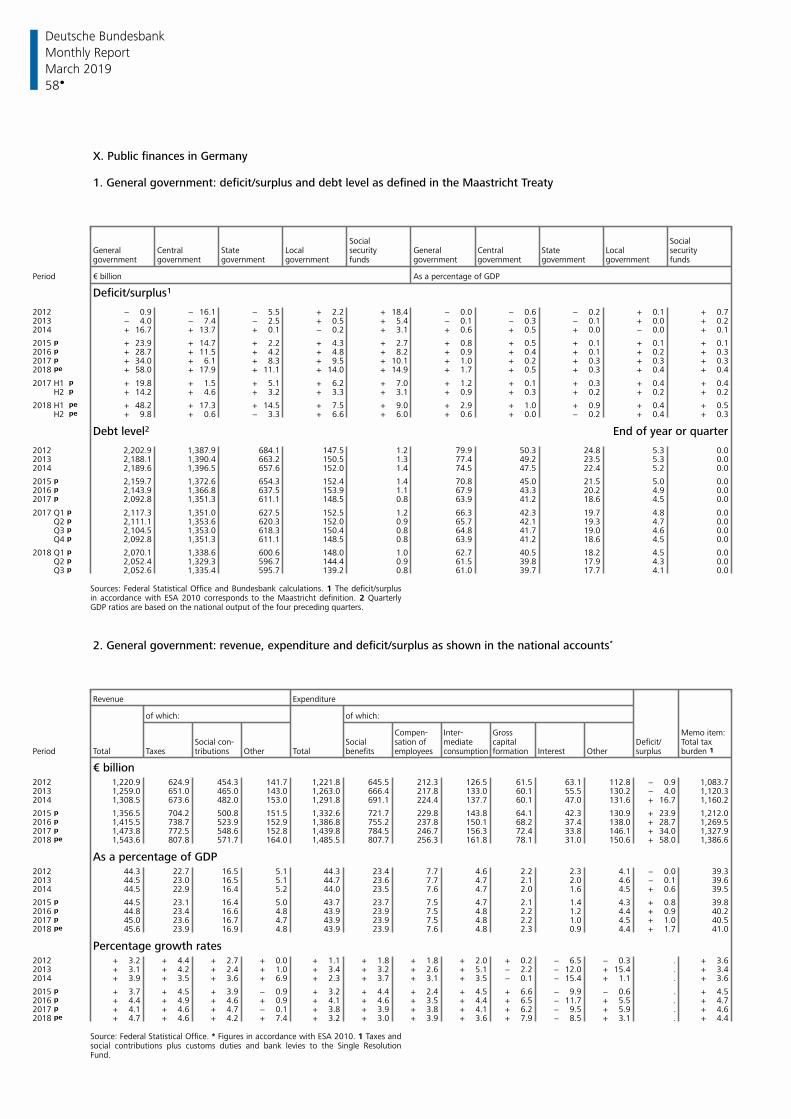
Deutsche Bundesbank
58
Monthly Report
March 2019
X. Public finances in Germany 1. General government: deficit/surplus and debt level as defined in the Maastricht Treaty
Social SocialGeneral Central State Local security General Central State Local securitygovernment government government government funds government government government government funds
Period € billion As a percentage of GDP
Deficit/surplus1
2012 − 0.9 − 16.1 − 5.5 + 2.2 + 18.4 − 0.0 − 0.6 − 0.2 + 0.1 + 0.72013 − 4.0 − 7.4 − 2.5 + 0.5 + 5.4 − 0.1 − 0.3 − 0.1 + 0.0 + 0.22014 + 16.7 + 13.7 + 0.1 − 0.2 + 3.1 + 0.6 + 0.5 + 0.0 − 0.0 + 0.1
2015 p + 23.9 + 14.7 + 2.2 + 4.3 + 2.7 + 0.8 + 0.5 + 0.1 + 0.1 + 0.12016 p + 28.7 + 11.5 + 4.2 + 4.8 + 8.2 + 0.9 + 0.4 + 0.1 + 0.2 + 0.32017 p + 34.0 + 6.1 + 8.3 + 9.5 + 10.1 + 1.0 + 0.2 + 0.3 + 0.3 + 0.32018 pe + 58.0 + 17.9 + 11.1 + 14.0 + 14.9 + 1.7 + 0.5 + 0.3 + 0.4 + 0.4
2017 H1 p + 19.8 + 1.5 + 5.1 + 6.2 + 7.0 + 1.2 + 0.1 + 0.3 + 0.4 + 0.4 H2 p + 14.2 + 4.6 + 3.2 + 3.3 + 3.1 + 0.9 + 0.3 + 0.2 + 0.2 + 0.2
2018 H1 pe + 48.2 + 17.3 + 14.5 + 7.5 + 9.0 + 2.9 + 1.0 + 0.9 + 0.4 + 0.5 H2 pe + 9.8 + 0.6 − 3.3 + 6.6 + 6.0 + 0.6 + 0.0 − 0.2 + 0.4 + 0.3
Debt level2 End of year or quarter
2012 2,202.9 1,387.9 684.1 147.5 1.2 79.9 50.3 24.8 5.3 0.02013 2,188.1 1,390.4 663.2 150.5 1.3 77.4 49.2 23.5 5.3 0.02014 2,189.6 1,396.5 657.6 152.0 1.4 74.5 47.5 22.4 5.2 0.0
2015 p 2,159.7 1,372.6 654.3 152.4 1.4 70.8 45.0 21.5 5.0 0.02016 p 2,143.9 1,366.8 637.5 153.9 1.1 67.9 43.3 20.2 4.9 0.02017 p 2,092.8 1,351.3 611.1 148.5 0.8 63.9 41.2 18.6 4.5 0.0
2017 Q1 p 2,117.3 1,351.0 627.5 152.5 1.2 66.3 42.3 19.7 4.8 0.0 Q2 p 2,111.1 1,353.6 620.3 152.0 0.9 65.7 42.1 19.3 4.7 0.0 Q3 p 2,104.5 1,353.0 618.3 150.4 0.8 64.8 41.7 19.0 4.6 0.0 Q4 p 2,092.8 1,351.3 611.1 148.5 0.8 63.9 41.2 18.6 4.5 0.0
2018 Q1 p 2,070.1 1,338.6 600.6 148.0 1.0 62.7 40.5 18.2 4.5 0.0 Q2 p 2,052.4 1,329.3 596.7 144.4 0.9 61.5 39.8 17.9 4.3 0.0 Q3 p 2,052.6 1,335.4 595.7 139.2 0.8 61.0 39.7 17.7 4.1 0.0
Sources: Federal Statistical Office and Bundesbank calculations. 1 The deficit/surplus in accordance with ESA 2010 corresponds to the Maastricht definition. 2 Quarterly GDP ratios are based on the national output of the four preceding quarters.
2. General government: revenue, expenditure and deficit/surplus as shown in the national accounts*
Revenue Expenditure
of which: of which:
Compen- Inter- Gross Memo item:Social con- Social sation of mediate capital Deficit/ Total tax
Period Total Taxes tributions Other Total benefits employees formation Interest Other surplus burden 1 consumption
€ billion2012 1,220.9 624.9 454.3 141.7 1,221.8 645.5 212.3 126.5 61.5 63.1 112.8 − 0.9 1,083.72013 1,259.0 651.0 465.0 143.0 1,263.0 666.4 217.8 133.0 60.1 55.5 130.2 − 4.0 1,120.32014 1,308.5 673.6 482.0 153.0 1,291.8 691.1 224.4 137.7 60.1 47.0 131.6 + 16.7 1,160.2
2015 p 1,356.5 704.2 500.8 151.5 1,332.6 721.7 229.8 143.8 64.1 42.3 130.9 + 23.9 1,212.02016 p 1,415.5 738.7 523.9 152.9 1,386.8 755.2 237.8 150.1 68.2 37.4 138.0 + 28.7 1,269.52017 p 1,473.8 772.5 548.6 152.8 1,439.8 784.5 246.7 156.3 72.4 33.8 146.1 + 34.0 1,327.92018 pe 1,543.6 807.8 571.7 164.0 1,485.5 807.7 256.3 161.8 78.1 31.0 150.6 + 58.0 1,386.6
As a percentage of GDP2012 44.3 22.7 16.5 5.1 44.3 23.4 7.7 4.6 2.2 2.3 4.1 − 0.0 39.32013 44.5 23.0 16.5 5.1 44.7 23.6 7.7 4.7 2.1 2.0 4.6 − 0.1 39.62014 44.5 22.9 16.4 5.2 44.0 23.5 7.6 4.7 2.0 1.6 4.5 + 0.6 39.5
2015 p 44.5 23.1 16.4 5.0 43.7 23.7 7.5 4.7 2.1 1.4 4.3 + 0.8 39.82016 p 44.8 23.4 16.6 4.8 43.9 23.9 7.5 4.8 2.2 1.2 4.4 + 0.9 40.22017 p 45.0 23.6 16.7 4.7 43.9 23.9 7.5 4.8 2.2 1.0 4.5 + 1.0 40.52018 pe 45.6 23.9 16.9 4.8 43.9 23.9 7.6 4.8 2.3 0.9 4.4 + 1.7 41.0
Percentage growth rates2012 + 3.2 + 4.4 + 2.7 + 0.0 + 1.1 + 1.8 + 1.8 + 2.0 + 0.2 − 6.5 − 0.3 . + 3.62013 + 3.1 + 4.2 + 2.4 + 1.0 + 3.4 + 3.2 + 2.6 + 5.1 − 2.2 − 12.0 + 15.4 . + 3.42014 + 3.9 + 3.5 + 3.6 + 6.9 + 2.3 + 3.7 + 3.1 + 3.5 − 0.1 − 15.4 + 1.1 . + 3.6
2015 p + 3.7 + 4.5 + 3.9 − 0.9 + 3.2 + 4.4 + 2.4 + 4.5 + 6.6 − 9.9 − 0.6 . + 4.52016 p + 4.4 + 4.9 + 4.6 + 0.9 + 4.1 + 4.6 + 3.5 + 4.4 + 6.5 − 11.7 + 5.5 . + 4.72017 p + 4.1 + 4.6 + 4.7 − 0.1 + 3.8 + 3.9 + 3.8 + 4.1 + 6.2 − 9.5 + 5.9 . + 4.62018 pe + 4.7 + 4.6 + 4.2 + 7.4 + 3.2 + 3.0 + 3.9 + 3.6 + 7.9 − 8.5 + 3.1 . + 4.4
Source: Federal Statistical Office. * Figures in accordance with ESA 2010. 1 Taxes and social contributions plus customs duties and bank levies to the Single Resolution Fund.
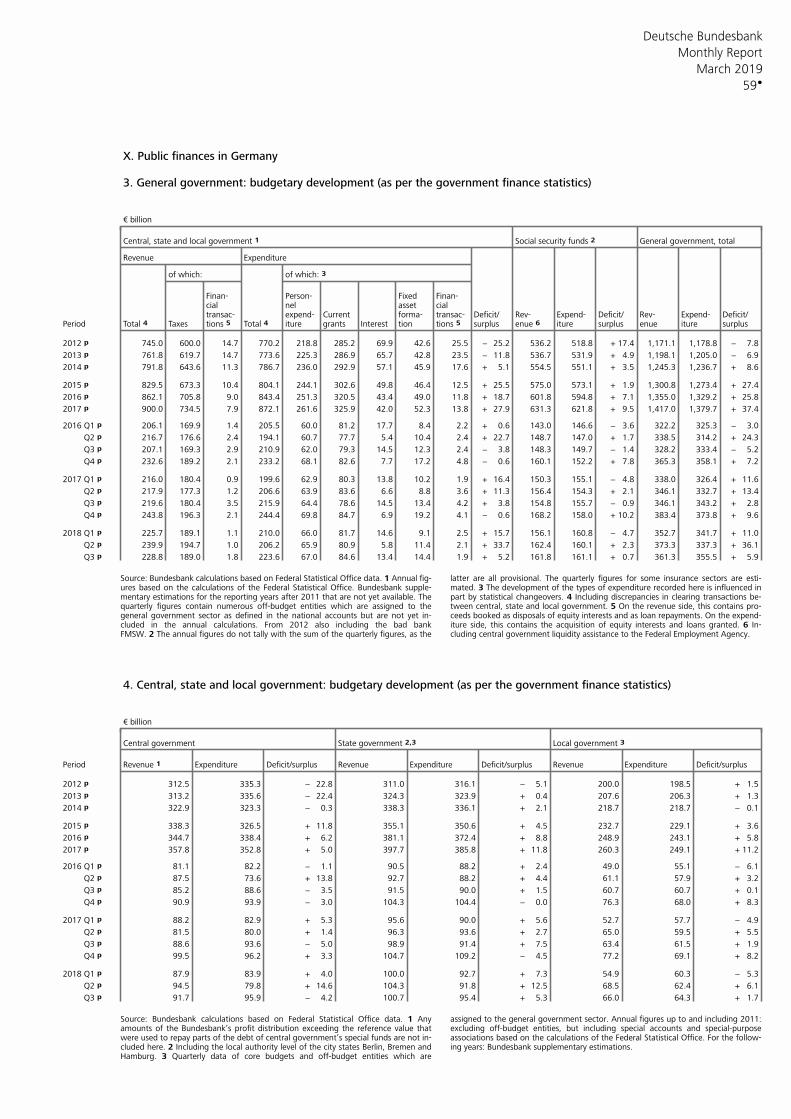
Deutsche Bundesbank
59
Monthly Report
March 2019
X. Public finances in Germany 3. General government: budgetary development (as per the government finance statistics) € billion
Central, state and local government 1 Social security funds 2 General government, total
Revenue Expenditure
of which: of which: 3
Finan- Person- Fixed Finan-cial nel asset cialtransac- expend- Current forma- transac- Deficit/ Rev- Expend- Deficit/ Rev- Expend- Deficit/
Period Total 4 Taxes tions 5 Total 4 iture grants Interest tion tions 5 surplus enue 6 iture surplus enue iture surplus
2012 p 745.0 600.0 14.7 770.2 218.8 285.2 69.9 42.6 25.5 − 25.2 536.2 518.8 + 17.4 1,171.1 1,178.8 − 7.8
2013 p 761.8 619.7 14.7 773.6 225.3 286.9 65.7 42.8 23.5 − 11.8 536.7 531.9 + 4.9 1,198.1 1,205.0 − 6.9
2014 p 791.8 643.6 11.3 786.7 236.0 292.9 57.1 45.9 17.6 + 5.1 554.5 551.1 + 3.5 1,245.3 1,236.7 + 8.6
2015 p 829.5 673.3 10.4 804.1 244.1 302.6 49.8 46.4 12.5 + 25.5 575.0 573.1 + 1.9 1,300.8 1,273.4 + 27.4
2016 p 862.1 705.8 9.0 843.4 251.3 320.5 43.4 49.0 11.8 + 18.7 601.8 594.8 + 7.1 1,355.0 1,329.2 + 25.8
2017 p 900.0 734.5 7.9 872.1 261.6 325.9 42.0 52.3 13.8 + 27.9 631.3 621.8 + 9.5 1,417.0 1,379.7 + 37.4
2016 Q1 p 206.1 169.9 1.4 205.5 60.0 81.2 17.7 8.4 2.2 + 0.6 143.0 146.6 − 3.6 322.2 325.3 − 3.0
Q2 p 216.7 176.6 2.4 194.1 60.7 77.7 5.4 10.4 2.4 + 22.7 148.7 147.0 + 1.7 338.5 314.2 + 24.3
Q3 p 207.1 169.3 2.9 210.9 62.0 79.3 14.5 12.3 2.4 − 3.8 148.3 149.7 − 1.4 328.2 333.4 − 5.2
Q4 p 232.6 189.2 2.1 233.2 68.1 82.6 7.7 17.2 4.8 − 0.6 160.1 152.2 + 7.8 365.3 358.1 + 7.2
2017 Q1 p 216.0 180.4 0.9 199.6 62.9 80.3 13.8 10.2 1.9 + 16.4 150.3 155.1 − 4.8 338.0 326.4 + 11.6
Q2 p 217.9 177.3 1.2 206.6 63.9 83.6 6.6 8.8 3.6 + 11.3 156.4 154.3 + 2.1 346.1 332.7 + 13.4
Q3 p 219.6 180.4 3.5 215.9 64.4 78.6 14.5 13.4 4.2 + 3.8 154.8 155.7 − 0.9 346.1 343.2 + 2.8
Q4 p 243.8 196.3 2.1 244.4 69.8 84.7 6.9 19.2 4.1 − 0.6 168.2 158.0 + 10.2 383.4 373.8 + 9.6
2018 Q1 p 225.7 189.1 1.1 210.0 66.0 81.7 14.6 9.1 2.5 + 15.7 156.1 160.8 − 4.7 352.7 341.7 + 11.0
Q2 p 239.9 194.7 1.0 206.2 65.9 80.9 5.8 11.4 2.1 + 33.7 162.4 160.1 + 2.3 373.3 337.3 + 36.1
Q3 p 228.8 189.0 1.8 223.6 67.0 84.6 13.4 14.4 1.9 + 5.2 161.8 161.1 + 0.7 361.3 355.5 + 5.9
Source: Bundesbank calculations based on Federal Statistical Office data. 1 Annual fig- latter are all provisional. The quarterly figures for some insurance sectors are esti-ures based on the calculations of the Federal Statistical Office. Bundesbank supple- mated. 3 The development of the types of expenditure recorded here is influenced inmentary estimations for the reporting years after 2011 that are not yet available. The part by statistical changeovers. 4 Including discrepancies in clearing transactions be-quarterly figures contain numerous off-budget entities which are assigned to the tween central, state and local government. 5 On the revenue side, this contains pro-general government sector as defined in the national accounts but are not yet in- ceeds booked as disposals of equity interests and as loan repayments. On the expend-cluded in the annual calculations. From 2012 also including the bad bank iture side, this contains the acquisition of equity interests and loans granted. 6 In-FMSW. 2 The annual figures do not tally with the sum of the quarterly figures, as the cluding central government liquidity assistance to the Federal Employment Agency.
4. Central, state and local government: budgetary development (as per the government finance statistics) € billion
Central government State government 2,3 Local government 3
Period Revenue 1 Expenditure Deficit/surplus Revenue Expenditure Deficit/surplus Revenue Expenditure Deficit/surplus
2012 p 312.5 335.3 − 22.8 311.0 316.1 − 5.1 200.0 198.5 + 1.5
2013 p 313.2 335.6 − 22.4 324.3 323.9 + 0.4 207.6 206.3 + 1.3
2014 p 322.9 323.3 − 0.3 338.3 336.1 + 2.1 218.7 218.7 − 0.1
2015 p 338.3 326.5 + 11.8 355.1 350.6 + 4.5 232.7 229.1 + 3.6
2016 p 344.7 338.4 + 6.2 381.1 372.4 + 8.8 248.9 243.1 + 5.8
2017 p 357.8 352.8 + 5.0 397.7 385.8 + 11.8 260.3 249.1 + 11.2
2016 Q1 p 81.1 82.2 − 1.1 90.5 88.2 + 2.4 49.0 55.1 − 6.1
Q2 p 87.5 73.6 + 13.8 92.7 88.2 + 4.4 61.1 57.9 + 3.2
Q3 p 85.2 88.6 − 3.5 91.5 90.0 + 1.5 60.7 60.7 + 0.1
Q4 p 90.9 93.9 − 3.0 104.3 104.4 − 0.0 76.3 68.0 + 8.3
2017 Q1 p 88.2 82.9 + 5.3 95.6 90.0 + 5.6 52.7 57.7 − 4.9
Q2 p 81.5 80.0 + 1.4 96.3 93.6 + 2.7 65.0 59.5 + 5.5
Q3 p 88.6 93.6 − 5.0 98.9 91.4 + 7.5 63.4 61.5 + 1.9
Q4 p 99.5 96.2 + 3.3 104.7 109.2 − 4.5 77.2 69.1 + 8.2
2018 Q1 p 87.9 83.9 + 4.0 100.0 92.7 + 7.3 54.9 60.3 − 5.3
Q2 p 94.5 79.8 + 14.6 104.3 91.8 + 12.5 68.5 62.4 + 6.1
Q3 p 91.7 95.9 − 4.2 100.7 95.4 + 5.3 66.0 64.3 + 1.7
Source: Bundesbank calculations based on Federal Statistical Office data. 1 Any assigned to the general government sector. Annual figures up to and including 2011:amounts of the Bundesbank’s profit distribution exceeding the reference value that excluding off-budget entities, but including special accounts and special-purposewere used to repay parts of the debt of central government’s special funds are not in- associations based on the calculations of the Federal Statistical Office. For the follow-cluded here. 2 Including the local authority level of the city states Berlin, Bremen and ing years: Bundesbank supplementary estimations. Hamburg. 3 Quarterly data of core budgets and off-budget entities which are
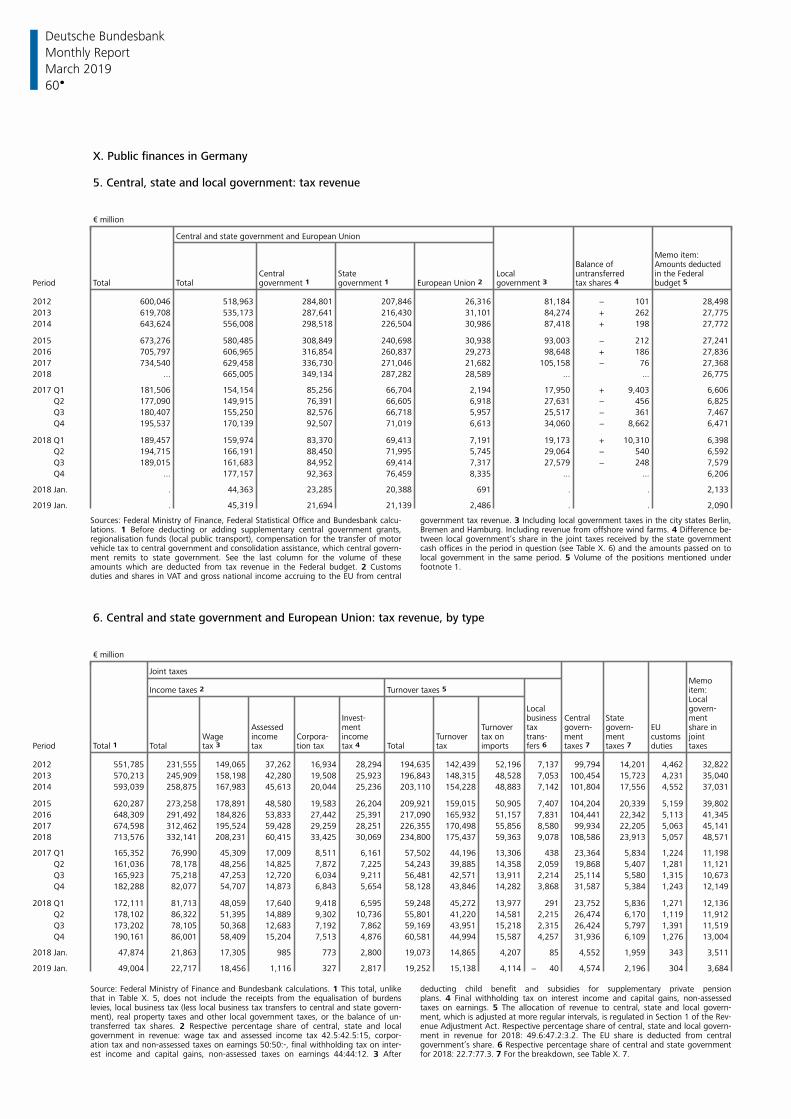
Deutsche Bundesbank
60
Monthly Report
March 2019
X. Public finances in Germany 5. Central, state and local government: tax revenue € million
Central and state government and European Union
Memo item:Balance of Amounts deducted
Central State Local untransferred in the FederalPeriod Total Total government 1 government 1 European Union 2 government 3 tax shares 4 budget 5
2012 600,046 518,963 284,801 207,846 26,316 81,184 − 101 28,498
2013 619,708 535,173 287,641 216,430 31,101 84,274 + 262 27,775
2014 643,624 556,008 298,518 226,504 30,986 87,418 + 198 27,772
2015 673,276 580,485 308,849 240,698 30,938 93,003 − 212 27,241
2016 705,797 606,965 316,854 260,837 29,273 98,648 + 186 27,836
2017 734,540 629,458 336,730 271,046 21,682 105,158 − 76 27,368
2018 ... 665,005 349,134 287,282 28,589 ... ... 26,775
2017 Q1 181,506 154,154 85,256 66,704 2,194 17,950 + 9,403 6,606
Q2 177,090 149,915 76,391 66,605 6,918 27,631 − 456 6,825
Q3 180,407 155,250 82,576 66,718 5,957 25,517 − 361 7,467
Q4 195,537 170,139 92,507 71,019 6,613 34,060 − 8,662 6,471
2018 Q1 189,457 159,974 83,370 69,413 7,191 19,173 + 10,310 6,398
Q2 194,715 166,191 88,450 71,995 5,745 29,064 − 540 6,592
Q3 189,015 161,683 84,952 69,414 7,317 27,579 − 248 7,579
Q4 ... 177,157 92,363 76,459 8,335 ... ... 6,206
2018 Jan. . 44,363 23,285 20,388 691 . . 2,133
2019 Jan. . 45,319 21,694 21,139 2,486 . . 2,090
Sources: Federal Ministry of Finance, Federal Statistical Office and Bundesbank calcu- government tax revenue. 3 Including local government taxes in the city states Berlin,lations. 1 Before deducting or adding supplementary central government grants, Bremen and Hamburg. Including revenue from offshore wind farms. 4 Difference be-regionalisation funds (local public transport), compensation for the transfer of motor tween local government’s share in the joint taxes received by the state governmentvehicle tax to central government and consolidation assistance, which central govern- cash offices in the period in question (see Table X. 6) and the amounts passed on toment remits to state government. See the last column for the volume of these local government in the same period. 5 Volume of the positions mentioned underamounts which are deducted from tax revenue in the Federal budget. 2 Customs footnote 1. duties and shares in VAT and gross national income accruing to the EU from central
6. Central and state government and European Union: tax revenue, by type € million
Joint taxesMemo
Income taxes 2 Turnover taxes 5 item:Local
Local govern-Invest- business Central State ment
Assessed ment Turnover tax govern- govern- EU share inWage income Corpora- income Turnover tax on trans- ment ment customs joint
Period Total 1 Total tax 3 tax tion tax tax 4 Total tax imports fers 6 taxes 7 taxes 7 duties taxes
2012 551,785 231,555 149,065 37,262 16,934 28,294 194,635 142,439 52,196 7,137 99,794 14,201 4,462 32,822
2013 570,213 245,909 158,198 42,280 19,508 25,923 196,843 148,315 48,528 7,053 100,454 15,723 4,231 35,040
2014 593,039 258,875 167,983 45,613 20,044 25,236 203,110 154,228 48,883 7,142 101,804 17,556 4,552 37,031
2015 620,287 273,258 178,891 48,580 19,583 26,204 209,921 159,015 50,905 7,407 104,204 20,339 5,159 39,802
2016 648,309 291,492 184,826 53,833 27,442 25,391 217,090 165,932 51,157 7,831 104,441 22,342 5,113 41,345
2017 674,598 312,462 195,524 59,428 29,259 28,251 226,355 170,498 55,856 8,580 99,934 22,205 5,063 45,141
2018 713,576 332,141 208,231 60,415 33,425 30,069 234,800 175,437 59,363 9,078 108,586 23,913 5,057 48,571
2017 Q1 165,352 76,990 45,309 17,009 8,511 6,161 57,502 44,196 13,306 438 23,364 5,834 1,224 11,198
Q2 161,036 78,178 48,256 14,825 7,872 7,225 54,243 39,885 14,358 2,059 19,868 5,407 1,281 11,121
Q3 165,923 75,218 47,253 12,720 6,034 9,211 56,481 42,571 13,911 2,214 25,114 5,580 1,315 10,673
Q4 182,288 82,077 54,707 14,873 6,843 5,654 58,128 43,846 14,282 3,868 31,587 5,384 1,243 12,149
2018 Q1 172,111 81,713 48,059 17,640 9,418 6,595 59,248 45,272 13,977 291 23,752 5,836 1,271 12,136
Q2 178,102 86,322 51,395 14,889 9,302 10,736 55,801 41,220 14,581 2,215 26,474 6,170 1,119 11,912
Q3 173,202 78,105 50,368 12,683 7,192 7,862 59,169 43,951 15,218 2,315 26,424 5,797 1,391 11,519
Q4 190,161 86,001 58,409 15,204 7,513 4,876 60,581 44,994 15,587 4,257 31,936 6,109 1,276 13,004
2018 Jan. 47,874 21,863 17,305 985 773 2,800 19,073 14,865 4,207 85 4,552 1,959 343 3,511
2019 Jan. 49,004 22,717 18,456 1,116 327 2,817 19,252 15,138 4,114 − 40 4,574 2,196 304 3,684
Source: Federal Ministry of Finance and Bundesbank calculations. 1 This total, unlike deducting child benefit and subsidies for supplementary private pensionthat in Table X. 5, does not include the receipts from the equalisation of burdens plans. 4 Final withholding tax on interest income and capital gains, non-assessedlevies, local business tax (less local business tax transfers to central and state govern- taxes on earnings. 5 The allocation of revenue to central, state and local govern-ment), real property taxes and other local government taxes, or the balance of un- ment, which is adjusted at more regular intervals, is regulated in Section 1 of the Rev-transferred tax shares. 2 Respective percentage share of central, state and local enue Adjustment Act. Respective percentage share of central, state and local govern-government in revenue: wage tax and assessed income tax 42.5:42.5:15, corpor- ment in revenue for 2018: 49.6:47.2:3.2. The EU share is deducted from centralation tax and non-assessed taxes on earnings 50:50:-, final withholding tax on inter- government’s share. 6 Respective percentage share of central and state governmentest income and capital gains, non-assessed taxes on earnings 44:44:12. 3 After for 2018: 22.7:77.3. 7 For the breakdown, see Table X. 7.
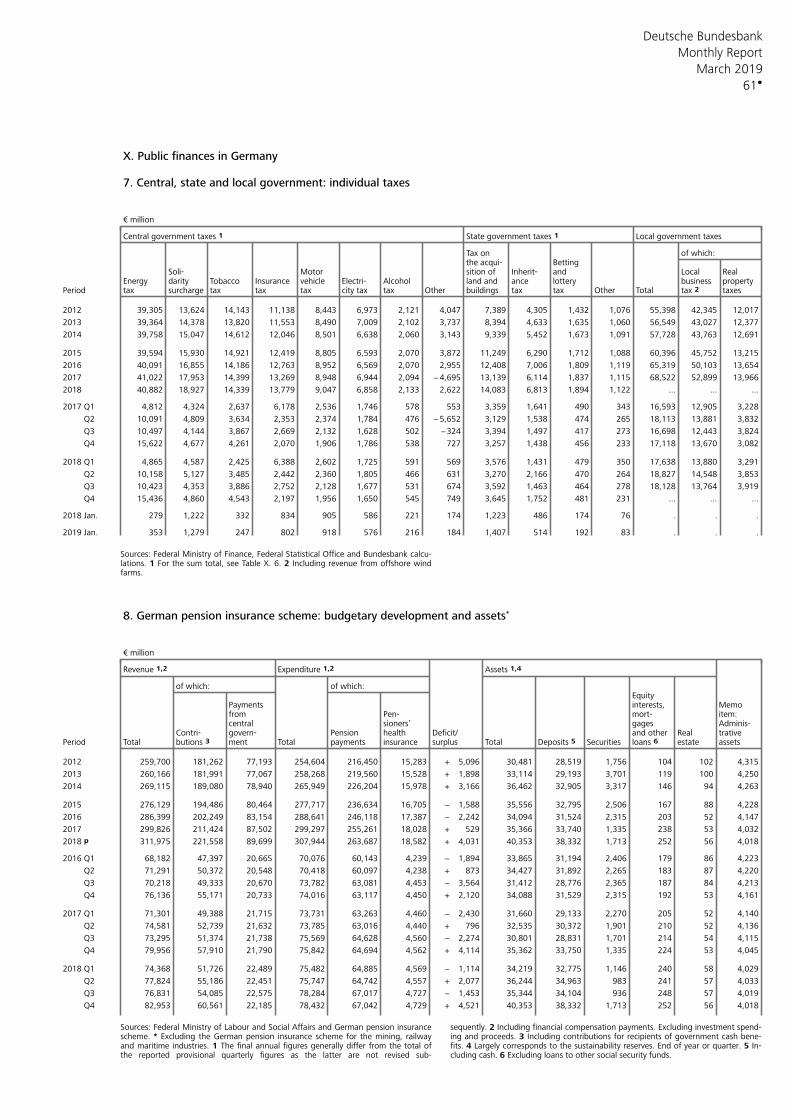
Deutsche Bundesbank
61
Monthly Report
March 2019
X. Public finances in Germany 7. Central, state and local government: individual taxes € million
Central government taxes 1 State government taxes 1 Local government taxes
Tax on of which:the acqui- Betting
Soli- Motor sition of Inherit- and Local RealEnergy darity Tobacco Insurance vehicle Electri- Alcohol land and ance lottery business property
Period tax surcharge tax tax tax city tax tax Other buildings tax tax Other Total tax 2 taxes
2012 39,305 13,624 14,143 11,138 8,443 6,973 2,121 4,047 7,389 4,305 1,432 1,076 55,398 42,345 12,017
2013 39,364 14,378 13,820 11,553 8,490 7,009 2,102 3,737 8,394 4,633 1,635 1,060 56,549 43,027 12,377
2014 39,758 15,047 14,612 12,046 8,501 6,638 2,060 3,143 9,339 5,452 1,673 1,091 57,728 43,763 12,691
2015 39,594 15,930 14,921 12,419 8,805 6,593 2,070 3,872 11,249 6,290 1,712 1,088 60,396 45,752 13,215
2016 40,091 16,855 14,186 12,763 8,952 6,569 2,070 2,955 12,408 7,006 1,809 1,119 65,319 50,103 13,654
2017 41,022 17,953 14,399 13,269 8,948 6,944 2,094 − 4,695 13,139 6,114 1,837 1,115 68,522 52,899 13,966
2018 40,882 18,927 14,339 13,779 9,047 6,858 2,133 2,622 14,083 6,813 1,894 1,122 ... ... ...
2017 Q1 4,812 4,324 2,637 6,178 2,536 1,746 578 553 3,359 1,641 490 343 16,593 12,905 3,228
Q2 10,091 4,809 3,634 2,353 2,374 1,784 476 − 5,652 3,129 1,538 474 265 18,113 13,881 3,832
Q3 10,497 4,144 3,867 2,669 2,132 1,628 502 −324 3,394 1,497 417 273 16,698 12,443 3,824
Q4 15,622 4,677 4,261 2,070 1,906 1,786 538 727 3,257 1,438 456 233 17,118 13,670 3,082
2018 Q1 4,865 4,587 2,425 6,388 2,602 1,725 591 569 3,576 1,431 479 350 17,638 13,880 3,291
Q2 10,158 5,127 3,485 2,442 2,360 1,805 466 631 3,270 2,166 470 264 18,827 14,548 3,853
Q3 10,423 4,353 3,886 2,752 2,128 1,677 531 674 3,592 1,463 464 278 18,128 13,764 3,919
Q4 15,436 4,860 4,543 2,197 1,956 1,650 545 749 3,645 1,752 481 231 ... ... ...
2018 Jan. 279 1,222 332 834 905 586 221 174 1,223 486 174 76 . . .
2019 Jan. 353 1,279 247 802 918 576 216 184 1,407 514 192 83 . . .
Sources: Federal Ministry of Finance, Federal Statistical Office and Bundesbank calcu-lations. 1 For the sum total, see Table X. 6. 2 Including revenue from offshore wind farms.
8. German pension insurance scheme: budgetary development and assets*
€ million
Revenue 1,2 Expenditure 1,2 Assets 1,4
of which: of which:Equity
Payments interests, Memofrom Pen- mort- item:central sioners’ gages Adminis-
Contri- govern- Pension health Deficit/ and other Real trativePeriod Total butions 3 ment Total payments insurance surplus Total Deposits 5 Securities loans 6 estate assets
2012 259,700 181,262 77,193 254,604 216,450 15,283 + 5,096 30,481 28,519 1,756 104 102 4,315
2013 260,166 181,991 77,067 258,268 219,560 15,528 + 1,898 33,114 29,193 3,701 119 100 4,250
2014 269,115 189,080 78,940 265,949 226,204 15,978 + 3,166 36,462 32,905 3,317 146 94 4,263
2015 276,129 194,486 80,464 277,717 236,634 16,705 − 1,588 35,556 32,795 2,506 167 88 4,228
2016 286,399 202,249 83,154 288,641 246,118 17,387 − 2,242 34,094 31,524 2,315 203 52 4,147
2017 299,826 211,424 87,502 299,297 255,261 18,028 + 529 35,366 33,740 1,335 238 53 4,032
2018 p 311,975 221,558 89,699 307,944 263,687 18,582 + 4,031 40,353 38,332 1,713 252 56 4,018
2016 Q1 68,182 47,397 20,665 70,076 60,143 4,239 − 1,894 33,865 31,194 2,406 179 86 4,223
Q2 71,291 50,372 20,548 70,418 60,097 4,238 + 873 34,427 31,892 2,265 183 87 4,220
Q3 70,218 49,333 20,670 73,782 63,081 4,453 − 3,564 31,412 28,776 2,365 187 84 4,213
Q4 76,136 55,171 20,733 74,016 63,117 4,450 + 2,120 34,088 31,529 2,315 192 53 4,161
2017 Q1 71,301 49,388 21,715 73,731 63,263 4,460 − 2,430 31,660 29,133 2,270 205 52 4,140
Q2 74,581 52,739 21,632 73,785 63,016 4,440 + 796 32,535 30,372 1,901 210 52 4,136
Q3 73,295 51,374 21,738 75,569 64,628 4,560 − 2,274 30,801 28,831 1,701 214 54 4,115
Q4 79,956 57,910 21,790 75,842 64,694 4,562 + 4,114 35,362 33,750 1,335 224 53 4,045
2018 Q1 74,368 51,726 22,489 75,482 64,885 4,569 − 1,114 34,219 32,775 1,146 240 58 4,029
Q2 77,824 55,186 22,451 75,747 64,742 4,557 + 2,077 36,244 34,963 983 241 57 4,033
Q3 76,831 54,085 22,575 78,284 67,017 4,727 − 1,453 35,344 34,104 936 248 57 4,019
Q4 82,953 60,561 22,185 78,432 67,042 4,729 + 4,521 40,353 38,332 1,713 252 56 4,018
Sources: Federal Ministry of Labour and Social Affairs and German pension insurance sequently. 2 Including financial compensation payments. Excluding investment spend-scheme. * Excluding the German pension insurance scheme for the mining, railway ing and proceeds. 3 Including contributions for recipients of government cash bene-and maritime industries. 1 The final annual figures generally differ from the total of fits. 4 Largely corresponds to the sustainability reserves. End of year or quarter. 5 In-the reported provisional quarterly figures as the latter are not revised sub- cluding cash. 6 Excluding loans to other social security funds.
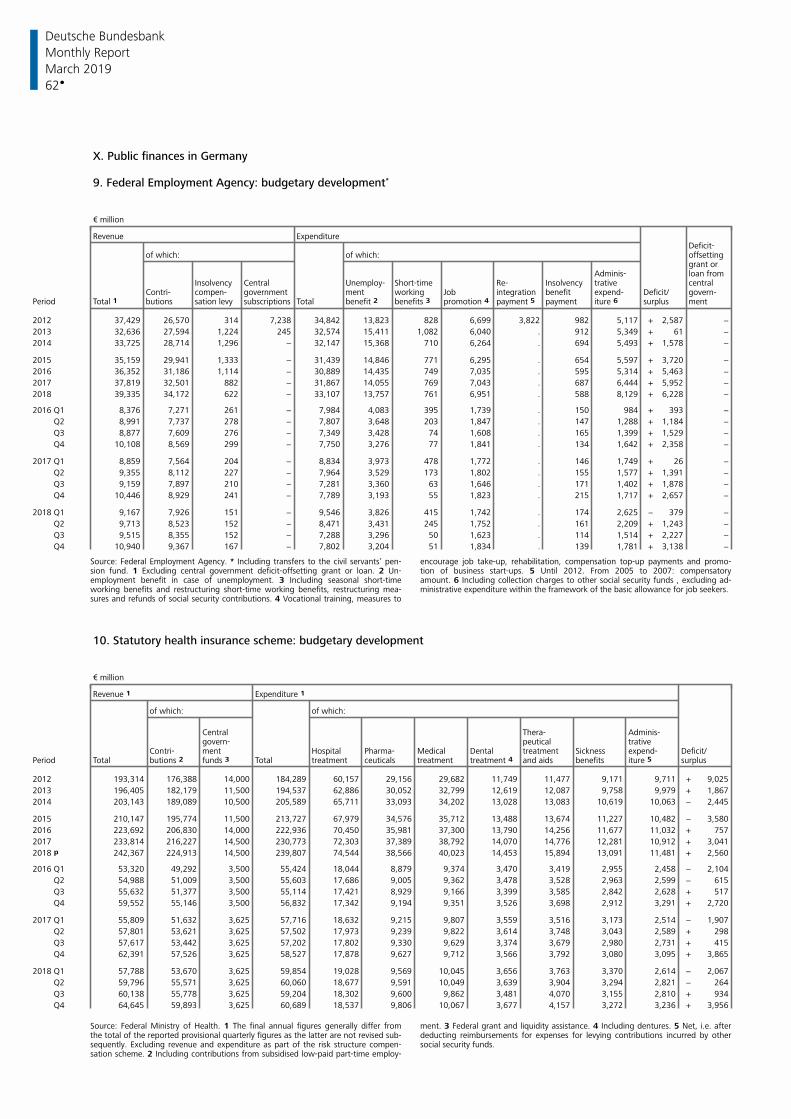
Deutsche Bundesbank
62
Monthly Report
March 2019
X. Public finances in Germany 9. Federal Employment Agency: budgetary development*
€ million
Revenue ExpenditureDeficit-
of which: of which: offsettinggrant or
Adminis- loan fromInsolvency Central Unemploy- Short-time Re- Insolvency trative central
Contri- compen- government ment working Job integration benefit expend- Deficit/ govern-Period Total 1 butions sation levy subscriptions Total benefit 2 benefits 3 promotion 4 payment 5 payment iture 6 surplus ment
2012 37,429 26,570 314 7,238 34,842 13,823 828 6,699 3,822 982 5,117 + 2,587 −
2013 32,636 27,594 1,224 245 32,574 15,411 1,082 6,040 . 912 5,349 + 61 −
2014 33,725 28,714 1,296 − 32,147 15,368 710 6,264 . 694 5,493 + 1,578 −
2015 35,159 29,941 1,333 − 31,439 14,846 771 6,295 . 654 5,597 + 3,720 −
2016 36,352 31,186 1,114 − 30,889 14,435 749 7,035 . 595 5,314 + 5,463 −
2017 37,819 32,501 882 − 31,867 14,055 769 7,043 . 687 6,444 + 5,952 −
2018 39,335 34,172 622 − 33,107 13,757 761 6,951 . 588 8,129 + 6,228 −
2016 Q1 8,376 7,271 261 − 7,984 4,083 395 1,739 . 150 984 + 393 −
Q2 8,991 7,737 278 − 7,807 3,648 203 1,847 . 147 1,288 + 1,184 −
Q3 8,877 7,609 276 − 7,349 3,428 74 1,608 . 165 1,399 + 1,529 −
Q4 10,108 8,569 299 − 7,750 3,276 77 1,841 . 134 1,642 + 2,358 −
2017 Q1 8,859 7,564 204 − 8,834 3,973 478 1,772 . 146 1,749 + 26 −
Q2 9,355 8,112 227 − 7,964 3,529 173 1,802 . 155 1,577 + 1,391 −
Q3 9,159 7,897 210 − 7,281 3,360 63 1,646 . 171 1,402 + 1,878 −
Q4 10,446 8,929 241 − 7,789 3,193 55 1,823 . 215 1,717 + 2,657 −
2018 Q1 9,167 7,926 151 − 9,546 3,826 415 1,742 . 174 2,625 − 379 −
Q2 9,713 8,523 152 − 8,471 3,431 245 1,752 . 161 2,209 + 1,243 −
Q3 9,515 8,355 152 − 7,288 3,296 50 1,623 . 114 1,514 + 2,227 −
Q4 10,940 9,367 167 − 7,802 3,204 51 1,834 . 139 1,781 + 3,138 −
Source: Federal Employment Agency. * Including transfers to the civil servants’ pen- encourage job take-up, rehabilitation, compensation top-up payments and promo-sion fund. 1 Excluding central government deficit-offsetting grant or loan. 2 Un- tion of business start-ups. 5 Until 2012. From 2005 to 2007: compensatoryemployment benefit in case of unemployment. 3 Including seasonal short-time amount. 6 Including collection charges to other social security funds , excluding ad-working benefits and restructuring short-time working benefits, restructuring mea- ministrative expenditure within the framework of the basic allowance for job seekers. sures and refunds of social security contributions. 4 Vocational training, measures to
10. Statutory health insurance scheme: budgetary development € million
Revenue 1 Expenditure 1
of which: of which:
Central Thera- Adminis-govern- peutical trative
Contri- ment Hospital Pharma- Medical Dental treatment Sickness expend- Deficit/Period Total butions 2 funds 3 Total treatment ceuticals treatment treatment 4 and aids benefits iture 5 surplus
2012 193,314 176,388 14,000 184,289 60,157 29,156 29,682 11,749 11,477 9,171 9,711 + 9,025
2013 196,405 182,179 11,500 194,537 62,886 30,052 32,799 12,619 12,087 9,758 9,979 + 1,867
2014 203,143 189,089 10,500 205,589 65,711 33,093 34,202 13,028 13,083 10,619 10,063 − 2,445
2015 210,147 195,774 11,500 213,727 67,979 34,576 35,712 13,488 13,674 11,227 10,482 − 3,580
2016 223,692 206,830 14,000 222,936 70,450 35,981 37,300 13,790 14,256 11,677 11,032 + 757
2017 233,814 216,227 14,500 230,773 72,303 37,389 38,792 14,070 14,776 12,281 10,912 + 3,041
2018 p 242,367 224,913 14,500 239,807 74,544 38,566 40,023 14,453 15,894 13,091 11,481 + 2,560
2016 Q1 53,320 49,292 3,500 55,424 18,044 8,879 9,374 3,470 3,419 2,955 2,458 − 2,104
Q2 54,988 51,009 3,500 55,603 17,686 9,005 9,362 3,478 3,528 2,963 2,599 − 615
Q3 55,632 51,377 3,500 55,114 17,421 8,929 9,166 3,399 3,585 2,842 2,628 + 517
Q4 59,552 55,146 3,500 56,832 17,342 9,194 9,351 3,526 3,698 2,912 3,291 + 2,720
2017 Q1 55,809 51,632 3,625 57,716 18,632 9,215 9,807 3,559 3,516 3,173 2,514 − 1,907
Q2 57,801 53,621 3,625 57,502 17,973 9,239 9,822 3,614 3,748 3,043 2,589 + 298
Q3 57,617 53,442 3,625 57,202 17,802 9,330 9,629 3,374 3,679 2,980 2,731 + 415
Q4 62,391 57,526 3,625 58,527 17,878 9,627 9,712 3,566 3,792 3,080 3,095 + 3,865
2018 Q1 57,788 53,670 3,625 59,854 19,028 9,569 10,045 3,656 3,763 3,370 2,614 − 2,067
Q2 59,796 55,571 3,625 60,060 18,677 9,591 10,049 3,639 3,904 3,294 2,821 − 264
Q3 60,138 55,778 3,625 59,204 18,302 9,600 9,862 3,481 4,070 3,155 2,810 + 934
Q4 64,645 59,893 3,625 60,689 18,537 9,806 10,067 3,677 4,157 3,272 3,236 + 3,956
Source: Federal Ministry of Health. 1 The final annual figures generally differ from ment. 3 Federal grant and liquidity assistance. 4 Including dentures. 5 Net, i.e. afterthe total of the reported provisional quarterly figures as the latter are not revised sub- deducting reimbursements for expenses for levying contributions incurred by othersequently. Excluding revenue and expenditure as part of the risk structure compen- social security funds. sation scheme. 2 Including contributions from subsidised low-paid part-time employ-
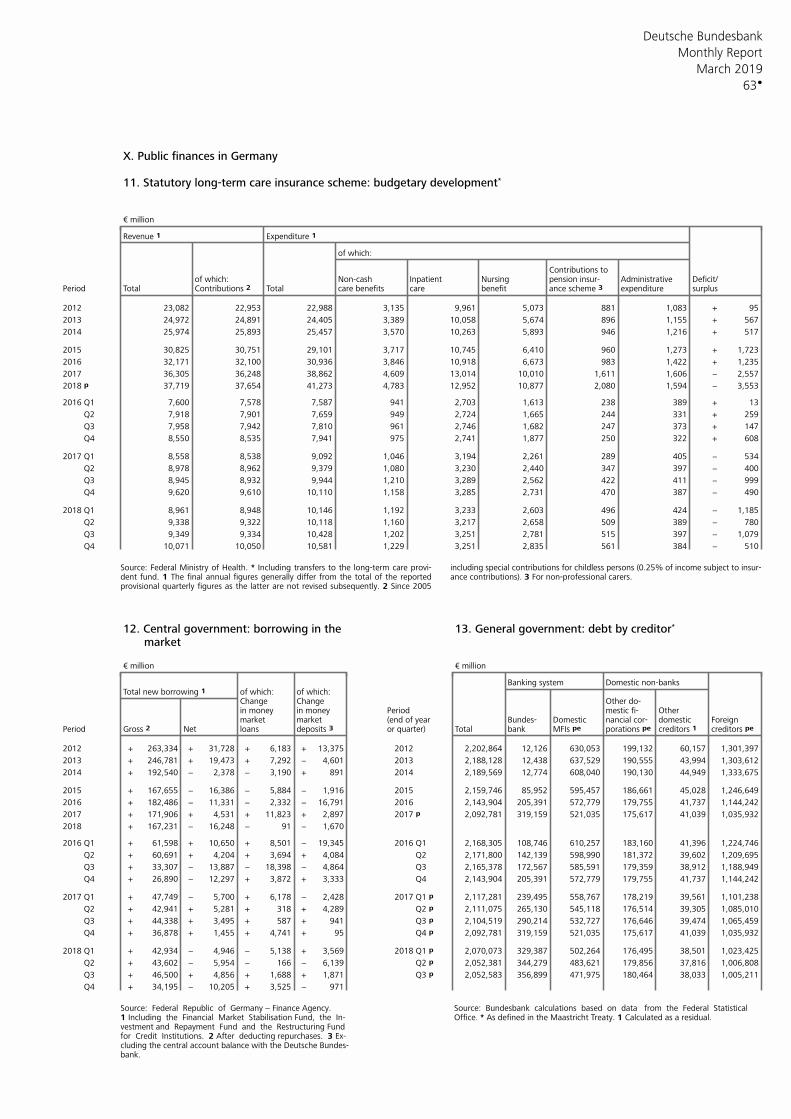
Deutsche Bundesbank
63
Monthly Report
March 2019
X. Public finances in Germany 11. Statutory long-term care insurance scheme: budgetary development*
€ million
Revenue 1 Expenditure 1
of which:
Contributions toof which: Non-cash Inpatient Nursing pension insur- Administrative Deficit/
Period Total Contributions 2 Total care benefits care benefit ance scheme 3 expenditure surplus
2012 23,082 22,953 22,988 3,135 9,961 5,073 881 1,083 + 95
2013 24,972 24,891 24,405 3,389 10,058 5,674 896 1,155 + 567
2014 25,974 25,893 25,457 3,570 10,263 5,893 946 1,216 + 517
2015 30,825 30,751 29,101 3,717 10,745 6,410 960 1,273 + 1,723
2016 32,171 32,100 30,936 3,846 10,918 6,673 983 1,422 + 1,235
2017 36,305 36,248 38,862 4,609 13,014 10,010 1,611 1,606 − 2,557
2018 p 37,719 37,654 41,273 4,783 12,952 10,877 2,080 1,594 − 3,553
2016 Q1 7,600 7,578 7,587 941 2,703 1,613 238 389 + 13
Q2 7,918 7,901 7,659 949 2,724 1,665 244 331 + 259
Q3 7,958 7,942 7,810 961 2,746 1,682 247 373 + 147
Q4 8,550 8,535 7,941 975 2,741 1,877 250 322 + 608
2017 Q1 8,558 8,538 9,092 1,046 3,194 2,261 289 405 − 534
Q2 8,978 8,962 9,379 1,080 3,230 2,440 347 397 − 400
Q3 8,945 8,932 9,944 1,210 3,289 2,562 422 411 − 999
Q4 9,620 9,610 10,110 1,158 3,285 2,731 470 387 − 490
2018 Q1 8,961 8,948 10,146 1,192 3,233 2,603 496 424 − 1,185
Q2 9,338 9,322 10,118 1,160 3,217 2,658 509 389 − 780
Q3 9,349 9,334 10,428 1,202 3,251 2,781 515 397 − 1,079
Q4 10,071 10,050 10,581 1,229 3,251 2,835 561 384 − 510
Source: Federal Ministry of Health. * Including transfers to the long-term care provi- including special contributions for childless persons (0.25% of income subject to insur-dent fund. 1 The final annual figures generally differ from the total of the reported ance contributions). 3 For non-professional carers. provisional quarterly figures as the latter are not revised subsequently. 2 Since 2005
12. Central government: borrowing in the 13. General government: debt by creditor*
market € million € million
Banking system Domestic non-banksTotal new borrowing 1 of which: of which:
Change Change Other do-in money in money Period mestic fi- Othermarket market (end of year Bundes- Domestic nancial cor- domestic Foreign
Period Gross 2 Net loans deposits 3 or quarter) Total bank MFIs pe porations pe creditors 1 creditors pe
2012 + 263,334 + 31,728 + 6,183 + 13,375 2012 2,202,864 12,126 630,053 199,132 60,157 1,301,397
2013 + 246,781 + 19,473 + 7,292 − 4,601 2013 2,188,128 12,438 637,529 190,555 43,994 1,303,612
2014 + 192,540 − 2,378 − 3,190 + 891 2014 2,189,569 12,774 608,040 190,130 44,949 1,333,675
2015 + 167,655 − 16,386 − 5,884 − 1,916 2015 2,159,746 85,952 595,457 186,661 45,028 1,246,649
2016 + 182,486 − 11,331 − 2,332 − 16,791 2016 2,143,904 205,391 572,779 179,755 41,737 1,144,242
2017 + 171,906 + 4,531 + 11,823 + 2,897 2017 p 2,092,781 319,159 521,035 175,617 41,039 1,035,932
2018 + 167,231 − 16,248 − 91 − 1,670
2016 Q1 + 61,598 + 10,650 + 8,501 − 19,345 2016 Q1 2,168,305 108,746 610,257 183,160 41,396 1,224,746
Q2 + 60,691 + 4,204 + 3,694 + 4,084 Q2 2,171,800 142,139 598,990 181,372 39,602 1,209,695
Q3 + 33,307 − 13,887 − 18,398 − 4,864 Q3 2,165,378 172,567 585,591 179,359 38,912 1,188,949
Q4 + 26,890 − 12,297 + 3,872 + 3,333 Q4 2,143,904 205,391 572,779 179,755 41,737 1,144,242
2017 Q1 + 47,749 − 5,700 + 6,178 − 2,428 2017 Q1 p 2,117,281 239,495 558,767 178,219 39,561 1,101,238
Q2 + 42,941 + 5,281 + 318 + 4,289 Q2 p 2,111,075 265,130 545,118 176,514 39,305 1,085,010
Q3 + 44,338 + 3,495 + 587 + 941 Q3 p 2,104,519 290,214 532,727 176,646 39,474 1,065,459
Q4 + 36,878 + 1,455 + 4,741 + 95 Q4 p 2,092,781 319,159 521,035 175,617 41,039 1,035,932
2018 Q1 + 42,934 − 4,946 − 5,138 + 3,569 2018 Q1 p 2,070,073 329,387 502,264 176,495 38,501 1,023,425
Q2 + 43,602 − 5,954 − 166 − 6,139 Q2 p 2,052,381 344,279 483,621 179,856 37,816 1,006,808
Q3 + 46,500 + 4,856 + 1,688 + 1,871 Q3 p 2,052,583 356,899 471,975 180,464 38,033 1,005,211
Q4 + 34,195 − 10,205 + 3,525 − 971
Source: Federal Republic of Germany − Finance Agency. Source: Bundesbank calculations based on data from the Federal Statistical 1 Including the Financial Market Stabilisation Fund, the In- Office. * As defined in the Maastricht Treaty. 1 Calculated as a residual. vestment and Repayment Fund and the Restructuring Fund for Credit Institutions. 2 After deducting repurchases. 3 Ex- cluding the central account balance with the Deutsche Bundes- bank.
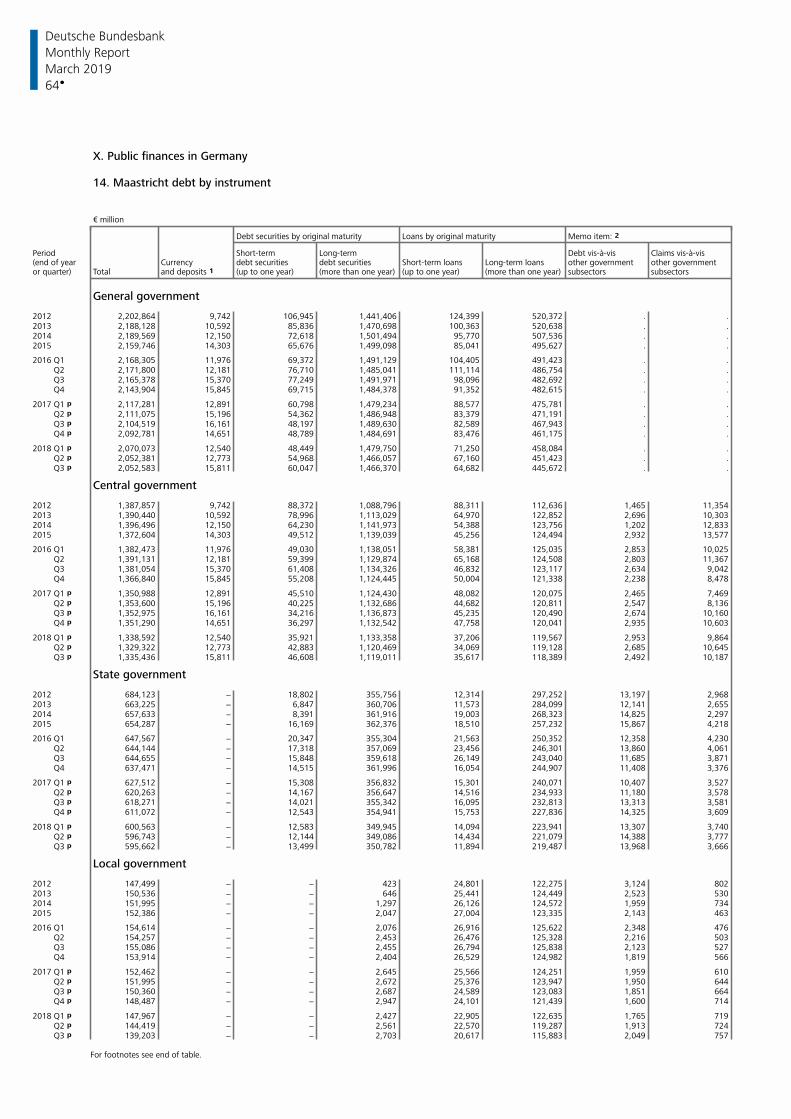
Deutsche Bundesbank
64
Monthly Report
March 2019
X. Public finances in Germany 14. Maastricht debt by instrument € million
Debt securities by original maturity Loans by original maturity Memo item: 2
Period Short-term Long-term Debt vis-à-vis Claims vis-à-vis(end of year Currency debt securities debt securities Short-term loans Long-term loans other government other governmentor quarter) Total and deposits 1 (up to one year) (more than one year) (up to one year) (more than one year) subsectors subsectors
General government
2012 2,202,864 9,742 106,945 1,441,406 124,399 520,372 . .2013 2,188,128 10,592 85,836 1,470,698 100,363 520,638 . .2014 2,189,569 12,150 72,618 1,501,494 95,770 507,536 . .2015 2,159,746 14,303 65,676 1,499,098 85,041 495,627 . .
2016 Q1 2,168,305 11,976 69,372 1,491,129 104,405 491,423 . . Q2 2,171,800 12,181 76,710 1,485,041 111,114 486,754 . . Q3 2,165,378 15,370 77,249 1,491,971 98,096 482,692 . . Q4 2,143,904 15,845 69,715 1,484,378 91,352 482,615 . .
2017 Q1 p 2,117,281 12,891 60,798 1,479,234 88,577 475,781 . . Q2 p 2,111,075 15,196 54,362 1,486,948 83,379 471,191 . . Q3 p 2,104,519 16,161 48,197 1,489,630 82,589 467,943 . . Q4 p 2,092,781 14,651 48,789 1,484,691 83,476 461,175 . .
2018 Q1 p 2,070,073 12,540 48,449 1,479,750 71,250 458,084 . . Q2 p 2,052,381 12,773 54,968 1,466,057 67,160 451,423 . . Q3 p 2,052,583 15,811 60,047 1,466,370 64,682 445,672 . .
Central government
2012 1,387,857 9,742 88,372 1,088,796 88,311 112,636 1,465 11,3542013 1,390,440 10,592 78,996 1,113,029 64,970 122,852 2,696 10,3032014 1,396,496 12,150 64,230 1,141,973 54,388 123,756 1,202 12,8332015 1,372,604 14,303 49,512 1,139,039 45,256 124,494 2,932 13,577
2016 Q1 1,382,473 11,976 49,030 1,138,051 58,381 125,035 2,853 10,025 Q2 1,391,131 12,181 59,399 1,129,874 65,168 124,508 2,803 11,367 Q3 1,381,054 15,370 61,408 1,134,326 46,832 123,117 2,634 9,042 Q4 1,366,840 15,845 55,208 1,124,445 50,004 121,338 2,238 8,478
2017 Q1 p 1,350,988 12,891 45,510 1,124,430 48,082 120,075 2,465 7,469 Q2 p 1,353,600 15,196 40,225 1,132,686 44,682 120,811 2,547 8,136 Q3 p 1,352,975 16,161 34,216 1,136,873 45,235 120,490 2,674 10,160 Q4 p 1,351,290 14,651 36,297 1,132,542 47,758 120,041 2,935 10,603
2018 Q1 p 1,338,592 12,540 35,921 1,133,358 37,206 119,567 2,953 9,864 Q2 p 1,329,322 12,773 42,883 1,120,469 34,069 119,128 2,685 10,645 Q3 p 1,335,436 15,811 46,608 1,119,011 35,617 118,389 2,492 10,187
State government
2012 684,123 − 18,802 355,756 12,314 297,252 13,197 2,9682013 663,225 − 6,847 360,706 11,573 284,099 12,141 2,6552014 657,633 − 8,391 361,916 19,003 268,323 14,825 2,2972015 654,287 − 16,169 362,376 18,510 257,232 15,867 4,218
2016 Q1 647,567 − 20,347 355,304 21,563 250,352 12,358 4,230 Q2 644,144 − 17,318 357,069 23,456 246,301 13,860 4,061 Q3 644,655 − 15,848 359,618 26,149 243,040 11,685 3,871 Q4 637,471 − 14,515 361,996 16,054 244,907 11,408 3,376
2017 Q1 p 627,512 − 15,308 356,832 15,301 240,071 10,407 3,527 Q2 p 620,263 − 14,167 356,647 14,516 234,933 11,180 3,578 Q3 p 618,271 − 14,021 355,342 16,095 232,813 13,313 3,581 Q4 p 611,072 − 12,543 354,941 15,753 227,836 14,325 3,609
2018 Q1 p 600,563 − 12,583 349,945 14,094 223,941 13,307 3,740 Q2 p 596,743 − 12,144 349,086 14,434 221,079 14,388 3,777 Q3 p 595,662 − 13,499 350,782 11,894 219,487 13,968 3,666
Local government
2012 147,499 − − 423 24,801 122,275 3,124 8022013 150,536 − − 646 25,441 124,449 2,523 5302014 151,995 − − 1,297 26,126 124,572 1,959 7342015 152,386 − − 2,047 27,004 123,335 2,143 463
2016 Q1 154,614 − − 2,076 26,916 125,622 2,348 476 Q2 154,257 − − 2,453 26,476 125,328 2,216 503 Q3 155,086 − − 2,455 26,794 125,838 2,123 527 Q4 153,914 − − 2,404 26,529 124,982 1,819 566
2017 Q1 p 152,462 − − 2,645 25,566 124,251 1,959 610 Q2 p 151,995 − − 2,672 25,376 123,947 1,950 644 Q3 p 150,360 − − 2,687 24,589 123,083 1,851 664 Q4 p 148,487 − − 2,947 24,101 121,439 1,600 714
2018 Q1 p 147,967 − − 2,427 22,905 122,635 1,765 719 Q2 p 144,419 − − 2,561 22,570 119,287 1,913 724 Q3 p 139,203 − − 2,703 20,617 115,883 2,049 757
For footnotes see end of table.
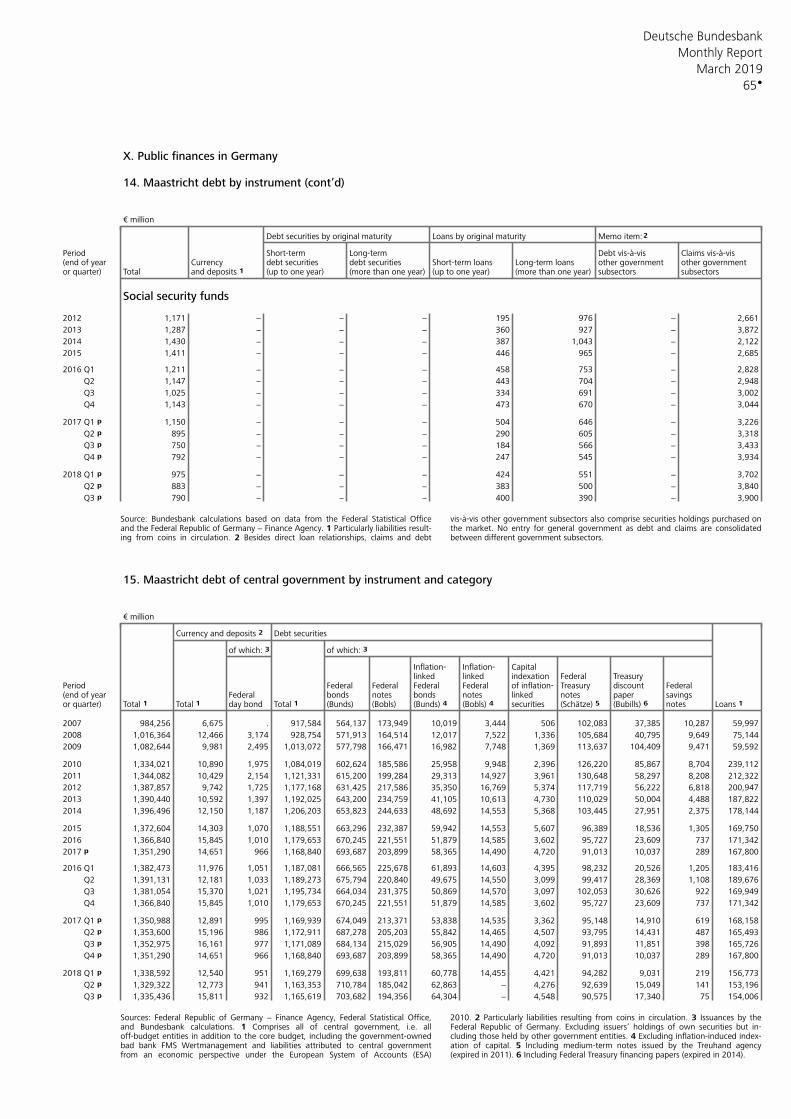
Deutsche Bundesbank
65
Monthly Report
March 2019
X. Public finances in Germany 14. Maastricht debt by instrument (cont’d) € million
Debt securities by original maturity Loans by original maturity Memo item:2
Period Short-term Long-term Debt vis-à-vis Claims vis-à-vis(end of year Currency debt securities debt securities Short-term loans Long-term loans other government other governmentor quarter) Total and deposits 1 (up to one year) (more than one year) (up to one year) (more than one year) subsectors subsectors
Social security funds
2012 1,171 − − − 195 976 − 2,661
2013 1,287 − − − 360 927 − 3,872
2014 1,430 − − − 387 1,043 − 2,122
2015 1,411 − − − 446 965 − 2,685
2016 Q1 1,211 − − − 458 753 − 2,828
Q2 1,147 − − − 443 704 − 2,948
Q3 1,025 − − − 334 691 − 3,002
Q4 1,143 − − − 473 670 − 3,044
2017 Q1 p 1,150 − − − 504 646 − 3,226
Q2 p 895 − − − 290 605 − 3,318
Q3 p 750 − − − 184 566 − 3,433
Q4 p 792 − − − 247 545 − 3,934
2018 Q1 p 975 − − − 424 551 − 3,702
Q2 p 883 − − − 383 500 − 3,840
Q3 p 790 − − − 400 390 − 3,900
Source: Bundesbank calculations based on data from the Federal Statistical Office vis-à-vis other government subsectors also comprise securities holdings purchased onand the Federal Republic of Germany − Finance Agency. 1 Particularly liabilities result- the market. No entry for general government as debt and claims are consolidateding from coins in circulation. 2 Besides direct loan relationships, claims and debt between different government subsectors.
15. Maastricht debt of central government by instrument and category € million
Currency and deposits 2 Debt securities
of which: 3 of which: 3
Inflation- Inflation- Capitallinked linked indexation Federal Treasury
Period Federal Federal Federal Federal Treasury discount Federalof inflation-(end of year Federal bonds notes bonds notes linked notes paper savingsor quarter) Total 1 Total 1 day bond Total 1 (Bunds) (Bobls) (Bunds) 4 (Bobls) 4 securities (Schätze) 5 (Bubills) 6 notes Loans 1
2007 984,256 6,675 . 917,584 564,137 173,949 10,019 3,444 506 102,083 37,385 10,287 59,997
2008 1,016,364 12,466 3,174 928,754 571,913 164,514 12,017 7,522 1,336 105,684 40,795 9,649 75,144
2009 1,082,644 9,981 2,495 1,013,072 577,798 166,471 16,982 7,748 1,369 113,637 104,409 9,471 59,592
2010 1,334,021 10,890 1,975 1,084,019 602,624 185,586 25,958 9,948 2,396 126,220 85,867 8,704 239,112
2011 1,344,082 10,429 2,154 1,121,331 615,200 199,284 29,313 14,927 3,961 130,648 58,297 8,208 212,322
2012 1,387,857 9,742 1,725 1,177,168 631,425 217,586 35,350 16,769 5,374 117,719 56,222 6,818 200,947
2013 1,390,440 10,592 1,397 1,192,025 643,200 234,759 41,105 10,613 4,730 110,029 50,004 4,488 187,822
2014 1,396,496 12,150 1,187 1,206,203 653,823 244,633 48,692 14,553 5,368 103,445 27,951 2,375 178,144
2015 1,372,604 14,303 1,070 1,188,551 663,296 232,387 59,942 14,553 5,607 96,389 18,536 1,305 169,750
2016 1,366,840 15,845 1,010 1,179,653 670,245 221,551 51,879 14,585 3,602 95,727 23,609 737 171,342
2017 p 1,351,290 14,651 966 1,168,840 693,687 203,899 58,365 14,490 4,720 91,013 10,037 289 167,800
2016 Q1 1,382,473 11,976 1,051 1,187,081 666,565 225,678 61,893 14,603 4,395 98,232 20,526 1,205 183,416
Q2 1,391,131 12,181 1,033 1,189,273 675,794 220,840 49,675 14,550 3,099 99,417 28,369 1,108 189,676
Q3 1,381,054 15,370 1,021 1,195,734 664,034 231,375 50,869 14,570 3,097 102,053 30,626 922 169,949
Q4 1,366,840 15,845 1,010 1,179,653 670,245 221,551 51,879 14,585 3,602 95,727 23,609 737 171,342
2017 Q1 p 1,350,988 12,891 995 1,169,939 674,049 213,371 53,838 14,535 3,362 95,148 14,910 619 168,158
Q2 p 1,353,600 15,196 986 1,172,911 687,278 205,203 55,842 14,465 4,507 93,795 14,431 487 165,493
Q3 p 1,352,975 16,161 977 1,171,089 684,134 215,029 56,905 14,490 4,092 91,893 11,851 398 165,726
Q4 p 1,351,290 14,651 966 1,168,840 693,687 203,899 58,365 14,490 4,720 91,013 10,037 289 167,800
2018 Q1 p 1,338,592 12,540 951 1,169,279 699,638 193,811 60,778 14,455 4,421 94,282 9,031 219 156,773
Q2 p 1,329,322 12,773 941 1,163,353 710,784 185,042 62,863 − 4,276 92,639 15,049 141 153,196
Q3 p 1,335,436 15,811 932 1,165,619 703,682 194,356 64,304 − 4,548 90,575 17,340 75 154,006
Sources: Federal Republic of Germany − Finance Agency, Federal Statistical Office, 2010. 2 Particularly liabilities resulting from coins in circulation. 3 Issuances by theand Bundesbank calculations. 1 Comprises all of central government, i.e. all Federal Republic of Germany. Excluding issuers’ holdings of own securities but in-off-budget entities in addition to the core budget, including the government-owned cluding those held by other government entities. 4 Excluding inflation-induced index-bad bank FMS Wertmanagement and liabilities attributed to central government ation of capital. 5 Including medium-term notes issued by the Treuhand agencyfrom an economic perspective under the European System of Accounts (ESA) (expired in 2011). 6 Including Federal Treasury financing papers (expired in 2014).
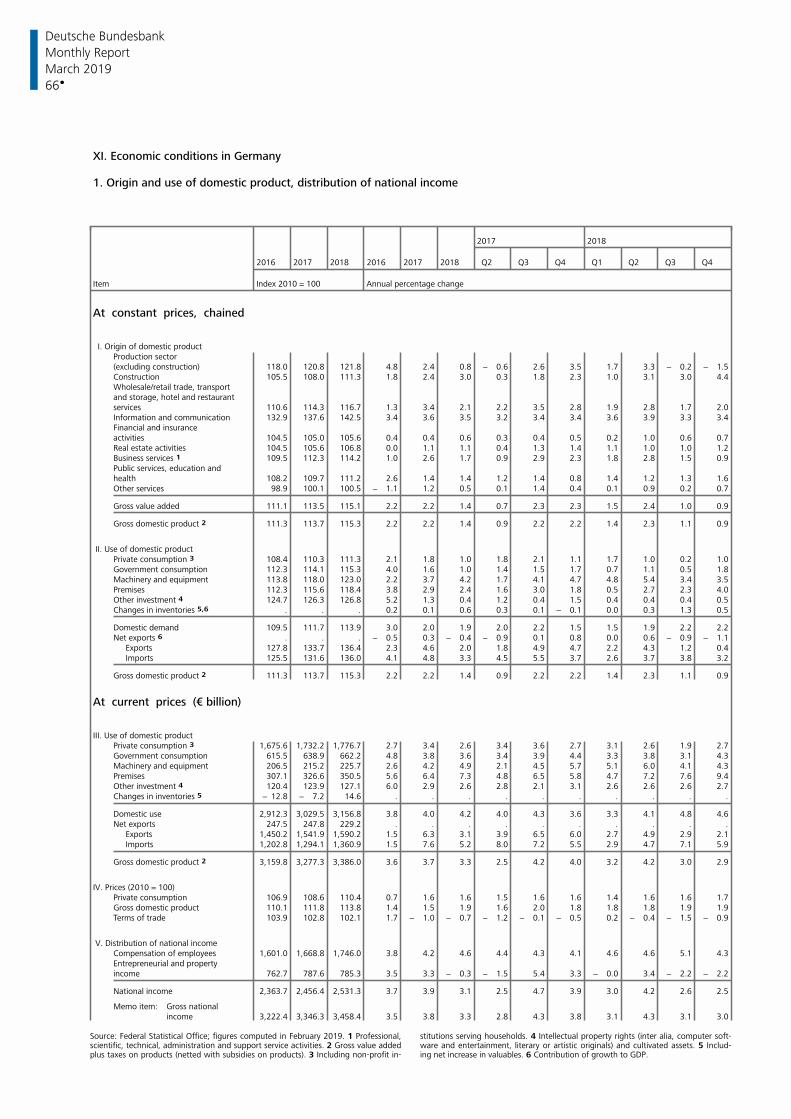
Deutsche Bundesbank
66
Monthly Report
March 2019
XI. Economic conditions in Germany
1. Origin and use of domestic product, distribution of national income
2017 2018
2016 2017 2018 2016 2017 2018 Q2 Q3 Q4 Q1 Q2 Q3 Q4
Item Index 2010 = 100 Annual percentage change
At constant prices, chained
I. Origin of domestic productProduction sector(excluding construction) 118.0 120.8 121.8 4.8 2.4 0.8 − 0.6 2.6 3.5 1.7 3.3 − 0.2 − 1.5Construction 105.5 108.0 111.3 1.8 2.4 3.0 0.3 1.8 2.3 1.0 3.1 3.0 4.4Wholesale/retail trade, transportand storage, hotel and restaurantservices 110.6 114.3 116.7 1.3 3.4 2.1 2.2 3.5 2.8 1.9 2.8 1.7 2.0Information and communication 132.9 137.6 142.5 3.4 3.6 3.5 3.2 3.4 3.4 3.6 3.9 3.3 3.4Financial and insuranceactivities 104.5 105.0 105.6 0.4 0.4 0.6 0.3 0.4 0.5 0.2 1.0 0.6 0.7Real estate activities 104.5 105.6 106.8 0.0 1.1 1.1 0.4 1.3 1.4 1.1 1.0 1.0 1.2Business services 1 109.5 112.3 114.2 1.0 2.6 1.7 0.9 2.9 2.3 1.8 2.8 1.5 0.9Public services, education andhealth 108.2 109.7 111.2 2.6 1.4 1.4 1.2 1.4 0.8 1.4 1.2 1.3 1.6Other services 98.9 100.1 100.5 − 1.1 1.2 0.5 0.1 1.4 0.4 0.1 0.9 0.2 0.7
Gross value added 111.1 113.5 115.1 2.2 2.2 1.4 0.7 2.3 2.3 1.5 2.4 1.0 0.9
Gross domestic product 2 111.3 113.7 115.3 2.2 2.2 1.4 0.9 2.2 2.2 1.4 2.3 1.1 0.9
II. Use of domestic productPrivate consumption 3 108.4 110.3 111.3 2.1 1.8 1.0 1.8 2.1 1.1 1.7 1.0 0.2 1.0Government consumption 112.3 114.1 115.3 4.0 1.6 1.0 1.4 1.5 1.7 0.7 1.1 0.5 1.8Machinery and equipment 113.8 118.0 123.0 2.2 3.7 4.2 1.7 4.1 4.7 4.8 5.4 3.4 3.5Premises 112.3 115.6 118.4 3.8 2.9 2.4 1.6 3.0 1.8 0.5 2.7 2.3 4.0Other investment 4 124.7 126.3 126.8 5.2 1.3 0.4 1.2 0.4 1.5 0.4 0.4 0.4 0.5Changes in inventories 5,6 . . . 0.2 0.1 0.6 0.3 0.1 − 0.1 0.0 0.3 1.3 0.5
Domestic demand 109.5 111.7 113.9 3.0 2.0 1.9 2.0 2.2 1.5 1.5 1.9 2.2 2.2Net exports 6 . . . − 0.5 0.3 − 0.4 − 0.9 0.1 0.8 0.0 0.6 − 0.9 − 1.1
Exports 127.8 133.7 136.4 2.3 4.6 2.0 1.8 4.9 4.7 2.2 4.3 1.2 0.4Imports 125.5 131.6 136.0 4.1 4.8 3.3 4.5 5.5 3.7 2.6 3.7 3.8 3.2
Gross domestic product 2 111.3 113.7 115.3 2.2 2.2 1.4 0.9 2.2 2.2 1.4 2.3 1.1 0.9
At current prices (€ billion)
III. Use of domestic productPrivate consumption 3 1,675.6 1,732.2 1,776.7 2.7 3.4 2.6 3.4 3.6 2.7 3.1 2.6 1.9 2.7Government consumption 615.5 638.9 662.2 4.8 3.8 3.6 3.4 3.9 4.4 3.3 3.8 3.1 4.3Machinery and equipment 206.5 215.2 225.7 2.6 4.2 4.9 2.1 4.5 5.7 5.1 6.0 4.1 4.3Premises 307.1 326.6 350.5 5.6 6.4 7.3 4.8 6.5 5.8 4.7 7.2 7.6 9.4Other investment 4 120.4 123.9 127.1 6.0 2.9 2.6 2.8 2.1 3.1 2.6 2.6 2.6 2.7Changes in inventories 5 − 12.8 − 7.2 14.6 . . . . . . . . . .
Domestic use 2,912.3 3,029.5 3,156.8 3.8 4.0 4.2 4.0 4.3 3.6 3.3 4.1 4.8 4.6Net exports 247.5 247.8 229.2 . . . . . . . . . .
Exports 1,450.2 1,541.9 1,590.2 1.5 6.3 3.1 3.9 6.5 6.0 2.7 4.9 2.9 2.1Imports 1,202.8 1,294.1 1,360.9 1.5 7.6 5.2 8.0 7.2 5.5 2.9 4.7 7.1 5.9
Gross domestic product 2 3,159.8 3,277.3 3,386.0 3.6 3.7 3.3 2.5 4.2 4.0 3.2 4.2 3.0 2.9
IV. Prices (2010 = 100)Private consumption 106.9 108.6 110.4 0.7 1.6 1.6 1.5 1.6 1.6 1.4 1.6 1.6 1.7Gross domestic product 110.1 111.8 113.8 1.4 1.5 1.9 1.6 2.0 1.8 1.8 1.8 1.9 1.9Terms of trade 103.9 102.8 102.1 1.7 − 1.0 − 0.7 − 1.2 − 0.1 − 0.5 0.2 − 0.4 − 1.5 − 0.9
V. Distribution of national incomeCompensation of employees 1,601.0 1,668.8 1,746.0 3.8 4.2 4.6 4.4 4.3 4.1 4.6 4.6 5.1 4.3Entrepreneurial and propertyincome 762.7 787.6 785.3 3.5 3.3 − 0.3 − 1.5 5.4 3.3 − 0.0 3.4 − 2.2 − 2.2
National income 2,363.7 2,456.4 2,531.3 3.7 3.9 3.1 2.5 4.7 3.9 3.0 4.2 2.6 2.5
Memo item: Gross nationalincome 3,222.4 3,346.3 3,458.4 3.5 3.8 3.3 2.8 4.3 3.8 3.1 4.3 3.1 3.0
Source: Federal Statistical Office; figures computed in February 2019. 1 Professional, stitutions serving households. 4 Intellectual property rights (inter alia, computer soft-scientific, technical, administration and support service activities. 2 Gross value added ware and entertainment, literary or artistic originals) and cultivated assets. 5 Includ-plus taxes on products (netted with subsidies on products). 3 Including non-profit in- ing net increase in valuables. 6 Contribution of growth to GDP.
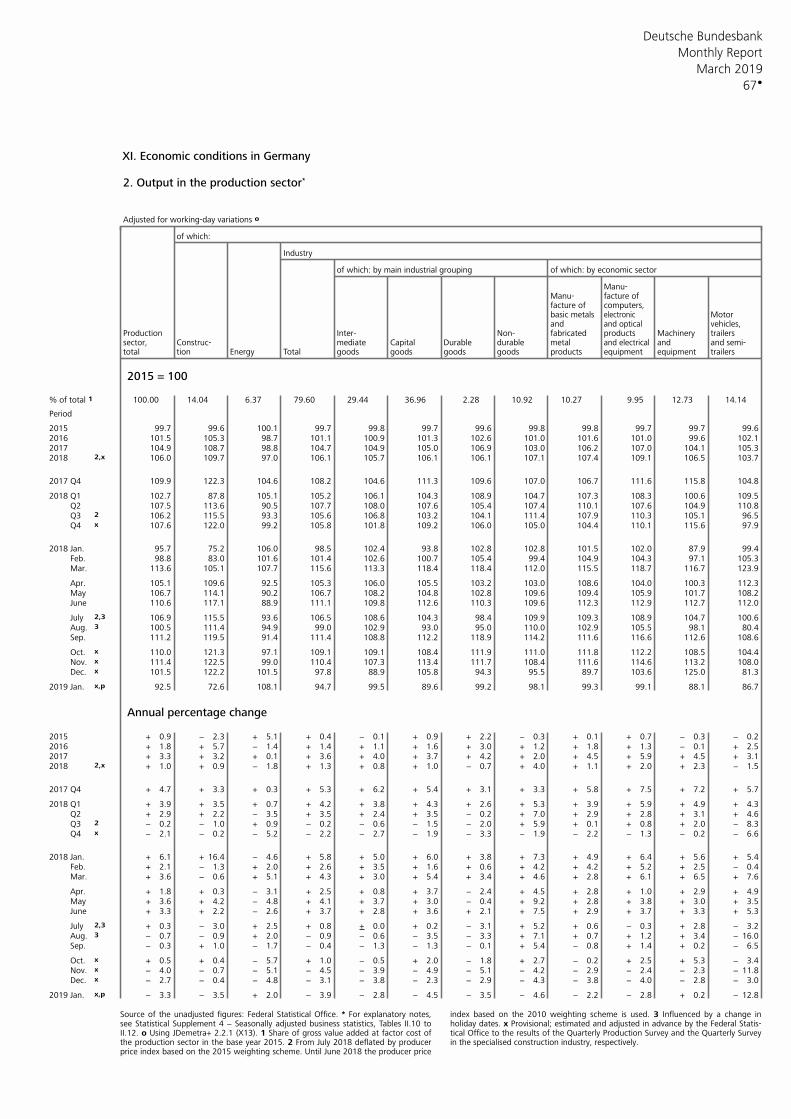
Deutsche Bundesbank
67
Monthly Report
March 2019
XI. Economic conditions in Germany
2. Output in the production sector*
Adjusted for working-day variations o
of which:
Industry
of which: by main industrial grouping of which: by economic sector
Manu-Manu- facture offacture of computers,basic metals Motorelectronicand vehicles,and optical
Production Inter- Non- fabricated products Machinery trailerssector, Construc- mediate Capital Durable durable metal and and semi-and electricaltotal tion Energy Total goods goods goods goods products equipment equipment trailers
2015 = 100
% of total 1 100.00 14.04 6.37 79.60 29.44 36.96 2.28 10.92 10.27 9.95 12.73 14.14
Period
2015 99.7 99.6 100.1 99.7 99.8 99.7 99.6 99.8 99.8 99.7 99.7 99.62016 101.5 105.3 98.7 101.1 100.9 101.3 102.6 101.0 101.6 101.0 99.6 102.12017 104.9 108.7 98.8 104.7 104.9 105.0 106.9 103.0 106.2 107.0 104.1 105.32018 2,x 106.0 109.7 97.0 106.1 105.7 106.1 106.1 107.1 107.4 109.1 106.5 103.7
2017 Q4 109.9 122.3 104.6 108.2 104.6 111.3 109.6 107.0 106.7 111.6 115.8 104.8
2018 Q1 102.7 87.8 105.1 105.2 106.1 104.3 108.9 104.7 107.3 108.3 100.6 109.5 Q2 107.5 113.6 90.5 107.7 108.0 107.6 105.4 107.4 110.1 107.6 104.9 110.8 Q3 2 106.2 115.5 93.3 105.6 106.8 103.2 104.1 111.4 107.9 110.3 105.1 96.5 Q4 x 107.6 122.0 99.2 105.8 101.8 109.2 106.0 105.0 104.4 110.1 115.6 97.9
2018 Jan. 95.7 75.2 106.0 98.5 102.4 93.8 102.8 102.8 101.5 102.0 87.9 99.4 Feb. 98.8 83.0 101.6 101.4 102.6 100.7 105.4 99.4 104.9 104.3 97.1 105.3 Mar. 113.6 105.1 107.7 115.6 113.3 118.4 118.4 112.0 115.5 118.7 116.7 123.9
Apr. 105.1 109.6 92.5 105.3 106.0 105.5 103.2 103.0 108.6 104.0 100.3 112.3 May 106.7 114.1 90.2 106.7 108.2 104.8 102.8 109.6 109.4 105.9 101.7 108.2 June 110.6 117.1 88.9 111.1 109.8 112.6 110.3 109.6 112.3 112.9 112.7 112.0
July 2,3 106.9 115.5 93.6 106.5 108.6 104.3 98.4 109.9 109.3 108.9 104.7 100.6 Aug. 3 100.5 111.4 94.9 99.0 102.9 93.0 95.0 110.0 102.9 105.5 98.1 80.4 Sep. 111.2 119.5 91.4 111.4 108.8 112.2 118.9 114.2 111.6 116.6 112.6 108.6
Oct. x 110.0 121.3 97.1 109.1 109.1 108.4 111.9 111.0 111.8 112.2 108.5 104.4 Nov. x 111.4 122.5 99.0 110.4 107.3 113.4 111.7 108.4 111.6 114.6 113.2 108.0 Dec. x 101.5 122.2 101.5 97.8 88.9 105.8 94.3 95.5 89.7 103.6 125.0 81.3
2019 Jan. x,p 92.5 72.6 108.1 94.7 99.5 89.6 99.2 98.1 99.3 99.1 88.1 86.7
Annual percentage change
2015 + 0.9 − 2.3 + 5.1 + 0.4 − 0.1 + 0.9 + 2.2 − 0.3 + 0.1 + 0.7 − 0.3 − 0.22016 + 1.8 + 5.7 − 1.4 + 1.4 + 1.1 + 1.6 + 3.0 + 1.2 + 1.8 + 1.3 − 0.1 + 2.52017 + 3.3 + 3.2 + 0.1 + 3.6 + 4.0 + 3.7 + 4.2 + 2.0 + 4.5 + 5.9 + 4.5 + 3.12018 2,x + 1.0 + 0.9 − 1.8 + 1.3 + 0.8 + 1.0 − 0.7 + 4.0 + 1.1 + 2.0 + 2.3 − 1.5
2017 Q4 + 4.7 + 3.3 + 0.3 + 5.3 + 6.2 + 5.4 + 3.1 + 3.3 + 5.8 + 7.5 + 7.2 + 5.7
2018 Q1 + 3.9 + 3.5 + 0.7 + 4.2 + 3.8 + 4.3 + 2.6 + 5.3 + 3.9 + 5.9 + 4.9 + 4.3 Q2 + 2.9 + 2.2 − 3.5 + 3.5 + 2.4 + 3.5 − 0.2 + 7.0 + 2.9 + 2.8 + 3.1 + 4.6 Q3 2 − 0.2 − 1.0 + 0.9 − 0.2 − 0.6 − 1.5 − 2.0 + 5.9 + 0.1 + 0.8 + 2.0 − 8.3 Q4 x − 2.1 − 0.2 − 5.2 − 2.2 − 2.7 − 1.9 − 3.3 − 1.9 − 2.2 − 1.3 − 0.2 − 6.6
2018 Jan. + 6.1 + 16.4 − 4.6 + 5.8 + 5.0 + 6.0 + 3.8 + 7.3 + 4.9 + 6.4 + 5.6 + 5.4 Feb. + 2.1 − 1.3 + 2.0 + 2.6 + 3.5 + 1.6 + 0.6 + 4.2 + 4.2 + 5.2 + 2.5 − 0.4 Mar. + 3.6 − 0.6 + 5.1 + 4.3 + 3.0 + 5.4 + 3.4 + 4.6 + 2.8 + 6.1 + 6.5 + 7.6
Apr. + 1.8 + 0.3 − 3.1 + 2.5 + 0.8 + 3.7 − 2.4 + 4.5 + 2.8 + 1.0 + 2.9 + 4.9 May + 3.6 + 4.2 − 4.8 + 4.1 + 3.7 + 3.0 − 0.4 + 9.2 + 2.8 + 3.8 + 3.0 + 3.5 June + 3.3 + 2.2 − 2.6 + 3.7 + 2.8 + 3.6 + 2.1 + 7.5 + 2.9 + 3.7 + 3.3 + 5.3
July 2,3 + 0.3 − 3.0 + 2.5 + 0.8 + 0.0 + 0.2 − 3.1 + 5.2 + 0.6 − 0.3 + 2.8 − 3.2 Aug. 3 − 0.7 − 0.9 + 2.0 − 0.9 − 0.6 − 3.5 − 3.3 + 7.1 + 0.7 + 1.2 + 3.4 − 16.0 Sep. − 0.3 + 1.0 − 1.7 − 0.4 − 1.3 − 1.3 − 0.1 + 5.4 − 0.8 + 1.4 + 0.2 − 6.5
Oct. x + 0.5 + 0.4 − 5.7 + 1.0 − 0.5 + 2.0 − 1.8 + 2.7 − 0.2 + 2.5 + 5.3 − 3.4 Nov. x − 4.0 − 0.7 − 5.1 − 4.5 − 3.9 − 4.9 − 5.1 − 4.2 − 2.9 − 2.4 − 2.3 − 11.8 Dec. x − 2.7 − 0.4 − 4.8 − 3.1 − 3.8 − 2.3 − 2.9 − 4.3 − 3.8 − 4.0 − 2.8 − 3.0
2019 Jan. x,p − 3.3 − 3.5 + 2.0 − 3.9 − 2.8 − 4.5 − 3.5 − 4.6 − 2.2 − 2.8 + 0.2 − 12.8
Source of the unadjusted figures: Federal Statistical Office. * For explanatory notes, index based on the 2010 weighting scheme is used. 3 Influenced by a change insee Statistical Supplement 4 − Seasonally adjusted business statistics, Tables II.10 to holiday dates. x Provisional; estimated and adjusted in advance by the Federal Statis-II.12. o Using JDemetra+ 2.2.1 (X13). 1 Share of gross value added at factor cost of tical Office to the results of the Quarterly Production Survey and the Quarterly Surveythe production sector in the base year 2015. 2 From July 2018 deflated by producer in the specialised construction industry, respectively. price index based on the 2015 weighting scheme. Until June 2018 the producer price
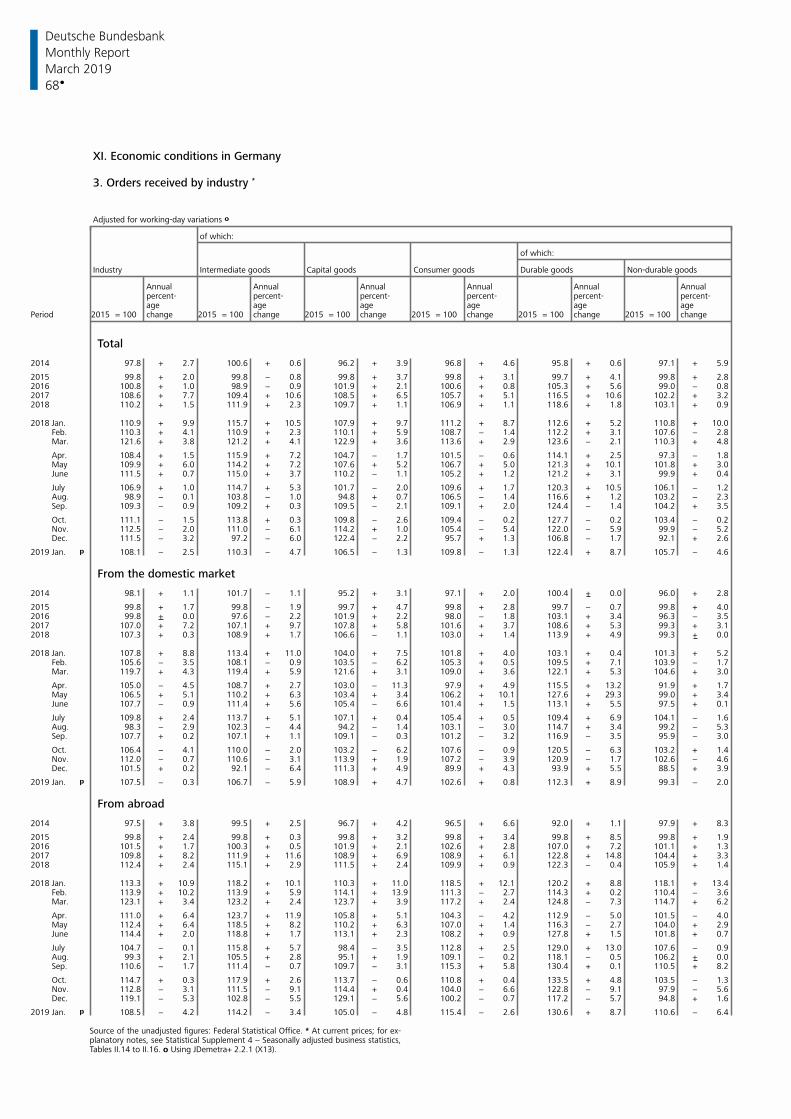
Deutsche Bundesbank
68
Monthly Report
March 2019
XI. Economic conditions in Germany 3. Orders received by industry *
Adjusted for working-day variations o
of which:
of which:
Industry Intermediate goods Capital goods Consumer goods Durable goods Non-durable goods
Annual Annual Annual Annual Annual Annualpercent- percent- percent- percent- percent- percent-age age age age age age
Period 2015 = 100 change 2015 = 100 change 2015 = 100 change 2015 = 100 change 2015 = 100 change 2015 = 100 change
Total
2014 97.8 + 2.7 100.6 + 0.6 96.2 + 3.9 96.8 + 4.6 95.8 + 0.6 97.1 + 5.9
2015 99.8 + 2.0 99.8 − 0.8 99.8 + 3.7 99.8 + 3.1 99.7 + 4.1 99.8 + 2.82016 100.8 + 1.0 98.9 − 0.9 101.9 + 2.1 100.6 + 0.8 105.3 + 5.6 99.0 − 0.82017 108.6 + 7.7 109.4 + 10.6 108.5 + 6.5 105.7 + 5.1 116.5 + 10.6 102.2 + 3.22018 110.2 + 1.5 111.9 + 2.3 109.7 + 1.1 106.9 + 1.1 118.6 + 1.8 103.1 + 0.9
2018 Jan. 110.9 + 9.9 115.7 + 10.5 107.9 + 9.7 111.2 + 8.7 112.6 + 5.2 110.8 + 10.0 Feb. 110.3 + 4.1 110.9 + 2.3 110.1 + 5.9 108.7 − 1.4 112.2 + 3.1 107.6 − 2.8 Mar. 121.6 + 3.8 121.2 + 4.1 122.9 + 3.6 113.6 + 2.9 123.6 − 2.1 110.3 + 4.8
Apr. 108.4 + 1.5 115.9 + 7.2 104.7 − 1.7 101.5 − 0.6 114.1 + 2.5 97.3 − 1.8 May 109.9 + 6.0 114.2 + 7.2 107.6 + 5.2 106.7 + 5.0 121.3 + 10.1 101.8 + 3.0 June 111.5 + 0.7 115.0 + 3.7 110.2 − 1.1 105.2 + 1.2 121.2 + 3.1 99.9 + 0.4
July 106.9 + 1.0 114.7 + 5.3 101.7 − 2.0 109.6 + 1.7 120.3 + 10.5 106.1 − 1.2 Aug. 98.9 − 0.1 103.8 − 1.0 94.8 + 0.7 106.5 − 1.4 116.6 + 1.2 103.2 − 2.3 Sep. 109.3 − 0.9 109.2 + 0.3 109.5 − 2.1 109.1 + 2.0 124.4 − 1.4 104.2 + 3.5
Oct. 111.1 − 1.5 113.8 + 0.3 109.8 − 2.6 109.4 − 0.2 127.7 − 0.2 103.4 − 0.2 Nov. 112.5 − 2.0 111.0 − 6.1 114.2 + 1.0 105.4 − 5.4 122.0 − 5.9 99.9 − 5.2 Dec. 111.5 − 3.2 97.2 − 6.0 122.4 − 2.2 95.7 + 1.3 106.8 − 1.7 92.1 + 2.6
2019 Jan. p 108.1 − 2.5 110.3 − 4.7 106.5 − 1.3 109.8 − 1.3 122.4 + 8.7 105.7 − 4.6
From the domestic market
2014 98.1 + 1.1 101.7 − 1.1 95.2 + 3.1 97.1 + 2.0 100.4 + 0.0 96.0 + 2.8
2015 99.8 + 1.7 99.8 − 1.9 99.7 + 4.7 99.8 + 2.8 99.7 − 0.7 99.8 + 4.02016 99.8 + 0.0 97.6 − 2.2 101.9 + 2.2 98.0 − 1.8 103.1 + 3.4 96.3 − 3.52017 107.0 + 7.2 107.1 + 9.7 107.8 + 5.8 101.6 + 3.7 108.6 + 5.3 99.3 + 3.12018 107.3 + 0.3 108.9 + 1.7 106.6 − 1.1 103.0 + 1.4 113.9 + 4.9 99.3 + 0.0
2018 Jan. 107.8 + 8.8 113.4 + 11.0 104.0 + 7.5 101.8 + 4.0 103.1 + 0.4 101.3 + 5.2 Feb. 105.6 − 3.5 108.1 − 0.9 103.5 − 6.2 105.3 + 0.5 109.5 + 7.1 103.9 − 1.7 Mar. 119.7 + 4.3 119.4 + 5.9 121.6 + 3.1 109.0 + 3.6 122.1 + 5.3 104.6 + 3.0
Apr. 105.0 − 4.5 108.7 + 2.7 103.0 − 11.3 97.9 + 4.9 115.5 + 13.2 91.9 + 1.7 May 106.5 + 5.1 110.2 + 6.3 103.4 + 3.4 106.2 + 10.1 127.6 + 29.3 99.0 + 3.4 June 107.7 − 0.9 111.4 + 5.6 105.4 − 6.6 101.4 + 1.5 113.1 + 5.5 97.5 + 0.1
July 109.8 + 2.4 113.7 + 5.1 107.1 + 0.4 105.4 + 0.5 109.4 + 6.9 104.1 − 1.6 Aug. 98.3 − 2.9 102.3 − 4.4 94.2 − 1.4 103.1 − 3.0 114.7 + 3.4 99.2 − 5.3 Sep. 107.7 + 0.2 107.1 + 1.1 109.1 − 0.3 101.2 − 3.2 116.9 − 3.5 95.9 − 3.0
Oct. 106.4 − 4.1 110.0 − 2.0 103.2 − 6.2 107.6 − 0.9 120.5 − 6.3 103.2 + 1.4 Nov. 112.0 − 0.7 110.6 − 3.1 113.9 + 1.9 107.2 − 3.9 120.9 − 1.7 102.6 − 4.6 Dec. 101.5 + 0.2 92.1 − 6.4 111.3 + 4.9 89.9 + 4.3 93.9 + 5.5 88.5 + 3.9
2019 Jan. p 107.5 − 0.3 106.7 − 5.9 108.9 + 4.7 102.6 + 0.8 112.3 + 8.9 99.3 − 2.0
From abroad
2014 97.5 + 3.8 99.5 + 2.5 96.7 + 4.2 96.5 + 6.6 92.0 + 1.1 97.9 + 8.3
2015 99.8 + 2.4 99.8 + 0.3 99.8 + 3.2 99.8 + 3.4 99.8 + 8.5 99.8 + 1.92016 101.5 + 1.7 100.3 + 0.5 101.9 + 2.1 102.6 + 2.8 107.0 + 7.2 101.1 + 1.32017 109.8 + 8.2 111.9 + 11.6 108.9 + 6.9 108.9 + 6.1 122.8 + 14.8 104.4 + 3.32018 112.4 + 2.4 115.1 + 2.9 111.5 + 2.4 109.9 + 0.9 122.3 − 0.4 105.9 + 1.4
2018 Jan. 113.3 + 10.9 118.2 + 10.1 110.3 + 11.0 118.5 + 12.1 120.2 + 8.8 118.1 + 13.4 Feb. 113.9 + 10.2 113.9 + 5.9 114.1 + 13.9 111.3 − 2.7 114.3 + 0.2 110.4 − 3.6 Mar. 123.1 + 3.4 123.2 + 2.4 123.7 + 3.9 117.2 + 2.4 124.8 − 7.3 114.7 + 6.2
Apr. 111.0 + 6.4 123.7 + 11.9 105.8 + 5.1 104.3 − 4.2 112.9 − 5.0 101.5 − 4.0 May 112.4 + 6.4 118.5 + 8.2 110.2 + 6.3 107.0 + 1.4 116.3 − 2.7 104.0 + 2.9 June 114.4 + 2.0 118.8 + 1.7 113.1 + 2.3 108.2 + 0.9 127.8 + 1.5 101.8 + 0.7
July 104.7 − 0.1 115.8 + 5.7 98.4 − 3.5 112.8 + 2.5 129.0 + 13.0 107.6 − 0.9 Aug. 99.3 + 2.1 105.5 + 2.8 95.1 + 1.9 109.1 − 0.2 118.1 − 0.5 106.2 + 0.0 Sep. 110.6 − 1.7 111.4 − 0.7 109.7 − 3.1 115.3 + 5.8 130.4 + 0.1 110.5 + 8.2
Oct. 114.7 + 0.3 117.9 + 2.6 113.7 − 0.6 110.8 + 0.4 133.5 + 4.8 103.5 − 1.3 Nov. 112.8 − 3.1 111.5 − 9.1 114.4 + 0.4 104.0 − 6.6 122.8 − 9.1 97.9 − 5.6 Dec. 119.1 − 5.3 102.8 − 5.5 129.1 − 5.6 100.2 − 0.7 117.2 − 5.7 94.8 + 1.6
2019 Jan. p 108.5 − 4.2 114.2 − 3.4 105.0 − 4.8 115.4 − 2.6 130.6 + 8.7 110.6 − 6.4
Source of the unadjusted figures: Federal Statistical Office. * At current prices; for ex- planatory notes, see Statistical Supplement 4 − Seasonally adjusted business statistics, Tables II.14 to II.16. o Using JDemetra+ 2.2.1 (X13).
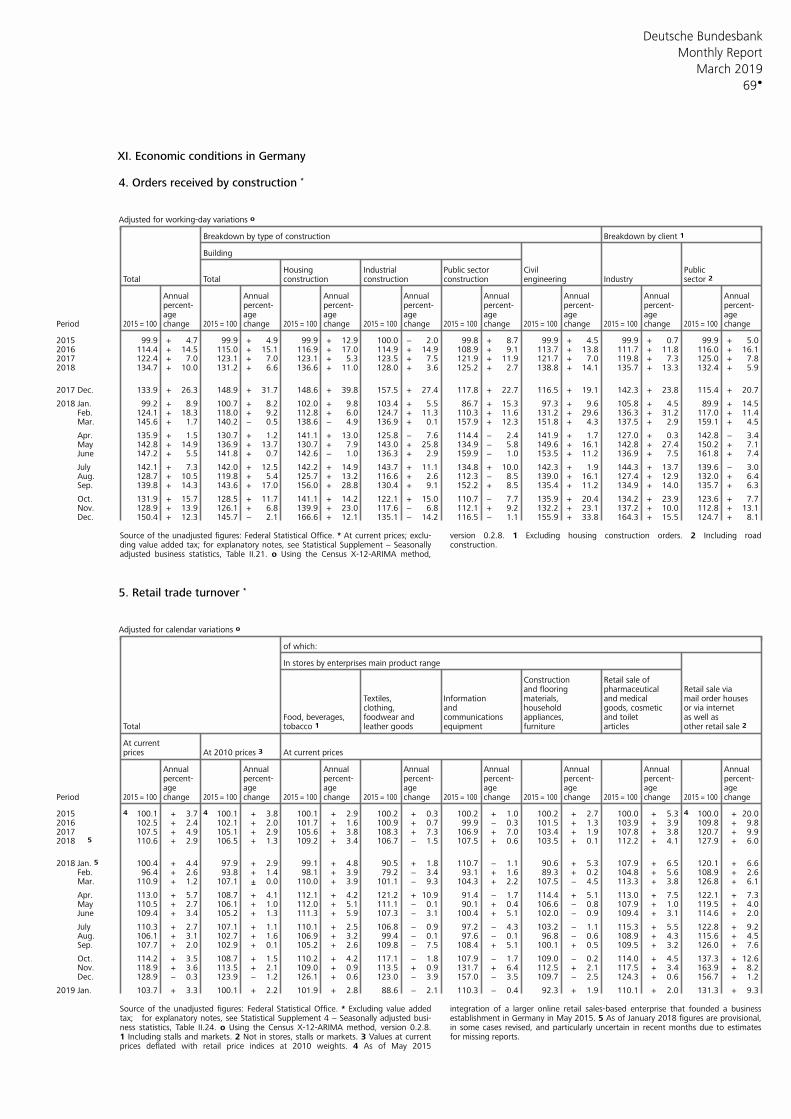
Deutsche Bundesbank
69
Monthly Report
March 2019
XI. Economic conditions in Germany 4. Orders received by construction * Adjusted for working-day variations o
Breakdown by type of construction Breakdown by client 1
Building
Housing Industrial Public sector Civil PublicTotal Total construction construction construction engineering Industry sector 2
Annual Annual Annual Annual Annual Annual Annual Annualpercent- percent- percent- percent- percent- percent- percent- percent-age age age age age age age age
Period change change change change change change change change2015 = 100 2015 = 100 2015 = 100 2015 = 100 2015 = 100 2015 = 100 2015 = 100 2015 = 100
2015 99.9 + 4.7 99.9 + 4.9 99.9 + 12.9 100.0 − 2.0 99.8 + 8.7 99.9 + 4.5 99.9 + 0.7 99.9 + 5.02016 114.4 + 14.5 115.0 + 15.1 116.9 + 17.0 114.9 + 14.9 108.9 + 9.1 113.7 + 13.8 111.7 + 11.8 116.0 + 16.12017 122.4 + 7.0 123.1 + 7.0 123.1 + 5.3 123.5 + 7.5 121.9 + 11.9 121.7 + 7.0 119.8 + 7.3 125.0 + 7.82018 134.7 + 10.0 131.2 + 6.6 136.6 + 11.0 128.0 + 3.6 125.2 + 2.7 138.8 + 14.1 135.7 + 13.3 132.4 + 5.9
2017 Dec. 133.9 + 26.3 148.9 + 31.7 148.6 + 39.8 157.5 + 27.4 117.8 + 22.7 116.5 + 19.1 142.3 + 23.8 115.4 + 20.7
2018 Jan. 99.2 + 8.9 100.7 + 8.2 102.0 + 9.8 103.4 + 5.5 86.7 + 15.3 97.3 + 9.6 105.8 + 4.5 89.9 + 14.5 Feb. 124.1 + 18.3 118.0 + 9.2 112.8 + 6.0 124.7 + 11.3 110.3 + 11.6 131.2 + 29.6 136.3 + 31.2 117.0 + 11.4 Mar. 145.6 + 1.7 140.2 − 0.5 138.6 − 4.9 136.9 + 0.1 157.9 + 12.3 151.8 + 4.3 137.5 + 2.9 159.1 + 4.5
Apr. 135.9 + 1.5 130.7 + 1.2 141.1 + 13.0 125.8 − 7.6 114.4 − 2.4 141.9 + 1.7 127.0 + 0.3 142.8 − 3.4 May 142.8 + 14.9 136.9 + 13.7 130.7 + 7.9 143.0 + 25.8 134.9 − 5.8 149.6 + 16.1 142.8 + 27.4 150.2 + 7.1 June 147.2 + 5.5 141.8 + 0.7 142.6 − 1.0 136.3 + 2.9 159.9 − 1.0 153.5 + 11.2 136.9 + 7.5 161.8 + 7.4
July 142.1 + 7.3 142.0 + 12.5 142.2 + 14.9 143.7 + 11.1 134.8 + 10.0 142.3 + 1.9 144.3 + 13.7 139.6 − 3.0 Aug. 128.7 + 10.5 119.8 + 5.4 125.7 + 13.2 116.6 + 2.6 112.3 − 8.5 139.0 + 16.1 127.4 + 12.9 132.0 + 6.4 Sep. 139.8 + 14.3 143.6 + 17.0 156.0 + 28.8 130.4 + 9.1 152.2 + 8.5 135.4 + 11.2 134.9 + 14.0 135.7 + 6.3
Oct. 131.9 + 15.7 128.5 + 11.7 141.1 + 14.2 122.1 + 15.0 110.7 − 7.7 135.9 + 20.4 134.2 + 23.9 123.6 + 7.7 Nov. 128.9 + 13.9 126.1 + 6.8 139.9 + 23.0 117.6 − 6.8 112.1 + 9.2 132.2 + 23.1 137.2 + 10.0 112.8 + 13.1 Dec. 150.4 + 12.3 145.7 − 2.1 166.6 + 12.1 135.1 − 14.2 116.5 − 1.1 155.9 + 33.8 164.3 + 15.5 124.7 + 8.1
Source of the unadjusted figures: Federal Statistical Office. * At current prices; exclu- version 0.2.8. 1 Excluding housing construction orders. 2 Including roadding value added tax; for explanatory notes, see Statistical Supplement − Seasonally construction. adjusted business statistics, Table II.21. o Using the Census X-12-ARIMA method,
5. Retail trade turnover * Adjusted for calendar variations o
of which:
In stores by enterprises main product range
Construction Retail sale ofand flooring pharmaceutical Retail sale via
Textiles, Information materials, and medical mail order housesclothing, and household goods, cosmetic or via internet
Food, beverages, foodwear and communications appliances, and toilet as well asTotal tobacco 1 leather goods equipment furniture articles other retail sale 2
At currentprices At 2010 prices 3 At current prices
Annual Annual Annual Annual Annual Annual Annual Annualpercent- percent- percent- percent- percent- percent- percent- percent-age age age age age age age age
Period change change change change change change change change2015 = 100 2015 = 100 2015 = 100 2015 = 100 2015 = 100 2015 = 100 2015 = 100 2015 = 100
2015 4 100.1 + 3.7 4 100.1 + 3.8 100.1 + 2.9 100.2 + 0.3 100.2 + 1.0 100.2 + 2.7 100.0 + 5.3 4 100.0 + 20.02016 102.5 + 2.4 102.1 + 2.0 101.7 + 1.6 100.9 + 0.7 99.9 − 0.3 101.5 + 1.3 103.9 + 3.9 109.8 + 9.82017 107.5 + 4.9 105.1 + 2.9 105.6 + 3.8 108.3 + 7.3 106.9 + 7.0 103.4 + 1.9 107.8 + 3.8 120.7 + 9.92018 5 110.6 + 2.9 106.5 + 1.3 109.2 + 3.4 106.7 − 1.5 107.5 + 0.6 103.5 + 0.1 112.2 + 4.1 127.9 + 6.0
2018 Jan. 5 100.4 + 4.4 97.9 + 2.9 99.1 + 4.8 90.5 + 1.8 110.7 − 1.1 90.6 + 5.3 107.9 + 6.5 120.1 + 6.6 Feb. 96.4 + 2.6 93.8 + 1.4 98.1 + 3.9 79.2 − 3.4 93.1 + 1.6 89.3 + 0.2 104.8 + 5.6 108.9 + 2.6 Mar. 110.9 + 1.2 107.1 + 0.0 110.0 + 3.9 101.1 − 9.3 104.3 + 2.2 107.5 − 4.5 113.3 + 3.8 126.8 + 6.1
Apr. 113.0 + 5.7 108.7 + 4.1 112.1 + 4.2 121.2 + 10.9 91.4 − 1.7 114.4 + 5.1 113.0 + 7.5 122.1 + 7.3 May 110.5 + 2.7 106.1 + 1.0 112.0 + 5.1 111.1 − 0.1 90.1 + 0.4 106.6 − 0.8 107.9 + 1.0 119.5 + 4.0 June 109.4 + 3.4 105.2 + 1.3 111.3 + 5.9 107.3 − 3.1 100.4 + 5.1 102.0 − 0.9 109.4 + 3.1 114.6 + 2.0
July 110.3 + 2.7 107.1 + 1.1 110.1 + 2.5 106.8 − 0.9 97.2 − 4.3 103.2 − 1.1 115.3 + 5.5 122.8 + 9.2 Aug. 106.1 + 3.1 102.7 + 1.6 106.9 + 3.2 99.4 − 0.1 97.6 − 0.1 96.8 − 0.6 108.9 + 4.3 115.6 + 4.5 Sep. 107.7 + 2.0 102.9 + 0.1 105.2 + 2.6 109.8 − 7.5 108.4 + 5.1 100.1 + 0.5 109.5 + 3.2 126.0 + 7.6
Oct. 114.2 + 3.5 108.7 + 1.5 110.2 + 4.2 117.1 − 1.8 107.9 − 1.7 109.0 − 0.2 114.0 + 4.5 137.3 + 12.6 Nov. 118.9 + 3.6 113.5 + 2.1 109.0 + 0.9 113.5 + 0.9 131.7 + 6.4 112.5 + 2.1 117.5 + 3.4 163.9 + 8.2 Dec. 128.9 − 0.3 123.9 − 1.2 126.1 + 0.6 123.0 − 3.9 157.0 − 3.5 109.7 − 2.5 124.3 + 0.6 156.7 + 1.2
2019 Jan. 103.7 + 3.3 100.1 + 2.2 101.9 + 2.8 88.6 − 2.1 110.3 − 0.4 92.3 + 1.9 110.1 + 2.0 131.3 + 9.3
Source of the unadjusted figures: Federal Statistical Office. * Excluding value added integration of a larger online retail sales-based enterprise that founded a businesstax; for explanatory notes, see Statistical Supplement 4 − Seasonally adjusted busi- establishment in Germany in May 2015. 5 As of January 2018 figures are provisional,ness statistics, Table II.24. o Using the Census X-12-ARIMA method, version 0.2.8. in some cases revised, and particularly uncertain in recent months due to estimates1 Including stalls and markets. 2 Not in stores, stalls or markets. 3 Values at current for missing reports. prices deflated with retail price indices at 2010 weights. 4 As of May 2015
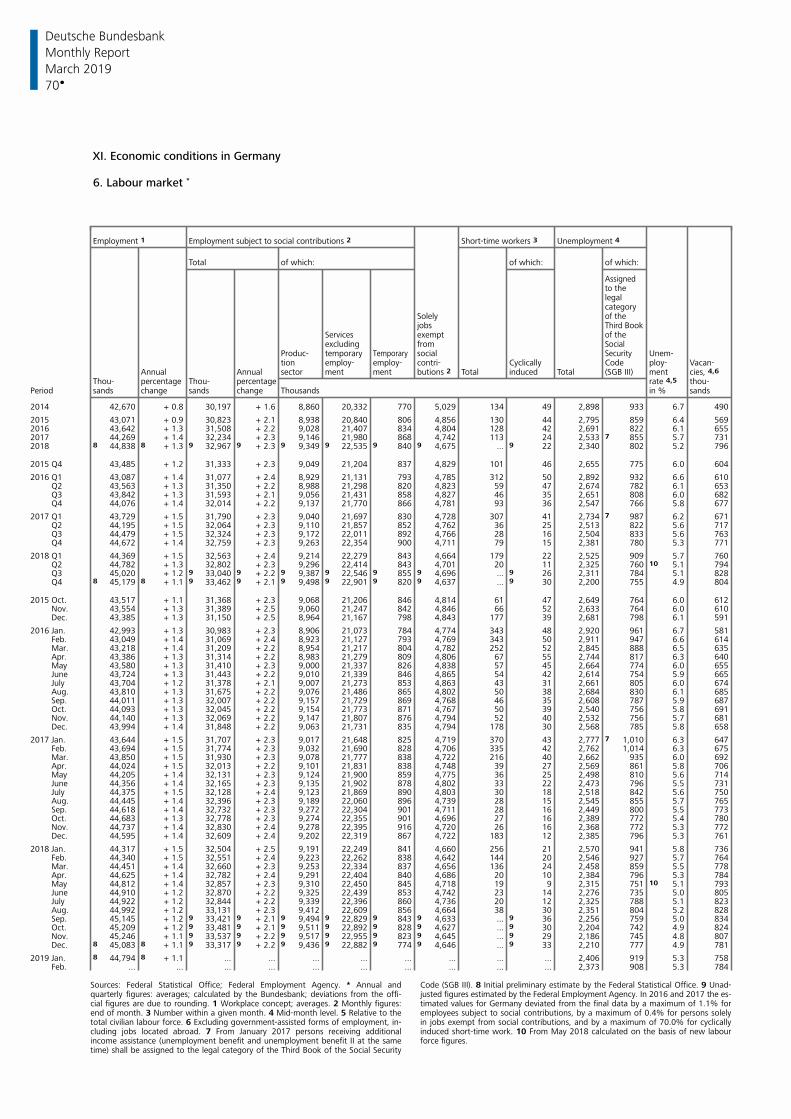
Deutsche Bundesbank
70
Monthly Report
March 2019
XI. Economic conditions in Germany 6. Labour market *
Employment 1 Employment subject to social contributions 2 Short-time workers 3 Unemployment 4
Total of which: of which: of which:
Assignedto thelegalcategory
Solely of thejobs Third Book
Services exempt of theexcluding from Social
Produc- temporary social Unem-Temporary Securitytion employ- employ- contri- Cyclically Code ploy- Vacan-
Annual Annual sector ment ment butions 2 Total induced Total (SGB III) ment cies, 4,6 Thou- percentage Thou- rate 4,5 thou-percentage
Period sands change sands change Thousands in % sands
2014 42,670 + 0.8 30,197 + 1.6 8,860 20,332 770 5,029 134 49 2,898 933 6.7 490
2015 43,071 + 0.9 30,823 + 2.1 8,938 20,840 806 4,856 130 44 2,795 859 6.4 5692016 43,642 + 1.3 31,508 + 2.2 9,028 21,407 834 4,804 128 42 2,691 822 6.1 6552017 44,269 + 1.4 32,234 + 2.3 9,146 21,980 868 4,742 113 24 2,533 7 855 5.7 7312018 8 44,838 8 + 1.3 9 32,967 9 + 2.3 9 9,349 9 22,535 9 840 9 4,675 ... 9 22 2,340 802 5.2 796
2015 Q4 43,485 + 1.2 31,333 + 2.3 9,049 21,204 837 4,829 101 46 2,655 775 6.0 604
2016 Q1 43,087 + 1.4 31,077 + 2.4 8,929 21,131 793 4,785 312 50 2,892 932 6.6 610 Q2 43,563 + 1.3 31,350 + 2.2 8,988 21,298 820 4,823 59 47 2,674 782 6.1 653 Q3 43,842 + 1.3 31,593 + 2.1 9,056 21,431 858 4,827 46 35 2,651 808 6.0 682 Q4 44,076 + 1.4 32,014 + 2.2 9,137 21,770 866 4,781 93 36 2,547 766 5.8 677
2017 Q1 43,729 + 1.5 31,790 + 2.3 9,040 21,697 830 4,728 307 41 2,734 7 987 6.2 671 Q2 44,195 + 1.5 32,064 + 2.3 9,110 21,857 852 4,762 36 25 2,513 822 5.6 717 Q3 44,479 + 1.5 32,324 + 2.3 9,172 22,011 892 4,766 28 16 2,504 833 5.6 763 Q4 44,672 + 1.4 32,759 + 2.3 9,263 22,354 900 4,711 79 15 2,381 780 5.3 771
2018 Q1 44,369 + 1.5 32,563 + 2.4 9,214 22,279 843 4,664 179 22 2,525 909 5.7 760 Q2 44,782 + 1.3 32,802 + 2.3 9,296 22,414 843 4,701 20 11 2,325 760 10 5.1 794 Q3 45,020 + 1.2 9 33,040 9 + 2.2 9 9,387 9 22,546 9 855 9 4,696 ... 9 26 2,311 784 5.1 828 Q4 8 45,179 8 + 1.1 9 33,462 9 + 2.1 9 9,498 9 22,901 9 820 9 4,637 ... 9 30 2,200 755 4.9 804
2015 Oct. 43,517 + 1.1 31,368 + 2.3 9,068 21,206 846 4,814 61 47 2,649 764 6.0 612 Nov. 43,554 + 1.3 31,389 + 2.5 9,060 21,247 842 4,846 66 52 2,633 764 6.0 610 Dec. 43,385 + 1.3 31,150 + 2.5 8,964 21,167 798 4,843 177 39 2,681 798 6.1 591
2016 Jan. 42,993 + 1.3 30,983 + 2.3 8,906 21,073 784 4,774 343 48 2,920 961 6.7 581 Feb. 43,049 + 1.4 31,069 + 2.4 8,923 21,127 793 4,769 343 50 2,911 947 6.6 614 Mar. 43,218 + 1.4 31,209 + 2.2 8,954 21,217 804 4,782 252 52 2,845 888 6.5 635 Apr. 43,386 + 1.3 31,314 + 2.2 8,983 21,279 809 4,806 67 55 2,744 817 6.3 640 May 43,580 + 1.3 31,410 + 2.3 9,000 21,337 826 4,838 57 45 2,664 774 6.0 655 June 43,724 + 1.3 31,443 + 2.2 9,010 21,339 846 4,865 54 42 2,614 754 5.9 665 July 43,704 + 1.2 31,378 + 2.1 9,007 21,273 853 4,863 43 31 2,661 805 6.0 674 Aug. 43,810 + 1.3 31,675 + 2.2 9,076 21,486 865 4,802 50 38 2,684 830 6.1 685 Sep. 44,011 + 1.3 32,007 + 2.2 9,157 21,729 869 4,768 46 35 2,608 787 5.9 687 Oct. 44,093 + 1.3 32,045 + 2.2 9,154 21,773 871 4,767 50 39 2,540 756 5.8 691 Nov. 44,140 + 1.3 32,069 + 2.2 9,147 21,807 876 4,794 52 40 2,532 756 5.7 681 Dec. 43,994 + 1.4 31,848 + 2.2 9,063 21,731 835 4,794 178 30 2,568 785 5.8 658
2017 Jan. 43,644 + 1.5 31,707 + 2.3 9,017 21,648 825 4,719 370 43 2,777 7 1,010 6.3 647 Feb. 43,694 + 1.5 31,774 + 2.3 9,032 21,690 828 4,706 335 42 2,762 1,014 6.3 675 Mar. 43,850 + 1.5 31,930 + 2.3 9,078 21,777 838 4,722 216 40 2,662 935 6.0 692 Apr. 44,024 + 1.5 32,013 + 2.2 9,101 21,831 838 4,748 39 27 2,569 861 5.8 706 May 44,205 + 1.4 32,131 + 2.3 9,124 21,900 859 4,775 36 25 2,498 810 5.6 714 June 44,356 + 1.4 32,165 + 2.3 9,135 21,902 878 4,802 33 22 2,473 796 5.5 731 July 44,375 + 1.5 32,128 + 2.4 9,123 21,869 890 4,803 30 18 2,518 842 5.6 750 Aug. 44,445 + 1.4 32,396 + 2.3 9,189 22,060 896 4,739 28 15 2,545 855 5.7 765 Sep. 44,618 + 1.4 32,732 + 2.3 9,272 22,304 901 4,711 28 16 2,449 800 5.5 773 Oct. 44,683 + 1.3 32,778 + 2.3 9,274 22,355 901 4,696 27 16 2,389 772 5.4 780 Nov. 44,737 + 1.4 32,830 + 2.4 9,278 22,395 916 4,720 26 16 2,368 772 5.3 772 Dec. 44,595 + 1.4 32,609 + 2.4 9,202 22,319 867 4,722 183 12 2,385 796 5.3 761
2018 Jan. 44,317 + 1.5 32,504 + 2.5 9,191 22,249 841 4,660 256 21 2,570 941 5.8 736 Feb. 44,340 + 1.5 32,551 + 2.4 9,223 22,262 838 4,642 144 20 2,546 927 5.7 764 Mar. 44,451 + 1.4 32,660 + 2.3 9,253 22,334 837 4,656 136 24 2,458 859 5.5 778 Apr. 44,625 + 1.4 32,782 + 2.4 9,291 22,404 840 4,686 20 10 2,384 796 5.3 784 May 44,812 + 1.4 32,857 + 2.3 9,310 22,450 845 4,718 19 9 2,315 751 10 5.1 793 June 44,910 + 1.2 32,870 + 2.2 9,325 22,439 853 4,742 23 14 2,276 735 5.0 805 July 44,922 + 1.2 32,844 + 2.2 9,339 22,396 860 4,736 20 12 2,325 788 5.1 823 Aug. 44,992 + 1.2 33,131 + 2.3 9,412 22,609 856 4,664 38 30 2,351 804 5.2 828 Sep. 45,145 + 1.2 9 33,421 9 + 2.1 9 9,494 9 22,829 9 843 9 4,633 ... 9 36 2,256 759 5.0 834 Oct. 45,209 + 1.2 9 33,481 9 + 2.1 9 9,511 9 22,892 9 828 9 4,627 ... 9 30 2,204 742 4.9 824 Nov. 45,246 + 1.1 9 33,537 9 + 2.2 9 9,517 9 22,955 9 823 9 4,645 ... 9 29 2,186 745 4.8 807 Dec. 8 45,083 8 + 1.1 9 33,317 9 + 2.2 9 9,436 9 22,882 9 774 9 4,646 ... 9 33 2,210 777 4.9 781
2019 Jan. 8 44,794 8 + 1.1 ... ... ... ... ... ... ... ... 2,406 919 5.3 758 Feb. ... ... ... ... ... ... ... ... ... ... 2,373 908 5.3 784
Sources: Federal Statistical Office; Federal Employment Agency. * Annual and Code (SGB III). 8 Initial preliminary estimate by the Federal Statistical Office. 9 Unad-quarterly figures: averages; calculated by the Bundesbank; deviations from the offi- justed figures estimated by the Federal Employment Agency. In 2016 and 2017 the es-cial figures are due to rounding. 1 Workplace concept; averages. 2 Monthly figures: timated values for Germany deviated from the final data by a maximum of 1.1% forend of month. 3 Number within a given month. 4 Mid-month level. 5 Relative to the employees subject to social contributions, by a maximum of 0.4% for persons solelytotal civilian labour force. 6 Excluding government-assisted forms of employment, in- in jobs exempt from social contributions, and by a maximum of 70.0% for cyclicallycluding jobs located abroad. 7 From January 2017 persons receiving additional induced short-time work. 10 From May 2018 calculated on the basis of new labourincome assistance (unemployment benefit and unemployment benefit II at the same force figures. time) shall be assigned to the legal category of the Third Book of the Social Security
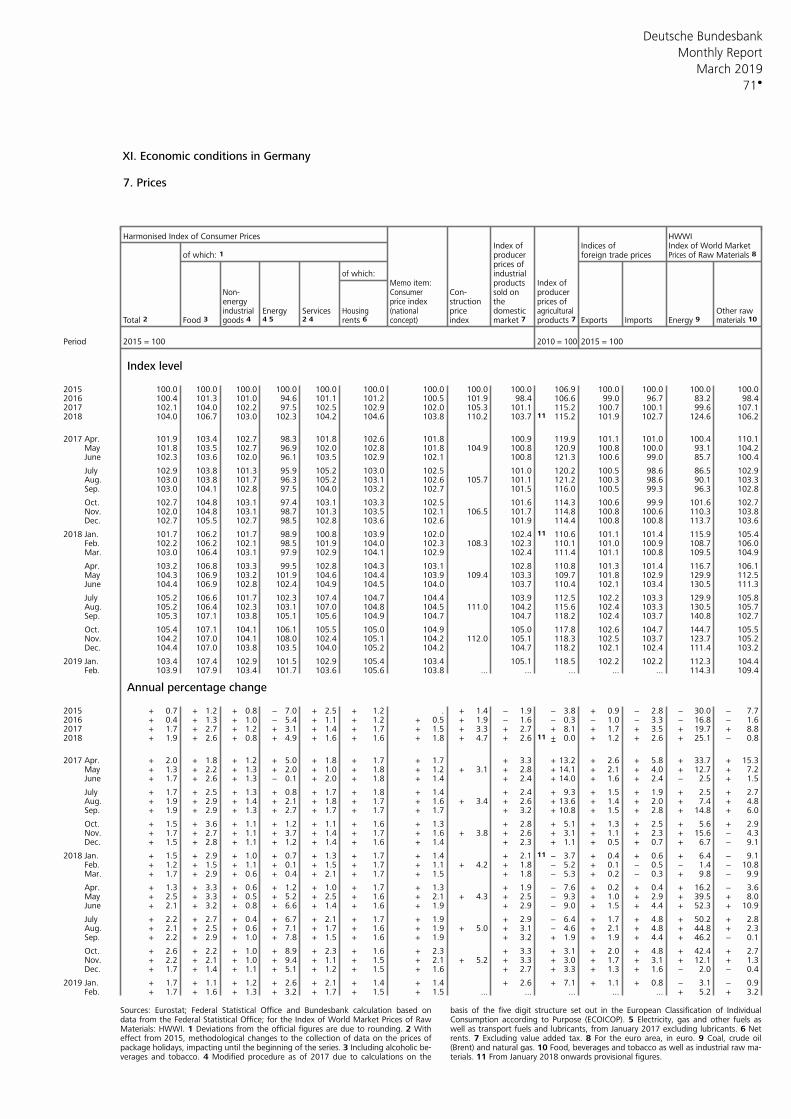
Deutsche Bundesbank
71
Monthly Report
March 2019
XI. Economic conditions in Germany
7. Prices
Harmonised Index of Consumer Prices HWWIIndex of Indices of Index of World Market
of which: 1 producer foreign trade prices Prices of Raw Materials 8 prices ofindustrialof which:products Index ofMemo item:
Non- Consumer Con- producersold onenergy struction the prices ofprice index
Energy Services (national price domestic Other rawagriculturalindustrial HousingTotal 2 Food 3 4 5 2 4 rents 6 concept) index market 7 Exports Imports Energy 9 products 7 goods 4 materials 10
Period 2015 = 100 2015 = 1002010 = 100
Index level
2015 100.0 100.0 100.0 100.0 100.0 100.0 100.0 100.0 100.0 106.9 100.0 100.0 100.0 100.02016 100.4 101.3 101.0 94.6 101.1 101.2 100.5 101.9 98.4 106.6 99.0 96.7 83.2 98.42017 102.1 104.0 102.2 97.5 102.5 102.9 102.0 105.3 101.1 115.2 100.7 100.1 99.6 107.12018 104.0 106.7 103.0 102.3 104.2 104.6 103.8 110.2 103.7 11 115.2 101.9 102.7 124.6 106.2
2017 Apr. 101.9 103.4 102.7 98.3 101.8 102.6 101.8 100.9 119.9 101.1 101.0 100.4 110.1 May 101.8 103.5 102.7 96.9 102.0 102.8 101.8 104.9 100.8 120.9 100.8 100.0 93.1 104.2 June 102.3 103.6 102.0 96.1 103.5 102.9 102.1 100.8 121.3 100.6 99.0 85.7 100.4
July 102.9 103.8 101.3 95.9 105.2 103.0 102.5 101.0 120.2 100.5 98.6 86.5 102.9 Aug. 103.0 103.8 101.7 96.3 105.2 103.1 102.6 105.7 101.1 121.2 100.3 98.6 90.1 103.3 Sep. 103.0 104.1 102.8 97.5 104.0 103.2 102.7 101.5 116.0 100.5 99.3 96.3 102.8
Oct. 102.7 104.8 103.1 97.4 103.1 103.3 102.5 101.6 114.3 100.6 99.9 101.6 102.7 Nov. 102.0 104.8 103.1 98.7 101.3 103.5 102.1 106.5 101.7 114.8 100.8 100.6 110.3 103.8 Dec. 102.7 105.5 102.7 98.5 102.8 103.6 102.6 101.9 114.4 100.8 100.8 113.7 103.6
2018 Jan. 101.7 106.2 101.7 98.9 100.8 103.9 102.0 102.4 11 110.6 101.1 101.4 115.9 105.4 Feb. 102.2 106.2 102.1 98.5 101.9 104.0 102.3 108.3 102.3 110.1 101.0 100.9 108.7 106.0 Mar. 103.0 106.4 103.1 97.9 102.9 104.1 102.9 102.4 111.4 101.1 100.8 109.5 104.9
Apr. 103.2 106.8 103.3 99.5 102.8 104.3 103.1 102.8 110.8 101.3 101.4 116.7 106.1 May 104.3 106.9 103.2 101.9 104.6 104.4 103.9 109.4 103.3 109.7 101.8 102.9 129.9 112.5 June 104.4 106.9 102.8 102.4 104.9 104.5 104.0 103.7 110.4 102.1 103.4 130.5 111.3
July 105.2 106.6 101.7 102.3 107.4 104.7 104.4 103.9 112.5 102.2 103.3 129.9 105.8 Aug. 105.2 106.4 102.3 103.1 107.0 104.8 104.5 111.0 104.2 115.6 102.4 103.3 130.5 105.7 Sep. 105.3 107.1 103.8 105.1 105.6 104.9 104.7 104.7 118.2 102.4 103.7 140.8 102.7
Oct. 105.4 107.1 104.1 106.1 105.5 105.0 104.9 105.0 117.8 102.6 104.7 144.7 105.5 Nov. 104.2 107.0 104.1 108.0 102.4 105.1 104.2 112.0 105.1 118.3 102.5 103.7 123.7 105.2 Dec. 104.4 107.0 103.8 103.5 104.0 105.2 104.2 104.7 118.2 102.1 102.4 111.4 103.2
2019 Jan. 103.4 107.4 102.9 101.5 102.9 105.4 103.4 105.1 118.5 102.2 102.2 112.3 104.4 Feb. 103.9 107.9 103.4 101.7 103.6 105.6 103.8 ... ... ... ... ... 114.3 109.4
Annual percentage change
2015 + 0.7 + 1.2 + 0.8 − 7.0 + 2.5 + 1.2 . + 1.4 − 1.9 − 3.8 + 0.9 − 2.8 − 30.0 − 7.72016 + 0.4 + 1.3 + 1.0 − 5.4 + 1.1 + 1.2 + 0.5 + 1.9 − 1.6 − 0.3 − 1.0 − 3.3 − 16.8 − 1.62017 + 1.7 + 2.7 + 1.2 + 3.1 + 1.4 + 1.7 + 1.5 + 3.3 + 2.7 + 8.1 + 1.7 + 3.5 + 19.7 + 8.82018 + 1.9 + 2.6 + 0.8 + 4.9 + 1.6 + 1.6 + 1.8 + 4.7 + 2.6 11 + 0.0 + 1.2 + 2.6 + 25.1 − 0.8
2017 Apr. + 2.0 + 1.8 + 1.2 + 5.0 + 1.8 + 1.7 + 1.7 + 3.3 + 13.2 + 2.6 + 5.8 + 33.7 + 15.3 May + 1.3 + 2.2 + 1.3 + 2.0 + 1.0 + 1.8 + 1.2 + 3.1 + 2.8 + 14.1 + 2.1 + 4.0 + 12.7 + 7.2 June + 1.7 + 2.6 + 1.3 − 0.1 + 2.0 + 1.8 + 1.4 + 2.4 + 14.0 + 1.6 + 2.4 − 2.5 + 1.5
July + 1.7 + 2.5 + 1.3 + 0.8 + 1.7 + 1.8 + 1.4 + 2.4 + 9.3 + 1.5 + 1.9 + 2.5 + 2.7 Aug. + 1.9 + 2.9 + 1.4 + 2.1 + 1.8 + 1.7 + 1.6 + 3.4 + 2.6 + 13.6 + 1.4 + 2.0 + 7.4 + 4.8 Sep. + 1.9 + 2.9 + 1.3 + 2.7 + 1.7 + 1.7 + 1.7 + 3.2 + 10.8 + 1.5 + 2.8 + 14.8 + 6.0
Oct. + 1.5 + 3.6 + 1.1 + 1.2 + 1.1 + 1.6 + 1.3 + 2.8 + 5.1 + 1.3 + 2.5 + 5.6 + 2.9 Nov. + 1.7 + 2.7 + 1.1 + 3.7 + 1.4 + 1.7 + 1.6 + 3.8 + 2.6 + 3.1 + 1.1 + 2.3 + 15.6 − 4.3 Dec. + 1.5 + 2.8 + 1.1 + 1.2 + 1.4 + 1.6 + 1.4 + 2.3 + 1.1 + 0.5 + 0.7 + 6.7 − 9.1
2018 Jan. + 1.5 + 2.9 + 1.0 + 0.7 + 1.3 + 1.7 + 1.4 + 2.1 11 − 3.7 + 0.4 + 0.6 + 6.4 − 9.1 Feb. + 1.2 + 1.5 + 1.1 + 0.1 + 1.5 + 1.7 + 1.1 + 4.2 + 1.8 − 5.2 + 0.1 − 0.5 − 1.4 − 10.8 Mar. + 1.7 + 2.9 + 0.6 + 0.4 + 2.1 + 1.7 + 1.5 + 1.8 − 5.3 + 0.2 − 0.3 + 9.8 − 9.9
Apr. + 1.3 + 3.3 + 0.6 + 1.2 + 1.0 + 1.7 + 1.3 + 1.9 − 7.6 + 0.2 + 0.4 + 16.2 − 3.6 May + 2.5 + 3.3 + 0.5 + 5.2 + 2.5 + 1.6 + 2.1 + 4.3 + 2.5 − 9.3 + 1.0 + 2.9 + 39.5 + 8.0 June + 2.1 + 3.2 + 0.8 + 6.6 + 1.4 + 1.6 + 1.9 + 2.9 − 9.0 + 1.5 + 4.4 + 52.3 + 10.9
July + 2.2 + 2.7 + 0.4 + 6.7 + 2.1 + 1.7 + 1.9 + 2.9 − 6.4 + 1.7 + 4.8 + 50.2 + 2.8 Aug. + 2.1 + 2.5 + 0.6 + 7.1 + 1.7 + 1.6 + 1.9 + 5.0 + 3.1 − 4.6 + 2.1 + 4.8 + 44.8 + 2.3 Sep. + 2.2 + 2.9 + 1.0 + 7.8 + 1.5 + 1.6 + 1.9 + 3.2 + 1.9 + 1.9 + 4.4 + 46.2 − 0.1
Oct. + 2.6 + 2.2 + 1.0 + 8.9 + 2.3 + 1.6 + 2.3 + 3.3 + 3.1 + 2.0 + 4.8 + 42.4 + 2.7 Nov. + 2.2 + 2.1 + 1.0 + 9.4 + 1.1 + 1.5 + 2.1 + 5.2 + 3.3 + 3.0 + 1.7 + 3.1 + 12.1 + 1.3 Dec. + 1.7 + 1.4 + 1.1 + 5.1 + 1.2 + 1.5 + 1.6 + 2.7 + 3.3 + 1.3 + 1.6 − 2.0 − 0.4
2019 Jan. + 1.7 + 1.1 + 1.2 + 2.6 + 2.1 + 1.4 + 1.4 + 2.6 + 7.1 + 1.1 + 0.8 − 3.1 − 0.9 Feb. + 1.7 + 1.6 + 1.3 + 3.2 + 1.7 + 1.5 + 1.5 ... ... ... ... ... + 5.2 + 3.2
Sources: Eurostat; Federal Statistical Office and Bundesbank calculation based on basis of the five digit structure set out in the European Classification of Individualdata from the Federal Statistical Office; for the Index of World Market Prices of Raw Consumption according to Purpose (ECOICOP). 5 Electricity, gas and other fuels asMaterials: HWWI. 1 Deviations from the official figures are due to rounding. 2 With well as transport fuels and lubricants, from January 2017 excluding lubricants. 6 Neteffect from 2015, methodological changes to the collection of data on the prices of rents. 7 Excluding value added tax. 8 For the euro area, in euro. 9 Coal, crude oilpackage holidays, impacting until the beginning of the series. 3 Including alcoholic be- (Brent) and natural gas. 10 Food, beverages and tobacco as well as industrial raw ma-verages and tobacco. 4 Modified procedure as of 2017 due to calculations on the terials. 11 From January 2018 onwards provisional figures.
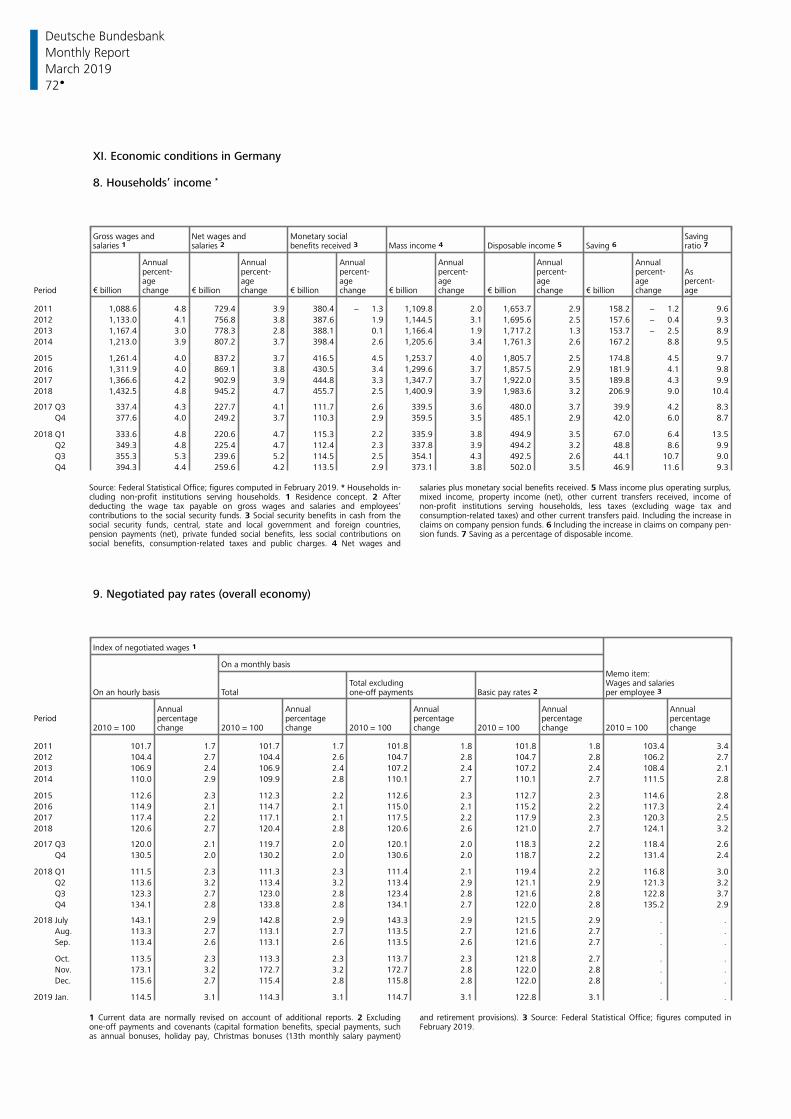
Deutsche Bundesbank
72
Monthly Report
March 2019
XI. Economic conditions in Germany
8. Households’ income *
Gross wages and Net wages and Monetary social Savingsalaries 1 salaries 2 Mass income 4 Saving 6 ratio 7 benefits received 3 Disposable income 5
Annual Annual Annual Annual Annual Annualpercent- percent- percent- percent- percent- percent- Asage age age age age age percent-
Period change change change change change change age€ billion € billion € billion € billion € billion € billion
2011 1,088.6 4.8 729.4 3.9 380.4 − 1.3 1,109.8 2.0 1,653.7 2.9 158.2 − 1.2 9.6
2012 1,133.0 4.1 756.8 3.8 387.6 1.9 1,144.5 3.1 1,695.6 2.5 157.6 − 0.4 9.3
2013 1,167.4 3.0 778.3 2.8 388.1 0.1 1,166.4 1.9 1,717.2 1.3 153.7 − 2.5 8.9
2014 1,213.0 3.9 807.2 3.7 398.4 2.6 1,205.6 3.4 1,761.3 2.6 167.2 8.8 9.5
2015 1,261.4 4.0 837.2 3.7 416.5 4.5 1,253.7 4.0 1,805.7 2.5 174.8 4.5 9.7
2016 1,311.9 4.0 869.1 3.8 430.5 3.4 1,299.6 3.7 1,857.5 2.9 181.9 4.1 9.8
2017 1,366.6 4.2 902.9 3.9 444.8 3.3 1,347.7 3.7 1,922.0 3.5 189.8 4.3 9.9
2018 1,432.5 4.8 945.2 4.7 455.7 2.5 1,400.9 3.9 1,983.6 3.2 206.9 9.0 10.4
2017 Q3 337.4 4.3 227.7 4.1 111.7 2.6 339.5 3.6 480.0 3.7 39.9 4.2 8.3
Q4 377.6 4.0 249.2 3.7 110.3 2.9 359.5 3.5 485.1 2.9 42.0 6.0 8.7
2018 Q1 333.6 4.8 220.6 4.7 115.3 2.2 335.9 3.8 494.9 3.5 67.0 6.4 13.5
Q2 349.3 4.8 225.4 4.7 112.4 2.3 337.8 3.9 494.2 3.2 48.8 8.6 9.9
Q3 355.3 5.3 239.6 5.2 114.5 2.5 354.1 4.3 492.5 2.6 44.1 10.7 9.0
Q4 394.3 4.4 259.6 4.2 113.5 2.9 373.1 3.8 502.0 3.5 46.9 11.6 9.3
Source: Federal Statistical Office; figures computed in February 2019. * Households in- salaries plus monetary social benefits received. 5 Mass income plus operating surplus,cluding non-profit institutions serving households. 1 Residence concept. 2 After mixed income, property income (net), other current transfers received, income ofdeducting the wage tax payable on gross wages and salaries and employees’ non-profit institutions serving households, less taxes (excluding wage tax andcontributions to the social security funds. 3 Social security benefits in cash from the consumption-related taxes) and other current transfers paid. Including the increase insocial security funds, central, state and local government and foreign countries, claims on company pension funds. 6 Including the increase in claims on company pen-pension payments (net), private funded social benefits, less social contributions on sion funds. 7 Saving as a percentage of disposable income. social benefits, consumption-related taxes and public charges. 4 Net wages and
9. Negotiated pay rates (overall economy)
Index of negotiated wages 1
On a monthly basisMemo item:
Total excluding Wages and salariesOn an hourly basis Total one-off payments Basic pay rates 2 per employee 3
Annual Annual Annual Annual AnnualPeriod percentage percentage percentage percentage percentage
2010 = 100 change 2010 = 100 change 2010 = 100 change 2010 = 100 change 2010 = 100 change
2011 101.7 1.7 101.7 1.7 101.8 1.8 101.8 1.8 103.4 3.4
2012 104.4 2.7 104.4 2.6 104.7 2.8 104.7 2.8 106.2 2.7
2013 106.9 2.4 106.9 2.4 107.2 2.4 107.2 2.4 108.4 2.1
2014 110.0 2.9 109.9 2.8 110.1 2.7 110.1 2.7 111.5 2.8
2015 112.6 2.3 112.3 2.2 112.6 2.3 112.7 2.3 114.6 2.8
2016 114.9 2.1 114.7 2.1 115.0 2.1 115.2 2.2 117.3 2.4
2017 117.4 2.2 117.1 2.1 117.5 2.2 117.9 2.3 120.3 2.5
2018 120.6 2.7 120.4 2.8 120.6 2.6 121.0 2.7 124.1 3.2
2017 Q3 120.0 2.1 119.7 2.0 120.1 2.0 118.3 2.2 118.4 2.6
Q4 130.5 2.0 130.2 2.0 130.6 2.0 118.7 2.2 131.4 2.4
2018 Q1 111.5 2.3 111.3 2.3 111.4 2.1 119.4 2.2 116.8 3.0
Q2 113.6 3.2 113.4 3.2 113.4 2.9 121.1 2.9 121.3 3.2
Q3 123.3 2.7 123.0 2.8 123.4 2.8 121.6 2.8 122.8 3.7
Q4 134.1 2.8 133.8 2.8 134.1 2.7 122.0 2.8 135.2 2.9
2018 July 143.1 2.9 142.8 2.9 143.3 2.9 121.5 2.9 . .
Aug. 113.3 2.7 113.1 2.7 113.5 2.7 121.6 2.7 . .
Sep. 113.4 2.6 113.1 2.6 113.5 2.6 121.6 2.7 . .
Oct. 113.5 2.3 113.3 2.3 113.7 2.3 121.8 2.7 . .
Nov. 173.1 3.2 172.7 3.2 172.7 2.8 122.0 2.8 . .
Dec. 115.6 2.7 115.4 2.8 115.8 2.8 122.0 2.8 . .
2019 Jan. 114.5 3.1 114.3 3.1 114.7 3.1 122.8 3.1 . .
1 Current data are normally revised on account of additional reports. 2 Excluding and retirement provisions). 3 Source: Federal Statistical Office; figures computed inone-off payments and covenants (capital formation benefits, special payments, such February 2019. as annual bonuses, holiday pay, Christmas bonuses (13th monthly salary payment)
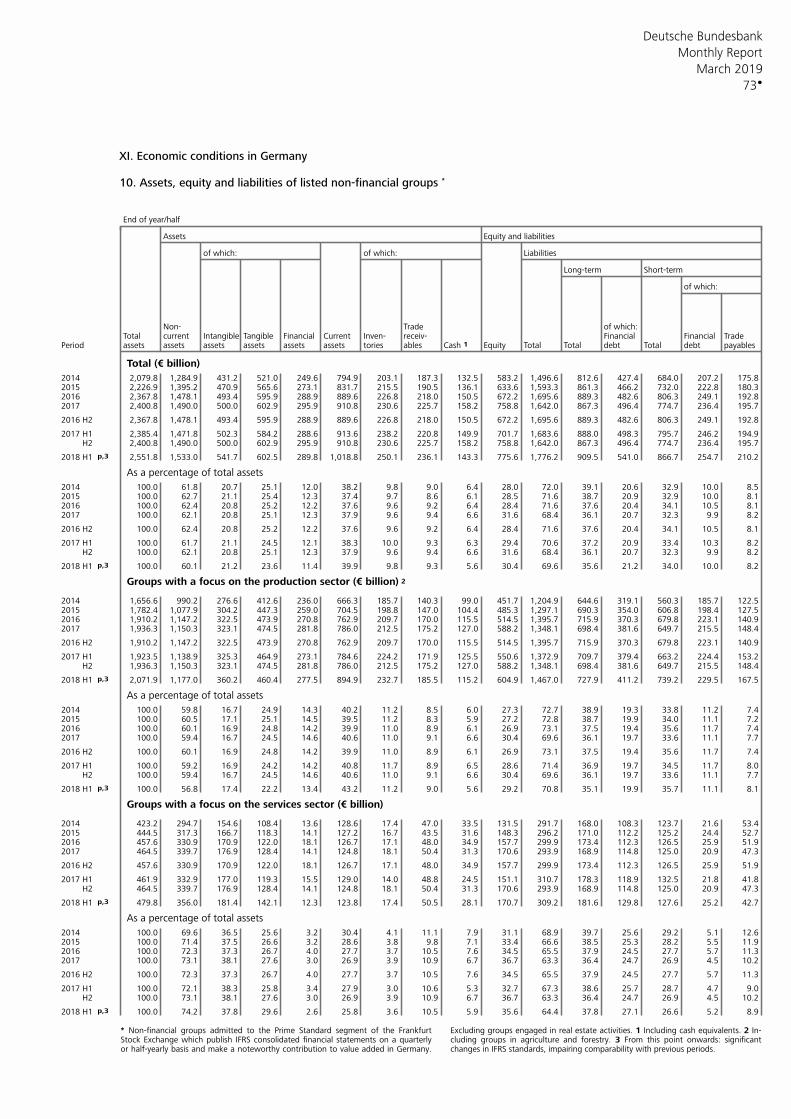
Deutsche Bundesbank
73
Monthly Report
March 2019
XI. Economic conditions in Germany 10. Assets, equity and liabilities of listed non-financial groups *
End of year/half
Assets Equity and liabilities
of which: of which: Liabilities
Long-term Short-term
of which:
Non- Trade of which:Total current Intangible Tangible Financial Current Inven- receiv- Financial Financial Trade
Period assets assets assets assets assets assets tories ables Cash 1 Equity Total Total debt Total debt payables
Total (€ billion)
2014 2,079.8 1,284.9 431.2 521.0 249.6 794.9 203.1 187.3 132.5 583.2 1,496.6 812.6 427.4 684.0 207.2 175.82015 2,226.9 1,395.2 470.9 565.6 273.1 831.7 215.5 190.5 136.1 633.6 1,593.3 861.3 466.2 732.0 222.8 180.32016 2,367.8 1,478.1 493.4 595.9 288.9 889.6 226.8 218.0 150.5 672.2 1,695.6 889.3 482.6 806.3 249.1 192.82017 2,400.8 1,490.0 500.0 602.9 295.9 910.8 230.6 225.7 158.2 758.8 1,642.0 867.3 496.4 774.7 236.4 195.7
2016 H2 2,367.8 1,478.1 493.4 595.9 288.9 889.6 226.8 218.0 150.5 672.2 1,695.6 889.3 482.6 806.3 249.1 192.8
2017 H1 2,385.4 1,471.8 502.3 584.2 288.6 913.6 238.2 220.8 149.9 701.7 1,683.6 888.0 498.3 795.7 246.2 194.9 H2 2,400.8 1,490.0 500.0 602.9 295.9 910.8 230.6 225.7 158.2 758.8 1,642.0 867.3 496.4 774.7 236.4 195.7
2018 H1 p,3 2,551.8 1,533.0 541.7 602.5 289.8 1,018.8 250.1 236.1 143.3 775.6 1,776.2 909.5 541.0 866.7 254.7 210.2
As a percentage of total assets
2014 100.0 61.8 20.7 25.1 12.0 38.2 9.8 9.0 6.4 28.0 72.0 39.1 20.6 32.9 10.0 8.52015 100.0 62.7 21.1 25.4 12.3 37.4 9.7 8.6 6.1 28.5 71.6 38.7 20.9 32.9 10.0 8.12016 100.0 62.4 20.8 25.2 12.2 37.6 9.6 9.2 6.4 28.4 71.6 37.6 20.4 34.1 10.5 8.12017 100.0 62.1 20.8 25.1 12.3 37.9 9.6 9.4 6.6 31.6 68.4 36.1 20.7 32.3 9.9 8.2
2016 H2 100.0 62.4 20.8 25.2 12.2 37.6 9.6 9.2 6.4 28.4 71.6 37.6 20.4 34.1 10.5 8.1
2017 H1 100.0 61.7 21.1 24.5 12.1 38.3 10.0 9.3 6.3 29.4 70.6 37.2 20.9 33.4 10.3 8.2 H2 100.0 62.1 20.8 25.1 12.3 37.9 9.6 9.4 6.6 31.6 68.4 36.1 20.7 32.3 9.9 8.2
2018 H1 p,3 100.0 60.1 21.2 23.6 11.4 39.9 9.8 9.3 5.6 30.4 69.6 35.6 21.2 34.0 10.0 8.2
Groups with a focus on the production sector (€ billion) 2
2014 1,656.6 990.2 276.6 412.6 236.0 666.3 185.7 140.3 99.0 451.7 1,204.9 644.6 319.1 560.3 185.7 122.52015 1,782.4 1,077.9 304.2 447.3 259.0 704.5 198.8 147.0 104.4 485.3 1,297.1 690.3 354.0 606.8 198.4 127.52016 1,910.2 1,147.2 322.5 473.9 270.8 762.9 209.7 170.0 115.5 514.5 1,395.7 715.9 370.3 679.8 223.1 140.92017 1,936.3 1,150.3 323.1 474.5 281.8 786.0 212.5 175.2 127.0 588.2 1,348.1 698.4 381.6 649.7 215.5 148.4
2016 H2 1,910.2 1,147.2 322.5 473.9 270.8 762.9 209.7 170.0 115.5 514.5 1,395.7 715.9 370.3 679.8 223.1 140.9
2017 H1 1,923.5 1,138.9 325.3 464.9 273.1 784.6 224.2 171.9 125.5 550.6 1,372.9 709.7 379.4 663.2 224.4 153.2 H2 1,936.3 1,150.3 323.1 474.5 281.8 786.0 212.5 175.2 127.0 588.2 1,348.1 698.4 381.6 649.7 215.5 148.4
2018 H1 p,3 2,071.9 1,177.0 360.2 460.4 277.5 894.9 232.7 185.5 115.2 604.9 1,467.0 727.9 411.2 739.2 229.5 167.5
As a percentage of total assets
2014 100.0 59.8 16.7 24.9 14.3 40.2 11.2 8.5 6.0 27.3 72.7 38.9 19.3 33.8 11.2 7.42015 100.0 60.5 17.1 25.1 14.5 39.5 11.2 8.3 5.9 27.2 72.8 38.7 19.9 34.0 11.1 7.22016 100.0 60.1 16.9 24.8 14.2 39.9 11.0 8.9 6.1 26.9 73.1 37.5 19.4 35.6 11.7 7.42017 100.0 59.4 16.7 24.5 14.6 40.6 11.0 9.1 6.6 30.4 69.6 36.1 19.7 33.6 11.1 7.7
2016 H2 100.0 60.1 16.9 24.8 14.2 39.9 11.0 8.9 6.1 26.9 73.1 37.5 19.4 35.6 11.7 7.4
2017 H1 100.0 59.2 16.9 24.2 14.2 40.8 11.7 8.9 6.5 28.6 71.4 36.9 19.7 34.5 11.7 8.0 H2 100.0 59.4 16.7 24.5 14.6 40.6 11.0 9.1 6.6 30.4 69.6 36.1 19.7 33.6 11.1 7.7
2018 H1 p,3 100.0 56.8 17.4 22.2 13.4 43.2 11.2 9.0 5.6 29.2 70.8 35.1 19.9 35.7 11.1 8.1
Groups with a focus on the services sector (€ billion)
2014 423.2 294.7 154.6 108.4 13.6 128.6 17.4 47.0 33.5 131.5 291.7 168.0 108.3 123.7 21.6 53.42015 444.5 317.3 166.7 118.3 14.1 127.2 16.7 43.5 31.6 148.3 296.2 171.0 112.2 125.2 24.4 52.72016 457.6 330.9 170.9 122.0 18.1 126.7 17.1 48.0 34.9 157.7 299.9 173.4 112.3 126.5 25.9 51.92017 464.5 339.7 176.9 128.4 14.1 124.8 18.1 50.4 31.3 170.6 293.9 168.9 114.8 125.0 20.9 47.3
2016 H2 457.6 330.9 170.9 122.0 18.1 126.7 17.1 48.0 34.9 157.7 299.9 173.4 112.3 126.5 25.9 51.9
2017 H1 461.9 332.9 177.0 119.3 15.5 129.0 14.0 48.8 24.5 151.1 310.7 178.3 118.9 132.5 21.8 41.8 H2 464.5 339.7 176.9 128.4 14.1 124.8 18.1 50.4 31.3 170.6 293.9 168.9 114.8 125.0 20.9 47.3
2018 H1 p,3 479.8 356.0 181.4 142.1 12.3 123.8 17.4 50.5 28.1 170.7 309.2 181.6 129.8 127.6 25.2 42.7
As a percentage of total assets
2014 100.0 69.6 36.5 25.6 3.2 30.4 4.1 11.1 7.9 31.1 68.9 39.7 25.6 29.2 5.1 12.62015 100.0 71.4 37.5 26.6 3.2 28.6 3.8 9.8 7.1 33.4 66.6 38.5 25.3 28.2 5.5 11.92016 100.0 72.3 37.3 26.7 4.0 27.7 3.7 10.5 7.6 34.5 65.5 37.9 24.5 27.7 5.7 11.32017 100.0 73.1 38.1 27.6 3.0 26.9 3.9 10.9 6.7 36.7 63.3 36.4 24.7 26.9 4.5 10.2
2016 H2 100.0 72.3 37.3 26.7 4.0 27.7 3.7 10.5 7.6 34.5 65.5 37.9 24.5 27.7 5.7 11.3
2017 H1 100.0 72.1 38.3 25.8 3.4 27.9 3.0 10.6 5.3 32.7 67.3 38.6 25.7 28.7 4.7 9.0 H2 100.0 73.1 38.1 27.6 3.0 26.9 3.9 10.9 6.7 36.7 63.3 36.4 24.7 26.9 4.5 10.2
2018 H1 p,3 100.0 74.2 37.8 29.6 2.6 25.8 3.6 10.5 5.9 35.6 64.4 37.8 27.1 26.6 5.2 8.9
* Non-financial groups admitted to the Prime Standard segment of the Frankfurt Excluding groups engaged in real estate activities. 1 Including cash equivalents. 2 In-Stock Exchange which publish IFRS consolidated financial statements on a quarterly cluding groups in agriculture and forestry. 3 From this point onwards: significantor half-yearly basis and make a noteworthy contribution to value added in Germany. changes in IFRS standards, impairing comparability with previous periods.
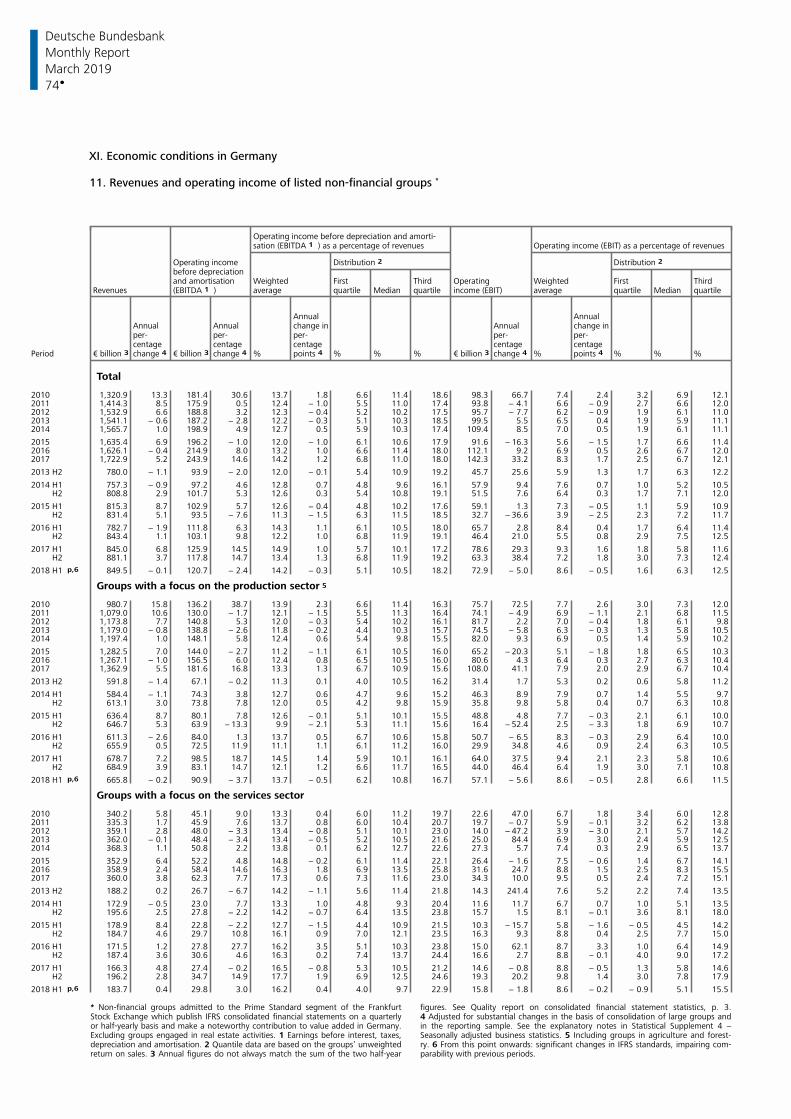
Deutsche Bundesbank
74
Monthly Report
March 2019
XI. Economic conditions in Germany 11. Revenues and operating income of listed non-financial groups *
Operating income before depreciation and amorti-sation (EBITDA 1 ) as a percentage of revenues Operating income (EBIT) as a percentage of revenues
Operating income Distribution 2 Distribution 2 before depreciationand amortisation Weighted First Third Operating Weighted First Third
Revenues (EBITDA 1 ) average quartile Median quartile income (EBIT) average quartile Median quartile
Annual AnnualAnnual Annual change in Annual change inper- per- per- per- per-centage centage centage centage centage
Period change 4 change 4 % points 4 % % % change 4 % points 4 % % %€ billion 3 € billion 3 € billion 3
Total
2010 1,320.9 13.3 181.4 30.6 13.7 1.8 6.6 11.4 18.6 98.3 66.7 7.4 2.4 3.2 6.9 12.12011 1,414.3 8.5 175.9 0.5 12.4 − 1.0 5.5 11.0 17.4 93.8 − 4.1 6.6 − 0.9 2.7 6.6 12.02012 1,532.9 6.6 188.8 3.2 12.3 − 0.4 5.2 10.2 17.5 95.7 − 7.7 6.2 − 0.9 1.9 6.1 11.02013 1,541.1 − 0.6 187.2 − 2.8 12.2 − 0.3 5.1 10.3 18.5 99.5 5.5 6.5 0.4 1.9 5.9 11.12014 1,565.7 1.0 198.9 4.9 12.7 0.5 5.9 10.3 17.4 109.4 8.5 7.0 0.5 1.9 6.1 11.1
2015 1,635.4 6.9 196.2 − 1.0 12.0 − 1.0 6.1 10.6 17.9 91.6 − 16.3 5.6 − 1.5 1.7 6.6 11.42016 1,626.1 − 0.4 214.9 8.0 13.2 1.0 6.6 11.4 18.0 112.1 9.2 6.9 0.5 2.6 6.7 12.02017 1,722.9 5.2 243.9 14.6 14.2 1.2 6.8 11.0 18.0 142.3 33.2 8.3 1.7 2.5 6.7 12.1
2013 H2 780.0 − 1.1 93.9 − 2.0 12.0 − 0.1 5.4 10.9 19.2 45.7 25.6 5.9 1.3 1.7 6.3 12.2
2014 H1 757.3 − 0.9 97.2 4.6 12.8 0.7 4.8 9.6 16.1 57.9 9.4 7.6 0.7 1.0 5.2 10.5 H2 808.8 2.9 101.7 5.3 12.6 0.3 5.4 10.8 19.1 51.5 7.6 6.4 0.3 1.7 7.1 12.0
2015 H1 815.3 8.7 102.9 5.7 12.6 − 0.4 4.8 10.2 17.6 59.1 1.3 7.3 − 0.5 1.1 5.9 10.9 H2 831.4 5.1 93.5 − 7.6 11.3 − 1.5 6.3 11.5 18.5 32.7 − 36.6 3.9 − 2.5 2.3 7.2 11.7
2016 H1 782.7 − 1.9 111.8 6.3 14.3 1.1 6.1 10.5 18.0 65.7 2.8 8.4 0.4 1.7 6.4 11.4 H2 843.4 1.1 103.1 9.8 12.2 1.0 6.8 11.9 19.1 46.4 21.0 5.5 0.8 2.9 7.5 12.5
2017 H1 845.0 6.8 125.9 14.5 14.9 1.0 5.7 10.1 17.2 78.6 29.3 9.3 1.6 1.8 5.8 11.6 H2 881.1 3.7 117.8 14.7 13.4 1.3 6.8 11.9 19.2 63.3 38.4 7.2 1.8 3.0 7.3 12.4
2018 H1 p,6 849.5 − 0.1 120.7 − 2.4 14.2 − 0.3 5.1 10.5 18.2 72.9 − 5.0 8.6 − 0.5 1.6 6.3 12.5
Groups with a focus on the production sector 5
2010 980.7 15.8 136.2 38.7 13.9 2.3 6.6 11.4 16.3 75.7 72.5 7.7 2.6 3.0 7.3 12.02011 1,079.0 10.6 130.0 − 1.7 12.1 − 1.5 5.5 11.3 16.4 74.1 − 4.9 6.9 − 1.1 2.1 6.8 11.52012 1,173.8 7.7 140.8 5.3 12.0 − 0.3 5.4 10.2 16.1 81.7 2.2 7.0 − 0.4 1.8 6.1 9.82013 1,179.0 − 0.8 138.8 − 2.6 11.8 − 0.2 4.4 10.3 15.7 74.5 − 5.8 6.3 − 0.3 1.3 5.8 10.52014 1,197.4 1.0 148.1 5.8 12.4 0.6 5.4 9.8 15.5 82.0 9.3 6.9 0.5 1.4 5.9 10.2
2015 1,282.5 7.0 144.0 − 2.7 11.2 − 1.1 6.1 10.5 16.0 65.2 − 20.3 5.1 − 1.8 1.8 6.5 10.32016 1,267.1 − 1.0 156.5 6.0 12.4 0.8 6.5 10.5 16.0 80.6 4.3 6.4 0.3 2.7 6.3 10.42017 1,362.9 5.5 181.6 16.8 13.3 1.3 6.7 10.9 15.6 108.0 41.1 7.9 2.0 2.9 6.7 10.4
2013 H2 591.8 − 1.4 67.1 − 0.2 11.3 0.1 4.0 10.5 16.2 31.4 1.7 5.3 0.2 0.6 5.8 11.2
2014 H1 584.4 − 1.1 74.3 3.8 12.7 0.6 4.7 9.6 15.2 46.3 8.9 7.9 0.7 1.4 5.5 9.7 H2 613.1 3.0 73.8 7.8 12.0 0.5 4.2 9.8 15.9 35.8 9.8 5.8 0.4 0.7 6.3 10.8
2015 H1 636.4 8.7 80.1 7.8 12.6 − 0.1 5.1 10.1 15.5 48.8 4.8 7.7 − 0.3 2.1 6.1 10.0 H2 646.7 5.3 63.9 − 13.3 9.9 − 2.1 5.3 11.1 15.6 16.4 − 52.4 2.5 − 3.3 1.8 6.9 10.7
2016 H1 611.3 − 2.6 84.0 1.3 13.7 0.5 6.7 10.6 15.8 50.7 − 6.5 8.3 − 0.3 2.9 6.4 10.0 H2 655.9 0.5 72.5 11.9 11.1 1.1 6.1 11.2 16.0 29.9 34.8 4.6 0.9 2.4 6.3 10.5
2017 H1 678.7 7.2 98.5 18.7 14.5 1.4 5.9 10.1 16.1 64.0 37.5 9.4 2.1 2.3 5.8 10.6 H2 684.9 3.9 83.1 14.7 12.1 1.2 6.6 11.7 16.5 44.0 46.4 6.4 1.9 3.0 7.1 10.8
2018 H1 p,6 665.8 − 0.2 90.9 − 3.7 13.7 − 0.5 6.2 10.8 16.7 57.1 − 5.6 8.6 − 0.5 2.8 6.6 11.5
Groups with a focus on the services sector
2010 340.2 5.8 45.1 9.0 13.3 0.4 6.0 11.2 19.7 22.6 47.0 6.7 1.8 3.4 6.0 12.82011 335.3 1.7 45.9 7.6 13.7 0.8 6.0 10.4 20.7 19.7 − 0.7 5.9 − 0.1 3.2 6.2 13.82012 359.1 2.8 48.0 − 3.3 13.4 − 0.8 5.1 10.1 23.0 14.0 − 47.2 3.9 − 3.0 2.1 5.7 14.22013 362.0 − 0.1 48.4 − 3.4 13.4 − 0.5 5.2 10.5 21.6 25.0 84.4 6.9 3.0 2.4 5.9 12.52014 368.3 1.1 50.8 2.2 13.8 0.1 6.2 12.7 22.6 27.3 5.7 7.4 0.3 2.9 6.5 13.7
2015 352.9 6.4 52.2 4.8 14.8 − 0.2 6.1 11.4 22.1 26.4 − 1.6 7.5 − 0.6 1.4 6.7 14.12016 358.9 2.4 58.4 14.6 16.3 1.8 6.9 13.5 25.8 31.6 24.7 8.8 1.5 2.5 8.3 15.52017 360.0 3.8 62.3 7.7 17.3 0.6 7.3 11.6 23.0 34.3 10.0 9.5 0.5 2.4 7.2 15.1
2013 H2 188.2 0.2 26.7 − 6.7 14.2 − 1.1 5.6 11.4 21.8 14.3 241.4 7.6 5.2 2.2 7.4 13.5
2014 H1 172.9 − 0.5 23.0 7.7 13.3 1.0 4.8 9.3 20.4 11.6 11.7 6.7 0.7 1.0 5.1 13.5 H2 195.6 2.5 27.8 − 2.2 14.2 − 0.7 6.4 13.5 23.8 15.7 1.5 8.1 − 0.1 3.6 8.1 18.0
2015 H1 178.9 8.4 22.8 − 2.2 12.7 − 1.5 4.4 10.9 21.5 10.3 − 15.7 5.8 − 1.6 − 0.5 4.5 14.2 H2 184.7 4.6 29.7 10.8 16.1 0.9 7.0 12.1 23.5 16.3 9.3 8.8 0.4 2.5 7.7 15.0
2016 H1 171.5 1.2 27.8 27.7 16.2 3.5 5.1 10.3 23.8 15.0 62.1 8.7 3.3 1.0 6.4 14.9 H2 187.4 3.6 30.6 4.6 16.3 0.2 7.4 13.7 24.4 16.6 2.7 8.8 − 0.1 4.0 9.0 17.2
2017 H1 166.3 4.8 27.4 − 0.2 16.5 − 0.8 5.3 10.5 21.2 14.6 − 0.8 8.8 − 0.5 1.3 5.8 14.6 H2 196.2 2.8 34.7 14.9 17.7 1.9 6.9 12.5 24.6 19.3 20.2 9.8 1.4 3.0 7.8 17.9
2018 H1 p,6 183.7 0.4 29.8 3.0 16.2 0.4 4.0 9.7 22.9 15.8 − 1.8 8.6 − 0.2 − 0.9 5.1 15.5
* Non-financial groups admitted to the Prime Standard segment of the Frankfurt figures. See Quality report on consolidated financial statement statistics, p. 3.Stock Exchange which publish IFRS consolidated financial statements on a quarterly 4 Adjusted for substantial changes in the basis of consolidation of large groups andor half-yearly basis and make a noteworthy contribution to value added in Germany. in the reporting sample. See the explanatory notes in Statistical Supplement 4 −Excluding groups engaged in real estate activities. 1 Earnings before interest, taxes, Seasonally adjusted business statistics. 5 Including groups in agriculture and forest-depreciation and amortisation. 2 Quantile data are based on the groups’ unweighted ry. 6 From this point onwards: significant changes in IFRS standards, impairing com-return on sales. 3 Annual figures do not always match the sum of the two half-year parability with previous periods.
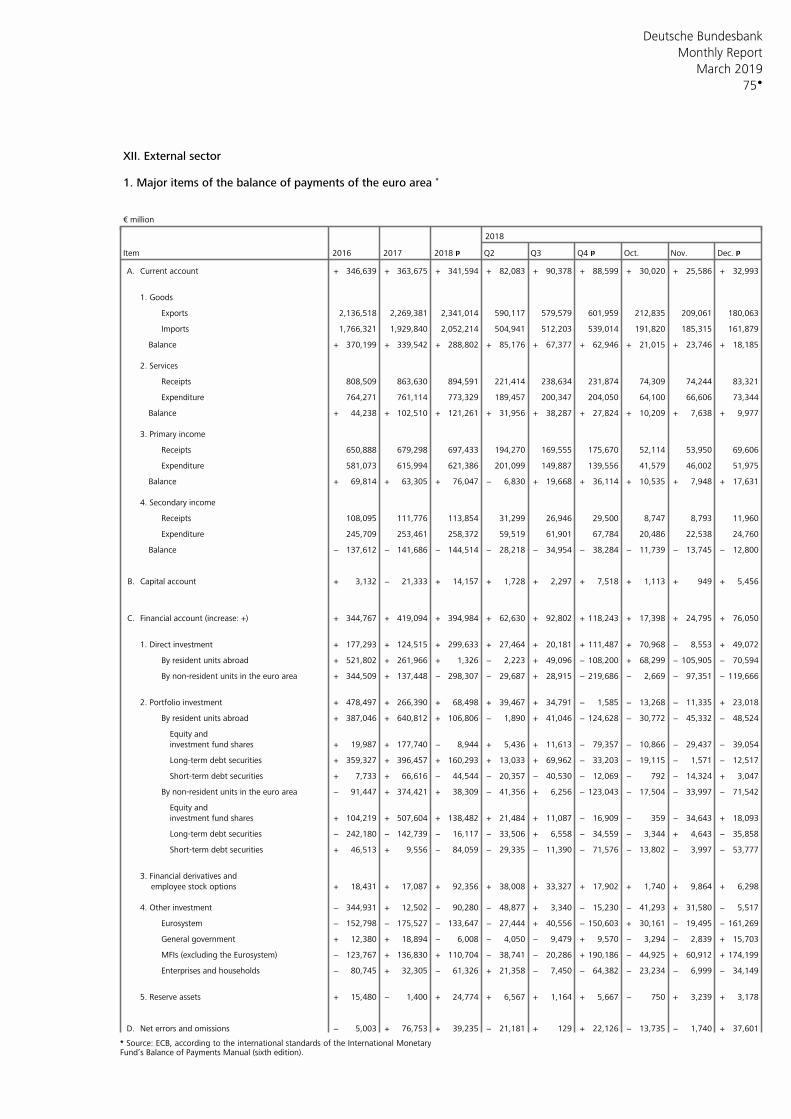
Deutsche Bundesbank
75
Monthly Report
March 2019
XII. External sector 1. Major items of the balance of payments of the euro area *
€ million
2018
Item 2016 2017 2018 p Q2 Q3 Q4 p Oct. Nov. Dec. p
Current account + 346,639 + 363,675 + 341,594 + 82,083 + 90,378 + 88,599 + 30,020 + 25,586 + 32,993A.
1. Goods
Exports 2,136,518 2,269,381 2,341,014 590,117 579,579 601,959 212,835 209,061 180,063
Imports 1,766,321 1,929,840 2,052,214 504,941 512,203 539,014 191,820 185,315 161,879
Balance + 370,199 + 339,542 + 288,802 + 85,176 + 67,377 + 62,946 + 21,015 + 23,746 + 18,185
2. Services
Receipts 808,509 863,630 894,591 221,414 238,634 231,874 74,309 74,244 83,321
Expenditure 764,271 761,114 773,329 189,457 200,347 204,050 64,100 66,606 73,344
Balance + 44,238 + 102,510 + 121,261 + 31,956 + 38,287 + 27,824 + 10,209 + 7,638 + 9,977
3. Primary income
Receipts 650,888 679,298 697,433 194,270 169,555 175,670 52,114 53,950 69,606
Expenditure 581,073 615,994 621,386 201,099 149,887 139,556 41,579 46,002 51,975
Balance + 69,814 + 63,305 + 76,047 − 6,830 + 19,668 + 36,114 + 10,535 + 7,948 + 17,631
4. Secondary income
Receipts 108,095 111,776 113,854 31,299 26,946 29,500 8,747 8,793 11,960
Expenditure 245,709 253,461 258,372 59,519 61,901 67,784 20,486 22,538 24,760
Balance − 137,612 − 141,686 − 144,514 − 28,218 − 34,954 − 38,284 − 11,739 − 13,745 − 12,800
Capital account + 3,132 − 21,333 + 14,157 + 1,728 + 2,297 + 7,518 + 1,113 + 949 + 5,456B.
Financial account (increase: +) + 344,767 + 419,094 + 394,984 + 62,630 + 92,802 + 118,243 + 17,398 + 24,795 + 76,050C.
1. Direct investment + 177,293 + 124,515 + 299,633 + 27,464 + 20,181 + 111,487 + 70,968 − 8,553 + 49,072
By resident units abroad + 521,802 + 261,966 + 1,326 − 2,223 + 49,096 − 108,200 + 68,299 − 105,905 − 70,594
By non-resident units in the euro area + 344,509 + 137,448 − 298,307 − 29,687 + 28,915 − 219,686 − 2,669 − 97,351 − 119,666
2. Portfolio investment + 478,497 + 266,390 + 68,498 + 39,467 + 34,791 − 1,585 − 13,268 − 11,335 + 23,018
By resident units abroad + 387,046 + 640,812 + 106,806 − 1,890 + 41,046 − 124,628 − 30,772 − 45,332 − 48,524
Equity and
investment fund shares + 19,987 + 177,740 − 8,944 + 5,436 + 11,613 − 79,357 − 10,866 − 29,437 − 39,054
Long-term debt securities + 359,327 + 396,457 + 160,293 + 13,033 + 69,962 − 33,203 − 19,115 − 1,571 − 12,517
Short-term debt securities + 7,733 + 66,616 − 44,544 − 20,357 − 40,530 − 12,069 − 792 − 14,324 + 3,047
By non-resident units in the euro area − 91,447 + 374,421 + 38,309 − 41,356 + 6,256 − 123,043 − 17,504 − 33,997 − 71,542
Equity and
investment fund shares + 104,219 + 507,604 + 138,482 + 21,484 + 11,087 − 16,909 − 359 − 34,643 + 18,093
Long-term debt securities − 242,180 − 142,739 − 16,117 − 33,506 + 6,558 − 34,559 − 3,344 + 4,643 − 35,858
Short-term debt securities + 46,513 + 9,556 − 84,059 − 29,335 − 11,390 − 71,576 − 13,802 − 3,997 − 53,777
3. Financial derivatives and
employee stock options + 18,431 + 17,087 + 92,356 + 38,008 + 33,327 + 17,902 + 1,740 + 9,864 + 6,298
4. Other investment − 344,931 + 12,502 − 90,280 − 48,877 + 3,340 − 15,230 − 41,293 + 31,580 − 5,517
Eurosystem − 152,798 − 175,527 − 133,647 − 27,444 + 40,556 − 150,603 + 30,161 − 19,495 − 161,269
General government + 12,380 + 18,894 − 6,008 − 4,050 − 9,479 + 9,570 − 3,294 − 2,839 + 15,703
MFIs (excluding the Eurosystem) − 123,767 + 136,830 + 110,704 − 38,741 − 20,286 + 190,186 − 44,925 + 60,912 + 174,199
Enterprises and households − 80,745 + 32,305 − 61,326 + 21,358 − 7,450 − 64,382 − 23,234 − 6,999 − 34,149
5. Reserve assets + 15,480 − 1,400 + 24,774 + 6,567 + 1,164 + 5,667 − 750 + 3,239 + 3,178
Net errors and omissions − 5,003 + 76,753 + 39,235 − 21,181 + 129 + 22,126 − 13,735 − 1,740 + 37,601D.
* Source: ECB, according to the international standards of the International Monetary Fund’s Balance of Payments Manual (sixth edition).
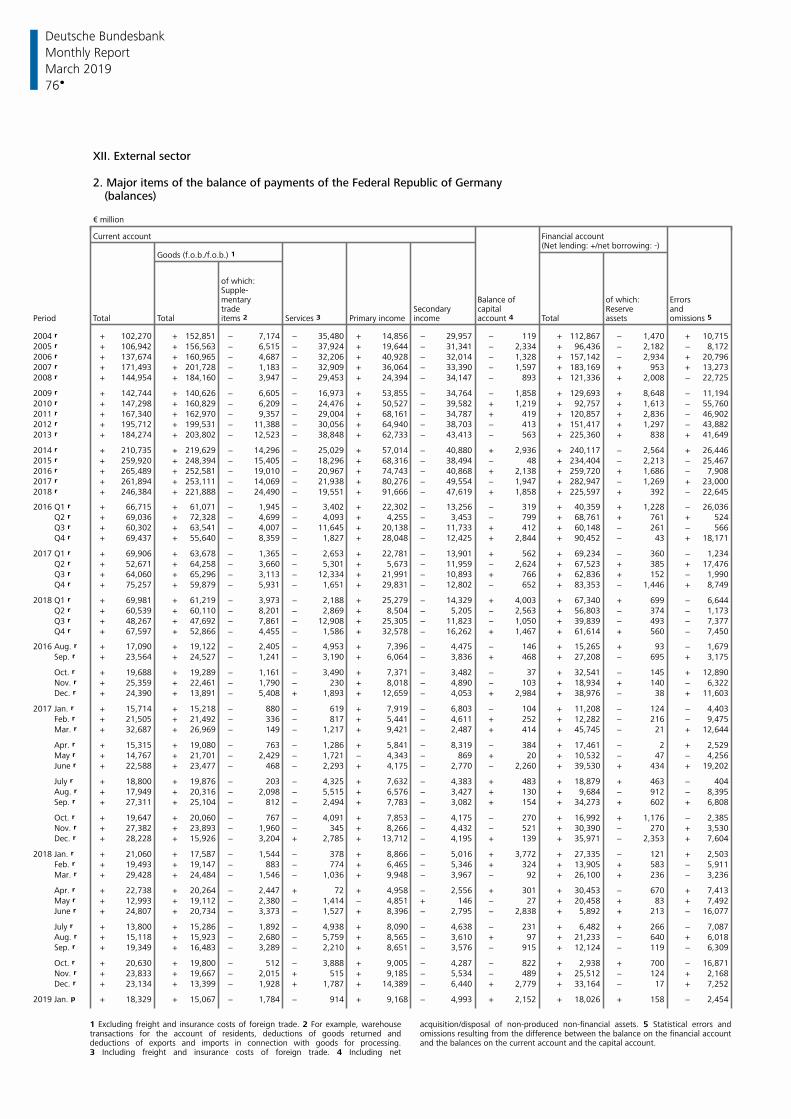
Deutsche Bundesbank
76
Monthly Report
March 2019
XII. External sector 2. Major items of the balance of payments of the Federal Republic of Germany
(balances) € million
Current account Financial account (Net lending: +/net borrowing: -)
Goods (f.o.b./f.o.b.) 1
of which:Supple-mentary Balance of of which: Errorstrade Secondary capital Reserve and
Period Total Total items 2 Services 3 Primary income income account 4 Total assets omissions 5
2004 r + 102,270 + 152,851 − 7,174 − 35,480 + 14,856 − 29,957 − 119 + 112,867 − 1,470 + 10,715
2005 r + 106,942 + 156,563 − 6,515 − 37,924 + 19,644 − 31,341 − 2,334 + 96,436 − 2,182 − 8,172
2006 r + 137,674 + 160,965 − 4,687 − 32,206 + 40,928 − 32,014 − 1,328 + 157,142 − 2,934 + 20,796
2007 r + 171,493 + 201,728 − 1,183 − 32,909 + 36,064 − 33,390 − 1,597 + 183,169 + 953 + 13,273
2008 r + 144,954 + 184,160 − 3,947 − 29,453 + 24,394 − 34,147 − 893 + 121,336 + 2,008 − 22,725
2009 r + 142,744 + 140,626 − 6,605 − 16,973 + 53,855 − 34,764 − 1,858 + 129,693 + 8,648 − 11,194
2010 r + 147,298 + 160,829 − 6,209 − 24,476 + 50,527 − 39,582 + 1,219 + 92,757 + 1,613 − 55,760
2011 r + 167,340 + 162,970 − 9,357 − 29,004 + 68,161 − 34,787 + 419 + 120,857 + 2,836 − 46,902
2012 r + 195,712 + 199,531 − 11,388 − 30,056 + 64,940 − 38,703 − 413 + 151,417 + 1,297 − 43,882
2013 r + 184,274 + 203,802 − 12,523 − 38,848 + 62,733 − 43,413 − 563 + 225,360 + 838 + 41,649
2014 r + 210,735 + 219,629 − 14,296 − 25,029 + 57,014 − 40,880 + 2,936 + 240,117 − 2,564 + 26,446
2015 r + 259,920 + 248,394 − 15,405 − 18,296 + 68,316 − 38,494 − 48 + 234,404 − 2,213 − 25,467
2016 r + 265,489 + 252,581 − 19,010 − 20,967 + 74,743 − 40,868 + 2,138 + 259,720 + 1,686 − 7,908
2017 r + 261,894 + 253,111 − 14,069 − 21,938 + 80,276 − 49,554 − 1,947 + 282,947 − 1,269 + 23,000
2018 r + 246,384 + 221,888 − 24,490 − 19,551 + 91,666 − 47,619 + 1,858 + 225,597 + 392 − 22,645
2016 Q1 r + 66,715 + 61,071 − 1,945 − 3,402 + 22,302 − 13,256 − 319 + 40,359 + 1,228 − 26,036
Q2 r + 69,036 + 72,328 − 4,699 − 4,093 + 4,255 − 3,453 − 799 + 68,761 + 761 + 524
Q3 r + 60,302 + 63,541 − 4,007 − 11,645 + 20,138 − 11,733 + 412 + 60,148 − 261 − 566
Q4 r + 69,437 + 55,640 − 8,359 − 1,827 + 28,048 − 12,425 + 2,844 + 90,452 − 43 + 18,171
2017 Q1 r + 69,906 + 63,678 − 1,365 − 2,653 + 22,781 − 13,901 + 562 + 69,234 − 360 − 1,234
Q2 r + 52,671 + 64,258 − 3,660 − 5,301 + 5,673 − 11,959 − 2,624 + 67,523 + 385 + 17,476
Q3 r + 64,060 + 65,296 − 3,113 − 12,334 + 21,991 − 10,893 + 766 + 62,836 + 152 − 1,990
Q4 r + 75,257 + 59,879 − 5,931 − 1,651 + 29,831 − 12,802 − 652 + 83,353 − 1,446 + 8,749
2018 Q1 r + 69,981 + 61,219 − 3,973 − 2,188 + 25,279 − 14,329 + 4,003 + 67,340 + 699 − 6,644
Q2 r + 60,539 + 60,110 − 8,201 − 2,869 + 8,504 − 5,205 − 2,563 + 56,803 − 374 − 1,173
Q3 r + 48,267 + 47,692 − 7,861 − 12,908 + 25,305 − 11,823 − 1,050 + 39,839 − 493 − 7,377
Q4 r + 67,597 + 52,866 − 4,455 − 1,586 + 32,578 − 16,262 + 1,467 + 61,614 + 560 − 7,450
2016 Aug. r + 17,090 + 19,122 − 2,405 − 4,953 + 7,396 − 4,475 − 146 + 15,265 + 93 − 1,679
Sep. r + 23,564 + 24,527 − 1,241 − 3,190 + 6,064 − 3,836 + 468 + 27,208 − 695 + 3,175
Oct. r + 19,688 + 19,289 − 1,161 − 3,490 + 7,371 − 3,482 − 37 + 32,541 − 145 + 12,890
Nov. r + 25,359 + 22,461 − 1,790 − 230 + 8,018 − 4,890 − 103 + 18,934 + 140 − 6,322
Dec. r + 24,390 + 13,891 − 5,408 + 1,893 + 12,659 − 4,053 + 2,984 + 38,976 − 38 + 11,603
2017 Jan. r + 15,714 + 15,218 − 880 − 619 + 7,919 − 6,803 − 104 + 11,208 − 124 − 4,403
Feb. r + 21,505 + 21,492 − 336 − 817 + 5,441 − 4,611 + 252 + 12,282 − 216 − 9,475
Mar. r + 32,687 + 26,969 − 149 − 1,217 + 9,421 − 2,487 + 414 + 45,745 − 21 + 12,644
Apr. r + 15,315 + 19,080 − 763 − 1,286 + 5,841 − 8,319 − 384 + 17,461 − 2 + 2,529
May r + 14,767 + 21,701 − 2,429 − 1,721 − 4,343 − 869 + 20 + 10,532 − 47 − 4,256
June r + 22,588 + 23,477 − 468 − 2,293 + 4,175 − 2,770 − 2,260 + 39,530 + 434 + 19,202
July r + 18,800 + 19,876 − 203 − 4,325 + 7,632 − 4,383 + 483 + 18,879 + 463 − 404
Aug. r + 17,949 + 20,316 − 2,098 − 5,515 + 6,576 − 3,427 + 130 + 9,684 − 912 − 8,395
Sep. r + 27,311 + 25,104 − 812 − 2,494 + 7,783 − 3,082 + 154 + 34,273 + 602 + 6,808
Oct. r + 19,647 + 20,060 − 767 − 4,091 + 7,853 − 4,175 − 270 + 16,992 + 1,176 − 2,385
Nov. r + 27,382 + 23,893 − 1,960 − 345 + 8,266 − 4,432 − 521 + 30,390 − 270 + 3,530
Dec. r + 28,228 + 15,926 − 3,204 + 2,785 + 13,712 − 4,195 + 139 + 35,971 − 2,353 + 7,604
2018 Jan. r + 21,060 + 17,587 − 1,544 − 378 + 8,866 − 5,016 + 3,772 + 27,335 − 121 + 2,503
Feb. r + 19,493 + 19,147 − 883 − 774 + 6,465 − 5,346 + 324 + 13,905 + 583 − 5,911
Mar. r + 29,428 + 24,484 − 1,546 − 1,036 + 9,948 − 3,967 − 92 + 26,100 + 236 − 3,236
Apr. r + 22,738 + 20,264 − 2,447 + 72 + 4,958 − 2,556 + 301 + 30,453 − 670 + 7,413
May r + 12,993 + 19,112 − 2,380 − 1,414 − 4,851 + 146 − 27 + 20,458 + 83 + 7,492
June r + 24,807 + 20,734 − 3,373 − 1,527 + 8,396 − 2,795 − 2,838 + 5,892 + 213 − 16,077
July r + 13,800 + 15,286 − 1,892 − 4,938 + 8,090 − 4,638 − 231 + 6,482 + 266 − 7,087
Aug. r + 15,118 + 15,923 − 2,680 − 5,759 + 8,565 − 3,610 + 97 + 21,233 − 640 + 6,018
Sep. r + 19,349 + 16,483 − 3,289 − 2,210 + 8,651 − 3,576 − 915 + 12,124 − 119 − 6,309
Oct. r + 20,630 + 19,800 − 512 − 3,888 + 9,005 − 4,287 − 822 + 2,938 + 700 − 16,871
Nov. r + 23,833 + 19,667 − 2,015 + 515 + 9,185 − 5,534 − 489 + 25,512 − 124 + 2,168
Dec. r + 23,134 + 13,399 − 1,928 + 1,787 + 14,389 − 6,440 + 2,779 + 33,164 − 17 + 7,252
2019 Jan. p + 18,329 + 15,067 − 1,784 − 914 + 9,168 − 4,993 + 2,152 + 18,026 + 158 − 2,454
1 Excluding freight and insurance costs of foreign trade. 2 For example, warehouse acquisition/disposal of non-produced non-financial assets. 5 Statistical errors andtransactions for the account of residents, deductions of goods returned and omissions resulting from the difference between the balance on the financial accountdeductions of exports and imports in connection with goods for processing. and the balances on the current account and the capital account. 3 Including freight and insurance costs of foreign trade. 4 Including net
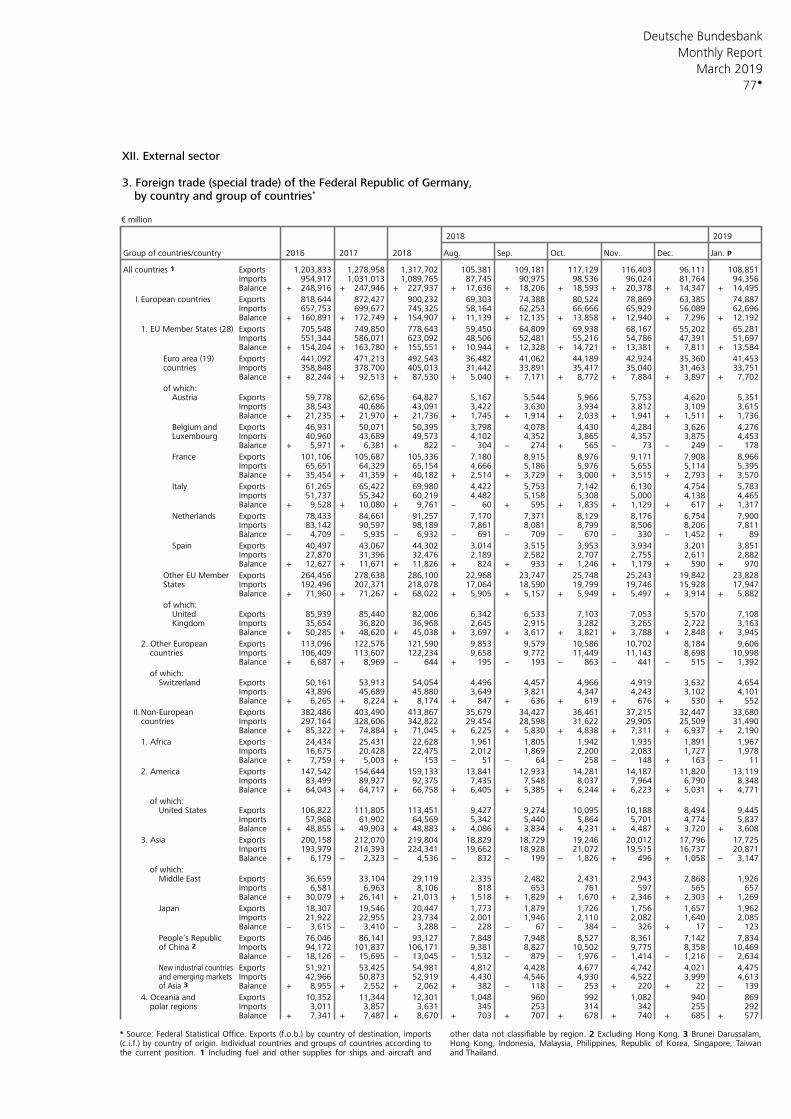
77
XII. External sector 3. Foreign trade (special trade) of the Federal Republic of Germany,
by country and group of countries*
€ million
2018 2019
Group of countries/country 2016 2017 2018 Aug. Sep. Oct. Nov. Dec. Jan. p
All countries 1 Exports 1,203,833 1,278,958 1,317,702 105,381 109,181 117,129 116,403 96,111 108,851Imports 954,917 1,031,013 1,089,765 87,745 90,975 98,536 96,024 81,764 94,356Balance + 248,916 + 247,946 + 227,937 + 17,636 + 18,206 + 18,593 + 20,378 + 14,347 + 14,495
I. Exports 818,644 872,427 900,232 69,303 74,388 80,524 78,869 63,385 74,887European countriesImports 657,753 699,677 745,325 58,164 62,253 66,666 65,929 56,089 62,696Balance + 160,891 + 172,749 + 154,907 + 11,139 + 12,135 + 13,858 + 12,940 + 7,296 + 12,192
Exports 705,548 749,850 778,643 59,450 64,809 69,938 68,167 55,202 65,2811. EU Member States (28)Imports 551,344 586,071 623,092 48,506 52,481 55,216 54,786 47,391 51,697Balance + 154,204 + 163,780 + 155,551 + 10,944 + 12,328 + 14,721 + 13,381 + 7,811 + 13,584
Euro area (19) Exports 441,092 471,213 492,543 36,482 41,062 44,189 42,924 35,360 41,453countries Imports 358,848 378,700 405,013 31,442 33,891 35,417 35,040 31,463 33,751
Balance + 82,244 + 92,513 + 87,530 + 5,040 + 7,171 + 8,772 + 7,884 + 3,897 + 7,702
of which:Austria Exports 59,778 62,656 64,827 5,167 5,544 5,966 5,753 4,620 5,351
Imports 38,543 40,686 43,091 3,422 3,630 3,934 3,812 3,109 3,615Balance + 21,235 + 21,970 + 21,736 + 1,745 + 1,914 + 2,033 + 1,941 + 1,511 + 1,736
Belgium and Exports 46,931 50,071 50,395 3,798 4,078 4,430 4,284 3,626 4,276Luxembourg Imports 40,960 43,689 49,573 4,102 4,352 3,865 4,357 3,875 4,453
Balance + 5,971 + 6,381 + 822 − 304 − 274 + 565 − 73 − 249 − 178
France Exports 101,106 105,687 105,336 7,180 8,915 8,976 9,171 7,908 8,966Imports 65,651 64,329 65,154 4,666 5,186 5,976 5,655 5,114 5,395Balance + 35,454 + 41,359 + 40,182 + 2,514 + 3,729 + 3,000 + 3,515 + 2,793 + 3,570
Italy Exports 61,265 65,422 69,980 4,422 5,753 7,142 6,130 4,754 5,783Imports 51,737 55,342 60,219 4,482 5,158 5,308 5,000 4,138 4,465Balance + 9,528 + 10,080 + 9,761 − 60 + 595 + 1,835 + 1,129 + 617 + 1,317
Netherlands Exports 78,433 84,661 91,257 7,170 7,371 8,129 8,176 6,754 7,900Imports 83,142 90,597 98,189 7,861 8,081 8,799 8,506 8,206 7,811Balance − 4,709 − 5,935 − 6,932 − 691 − 709 − 670 − 330 − 1,452 + 89
Spain Exports 40,497 43,067 44,302 3,014 3,515 3,953 3,934 3,201 3,851Imports 27,870 31,396 32,476 2,189 2,582 2,707 2,755 2,611 2,882Balance + 12,627 + 11,671 + 11,826 + 824 + 933 + 1,246 + 1,179 + 590 + 970
Other EU Member Exports 264,456 278,638 286,100 22,968 23,747 25,748 25,243 19,842 23,828States Imports 192,496 207,371 218,078 17,064 18,590 19,799 19,746 15,928 17,947
Balance + 71,960 + 71,267 + 68,022 + 5,905 + 5,157 + 5,949 + 5,497 + 3,914 + 5,882
of which:United Exports 85,939 85,440 82,006 6,342 6,533 7,103 7,053 5,570 7,108Kingdom Imports 35,654 36,820 36,968 2,645 2,915 3,282 3,265 2,722 3,163
Balance + 50,285 + 48,620 + 45,038 + 3,697 + 3,617 + 3,821 + 3,788 + 2,848 + 3,945
Exports 113,096 122,576 121,590 9,853 9,579 10,586 10,702 8,184 9,6062. Other EuropeanImports 106,409 113,607 122,234 9,658 9,772 11,449 11,143 8,698 10,998countriesBalance + 6,687 + 8,969 − 644 + 195 − 193 − 863 − 441 − 515 − 1,392
of which:Switzerland Exports 50,161 53,913 54,054 4,496 4,457 4,966 4,919 3,632 4,654
Imports 43,896 45,689 45,880 3,649 3,821 4,347 4,243 3,102 4,101Balance + 6,265 + 8,224 + 8,174 + 847 + 636 + 619 + 676 + 530 + 552
II. Exports 382,486 403,490 413,867 35,679 34,427 36,461 37,215 32,447 33,680Non-EuropeanImports 297,164 328,606 342,822 29,454 28,598 31,622 29,905 25,509 31,490countriesBalance + 85,322 + 74,884 + 71,045 + 6,225 + 5,830 + 4,838 + 7,311 + 6,937 + 2,190
Exports 24,434 25,431 22,628 1,961 1,805 1,942 1,935 1,891 1,9671. AfricaImports 16,675 20,428 22,475 2,012 1,869 2,200 2,083 1,727 1,978Balance + 7,759 + 5,003 + 153 − 51 − 64 − 258 − 148 + 163 − 11
Exports 147,542 154,644 159,133 13,841 12,933 14,281 14,187 11,820 13,1192. AmericaImports 83,499 89,927 92,375 7,435 7,548 8,037 7,964 6,790 8,348Balance + 64,043 + 64,717 + 66,758 + 6,405 + 5,385 + 6,244 + 6,223 + 5,031 + 4,771
of which:Exports 106,822 111,805 113,451 9,427 9,274 10,095 10,188 8,494 9,445United StatesImports 57,968 61,902 64,569 5,342 5,440 5,864 5,701 4,774 5,837Balance + 48,855 + 49,903 + 48,883 + 4,086 + 3,834 + 4,231 + 4,487 + 3,720 + 3,608
Exports 200,158 212,070 219,804 18,829 18,729 19,246 20,012 17,796 17,7253. AsiaImports 193,979 214,393 224,341 19,662 18,928 21,072 19,515 16,737 20,871Balance + 6,179 − 2,323 − 4,536 − 832 − 199 − 1,826 + 496 + 1,058 − 3,147
of which:Middle East Exports 36,659 33,104 29,119 2,335 2,482 2,431 2,943 2,868 1,926
Imports 6,581 6,963 8,106 818 653 761 597 565 657Balance + 30,079 + 26,141 + 21,013 + 1,518 + 1,829 + 1,670 + 2,346 + 2,303 + 1,269
Japan Exports 18,307 19,546 20,447 1,773 1,879 1,726 1,756 1,657 1,962Imports 21,922 22,955 23,734 2,001 1,946 2,110 2,082 1,640 2,085Balance − 3,615 − 3,410 − 3,288 − 228 − 67 − 384 − 326 + 17 − 123
Exports 76,046 86,141 93,127 7,848 7,948 8,527 8,361 7,142 7,834People‘s RepublicImports 94,172 101,837 106,171 9,381 8,827 10,502 9,775 8,358 10,469of China 2 Balance − 18,126 − 15,695 − 13,045 − 1,532 − 879 − 1,976 − 1,414 − 1,216 − 2,634
Exports 51,921 53,425 54,981 4,812 4,428 4,677 4,742 4,021 4,475New industrial countriesImports 42,966 50,873 52,919 4,430 4,546 4,930 4,522 3,999 4,613and emerging marketsBalance + 8,955 + 2,552 + 2,062 + 382 − 118 − 253 + 220 + 22 − 139of Asia 3
Exports 10,352 11,344 12,301 1,048 960 992 1,082 940 8694. Oceania andImports 3,011 3,857 3,631 345 253 314 342 255 292polar regionsBalance + 7,341 + 7,487 + 8,670 + 703 + 707 + 678 + 740 + 685 + 577
* Source: Federal Statistical Office. Exports (f.o.b.) by country of destination, imports other data not classifiable by region. 2 Excluding Hong Kong. 3 Brunei Darussalam,(c.i.f.) by country of origin. Individual countries and groups of countries according to Hong Kong, Indonesia, Malaysia, Philippines, Republic of Korea, Singapore, Taiwanthe current position. 1 Including fuel and other supplies for ships and aircraft and and Thailand.
Deutsche Bundesbank
Monthly Report
March 2019
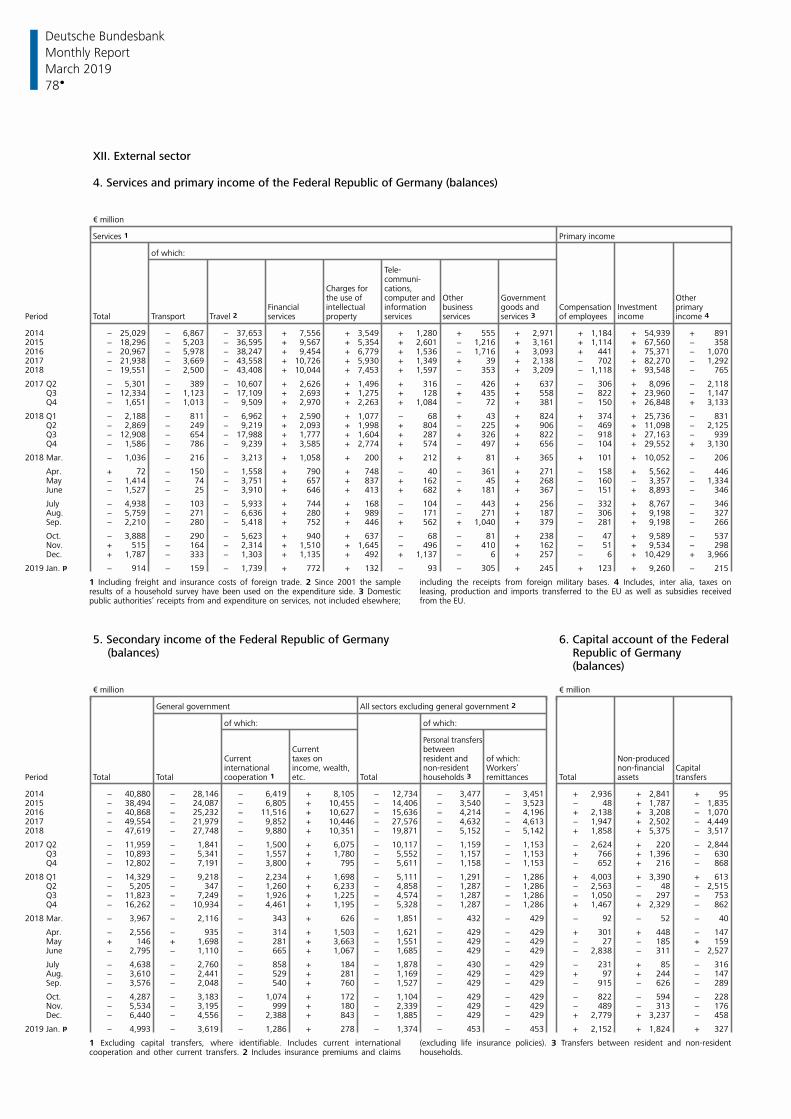
Deutsche Bundesbank
78
Monthly Report
March 2019
XII. External sector 4. Services and primary income of the Federal Republic of Germany (balances) € million
Services 1 Primary income
of which:
Tele-communi-
Charges for cations,the use of Other Government Othercomputer and
Financial information business goods and Investment primaryintellectual CompensationPeriod Total Transport Travel 2 services property services services services 3 income income 4 of employees
2014 − 25,029 − 6,867 − 37,653 + 7,556 + 3,549 + 1,280 + 555 + 2,971 + 1,184 + 54,939 + 8912015 − 18,296 − 5,203 − 36,595 + 9,567 + 5,354 + 2,601 − 1,216 + 3,161 + 1,114 + 67,560 − 3582016 − 20,967 − 5,978 − 38,247 + 9,454 + 6,779 + 1,536 − 1,716 + 3,093 + 441 + 75,371 − 1,0702017 − 21,938 − 3,669 − 43,558 + 10,726 + 5,930 + 1,349 + 39 + 2,138 − 702 + 82,270 − 1,2922018 − 19,551 − 2,500 − 43,408 + 10,044 + 7,453 + 1,597 − 353 + 3,209 − 1,118 + 93,548 − 765
2017 Q2 − 5,301 − 389 − 10,607 + 2,626 + 1,496 + 316 − 426 + 637 − 306 + 8,096 − 2,118 Q3 − 12,334 − 1,123 − 17,109 + 2,693 + 1,275 + 128 + 435 + 558 − 822 + 23,960 − 1,147 Q4 − 1,651 − 1,013 − 9,509 + 2,970 + 2,263 + 1,084 − 72 + 381 − 150 + 26,848 + 3,133
2018 Q1 − 2,188 − 811 − 6,962 + 2,590 + 1,077 − 68 + 43 + 824 + 374 + 25,736 − 831 Q2 − 2,869 − 249 − 9,219 + 2,093 + 1,998 + 804 − 225 + 906 − 469 + 11,098 − 2,125 Q3 − 12,908 − 654 − 17,988 + 1,777 + 1,604 + 287 + 326 + 822 − 918 + 27,163 − 939 Q4 − 1,586 − 786 − 9,239 + 3,585 + 2,774 + 574 − 497 + 656 − 104 + 29,552 + 3,130
2018 Mar. − 1,036 − 216 − 3,213 + 1,058 + 200 + 212 + 81 + 365 + 101 + 10,052 − 206
Apr. + 72 − 150 − 1,558 + 790 + 748 − 40 − 361 + 271 − 158 + 5,562 − 446 May − 1,414 − 74 − 3,751 + 657 + 837 + 162 − 45 + 268 − 160 − 3,357 − 1,334 June − 1,527 − 25 − 3,910 + 646 + 413 + 682 + 181 + 367 − 151 + 8,893 − 346
July − 4,938 − 103 − 5,933 + 744 + 168 − 104 − 443 + 256 − 332 + 8,767 − 346 Aug. − 5,759 − 271 − 6,636 + 280 + 989 − 171 − 271 + 187 − 306 + 9,198 − 327 Sep. − 2,210 − 280 − 5,418 + 752 + 446 + 562 + 1,040 + 379 − 281 + 9,198 − 266
Oct. − 3,888 − 290 − 5,623 + 940 + 637 − 68 − 81 + 238 − 47 + 9,589 − 537 Nov. + 515 − 164 − 2,314 + 1,510 + 1,645 − 496 − 410 + 162 − 51 + 9,534 − 298 Dec. + 1,787 − 333 − 1,303 + 1,135 + 492 + 1,137 − 6 + 257 − 6 + 10,429 + 3,966
2019 Jan. p − 914 − 159 − 1,739 + 772 + 132 − 93 − 305 + 245 + 123 + 9,260 − 215
1 Including freight and insurance costs of foreign trade. 2 Since 2001 the sample including the receipts from foreign military bases. 4 Includes, inter alia, taxes onresults of a household survey have been used on the expenditure side. 3 Domestic leasing, production and imports transferred to the EU as well as subsidies receivedpublic authorities’ receipts from and expenditure on services, not included elsewhere; from the EU.
5. Secondary income of the Federal Republic of Germany 6. Capital account of the Federal(balances) Republic of Germany
(balances)
€ million € million
General government All sectors excluding general government 2
of which: of which:
Personal transfersCurrent between
Current taxes on of which:resident and Non-producedinternational non-resident Workers’ Capitalincome, wealth, non-financial
Period Total Total etc. Total remittances Total assets transferscooperation 1 households 3
2014 − 40,880 − 28,146 − 6,419 + 8,105 − 12,734 − 3,477 − 3,451 + 2,936 + 2,841 + 952015 − 38,494 − 24,087 − 6,805 + 10,455 − 14,406 − 3,540 − 3,523 − 48 + 1,787 − 1,8352016 − 40,868 − 25,232 − 11,516 + 10,627 − 15,636 − 4,214 − 4,196 + 2,138 + 3,208 − 1,0702017 − 49,554 − 21,979 − 9,852 + 10,446 − 27,576 − 4,632 − 4,613 − 1,947 + 2,502 − 4,4492018 − 47,619 − 27,748 − 9,880 + 10,351 − 19,871 − 5,152 − 5,142 + 1,858 + 5,375 − 3,517
2017 Q2 − 11,959 − 1,841 − 1,500 + 6,075 − 10,117 − 1,159 − 1,153 − 2,624 + 220 − 2,844 Q3 − 10,893 − 5,341 − 1,557 + 1,780 − 5,552 − 1,157 − 1,153 + 766 + 1,396 − 630 Q4 − 12,802 − 7,191 − 3,800 + 795 − 5,611 − 1,158 − 1,153 − 652 + 216 − 868
2018 Q1 − 14,329 − 9,218 − 2,234 + 1,698 − 5,111 − 1,291 − 1,286 + 4,003 + 3,390 + 613 Q2 − 5,205 − 347 − 1,260 + 6,233 − 4,858 − 1,287 − 1,286 − 2,563 − 48 − 2,515 Q3 − 11,823 − 7,249 − 1,926 + 1,225 − 4,574 − 1,287 − 1,286 − 1,050 − 297 − 753 Q4 − 16,262 − 10,934 − 4,461 + 1,195 − 5,328 − 1,287 − 1,286 + 1,467 + 2,329 − 862
2018 Mar. − 3,967 − 2,116 − 343 + 626 − 1,851 − 432 − 429 − 92 − 52 − 40
Apr. − 2,556 − 935 − 314 + 1,503 − 1,621 − 429 − 429 + 301 + 448 − 147 May + 146 + 1,698 − 281 + 3,663 − 1,551 − 429 − 429 − 27 − 185 + 159 June − 2,795 − 1,110 − 665 + 1,067 − 1,685 − 429 − 429 − 2,838 − 311 − 2,527
July − 4,638 − 2,760 − 858 + 184 − 1,878 − 430 − 429 − 231 + 85 − 316 Aug. − 3,610 − 2,441 − 529 + 281 − 1,169 − 429 − 429 + 97 + 244 − 147 Sep. − 3,576 − 2,048 − 540 + 760 − 1,527 − 429 − 429 − 915 − 626 − 289
Oct. − 4,287 − 3,183 − 1,074 + 172 − 1,104 − 429 − 429 − 822 − 594 − 228 Nov. − 5,534 − 3,195 − 999 + 180 − 2,339 − 429 − 429 − 489 − 313 − 176 Dec. − 6,440 − 4,556 − 2,388 + 843 − 1,885 − 429 − 429 + 2,779 + 3,237 − 458
2019 Jan. p − 4,993 − 3,619 − 1,286 + 278 − 1,374 − 453 − 453 + 2,152 + 1,824 + 327
1 Excluding capital transfers, where identifiable. Includes current international (excluding life insurance policies). 3 Transfers between resident and non-residentcooperation and other current transfers. 2 Includes insurance premiums and claims households.
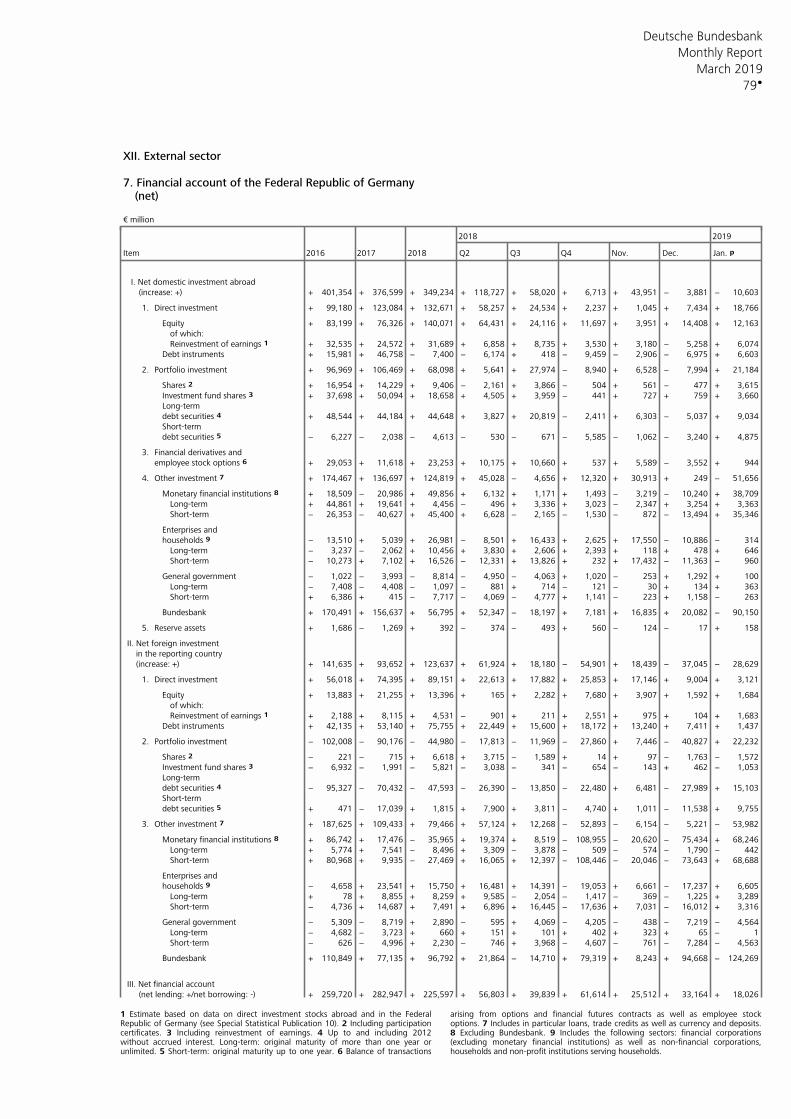
Deutsche Bundesbank
79
Monthly Report
March 2019
XII. External sector 7. Financial account of the Federal Republic of Germany
(net)
€ million
2018 2019
Item 2016 2017 2018 Q2 Q3 Q4 Nov. Dec. Jan. p
I. Net domestic investment abroad(increase: +) + 401,354 + 376,599 + 349,234 + 118,727 + 58,020 + 6,713 + 43,951 − 3,881 − 10,603
1. Direct investment + 99,180 + 123,084 + 132,671 + 58,257 + 24,534 + 2,237 + 1,045 + 7,434 + 18,766
Equity + 83,199 + 76,326 + 140,071 + 64,431 + 24,116 + 11,697 + 3,951 + 14,408 + 12,163of which:Reinvestment of earnings 1 + 32,535 + 24,572 + 31,689 + 6,858 + 8,735 + 3,530 + 3,180 − 5,258 + 6,074
Debt instruments + 15,981 + 46,758 − 7,400 − 6,174 + 418 − 9,459 − 2,906 − 6,975 + 6,603
2. Portfolio investment + 96,969 + 106,469 + 68,098 + 5,641 + 27,974 − 8,940 + 6,528 − 7,994 + 21,184
Shares 2 + 16,954 + 14,229 + 9,406 − 2,161 + 3,866 − 504 + 561 − 477 + 3,615Investment fund shares 3 + 37,698 + 50,094 + 18,658 + 4,505 + 3,959 − 441 + 727 + 759 + 3,660Long-termdebt securities 4 + 48,544 + 44,184 + 44,648 + 3,827 + 20,819 − 2,411 + 6,303 − 5,037 + 9,034Short-termdebt securities 5 − 6,227 − 2,038 − 4,613 − 530 − 671 − 5,585 − 1,062 − 3,240 + 4,875
3. Financial derivatives andemployee stock options 6 + 29,053 + 11,618 + 23,253 + 10,175 + 10,660 + 537 + 5,589 − 3,552 + 944
4. Other investment 7 + 174,467 + 136,697 + 124,819 + 45,028 − 4,656 + 12,320 + 30,913 + 249 − 51,656
Monetary financial institutions 8 + 18,509 − 20,986 + 49,856 + 6,132 + 1,171 + 1,493 − 3,219 − 10,240 + 38,709Long-term + 44,861 + 19,641 + 4,456 − 496 + 3,336 + 3,023 − 2,347 + 3,254 + 3,363Short-term − 26,353 − 40,627 + 45,400 + 6,628 − 2,165 − 1,530 − 872 − 13,494 + 35,346
Enterprises andhouseholds 9 − 13,510 + 5,039 + 26,981 − 8,501 + 16,433 + 2,625 + 17,550 − 10,886 − 314
Long-term − 3,237 − 2,062 + 10,456 + 3,830 + 2,606 + 2,393 + 118 + 478 + 646Short-term − 10,273 + 7,102 + 16,526 − 12,331 + 13,826 + 232 + 17,432 − 11,363 − 960
General government − 1,022 − 3,993 − 8,814 − 4,950 − 4,063 + 1,020 − 253 + 1,292 + 100Long-term − 7,408 − 4,408 − 1,097 − 881 + 714 − 121 − 30 + 134 + 363Short-term + 6,386 + 415 − 7,717 − 4,069 − 4,777 + 1,141 − 223 + 1,158 − 263
Bundesbank + 170,491 + 156,637 + 56,795 + 52,347 − 18,197 + 7,181 + 16,835 + 20,082 − 90,150
5. Reserve assets + 1,686 − 1,269 + 392 − 374 − 493 + 560 − 124 − 17 + 158
II. Net foreign investmentin the reporting country(increase: +) + 141,635 + 93,652 + 123,637 + 61,924 + 18,180 − 54,901 + 18,439 − 37,045 − 28,629
1. Direct investment + 56,018 + 74,395 + 89,151 + 22,613 + 17,882 + 25,853 + 17,146 + 9,004 + 3,121
Equity + 13,883 + 21,255 + 13,396 + 165 + 2,282 + 7,680 + 3,907 + 1,592 + 1,684of which:Reinvestment of earnings 1 + 2,188 + 8,115 + 4,531 − 901 + 211 + 2,551 + 975 + 104 + 1,683
Debt instruments + 42,135 + 53,140 + 75,755 + 22,449 + 15,600 + 18,172 + 13,240 + 7,411 + 1,437
2. Portfolio investment − 102,008 − 90,176 − 44,980 − 17,813 − 11,969 − 27,860 + 7,446 − 40,827 + 22,232
Shares 2 − 221 − 715 + 6,618 + 3,715 − 1,589 + 14 + 97 − 1,763 − 1,572Investment fund shares 3 − 6,932 − 1,991 − 5,821 − 3,038 − 341 − 654 − 143 + 462 − 1,053Long-termdebt securities 4 − 95,327 − 70,432 − 47,593 − 26,390 − 13,850 − 22,480 + 6,481 − 27,989 + 15,103Short-termdebt securities 5 + 471 − 17,039 + 1,815 + 7,900 + 3,811 − 4,740 + 1,011 − 11,538 + 9,755
3. Other investment 7 + 187,625 + 109,433 + 79,466 + 57,124 + 12,268 − 52,893 − 6,154 − 5,221 − 53,982
Monetary financial institutions 8 + 86,742 + 17,476 − 35,965 + 19,374 + 8,519 − 108,955 − 20,620 − 75,434 + 68,246Long-term + 5,774 + 7,541 − 8,496 + 3,309 − 3,878 − 509 − 574 − 1,790 − 442Short-term + 80,968 + 9,935 − 27,469 + 16,065 + 12,397 − 108,446 − 20,046 − 73,643 + 68,688
Enterprises andhouseholds 9 − 4,658 + 23,541 + 15,750 + 16,481 + 14,391 − 19,053 + 6,661 − 17,237 + 6,605
Long-term + 78 + 8,855 + 8,259 + 9,585 − 2,054 − 1,417 − 369 − 1,225 + 3,289Short-term − 4,736 + 14,687 + 7,491 + 6,896 + 16,445 − 17,636 + 7,031 − 16,012 + 3,316
General government − 5,309 − 8,719 + 2,890 − 595 + 4,069 − 4,205 − 438 − 7,219 − 4,564Long-term − 4,682 − 3,723 + 660 + 151 + 101 + 402 + 323 + 65 − 1Short-term − 626 − 4,996 + 2,230 − 746 + 3,968 − 4,607 − 761 − 7,284 − 4,563
Bundesbank + 110,849 + 77,135 + 96,792 + 21,864 − 14,710 + 79,319 + 8,243 + 94,668 − 124,269
III. Net financial account(net lending: +/net borrowing: -) + 259,720 + 282,947 + 225,597 + 56,803 + 39,839 + 61,614 + 25,512 + 33,164 + 18,026
1 Estimate based on data on direct investment stocks abroad and in the Federal arising from options and financial futures contracts as well as employee stockRepublic of Germany (see Special Statistical Publication 10). 2 Including participation options. 7 Includes in particular loans, trade credits as well as currency and deposits.certificates. 3 Including reinvestment of earnings. 4 Up to and including 2012 8 Excluding Bundesbank. 9 Includes the following sectors: financial corporationswithout accrued interest. Long-term: original maturity of more than one year or (excluding monetary financial institutions) as well as non-financial corporations,unlimited. 5 Short-term: original maturity up to one year. 6 Balance of transactions households and non-profit institutions serving households.
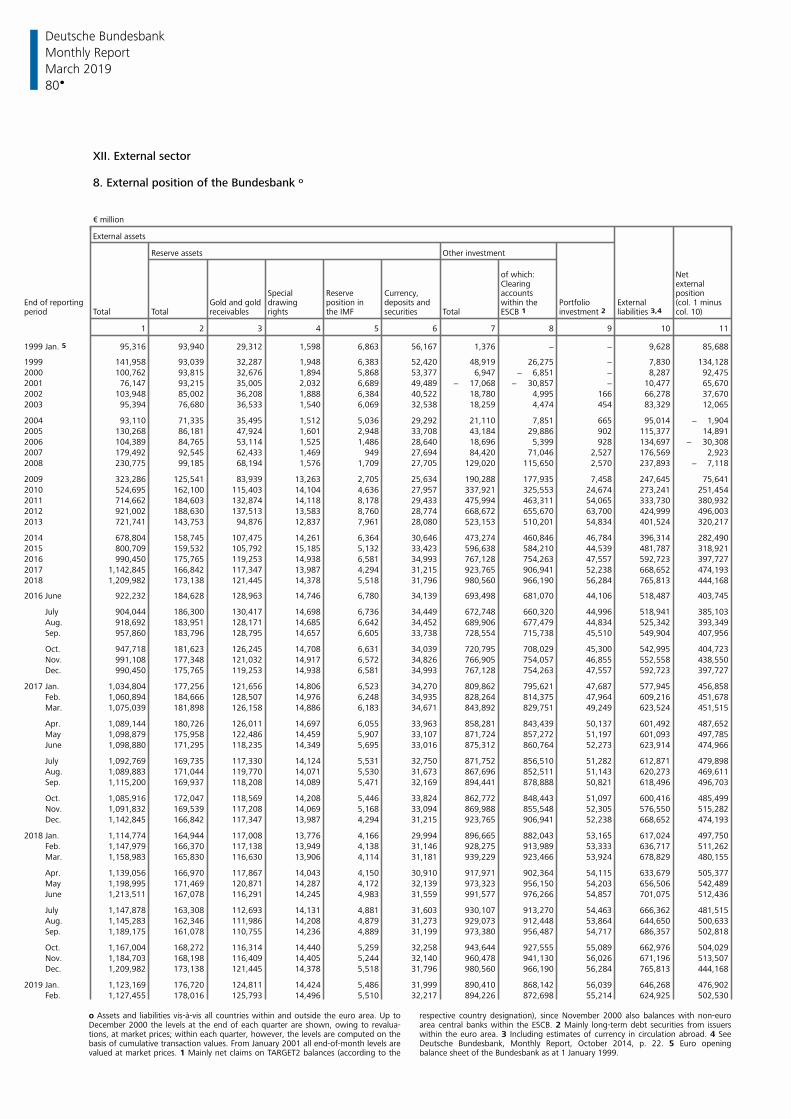
Deutsche Bundesbank
80
Monthly Report
March 2019
XII. External sector
8. External position of the Bundesbank o
€ million
External assets
Reserve assets Other investment
of which: NetClearing external
Special Reserve Currency, accounts positiondrawing within the Portfolio ExternalGold and gold position in deposits and (col. 1 minusEnd of reporting
period Total Total rights the IMF securities Total ESCB 1 col. 10)receivables investment 2 liabilities 3,4
1 2 3 4 5 6 7 8 9 10 11
1999 Jan. 5 95,316 93,940 29,312 1,598 6,863 56,167 1,376 − − 9,628 85,688
1999 141,958 93,039 32,287 1,948 6,383 52,420 48,919 26,275 − 7,830 134,128
2000 100,762 93,815 32,676 1,894 5,868 53,377 6,947 − 6,851 − 8,287 92,475
2001 76,147 93,215 35,005 2,032 6,689 49,489 − 17,068 − 30,857 − 10,477 65,670
2002 103,948 85,002 36,208 1,888 6,384 40,522 18,780 4,995 166 66,278 37,670
2003 95,394 76,680 36,533 1,540 6,069 32,538 18,259 4,474 454 83,329 12,065
2004 93,110 71,335 35,495 1,512 5,036 29,292 21,110 7,851 665 95,014 − 1,904
2005 130,268 86,181 47,924 1,601 2,948 33,708 43,184 29,886 902 115,377 14,891
2006 104,389 84,765 53,114 1,525 1,486 28,640 18,696 5,399 928 134,697 − 30,308
2007 179,492 92,545 62,433 1,469 949 27,694 84,420 71,046 2,527 176,569 2,923
2008 230,775 99,185 68,194 1,576 1,709 27,705 129,020 115,650 2,570 237,893 − 7,118
2009 323,286 125,541 83,939 13,263 2,705 25,634 190,288 177,935 7,458 247,645 75,641
2010 524,695 162,100 115,403 14,104 4,636 27,957 337,921 325,553 24,674 273,241 251,454
2011 714,662 184,603 132,874 14,118 8,178 29,433 475,994 463,311 54,065 333,730 380,932
2012 921,002 188,630 137,513 13,583 8,760 28,774 668,672 655,670 63,700 424,999 496,003
2013 721,741 143,753 94,876 12,837 7,961 28,080 523,153 510,201 54,834 401,524 320,217
2014 678,804 158,745 107,475 14,261 6,364 30,646 473,274 460,846 46,784 396,314 282,490
2015 800,709 159,532 105,792 15,185 5,132 33,423 596,638 584,210 44,539 481,787 318,921
2016 990,450 175,765 119,253 14,938 6,581 34,993 767,128 754,263 47,557 592,723 397,727
2017 1,142,845 166,842 117,347 13,987 4,294 31,215 923,765 906,941 52,238 668,652 474,193
2018 1,209,982 173,138 121,445 14,378 5,518 31,796 980,560 966,190 56,284 765,813 444,168
2016 June 922,232 184,628 128,963 14,746 6,780 34,139 693,498 681,070 44,106 518,487 403,745
July 904,044 186,300 130,417 14,698 6,736 34,449 672,748 660,320 44,996 518,941 385,103
Aug. 918,692 183,951 128,171 14,685 6,642 34,452 689,906 677,479 44,834 525,342 393,349
Sep. 957,860 183,796 128,795 14,657 6,605 33,738 728,554 715,738 45,510 549,904 407,956
Oct. 947,718 181,623 126,245 14,708 6,631 34,039 720,795 708,029 45,300 542,995 404,723
Nov. 991,108 177,348 121,032 14,917 6,572 34,826 766,905 754,057 46,855 552,558 438,550
Dec. 990,450 175,765 119,253 14,938 6,581 34,993 767,128 754,263 47,557 592,723 397,727
2017 Jan. 1,034,804 177,256 121,656 14,806 6,523 34,270 809,862 795,621 47,687 577,945 456,858
Feb. 1,060,894 184,666 128,507 14,976 6,248 34,935 828,264 814,375 47,964 609,216 451,678
Mar. 1,075,039 181,898 126,158 14,886 6,183 34,671 843,892 829,751 49,249 623,524 451,515
Apr. 1,089,144 180,726 126,011 14,697 6,055 33,963 858,281 843,439 50,137 601,492 487,652
May 1,098,879 175,958 122,486 14,459 5,907 33,107 871,724 857,272 51,197 601,093 497,785
June 1,098,880 171,295 118,235 14,349 5,695 33,016 875,312 860,764 52,273 623,914 474,966
July 1,092,769 169,735 117,330 14,124 5,531 32,750 871,752 856,510 51,282 612,871 479,898
Aug. 1,089,883 171,044 119,770 14,071 5,530 31,673 867,696 852,511 51,143 620,273 469,611
Sep. 1,115,200 169,937 118,208 14,089 5,471 32,169 894,441 878,888 50,821 618,496 496,703
Oct. 1,085,916 172,047 118,569 14,208 5,446 33,824 862,772 848,443 51,097 600,416 485,499
Nov. 1,091,832 169,539 117,208 14,069 5,168 33,094 869,988 855,548 52,305 576,550 515,282
Dec. 1,142,845 166,842 117,347 13,987 4,294 31,215 923,765 906,941 52,238 668,652 474,193
2018 Jan. 1,114,774 164,944 117,008 13,776 4,166 29,994 896,665 882,043 53,165 617,024 497,750
Feb. 1,147,979 166,370 117,138 13,949 4,138 31,146 928,275 913,989 53,333 636,717 511,262
Mar. 1,158,983 165,830 116,630 13,906 4,114 31,181 939,229 923,466 53,924 678,829 480,155
Apr. 1,139,056 166,970 117,867 14,043 4,150 30,910 917,971 902,364 54,115 633,679 505,377
May 1,198,995 171,469 120,871 14,287 4,172 32,139 973,323 956,150 54,203 656,506 542,489
June 1,213,511 167,078 116,291 14,245 4,983 31,559 991,577 976,266 54,857 701,075 512,436
July 1,147,878 163,308 112,693 14,131 4,881 31,603 930,107 913,270 54,463 666,362 481,515
Aug. 1,145,283 162,346 111,986 14,208 4,879 31,273 929,073 912,448 53,864 644,650 500,633
Sep. 1,189,175 161,078 110,755 14,236 4,889 31,199 973,380 956,487 54,717 686,357 502,818
Oct. 1,167,004 168,272 116,314 14,440 5,259 32,258 943,644 927,555 55,089 662,976 504,029
Nov. 1,184,703 168,198 116,409 14,405 5,244 32,140 960,478 941,130 56,026 671,196 513,507
Dec. 1,209,982 173,138 121,445 14,378 5,518 31,796 980,560 966,190 56,284 765,813 444,168
2019 Jan. 1,123,169 176,720 124,811 14,424 5,486 31,999 890,410 868,142 56,039 646,268 476,902
Feb. 1,127,455 178,016 125,793 14,496 5,510 32,217 894,226 872,698 55,214 624,925 502,530
o Assets and liabilities vis-à-vis all countries within and outside the euro area. Up to respective country designation), since November 2000 also balances with non-euroDecember 2000 the levels at the end of each quarter are shown, owing to revalua- area central banks within the ESCB. 2 Mainly long-term debt securities from issuerstions, at market prices; within each quarter, however, the levels are computed on the within the euro area. 3 Including estimates of currency in circulation abroad. 4 Seebasis of cumulative transaction values. From January 2001 all end-of-month levels are Deutsche Bundesbank, Monthly Report, October 2014, p. 22. 5 Euro openingvalued at market prices. 1 Mainly net claims on TARGET2 balances (according to the balance sheet of the Bundesbank as at 1 January 1999.
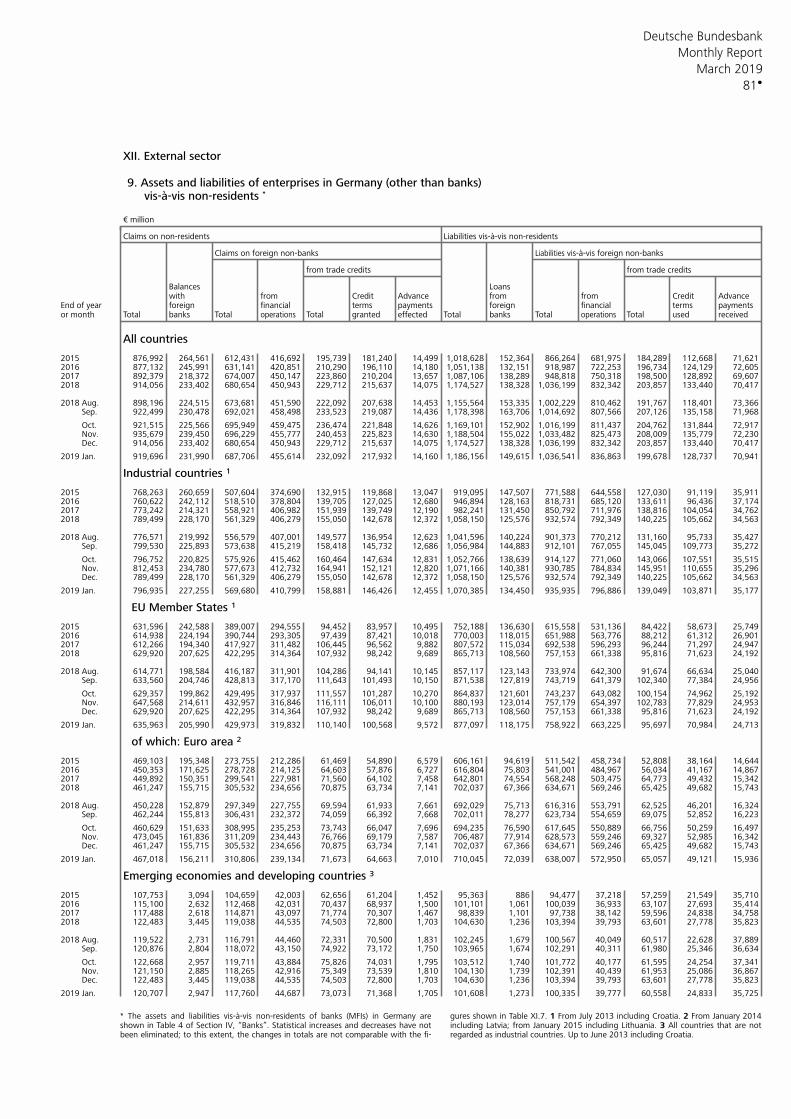
Deutsche Bundesbank
81
Monthly Report
March 2019
XII. External sector 9. Assets and liabilities of enterprises in Germany (other than banks)
vis-à-vis non-residents *
€ million
Claims on non-residents Liabilities vis-à-vis non-residents
Claims on foreign non-banks Liabilities vis-à-vis foreign non-banks
from trade credits from trade credits
Balances Loanswith from Credit Advance from from Credit Advance
End of year foreign financial terms payments foreign financial terms paymentsor month Total banks Total Total granted effected Total banks Total Total used receivedoperations operations
All countries
2015 876,992 264,561 612,431 416,692 195,739 181,240 14,499 1,018,628 152,364 866,264 681,975 184,289 112,668 71,6212016 877,132 245,991 631,141 420,851 210,290 196,110 14,180 1,051,138 132,151 918,987 722,253 196,734 124,129 72,6052017 892,379 218,372 674,007 450,147 223,860 210,204 13,657 1,087,106 138,289 948,818 750,318 198,500 128,892 69,6072018 914,056 233,402 680,654 450,943 229,712 215,637 14,075 1,174,527 138,328 1,036,199 832,342 203,857 133,440 70,417
2018 Aug. 898,196 224,515 673,681 451,590 222,092 207,638 14,453 1,155,564 153,335 1,002,229 810,462 191,767 118,401 73,366 Sep. 922,499 230,478 692,021 458,498 233,523 219,087 14,436 1,178,398 163,706 1,014,692 807,566 207,126 135,158 71,968
Oct. 921,515 225,566 695,949 459,475 236,474 221,848 14,626 1,169,101 152,902 1,016,199 811,437 204,762 131,844 72,917 Nov. 935,679 239,450 696,229 455,777 240,453 225,823 14,630 1,188,504 155,022 1,033,482 825,473 208,009 135,779 72,230 Dec. 914,056 233,402 680,654 450,943 229,712 215,637 14,075 1,174,527 138,328 1,036,199 832,342 203,857 133,440 70,417
2019 Jan. 919,696 231,990 687,706 455,614 232,092 217,932 14,160 1,186,156 149,615 1,036,541 836,863 199,678 128,737 70,941
Industrial countries 1 2015 768,263 260,659 507,604 374,690 132,915 119,868 13,047 919,095 147,507 771,588 644,558 127,030 91,119 35,9112016 760,622 242,112 518,510 378,804 139,705 127,025 12,680 946,894 128,163 818,731 685,120 133,611 96,436 37,1742017 773,242 214,321 558,921 406,982 151,939 139,749 12,190 982,241 131,450 850,792 711,976 138,816 104,054 34,7622018 789,499 228,170 561,329 406,279 155,050 142,678 12,372 1,058,150 125,576 932,574 792,349 140,225 105,662 34,563
2018 Aug. 776,571 219,992 556,579 407,001 149,577 136,954 12,623 1,041,596 140,224 901,373 770,212 131,160 95,733 35,427 Sep. 799,530 225,893 573,638 415,219 158,418 145,732 12,686 1,056,984 144,883 912,101 767,055 145,045 109,773 35,272
Oct. 796,752 220,825 575,926 415,462 160,464 147,634 12,831 1,052,766 138,639 914,127 771,060 143,066 107,551 35,515 Nov. 812,453 234,780 577,673 412,732 164,941 152,121 12,820 1,071,166 140,381 930,785 784,834 145,951 110,655 35,296 Dec. 789,499 228,170 561,329 406,279 155,050 142,678 12,372 1,058,150 125,576 932,574 792,349 140,225 105,662 34,563
2019 Jan. 796,935 227,255 569,680 410,799 158,881 146,426 12,455 1,070,385 134,450 935,935 796,886 139,049 103,871 35,177
EU Member States 1 2015 631,596 242,588 389,007 294,555 94,452 83,957 10,495 752,188 136,630 615,558 531,136 84,422 58,673 25,7492016 614,938 224,194 390,744 293,305 97,439 87,421 10,018 770,003 118,015 651,988 563,776 88,212 61,312 26,9012017 612,266 194,340 417,927 311,482 106,445 96,562 9,882 807,572 115,034 692,538 596,293 96,244 71,297 24,9472018 629,920 207,625 422,295 314,364 107,932 98,242 9,689 865,713 108,560 757,153 661,338 95,816 71,623 24,192
2018 Aug. 614,771 198,584 416,187 311,901 104,286 94,141 10,145 857,117 123,143 733,974 642,300 91,674 66,634 25,040 Sep. 633,560 204,746 428,813 317,170 111,643 101,493 10,150 871,538 127,819 743,719 641,379 102,340 77,384 24,956
Oct. 629,357 199,862 429,495 317,937 111,557 101,287 10,270 864,837 121,601 743,237 643,082 100,154 74,962 25,192 Nov. 647,568 214,611 432,957 316,846 116,111 106,011 10,100 880,193 123,014 757,179 654,397 102,783 77,829 24,953 Dec. 629,920 207,625 422,295 314,364 107,932 98,242 9,689 865,713 108,560 757,153 661,338 95,816 71,623 24,192
2019 Jan. 635,963 205,990 429,973 319,832 110,140 100,568 9,572 877,097 118,175 758,922 663,225 95,697 70,984 24,713
of which: Euro area 2 2015 469,103 195,348 273,755 212,286 61,469 54,890 6,579 606,161 94,619 511,542 458,734 52,808 38,164 14,6442016 450,353 171,625 278,728 214,125 64,603 57,876 6,727 616,804 75,803 541,001 484,967 56,034 41,167 14,8672017 449,892 150,351 299,541 227,981 71,560 64,102 7,458 642,801 74,554 568,248 503,475 64,773 49,432 15,3422018 461,247 155,715 305,532 234,656 70,875 63,734 7,141 702,037 67,366 634,671 569,246 65,425 49,682 15,743
2018 Aug. 450,228 152,879 297,349 227,755 69,594 61,933 7,661 692,029 75,713 616,316 553,791 62,525 46,201 16,324 Sep. 462,244 155,813 306,431 232,372 74,059 66,392 7,668 702,011 78,277 623,734 554,659 69,075 52,852 16,223
Oct. 460,629 151,633 308,995 235,253 73,743 66,047 7,696 694,235 76,590 617,645 550,889 66,756 50,259 16,497 Nov. 473,045 161,836 311,209 234,443 76,766 69,179 7,587 706,487 77,914 628,573 559,246 69,327 52,985 16,342 Dec. 461,247 155,715 305,532 234,656 70,875 63,734 7,141 702,037 67,366 634,671 569,246 65,425 49,682 15,743
2019 Jan. 467,018 156,211 310,806 239,134 71,673 64,663 7,010 710,045 72,039 638,007 572,950 65,057 49,121 15,936
Emerging economies and developing countries 3 2015 107,753 3,094 104,659 42,003 62,656 61,204 1,452 95,363 886 94,477 37,218 57,259 21,549 35,7102016 115,100 2,632 112,468 42,031 70,437 68,937 1,500 101,101 1,061 100,039 36,933 63,107 27,693 35,4142017 117,488 2,618 114,871 43,097 71,774 70,307 1,467 98,839 1,101 97,738 38,142 59,596 24,838 34,7582018 122,483 3,445 119,038 44,535 74,503 72,800 1,703 104,630 1,236 103,394 39,793 63,601 27,778 35,823
2018 Aug. 119,522 2,731 116,791 44,460 72,331 70,500 1,831 102,245 1,679 100,567 40,049 60,517 22,628 37,889 Sep. 120,876 2,804 118,072 43,150 74,922 73,172 1,750 103,965 1,674 102,291 40,311 61,980 25,346 36,634
Oct. 122,668 2,957 119,711 43,884 75,826 74,031 1,795 103,512 1,740 101,772 40,177 61,595 24,254 37,341 Nov. 121,150 2,885 118,265 42,916 75,349 73,539 1,810 104,130 1,739 102,391 40,439 61,953 25,086 36,867 Dec. 122,483 3,445 119,038 44,535 74,503 72,800 1,703 104,630 1,236 103,394 39,793 63,601 27,778 35,823
2019 Jan. 120,707 2,947 117,760 44,687 73,073 71,368 1,705 101,608 1,273 100,335 39,777 60,558 24,833 35,725
* The assets and liabilities vis-à-vis non-residents of banks (MFIs) in Germany are gures shown in Table XI.7. 1 From July 2013 including Croatia. 2 From January 2014shown in Table 4 of Section IV, “Banks”. Statistical increases and decreases have not including Latvia; from January 2015 including Lithuania. 3 All countries that are notbeen eliminated; to this extent, the changes in totals are not comparable with the fi- regarded as industrial countries. Up to June 2013 including Croatia.
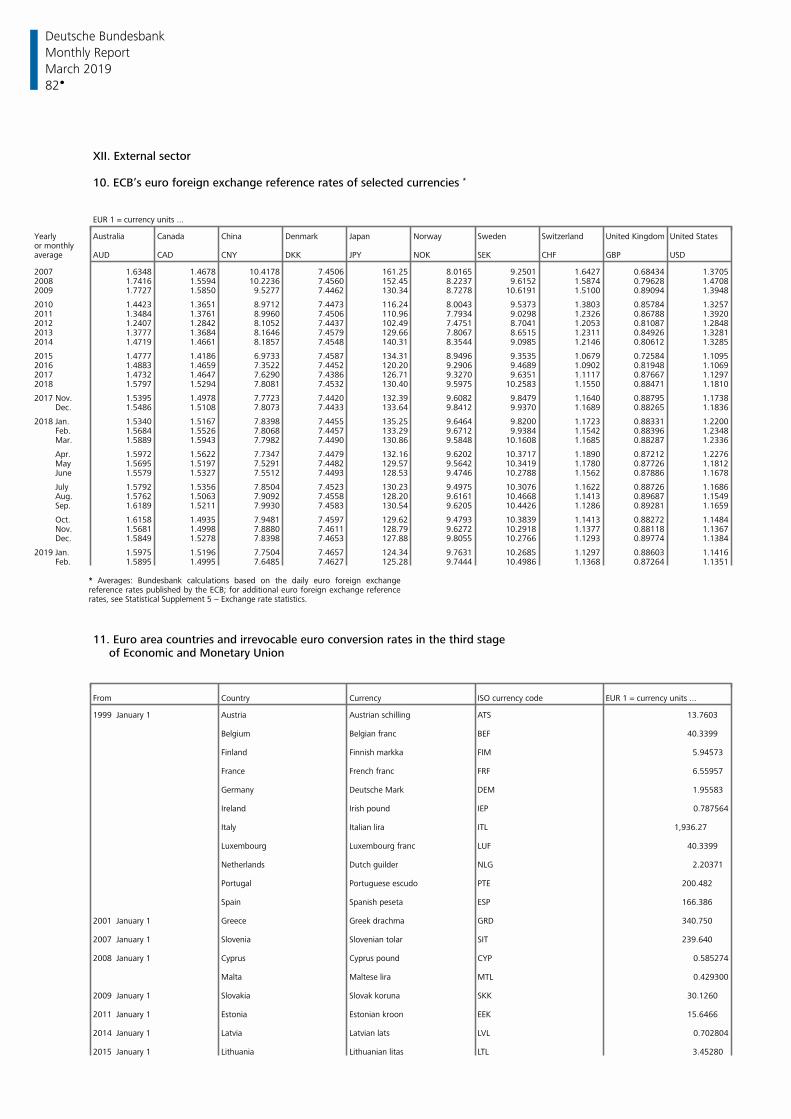
Deutsche Bundesbank
82
Monthly Report
March 2019
XII. External sector
10. ECB’s euro foreign exchange reference rates of selected currencies *
EUR 1 = currency units ...
Yearly Australia Canada China Denmark Japan Norway Sweden Switzerland United StatesUnited Kingdomor monthly average AUD CAD CNY DKK JPY NOK SEK CHF GBP USD
2007 1.6348 1.4678 10.4178 7.4506 161.25 8.0165 9.2501 1.6427 0.68434 1.37052008 1.7416 1.5594 10.2236 7.4560 152.45 8.2237 9.6152 1.5874 0.79628 1.47082009 1.7727 1.5850 9.5277 7.4462 130.34 8.7278 10.6191 1.5100 0.89094 1.3948
2010 1.4423 1.3651 8.9712 7.4473 116.24 8.0043 9.5373 1.3803 0.85784 1.32572011 1.3484 1.3761 8.9960 7.4506 110.96 7.7934 9.0298 1.2326 0.86788 1.39202012 1.2407 1.2842 8.1052 7.4437 102.49 7.4751 8.7041 1.2053 0.81087 1.28482013 1.3777 1.3684 8.1646 7.4579 129.66 7.8067 8.6515 1.2311 0.84926 1.32812014 1.4719 1.4661 8.1857 7.4548 140.31 8.3544 9.0985 1.2146 0.80612 1.3285
2015 1.4777 1.4186 6.9733 7.4587 134.31 8.9496 9.3535 1.0679 0.72584 1.10952016 1.4883 1.4659 7.3522 7.4452 120.20 9.2906 9.4689 1.0902 0.81948 1.10692017 1.4732 1.4647 7.6290 7.4386 126.71 9.3270 9.6351 1.1117 0.87667 1.12972018 1.5797 1.5294 7.8081 7.4532 130.40 9.5975 10.2583 1.1550 0.88471 1.1810
2017 Nov. 1.5395 1.4978 7.7723 7.4420 132.39 9.6082 9.8479 1.1640 0.88795 1.1738 Dec. 1.5486 1.5108 7.8073 7.4433 133.64 9.8412 9.9370 1.1689 0.88265 1.1836
2018 Jan. 1.5340 1.5167 7.8398 7.4455 135.25 9.6464 9.8200 1.1723 0.88331 1.2200 Feb. 1.5684 1.5526 7.8068 7.4457 133.29 9.6712 9.9384 1.1542 0.88396 1.2348 Mar. 1.5889 1.5943 7.7982 7.4490 130.86 9.5848 10.1608 1.1685 0.88287 1.2336
Apr. 1.5972 1.5622 7.7347 7.4479 132.16 9.6202 10.3717 1.1890 0.87212 1.2276 May 1.5695 1.5197 7.5291 7.4482 129.57 9.5642 10.3419 1.1780 0.87726 1.1812 June 1.5579 1.5327 7.5512 7.4493 128.53 9.4746 10.2788 1.1562 0.87886 1.1678
July 1.5792 1.5356 7.8504 7.4523 130.23 9.4975 10.3076 1.1622 0.88726 1.1686 Aug. 1.5762 1.5063 7.9092 7.4558 128.20 9.6161 10.4668 1.1413 0.89687 1.1549 Sep. 1.6189 1.5211 7.9930 7.4583 130.54 9.6205 10.4426 1.1286 0.89281 1.1659
Oct. 1.6158 1.4935 7.9481 7.4597 129.62 9.4793 10.3839 1.1413 0.88272 1.1484 Nov. 1.5681 1.4998 7.8880 7.4611 128.79 9.6272 10.2918 1.1377 0.88118 1.1367 Dec. 1.5849 1.5278 7.8398 7.4653 127.88 9.8055 10.2766 1.1293 0.89774 1.1384
2019 Jan. 1.5975 1.5196 7.7504 7.4657 124.34 9.7631 10.2685 1.1297 0.88603 1.1416 Feb. 1.5895 1.4995 7.6485 7.4627 125.28 9.7444 10.4986 1.1368 0.87264 1.1351
* Averages: Bundesbank calculations based on the daily euro foreign exchange reference rates published by the ECB; for additional euro foreign exchange reference rates, see Statistical Supplement 5 − Exchange rate statistics.
11. Euro area countries and irrevocable euro conversion rates in the third stageof Economic and Monetary Union
From Country Currency ISO currency code EUR 1 = currency units ...
1999 January 1 Austria Austrian schilling ATS 13.7603
Belgium Belgian franc BEF 40.3399
Finland Finnish markka FIM 5.94573
France French franc FRF 6.55957
Germany Deutsche Mark DEM 1.95583
Ireland Irish pound IEP 0.787564
Italy Italian lira ITL 1,936.27
Luxembourg Luxembourg franc LUF 40.3399
Netherlands Dutch guilder NLG 2.20371
Portugal Portuguese escudo PTE 200.482
Spain Spanish peseta ESP 166.386
2001 January 1 Greece Greek drachma GRD 340.750
2007 January 1 Slovenia Slovenian tolar SIT 239.640
2008 January 1 Cyprus Cyprus pound CYP 0.585274
Malta Maltese lira MTL 0.429300
2009 January 1 Slovakia Slovak koruna SKK 30.1260
2011 January 1 Estonia Estonian kroon EEK 15.6466
2014 January 1 Latvia Latvian lats LVL 0.702804
2015 January 1 Lithuania Lithuanian litas LTL 3.45280
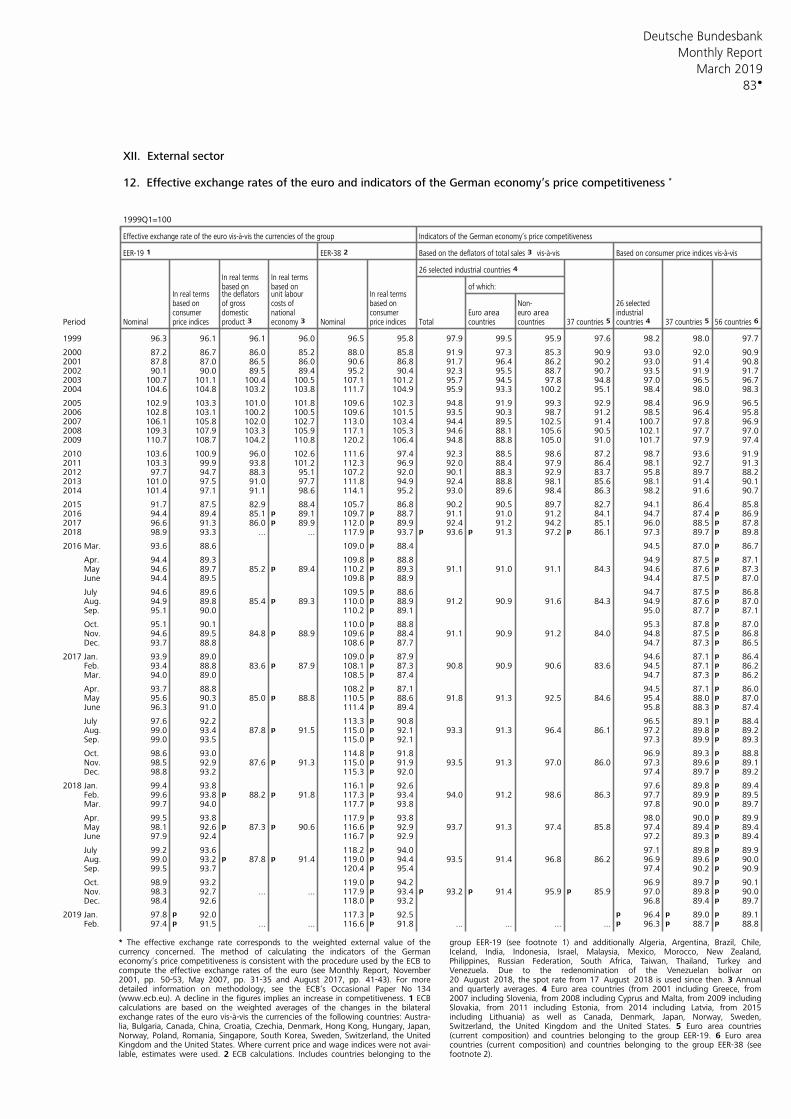
Deutsche Bundesbank
83
Monthly Report
March 2019
XII. External sector
12. Effective exchange rates of the euro and indicators of the German economy’s price competitiveness *
1999Q1=100
Indicators of the German economy’s price competitivenessEffective exchange rate of the euro vis-à-vis the currencies of the group
EER-19 1 EER-38 2 Based on the deflators of total sales 3 vis-à-vis Based on consumer price indices vis-à-vis
26 selected industrial countries 4 In real terms In real terms
of which:based on based onIn real terms the deflators unit labour In real termsbased on of gross costs of based on Non- 26 selectedconsumer domestic national consumer Euro area euro area industrial
Period Nominal price indices product 3 economy 3 Nominal price indices Total countries countries 37 countries 5 countries 4 37 countries 5 56 countries 6
1999 96.3 96.1 96.1 96.0 96.5 95.8 97.9 99.5 95.9 97.6 98.2 98.0 97.7
2000 87.2 86.7 86.0 85.2 88.0 85.8 91.9 97.3 85.3 90.9 93.0 92.0 90.92001 87.8 87.0 86.5 86.0 90.6 86.8 91.7 96.4 86.2 90.2 93.0 91.4 90.82002 90.1 90.0 89.5 89.4 95.2 90.4 92.3 95.5 88.7 90.7 93.5 91.9 91.72003 100.7 101.1 100.4 100.5 107.1 101.2 95.7 94.5 97.8 94.8 97.0 96.5 96.72004 104.6 104.8 103.2 103.8 111.7 104.9 95.9 93.3 100.2 95.1 98.4 98.0 98.3
2005 102.9 103.3 101.0 101.8 109.6 102.3 94.8 91.9 99.3 92.9 98.4 96.9 96.52006 102.8 103.1 100.2 100.5 109.6 101.5 93.5 90.3 98.7 91.2 98.5 96.4 95.82007 106.1 105.8 102.0 102.7 113.0 103.4 94.4 89.5 102.5 91.4 100.7 97.8 96.92008 109.3 107.9 103.3 105.9 117.1 105.3 94.6 88.1 105.6 90.5 102.1 97.7 97.02009 110.7 108.7 104.2 110.8 120.2 106.4 94.8 88.8 105.0 91.0 101.7 97.9 97.4
2010 103.6 100.9 96.0 102.6 111.6 97.4 92.3 88.5 98.6 87.2 98.7 93.6 91.92011 103.3 99.9 93.8 101.2 112.3 96.9 92.0 88.4 97.9 86.4 98.1 92.7 91.32012 97.7 94.7 88.3 95.1 107.2 92.0 90.1 88.3 92.9 83.7 95.8 89.7 88.22013 101.0 97.5 91.0 97.7 111.8 94.9 92.4 88.8 98.1 85.6 98.1 91.4 90.12014 101.4 97.1 91.1 98.6 114.1 95.2 93.0 89.6 98.4 86.3 98.2 91.6 90.7
2015 91.7 87.5 82.9 88.4 105.7 86.8 90.2 90.5 89.7 82.7 94.1 86.4 85.82016 94.4 89.4 85.1 p 89.1 109.7 p 88.7 91.1 91.0 91.2 84.1 94.7 87.4 p 86.92017 96.6 91.3 86.0 p 89.9 112.0 p 89.9 92.4 91.2 94.2 85.1 96.0 88.5 p 87.82018 98.9 93.3 ... ... 117.9 p 93.7 p 93.6 p 91.3 97.2 p 86.1 97.3 89.7 p 89.8
2016 Mar. 93.6 88.6 109.0 p 88.4 94.5 87.0 p 86.7
Apr. 94.4 89.3 109.8 p 88.8 94.9 87.5 p 87.1 May 94.6 89.7 85.2 p 89.4 110.2 p 89.3 91.1 91.0 91.1 84.3 94.6 87.6 p 87.3 June 94.4 89.5 109.8 p 88.9 94.4 87.5 p 87.0
July 94.6 89.6 109.5 p 88.6 94.7 87.5 p 86.8 Aug. 94.9 89.8 85.4 p 89.3 110.0 p 88.9 91.2 90.9 91.6 84.3 94.9 87.6 p 87.0 Sep. 95.1 90.0 110.2 p 89.1 95.0 87.7 p 87.1
Oct. 95.1 90.1 110.0 p 88.8 95.3 87.8 p 87.0 Nov. 94.6 89.5 84.8 p 88.9 109.6 p 88.4 91.1 90.9 91.2 84.0 94.8 87.5 p 86.8 Dec. 93.7 88.8 108.6 p 87.7 94.7 87.3 p 86.5
2017 Jan. 93.9 89.0 109.0 p 87.9 94.6 87.1 p 86.4 Feb. 93.4 88.8 83.6 p 87.9 108.1 p 87.3 90.8 90.9 90.6 83.6 94.5 87.1 p 86.2 Mar. 94.0 89.0 108.5 p 87.4 94.7 87.3 p 86.2
Apr. 93.7 88.8 108.2 p 87.1 94.5 87.1 p 86.0 May 95.6 90.3 85.0 p 88.8 110.5 p 88.6 91.8 91.3 92.5 84.6 95.4 88.0 p 87.0 June 96.3 91.0 111.4 p 89.4 95.8 88.3 p 87.4
July 97.6 92.2 113.3 p 90.8 96.5 89.1 p 88.4 Aug. 99.0 93.4 87.8 p 91.5 115.0 p 92.1 93.3 91.3 96.4 86.1 97.2 89.8 p 89.2 Sep. 99.0 93.5 115.0 p 92.1 97.3 89.9 p 89.3
Oct. 98.6 93.0 114.8 p 91.8 96.9 89.3 p 88.8 Nov. 98.5 92.9 87.6 p 91.3 115.0 p 91.9 93.5 91.3 97.0 86.0 97.3 89.6 p 89.1 Dec. 98.8 93.2 115.3 p 92.0 97.4 89.7 p 89.2
2018 Jan. 99.4 93.8 116.1 p 92.6 97.6 89.8 p 89.4 Feb. 99.6 93.8 p 88.2 p 91.8 117.3 p 93.4 94.0 91.2 98.6 86.3 97.7 89.9 p 89.5 Mar. 99.7 94.0 117.7 p 93.8 97.8 90.0 p 89.7
Apr. 99.5 93.8 117.9 p 93.8 98.0 90.0 p 89.9 May 98.1 92.6 p 87.3 p 90.6 116.6 p 92.9 93.7 91.3 97.4 85.8 97.4 89.4 p 89.4 June 97.9 92.4 116.7 p 92.9 97.2 89.3 p 89.4
July 99.2 93.6 118.2 p 94.0 97.1 89.8 p 89.9 Aug. 99.0 93.2 p 87.8 p 91.4 119.0 p 94.4 93.5 91.4 96.8 86.2 96.9 89.6 p 90.0 Sep. 99.5 93.7 120.4 p 95.4 97.4 90.2 p 90.9
Oct. 98.9 93.2 119.0 p 94.2 96.9 89.7 p 90.1 Nov. 98.3 92.7 ... ... 117.9 p 93.4 p 93.2 p 91.4 95.9 p 85.9 97.0 89.8 p 90.0 Dec. 98.4 92.6 118.0 p 93.2 96.8 89.4 p 89.7
2019 Jan. 97.8 p 92.0 117.3 p 92.5 p 96.4 p 89.0 p 89.1 Feb. 97.4 p 91.5 ... ... 116.6 p 91.8 ... ... ... ... p 96.3 p 88.7 p 88.8
* The effective exchange rate corresponds to the weighted external value of the group EER-19 (see footnote 1) and additionally Algeria, Argentina, Brazil, Chile,currency concerned. The method of calculating the indicators of the German Iceland, India, Indonesia, Israel, Malaysia, Mexico, Morocco, New Zealand,economy’s price competitiveness is consistent with the procedure used by the ECB to Philippines, Russian Federation, South Africa, Taiwan, Thailand, Turkey andcompute the effective exchange rates of the euro (see Monthly Report, November Venezuela. Due to the redenomination of the Venezuelan bolívar on2001, pp. 50-53, May 2007, pp. 31-35 and August 2017, pp. 41-43). For more 20 August 2018, the spot rate from 17 August 2018 is used since then. 3 Annualdetailed information on methodology, see the ECB’s Occasional Paper No 134 and quarterly averages. 4 Euro area countries (from 2001 including Greece, from(www.ecb.eu). A decline in the figures implies an increase in competitiveness. 1 ECB 2007 including Slovenia, from 2008 including Cyprus and Malta, from 2009 includingcalculations are based on the weighted averages of the changes in the bilateral Slovakia, from 2011 including Estonia, from 2014 including Latvia, from 2015exchange rates of the euro vis-à-vis the currencies of the following countries: Austra- including Lithuania) as well as Canada, Denmark, Japan, Norway, Sweden,lia, Bulgaria, Canada, China, Croatia, Czechia, Denmark, Hong Kong, Hungary, Japan, Switzerland, the United Kingdom and the United States. 5 Euro area countriesNorway, Poland, Romania, Singapore, South Korea, Sweden, Switzerland, the United (current composition) and countries belonging to the group EER-19. 6 Euro areaKingdom and the United States. Where current price and wage indices were not avai- countries (current composition) and countries belonging to the group EER-38 (seelable, estimates were used. 2 ECB calculations. Includes countries belonging to the footnote 2).

Deutsche Bundesbank Monthly Report March 2019 84•
Overview of publications by the Deutsche Bundesbank
This overview provides information about selected recent economic and statistical publica-
tions by the Deutsche Bundesbank. Unless otherwise indicated, these publications are avail-
able in both English and German, in printed form and on the Bundesbank’s website.
The publications are available free of charge from the External Communication Division.
Up-to-date figures for some statistical datasets are also available on the Bundesbank’s web-
site.
Annual Report
Financial Stability Review
Monthly Report
For information on the articles published be-
tween 2000 and 2018 see the index attached
to the January 2019 Monthly Report.
Monthly Report articles
April 2018– Wage growth in Germany: assessment and
determinants of recent developments
– Germany’s external position: new statistical
approaches and results since the financial
crisis
– Current regulatory developments in the field
of payments and in the settlement of secur-
ities and derivatives
– Maastricht debt: methodological principles,
compilation and development in Germany
May 2018– The current economic situation in Germany
June 2018– Outlook for the German economy – macro-
economic projections for 2018 and 2019 and
an outlook for 2020
– Lower bound, inflation target and the an-
choring of inflation expectations
July 2018– The market for Federal securities: holder
structure and the main drivers of yield move-
ments
– The realignment of the Chinese economy
and its global implications
– Trends in the financing structures of German
non- financial corporations as reflected in the
corporate financial statements statistics
August 2018– The current economic situation in Germany
September 2018– Models for short- term economic forecasts:
an update
– The performance of German credit institu-
tions in 2017
October 2018– State government finances: comparison of
developments, debt brakes and fiscal surveil-
lance
– The macroeconomic impact of uncertainty
Deutsche Bundesbank Monthly Report
March 2019 85•
– Activities of multinational enterprise groups
and national economic statistics
– The growing importance of exchange- traded
funds in the financial markets
November 2018– The current economic situation in Germany
December 2018– Outlook for the German economy – macro-
economic projections for 2019 and 2020 and
an outlook for 2021
– German enterprises’ profitability and finan-
cing in 2017
– Germany’s international investment position:
amount, profitability and risks of cross-
border assets
January 2019– The impact of an interest rate normalisation
on the private non- financial sector in the
euro area from a balance sheet perspective
– Price competitiveness in individual euro area
countries: developments, drivers and the in-
fluence of labour market reforms
– Financial cycles in the euro area
– IFRS 9 from the perspective of banking super-
vision
February 2019– The current economic situation in Germany
March 2019– German balance of payments in 2018
– Cash demand in the shadow economy
Statistical Supplements to the Monthly Report
1 Banking statistics1, 2
2 Capital market statistics1, 2
3 Balance of payments statistics1, 2
4 Seasonally adjusted business statistics1, 2
5 Exchange rate statistics2
Special Publications
Makro-ökonometrisches Mehr-Länder-Modell,
November 1996 3
Europäische Organisationen und Gremien im
Bereich von Währung und Wirtschaft, May
19973
Die Zahlungsbilanz der ehemaligen DDR 1975
bis 1989, August 19993
The market for German Federal securities,
May 2000
Macro-Econometric Multi-Country Model:
MEMMOD, June 2000
Bundesbank Act, September 2002
Weltweite Organisationen und Gremien im
Bereich von Währung und Wirtschaft, March
20133
Die Europäische Union: Grundlagen und Politik-
bereiche außerhalb der Wirtschafts- und Wäh-
rungsunion, April 20053
Die Deutsche Bundesbank – Aufgabenfelder,
rechtlicher Rahmen, Geschichte, April 20063
European economic and monetary union, April
2008
For footnotes, see p. 88•.
Deutsche Bundesbank Monthly Report March 2019 86•
Special Statistical Publications
1 Banking statistics guidelines,
January 20192, 4
2 Banking statistics customer classification,
January 20192
3 Aufbau der bankstatistischen Tabellen,
July 20132, 3
4 Financial accounts for Germany 2012 to
2017, July 20182
5 Extrapolated results from financial state-
ments of German enterprises 1997 to 2016,
December 20172
6 Verhältniszahlen aus Jahresabschlüssen
deutscher Unternehmen von 2014 bis 2015,
May 20182, 3
7 Notes on the coding list for the balance of
payments statistics, September 20132
8 The balance of payments statistics of the
Federal Republic of Germany, 2nd edition,
February 1991o
9 Securities deposits, August 2005
10 Foreign direct investment stock statistics,
April 20181, 2
11 Balance of payments by region,
July 2013
12 Technologische Dienstleistungen in der
Zahlungsbilanz, June 20113
Discussion Papers*
57/2018
Credit crunches from occasionally binding bank
borrowing constraints
01/2019
The interest rate exposure of euro area house-
holds
02/2019
Monetary policy, housing, and collateral con-
straints
03/2019
Who benefits from using property taxes to
finance a labor tax wedge reduction?
04/2019
Anatomy of regional price differentials: Evi-
dence from micro price data
05/2019
What drives the short-term fluctuations of
banks’ exposure to interest rate risk?
06/2019
Connectedness between G10 currencies:
Searching for the causal structure
07/ 2019
Information effects of euro area monetary
policy : New evidence from high- frequency
futures data
08/ 2019
The nonlinear dynamics of corporate bond
spreads: Regime- dependent effects of their
determinants
09/ 2019
Model and estimation risk in credit risk stress
tests
o Not available on the website.* As of 2000 these publications have been made available on the Bundesbank’s website in German and English. Since the beginning of 2012, no longer subdivided into series 1 and series 2.For footnotes, see p. 88•.
Deutsche Bundesbank Monthly Report
March 2019 87•

Banking legislation
1 Bundesbank Act, July 2013, and Statute
of the European System of Central Banks
and of the European Central Bank, June
1998
2 Banking Act, July 20142
2a Solvency Regulation, December 20062
Liquidity Regulation, December 20062
1 Only the headings and explanatory notes to the data con-tained in the German originals are available in English.2 Available on the website only.3 Available in German only.4 Only some parts of the Special Statistical Publications are provided in English. The date refers to the German issue, which may be of a more recent date than the English one.
Deutsche Bundesbank Monthly Report March 2019 88•
![Untitled-1 [ ] · PDF fileSoftstopp Pro is a world-first damping system that provides dampened opening. Combined with ... Both systems are height-adjustable](https://img.pdfslide.us/doc/110x75/5aa840c87f8b9a77188b5654/untitled-1-pro-is-a-world-first-damping-system-that-provides-dampened-opening.jpg)