Embed Size (px)
Citation preview
Biology EOC Study Guide: Part 1, Ecology
Washington State Life Sciences Content Standards and Student Performance Expectations
Content Standard “A” (9-11 LS2A) Student Performance Expectation
Students know that: Students are expected to:
Matter cycles and energy flows through living and
nonliving components in ecosystems. The transfer of
matter and energy is important for maintaining the health and sustainability of an ecosystem.
Explain how plants and animals cycle carbon and
nitrogen within an ecosystem.
Explain how matter cycles and energy flows in
ecosystems, resulting in the formation of differing
chemical compounds and heat.
In other words:
When studying ecosystems, we look at two different things: (1) The flow of energy and (2) the cycling of
nutrients. Because nutrients are made of solid atoms and molecules, they never disappear from the face of
the Earth. They just get rearranged into many different molecules. That is, they are constantly being recycled. Thus we say that “nutrients cycle.” Energy, on the other hand, is not a particle, although it is
stored in the chemical bonds between atoms. But as atoms get rearranged, a little bit of energy is always
given off as heat. Eventually energy that has come into a system will all dissipate as heat. Thus, energy
(e.g., from the sun) has to constantly come into the system. Thus we say that “energy flows.”
Important notes:
All organisms expend energy (e.g., for growth, reproduction, metabolic processes).
- Organisms cannot create their own energy. Most use energy from the sun. Some use chemical energy
stored in inorganic compounds. o Autotrophs = primary producers = the first producers of energy-rich
compounds that are later used by other organisms.
o Only autotrophs (algae, certain bacteria, and plants) can capture energy from the sun or chemical compounds and use it to assemble inorganic
compounds into complex organic molecules.
- Energy From the Sun o Photosynthesis uses light energy to convert carbon dioxide and water
into oxygen and energy-rich carbohydrates such as sugars and starches.
Photosynthesis takes CO2 from the air and adds O2. Accomplished by
plants on land, algae in freshwaters, and cyanobacteria in oceans.
- Energy from inorganic molecules
o In the process called chemosynthesis, bacteria harness chemical energy
from inorganic molecules (such as hydrogen sulfide) to produce carbohydrates. Often live in extreme environments = deep ocean vents,
hot springs, etc.
Food Chains and Food Webs: How does energy flow
through ecosystems?
- Energy flows through an ecosystem in a one-way stream,
from primary producers to various consumers.
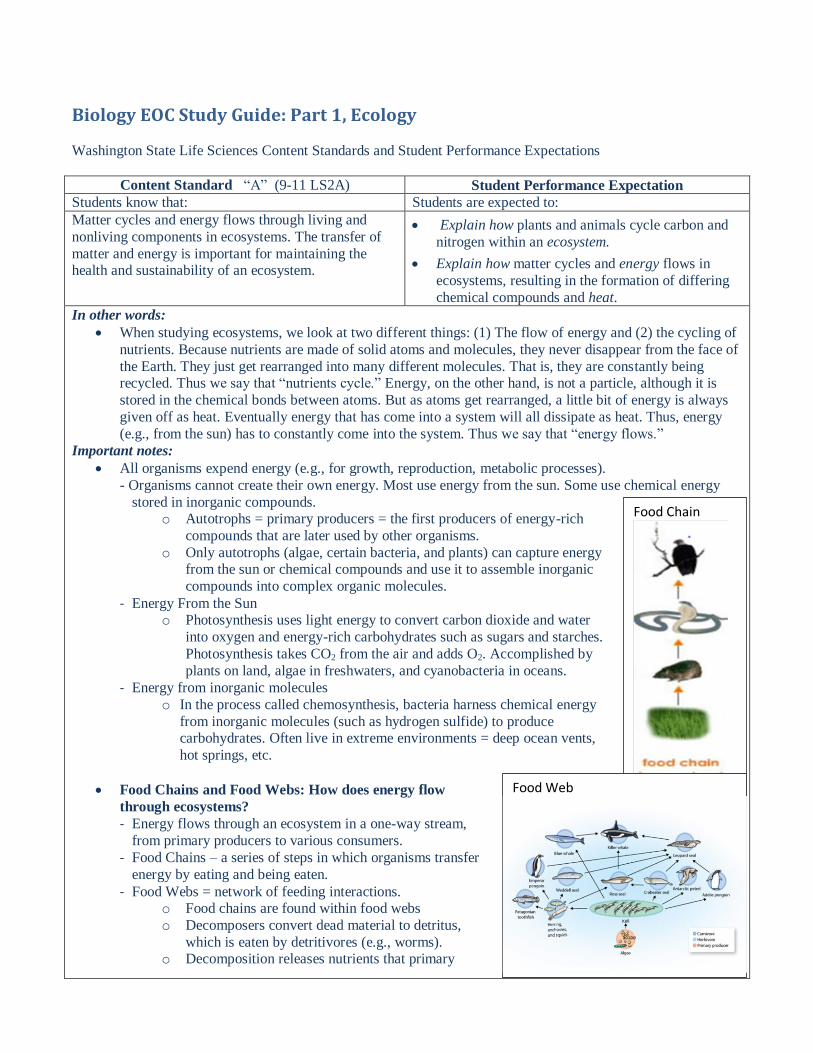
- Food Chains – a series of steps in which organisms transfer
energy by eating and being eaten.
- Food Webs = network of feeding interactions. o Food chains are found within food webs
o Decomposers convert dead material to detritus,
which is eaten by detritivores (e.g., worms). o Decomposition releases nutrients that primary
Food Chain
Food Web
producers can then recycle
o Without decomposers, nutrients would remain locked within dead organisms and life on Earth would stop.
- Food Webs and Disturbances – Because food webs are so complex, it is difficult to predict how they
will be affected by an environmental disturbance.
Trophic Levels and Ecological Pyramids: What do the three
types of ecological pyramids illustrate?
- Trophic Level = each step in a food chain or food web. o First level is always primary producers; various
consumers occupy the other levels.
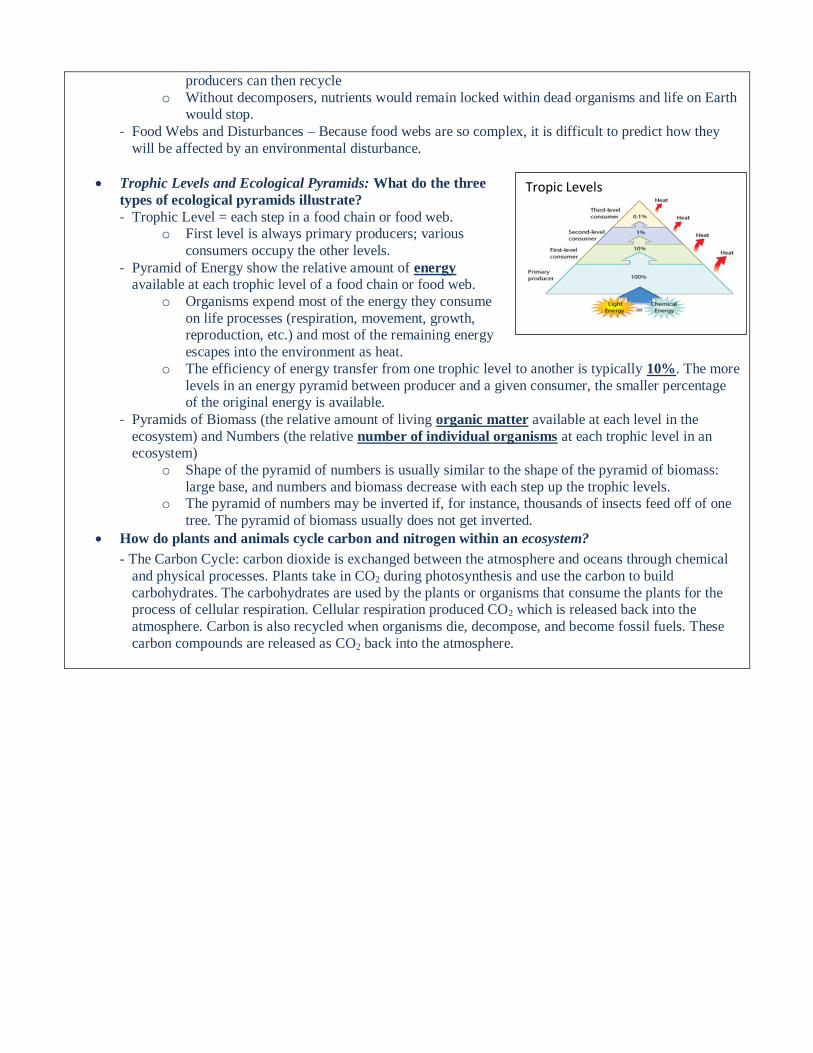
- Pyramid of Energy show the relative amount of energy available at each trophic level of a food chain or food web.
o Organisms expend most of the energy they consume
on life processes (respiration, movement, growth, reproduction, etc.) and most of the remaining energy
escapes into the environment as heat.
o The efficiency of energy transfer from one trophic level to another is typically 10%. The more
levels in an energy pyramid between producer and a given consumer, the smaller percentage of the original energy is available.
- Pyramids of Biomass (the relative amount of living organic matter available at each level in the
ecosystem) and Numbers (the relative number of individual organisms at each trophic level in an ecosystem)
o Shape of the pyramid of numbers is usually similar to the shape of the pyramid of biomass:
large base, and numbers and biomass decrease with each step up the trophic levels. o The pyramid of numbers may be inverted if, for instance, thousands of insects feed off of one
tree. The pyramid of biomass usually does not get inverted.
How do plants and animals cycle carbon and nitrogen within an ecosystem?
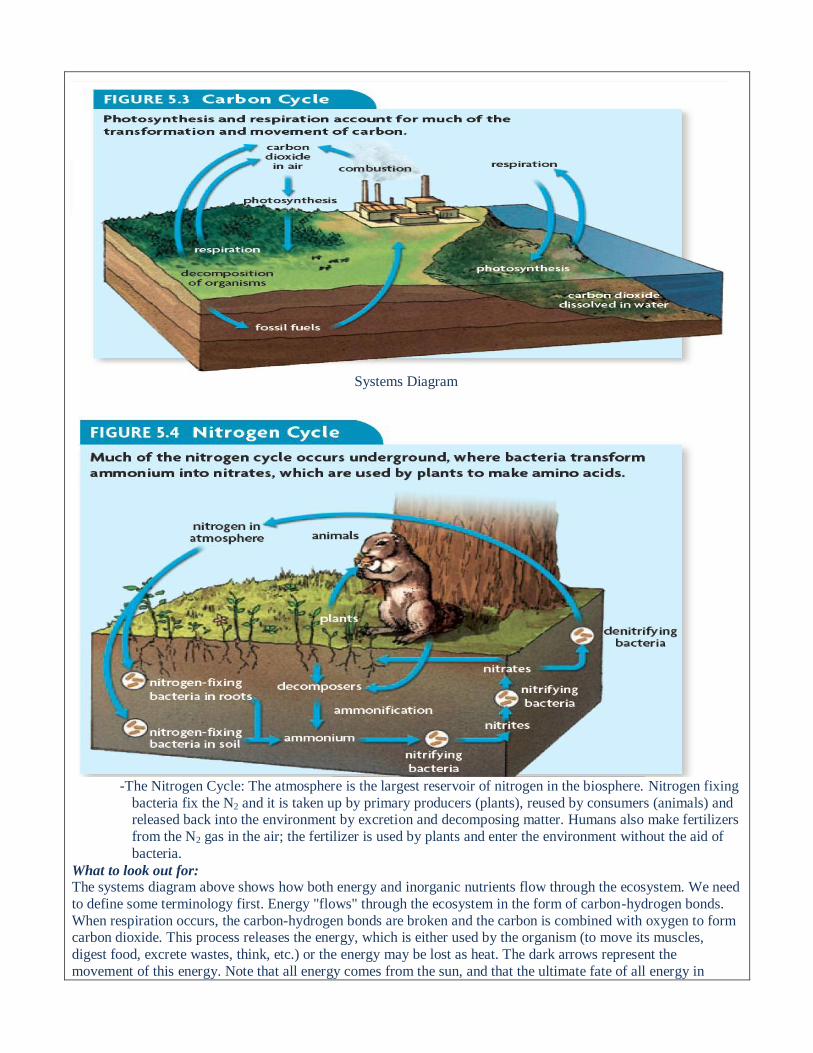
- The Carbon Cycle: carbon dioxide is exchanged between the atmosphere and oceans through chemical
and physical processes. Plants take in CO2 during photosynthesis and use the carbon to build
carbohydrates. The carbohydrates are used by the plants or organisms that consume the plants for the process of cellular respiration. Cellular respiration produced CO2 which is released back into the
atmosphere. Carbon is also recycled when organisms die, decompose, and become fossil fuels. These
carbon compounds are released as CO2 back into the atmosphere.
Tropic Levels
Systems Diagram
-The Nitrogen Cycle: The atmosphere is the largest reservoir of nitrogen in the biosphere. Nitrogen fixing
bacteria fix the N2 and it is taken up by primary producers (plants), reused by consumers (animals) and released back into the environment by excretion and decomposing matter. Humans also make fertilizers
from the N2 gas in the air; the fertilizer is used by plants and enter the environment without the aid of
bacteria.
What to look out for: The systems diagram above shows how both energy and inorganic nutrients flow through the ecosystem. We need
to define some terminology first. Energy "flows" through the ecosystem in the form of carbon-hydrogen bonds.
When respiration occurs, the carbon-hydrogen bonds are broken and the carbon is combined with oxygen to form carbon dioxide. This process releases the energy, which is either used by the organism (to move its muscles,
digest food, excrete wastes, think, etc.) or the energy may be lost as heat. The dark arrows represent the
movement of this energy. Note that all energy comes from the sun, and that the ultimate fate of all energy in
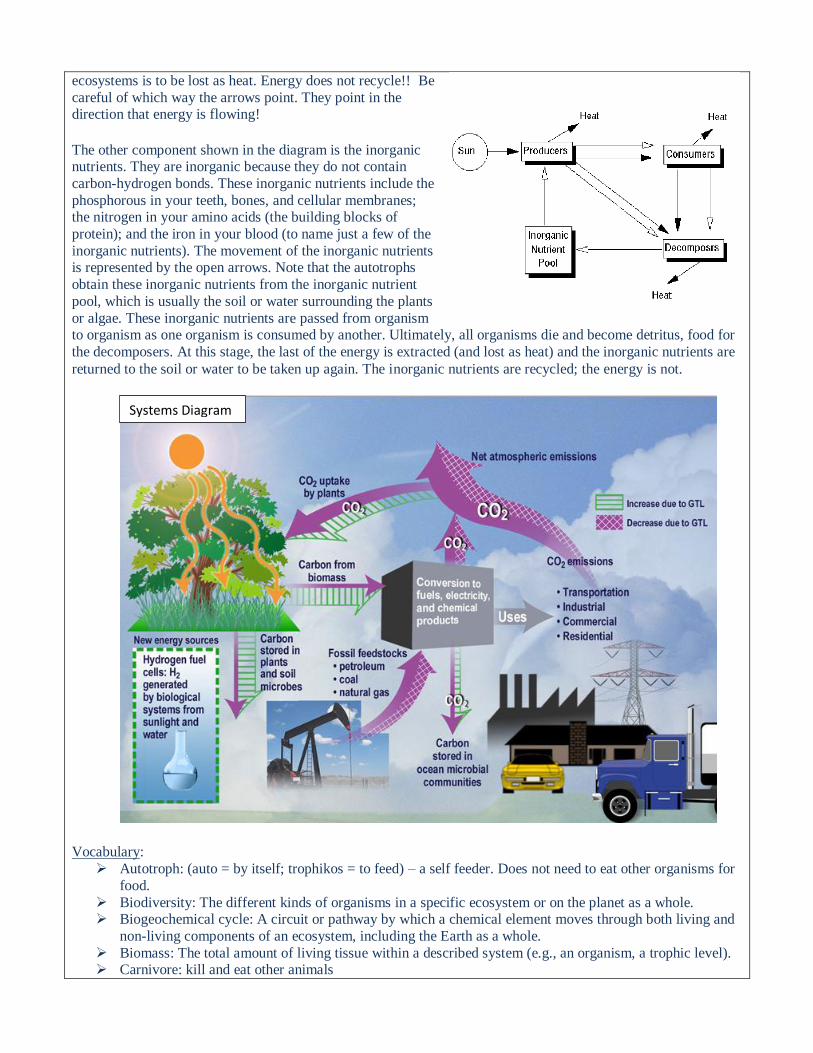
ecosystems is to be lost as heat. Energy does not recycle!! Be
careful of which way the arrows point. They point in the direction that energy is flowing!
The other component shown in the diagram is the inorganic nutrients. They are inorganic because they do not contain
carbon-hydrogen bonds. These inorganic nutrients include the
phosphorous in your teeth, bones, and cellular membranes; the nitrogen in your amino acids (the building blocks of
protein); and the iron in your blood (to name just a few of the
inorganic nutrients). The movement of the inorganic nutrients is represented by the open arrows. Note that the autotrophs
obtain these inorganic nutrients from the inorganic nutrient
pool, which is usually the soil or water surrounding the plants
or algae. These inorganic nutrients are passed from organism to organism as one organism is consumed by another. Ultimately, all organisms die and become detritus, food for
the decomposers. At this stage, the last of the energy is extracted (and lost as heat) and the inorganic nutrients are
returned to the soil or water to be taken up again. The inorganic nutrients are recycled; the energy is not.
Vocabulary:
Autotroph: (auto = by itself; trophikos = to feed) – a self feeder. Does not need to eat other organisms for
food.
Biodiversity: The different kinds of organisms in a specific ecosystem or on the planet as a whole. Biogeochemical cycle: A circuit or pathway by which a chemical element moves through both living and
non-living components of an ecosystem, including the Earth as a whole.
Biomass: The total amount of living tissue within a described system (e.g., an organism, a trophic level). Carnivore: kill and eat other animals
Systems Diagram
Systems Diagram
Chemosynthesis: bacteria harness chemical energy from inorganic molecules (such as hydrogen sulfide)
to produce carbohydrates Consumer: Organisms that rely on other organisms for energy and nutrients.
Decomposer: “feed” by chemically breaking down organic matter.
Denitrification: The process by which soil bacteria convert nitrates into nitrogen gas that enters the
atmosphere. Detritivores: feeds on detritus and often decomposers
Ecological pyramid: show the relative amount of energy or matter contained within each trophic level in a
given food chain or food web. Energy transfer: The movement of energy from one location to another.
Energy transformation: Change of energy from one form to another.
Environment: Natural surroundings, including living and nonliving components. May also refer to a
region or to all natural systems on planet Earth. Food chain: a series of steps in which organisms transfer energy by eating and being eaten.
Food web: a network of feeding interactions.
Food web: The complex eating relationships among species within an ecosystem. In a diagram of a food web organisms are connected to the organisms they consume by arrows representing the direction of
energy transfer.
Fossil Fuel: A substance that can be burned for heat energy, such as coal, oil, or natural gas, formed from
the decayed remains of prehistoric animals and plants.
Herbivore: eat plant material
Heterotroph: consumers - must acquire energy from other organisms, typically by ingesting them.
Input: The addition of matter, energy, or information to a system. Invasive Species- A non-native species
Limiting Factors- Components that control the growth of a population.
Nitrogen Fixation: The process of converting nitrogen gas into ammonia that plants absorb and use. Omnivore: eat both plant and animal material
Output: Matter, energy, or information that flows out of a system.
Photosynthesis: uses light energy to convert carbon dioxide and water into oxygen and energy-rich carbohydrates
Phytoplankton: floating algae = primary producers in many aquatic food chains.
Precipitation: Any product of the condensation of atmospheric water vapor deposited on Earth's surface,
such as rain, snow, or hail. Primary producer: (autotrophs) – are the first producers of energy-rich compounds that are later used by
other organisms.
Scavenger: consume the carcasses of other animals that are already dead. Secondary Consumer: An organism that eats primary producers. (example: A grasshopper eats a leaf.)
System: An assemblage of interrelated parts or conditions through which matter, energy, and information
flow. Trophic level: Each step in a food chain or a food web
Zooplankton: small swimming animals that feed on marine algae
Content Standard “B” (9-11 LS2B) Student Performance Expectation
Students know that: Students are expected to:
Living organisms have the capacity to produce very large populations. Population density is the number of
individuals of a particular population living in a given
amount of space.
Evaluate the conditions necessary for rapid population growth (e.g., given adequate living and
nonliving resources and no disease or predators,
populations of an organism increase at rapid rates).
Given ecosystem data, calculate the population
density of an organism.*a
In other words:
Population density = # of organisms/area they live in.
Given unlimited resources, populations will grow very rapidly. Resources include space, food, water,
mates, lack of predators, lack of diseases, etc.
Important notes:
Conditions necessary for rapid population growth
-Abiotic factors include
o Temperature, humidity, hours of light and dark, water resources, etc.
-Biotic factors include
o Adequate food, mates, places to live, places to raise young, etc.
Competition can occur both among members
of the same species (intraspecific
competition) and between members of different species (interspecific competition).
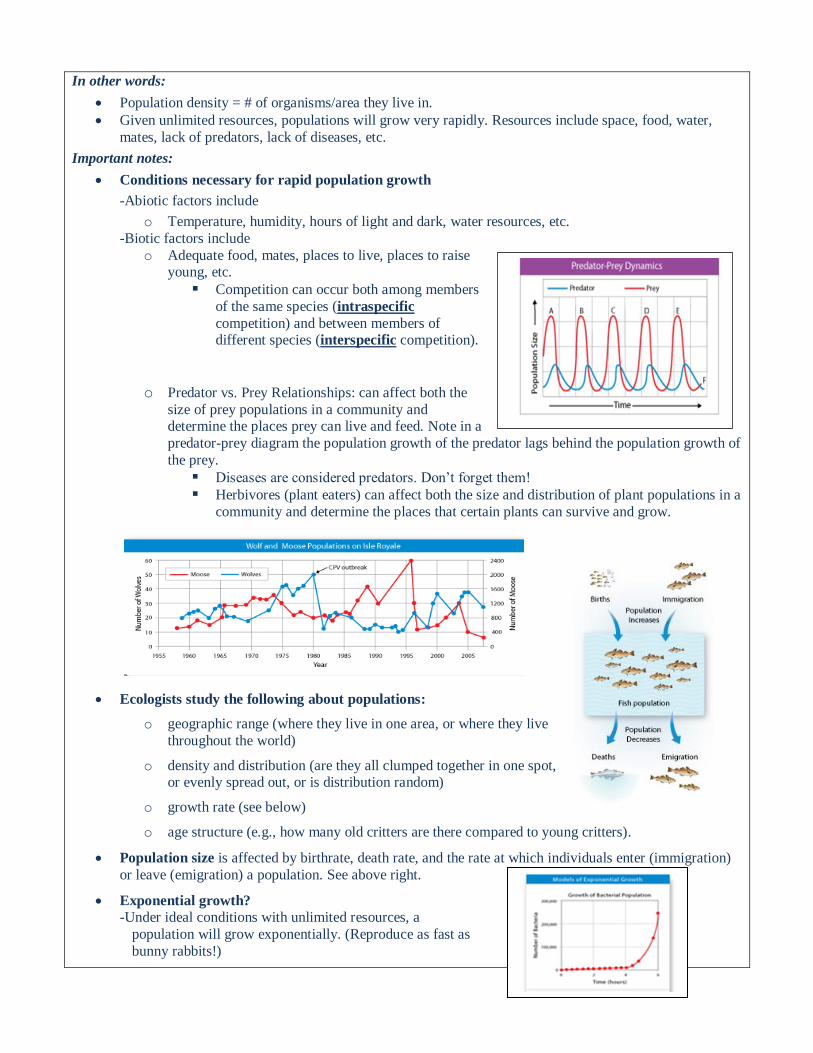
o Predator vs. Prey Relationships: can affect both the
size of prey populations in a community and determine the places prey can live and feed. Note in a
predator-prey diagram the population growth of the predator lags behind the population growth of
the prey. Diseases are considered predators. Don’t forget them! Herbivores (plant eaters) can affect both the size and distribution of plant populations in a
community and determine the places that certain plants can survive and grow.
Ecologists study the following about populations:
o geographic range (where they live in one area, or where they live
throughout the world)
o density and distribution (are they all clumped together in one spot, or evenly spread out, or is distribution random)
o growth rate (see below)
o age structure (e.g., how many old critters are there compared to young critters).
Population size is affected by birthrate, death rate, and the rate at which individuals enter (immigration)
or leave (emigration) a population. See above right.
Exponential growth?
-Under ideal conditions with unlimited resources, a
population will grow exponentially. (Reproduce as fast as
bunny rabbits!)
- Organisms that are introduced to new environments can
grow exponentially for a time and change an ecosystem. This is especially true of invasive species.
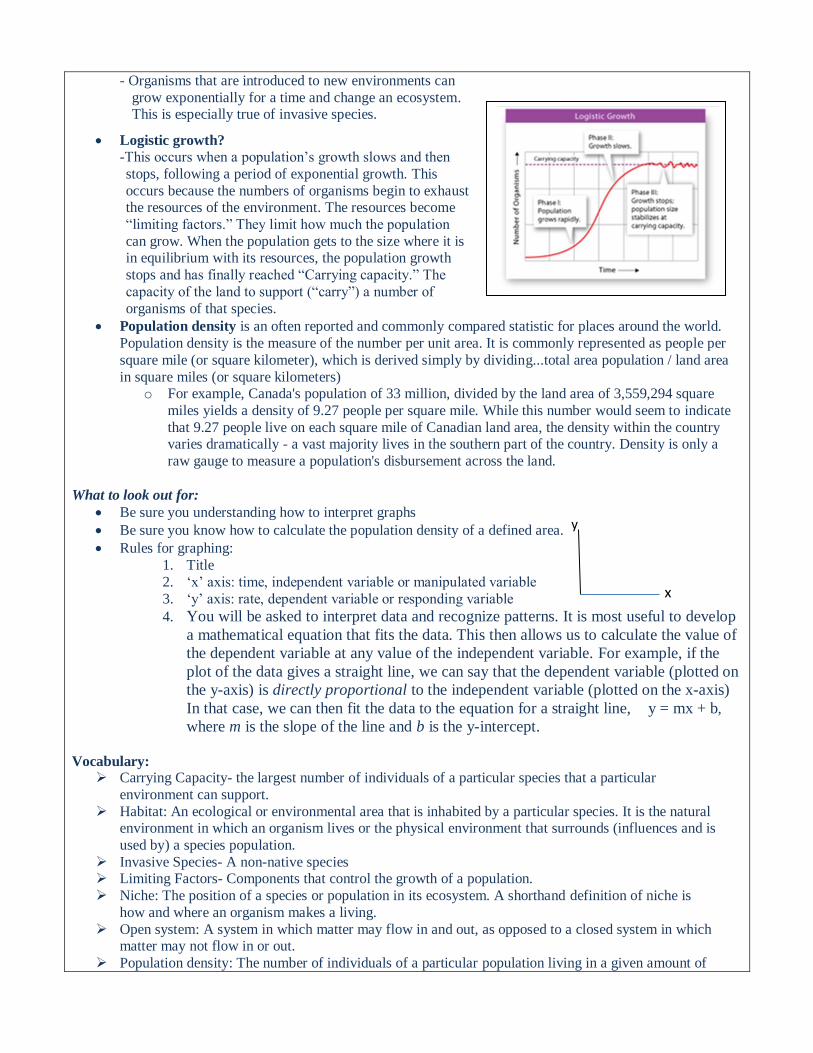
Logistic growth?
-This occurs when a population’s growth slows and then
stops, following a period of exponential growth. This
occurs because the numbers of organisms begin to exhaust the resources of the environment. The resources become
“limiting factors.” They limit how much the population
can grow. When the population gets to the size where it is in equilibrium with its resources, the population growth
stops and has finally reached “Carrying capacity.” The
capacity of the land to support (“carry”) a number of
organisms of that species.
Population density is an often reported and commonly compared statistic for places around the world.
Population density is the measure of the number per unit area. It is commonly represented as people per
square mile (or square kilometer), which is derived simply by dividing...total area population / land area
in square miles (or square kilometers) o For example, Canada's population of 33 million, divided by the land area of 3,559,294 square
miles yields a density of 9.27 people per square mile. While this number would seem to indicate
that 9.27 people live on each square mile of Canadian land area, the density within the country varies dramatically - a vast majority lives in the southern part of the country. Density is only a
raw gauge to measure a population's disbursement across the land.
What to look out for:
Be sure you understanding how to interpret graphs
Be sure you know how to calculate the population density of a defined area.
Rules for graphing:
1. Title
2. ‘x’ axis: time, independent variable or manipulated variable
3. ‘y’ axis: rate, dependent variable or responding variable
4. You will be asked to interpret data and recognize patterns. It is most useful to develop
a mathematical equation that fits the data. This then allows us to calculate the value of
the dependent variable at any value of the independent variable. For example, if the
plot of the data gives a straight line, we can say that the dependent variable (plotted on
the y-axis) is directly proportional to the independent variable (plotted on the x-axis)
In that case, we can then fit the data to the equation for a straight line, y = mx + b,
where m is the slope of the line and b is the y-intercept.
Vocabulary: Carrying Capacity- the largest number of individuals of a particular species that a particular
environment can support.
Habitat: An ecological or environmental area that is inhabited by a particular species. It is the natural environment in which an organism lives or the physical environment that surrounds (influences and is
used by) a species population.
Invasive Species- A non-native species Limiting Factors- Components that control the growth of a population.
Niche: The position of a species or population in its ecosystem. A shorthand definition of niche is
how and where an organism makes a living.
Open system: A system in which matter may flow in and out, as opposed to a closed system in which matter may not flow in or out.
Population density: The number of individuals of a particular population living in a given amount of
y
x
space.
Population growth: The rate at which the number of individuals in a population increases. Usually applies to a given ecosystem, but could refer to a region or the entire Earth.
Population: The collection organisms of a particular species that can breed and reproduce.
Content Standard “C” (9-11 LS2C) Student Performance Expectation
Students know that: Students are expected to:
Population growth is limited by the availability of
matter and energy found in resources, the size of the
environment, and the presence of competing and/or predatory organisms.
•Explain factors, including matter and energy, in the
environment that limit the growth of plant and animal
populations in natural ecosystems.
In other words:
No interpretation needed. The Standard and Performance Expectation are clear.
Important notes:
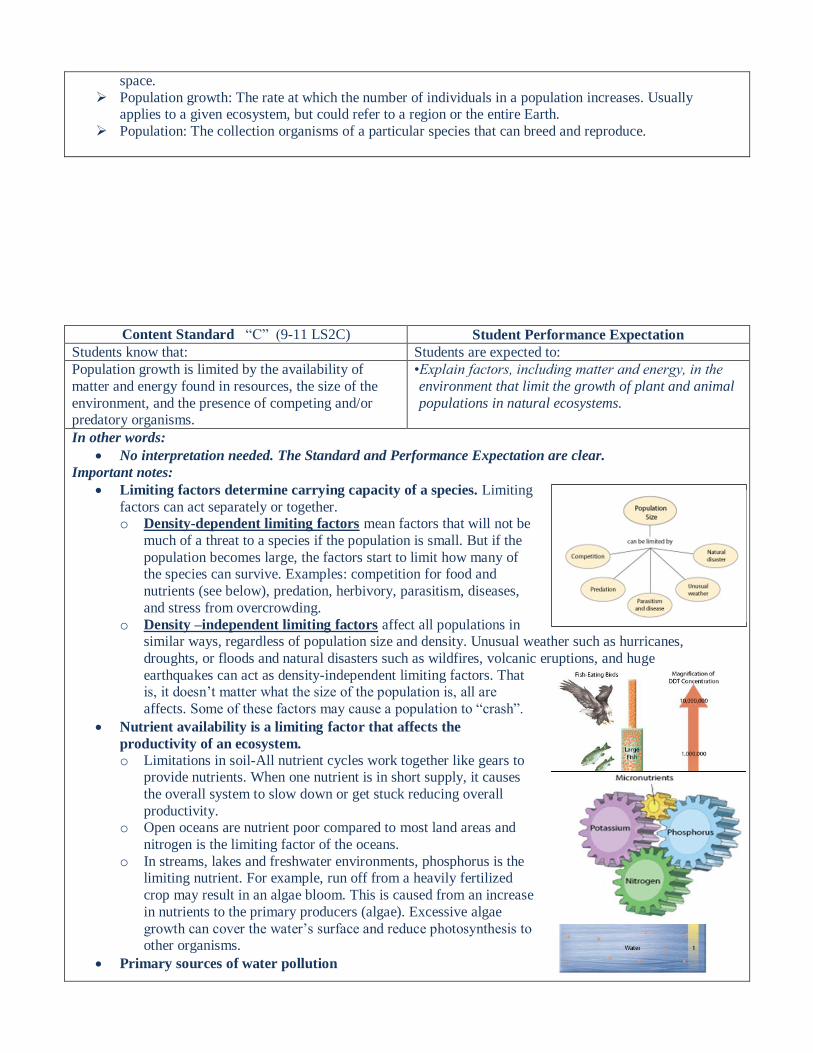
Limiting factors determine carrying capacity of a species. Limiting
factors can act separately or together. o Density-dependent limiting factors mean factors that will not be
much of a threat to a species if the population is small. But if the
population becomes large, the factors start to limit how many of the species can survive. Examples: competition for food and
nutrients (see below), predation, herbivory, parasitism, diseases,
and stress from overcrowding.
o Density –independent limiting factors affect all populations in similar ways, regardless of population size and density. Unusual weather such as hurricanes,
droughts, or floods and natural disasters such as wildfires, volcanic eruptions, and huge
earthquakes can act as density-independent limiting factors. That is, it doesn’t matter what the size of the population is, all are
affects. Some of these factors may cause a population to “crash”.
Nutrient availability is a limiting factor that affects the
productivity of an ecosystem. o Limitations in soil-All nutrient cycles work together like gears to
provide nutrients. When one nutrient is in short supply, it causes
the overall system to slow down or get stuck reducing overall
productivity. o Open oceans are nutrient poor compared to most land areas and
nitrogen is the limiting factor of the oceans.
o In streams, lakes and freshwater environments, phosphorus is the limiting nutrient. For example, run off from a heavily fertilized
crop may result in an algae bloom. This is caused from an increase
in nutrients to the primary producers (algae). Excessive algae
growth can cover the water’s surface and reduce photosynthesis to other organisms.
Primary sources of water pollution
o The primary sources of water pollution are industrial and
agricultural chemicals, and residential sewage and nonpoint sources.
o For Example: Biomagnification occurs if a pollutant, such as
DDT (a long lasting chemical used to control agricultural pest and
disease carrying mosquitoes) enters a stream from rain water run-off and is consumed by organisms, but not broken down. The
DDT is passed up the food chain from producers to consumers.
As the DDT enters the tropic levels, its concentration becomes more concentrated, causing damage to larger species at the top of
the food chain.
o This is also an example of a closed system. A system in which
matter (DDT) may circulate, but may not enter or leave.
What to look for:
Be sure you understand what a limiting factor is. Know the differences between a density-dependent and
density-independent limiting factor.
Biomagnification is a big deal. Understand the principle.
Vocabulary:
Limiting Factor: determines the carrying capacity of an environment for a species. A balance between
extinction and overcrowding the planet.
Competition: When populations become crowded, individuals compete for food, water, space, sunlight, and other essentials.
Predation: The effect of a predator on its prey. Most predator-prey relationship populations’ cycle up and
down over time like the graph above shown the wolf and moose on Isle Royale. Human predation: Humans can limit the supply of certain populations by catching/hunting/harvesting more
than can be put back causing the population steadily decline toward extinction.
Closed system: A system in which matter may circulate, but may not enter or leave.
Content Standard “D” (9-11 LS2D) Student Performance Expectation
Students know that: Students are expected to:
Scientists represent ecosystems in the natural world using mathematical models.
•Draw a systems diagram to illustrate and explain why introduced (nonnative) species often do poorly and
have a tendency to die out, as well as why they
sometimes do very well and force out native species.
*a, *b
In other words:
Because ecosystems are typically large and/or complex and/or change over long periods of time, it is
usually best to understand them using a mathematical model.
Invasive species are a good topic to introduce this concept of modeling.
Important notes:
An introduced species is synonymous with non-native. These species are usually introduced to an area by
humans for a variety of reasons. E.g.,
o By mistake (e.g., Norway rats hitchhiking aboard sailing ships).
o To control other non-native species that are reproducing out of control, and needing to be limited
without using a herbicide (plant killer). NOTE: In the process of controlling non-native species, these
introduced species can choke out the native vegetation as well and themselves become an invasive
species
o From human carelessness and/or ignorance. E.g., releasing your python pet into the Everglades.
Non-native species can
o increase the biodiversity of an ecosystem
o cause such an imbalance that the area in which it has been introduced becomes overcrowded, nutrient
poor and prone to disease.
What to look for:
You will probably be asked to draw a systems diagram and represent it mathematically. Chances are the
math will be no more than calculating population density at different times as populations change due to
an invasive species. See the example on this and the next page.
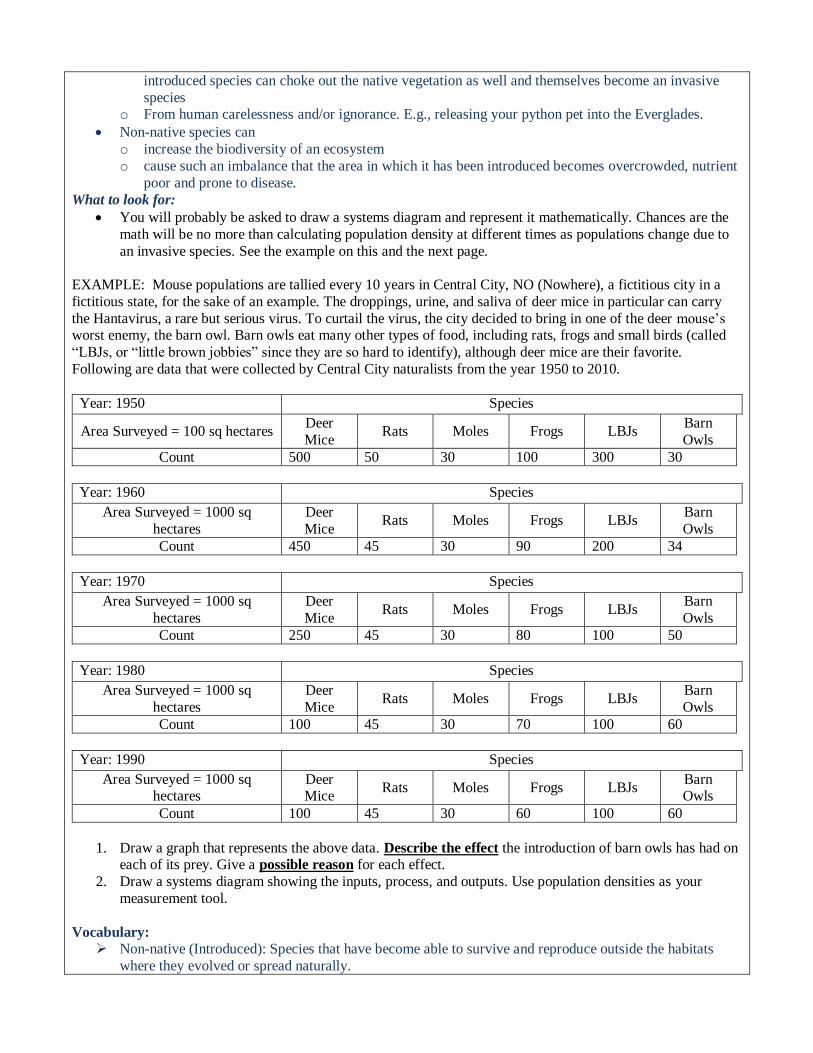
EXAMPLE: Mouse populations are tallied every 10 years in Central City, NO (Nowhere), a fictitious city in a
fictitious state, for the sake of an example. The droppings, urine, and saliva of deer mice in particular can carry
the Hantavirus, a rare but serious virus. To curtail the virus, the city decided to bring in one of the deer mouse’s worst enemy, the barn owl. Barn owls eat many other types of food, including rats, frogs and small birds (called
“LBJs, or “little brown jobbies” since they are so hard to identify), although deer mice are their favorite.
Following are data that were collected by Central City naturalists from the year 1950 to 2010.
Year: 1950 Species
Area Surveyed = 100 sq hectares Deer
Mice Rats Moles Frogs LBJs
Barn
Owls
Count 500 50 30 100 300 30
Year: 1960 Species
Area Surveyed = 1000 sq
hectares
Deer
Mice Rats Moles Frogs LBJs
Barn
Owls
Count 450 45 30 90 200 34
Year: 1970 Species
Area Surveyed = 1000 sq
hectares
Deer
Mice Rats Moles Frogs LBJs
Barn
Owls
Count 250 45 30 80 100 50
Year: 1980 Species
Area Surveyed = 1000 sq
hectares
Deer
Mice Rats Moles Frogs LBJs
Barn
Owls
Count 100 45 30 70 100 60
Year: 1990 Species
Area Surveyed = 1000 sq hectares
Deer Mice
Rats Moles Frogs LBJs Barn Owls
Count 100 45 30 60 100 60
1. Draw a graph that represents the above data. Describe the effect the introduction of barn owls has had on each of its prey. Give a possible reason for each effect.
2. Draw a systems diagram showing the inputs, process, and outputs. Use population densities as your
measurement tool.
Vocabulary:
Non-native (Introduced): Species that have become able to survive and reproduce outside the habitats
where they evolved or spread naturally.
Native Species: defined as natural to a given region or ecosystem if its presence in that region is the result
of only natural processes, with no human intervention. Invasive Species: those introduced species that spread-widely or quickly, and cause harm, be that to the
environment, human health, other valued resources or the economy.
Content Standard “E” (9-11 LS2E)
Student Performance Expectation
Students know that: Students are expected to:
Interrelationships of organisms may generate
ecosystems that are stable for hundreds or thousands of years. Biodiversity refers to the different kinds of
organisms in specific ecosystems or on the planet as a
whole.
Compare the biodiversity of organisms in different
types of ecosystems (e.g., rain forest, grassland, desert) noting the interdependencies and
interrelationships among the organisms in these
different ecosystems.
In other words:
No interpretation needed. The Standard and Performance Expectation are clear.
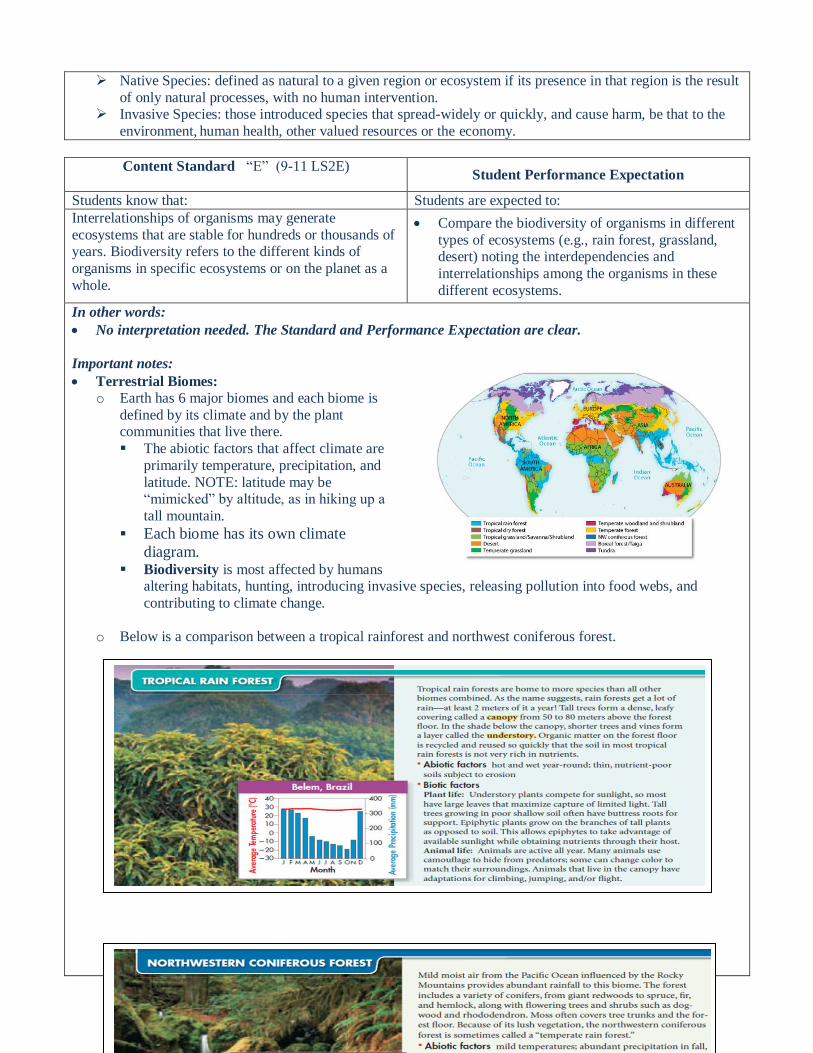
Important notes:
Terrestrial Biomes: o Earth has 6 major biomes and each biome is
defined by its climate and by the plant communities that live there.
The abiotic factors that affect climate are
primarily temperature, precipitation, and
latitude. NOTE: latitude may be “mimicked” by altitude, as in hiking up a
tall mountain.
Each biome has its own climate
diagram. Biodiversity is most affected by humans
altering habitats, hunting, introducing invasive species, releasing pollution into food webs, and
contributing to climate change.
o Below is a comparison between a tropical rainforest and northwest coniferous forest.
Aquatic ecosystems
o Aquatic organisms are affected primarily by the water’s depth, temperature, flow, and amount of
dissolved nutrients.
o Zones of Aquatic Ecosystems:
Photic zone: the sunlit region up to 200 meters deep. This may be only a few inches deep in rivers or
streams depending on the amount of silt that clouds the water.
Aphotic zone: below the photic zone, where photosynthesis does not occur.
Freshwater ecosystem categories
o Freshwater ecosystems can be divided into three main categories: rivers and streams; lakes
and ponds; and freshwater wetlands. Only 3% of the Earth’s surface water is fresh water, but that small percentage provides terrestrial (land) organisms with drinking water, food and
transportation.
o Wetlands support a large amount of plant and aquatic life and are one of the most important
for their role in filtering pollutants and to prevent flooding by absorbing large amounts of water.
Estuaries are where freshwater rivers dump into saltwater.
o Estuaries serve as spawning and nursery grounds for many ecologically and commercially
important fish and shellfish species.
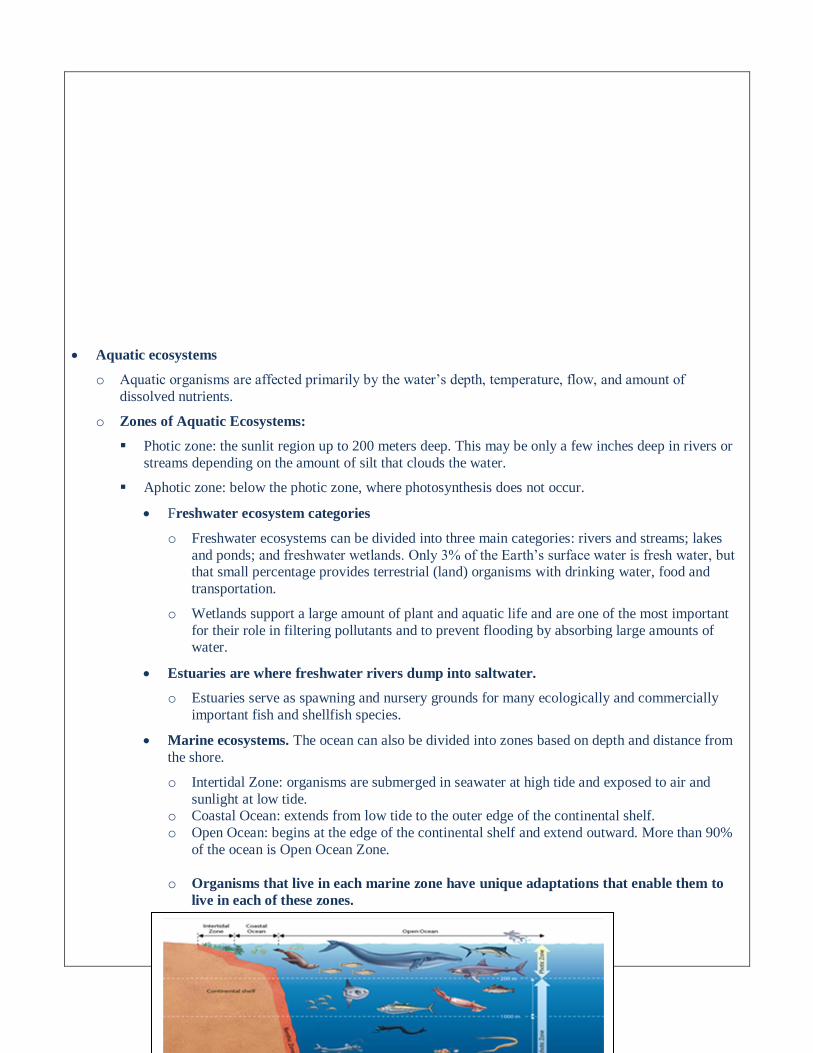
Marine ecosystems. The ocean can also be divided into zones based on depth and distance from
the shore.
o Intertidal Zone: organisms are submerged in seawater at high tide and exposed to air and
sunlight at low tide. o Coastal Ocean: extends from low tide to the outer edge of the continental shelf.
o Open Ocean: begins at the edge of the continental shelf and extend outward. More than 90%
of the ocean is Open Ocean Zone.
o Organisms that live in each marine zone have unique adaptations that enable them to
live in each of these zones.
What to look for:
Biodiversity is considered by most as a “good thing.” Ecosystems are healthier and more stable if they
contain a larger number of species. If something goes wrong, the whole ecosystem does not collapse.
Remember that the greatest threat to biodiversity is humans due to habitat destruction.
Remember that biomes are defined mostly by temperature, precipitation, and latitude…and plant type.
Vocabulary:
Aphotic Zone- This area is considered the dark zone and extends just below the photic zone to the bottom of
the ocean. Food webs here are based on which organisms fall from the photic zone above “marine snow” or on the chemosynthetic organism.
Benthic Zone- environment on the ocean floor in the Aphotic Zone where organisms are exposed to high
pressure, frigid temperature or extremely hot deep-sea vents that support chemosynthetic primary producers.
Climate: Encompasses the temperatures, humidity, atmospheric pressure, winds, rainfall, atmospheric particle
count, and numerous other meteorological elements in a given region over long periods of time.
Ecosystem: A natural unit consisting of all plants, animals, and microorganisms (biotic factors) in an area
functioning together with all of the nonliving physical (abiotic) factors of the environment.
Global climate: The average temperature, humidity, rainfall, and other meteorological measures of Earth as a
whole over a long period of time (usually taken to be about 30 years).
Photic Zone- The surface most layer of water that receives the most sunlight and conducts the most
photosynthesis. The photic zone is nutrient poor, but because it is so massive, it support a large number of small species such as phytoplankton.
Temperature: A physical property that determines the direction of heat flow between two objects placed in
thermal contact. If no heat flow occurs, the two objects have the same temperature; otherwise, heat flows
from the hotter object to the colder object.
Content Standard “F” (9-11 LS2F) Student Performance Expectation
Students know that: Students are expected to:
The concept of sustainable development supports
adoption of policies that enable people to obtain the
resources they need today without limiting the ability of future generations to meet their own needs.
Sustainable processes include substituting renewable
for nonrenewable resources, recycling, and using fewer
resources.
Explain how scientific concepts and findings relate
to a resource issue currently under discussion in the
state of Washington (e.g., removal of dams to facilitate salmon spawning in rivers; construction
of wind farms).* a,*b,*c.
Explain how the concept of sustainable
development may be applied to a current resource issue in the state of Washington.*a,*b,*c.
In other words :
No interpretation needed. The Standard and Performance Expectations are clear.
Important Notes:
It is important to familiarize yourself with resource issues applicable to the Pacific Northwest. These include,
but are not limited to
o Salmon populations
o Crop rotation
o Crop irrigation o Reforestation issues after clear-cutting
o The succession occurring at Mt. St. Helens
o Construction of wind farms along the Columbia Gorge. o Non-point source pollution of Puget Sound
Be able to demonstrate your knowledge of a resource issue using a systems diagram to show the
interdependency among organisms within an ecosystem.
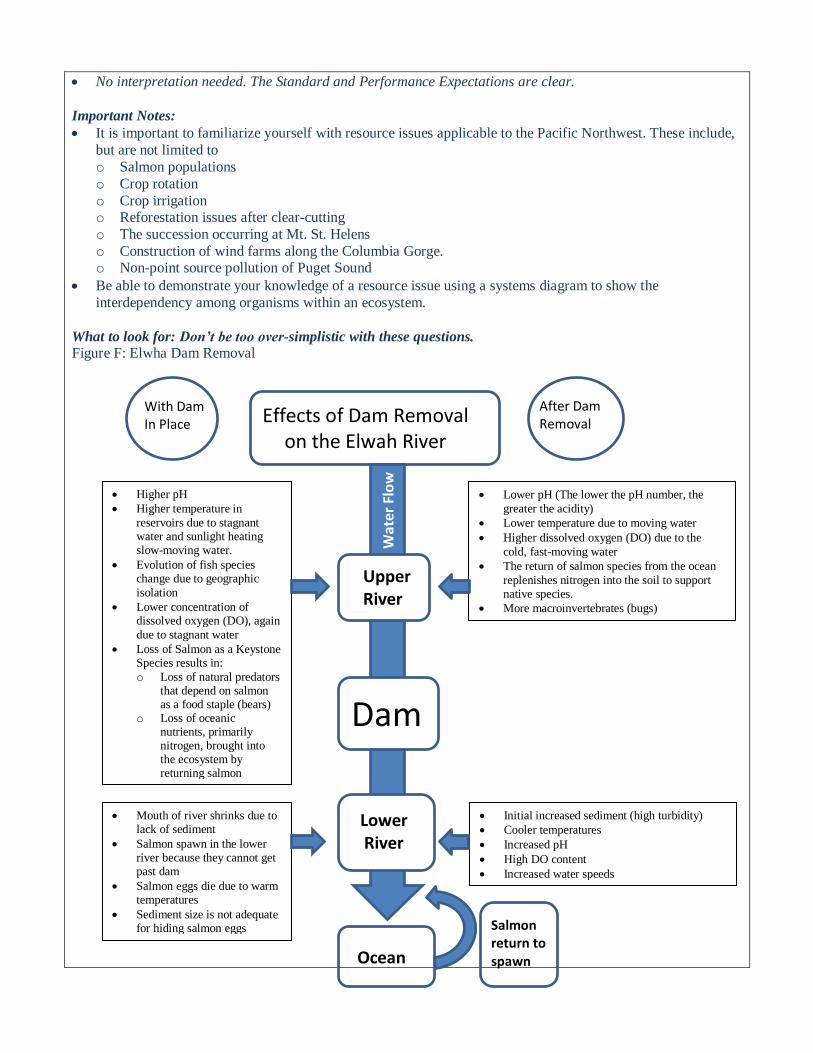
What to look for: Don’t be too over-simplistic with these questions. Figure F: Elwha Dam Removal
Effects of Dam Removal on the Elwah River
With Dam In Place
After Dam Removal
Ocean
Higher pH
Higher temperature in
reservoirs due to stagnant water and sunlight heating slow-moving water.
Evolution of fish species change due to geographic
isolation
Lower concentration of dissolved oxygen (DO), again
due to stagnant water
Loss of Salmon as a Keystone Species results in:
o Loss of natural predators that depend on salmon as a food staple (bears)
o Loss of oceanic nutrients, primarily nitrogen, brought into the ecosystem by returning salmon
Mouth of river shrinks due to lack of sediment
Salmon spawn in the lower river because they cannot get past dam
Salmon eggs die due to warm temperatures
Sediment size is not adequate for hiding salmon eggs
Dam
Lower River
Lower pH (The lower the pH number, the
greater the acidity)
Lower temperature due to moving water
Higher dissolved oxygen (DO) due to the
cold, fast-moving water
The return of salmon species from the ocean
replenishes nitrogen into the soil to support native species.
More macroinvertebrates (bugs)
Initial increased sediment (high turbidity)
Cooler temperatures
Increased pH
High DO content
Increased water speeds
Upper River
Dam
Lower River
Wa
ter
Flo
w
Salmon return to spawn
Vocabulary:
Sustainable development: Policies that enable people to obtain the resources they need today without
limiting the ability of future generations to meet their own needs.
SAMPLE TEST QUESTIONS – Taken from several tests, so the numbers are not in order.
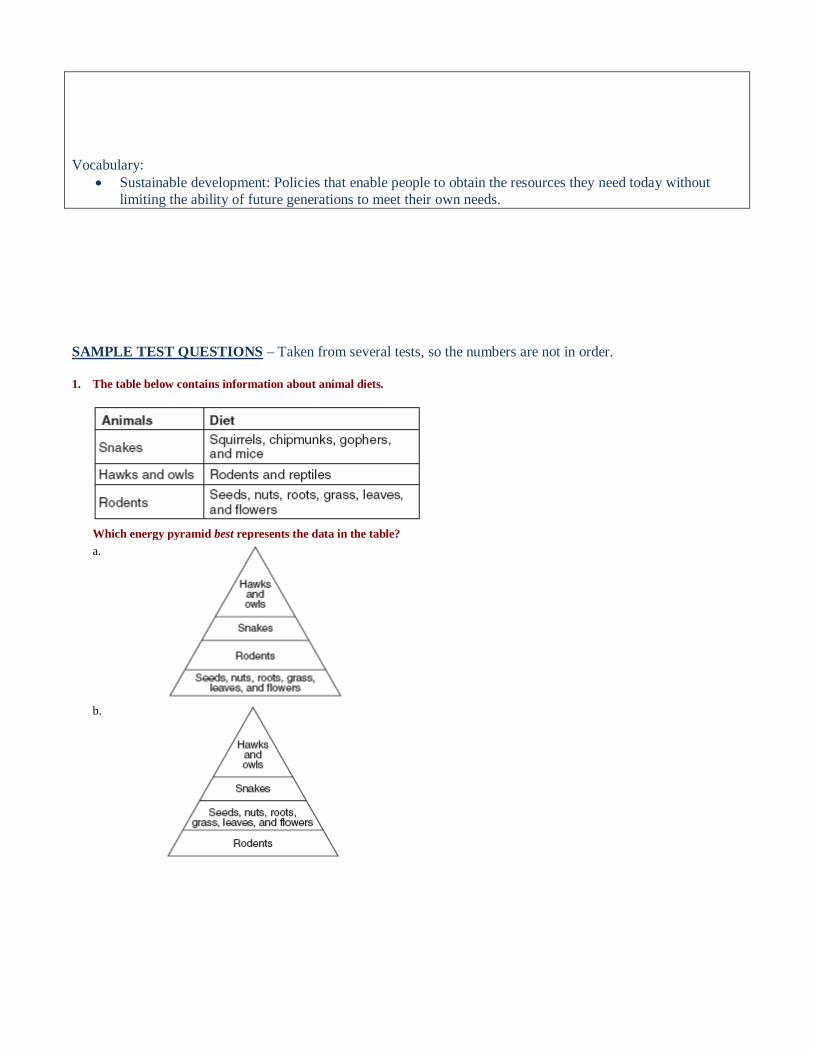
1.
The table below contains information about animal diets.
Which energy pyramid best represents the data in the table?
a.
b.
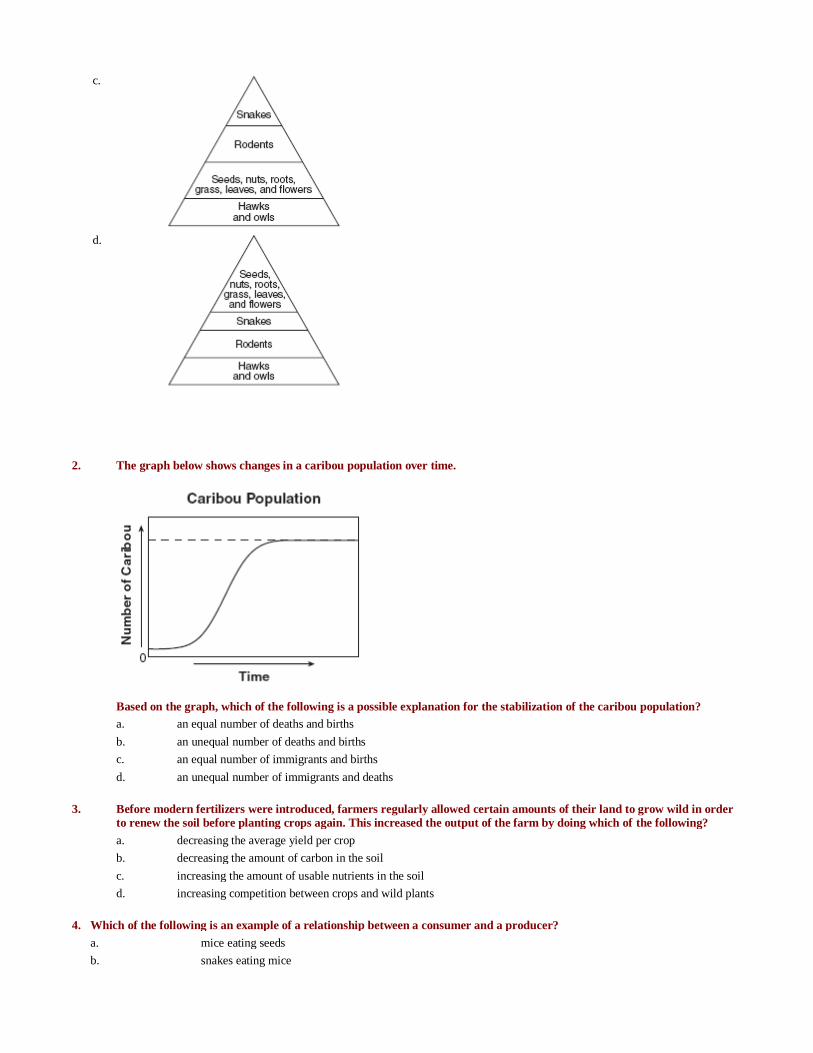
c.
d.
2. The graph below shows changes in a caribou population over time.
Based on the graph, which of the following is a possible explanation for the stabilization of the caribou population?
a. an equal number of deaths and births
b. an unequal number of deaths and births
c. an equal number of immigrants and births
d. an unequal number of immigrants and deaths
3. Before modern fertilizers were introduced, farmers regularly allowed certain amounts of their land to grow wild in order
to renew the soil before planting crops again. This increased the output of the farm by doing which of the following?
a. decreasing the average yield per crop
b. decreasing the amount of carbon in the soil
c. increasing the amount of usable nutrients in the soil
d. increasing competition between crops and wild plants
4.
Which of the following is an example of a relationship between a consumer and a producer?
a. mice eating seeds
b. snakes eating mice
c. humans eating mushrooms
d. plants taking nutrients from the soil
5. Which of the following sets of organisms would be found in a wetland ecosystem?
a. tortoise, lizard, fly
b. salamander, mosquito, frog
c. moose, seal, lemming
d. lion, giraffe, beetle
6. Nitrogen-fixing bacteria help cycle nitrogen through ecosystems. How do they do this?
a. They change nitrogen into forms usable by plants.
b. They convert water and carbon dioxide into sugar.
c. They release the chemical energy in nitrogen for respiration.
d. They convert sunlight into chemical energy stored in nitrogen.
7. The five Great Lakes make up 95% of the United States’ fresh water supply. Chemicals, pesticides, and herbicides from the agriculture industry and toxic wastes from factories have polluted the Lakes. Higher temperatures and reduced precipitation have contributed to lower water levels, leading to costly efforts to dig out harbors and to open shipping lanes. A hard freeze that affected Lakes Superior, Huron, and Erie during the winter of 2003 forced ships carrying industrial products to delay shipments or risk being trapped in the 2-foot-thick ice.
A scientist who believes that the dropping water levels in the Great Lakes are the result of global warming would
be most likely to study ways to reduce
a. oil spills.
b. acid rain.
c. fossil fuel use.
d. recycling of paper.
8. Complete burning of plant material returns carbon primarily to the
a. herbivores.
b. water.
c. vegetation.
d. atmosphere.
9.
The greatest mass in any ecosystem is usually found in
a. parasites.
b. producers.
c. consumers.
d. decomposers.
10. Rabbits introduced into Australia over 100 years ago have become a serious pest to farmers. Rabbit populations
increased so much that they displaced many native species of plant eaters. What is the most logical explanation for
their increased numbers?
a. Rabbits have a high death rate.
b. There are few effective predators.
c. Additional rabbit species have been introduced.
d. There is an increase in rabbit competitors.
11. Which of these organisms would most likely be found at the top of an energy pyramid?
a. clams
b. sardines
c. sharks
d. kelp
12.
Refer to the text below to answer questions 12 through 14.
A form of lake succession called eutrophication occurs when a lake fills with inorganic and organic debris and
eventually becomes a field. Water draining into a lake carries nutrients and organic compounds, which stimulate
growth of algae and microorganisms. This growth forms an opaque mat on the lake's surface and lowers the level
of dissolved oxygen produced by plants in the lake. Over time, the algae and microorganisms become so dense
that the oxygen becomes depleted, killing the fish in the lake. Decaying fish bodies and other sediments
accumulate on the lake bottom, until gradually the lake becomes land.
A biologist claims that during lake succession, fish such as trout are slowly replaced by fish such as bluegills. How
must these fish be different for this claim to be TRUE?
a. Bluegills must require less oxygen than trout.
b. Bluegills must have a greater population size.
c. Bluegills must require less nitrogen than trout.
d. Bluegills must have a higher carrying capacity.
13. Which of the following explains why algae and microorganisms reduce the level of dissolved oxygen?
a. Plants below the lake`s surface do not have cell walls.
b. Plants below the lake`s surface can not undergo mitosis.
c. Plants below the lake`s surface can not undergo meiosis.
d. Plants below the lake`s surface can not undergo photosynthesis.
14. There is much eutrophication taking place in Lake Mitchell, but in Lake Sarah there is relatively little. You read
that this is partially due to the runoff of the different kinds of forests surrounding each lake. Which of the
following would have to be true in order to support this claim?
a. The trees are taller around Lake Sarah than around Lake Mitchell.
b. The trees are taller around Lake Mitchell than around Lake Sarah.

c. The forests around Lake Sarah lose their leaves in fall; those around Lake Mitchell do not.
d. The forests around Lake Mitchell lose their leaves in fall; those around Lake Sarah do not.
15. After a volcanic eruption has covered an area with lava, which of the following is the most likely order or
succession in the repopulation of the area?
a. lichens ----> grasses ----> shrubs ----> trees
b. mosses ----> grasses ----> lichens ----> trees
c. grasses ----> trees ----> mosses ----> lichens
d. shrubs ----> grasses ----> trees ----> lichens
Read the article below and answer questions 16 and 17.
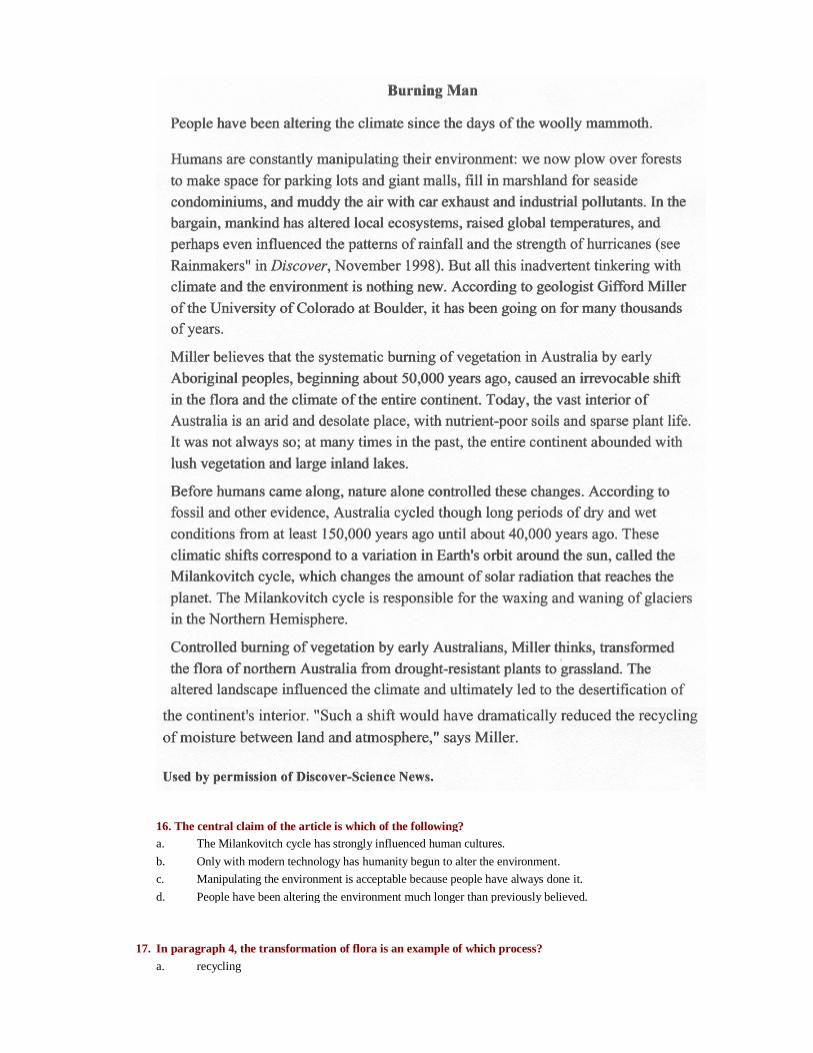
16. The central claim of the article is which of the following?
a. The Milankovitch cycle has strongly influenced human cultures.
b. Only with modern technology has humanity begun to alter the environment.
c. Manipulating the environment is acceptable because people have always done it.
d. People have been altering the environment much longer than previously believed.
17. In paragraph 4, the transformation of flora is an example of which process?
a. recycling
b. predation
c. succession
d. fossilization
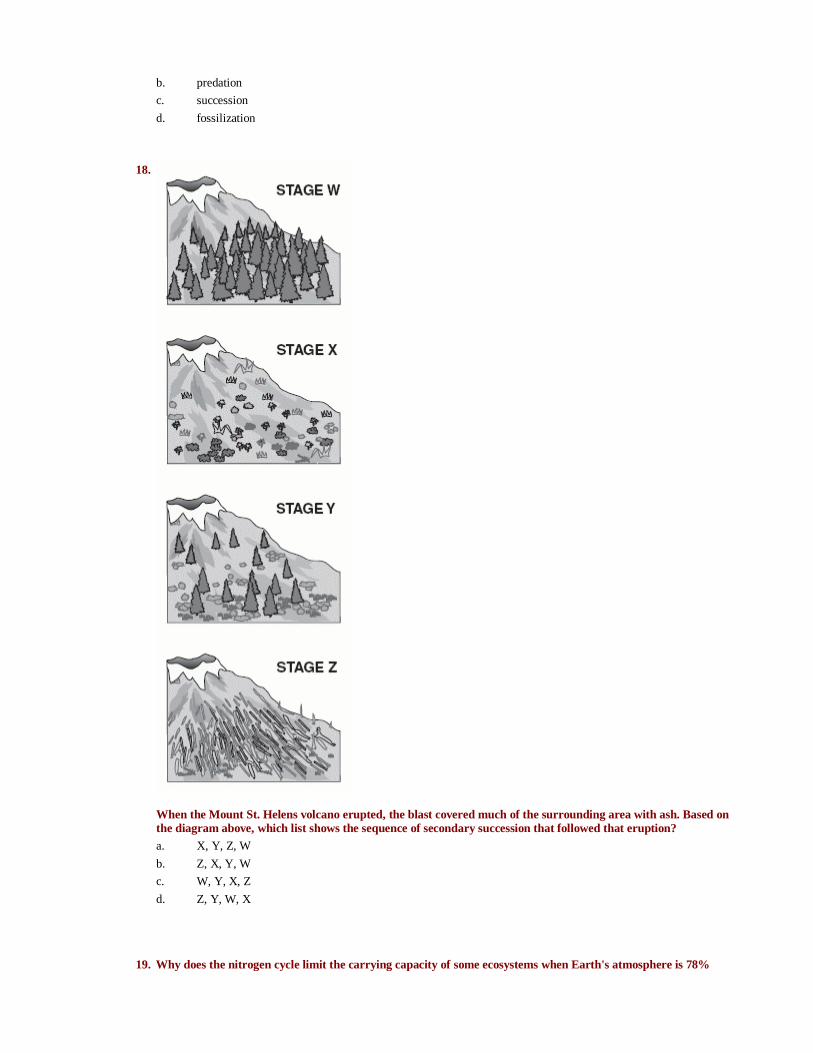
18.
When the Mount St. Helens volcano erupted, the blast covered much of the surrounding area with ash. Based on
the diagram above, which list shows the sequence of secondary succession that followed that eruption?
a. X, Y, Z, W
b. Z, X, Y, W
c. W, Y, X, Z
d. Z, Y, W, X
19. Why does the nitrogen cycle limit the carrying capacity of some ecosystems when Earth's atmosphere is 78%
nitrogen?
a. Only ultraviolet light can bond nitrogen with nonpoisonous elements.
b. Very few organisms can fix nitrogen into biologically useful compounds.
c. Only animals can use nitrogen in chemical reactions that give them energy.
d. Compared with solids, gases have such a low density that nitrogen is still scarce.
20. Which of these is a negative side effect of using pesticides on crops?
a. Crop pests are destroyed.
b. The crop takes longer to mature.
c. The size of the crop is reduced.
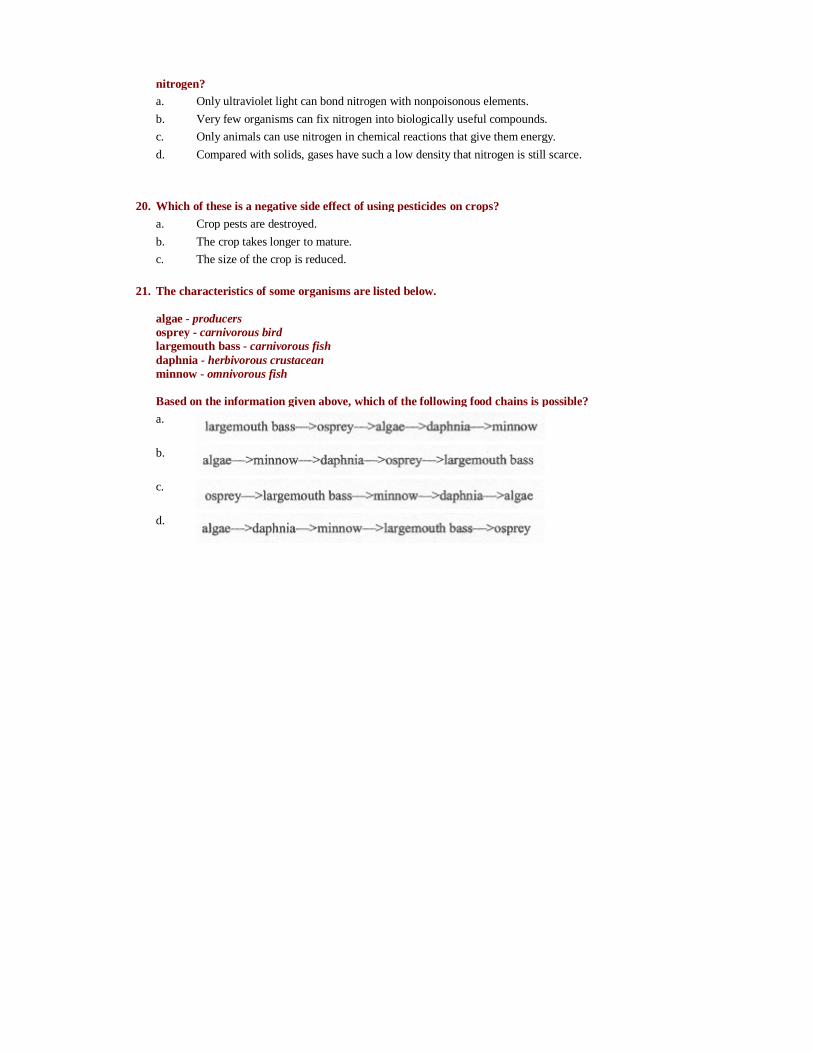
21.
The characteristics of some organisms are listed below.
algae - producers
osprey - carnivorous bird
largemouth bass - carnivorous fish
daphnia - herbivorous crustacean
minnow - omnivorous fish
Based on the information given above, which of the following food chains is possible?
a.
b.
c.
d.
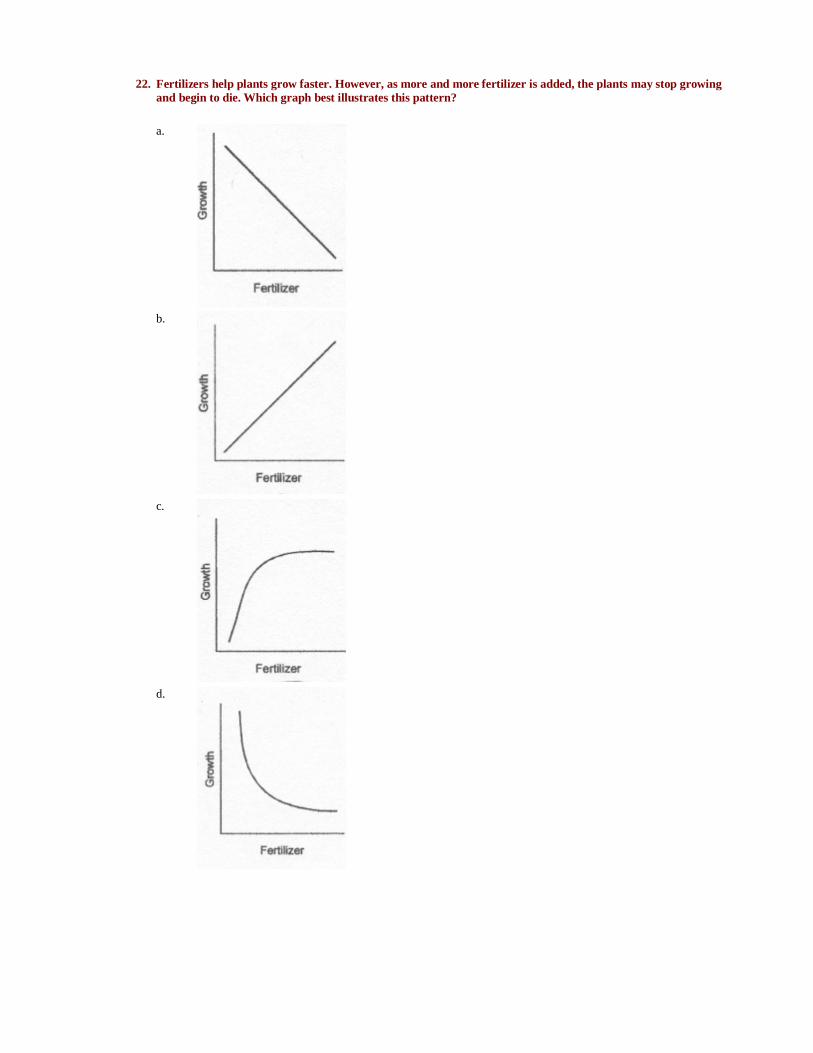
22. Fertilizers help plants grow faster. However, as more and more fertilizer is added, the plants may stop growing
and begin to die. Which graph best illustrates this pattern?
a.
b.
c.
d.
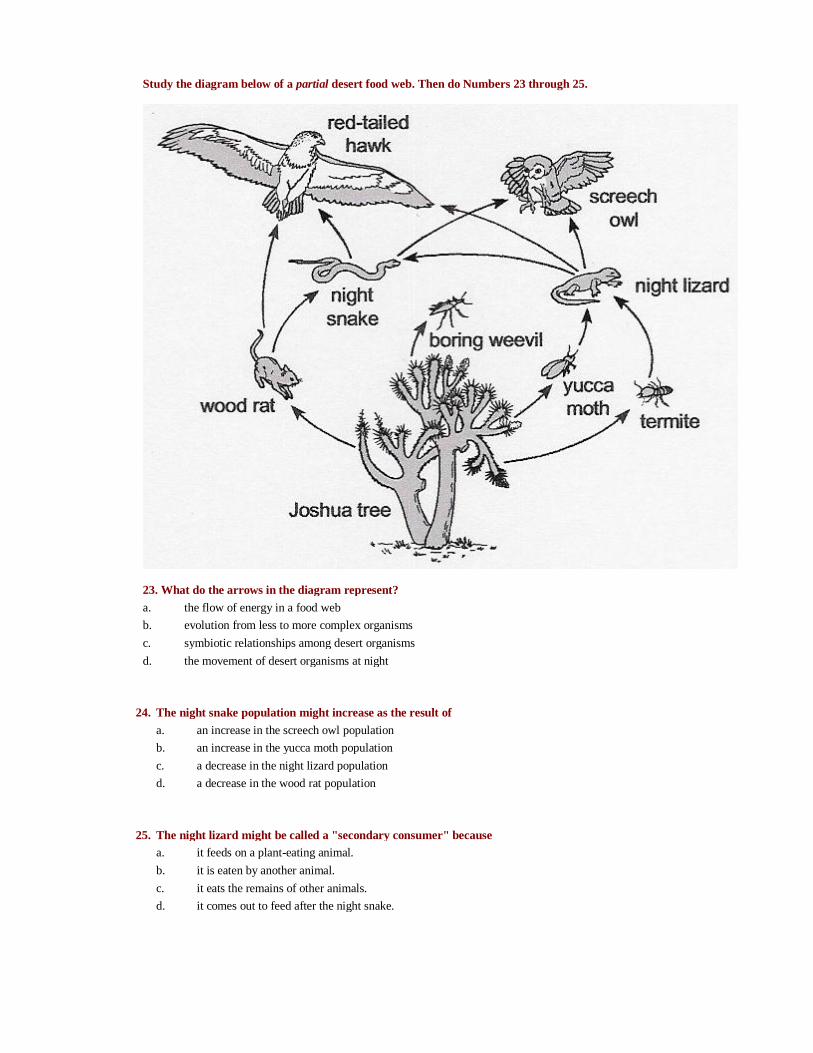
Study the diagram below of a partial desert food web. Then do Numbers 23 through 25.
23. What do the arrows in the diagram represent?
a. the flow of energy in a food web
b. evolution from less to more complex organisms
c. symbiotic relationships among desert organisms
d. the movement of desert organisms at night
24. The night snake population might increase as the result of
a. an increase in the screech owl population
b. an increase in the yucca moth population
c. a decrease in the night lizard population
d. a decrease in the wood rat population
25. The night lizard might be called a "secondary consumer" because
a. it feeds on a plant-eating animal.
b. it is eaten by another animal.
c. it eats the remains of other animals.
d. it comes out to feed after the night snake.