Embed Size (px)
Citation preview

BIOLOGICAL NUTRIENT REMOVAL STUDY CLEARFIELD WASTEWATER TREATMENT FACILITY FOR CLEARFIELD MUNICIPAL AUTHORITY APRIL 2008

Table of Contents
Transmittal Letter Executive Summary
Section 1: Introduction to Facility Plan and NRT Program 1.1 Nutrient Reduction Goals 1-1 1.2 Clearfield Wastewater Treatment Plant 1-1 1.3 Purpose and Scope of the Study 1-3 Section 2: Summary of Existing Facilities and Conditions 2-1 2.1 Introduction 2-1 2.2 History, Location and Capacity 2-1
2.2.1 Historical 2-1 2.2.2 Location 2-1 2.2.3 Capacity 2-1 2.2.4 Influent Characteristics 2-3 2.2.5 Sanitary Sewer System and Combined Sewer Overflows 2-3
2.3 Process Flow Description 2-7 2.3.1 Raw Wastewater Flow Pattern 2-7 2.3.2 Sludge Handling 2-7
2.4 Assessment of Existing Facilities and Equipment 2-8 2.4.1 Preliminary Treatment 2-8
2.4.1.1 Influent Hydraulics 2-8 2.4.1.2 Grit Chamber 2-8 2.4.1.3 Bar Screens 2-9 2.4.2 Main Pumping Station 2-10 2.4.3 Primary Influent Distribution Structure 2-12 2.4.4 Primary Sedimentation Tanks (PSTs) 2-12 2.4.5 Activated Sludge Aeration Tanks 2-14 2.4.6 Secondary Sedimentation Tanks 2-17 2.4.7 Chlorine Disinfection 2-18 2.4.8 Solids Handling System 2-19
Section 3: Evaluation of NRT Process Options 3-1 3.1 Introduction 3-1 3.2 Preliminary NRT Evaluation 3-1 3.3 NRT Modeling Evaluation 3-2 3.4 Process Alternatives 3-2
3.4.1 Introduction 3-2 3.4.2 Step-Feed 3-5 3.4.3 Modified Ludzack-Ettinger (MLE) Process 3-5 3.4.4 Virginia Initiative Plant (VIP) Process 3-6 3.4.5 NRT Process Upgrade with Denitrification Sand Filters 3-7
Clearfield Municipal Authority WWTF i NRT Evaluation Report April 2008
Table of Contents 3.5 CMA WWTF NRT Upgrade Options 3-8 3.6 Option 1: New Treatment Plant 3-8 3.7 Option 2: New Reactor Tanks with Existing Plant Upgrade 3-14 3.8 Option 3: Upgrade Existing Plant/Process 3-19 3.9 Option 4: Buy Nutrient Credits Only 3-23 3.10 Conclusions 3-23
Section 4: Cost Analysis 4-1
4.1 Cost-Effectiveness Evaluation 4-1 4.2 Project Financing 4-3 4.3 Operating Costs 4-4 4.4 Existing Debt Service Costs 4-5 4.5 Projected Operating Costs and Debt Service 4-5 4.6 Sewer Rate Analysis 4-6 Section 5: Project Schedule 5-1 Section 6: Operational Considerations 6-1 Section 7: Recommendations 7-1 List of Tables Table 1-1 Nutrient Loading Summary 1-2 Table 1-2 Nutrient Concentration Summary 1-2 Table 1-3 Clearfield WWTF NPDES Effluent Limits 1-2 Table 2-1 Hydraulic/Organic Loading (1998-2007) 2-3 Table 2-2 Sewer System Tabulation and Infiltration Potential (By System Owner) 2-4 Table 2-3 Long-Term Combined Sewer Overflow (CSO) Control Plan 2-5 Implementation Schedule Table 2-4 Primary Settling Tank Characteristics 2-12 Table 2-5 Aeration Tank Characteristics 2-15 Table 2-6 Secondary Settling Tanks Characteristics 2-17 Table 2-7 Trace Elements Concentration in Biosolids Generated 2-23 Table 2-8 Fecal Coliform Survey Results 2-23 Table 3-1 Preliminary NRT Process Evaluation Results 3-2 Table 3-2 Summary of Projected Effluent N and P Achieved by Option 1 3-9 Table 3-3 Summary of Projected Effluent N and P Achieved by Option 2 3-14 Table 3-4 Summary of Projected Effluent N and P Achieved by Option 3 3-22 Table 3-5 Nutrient Credit Analysis 3-23 Table 4-1 Project Cost Estimate for Option 1: New Treatment Plant 4-1 Clearfield Municipal Authority WWTF ii NRT Evaluation Report April 2008

Table of Contents List of Tables (Continued…) Table 4-2 Project Cost Estimate for Option 2: New Reactor Tanks with Existing Plant Upgrade 4-2 Table 4-3 Project Cost Estimate for Option 3: Upgrade Existing Plant/Process 4-2 Table 4-4 Project Cost Estimate for Option 4: Buy Nutrient Credits Only 4-3 Table 4-5 Tributary Municipalities BNR Costs 4-3 Table 4-6 Tabulation of Power BNR Consumption (Options 1 and 2) 4-4 Table 4-7 Current Indebtedness (As of January 1, 2007) 4-5 Table 4-8 Projected Operating Costs and Debt Service 4-5 Table 4-9 Sewer Rate Schedule - Meter Rates (Effective February 1, 2004) 4-6 Table 4-10 Sewer Rate Analysis - Proposed Option 1 Project (Per Quarter) 4-6 Table 4-11 Sewer Rate Analysis - Proposed Option 2 Project (Per Quarter) 4-6 Table 4-12 Sewer Rate Analysis - Proposed Option 3 Project (Per Quarter) 4-7 Table 4-13 Comparison of Regional Sewer Rates 4-7
List of Figures Figure 2-1 Location Map 2-2 Figure 2-2 Interceptor Sewer System after pg. 2-4 Figure 2-3 Existing Site Plan after pg. 2-7 Figure 2-4 Existing Process Schematic after pg. 2-7 Figure 2-5 Grit Chamber 2-9 Figure 2-6 Bar Screen 2-10 Figure 2-7 Influent Pump 2-11 Figure 2-8 Grit Pump 2-11 Figure 2-9 Primary Settling Tank 2-14 Figure 2-10 Aeration Tank, Circumference Around a Clarifier 2-16 Figure 2-11 Secondary Setting Tank 2-18 Figure 2-12 Chlorine Contact Chamber 2-19 Figure 2-13 RAS and WAS Pumps 2-20 Figure 2-14 Sludge Thickener 2-21 Figure 2-15 Anaerobic Sludge Digester Floating Cover 2-22 Figure 3-1 MLE Process Flow Schematic with Step Feed Option 3-5 Figure 3-2 VIP Process Flow Schematic with Step Feed Option 3-6 Figure 3-3 Biowin Schematic Model of Option 1 and of Option 2 3-9 Figure 3-4 Proposed Site Plan Layout "A" for Option 1 after pg. 3-9 Figure 3-5 Proposed Site Plan Layout "B" for Option 2 after pg. 3-9 Figure 3-6 Proposed Site Plan Layout for Option 2 after pg. 3-14 Figure 3-7 Biowin Schematic Model of Option 3 3-22 Figure 3-8 Proposed Schematic of Option 3 after pg. 3-22 Figure 3-9 Proposed Site Plan Layout for Option 3 after pg. 3-22
Clearfield Municipal Authority WWTF iii NRT Evaluation Report April 2008

Table of Contents Appendix Appendix A Biowin Data for Option 1 and Option 2 Appendix B Biowin Data for Option 3 Appendix C NPDES Permit Appendix D Summary of Plant Characteristics Appendix E Intensive Sampling Results Appendix F Detailed Cost Estimates Abbreviations ADF Average Design Flow BNR Biological Nutrient Removal BOD Biochemical Oxygen Demand CMA Clearfield Municipal Authority CMAS Complete Mixed Activated Sludge CSO Combined Sewer Overflow DEP Department of Environmental Protection GPD Gallons per Day MGD Million Gallons per Day MLE Modified-Ludzack Ettinger NPDES National Pollution Discharge Elimination System NRT Nutrient Reduction Technology PADEP Pennsylvania Department of Environmental Protection PFR Plug Flow Reactor PST Primary Settling Tank RAS Return Activated Sludge SCADA Supervisory Control and Data Acquisition SOR Surface Overflow Rate SST Secondary Settling Tank SWD Side Water Depth TMDL Total Maximum Daily Loads TN Total Nitrogen TP Total Phosphorus TSS Total Suspended Solids UCT University of Cape Town VIP Virginia Initiative Process WAS Waste Activated Sludge WEF Water Environment Federation WWTF Wastewater Treatment Facility
Clearfield Municipal Authority WWTF iv NRT Evaluation Report April 2008

April 15, 2008 Board of Directors Clearfield Municipal Authority 107 East Market Street Clearfield, PA 16830
Attn: Jeff Williams, Manager
RE: Wastewater Treatment Facility Biological Nutrient Removal Study Dear Board Members: Please find enclosed our engineering report on Biological Nutrient Removal at the Clearfield Wastewater Treatment Facility. The study includes an assessment of existing treatment systems for conversion and adaptation to a biological nutrient removal process. We have included results of intensive wastewater sampling and testing along with computer modeling of various BNR treatment alternatives. In addition, we performed an alternatives evaluation and cost effectiveness analysis of the most compatible BNR systems. A detailed cost estimate and financial analysis was performed for the recommended alternative along with a project implementation schedule. If you have any questions or require additional information, please contact our office at your convenience. Sincerely, GWIN, DOBSON & FOREMAN, INC. Mark Glenn, P.E. President enclosures 90016/NRT Evaluation Report.doc cc: File

Executive Summary
Executive Summary 1. The existing Clearfield Municipal Authority (CMA) wastewater treatment facility (WWTF) is a
conventional activated sludge process with a single stage carbon oxidation process for biochemical oxygen demand (BOD5) and total suspended solids (TSS) removal. The plant, built in 1960 and upgraded in 1975, consistently achieves a high level of organic removal and has consistently met all PADEP effluent discharge limits. However, the facility removes very little ammonia nitrogen and, therefore, does not achieve nitrification.
2. As part of the Chesapeake Bay nutrient reduction strategy, the PADEP has mandated that
wastewater treatment plants reduce nitrogen and phosphorus discharges. The WWTF was not designed for biological nutrient removal (BNR). The facility must achieve nitrogen and phosphorus loading limits by September 30, 2011 according to the new NPDES permit.
3. The treatment plant needs to be upgraded since the existing activated sludge process does not
achieve complete nitrification, mainly due to lack of sufficient reactor capacity. Due to lack of nitrification, the plant is unable to achieve total nitrogen removal as per the new NPDES permit.
4. This study includes an assessment of existing treatment system for conversion and adaptation to a
BNR process. Intensive wastewater sampling and testing, along with computer modeling of various BNR treatment alternatives, was performed. An alternatives evaluation and cost effectiveness analysis was done of the most compatible BNR system for the plant. The results include a cost estimate and financial analysis of the recommended alternative along with a project implementation schedule.
5. The Modified Ludzack-Ettinger (MLE)/Virginia Initiative Process (VIP) (Plug Flow, Single
Stage, Activated Sludge) should be implemented as the Nutrient Removal Technology (NRT) at the WWTF. This process offers adaptation to NRT processes such as the A2O, UCT and Johannesburg systems.
6. Computer modeling, capital cost and operational cost analysis, highlighted four major options to
achieve TN and TP NPDES limits at the WWTF. 7. Option 1 deals with building a completely new treatment plant adjacent to the existing WWTF.
This option utilizes the MLE/VIP process for TN and TP NPDES limits at a cost of $28 million. The peak design flow is 13.5 MGD while the average daily design flow is 4.5 MGD. The final plant capacity will depend on the success of the Borough/Township sewer project to reduce peak system flows and eliminate CSO discharges.
Clearfield Municipal Authority WWTF NRT Evaluation Report April 2008

Executive Summary
8. Option 2 deals with increasing reactor and clarifier volume by building new reactors and clarifiers
at a cost of $21 million. This option also utilizes the MLE/VIP process for TN and TP NPDES
limits. This option utilizes the existing sludge handling facility. The peak design flow is 13.5
MGD while the average daily design flow is 4.5 MGD. The final plant capacity will depend on
the success of the Borough/Township sewer project to reduce peak system flows and eliminate
CSO discharges.
9. Option 3 outlines an interim approach to contain TN and TP discharge near the NPDES limits.
This option utilizes MLE process and carbon augmentation (for BOD5 supplement) to limit TN
and TP at a cost of $4.1 million. Option 3 will be assessed after completion of the ongoing
Lawrence Township and Clearfield Borough sewer separation project in 2012. Option 3 will
continue to rely on upstream CSO's to relieve the plant of peak flow.
10. Option 4 uses the nutrient credit approach to attain the TN and TP NPDES limit. This option uses
TN and TP discharge data of the WWTF to predict the cost of buying nutrient credits ranging from
$250,000 to $460,000. The option does not include any retrofit/modification of the existing plant.
11. The Modified Ludzack-Ettinger (MLE) Process (Plug Flow, Single Stage, Activated Sludge)
should be implemented as the Nutrient Removal Technology at the WWTF. This process offers
future adaptation to other NRT processes including the VIP, A2O, UCT and Johannesburg
systems.
12. Option 3 (Retrofit Existing Plant/Process) is the most cost effective MLE process option for
adaptation to the existing treatment plant. Moreover, this option allows the CMA to comply with
the BNR limits until the ongoing sewer separation project is complete. This option may not bring
the TN and TP yearly discharge under the NPDES limit, however the yearly nutrient discharge
will be in a controlled range and hence will limit excessive spending for nutrient credits.
13. This option includes installing a 320,000 gallon tank (which will be used as the anoxic reactor
zone for the MLE process), with submersible mixers. The option will also include retrofitting the
existing distribution structure for step-feed purposes, installation of baffle walls in existing
aeration tanks, replacing coarse bubble diffusers with fine bubble diffusers, higher pumping and
piping capacity and arrangement for chemical feed.
Clearfield Municipal Authority WWTF NRT Evaluation Report April 2008

Executive Summary
14. Option 3 will include provisions for a step-feed system during peak flow events. No
recommendations are made at this time for the sludge digestion, conditioning, thickening,
dewatering, storage or disposal system. This system will be integrated entirely into the NRT
system.
15. The total project cost of the recommended improvements is $4.1 million. We recommend that the
Authority issue Sewer Revenue Bonds, pursue Pennvest financing or local financing through a
bank note. Unless the legislature enacts supplemental funding, Pennvest financing may not be
considered a viable alternative.
16. Failure of the Clearfield Borough and Lawrence Township sewer replacement projects to
eliminate CSO discharges and peak system flow will necessitate a costly treatment compliance
project for the Authority. This compliance cost, reflected in Options 1 and 2, will be at least $21
to $28 million, and is entirely dependent on the final peak flow. According to the Consent Order
and Agreement and CMA's Long Term Control Plan, the Authority will be forced to implement
whatever treatment compliance project is necessary to eliminate all CSO's and treat all flow at the
WWTF.
17. No recommendations or costs are offered for improving the upstream conveyance system
including pump stations and interceptor sewers. The final peak flow from the Township and
Borough collection systems will determine the need, if any, for upgrading these systems.
18. To comply with the NPDES permit deadlines, it is recommended that engineering and design
work commence immediately so that the necessary design documents, plans, specifications,
contract documents and permit application be submitted for construction to commence around
mid-late 2009 and be completed and ready for operation on September 30, 2010.
Clearfield Municipal Authority WWTF NRT Evaluation Report April 2008

Section 1: Introduction to Facility Plan and NRT Program
Section 1: Introduction to Facility Plan and NRT Program
1.1 Nutrient Reduction Goals
On June 8, 2000, the Commonwealth of Pennsylvania entered into an agreement with the Chesapeake Bay Partnership to reduce nutrient and sediments load entering the Bay. Governor Ridge directed the PA department of Environmental Protection (PADEP) to develop strategy for nutrient reductions from agricultural, forestry, urban stormwater and point source discharges (among others, wastewater treatment plants). Excess nutrients, particularly phosphorus and nitrogen, deplete the oxygen in tributary rivers and ultimately in the Bay. Depleted oxygen inhibits the growth of aquatic species. In December 2004, Governor Rendell presented Chesapeake Bay Strategy developed by PADEP. The plan includes increasing forested buffers and wetlands, control of agricultural and farm runoff, stormwater management, increasing riparian buffers and limiting wastewater and industrial discharges. Although wastewater treatment plant discharge only 10% of the total nutrient loading, they are targeted as “point source” dischargers and are regulated through National Pollution Discharge Elimination System (NPDES) permitted process. The remaining i.e. around 90% of nutrient loading are due to “non-point” discharges such as runoff from agricultural farms, urban areas and forests. To control wastewater pollution, PADEP has established maximum nutrient loads for total phosphorus (TP) and total nitrogen (TN) for the major state tributaries of the Chesapeake Bay. Treatment plants have to meet annual cap loads (and not instantaneous limits) for the Susquehanna and Potomac River watersheds. Point source cap loads were further allocated for each major wastewater treatment facility in the drainage basin, including the Clearfield Municipal Authority (CMA). The cap load limits were partially based on the design flow capacity of the treatment plant. 1.2 Clearfield Wastewater Treatment Plant
The Clearfield wastewater treatment plant uses a conventional activated sludge (secondary) treatment process for achieving organic and suspended solids removal. The plant has complied with all water quality and effluent parameters specified in the state/federal NPDES discharge permit. However, the aeration tanks at the WWTF have a limited detention time (4.8 hours at the design flow of 4.5 MGD). Owing to this detention time, the plant principally removes biological oxygen demand (BOD5) from the influent wastewater, but achieves virtually no nitrification. The lack of nitrification is documented by the intensive sampling data performed during November 2007 and monthly discharge monitoring reports. The limitations of the existing process place practical limits on the plant's ability to achieve nutrient reduction.
A summary of the NPDES cap loadings and influent and effluent total nitrogen and phosphorus (from Feb 2007-Jan 2008) is provided in Table 1-1 and Table 1-2. The January 11, 2008 NPDES permit issued by PADEP includes total annual loadings for the CMA WWTF. Please refer to Table 1-3.
Clearfield Municipal Authority WWTF NRT Evaluation Report April 2008
1-1

Section 1: Introduction to Facility Plan and NRT Program
Table 1-1: Nutrient Loading Summary
Influent (lbs/yr)
Effluent (lbs/yr)
NPDES Limit (lbs/yr) %
TP 19,231 7,336 10,959 -33 TN 186,445 134,244 82,191 +63
Table 1-2: Nutrient Concentration Summary
Influent
(mg/l) Effluent (mg/l)
NPDES Limit (mg/l) %
TP 1.40 0.54 0.80 -33 TN 13.61 9.80 6.00 +63
In addition, the permit stipulates compliance with the mass loading limits by September 30, 2011. Please refer to Table 1-3 for the NPDES effluent limits.
Table 1-3: Clearfield WWTF NPDES Effluent Limits
Parameter Average Monthly (mg/L) Average Weekly (mg/L) Instantaneous
Maximum (mg/L) CBOD5 25 40 50
Total Suspended Solids 30 45 60 Total Residual Chlorine 0.5 1.6
pH From 6.0 to 9.0 inclusive Fecal Coliform
(5-1 to 9-30) 200/100 ml as a Geometric Average (10-1 to 4-30) 2,000/100 ml as a Geometric Average
Chesapeake Bay Requirements
Parameter Concentration (mg/L) Mass (lbs)
Monthly Average Monthly Annual Ammonia-N Report Report Report Kjeldahl-N Report Report
Nitrate + Nitrite as N Report Report Total Nitrogen Report Report Report
Total Phosphorus Report Report Report Net Total Nitrogen Report 82,191*
Net Total Phosphorus Report 10,959* * The permit contains conditions which authorize the permittee to apply nutrient reduction credits, to meet the Net Total Nitrogen and Net Total Phosphorus effluent limits, under the Department of Environmental Protection's (Department) Trading of Nutrient and Sediment Reduction Credits Policy and Guidelines (392-0900-001, December 30, 2006). The conditions include the requirement to report application of these credits in Supplemental Discharge Monitoring Reports (DRMs) submitted to the Department.
* Net Total Nitrogen and Net Total Phosphorus limits compliance date will begin on October 1, 2010. Since these reporting requirements are annual loads, reporting on compliance with the annual limitations will be required on the Supplemental DMR--Annual Nutrient Summary by November 28, 2011. The facility is required to monitor and report for Net Total Nitrogen and Net Total Phosphorus from the effective date of the permit until October 1, 2010.
Clearfield Municipal Authority WWTF NRT Evaluation Report April 2008
1-2

Section 1: Introduction to Facility Plan and NRT Program
1.3 Purpose and Scope of the Study The Clearfield Municipal Authority informed PADEP of their intention to comply with the new nutrient limits on
June 20, 2007. This commitment included the provision for an engineering feasibility study to achieve compliance
with the NPDES permit limits. The Authority commissioned Gwin, Dobson & Foreman, Inc., Consulting
Engineers, to complete the feasibility study, the results of which are included herein. The report includes the
following major components:
a. Characterization of influent and effluent flows, and wastewater constituents for a sufficient period
of record.
b. Analyze average daily flows and peak flow events within the context of hydraulic and process
capacity of the existing plant.
c. Incorporate previous studies and projects performed at the CMA WWTF including sludge
handling process (i.e. anaerobic sludge mixing system; solids dewatering centrifuge), installation
of floating roof covers on anaerobic digesters and replacement of primary clarification
mechanisms.
d. Determine hydraulic and process capacity of existing plant and function and serviceability of
process treatment equipment.
e. Perform computer modeling of existing and proposed processes for various nitrogen/phosphorous
removal scenarios and processes using BioWin® modeling software.
f. Determine optimum nitrogen removal technologies (NRT) most compatible with the existing
physical plant and system operation.
g. Assess existing treatment processes and mechanical equipment for use in NRT process including
necessary retrofitting.
h. Perform an alternatives evaluation of several comparable NRT processes and provide
recommended alternatives, including cost effectiveness considerations.
i. Compile cost estimates of capital construction components, related operating costs and associated
engineering, legal and administrative costs to implement the project.
Clearfield Municipal Authority WWTF NRT Evaluation Report April 2008
1-3

Section 1: Introduction to Facility Plan and NRT Program
j. Review funding options and compute debt service for new construction and include analysis of
existing debt.
k. Determine effect on sewer rates and compare with other regional sewer authorities of similar size
and NRT requirements.
l. Develop a project implementation schedule including milestones for completion of engineering,
design, construction and system start-up and commissioning.
The conclusions and recommendations of this planning report should provide sufficient direction to the Authority
for the full implementation of the project within established deadlines and at the most reasonable cost.
Clearfield Municipal Authority WWTF NRT Evaluation Report April 2008
1-4

Section 2: Summary of Existing Facilities and Conditions
Section 2: Summary of Existing Facilities and Conditions 2.1 Introduction This section assesses the physical and biological treatment processes, along with process treatment and equipment
systems for functional adaptation with the new effluent limits. The Clearfield plant continues to meet current
effluent limits but will be unable to meet the 2010 NPDES permit limits for total nitrogen.
2.2 History, Location and Capacity
2.2.1 Historical A primary treatment facility, consisting of two (2) primary settling tanks, anaerobic sludge digesters, vacuum sludge
filters and a chlorine contact tank, was built in 1960. The facility provided 30% organic and 50% suspended solids
removal. Because of new secondary treatment standards, an activated sludge process (aeration tanks and secondary
settling tanks) was added in 1977. The original 1960 plant and 1976 upgrade project were designed by Hill & Hill,
Inc., Consulting Engineers, Northeast, PA.
In 1995, a self cleaning bar screen and screenings building were constructed. In 2005, a centrifuge, anaerobic
sludge mixing system, floating anaerobic sludge tank covers, sludge heating system and sludge storage building
were installed to enhance biosolids handling capability. In addition, the primary clarifier mechanisms were also
replaced.
2.2.2 Location The Clearfield Municipal Authority’s Wastewater Treatment Plant is located at the confluence of Clearfield Creek
and the West Branch of the Susquehanna River in Lawrence Township. The precise location of the plant is shown
on Figure 2-1. The plant discharges treated wastewater into the West Branch of the Susquehanna River. The West
Branch is located within the Susquehanna/Chesapeake Basin, State Water Plan 9, Subbasin 8 Upper West Branch
Susquehanna River (HUC 02050201), and is classified for trout stocking, water supply, recreation and fish
consumption. The nearest downstream public water supply intake is the Shawville Generating Station, located on
the West Branch, about 8 miles downstream.
2.2.3 Capacity The plant has a permitted hydraulic capacity of 4.5 MGD and an organic BOD5 capacity of 4,253 lbs/day. The
organic capacity was derived for a flow of 3.0 MGD and BOD5 concentration of 170 mg/l. The plant can treat a peak
flow of 5.25 MGD. The plant consistently achieves 90-95% removal of BOD5 and suspended solids under average
loading conditions.
Clearfield Municipal Authority WWTF NRT Evaluation Report April 2008
2-1

Section 2: Summary of Existing Facilities and Conditions
Figure 2-1: Location Map (Scale 1” = 2000’)
Clearfield Municipal Authority WWTF NRT Evaluation Report April 2008
2-2
CMA WWTF

Section 2: Summary of Existing Facilities and Conditions
2.2.4 Influent Characteristics The following tabulation shows the hydraulic and organic loading at the WWTF over the last 10 years.
Table 2-1: Hydraulic/Organic Loading (1998-2007)
Year Total
Precipitation
Annual Average Hydraulic Loading
(MGD)
Maximum Monthly Hydraulic Loading
(MGD)
Annual Average Organic Loading
(lbs/day)
Maximum Monthly Organic Loading
(lbs/yr)
2007
2.664
4.158
2,533
2,943 2006 45.68 2.433 3.517 2,328 2,681 2005 39.25 2.480 3.760 2,354 3,157 2004 54.86 3.075 3.900 2,169 2,931 2003 52.23 3.155 3.860 2,483 3,027 2002 41.49 2.724 3.485 2,577 3,240 2001 33.41 2.404 3.304 2,984 3,836 2000 37.45 2.628 3.592 2,668 3,526 1999 36.96 2.631 4.027 2,294 3,337 1998 37.03 2.658 3.634 2,371 3,695
Average 41.19 2.685 3.724 2,476 3,237
The maximum hydraulic flow is governed by upstream CSO discharges. Generally, flow is consistent with
precipitation or lack thereof. Organic loading is generally consistent but can be effected by low-flow deposition of
organic matter in large diameter combined sewers. This organic relationship has not been quantified.
Since January 1986, the Authority has accepted brine fluid from natural gas wells within a six county area. This
brine fluid is processed through an on-site wastewater pretreatment facility. This process was evaluated by a recent
treatability and monitoring study. This study concluded that the treatment facility could process up to 14,000 gpd.
The results of a 1996 laboratory analyses indicated that the Clearfield wastewater treatment facility was unaffected
by the pretreated brine fluid. During 2007, 10,100 gpd of brine fluid was processed at the treatment facility. The
Authority operates the brine pretreatment facility and assesses this cost to a consortium of brine generators.
2.2.5 Sanitary Sewer System and Combined Sewer Overflows The Authority owns and operates the wastewater treatment facility and interceptor sewer system. The interceptor
sewer system consists of 85,300 LF of pipeline (up to 30" diameter) and five (5) pumping stations. The Borough of
Clearfield and Lawrence Township own and maintain sewage collection systems that are tributary to the interceptor
sewers. Clearfield Borough and Lawrence Township provide reports for the Authority's annual Chapter 94 waste
load management report including any maintenance, connections and extensions to their collection systems.
Clearfield Municipal Authority WWTF NRT Evaluation Report April 2008
2-3

Section 2: Summary of Existing Facilities and Conditions
Before 2004, the Authority had ten (10) combined sewer overflow locations. The Authority has since permanently closed three of the overflows and temporarily closed two more. The overflows that were temporarily closed are operated manually by a slide gate and are only operated in an emergency. Four of the five remaining overflows are also manually controlled and used to relieve the treatment facility of excessive wet weather flow. Figure 2-2 shows the existing overflow discharge points and tributary areas. This figure also includes the interceptor sewer system showing those conveyance facilities owned and maintained by the Clearfield Municipal Authority. Over the last 15 years, the Authority has made significant improvements to its interceptor sewer system. The Authority has reduced extraneous system flows and maximized conveyance capacity. Since 1989, the Authority has invested $2.5 million for 20 sewer system projects. Table 2-2 shows the infiltration potential of the interceptor and collection system by contributing municipality/system owner. The Clearfield Borough collection system has the most inflow potential (40.7%) relative to Lawrence Township (24.8%) and Clearfield Municipal Authority (34.5%). Also, Clearfield Borough has the largest sewer system, in terms of pipe footage (126,050 LF or 39.8%), relative to Lawrence Township (105,400 LF or 33.2%) and Clearfield Municipal Authority (85,300 LF or 26.7%). The table reflects data for the 2004 sewer system and does not include recent Township/Borough upgrades and replacements. However, the relevant infiltration potential (in-miles) has not changed appreciably.
Table 2-2: Sewer System Tabulation and Infiltration Potential (By System Owner)
System Owner Type System Dia. (in.) Length
(ft.) In-Miles In-Miles
(% Total) Clearfield Borough Collection 6 3,700 4.20 0.62 8 51,850 78.56 11.54 10 21,200 40.16 5.90 12 17,900 40.68 5.98
15 8,700 24.72 3.63 18 12,700 43.30 6.36 24 10,000 45.45 6.65 Sub-Total, Clearfield Borough 11.6 (Avg.) 126,050 277.07 40.68 Lawrence Township Collection 8 87,300 132.27 19.42 10 11,500 21.78 3.20 12 6,600 15.00 2.20 Sub-Total, Lawrence Township 8.5 (Avg.) 105,400 169.05 24.82 Clearfield Municipal Authority Interceptor 8 7,710 11.68 1.72 10 12,000 22.73 3.34 12 20,870 47.43 6.96 14 1,050 2.78 0.41 15 22,310 63.38 9.31 16 3,550 10.76 1.58 18 6,540 22.30 3.27 24 8,970 40.77 5.99 30 2,300 13.07 1.92 Sub-Total, Clearfield Mun. Auth. 14.5 (Avg.) 85,300 234.90 34.50 TOTAL, ALL SYSTEMS 11.4 (Avg.) 316,750 681.02 100.00
Clearfield Municipal Authority WWTF NRT Evaluation Report April 2008
2-4


Section 2: Summary of Existing Facilities and Conditions
The Clearfield Municipal Authority, Lawrence Township, Clearfield Borough and the PADEP entered into a four-
party Consent Order and Agreement (CO&A) on April 12, 2007. The document provides a time frame for all sewer
improvement work that should eliminate excessive inflow and infiltration that are the cause of combined sewer
overflows. In fact, the Authority has made these replacement projects an integral part of its Long-Term CSO
Control Plan.
Over the last five years, Clearfield Borough has undertaken a $33 million sewage collection system largely funded
by the Pennsylvania Infrastructure Investment Authority. The Borough replaced sanitary sewer mains and laterals
via five separate contracts. Contract No. 1 included 28,001 linear feet of new sanitary sewer main, 126 manholes,
25,497 linear feet of laterals and 3,285 liner feet of storm sewer. Contract No. 2 included 16,583 linear feet of new
sanitary sewer main, 86 manholes, 12,070 linear feet of laterals and 1,224 linear feet of storm sewer. Contract No. 3
included 2,624 linear feet of new sanitary sewer mains, 15 manholes, 1,472 linear feet of laterals and 52 linear feet
of storm sewer. Contract No. 4 included 4,687 linear feet of new sanitary sewer mains, 24 manholes, 3,844 linear
feet of laterals and 674 linear feet of storm sewer. Contract No. 5 included the replacement of more than 25,000
linear feet of sanitary sewers.
In 2002, Lawrence Township completed a $3.4 million sanitary sewer improvement project. The Township is
undertaking a supplemental project to replace other deficient lines.
When completed, the Borough and Township sewer replacement project will approach $40 million. The Authority
has completely relied on these projects for achieving its Long-Term CSO Control Plan which are the elimination of
all combined sewer overflows in the system while not exceeding the hydraulic design capacity of the wastewater
treatment facility. If these projects fail to achieve CSO reduction, the Authority will be forced to undertake the
necessary CSO control including plant expansion. The following project task activity schedule, as codified in the
April 12, 2007 Consent Order and Agreement, is shown in Table 2-3.
Table 2-3: Long-Term Combined Sewer Overflow (CSO) Control Plan Implementation Schedule
1. Start Construction of the Clearfield Borough Phase II CSO Separation Project
March 31, 2007
2. Submit Part II WQM Permit for the Clearfield Borough Phase III CSO Separation Project
March 31, 2007
3. Construction Completion of Clearfield Borough Phase I CSO Separation Project
June 30, 2007
4. Construction Completion of Clearfield Borough Phase IA CSO Separation Project
September 30, 2007
5. Submit Part II WQM Permit for the Lawrence Township Phase 2 Project
January 31, 2008
Clearfield Municipal Authority WWTF NRT Evaluation Report April 2008
2-5

Section 2: Summary of Existing Facilities and Conditions
6. Start Construction of the Clearfield Borough Phase III CSO Separation Project
September 30, 2008
7. Complete Construction of the Clearfield Borough Phase II CSO Separation Project
November 30, 2008
8. Start Construction of the Lawrence Township Phase 2 Project
May 31, 2009
9. Construction Completion of the Phase III CSO Separation Project
June 30, 2010
10. Construction Completion of the Lawrence Township Phase 2 Project
June 30, 2010
11. Begin Receiving Stream Monitoring
September 1, 2010
12. Completion of Lawrence Township Collection System Flow Monitoring to Determine Project Effectiveness with Data Compilation
June 30, 2011
13. Completion of Clearfield Borough Collection System Flow Monitoring to Determine Project Effectiveness with Data Compilation
June 30, 2011
14. Complete CSO Control Alternatives Evaluation/CSO Stream Monitoring, If Required
December 30, 2012
15. Complete Cost/Performance Considerations, If Required
December 30, 2013
16. If Required, Complete Design of CSO Control Facilities
December 30, 2014
17. If Required, Complete CSO Control Facilities Construction/Begin Post Construction Monitoring
December 30, 2017
18. If Required, Complete CSO Post-Construction Monitoring/ Effectiveness at LTCP December 30, 2019
The Authority will be unable to quantify the affect of the sewer replacement projects until 2012. For purposes on
this report, estimates of hydraulic flow capacity will provide relative magnitudes of cost comparison.
Clearfield Municipal Authority WWTF NRT Evaluation Report April 2008
2-6

Section 2: Summary of Existing Facilities and Conditions
2.3 Process Flow Description 2.3.1 Raw Wastewater Flow Pattern The CMA WWTF currently utilizes coarse bar screens and a gravity grit chamber for preliminary treatment. Activated sludge aeration and final settling are the facility’s main treatment processes (a suspended-growth, biological treatment system) to reduce effluent concentrations of BOD5 and suspended solids. An equally important requirement is that wet-weather flow reaching the facility be treated, including first-flush CSO. A by-product of the process is waste sludge or biosolids, which requires its own handling and treatment processes, as well as final disposal. The treatment process at the WWTF includes preliminary treatment (grit removal and coarse bar screens), primary settling, activated sludge system, secondary settling and disinfection (via chlorination). Waste sludge is processed through a gravity thickener, anaerobic digesters and centrifuge system with agricultural land application to area farms.
Raw sewage enters the plant via a 36" gravity interceptor sewer. Flow is processed through preliminary treatment, which consists of grit removal and coarse bar screening. During high flow/wet-weather events, flow can bypass the pretreatment process.
Raw sewage is then pumped to an influent distribution structure, which divides the flow into two primary settling tanks (PSTs). Effluent from the PSTs enters the primary effluent distribution box and then to the activated sludge aeration tanks. A bypass is available at the primary effluent distribution box to divert excess flow directly to the chlorine contact chambers.
Effluent from the activated sludge tanks is directed to secondary settling tank (SSTs) in a combined reactor-clarifier tank. Overflow from the SSTs enter a chlorine contact chamber for disinfection and then discharged via a 24-inch outfall sewer to the West Branch of Susquehanna River. The site layout and process flow schematic of the existing plant are shown in Figure 2-3 and Figure 2-4, respectively.
2.3.2 Sludge Handling Activated sludge is recovered from the SSTs. The sludge is either returned to the aeration tanks (return activated sludge, RAS) or conveyed to the sludge handling/processing facility as waste activated sludge (WAS). WAS is processed through the following processes: thickening, anaerobic digestion and dewatering (via a centrifuge). The processed sludge is disposed through agricultural land application. Filtrate from dewatering process is returned to the primary influent distribution box.
Clearfield Municipal Authority WWTF NRT Evaluation Report April 2008
2-7


Section 2: Summary of Existing Facilities and Conditions
2.4 Assessment of Existing Facilities and Equipment A critical analysis on the attributes of each existing individual unit process and associated equipments and facilities
is necessary. When considering NRT upgrade options, a close examination of facility’s current treatment processes
must be conducted to determine which unit process(es) should be modified and what major constraints are to be
applied to the NRT process selection.
2.4.1 Preliminary Treatment Effective screening and grit removal is critical to the performance of the activated sludge process and the final
settling tanks. The impact on the settling tanks is related to the quality and amount of sludge to be removed. High
amounts of coarse particles in the settling tanks may decrease the efficiency of the pumps and reduce the overall
contaminant removal efficiency of the entire treatment process. The preliminary treatment process (i.e. headworks)
currently employed at the CMA WWTF includes screening and grit removal. The unit consist of a reduced velocity,
gravity grit chamber and self-cleaning, coarse bar screen, both contained within a pretreatment area. These
processes are discussed in further detail in the following sections.
2.4.1.1 Influent Hydraulics A 36-inch outfall sewer discharges to the grit chamber. The capacity of this line is about 13 MGD. It was replaced
with a 36-inch ductile iron pipe in 1991 at a cost of $125,000. The line is quite deep (25-30 feet).
Assessment The 36-inch plant influent sewer is relatively new and in good condition. However, the excessive depth of the line
causes difficulties to retrofit/replace the existing pretreatment process at the current location. In all likelihood, the
plant outfall sewer and pretreatment process will have to be relocated farther upstream to avoid problems of
excessive depth and related cost.
2.4.1.2 Grit Chamber Plant influent enters a reduced-flow gravity grit chamber device. The existing grit chamber is unaerated, which is
suitable for an NRT process upgrade. A grit classifier collects accumulated grit and pumps the material to a
dumpster near the screenings building. A bypass channel is adjacent to the grit chamber, which is used to divert
excess flow to the river. Refer to Figure 2-5 for views of the existing chamber.
Clearfield Municipal Authority WWTF NRT Evaluation Report April 2008
2-8

Section 2: Summary of Existing Facilities and Conditions
Figure 2-5: Grit Chamber
Assessment The existing grit chamber continues to operate and could be used in a plant upgrade that utilized existing process
treatment units for BNR removal. The grit system has the advantage of gravity particle separation, thus minimizing
carbon loss in the raw sewage. However, operators report that the process is very maintenance intensive and located
in a corrosive and restrictive confined space. The depth of the grit chamber/grit classifier system will be difficult to
retrofit or replace. More modern and efficient systems exist that are considered more viable and operator friendly
while achieving a higher level of particle removal.
2.4.1.3 Bar Screens A self-cleaning, course bar screen protects the plant from inert solids. These solids can cause physical damage and
reduce the efficiency of downstream equipment and processes.
Assessment
Screening and grit removal equipment have limited serviceability due to corrosion and wear and are maintenance
intensive. Although the bar screen operates effectively, it was installed during the 1994 renovation project, so is
likely past the midway point of its expected design life. Moreover, according to the operating staff at plant, the
existing screen generally poses very frequent maintenance and repair tasks. In addition, the coarse (1”) bar spacing
and resulting inability to remove smaller solids and debris particles make the screens less suited for the desired
increased efficiency of downstream processes (clarifiers, new NRT, etc.). For NRT processes, fine screens with ¼’’
openings are suited best. So it is advisable to replace the existing coarse bar screens with fine screens.
Clearfield Municipal Authority WWTF NRT Evaluation Report April 2008
2-9

Section 2: Summary of Existing Facilities and Conditions
Figure 2-6: Bar Screen
2.4.2 Main Pumping Station The main pumping station at the plant is equipped with two Aurora® non-clog, variable speed sewage pumps and
one constant speed pump. Each is rated at maximum speed of 1,150 rpm at 48-feet total dynamic head to deliver
1,800 GPM. Total capacity of the pumping system is 7.8 MGD. The pump drivers are 30 HP units wound for 440
volts, 3 phase, 60 cycle power. Pumps are utilized to lift effluent sewage from the bar screen to the primary influent
distribution box.
Apart from sewage pumps, a grit pump is also used for pumping accumulated grit from the headworks building to
the grit classifier and then to the gravity thickener. Refer to Figure 2-7 and Figure 2-8 for the sewage pump and grit
pump, respectively.
Assessment The plant operating staff maintains the pumps in good condition, and apart from regular maintenance problems, may
be sufficient for the near future. The system could function in an NRT upgrade option that uses the existing facility.
The capacity of the station may be insufficient for peak flows in excess of plant capacity.
Clearfield Municipal Authority WWTF NRT Evaluation Report April 2008
2-10

Section 2: Summary of Existing Facilities and Conditions
Figure 2-7: Influent Pump
Figure 2-8: Grit Pump
Clearfield Municipal Authority WWTF NRT Evaluation Report April 2008
2-11
Section 2: Summary of Existing Facilities and Conditions
2.4.3 Primary Influent Distribution Structure
Sewage is pumped from the headworks building to the primary influent distribution box. This structure was constructed in 1977 during the last upgrade project. Weirs in the distribution box divide the flow equally between the primary settling tanks (PSTs) for initial sedimentation. Assessment
The distribution structure is in good condition and performs its designated function. The structure can be used in an NRT process utilizing components of the existing plant (i.e. primary sedimentation).
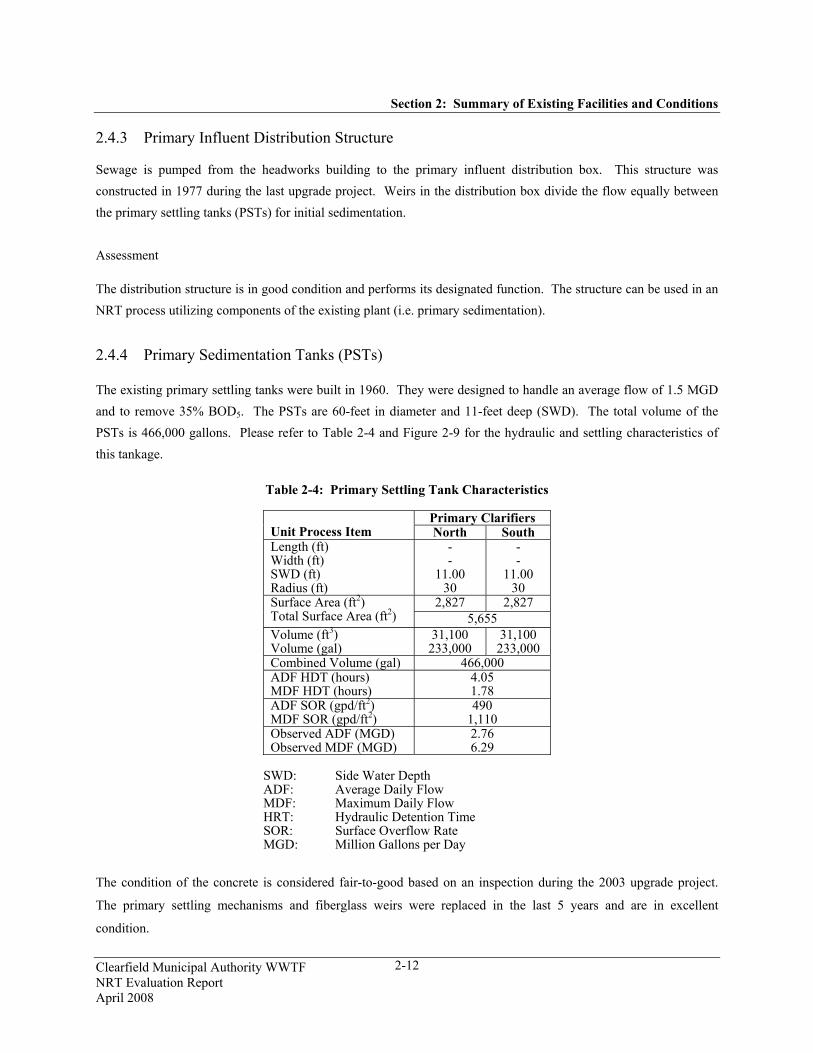
2.4.4 Primary Sedimentation Tanks (PSTs)
The existing primary settling tanks were built in 1960. They were designed to handle an average flow of 1.5 MGD and to remove 35% BOD5. The PSTs are 60-feet in diameter and 11-feet deep (SWD). The total volume of the PSTs is 466,000 gallons. Please refer to Table 2-4 and Figure 2-9 for the hydraulic and settling characteristics of this tankage.
Table 2-4: Primary Settling Tank Characteristics
Primary Clarifiers Unit Process Item North South Length (ft) Width (ft) SWD (ft) Radius (ft)
- -
11.00 30
- -
11.00 30
2,827 2,827 Surface Area (ft2) Total Surface Area (ft2) 5,655 Volume (ft3) Volume (gal)
31,100 233,000
31,100 233,000
Combined Volume (gal) 466,000 ADF HDT (hours) MDF HDT (hours)
4.05 1.78
ADF SOR (gpd/ft2) MDF SOR (gpd/ft2)
490 1,110
Observed ADF (MGD) Observed MDF (MGD)
2.76 6.29
SWD: Side Water Depth ADF: Average Daily Flow MDF: Maximum Daily Flow HRT: Hydraulic Detention Time SOR: Surface Overflow Rate MGD: Million Gallons per Day
The condition of the concrete is considered fair-to-good based on an inspection during the 2003 upgrade project.
The primary settling mechanisms and fiberglass weirs were replaced in the last 5 years and are in excellent
condition.
Clearfield Municipal Authority WWTF NRT Evaluation Report April 2008
2-12

Section 2: Summary of Existing Facilities and Conditions
The surface overflow rate (SOR) of the PSTs at ADF are currently in the range specified by DEP. However, the
SOR increases significantly as the flow increases especially to maximum daily flows of 6 MGD or more (1,000
GPD/SF or higher). An increase in SOR leads to decrease in the settling performance of the PSTs.
Assessment The primary settling tanks are in a serviceable condition for an NRT process that utilizes the existing facility. A
philosophical design question is posed for the need of primary treatment in an NRT process. However, the
primaries are well adapted to the anaerobic sludge digestion system since waste sludge is routinely directed to the
digesters. In addition, since the sludge thickener may be used as a carbon fermenter for one of the NRT options, the
fermentation of primary waste sludge (maximum carbon concentration) is both beneficial and desirable.
The recent replacement of the primary mechanisms and weirs have extended the useful life of the primary tanks
which would coincide with any compatible NRT process. Also, increased hydraulic design loadings would not
affect the primary settling tanks because peak flows would be step-fed around the process.
Clearfield Municipal Authority WWTF NRT Evaluation Report April 2008
2-13

Section 2: Summary of Existing Facilities and Conditions
Figure 2-9: Primary Settling Tank
2.4.5 Activated Sludge Aeration Tanks
The existing aeration tanks (or reactors) were originally designed in 1976. They operate as complete mix, activated
sludge (CMAS) reactors to achieve single-stage carbon oxidation. The CMAS process was chosen due to the
resultant benefits of its ability to handle a wide range of flows and because fewer treatment units were required.
Coarse bubble, swing-type air diffusers are used to accomplish aeration and mixing in the tanks.
An adjoining building near the aeration tank basins contains return sludge pumps and aeration blowers. The
building was constructed in the 1977 and appears to be in fair condition.
The two aeration tanks are arranged for parallel operation in a reactor-clarifier configuration. A distribution
structure equally directs flow to each tank. The tanks are 14.75-feet deep and provide a combined capacity of
900,000 gallons. Each tank surrounds a clarifier, which has diameter of 55-feet. Effluent from the aeration tanks
overflows to the clarifiers for settling of sludge. Please refer to Table 2-5 and Figure 2-10 for reactor characteristics.
Combined reactor clarifiers were commonly employed in the 1970's-80's because of the economical use of tankage
and cost savings resulting from inter-tank piping. We have not assessed the condition of concrete tankage, but the
operators report no major structural problems. The hydraulic characteristics of the aeration tank are shown in the
following table.
Clearfield Municipal Authority WWTF NRT Evaluation Report April 2008
2-14

Section 2: Summary of Existing Facilities and Conditions
Table 2-5: Aeration Tank Characteristics
Aeration Tanks Unit Process Item North South Length (ft) Width (ft) SWD (ft) Radius (ft)
249 14
14.67 -
249 14
14.67 -
3,192 3,192 Surface Area (ft2) Total Surface Area (ft2) 6,384 Volume (ft3) Volume (gal)
51,700 387,000
51,700 387,000
Combined Volume (gal) 774,000 ADF HDT (hours) MDF HDT (hours)
6.73 2.95
Observed ADF (MGD) Observed MDF (MGD)
2.76 6.29
SWD: Side Water Depth ADF: Average Daily Flow MDF: Maximum Daily Flow HRT: Hydraulic Detention Time SOR: Surface Overflow Rate MGD: Million Gallons per Day
Assessment Based on the limited volume of the aeration tank, detention times are reduced during peak flows. For instance, at a
projected peak daily flow of 13.5 MGD, the detention time is 1.4 hours. At the current permitted plant capacity of
4.5 MGD, the detention time is 4.1 hours, which is marginally sufficient for an activated sludge process. PADEP
requires 4 hours of detention time for an activated sludge process and up to 12 hours (but typically 8 hours) for a
nitrification process (ammonia nitrogen removal). In addition, low mixed liquor responded solids are indicative of
occasional dilution and possible solids washout during periods of high flow.
Given the NRT process requirements, the existing tankage will not be sufficient for rated plant capacity, let alone
potential future peak flow. Therefore, certain flows need be step-fed around the existing tankage for chemically
enhanced settling. The existing tanks can be retrofitted for an NRT process, but at a reduced flow.
Clearfield Municipal Authority WWTF NRT Evaluation Report April 2008
2-15

Section 2: Summary of Existing Facilities and Conditions
Figure 2-10: Aeration Tank, Circumference Around a Clarifier
The extensive sampling analysis performed during November 2007, revealed comparatively low concentrations of
(300-700 mg/L) of mixed liquor volatile suspended solids in the aeration tanks. It was also evident from the fact
that most of the NH4-N entering plant was leaving the plant without nitrification. Thus, to ensure higher solids
retention time (or less washout) and hence higher nitrification, nitrate sludge must be recycled at a higher rate.
The existing aeration tanks use coarse bubble air diffusers for aeration and mixing purposes. Coarse bubble diffusers
are less economical and have less oxygen transfer efficiency compared to fine bubble air diffusers. Thus, the
existing diffusers needs to be replaced by fine bubble diffusers for increased mixing and oxygenation required in
NRT oxic zones. The existing aeration blowers are not sufficient for the higher pressures of a fine bubble diffused
air system. The blowers will be replaced in an NRT process using the existing facility. The blower building should
be serviceable without major modifications.
The existing aeration tanks operate in a complete-mix rate (CMAs), which is not the most efficient approach for the
NRT process. Plug flow reactors (PFRs) are more suitable for nutrient removal processes. Thus, the existing
CMAS reactors need to be converted into PFR reactors. This can be achieved by dividing the existing tanks into
two halves by using baffle walls for the NRT oxic zones.
In summary, the existing activated sludge units can be retrofitted in an NRT process at a reduced flow. High flows
must be step-fed around the process. Also, fine bubble diffusers and new aeration blowers will be required.
Clearfield Municipal Authority WWTF NRT Evaluation Report April 2008
2-16

Section 2: Summary of Existing Facilities and Conditions
2.4.6 Secondary Sedimentation Tanks
The CMA WWTF utilizes two secondary settling tanks for final settling of solids from the activated sludge process with provision for return activated sludge. The tanks have a side-water depth of 8-feet and an effective surface area of 2,550 ft2 for a combined area of 5,100 ft2. The tanks provide a total volume of 300,000 gallons. As mentioned earlier, SSTs are surrounded by an outer ring of aeration tanks in a reactor-clarifier tank. Refer to Figure 2-11 and Table 2-6 for hydraulic characteristics. The existing sedimentation mechanisms and overflow weirs were constructed with the reactor-clarifiers in 1977. These mechanisms and weirs are reported to be in fair condition and could be serviceable in the future with continued maintenance. It is noted that the life of the original primary settling mechanisms was 45 years until their replacement in 2003.
Table 2-6: Secondary Settling Tanks Characteristics
Secondary Clarifiers Unit Process Item North South Length (ft) Width (ft) SWD (ft) Radius (ft)
- -
8.00 28.5
- -
8.00 28.5
2,552 2,552 Surface Area (ft2) Total Surface Area (ft2) 5,104 Volume (ft3) Volume (gal)
20,400 153,000
20,400 153,000
Combined Volume (gal) 306,000 ADF HDT (hours) MDF HDT (hours)
2.66 1.17
ADF SOR (gpd/ft2) MDF SOR (gpd/ft2)
540 1,230
Observed ADF (MGD) Observed MDF (MGD)
2.76 6.29
SWD: Side Water Depth ADF: Average Daily Flow MDF: Maximum Daily Flow HRT: Hydraulic Detention Time SOR: Surface Overflow Rate MGD: Million Gallons per Day
Assessment
The SSTs were designed for a peak flow of 5.5 MGD but they have consistently seen high flow of 6.0 MGD or higher. Peak flows of this magnitude have stressed the activated sludge process and particularly mixed liquor suspended solids concentrations critical for return activated sludge. At the current daily average flow of 2.76 MGD, surface overflow rate (SOR) is about 540 gpd/ft2, which is under the range specified by DEP (800-1,200 gpd/sf2). However, at higher flows (such as 6.3 MGD or above) the SOR increases to 1,230 gpd/ft2 causing decrease in the performance of the clarifiers and hence of the entire system.
Clearfield Municipal Authority WWTF NRT Evaluation Report April 2008
2-17

Section 2: Summary of Existing Facilities and Conditions
In summary, the secondary clarifiers could be used in an NRT process utilizing the existing facility. The secondary clarifiers could be used in a process where peak flows do not exceed 6.0 MGD and as long as the upstream CSO's are still functioning (i.e. existing conditions). However, if the ongoing sewer replacement projects are not effective in reducing total system peak flow, additional clarifiers and/or NRT reactor capacity will be required.
Figure 2-11: Secondary Settling Tank
2.4.7 Chlorine Disinfection
The secondary effluent is disinfected using free chlorine gas (through solution feed water) as the disinfecting agent. The WWTF has two contact chambers, which are 10.5-feet deep (SWD), 55-feet long and 15-feet wide. Each tank has the volume of 60,000 gallons and provides a detention time of 30 minutes at a flow of 3.0 MGD and 15 minutes at 6.0 MGD. The chambers utilize plug flow mechanics. Refer to Figure 2-12. The original chlorine contact tank was constructed in 1959 and was supplemented with a new tank in 1977. The condition of the concrete tanks and chlorine feed equipment appear to be in fair-to-good condition. Assessment As the NPDES permit does not include dechlorination or zero chlorine limits, the existing contact tanks could be used in an NRT process upgrade. However, if peak flows exceed 6.0 MGD, additional chlorine contact tanks and feed facilities will be needed. In this event, it is advisable to switch to UV disinfection. UV disinfection is safer and more efficient in operation. Also, the threat of stream toxicity is eliminated by use of UV.
Clearfield Municipal Authority WWTF NRT Evaluation Report April 2008
2-18

Section 2: Summary of Existing Facilities and Conditions
Figure 2-12: Chlorine Contact Chamber
2.4.8 Solids Handling System
The major components of the solids handling system at the WWTF are comprised of the following elements:
1. Thickening (Gravity Sludge Thickener)
2. Digestion (Two Anaerobic Digesters)
3. Dewatering (Centrifuge)
4. Disposal (Agricultural Land Application)
General
The current sludge handling configuration consists of 1) pumping waste activated sludge solids to the sludge
thickener, 2) pumping thickened solids to the primary (West) Anaerobic Digester, 3) transferring primary (West)
Digester solids to the secondary (East) Digester through an equalization line and 4) pumping digested sludge from
the secondary Digester to the centrifuge for dewatering.
Clearfield Municipal Authority WWTF NRT Evaluation Report April 2008
2-19

Section 2: Summary of Existing Facilities and Conditions
Figure 2-13: RAS and WAS Pumps
Sludge transfer of waste activated sludge (WAS) from the settling tanks to the digesters is accomplished through an
interconnected pumping/piping system which provides for a flexible flow pattern using sludge thickening as an
intermediate process. Also, scum from the primary and secondary settling tanks are pumped to the gravity
thickener. The condition of the transfer pumps and mechanical piping is in fair-to-good operating condition due to
regular maintenance by operating staff. Please refer to Figure 2-13.
Thickening
The existing gravity thickener at the WWTF is 6.3-feet deep with a 30-foot inside diameter. The total volume of the
thickener is 30,000 gallons. Refer to Figure 2-14. The thickener was constructed in 1977 as part of the plant
upgrade and expansion project. The thickener mechanism is over 30 years old, but should be in a functional
condition for an additional 10-15 years. No physical observations have been made of the mechanisms.
Based on data provided by operating personnel, thickened sludge had the following characteristics: Average
Volume Solids - 4.7%, Average Volatile Solids - 75%, Hydraulic Retention Time - 6.3 days, Average Digester Flow
- 4,770 gpd and Average Solids Loading - 3 lb/sq ft/day. However, the digester flow meter is not considered
accurate and the figures provided are estimated. The performance data from the digesters suggest that volume solids
and average volatile solids appear to be within standard parameters. But, the hydraulic retention time appears to
exceed 1-2 days (standard) and the solids loading rate is low (under 8 lb/ft2/day) indicative of low waste activated
sludge concentration and, therefore, low mixed liquor suspended solids and low return activated sludge.
Clearfield Municipal Authority WWTF NRT Evaluation Report April 2008
2-20

Section 2: Summary of Existing Facilities and Conditions
Figure 2-14: Sludge Thickener
Digestion The objectives of the anaerobic sludge digestion process (Figure 2-15) are to oxidize organics to stable end products, reduce the mass and volume of sludge and condition the sludge for solids disposal, i.e. agricultural land application purposes. The two digesters function in series with waste activated sludge from the thickener entering the primary digester and then into secondary digester. Each digester is 22-feet deep with an inside diameter of 45-feet. The volume of each digester is 260,000 gallons, providing a combined digester volume of 520,000 gallons. The anaerobic sludge digestion system was completely replaced in 2005. An Eimco® high rate sludge mixing system was installed with new floating covers. The sludge heating was also replaced. The upgrade of the system, in conjunction with the new centrifuge dewatering system, has greatly enhanced operating efficiency and performance. The sludge mixing system, in particular, has enhanced sludge stabilization and created a more consistent sludge product for dewatering and land application purposes. The digesters are in integral part of a reinforced concrete/brick facade control building. The roof was recently replaced in 2007. The condition of the building should be serviceable for the immediate future although the operator's room and laboratory are confined and lack adequate space. The quality of stabilized generally varies from 1.7 to 3.4%, volume of solids. The hydraulic retention time from 2005 to 2007 has averaged 77.5 days which may be considered typical for anaerobically digested solids. The average daily flow of stabilized solids for dewatering (cake solids) and land application (liquid solids) is 6,700 gallons/day. The difference between the flow to the thickener (4,700 gpd) may indicate unthickened waste solids are directly sent to the anaerobic digesters or errors with the thickener flow meter.
Clearfield Municipal Authority WWTF NRT Evaluation Report April 2008
2-21

Section 2: Summary of Existing Facilities and Conditions
Figure 2-15: Anaerobic Sludge Digester Floating Cover
Dewatering
Conditioned sludge from the secondary digester is pumped to the centrifuge, which is located inside a building next
to the thickener. The centrifuge unit used at the CMA WWTF is a Centramax® model by US Filter. The unit is
111-inches long, 54-inches wide and 43-inches deep. It is mounted horizontally on a concrete base. It has the
capacity to dewater 50-100 gpm of digested sludge. Polymer is fed through a feed system to enhance the dewatering
process. The unit was installed in 2005 with consistent solids percentages of 25-30%. The centrifuge operates
about 2 days per week, and 8-9 months per year. Operating data from 2005-2007 shows an average of 820 lb/day or
150 dry tons/year from this operation. This equates to about 62% of the total solids disposed at the WWTF. The
remaining solids (38%) are applied in liquid for about 3-4 months per year at 505 lbs/day or 62 dry tons/year.
Disposal
The ultimate means of biosolids disposal is agricultural land application at two area farms. The Conkey site (35
acres) is located adjacent to the plant and frequently receives liquid solids that are transported directly to the site.
The Sankey site (43 acres) is located several miles form the plant and therefore, receives cake solids. Liquid solids
are applied by a tanker truck with a nozzle applicator and cake solids applied by manure spreader. A new sludge
storage building was constructed in 2005 for winter storage of dried solids. The chemical biological analysis of the
digested sludge is provided in the following Table 2-7.
Clearfield Municipal Authority WWTF NRT Evaluation Report April 2008
2-22

Section 2: Summary of Existing Facilities and Conditions
Table 2-7: Trace Elements Concentration in Biosolids Generated
Pollutant
Average Concentration CMA
Sludge (mg/kg)
Maximum Concentration CMA
Sludge (mg/kg) Concentration Limit
(mg/kg) Arsenic 5.9 20 75 Cadmium 11.5 26 85 Chromium 44.8 85 --- Copper 39.0 581 4,300 Lead 79.4 126 840 Mercury 0.9 3.42 57 Molybdenum <10 41 75 Nickel 56.2 92 420 Selenium 5.1 10 100 Zinc 975.3 1,211 7,500
Table 3-8: Fecal Coliform Survey Results
Sample Date Digestor
(Primary/secondary) Geometric Mean
(Mpn/g) March 20, 2000 Primary 51,900 December 6, 2000 Secondary 4,437 December 11, 2000 Primary 10,019 December 12, 2001 Primary 109,960 April 8, 2002 Primary 17,009 April 8, 2002 Secondary 4,185
The chemical and biological data indicated that the sludge meets Class B pathogen limits under USEPA guidelines.
Assessment The recent upgrades to the anaerobic sludge digestion and dewatering system have greatly enhanced the stabilized
sludge product, reduced operating costs, provided more consistent performance and increased ease of operation.
The decision to construct a new facility will require a design decision on the use of either aerobic or anaerobic
digestion. Regardless, the existing sludge system can certainly be integrated in an NRT process.
Clearfield Municipal Authority WWTF NRT Evaluation Report April 2008
2-23

Section 3: Evaluation of NRT Process Options
Section 3: Evaluation of NRT Process Options 3.1 Introduction Several NRT options exist for achieving BNR compliance. Evaluation factors included site constraints, hydraulic
profile, existing process, operation and maintenance (O&M) and capital cost. Through a screening of available NRT
systems, the most viable processes will be further evaluated for the WWTF. Following this preliminary evaluation,
a detailed alternatives evaluation of viable processes will be conducted, including process computer modeling, site
layout, capital cost estimates and O&M costs.
While evaluating options, due consideration was given to the future effectiveness of the Clearfield Borough and
Lawrence Township sewer separation projects. The success of those projects will depend on CSO elimination and
reduction of peak flow to the treatment facility. For evaluation purposes, we have included projections of peak flow
(13.5 MGD) to the plant.
3.2 Preliminary NRT Evaluation From the outset of the project, several NRT processes were quickly evaluated to determine viable options for the
WWTF. The following options were screened on a preliminary basis. Table 3-1 shows the results of this
preliminary evaluation.
∗ Biological Nutrient Removal (BNR) NRT:
) Plug-Flow Activated Sludge (single-stage) NRT Process Upgrade (Modified Ludzack-
Ettinger [MLE], University of Cape Town/Virginia Initiative Plant [UCT/VIP],
Johannesburg, etc.)
) Plug-Flow Activated Sludge (single-stage) NRT Process Upgrade with Step-Feed
) Integrated Fixed-Film/Activated Sludge (IFAS [plastic media], single-stage)
∗ State of the Art (SOA) NRT:
) Plug-Flow Activated Sludge (single-stage) NRT Process Upgrade (as above) with
Denitrification (DN) Sand Filters
) Plug-Flow Activated Sludge (single-stage) NRT Process Upgrade (as above) with
Membrane Bioreactors (MBR)
Clearfield Municipal Authority WWTF NRT Evaluation Report April 2008
3-1

Section 3: Evaluation of NRT Process Options
Table 3-1: Preliminary NRT Process Evaluation Results
Process Option Result Reason
IFAS (plastic media) Do Not Evaluate Prohibitive capital cost.
Plug-Flow Activated Sludge NRT Process Upgrade with DN Sand Filters
Cursory Evaluation Only
Discussion/screening only, may not be applicable for current NPDES permit limits.
Plug-Flow Activated Sludge NRT Process Upgrade with MBR Do Not Evaluate Not needed to meet the current NPDES permit
nutrient limits. Plug-Flow Activated Sludge NRT Process Upgrade with Step-Feed (MLE, UCT/VIP,
Barden pho, etc.)
Evaluate MLE/ VIP Only
Adaptable to existing process; step-feeding at higher flows protects limited capacity reactors.
Some processes such as IFAS and MBR were eliminated from further investigation because of capital cost or
incompatibility with existing operations. Other options were modeled to assess their performance in meeting the
proposed effluent limits. A discussion of DN filters advantages and disadvantages will be done on a cursory basis.
As shown above, the Plug-Flow, Activated Sludge MLE/VIP Process with step feed will be evaluated further
through Biowin® modeling. The use of step-feeding is a necessary improvement in the process because of high flow
potential of the upstream sewer system.
The stand-alone MLE/VIP process will be evaluated with the step-feed option on the assumption that improvements
to the existing processes will be performed as part of the upgrade.
3.3 NRT Modeling Evaluation Based upon preliminary modeling results, the single stage step-feed MLE/VIP process (with supplemental chemical
feeding) has been selected as the best process option to meet the proposed effluent limits while maximizing use of
the existing facilities. However, the option will require upgrades/retrofits, to varying degrees of existing equipment
and the construction of additional reactor and settling capacity.
As discussed in Section 2.2, the current permitted ADF is 4.5 MGD with annual effluent nutrient loadings of 82,191
lbs/yr for total nitrogen (TN) and 10,959 lbs/yr for total phosphorus (TP). These loadings equate (based upon the
permitted ADF) to annual average concentration limits of 6 mg/l (TN) and 0.8 mg/l (TP). However, NPDES
effluent limits do not include instantaneous concentrations for TP, TN or Ammonia Nitrogen (NH3-N).
Clearfield Municipal Authority WWTF NRT Evaluation Report April 2008
3-2

Section 3: Evaluation of NRT Process Options
Therefore, the NRT modeling and facility/process upgrade recommendations are to be based upon the
abovementioned nutrient limits (TN ≤ 6 mg/L, TP ≤ 0.8 mg/L), which are based upon the design ADF of 4.5 MGD.
As indicated by preliminary modeling, the proposed processes have little difficulty in removing phosphorus at
average flows. Only peak flows, which are currently unknown, could cause concern. However, with increased
treatment capacity, the amount of TP at peak flow should be significantly reduced. With extra settling capacity,
additional measures to remove phosphorus (chemical precipitation, etc.) should not be needed.
It should be noted that CMA complies with the phosphorous limits because annual average daily flows do not
exceed plant capacity. A significant portion of flow is diverted through upstream CSO's along with an undetermined
amount of nitrogen and phosphorus. No significant population growth or new sewer connections are expected to
significantly increase average flows in the immediate future.
As stated, the Authority expects that the Borough and Township sewer replacement projects will significantly
reduce system inflow and infiltration. In fact, CMA has assumed that reduction of flow will be sufficient to
eliminate all CSO's without exceeding existing plant capacity. This assumption is the "lynchpin" of the Authority's
Long Term Control Plan.
Failure to achieve these goals could result in a significant plant expansion along with measures to protect the NRT
process during peak flow events. The results of the Borough/Township projects will not be known until after 2012.
The issue of peak flow and effect on the process treatment system is an unknown variable for this study. Therefore,
certain flow assumptions have been made to facilitate completion of this BNR evaluation.
3.4 Process Alternatives 3.4.1 Introduction The most common process configuration for activated sludge NRTs is the plug flow process, where flow enters a
reactor cell (zone) through one end, moves through the reactor like a plug through a channel (or a bullet through a
gun barrel), and leaves through the opposite end. There are many available variations of this, depending upon the
desired results. In nearly all plug flow activated sludge NRT processes, the following influent streams are
introduced to the upstream end of the reactor:
1. Raw wastewater
2. Return activated sludge (RAS)
3. Internal recycle flow
Clearfield Municipal Authority WWTF NRT Evaluation Report April 2008
3-3

Section 3: Evaluation of NRT Process Options
The majority of the suspended solids that exit from the reactor(s) to the secondary clarifier(s) (typical of activated
sludge processes) are returned to the reactors as RAS, with a fraction wasted (waste activated sludge-WAS),
maintaining a relatively constant quantity of activated sludge and suspended solids in the system. Activated sludge
is maintained in the reactor to consume the organics in the wastewater. The organics serve as food for the sludge, or
biomass, which reproduce and grow new cells in the activated sludge process. Plug-flow processes generally
produce better quality effluents than complete mix processes for a given reactor volume because they operate at
higher kinetic rates. This is a result of all of the food in the raw wastewater being mixed with a relatively small
amount of mixed liquor at the head of the reactor. This process prevents reaction rates from being limited by the
amount of food, which is what occurs in complete mix processes.
Plug flow processes are continuous flow, activated sludge processes in which the longitudinal dispersion of the
substrate is minimized to achieve faster reaction kinetics in smaller reactor volumes. Plug flow kinetics are
approximated in segmented tanks having a high length-to-width ratio, such as was the basis for this analysis.
Although operated in a complete mix mode, the circular tanks at the CMA WWTF can be retrofitted for plug flow
conversion. Although the existing cells in the tanks are circular, retrofitting them with internal baffle walls would
divide the cells (zones) into smaller subzones, allowing flow to be routed laterally back-and-forth from zone-to-
zone, closely approximating plug flow kinetics.
For most NRT systems, the initial reactor is unaerated (i.e. anoxic/anaerobic zones) with the latter parts of the
reactor aerated (i.e. oxic zones). In the aerated part, BOD is consumed and influent nitrogen is nitrified (i.e. NH4-N
is converted to NO3-N and NO2-N). The nitrified effluent, which is BOD deprived, is returned to unaerated zone of
the reactor where microorganisms convert NO3-N and NO2-N to N2 gas. The unaerated part is at front of the reactor
because the influent wastewater BOD serves as food for the microorganisms in the unaerated zone.
The activated sludge NRT processes that rely upon plug flow kinetics were evaluated for the NRT upgrade of the
CMA WWTF are as follows:
1. Modified Ludzack-Ettinger (MLE)
2. Virginia Initiative Plant (VIP)
These processes are to be evaluated in conjunction with the abovementioned plug flow-based processes. They are
described in further detail in the following sections.
Additionally, a discussion on DN sand filters is provided as an overview. Denitrification (DN) filters are considered
to be viable options, but were found to be unnecessary at this time (due to cost) and, therefore, not evaluated in
detail as a process option. However, DN filter may be needed in the future if stricter total maximum daily loads
(TMDL) limits are implemented.
Clearfield Municipal Authority WWTF NRT Evaluation Report April 2008
3-4

Section 3: Evaluation of NRT Process Options
3.4.2 Step-Feed Step-feeding is simply a method of bypassing flow from the beginning of the reactor to the end of the reactor. This process occurs at an increasing rate as flows increase (i.e. bypass flow increases, flow to the head of the reactor stays constant) in a step-wise manner, thus the term step-feed. This process reduces solids washouts from the up-front unaerated process zones, helping to preserve biomass in those zones. However, step-feeding alone does not provide adequate nutrient removal because most of the ammonia fed to the last oxic zone will not be nitrified and some of what does will not be recycled to be denitrified. It must be used in conjunction with NRTs such as MLE or VIP, and is only required during peak flows. The step-feed process is depicted within these NRT options’ process flow diagrams; see Figure 3-1 and Figure 3-2.
3.4.3 Modified Ludzack-Ettinger (MLE) Process The MLE process is an advanced activated sludge process designed to accomplish biological nitrogen removal. In the MLE process, nitrogen is removed in a two step process. In the first step, ammonia is oxidized into nitrites and then into nitrates in the oxic zone. In the second step, the nitrites and nitrates generated in the oxic zone are denitrified in the anoxic zone; however, the anoxic zone actually physically precedes the oxic zone in the reactor train. A nitrate recycle stream from the end of the (last) oxic zone pumps the nitrites and nitrates generated there to the anoxic zone (along with the RAS), as shown in Figure 3-1. The raw wastewater fed into the anoxic zone provides the carbon substrate required for the denitrification process in the form of readily biodegradable COD. In the MLE process, COD is stabilized both in the anoxic and oxic zones.
Figure 3-1: MLE Process Flow Schematic with Step Feed Option
Influent EffluentAx 1A Ox 2B Ox 3 Ox 4
WAS
Ax/Ox 1B
Trains 2-4 Inf
NaOH Addition
Ax/Ox 2A
As shown in Figure 3-1, the proposed MLE process would employ the flexibility to use one or several anoxic and
oxic subzones, to improve plug flow kinetics. A de-oxygenation zone would be included at the end of the oxic zone
to minimize the dissolved oxygen concentration in the nitrate recycle, which reduces anoxic zone performance
because the bacteria utilize oxygen preferentially over nitrate/nitrite. Dissolved oxygen in the nitrate recycle would
also promote the growth of filamentous bacteria that are responsible for poor sludge settling characteristics. The de-
oxygenation zone will limit dissolved oxygen in the nitrate recycle.
Clearfield Municipal Authority WWTF NRT Evaluation Report April 2008
3-5

Section 3: Evaluation of NRT Process Options
Preliminary modeling has shown the MLE process to be a suitable NRT upgrade option for the CMA WWTF at
average flows. The MLE process, though not adequate for phosphorus removal, can be used as a suitable process
since total annual phosphorus loadings are below the cap load limit. This is primarily because the actual average
flow (2.8MGD) is significantly lower than the ADF (4.5 MGD), which was used to assign the NPDES cap loads.
During peak flows, the introduction of step-feeding is necessary to protect the MLE process from solids wash-out.
Flows will be pumped around the reactors and discharged to secondary sedimentation tanks where chemical
coagulation will enhance solids settling.
3.4.4 Virginia Initiative Plant (VIP) Process The VIP process is an enhancement of the MLE process, with the ability to accomplish both biological nitrogen and
phosphorus removal. Even in VIP, nitrogen will be removed by the same process as the MLE (see above).
However, in the VIP process (contrary to MLE), the first part of the reactor is anaerobic (rather than anoxic), which
promotes enhanced biological phosphorus removal (EBPR). The anaerobic conditions stress the micro-organisms,
causing them to release phosphorus into solution as a survival mechanism. They then take back this phosphorus,
(plus excess phosphorus from the mixed liquor) in the oxic zones, providing the “luxury” uptake of phosphorus.
In addition to the nitrate recycle and RAS streams, an internal recycle stream located between the anoxic and oxic
zones is included with the VIP process, and is generally known as the mixed liquor recycle (MLR) stream. This
stream returns denitrified mixed liquor from the second (anoxic) zone to the first (anaerobic) zone to mix and react
with the raw wastewater. See Figure 3-2.
Figure 3-2: VIP Process Flow Schematic with Step Feed Option
Influent EffluentAn 1A Ox 2B Ox 3 Ox 4
WAS
Ax/Ox 1B
Trains 2-4 Inf
NaOH Addition
Ax/Ox 2A
As with MLE, preliminary modeling has shown the VIP process to be a suitable NRT upgrade option at the CMA
WWTF at average flows. During peak flow events, step-feeding is necessary to protect the VIP process from solids
washout.
Clearfield Municipal Authority WWTF NRT Evaluation Report April 2008
3-6

Section 3: Evaluation of NRT Process Options
3.4.5 NRT Process Upgrade with Denitrification Sand Filters Denitrification (DN) sand filters are a post-denitrification process that would follow the activated sludge treatment
process, receiving secondary settling effluent and filtering it before disinfection. So long as the filters are large
enough and sufficient carbon is fed (like Methanol), practically all of the nitrate can be removed. DN filters include
conventional deep bed filters and continuously recirculating filters such as Parkson Corporation’s Dynasand® filters.
DN filters are cost effective when the activated sludge process fails to meet a TN limit due to excessive nitrates.
Conventional deep bed DN filters (6’-8’ filter bed, 18’-20’ total depth) allow denitrifying bacteria to form a biofilm
and grow on the surface of the media. These filters would be added after the final settling tanks as a tertiary
treatment step.
DN filters operate by distributing filter influent down through the filter and over the biofilm, which denitrifies
influent nitrate to nitrogen gas. Effluent from the final settling tanks flows to the DN filter lift station and is
distributed to the filter cells. After passing through the filter media, the water flows through an under-drain system
and collects in the plenum before being combined with the effluent from the other filters and is sent to the effluent
pump station.
As the nitrogen gas is formed and trapped within the filter media, head loss builds on the filter. Once the head loss
reaches a set level, the filter will reverse flow and send nitrified effluent from the clear-well upwards through the
filter to release trapped nitrogen gas. Flow spills back into the effluent channel and is redistributed to the other
online filters, allowing the system to remain operational while this process occurs. Head loss may also buildup from
solids depositing in the filter pore space and biomass growth. A backwash cycle using air scour and water to
dislodge solids from the filter is scheduled to run about once every other day to clean the filter. Flow during the
backwash cycle comes from the clear-well (opposite direction), flows up through the filter, and is collected in the
mud well where it is gradually drained or pumped back to the head of the plant throughout the day.
DN filters are not cost effective when effluent nitrates are only 1 to 2 mg/L. The raw wastewater has, on average,
very low influent TN concentrations, so a relatively high fraction of this nitrogen is consumed in biomass growth.
This organic nitrogen is removed from the plant as waste activated sludge. Much of the remaining nitrogen is
nitrified, and the activated sludge NRT process has consistently been able to denitrify nearly all of the nitrates that
are produced. Therefore, DN filters were not modeled or considered in any further detail for this study.
Clearfield Municipal Authority WWTF NRT Evaluation Report April 2008
3-7

Section 3: Evaluation of NRT Process Options
3.5 CMA WWTF NRT Upgrade Options The Biowin® modeling concluded that the existing process is inadequate to achieve substantial nutrient removal. To achieve consistent year round nutrient reduction, the Biowin® modeling indicates the following process modifications:
∗ Finer screening of raw influent wastewater to preserve downstream process pumping/mixing equipment
∗ Grit removal system using gravity/centrifugal force to preserve carbon source in raw sewage
∗ Additional reactor volume for nitrification and denitrification
∗ Additional clarifier volume to handle projected peak flows and prevent solids washout
∗ Chemical addition to enhance solids settling during peak flow periods, enhance phosphorus
removal and provide additional carbon source for the NRT process Based on the above stipulations, four possible alternatives are proposed to achieve the nutrient limit:
∗ Option 1: New Treatment Plant
∗ Option 2: New Reactor Tanks with Existing Plant Upgrade
∗ Option 3: Upgrade Existing Plant/Process
∗ Option 4: Buy Nutrient Credits Only
3.6 Option 1: New Treatment Plant This option will examine the construction of a new wastewater treatment facility. The new WWTF will rely on the MLE/VIP process to consistently achieve BOD, TSS, nitrogen and phosphorus removal throughout the year. The main process operations will include new pretreatment building (with vortex grit removal and fine screening), reactor vessels, secondary settling tanks, UV disinfection and aerobic sludge processing/handling facility (using the existing centrifuge). The plant will have an average flow capacity of 4.5 MGD at a peak flow of 13.5 MGD (or three times the average daily flow). As previously stated, the estimate of peak flow is preliminary and will ultimately depend on the results of the sewer replacement project. Some elements of the existing plant are 50 years old, while the main process units are over 30 years old. From a depreciation standpoint, the existing plant components are reaching the end of their useful life, thereby giving justification for replacing all or a portion of the plant. Also, a new plant can be constructed without interrupting plant operations. Ultimately, the existing plant would be salvaged/abandoned except for some elements of the existing sludge handling system which can be retained.
Clearfield Municipal Authority WWTF NRT Evaluation Report April 2008
3-8

Section 3: Evaluation of NRT Process Options
The new plant will have following major process components:
a. Fine screening of raw influent wastewater to preserve process pumping/mixing equipment b. Two (2) vortex-type grit removal systems to preserve performance of submersible mixers and
retain influent carbon source c. Influent distribution structure to step-feed peak flows around the NRT process to the settling tanks d. Two (2) plug flow reactor vessels with anoxic and oxic zones to achieve nitrification and
denitrification e. Two (2) secondary settling tanks f. One (1) effluent distribution structure g. One (1) UV channel-type disinfection unit h. Two (2) aerobic digesters i. One (1) belt thickener j. One (1) sludge dewatering unit (relocation of centrifuge) k. Chemical feed system for carbon source, pH adjustment and settling enhancement
The NRT process of the system will consist of two (2) sets of reactor vessels and secondary settling tanks. Each reactor chain will consist of three (3) anoxic zones, one (1) anoxic/oxic zone and three (3) oxic zones. The system will employ two (2) clarifiers each for one chain. Due to larger capacity and detention time, the new plant will handle projected peak flows of 13.5 MGD or three times the average daily flow of 4.5 MGD.
The Biowin® schematic model of this NRT option is shown in Figure 3-3 showing two parallel treatment process. Several proposed site plans for this option are shown in Figure 3-4 and Figure 3-5. Please refer to Appendix A for detailed Biowin® modeling results. A summary of projected nutrient loadings are in Table 3-2.
Figure 3-3: Biowin Schematic Model of Option 1 and of Option 2
AX-1 AX-2 AX-3 (Parallel Treatment) Influent
OX-6 OX-5 AX/OX-4 Effluent OX-7 Secondary Clarifier
Waste Sludge
3-9
Table 3-2: Summary of Projected Effluent N and P Achieved by Option 1
Projecte Effluent NPDES Limit %
d
(lbs/yr) (lbs/yr) 10,602 10,959 3.26
TN 68,792 82,191 -16.30 TP - Option 1
. TN Loadings for Option 1 are calculated assuming that in the absence of primary clarifier in Option 1 10% more TN
will be removed due to more BOD availability. 2. TP loading will remain approximately at the same level as TP can be controlled by using polymer.
1
Clearfield Municipal Authority WWTF NRT Evaluation Report April 2008


Section 3: Evaluation of NRT Process Options
3-10
aile
Headworks
A new off-site headworks facility would be constructed utilizing fine screening and vortex grit removal. The facility
would be designed to adequately process a peak raw influent flow of 13.5 MGD. New raw sewage pumps rated for
peak flow capacity shall also be provided.
Reactor Influent Distribution Box
A new flow distribution box would be constructed to distribute the raw influent flow to the two (2) new NRT
reactors. The structure would be designed to adequately distribute a peak raw influent flow of 13.5 MGD, of which
up to 9.0 MGD would be equally distributed to the head of the reactors and 4.5 MGD would be equally distributed
to the last zone of the reactors as part of the peak flow bypass/step-feed process.
Two BNR (MLE) Reactors
Two new, concrete MLE reactor tanks would be constructed, each having a 20-foot side water depth (SWD). The
reactors would be constructed side-by-side within a concrete basin constructed of 22-foot deep (with 2-foot of
freeboard) exterior concrete walls. The common interior wall separating the reactors will also be 22-feet deep.
Each reactor would be comprised of the following components (note - volumes are one-half total).
1) Dedicated Anoxic (Unaerated) Zones (Pass #1) - The first three reactor zones (Zones #1, #2, & #3)
would each have a capacity of 150,000 gallons (gal) and would be dedicated anoxic zones in
which the raw influent wastewater would be denitrified. A new submersible mixer (to achieve
complete mixing, see below for further details) would be installed in each zone.
2) Anoxic/Oxic (Unaerated/Aerated) Switch Zone - A new submersible mixer and new air diffusers
(elastomer membrane type) would be installed in Zone #4, a “switch” zone (150,000 gal) that can
be operated under anoxic (unaerated, using a submersible mixer) or oxic (aerated, using air
diffusers) conditions.
3) Dedicated Oxic (Aerated) Zones - In each of the following zones, new aeration equipment
(headers and elastomer membrane diffusers) would be installed to maintain aerated (oxic)
conditions to achieve nitrification.
a. Zone #5 (Pass #2) would be 150,000 gal.
b. Zone #6 (Pass #2/#3) would be comprised of two conjoined, rectangular sections, the first
being for a total capacity of 240,000 gal.
c. Zone #7 (Pass #3) would be 380,000 gal.
A det d discussion of each process component is as follows:
Clearfield Municipal Authority WWTF NRT Evaluation Report April 2008

Section 3: Evaluation of NRT Process Options
3-11
are required for proper flow control in the reactors
and would improve performance.
a. Step-Feed (Peak Flow Bypass) - Because the system would have great difficulty in
avoiding solids washouts at peak flows, it requires step-feeding in order to bypass the
additional amount of flow to the last oxic zone. This zone would treat the dilute
ter in a "contact-stabilization" mode. To achieve this requirement, new piping
few feet of clearance at one end
would be built-in for flow to communicate from one pass to the next.
d. Underflow Ports - One underflow port would be installed in each internal baffle wall to
gpm) pumps and
associated piping would be installed to return the nitrified mixed liquor to the first
5)
a. Submersible Mixers - To achieve complete mixing under unaerated conditions, a new
9,000 gpm submersible mixer would be installed in each Zone: #1, #2, #3, & #4.
b. Aeration System - To achieve full nitrification under aerated conditions and complete
installed, including:
4) Flow Control - The following improvements
wastewa
would be utilized to route the step-feed flow.
b. Internal Divider Walls - Two (2) internal divider walls, each 22-foot in height, would be
constructed to separate each of the three passes. A
c. Internal Baffle Walls - Five (5) submerged, internal baffle walls would be constructed,
separating both Zones #1 and #2. Each wall would be full-width across the pass and
slightly submerged beneath the water surface.
conduct flow in a meandering pattern. To achieve this, the ports would be installed in an
alternating pattern.
e. Internal (Nitrate) Recycle - Two (2) new 2,400 gallons-per-minute (
(anoxic) zone of the reactor.
Mixing & Aeration
mixing, one new aeration system would be
Clearfield Municipal Authority WWTF NRT Evaluation Report April 2008

Section 3: Evaluation of NRT Process Options
3-12
ers would be installed. Three (3) blowers would normally
operate while the fourth would act as a backup blower.
iii. Elastomer Membrane Fine Bubble Air Diffusers - New elastomer membrane
Clarifier Influent Distribu
One clarifier influent distribution box would be constructed to collect/combine the reactors’ effluent and to
distribute flow to two n
Two Secondary Clarifiers
Two (2) new sec ary clarifiers will be provided with a 100-foot minimum diameter and 12-foot depth each. At
this size, the tota tentio
The size of the clarifiers
mechanism, influent well, d RAS piping, inboard effluent launders (with sloped density current
baffles) and scum ollector.
For an average daily flow
recommended criteria. D one (1) clarifier could be utilized to increase the surface
overflow rate and e reactivated during peak flow events.
Ultravio t (UV) Disinfection
A channel-type u iolet
and related safety and stre
Chemical Feed S s
1) Caustic ep pH above 6.0. A bulk
orage tank, metering pump, and associated piping would need to be installed.
i. Air Supply Centrifugal Blowers - Four (4) new 2,700 ICFM (at 10 psi)
centrifugal blow
ii. Air Supply and Distribution Piping - New air supply and distribution piping
would be installed to direct and distribute air from the centrifugal blowers to the
diffusers in Zones #4, #5, #6, & #7.
fine bubble air diffusers would be installed in Zones #4, #5, #6, & #7.
tion Box
the ew secondary clarifiers.
ond
l de n time at 13.5 MGD is 2.5 hours and the surface overflow rate would be 850 GPD/SF.
will be finalized in final design. Each clarifier will be equipped with a sludge collector
underslab influent an
c
of 4.5 MGD, the surface overflow rate is 340 GPD/SF and 7.8 hours which may exceed
uring periods of low flow,
b
le
ltrav system, sized for the peak flow rate of 13.5 MGD, will eliminate the need for chlorination
am toxicity considerations.
ystem
Soda - Caustic soda is necessary during wet weather flows to ke
st
Clearfield Municipal Authority WWTF NRT Evaluation Report April 2008

Section 3: Evaluation of NRT Process Options
3-13
2) Methano etha
loadings and/or d
piping would nee
3) Alum, P er a
suspended solids
phosphorus (TP) l
Solids Handling
1) Three (3) new ret r and are
rated at 1,200 gpm.
2) Two (2) new waste activated sludge pumps rated for 30 gpm.
3) Sludge Thickener - A new 0.75-meter gravity belt thickener (GBT) would be installed to thicken
waste activated sludge (WAS) prior to digestion.
th associated piping and coarse bubble diffusers would be installed to provide air to the
digesters. The digesters will provide a 20-day hydraulic detention time (HDT) at normal influent
ld be relocated to the new plant to dewater the aerobically
digested, waste activated sludge.
al buildings to house administrative, laboratory and control nctions along with solids handling, pumping, aeration blowers, chemical feed/storage systems and UV equipment
Plant Co l Sys
The proposed up mplexity of the
facility. A significant number of process control points and sequences have to be incorporated in an NRT control
system. A supervisory control and data acquisition system (SCADA) should be installed to control plant operations, monitor process parameters and generate data and reports.
l - M nol is necessary to trim effluent nutrient levels during periods of heavy pollutant
uring wet weather flows. A bulk storage tank, metering pump, and associated
d to be installed.
olym nd/or Other Coagulant Aids - Coagulant aids are necessary to trim effluent
levels during wet weather flows. This would also aid in lowering effluent total
evels as well.
urn activated sludge pumps are required to return nitrate mixed liquo
4) Aerobic Digesters - Two (2) new, rectangular aerobic digesters would be constructed to reduce the
volume of solids that require disposal. The digesters would adjoin the new reactors and would
each be 79’-6” l x 30’-0” w x 20’ SWD (356,800 gal). The walls of the digesters would be 22-
foot in height, constructed of concrete. Additionally, two new 2,500 ICFM (at 10 psi) centrifugal
blowers wi
flows.
5) Centrifuge - The existing centrifuge wou
Control and Mechanical Buildings
The new facility will require control and mechanicfu
ntro tem
grades to the wastewater treatment facility will vastly increase the operating co
Clearfield Municipal Authority WWTF NRT Evaluation Report April 2008

Section 3: Evaluation of NRT Process Options
3-14
Program e Lo
only used in mu
available from a ctrical equipment. Due to the wide availability of systems, the
PLC's are a cost effective and reliable operating platform for the monitoring and control system.
3.7 Option Option 2 also utilizes the MLE/VIP process but maximizes use of the existing facility will be made to use the
the maximum. New facilities include two (2) new reactor vessels, two (2) new circular clarifiers,
new hea rks/p
follows.
pumping/mixing equipment
. Two (2) vortex-type grit removal systems to preserve performance of submersible mixers and
c. ws around the NRT process to the settling tanks
. Two (2) plug flow reactor vessels with anoxic and oxic zones to achieve nitrification and
e.
f.
g.
fermenter
h. Chemical feed system for carbon source, pH adjustment and settling enhancement
The flow schematic and tank sizes will remain same as Option 1. Please refer to Figure 3-3 and Table 3-2,
respectively. Th Option 2 is shown in Figure 3-6. Please refer to the Appendix
r detailed Biowin® modeling results and Table 3-3 for projected nutrient loadings.
mary of Projected Effluent N and P Achieved by Option 2
(lbs/yr) (lbs/yr) %
mabl gic Controllers (PLC's) have become the standard for SCADA systems. These systems are not
nicipal applications, but also for the automation of industrial applications. PLC systems are
number of the lead providers of ele
2: New Reactor Tanks with Existing Plant Upgrade
existing facility to
dwo retreatment building (with fine screening and vortex grit removal) and new UV disinfection unit as
a. Fine screening of raw influent wastewater to preserve process
b
retain influent carbon source
Influent distribution structure to step-feed peak flo
d
denitrification
Conversion of two (2) existing reactor-clarifiers to full clarification tanks
One (1) UV channel-type disinfection unit
Reuse of anaerobic digesters and centrifuge; conversion of existing thickener to a primary sludge
e proposed site plan layout for the
fo
Table 3-3: Sum
Projected Effluent NPDES Limit
TP 10,602 10,959 -3.26 Option 2 TN 76,435 82,191 -7.00 1. TP loading will remain approximately at the same level as TP can be controlled by using polymer.
Clearfield Municipal Authority WWTF NRT Evaluation Report April 2008
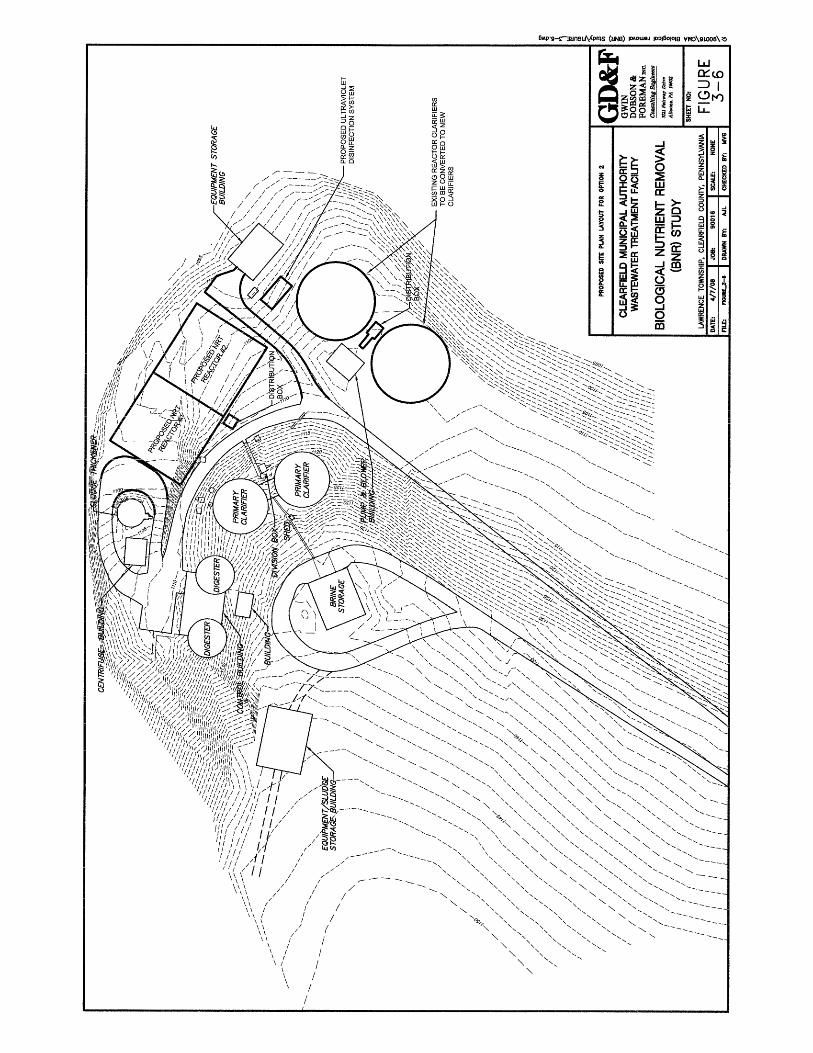

Section 3: Evaluation of NRT Process Options
New Headworks
A new off-site headworks facility would be constructed utilizing fine screening and vortex grit removal. The facility
would be designed to adequately process a peak raw influent flow of 13.5 MGD. New raw sewage pumps rated for
peak flow capacity shall also be provided.
3-15
ary
he existing 24-inch primary effluent piping from existing Manhole No. 3 to the secondary process distribution box
tor Influent Distribution Box
new flow distribution box would be constructed or installed to distribute the primary effluent flow to the two new
reactors. e str GD, of
which, u 9.0
distributed to the t of the peak flow bypass/step-feed process.
Two New BNR (M
Two new, concre rs would be constructed, each having a 20-foot side water depth (SWD). The
reactors t deep exterior concrete
walls (with 2-foo parating the reactors will also be 22-feet deep. Each
reactor would be
s #1, #2, & #3)
would each have a capacity of 160,000 gallons and would be dedicated anoxic zones in which the
2) A new air diffusers
(elastomer membrane type) would be in alled in Zone #4, a “switch” zone (160,000 gal) that can
be operated under anoxic (unaerat a submersibl or oxic (aerate sing air
diffusers) cond s.
ration equipment
(headers and elastomer membrane diffusers) would be installed to maintain aerated (oxic)
conditions to achieve nitrification.
Prim Effluent Piping Relocation
T
will be abandoned-in-place. The new outfall pipe will run from Manhole No. 3 to the new reactor influent
distribution box, and then to the new reactors.
New Reac
A
Th ucture would be designed to adequately distribute a peak primary effluent flow of 13.5 M
p to MGD would be equally distributed to the head of the reactors and 4.5 MGD would be equally
last zone of the reactors as par
LE) Reactors
te MLE reacto
would be constructed side-by-side within a concrete basin constructed of 22-foo
t freeboard). The common interior wall se
comprised of the following components (note - volumes are one-half the total).
1) Dedicated Anoxic (Unaerated) Zones (Pass #1) - The first three reactor zones (Zone
primary effluent wastewater would be denitrified. Two internal baffle walls (see below) would
separate the zones and a new submersible mixer (to achieve complete mixing) would be installed
in each zone.
noxic/Oxic (Unaerated/Aerated) Switch Zone - A new submersible mixer and
st
ed, using e mixer) d, u
ition
3) Dedicated Oxic (Aerated) Zones - In each of the following zones, new ae
Clearfield Municipal Authority WWTF NRT Evaluation Report April 2008

Section 3: Evaluation of NRT Process Options
3-16
a. Zone #5 (Pass #2) would be 160,000 gal.
3) would be 380,000 gal.
e following improvements are required for proper flow control in the reactors
ow Bypass) - Because the system would have great difficulty in
avoiding solids washouts at peak flows, they require step-feeding in order to bypass the
ount of flow to the last oxic zone. This zone would treat the dilute
would be utilized to route the step-feed flow.
b. Internal Divider Walls - Two internal divider walls, each 22-foot in height, would be
constructed to separate each of the three passes. A few feet of clearance at one end
would be built in for flow to communicate from one pass to the next.
pass and slightly
submerged beneath the water surface.
e. Internal (Nitrate) Recycle - Two new 2,400 gpm pumps and associated piping would be
6)
b. Zone #6 (Pass #2/#3) would be comprised of two conjoined, rectangular sections, the first
being for a total capacity of 250,000 gal.
c. Zone #7 (Pass #
4) Flow Control - Th
and would improve performance.
a. Step-Feed (Peak Fl
additional am
wastewater in a contact-stabilization mode. To achieve this requirement, new piping
c. Internal Baffle Walls - Five submerged, internal baffle walls would be constructed,
separating each zone. Each wall would be full-width across the
d. Underflow Ports - One underflow port would be installed in each internal baffle wall to
conduct flow in a meandering pattern. To achieve this, the ports would be installed in an
alternating pattern.
installed inside the existing pump and blower building to return the nitrified mixed liquor
to the first (anoxic) zone of the reactor.
Mixing & Aeration
a. New Submersible Mixers - To achieve complete mixing under unaerated conditions, one
new 9,000 gpm submersible mixer would be installed in each Zone: #1, #2, #3, & #4.
Clearfield Municipal Authority WWTF NRT Evaluation Report April 2008

Section 3: Evaluation of NRT Process Options
3-17
ll nitrification under aerated conditions and
s - Four (4) new 2,700 ICFM (at 10 psi)
centrifugal blowers would be installed in the existing pump and blower building.
pressures of the new fine bubble diffusers. Three (3) blowers would normally operate, while the fourth would act as a backup.
ii. Air Supply and Distribution Piping - New air supply and distribution piping
Air Diffusers - New elastomer membrane fine bubble air diffusers would be installed in Zones #4, #5, #6, & #7.
Retrofit Existing Clarifier The existing clarifier influ nt and to distribute the flow to the tw erted secondary clarifiers. At a peak flow of 13.5 MGD, the combined surface overflow rate is 1,000 GPD/SF and t For an average daily flow is 340 GPD/SF and a detention time of 7.8 hours which may exceed recommended criteria. During periods of low flow, one (1) clarifier could be utilized to increase the surface overflow rate (and decrease the detention time to prevent bacteriological formation) and then reactivated during peak flow nts. Convert Existing Reactor rifiers The existing reactor-clarifier tanks would be converted to full-on, secondary clarifiers each 92-feet in diameter, for a combined, total s ce are
1) Remove rifiers and aeration tanks. 2) emove the false floors, deepen the clarifiers from 8-foot to 14.7-feet (side water depth), and
m slab. ) Replace the existing clarifier mechanisms with new clarifier mechanisms consisting of sludge
4) Install n .
b. New Aeration System - To achieve fucomplete mixing, one new aeration system would be installed, including:
i. Air Supply Centrifugal Blower
The existing aeration blowers are not adequate due to the increased operating
would be installed to direct and distribute air from the centrifugal blowers to the new diffusers (see below) in the oxic (aerated) zones (Zones #4, #5, #6, & #7).
iii. Elastomer Membrane Fine Bubble
Influent Distribution Box ent distribution box will be modified to collect/combine reactor efflue
o convhe detention time is 2.6 hours, which are acceptable.
of 4.5 MGD, the surface overflow rate
eve
Clarifier Tanks to Cla
urfa a of 13,300 ft2. The necessary renovations are as follows:
the existing divider wall between the claRinstall a new concrete botto
3collector, scum collector; influent well and access bridge.
ew effluent launders on the outside wall of the tank using sloped density current baffles
Clearfield Municipal Authority WWTF NRT Evaluation Report April 2008

Section 3: Evaluation of NRT Process Options
3-18
New Ultraviolet ( DisiA channel-type ultraviolet r chlorination and related safety and stream toxicity considerations. New Chemical Feed Systems
1) Caustic Soda- CaA bulk storage tank, metering pump, and associated piping would need to be installed.
2) Methanol - Meth ring periods of heavy pollutant
loadings and/or during wet weather flows. A bulk storage tank, metering pump, and associated piping w nee
3) Alum, Polymer t
suspende solids levels during wet weather flows. This would aid in lowering effluent total phospho P) l
Solids Handling
robic digestion system and dewatering facility. The sludge
Convert Existing Sludge Thickener to Primary Sludge Fermenter This task will entail replacing the existing mechanism with modified equipment for primary sludge fermentation.
he proposed upgrades to the wastewater treatment facility will vastly increase the operating complexity of the ts and sequences have to be incorporated in an NRT control
Program e L These systems are not only use muavailable from a trical equipment. Due to the wide availability of the systems, the PLC's are a cost effective and reliable operating platform for a monitoring and control system. Upgrade of ExisThe new ility s along wi solids handling, pumping, aeration blowers, chemical feed/storage systems and UV equipment.
UV) nfection system, sized for the peak flow rate of 13.5 MGD, will eliminate the need fo
ustic soda is necessary during wet weather flows to keep pH between 6.0 and 9.0.
anol is necessary to trim effluent nutrient levels du
ould d to be installed.
and/or Other Coagulant Aids - Coagulant aids are necessary to trim effluend
rus (T evels as well.
This option will utilize the nearly renovated anaehandling system was upgraded in the last five years and is functioning in an efficient manner, producing stabilized sludge of exceptional quality.
This process will generate additional carbon for the NRT process. A fiberglass cover may be needed for odor control. Plant Control System Tfacility. A significant number of process control poinsystem. A supervisory control and data acquisition system (SCADA) should be installed to control plant operations, monitor process parameters and generate data and reports.
mabl ogic Controllers (PLC's) have become the standard for SCADA systems. d in nicipal applications, but also for the automation of industrial applications. PLC systems are
number of the lead providers of elec
ting Control and Mechanical Buildings fac will require upgrade of control and mechanical buildings to house laboratory and control functionth
Clearfield Municipal Authority WWTF NRT Evaluation Report April 2008

Section 3: Evaluation of NRT Process Options
3-19
xisting Plant/Process
fications to the existing system to achieve the best possible utrient removal using the MLE process. This option provides the maximum nutrient removal within the capacity of
ly, the amount of nutrient removal is less than Options 1 and 2 since those alternatives have mu reate Option 3 rimarily includes installing a 320,000 gallons anoxic tank and dividing the existing aeration tank into two aerated s zonesan MLE process t
Retrofitting the existing plant will bring the TN and TP under the NPDES limit of 6 mg/L and 0.8 mg/L at the current ge dincreases resultinbe under the NPDES load limits when combined with loadings treated during average daily flow periods.
ities may not be feasible in a future plant upgrade. The process modifications and dditions are described as follows:
zone and then onto the clarifiers. b. A new anoxic tank of 320,000 gallons capacity. This zone will accomplish denitrification of the
ied return flow from the oxic zones.
r better aeration and mixing of the oxic zone. f. Higher pumping and piping capacity is required because MLE process requires higher flows to be
rimary Effluent Piping Relocation anhole No. 3 to the secondary process distribution box
3.8 Option 3: Upgrade E The following option describes improvements and modinthe existing tankage. Obvious
ch g r hydraulic capacity.
pub- . The plant will rely on the existing primary settling tanks and coversion of the reactor-clarifiers to
o achieve nominal nutrient removal at average daily flow.
avera aily flow of 2.8 MGD. However, during higher flows, performance will decrease as the flow g in higher nutrient loadings during these events. It is hoped that the average annual loading will
This option is considered an interim solution since future peak flows are unknown. It is unlikely that future peak flows will be within existing plant capacity after all upstream sewer work is completed and all CSO's are closed. Also, reuse of converted facila
a. A new distribution structure, with flow regulating weirs, after the primary settling tanks. This structure will control the flow entering the anoxic zone by step-feeding high flows to last aeration
nitrifc. Installation of submersible mixers in the anoxic zone for the complete mixing of mixed liquor. d. Installation of baffle walls in existing aeration tanks to divide the volume into halves to achieve
plug flow mechanics. e. Installation of fine bubble air diffusers fo
recycled back to the anoxic zone. g. Chemical precipitation, pH adjustment and settling enhancement will require methanol, caustic
soda, alum and polymer chemical feed systems.
PThe existing 24-inch primary effluent piping from existing Mwill be abandoned-in-place. The new outfall pipe will run from Manhole No. 3 to the new reactor influent distribution box, and then to the new reactors.
Clearfield Municipal Authority WWTF NRT Evaluation Report April 2008

Section 3: Evaluation of NRT Process Options
3-20
Rea
new flow distribution box will be constructed to distribute the primary effluent flow to the two converted reactors.
5.0 MGD would be equally distributed to the new anoxic tank (see below) and 1.3 MGD would be equally
distributed to the last zone of the reactors as part of the peak flow bypass/step-feed process.
completely mixed, anoxic (unaerated)
conditions.
s for each
xisting reactor (note - volumes are one-half total).
cities.
a. Zone #1 - 300,000 gal
2) nts are required for proper flow control in the reactors
ak Flow Bypass) - Because the system would have great difficulty in
pass the
mode. To achieve this requirement, new piping would be
b. Internal Baffle Wall - One submerged, internal baffle wall would be constructed inside
tly submerged beneath the water surface.
New ctor Influent Distribution Box
A
The structure would be designed to adequately distribute a peak primary effluent flow of 6.3 MGD, of which, up to
New Anoxic Tank
A new 320,000 gal (approx.) tank will be constructed and serve as the first anoxic zone for each reactor. The tank
would use a 16,000 gpm vertical-mounted submersible mixer to maintain
Conversion of Existing Reactors to BNR Reactors
The two existing reactors (14.7’ SWD) will need to be upgraded and converted to operate more effectively within
the proposed BNR (MLE) process. The conversion procedure encompasses the following modification
e
1) New Dedicated Oxic (Aerated) Zones - Two new, oxic reactor zones would be created in each
existing aeration tank through the installation of baffle walls and will have the following
approximate capa
b. Zone #2 - 100,000 gal
Flow Control - The following improveme
and would improve performance.
a. Step-Feed (Pe
avoiding solids washouts at peak flows, step-feeding is required in order to by
excess amount of flow to the last oxic zone. This zone would treat the dilute wastewater
in a contact-stabilization
utilized to route the step-feed flow from the reactor influent distribution box to the last
zone in each reactor.
the existing aeration tank, creating Zones #1 and #2. The wall would be full-width across
the reactor and sligh
Clearfield Municipal Authority WWTF NRT Evaluation Report April 2008

Section 3: Evaluation of NRT Process Options
3-21
orts - One underflow port would be installed in the internal baffle wall to
) to return the nitrified
mixed liquor to the anoxic tank.
a. Air Supply Centrifugal Blowers - Four (4) new 2,000 ICFM (at 10 psi) centrifugal
lled in the existing pump and blower building. The existing
aeration blowers are not adequate due to the increased operating pressures of the new fine
bubble diffusers. Three (3) blowers would normally operate while the fourth would act
as a backup blower.
b. Air Supply and Distribution Piping - New air supply and distribution piping would be
t and distribute air from the centrifugal blowers to the new diffusers (see
below) in the upgraded aeration tanks (reactors).
ine Bubble Air Diffusers - New elastomer membrane fine bubble
air diffusers would be installed in the converted aeration tanks (reactors).
New Chemical Fe
1)
storage t
2) Methano
loadings
piping a
3) , P
suspende
phospho
c. Underflow P
conduct flow from the end of Zone #1 to the head of Zone #2.
d. Internal (Nitrate) Recycle - One new 1,200 gpm submersible pump (and associated
piping) would be installed inside Zone #2 (near the effluent end
2) New Aeration System - To achieve full nitrification under aerated conditions and complete
mixing, one new aeration system would be installed, including:
blowers would be insta
installed to direc
c. Elastomer Membrane F
ed Systems
Caustic Soda - Caustic soda is necessary during wet weather flows to keep pH above 6.0. A bulk
ank, metering pump, and associated piping would need to be installed.
l - Methanol is necessary to trim effluent nutrient levels during periods of heavy pollutant
and/or during wet weather flows. A bulk storage tank, metering pump, and associated
re required.
Alum olymer and/or Other Coagulant Aids - Coagulant aids are necessary to trim effluent
d solids levels during wet weather flows. This would also aid in lowering effluent total
rus (TP) levels as well.
Clearfield Municipal Authority WWTF NRT Evaluation Report April 2008

Section 3: Evaluation of NRT Process Options
3-22
A summary of the Biowin
and peak flow conditions i
ble 3
(lbs/yr) %
® modeling results yielded the following nutrient loadings at current average daily flow
s shown in Table 3-3 below:
Ta -4: Summary of Projected Effluent N and P Achieved by Option 3
Projected Effluent,
(lbs/yr) NPDES Limit, Exceedence
TP 9,200 10,959 -16 TN 90,000 82,191 10
The Biowin® process schematic of Option 3 is shown in Figure 3-7 with a diagrammatic schematic representation is
shown in Figure 3-8. The site plan layout of the Option 3 is shown in Figure 3-9.
Figure 3-7: Biowin Schematic Model of Option 3
nt) NaOHMethanol
Influent Secondary Clarifier
(Parallel Treatme
Prima larifie
The detailed Biowin® modeling results obtained from the simulations performed on the yearly hydraulic loading
data are shown in Appendix B.
Effluentry C r AX-1 OX-2 OX-3
Waste Sludge
Clearfield Municipal Authority WWTF NRT Evaluation Report April 2008


Section 3: Evaluation of NRT Process Options
3-23
A possible option is to defer any modification project and buy credits from the PADEP Nutrient Trading Program of
PADEP. A summ .
Ta e
Influent (lbs/yr)
t )
NPDES L
(lExceeden
(lbs/yr redits redits @ $5/lb
Credits @ $9/lb
3.9 Option 4: Buy Nutrient Credits Only
ary of estimate credit purchases for 2007 is shown for illustrative purposes below
ble 3-5: Nutrient Cr dit Analysis
Effluen(lbs/yr
imit bs/yr)
ce ) C
C
TP 19,231 7,336 10,959 -3,623 Sell $18,115 $32,600 TN 186,445 134,244 82,191 52,053 Buy $260,300 $468,500
The cost of nitrogen and phosphorus credits currently range from $5-9 per pound. Therefore, the Authority will
incur an annual net credit expen
3.10 Conclusions The process option that best achieves nutrient removal at the Clearfield Plant is the MLE/VIP Activated Sludge
NRT Process. From a cost effectiveness standpoint, the MLE process is well suited for integration with the existing
process and offers functional operational advantages. Three possible options will now be analyzed from a cost
effectiveness standpoint. Apart from the three NRT approaches, the fourth option is to buy nutrient credit annually
through the PADEP Nutrient Trading Program during the 60 day truing period.
Option 1 and Option 2 should be used in conjunction with the step-feed process at peak flows, in order to diminish
solids washouts from the reactors. Option 3 is considered an interim measure until actual peak flows are known
Finally, needs to be emphasized that the proposed reactor modifications and system improvements afford the
ability to operate efficiently, but also allows flexibility for the reactors to operate under alternative activated sludge
NRT processes such as the Johannesburg, anaerobic-anoxic-aerobic (A2O), and the University of Cape Town (UCT)
processes.
diture of $240,000 to $435,000.
after 2012.
it
Clearfield Municipal Authority WWTF NRT Evaluation Report April 2008

Section 4: Cost Analysis
Section 4: Cost Analysis
4-1
In the pr ious chapter, we performed an alternatives evaluation of various options, with possible application at the
CMA WWTF. A screening of these al ineering judgment. We examined the
NRT processes that are most compatible from tional and capital construction standpoint with the current
process. These a er ith ob eing cost. Other d
and tenance ations rforma ory w ts of si size an nt p A
summ of proje r Op is as f
it Cost Total Cost
Construction Cost enings Removal) 1 $3,500,000 $3,500,000
2 3,500,000 7,000,000 3. New Clarifiers 2 2,250,000 4,500,000
6. Aerobic Digesters/Reuse Centrifuge LS 2,500,000 2,500,000
4.1 Cost-Effectiveness Evaluation
ev
ternatives was done on the basis of eng
an opera
the most lternatives w e screened w vious factor b factors inclu ed operation
main consider and pe nce hist ith plan milar d treatme rocess.
ary ct costs fo tions 1-4 ollows:
Table 4-1: Project Cost Estimate for Option 1: New Treatment Plant
Qty Un
1. Headworks (Grit/Scre2. BNR Reactor Tanks
4. UV Disinfection System 1 1,000,000 1,000,000 5. Chemical Feed Systems LS 500,000 500,000
7. Electrical/Instrumentation/SCADA 1 2,000,000 2,000,000 8. Control/Mechanical Buildings 1 $3,000,000 $3,000,000
Total Construction Cost
$24,000,000
Costs
2. Legal/Administrative 150,000
/Rights-of-Way 450,000 5. Financing Cost $200,000
Other1. Engineering/Design/Const. Admin. $2,000,000
3. Contingency (5% of Construction) 1,200,000 4. Land
Total Other Costs $4,000,000
00
Total Project Cost Estimate, Option 1 $28,000,0
Clearfield Municipal Authority WWTF NRT Evaluation Report April 2008

Section 4: Cost Analysis
4-2
te for Option 2: New Reactor Tanks with Existing Plant Upgrade
ty Unit Cost Total Cost Co
1. Headworks (Grit/Screenings Removal) 1 $1,500,000 $1,500,000
5. Chemical Feed Systems LS 500,000 500,000
8. Renovate Control/Mechanical Buildings 1 $1,750,000 $1,750,000
Table 4-2: Project Cost Estima
Qstruction Cost n
2. New BNR Reactor Tanks 2 4,000,000 8,000,000 3. Reactor Clarifier Conversion 2 1,000,000 2,000,000 4. UV Disinfection System 1 1,000,000 1,000,000
6. Mechanical Piping/Equipment LS 1,500,000 1,500,000 7. Electrical/Instrumentation/SCADA 1 1,750,000 1,750,000
Total Construction Cost
$18,000,000 Other Costs
1. Engi ering/Design/Const. Admin. $1,600,000 2. Legal/Administrative
% of Construction) 1,150,00 4. L 5. F $1
ne
100,000 3. Contingency (6.5 0
and/Rights-of-way 0 inancing Cost 50,000 Total Other Costs $
Total Project Cost Esti $
Table 4-3: Project Co Op 3: Upgrad xisting Plant/
Tonstruction Co
Headworks (Grit/Screenings Removal) 300,000 New Anoxic Tank 0,000 Reactor/Clarifier Upgrades Chemical Feed Systems 0,000 Solids Digesters/De 0
6. Electrical/Instrumentation/SCADta
3,000,000
mate, Option 2 21,000,000
st Estimate for tion e E Process
Qty Unit Cost tal Cost Co st
1. LS $300,000 $ 2. 1 750,000 75 3. 2 825,000 1,650,000 4. LS 300,000 30 5. watering LS 0
A 1 $300,000 $300,000 To l Construction Cost $3,300,000
Other Cost
1. Engineering/Design/Const. Admin. $370,000 2. Legal/Administrative 50,000 3. Contingency (10% of Construction) 330,000 4. Land/Rights-of-way 0 5. Financing Cost $50,000
s
Total Other Costs $800,000
Total Project Cost Estimate, Option 3 $4,100,000
Clearfield Municipal Authority WWTF NRT Evaluation Report April 2008

Section 4: Cost Analysis
Table 4-4: Project Cost for Option 4: Buy Nutrient Credits Only
4-3
t Effluent NPDLimit
(lbs/yExceedence Credits @
$5/lb Credits @
$9/lb (lbs/yr) (lbs/yr) Influen
ES
r) (lbs/yr) Credits TP 19,231 7,336 10,9 $18,115 $32,600 59 -3,623 Sell TN 186,445 134,244 82,1 $260,300 $468,500 91 52,053 Buy
4 g S he proposed prov nve er revenue bonds have been
e apital i rov en o eld of 5% for
a term of 20-years.
I nia Infrastructure Investm t Authority has finance CMA projec totaling $25
m for 20-3 ears). Recent , Pe ancing has been difficult to
o ed funding pool for availa le projects. BN anned for d ens of large
s in the Chesapeake Bay atershed. The comm dead e projects are
2010 and 2011. The following table is a summary of regional BNR ojects planne by several municipalities.
Table 4-5: Tributary Municipalities BNR Costs
Municipality BNR Cost Capacity (MGD) Cost/Gallon
.2 Project Financin
everal alternatives exist for financing t im ements. Co ntional sew
mplo A to finance cyed several times by CM mp ements. Curr t municipal b nds have a yi
n addition, the Pennsylva en d five (5) ts
illion in low interest loans (1.00%-1.24% 0 y ly nnVEST fin
btain because of a limit b R projects are pl oz
Pennsylvania municipal authoritie w on lines for thes
pr d
Tyrone Borough $9 G 1.01/ga .1 Million 9 M D $ l.4
Scranton City $16. llion GD 0.83/gal. 6 Mi 20 M $Lewistown Borough $16 illion GD 5.71/gal. M 2.8 M $Hazelton City $15.4 illion G 1.73/gal. M 8.9 M D $Williamsport City $8 llion GD 5.25/gal. 4 Mi 16 M $Lock Haven City $2 llion 3. 5.87/gal. 2 Mi 75 MGD $Altoona City $19 illion M 1.75/gal. M 10.85 GD $
ylvania Municipalities Authorities Association (PMAA) recently compiled BNR comp ce costs in
authorities were contacted. T sur d a total of $408 million in
eatment capacity of 185 MGD The cost for BNR pliance is
$ mum unit cost (Option 3) for the CMA BN upgrade is .91/gallon which compares
e of $2.20/gallon, while the maxim co 1) i llon which is
consi ble higher than the average. The intermediate cost (Option 2) is $4.67/gallo . It should be ed that the
higher un o address non-BNR factors such as facility age and and
flow.
The Penns lian
January 2008. Forty three (43) sewer he vey reveale
planned BNR expenditures for a total tr . gross unit com
2.20/gallon. The mini R $0
favorably with the above averag um st (Option s $6.22/ga
dera n not
it cost is skewed because of the need t h ling peak
Huntingdon Borough $17.5 Million MGD $4.38/gal.
Clearfield Municipal Authority WWTF NRT Evaluation Report April 2008

Section 4: Cost Analysis
4-4
Not only will construct Continued PennVEST financin re Authority projects is debatable. Unless additional funding streams are enacted by the PA state legislature, the Authority should not rely on Pe nding for a BNR project.
For ses of t uation, ave ass nvent unicipal d finan the R proje ewer re onds a ed at a rate of 5% 0-year b Obvio mun d mark ll dete t rate l the f sue an l ra e
he annual debt service cost for the Option 1 project is $2,250,000; $1,687,500 for on 3.
g cost, we believe power chemical and manpower costs will increase, though to what extent is
ncertain. We have tabulated operating costs for power consumption, by motor size, run times and efficiency in
$/Yr $/Yr $/Yr $/Yr
ion costs escalate, but also the competition for PennVEST financing. g of futu
nnVEST fu
purpoct. S
his evalvenue b
we hre propos
umed co ional m for a 2
bonond.
cing for usly, the
CMA BNicipal bon
et w rmine the final discoun , as wil insurability o the is d financia ting of thiAuthority's credit worthiness. T
ption 2; and $327,500 for OptiO 4.3 Operating Costs
In terms of operatinuaccordance with the following tabulation.
Table 4-6: Tabulation of Power BNR Consumption (Options 1 and 2)
Units Yearly Cost
for ADF, Yearly Cost for MMF,
Yearly Cost for MWF,
Yearly Cost for MDF, Total Cost,
$/Yr
Headworks Fine Screen Works 2 65 25 15 10 115 Vortex Grit Pumps 2 585 80 35 20 720 Vortex Grit Paddles 10 300 2 235 40 15 Grit Classifier 2 50 15 10 5 80 Conveyor 1 5 60 1 30 15 0
s 500 75 30 rs 2 60,000 500 mps 7,000 700 ps 4 11,250 200
2,800 300
Reactors Submersible Mixer 4 4,000 4,605 Air Diffuser Blowe 4, 1,310 190 66,000 Internal Recycle Pu 2 150 20 7,870 Nitrate Recycle Pum 1, 250 30 12,730 Clarifier RAS Pum s 2 80 15 3,195 pMacerator 1 60 8 11 2 81 Scum Pumps 1 300 40 20 4 364 Clarifier Mechanism/ Equipment 2 470 43 10 2 525
USE 100,000
1. Efficiency of motors is assumed as 75% wherever the data is not available. 2. MMF days are assumed as 30; MWF days are 7; MDF is 1 day and hence ADF days are 327. 3.
The electrical operation cost estimation is performed on following assumptions:
Average electrical cost is assumed as 0.06 $/KW-H. 4. The units noted above represent redundant operation. For power consumption purposes, therefore, only
half the total units are included in the power consumption calculation.
Total Increased Power Cost 96,645
Clearfield Municipal Authority WWTF NRT Evaluation Report April 2008

Section 4: Cost Analysis
Abbreviations:
ADF: Average Daily Flow
MMF: Maximum Monthly Flow
MWF: Maximum Weekly Flow
MDF: Maximum Daily Flow
The following additional operating costs are programmed for the CMA NRT process (Option Nos. 1 and 2):
a. Chemicals - $100,000
b. Power Consumption - $100,000
Additional Annual Operating Costs - $200,000
We estimate the op n and maintenance
(O&M) budget of the Wastewater Division t la $200,000)
e annual operating expenses will escalate 000 nc tio nd No or
, the annual operating expenses will rise $900,000 or % increase
Debt Service sts
ield Municipal Authority has the following ebtedness i Wastewa ivision.
Table 4- Current I dness (As of January 1, 2007)
ment OriginaAmoun
tandiPrinci
Est. Payme te
A ual Debt Service
erating costs for Option 3 will be about $130,000. The current operatio
is $780,000.
to $1,000,
With the addi
or a 25% i
ional BNR-re
rease for Op
ted O&M costs (
n's No. 1 ath . 2. F
Option No. 3 to a 17 .
4.4 Existing Co
The Clearf ind n the ter D
7: ndebte
Instrul Outst
ng pal
Final nt Da
nn
(Ph 10
The existing debt of the Authority is considered low w compared t he asset val the physical plant.
g C sts and De ervice
The following table sets forth the projected operating costs of each Optio
ervice
ption Existing Existing Total Projected Projected Project
its Total
(Projected) Increase
hen o t ue of 4.5 Projected Operatin o bt S
n.
PennVEST Loan ase I Plant Improvements) $2,120,000 $1,600,000
(Est.) 2024 $ 8,420
Table 4-8: Projected Operating Costs and Debt S
O O&M Debt (Existing) O&M Debt Cred1 365% $780,000 $108,400 $888,400 $980,000 $2,250,000 $0 $3,230,0002 $1,687,500 $0 $2,667,500 300% $780,000 $108,400 $888,400 $980,0003 $780,000 $108,400 $888,400 $910,000 $327,500 $0 $1,237,500 140%
$780,000 $108,400 $888,400 $0 $0 $4 350,000 $1,238,400 140%
Clearfield Municipal Authority WWTF NRT Evaluation Report April 2008
4-5

Section 4: Cost Analysis
4-6
.6
CMA maintains a 4-tier, declining block rate structure. The current sewer rate is sufficient all operation and ncurred by the Authority. The following sewer rate schedule is
urrently
-9: Sewer Rate Schedule - Meter Rates (Effective February 1, 2004)
4 Sewer Rate Analysis
maintenance costs and debt service currently ic in effect:
Table 4
MINIMUM CHARGES
Meter Size Quarterly
Rate Daily Rate
5/8" $13.72 $0.152444 3/4" 20.58 0.228667 1" 34.30 0.381111
1-1/2" 68.60 0.762222 2" 109.76 1.219556 3" 219.52 2.439111 4" $258.72 $2.874667
2,000 - 15,000 gallons ……… $2.25 Per ThousanFirst 1,000 gallons ……… $2.27
d 16,000 - 50,000 gallons ……… $1.96 Per Thousand
51,000 & Over ……… $1.66 Per Thousand
Surcharge: $3.50 per thousand gallons surcharge for
gallons surcharge for Clearfield Borough sewage customers.
We analyzed the effects of the BNR project on current sewer ates for the projected maximum project (Option 1),
intermediate project (Option 2) and min ect a typ tial cust g 15,000
gallons ows for each municipality.
Table 4-10: Sewer Rate Analysis - Proposed Option 1 Project
Meter Minimum Consumption Boro. Project Total Boro.
e Twp.
Surcharge
Option 1 Project Charge
Total Twp.
Charge
Lawrence Township sewage customers; $8.00 per thousand
r
imum proj (Option 3) for ical residen omer usin
per quarter as foll
(Per Quarter)
Option 1
Size Charge Charge Surcharge Charge Charg5/8" $13.75 $33.77 $120.00 $125.00 $292.00 $52.50 $125.00 $225.00
T : S ate o ct ( r
Meter S
M C on . g
te
TwSurc e
able 4-11 ewer R Analysis - PrPe te
oposed Opti)
n 2 Projer Quar
ize inimum
Charge onsumpti
Charge Boro
Surchar e ProjecCharg
Option 2
Total Boro.
Charge p.
harg Project Charge
Option 2 Total Twp.
Charge8" $13.75 $33.77 $120.00 0.00 8.00 $52.50 $90.00 $190.005/ $9 $25
Clearfield Municipal Authority WWTF NRT Evaluation Report April 2008

Section 4: Cost Analysis
4-7
: Sewer Rate Analysis - Proposed Option 3 Project (Per Quarter)
Meter Minimum e
Consumption Charge
Boro. Surcharge
Project Charge
Boro. Charge
Twp. Surcharge
Project Charge
Twp. Charge
Table 4-12
Size
Current
Charg
Current Option 3 Total Option 3 Total
5/8" $13.75 $33.77 $120.00 $25.00 $193.00 $52.50 $25.00 $125.00
should be noted that the Township surcharge does NOT include any debt service surcharges for its Phase II
project. We, therefore, expect the Townshi ly in the near future. In addition, we have
provided a comparison of regional sew th able.
Table 4-1 omparison o al
Logan Township, Blair C mont )
It
p charge to rise according
er charges in e following t
3: C f Region Sewer Rates
ounty $39/ h (flat ratehori $18. onth (meteer A $46/ th (flat rateorit $57/ nth (flat rate
Williamsport Sanitary Aut ty 67/m red) Osceola Mills (ORD) Sew uthority mon ) Muddy Run Regional Auth y mo ) Portage Area Sewer Authority $36.50/month (metered-projected) Saxton Borough M 2/ (flat rate) unicipal Authority $4 month
ional Sewage Authority $1 31/month (metered) Authority $2 .00/month (metered)
Johnstown Reg 9.Altoona City 9 Clearfield ($28 Milli
Municipal Authority on Project, Option 1)
$97.00/month (Boro.) $75.00/month (Twp.)
Municipal Authority $86.00/month (Boro.) Clearfield ($21 Milli Project, Option 2) $63.30/month (Twp.) onClearfield Municipal Authority ($4.08 Million Project, Option 3)
$64.00/month (Boro.) $41.60/month (Twp.)
is apparent that if Option 1 and Option 2 projects are required, the projected sewer rates will greatly
exceed any of the regiona
It
l sewer rates.
Clearfield Municipal Authority WWTF NRT Evaluation Report April 2008
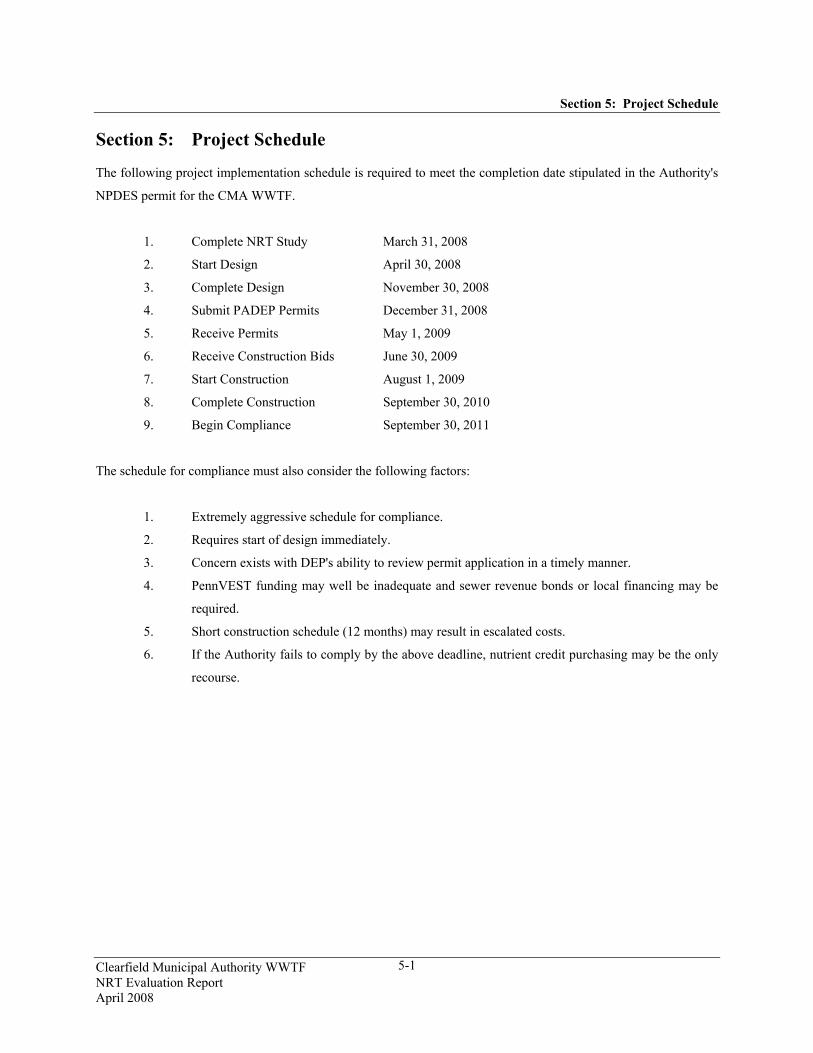
Section 5: Project Schedule
5-1
Section 5: Proje The following project implementation schedule is require to meet the completion date stipulated in the Authority's
N r
1. Complete NRT Study March 31, 2008
5. Receive Permits May 2009
6. Receive Cons
7. August
8. Septemb
9. ptemb
The schedule fo llowing
1. edule for complian
2. Requires start of design immediately.
3. lity to review timely manner.
4. nadequat nds or local financing may be
5. months) ma s.
e Authority fails to comply by the above deadline, nutrient credit purchasing may be the only
recourse.
ct Schedule
d
PDES pe mit for the CMA WWTF.
2. Start Design April 30, 2008
3. Complete Design November 30, 2008
4. Submit PADEP Permits December 31, 2008
1,
truction Bids June 30, 2009
Start Construction 1, 2009
Complete Construction er 30, 2010
Begin Compliance Se er 30, 2011
r compliance must also consider the fo factors:
Extremely aggressive sch ce.
Concern exists with DEP's abi permit application in a
PennVEST funding may well be i e and sewer revenue bo
required.
Short construction schedule (12 y result in escalated cost
6. If th
Clearfield Municipal Authority WWTF NRT Evaluation Report April 2008

Section 6: Operational Considerations
6-1
iderations
al activated sludge process. With the addition of nutrient removal, the plant
ould now be considered an advanced waste treatment plant with all the operational complexities inherent with
BNR.
The ML ubmersible mixing, oxic and
anoxic c rol) c anipul reactor kinetics with chemical nitrogen
conversi f process sophistication and operational
control.
Treatme lant nd rient and their variations including the VIP,
MLE, St Feed, rg p ses. ust begin with the microbiology of the
rganisms that nitrify, denitrify, and enhance biological phosphorus removal.
perators will be responsible for setting operating parameters so the treatment plant complies with the annual
allocatio he NPDES permit. The operators will control and
optimize trien ing parameters and adjusting operations as flows and
temperatures chan
∗ ich process is to be used including the VIP, MLE, A2O and Johannesburg processes.
sive influent flows threaten
processes as needed to optimize nitrification, denitrification, or biological phosphorus
removal. Which process is optimal will depend on actual flows, loads, and wastewater
temperatures.
∗ Mean cell residence time: increase and decrease waste activated sludge flows to control the
MCRT.
∗ Nutrient recycle flows: adjust return sludge, nitrate and mixed liquor recycle pumping rates to
minimize effluent nutrient concentrations.
Section 6: Operational Cons The BNR process will involve significant operational changes to the current process. The existing plant was
designed and operated as a convention
sh
E process (involving step feed pumping, nutrient and RAS return pumping, s
ont ombines a sophisticated m ation of plug flow
on and phosphorous removal. The plant involves a high degree o
nt p operators must understa nut removal technology
ep A2O and Johannesbu roces This understanding m
o
O
ns for Total Nitrogen and Total Phosphorus contained in t
nu t removal by determining the follow
ge:
Select wh
Step Feed is anticipated to be used at any time of the year when exces
to overwhelm the secondary clarifiers, causing solids washouts. The operator will select among
the other
Clearfield Municipal Authority WWTF NRT Evaluation Report April 2008
Section 6: Operational Considerations
6-2
erating parameters for the air supply blowers and air
diffuser grids so nitrogen is full nitrified in the aerobic zone, without recycling excess DO to the
anoxic zone.
∗ Chemically enhanced clarification: Determine when chemicals must be fed to enhance
clarification during peak flows and/or loads and during process upsets. Establish chemicals to be
fed and feed concentrations.
A process operator should have knowledge of the BioWin computer model as an operating tool. This operator
should optimize the process and predict operating results by inputting actual influent flows, temperatures, and
pollutant loads. Model results should be compared against actual effluent quality to refine the process on a
continuous basis.
Operators must understand the function of all equipment and components used in the NRT process and be familiar
with their operation and maintenance needs. Operators will utilize the treatment plant’s computerized process
control system by reading and interpreting data from multiple field instruments, probes, and flow meters and using
the control system to adjust the operation of NRT process equipment including aeration blowers, recycle and waste
sludge pumping, and chemical feed systems.
We recommend that all operators undertake the necessary training and education required to fully understand the
BNR process and perform the process control functions stated above.
∗ Dissolved Oxygen Concentration: Set op
Clearfield Municipal Authority WWTF NRT Evaluation Report April 2008

Section 7: Recommendations
7-1
Section 7: Based on our evaluation of the existing Wastewater Treatment Facility and computer modeling of various NRT
processes, we offer the following recommendations for compliance with the PADEP permit limits for nitrogen and
phosphorus:
1. The Modified Ludzack-Ettinger (MLE) Process (Plug Flow, Single Stage, Activated Sludge)
should be implemented as the Nutrient Removal Technology at the WWWTF. This process offers
future adaptation to other NRT processes including the VIP, A2O, UCT and Johannesburg
systems.
2. Option 3 (Retrofit Existing Plant/Process) is the most cost effective MLE process option for
adaptation to the existing treatment plant. Moreover, this option allows the CMA to comply with
the BNR limits until the ongoing sewer separation project is complete. This option may not bring
the TN and TP yearly discharge under the NPDES limit, however the yearly nutrient discharge
will be in a controlled range and hence will limit excessive spending for nutrient credits.
3. This option includes installing a 320,000 gallons tank (which will be used as the anoxic reactor
zone for the MLE process), with submersible mixers. The option will also include retrofitting the
existing distribution structure for step-feed purposes, installation of baffle walls in existing
aeration tanks, replacing coarse bubble diffusers with fine bubble diffusers, higher pumping and
piping capacity and arrangement for higher chemical feed.
4. Option 3 will include provisions for a step-feed system during peak flow events. No
recommendations are made at this time for the sludge digestion, conditioning, thickening,
dewatering, storage or disposal system. This system will be entirely integrated into the NRT
system.
5. The total project cost of the recommended improvements is $4.1 million. We recommend that the
Authority issue Sewer Revenue Bonds, pursue Pennvest financing or locally financed through a
bank note. Unless the legislature enacts supplemental funding, Pennvest financing may not be
considered a viable alternative.
6. Failure of the Clearfield Borough and Lawrence Township sewer replacement projects to
eliminate CSO discharges and peak system flow will necessitate a costly treatment compliance
project for the Authority. This compliance cost, reflected in Options 1 and 2, will be at least $21
Recommendations
Clearfield Municipal Authority WWTF NRT Evaluation Report April 2008

Section 7: Recommendations
7-2
y dependent on the final peak flow. According to the Consent Order
and Agreement and CMA's Long Term Control Plan, the Authority will be forced to implement
7. No recommendations or costs are offered for improving the upstream conveyance system
to $28 million, and is entirel
whatever treatment compliance project is necessary to eliminate all CSO's and treat all flow at the
WWTF.
including pump stations and interceptor sewers. The final peak flow from the Township and
Borough collection systems will determine the need, if any, for upgrading these systems.
Clearfield Municipal Authority WWTF NRT Evaluation Report April 2008