Embed Size (px)
Citation preview
Biological Nutrient Removal
Challenges at Small WWTPs –
Ellsworth, WI
Wisconsin Wastewater Operators’ Association 49th Annual Conference
October 8, 2015
Presented by: Tim Stockman
Matt Eberhardt
Outline
Existing Conditions
Project Goals
WWTP Upgrades
Performance and Optimization
Conclusions
Existing Conditions
WWTP overview
Biological treatment process
Other treatment processes
Design capacity
Effluent quality
Reasons for upgrades
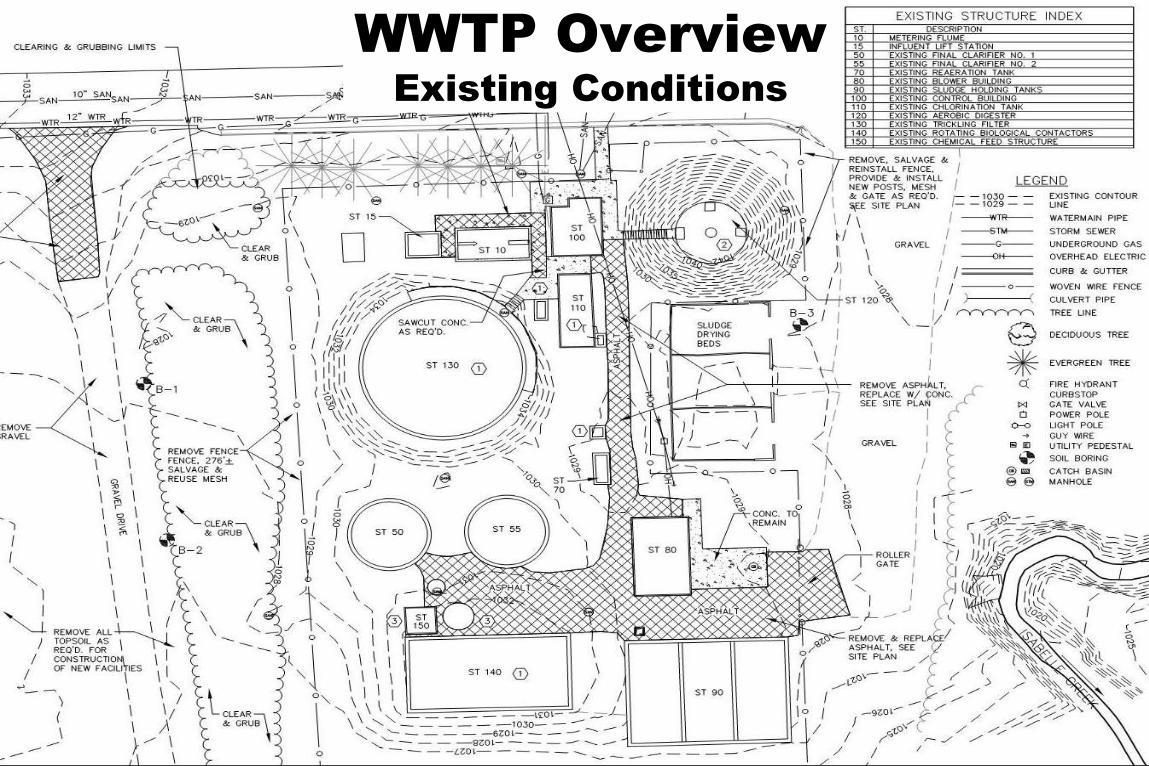
WWTP Overview
Existing Conditions
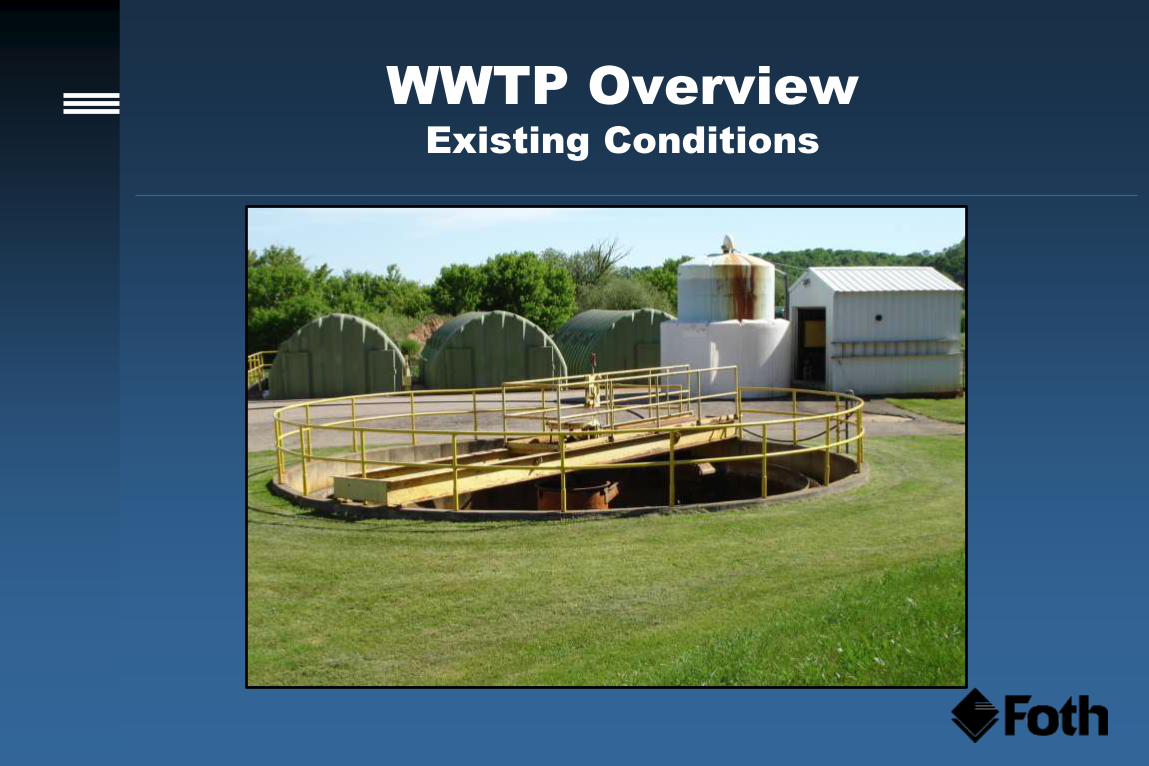
WWTP Overview
Existing Conditions
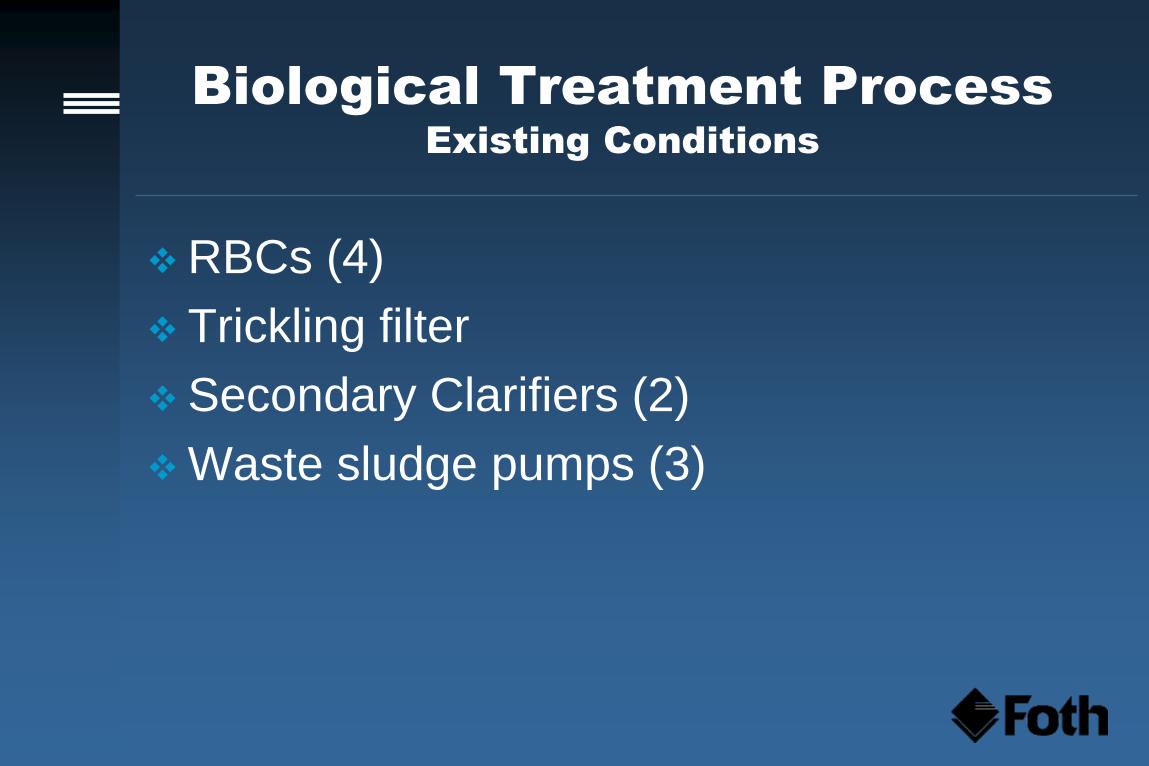
Biological Treatment Process
Existing Conditions
RBCs (4)
Trickling filter
Secondary Clarifiers (2)
Waste sludge pumps (3)
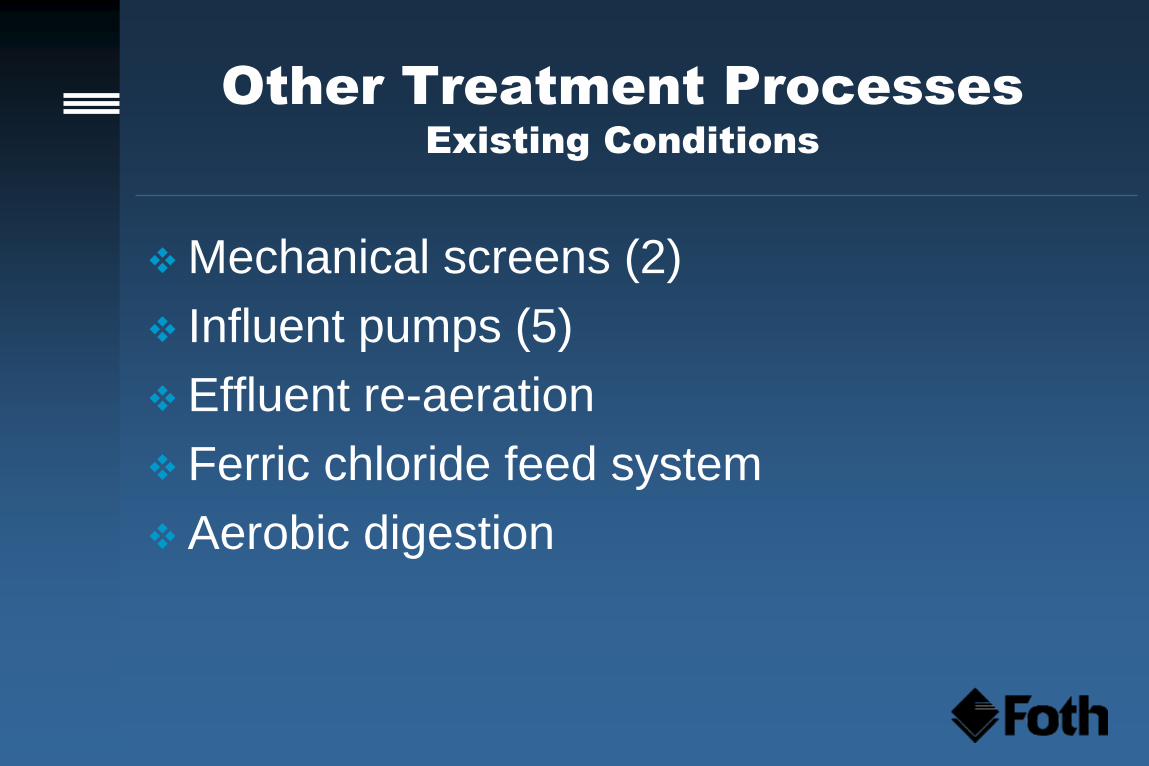
Other Treatment Processes
Existing Conditions
Mechanical screens (2)
Influent pumps (5)
Effluent re-aeration
Ferric chloride feed system
Aerobic digestion
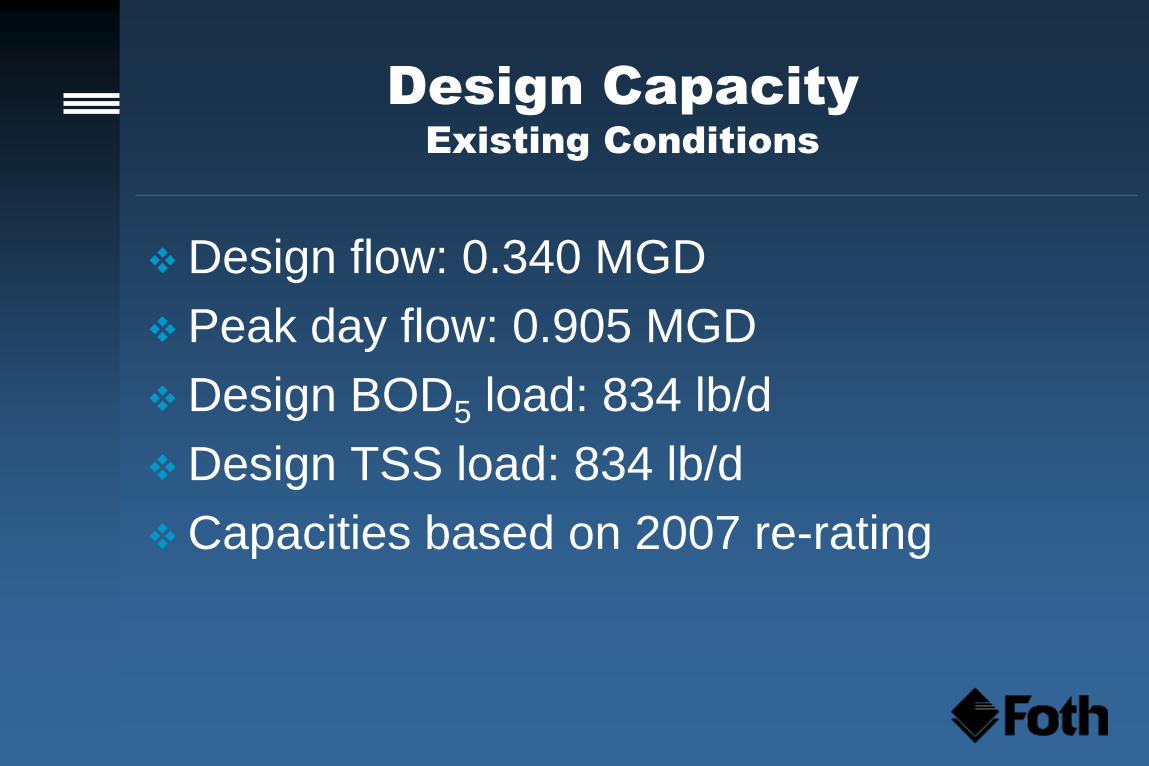
Design Capacity
Existing Conditions
Design flow: 0.340 MGD
Peak day flow: 0.905 MGD
Design BOD5 load: 834 lb/d
Design TSS load: 834 lb/d
Capacities based on 2007 re-rating
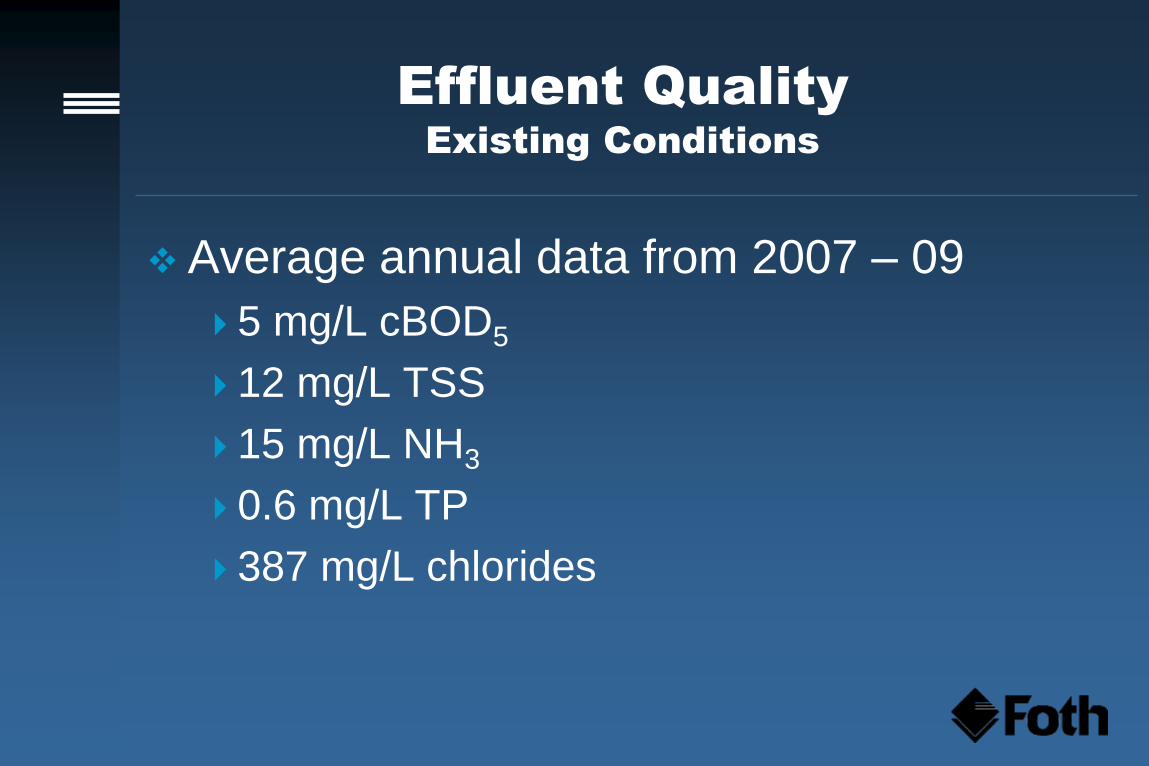
Effluent Quality
Existing Conditions
Average annual data from 2007 – 09
5 mg/L cBOD5
12 mg/L TSS
15 mg/L NH3
0.6 mg/L TP
387 mg/L chlorides
Reasons for Upgrades
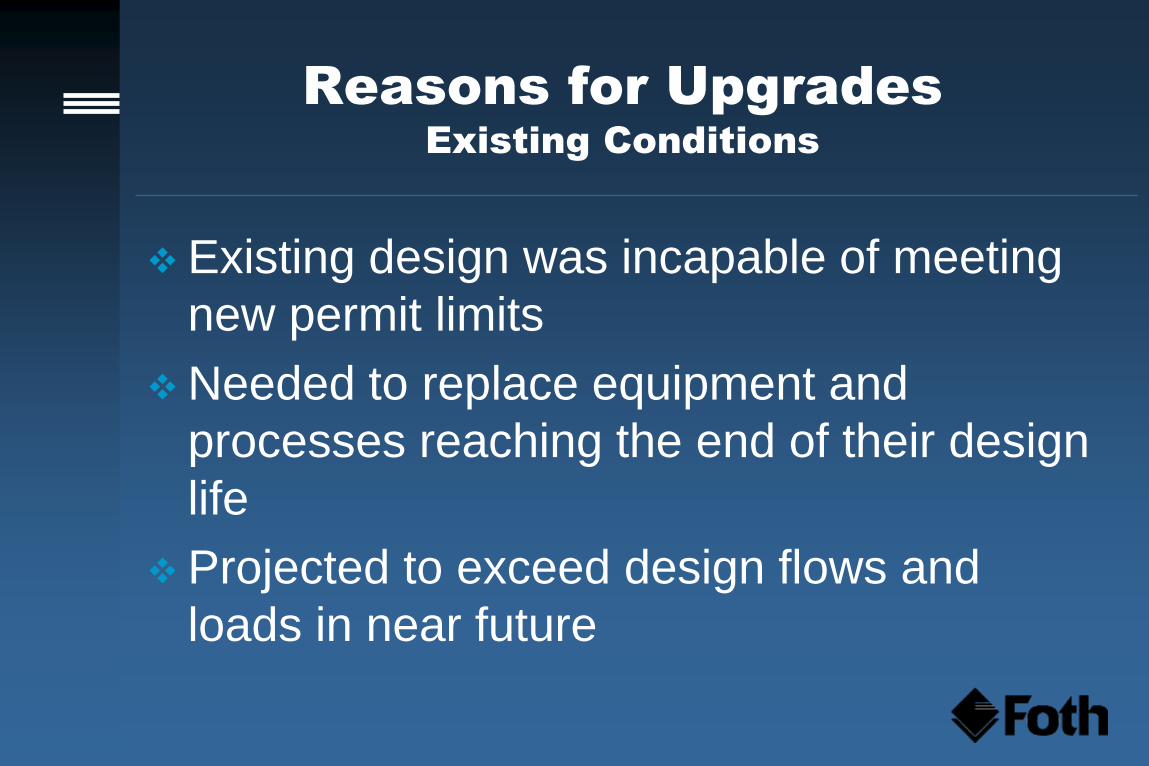
Existing Conditions
Existing design was incapable of meeting
new permit limits
Needed to replace equipment and
processes reaching the end of their design
life
Projected to exceed design flows and
loads in near future
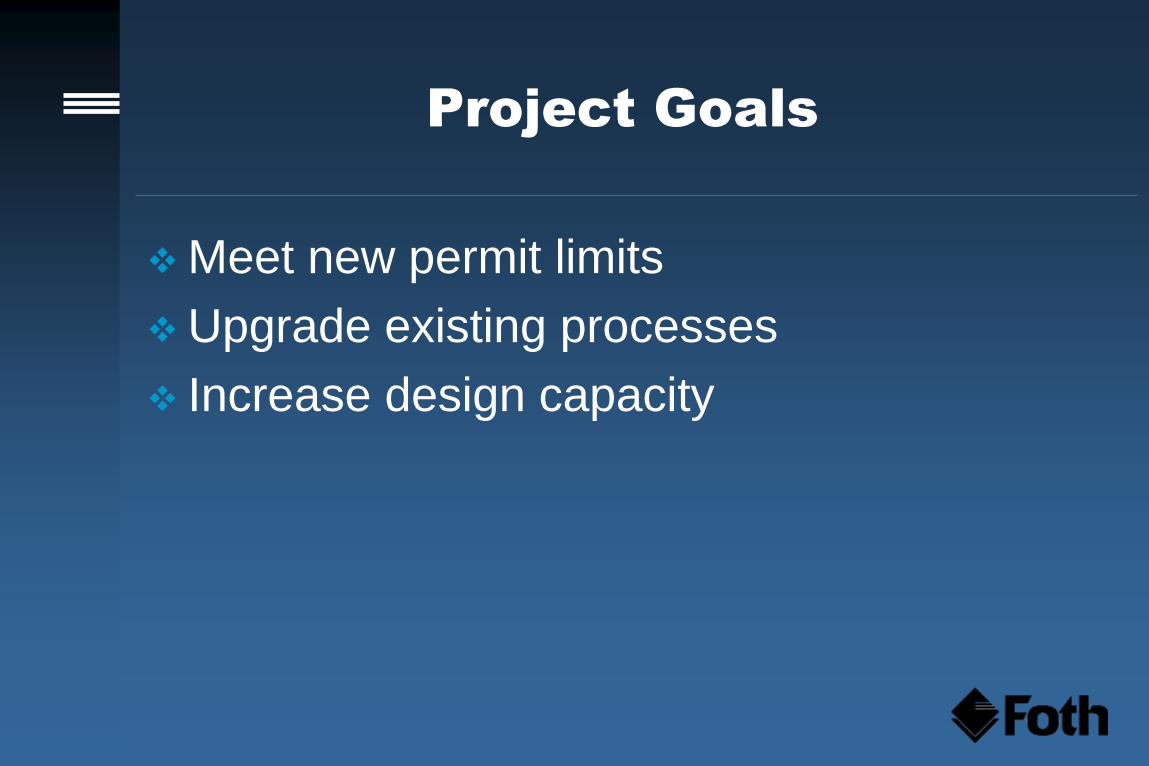
Project Goals
Meet new permit limits
Upgrade existing processes
Increase design capacity
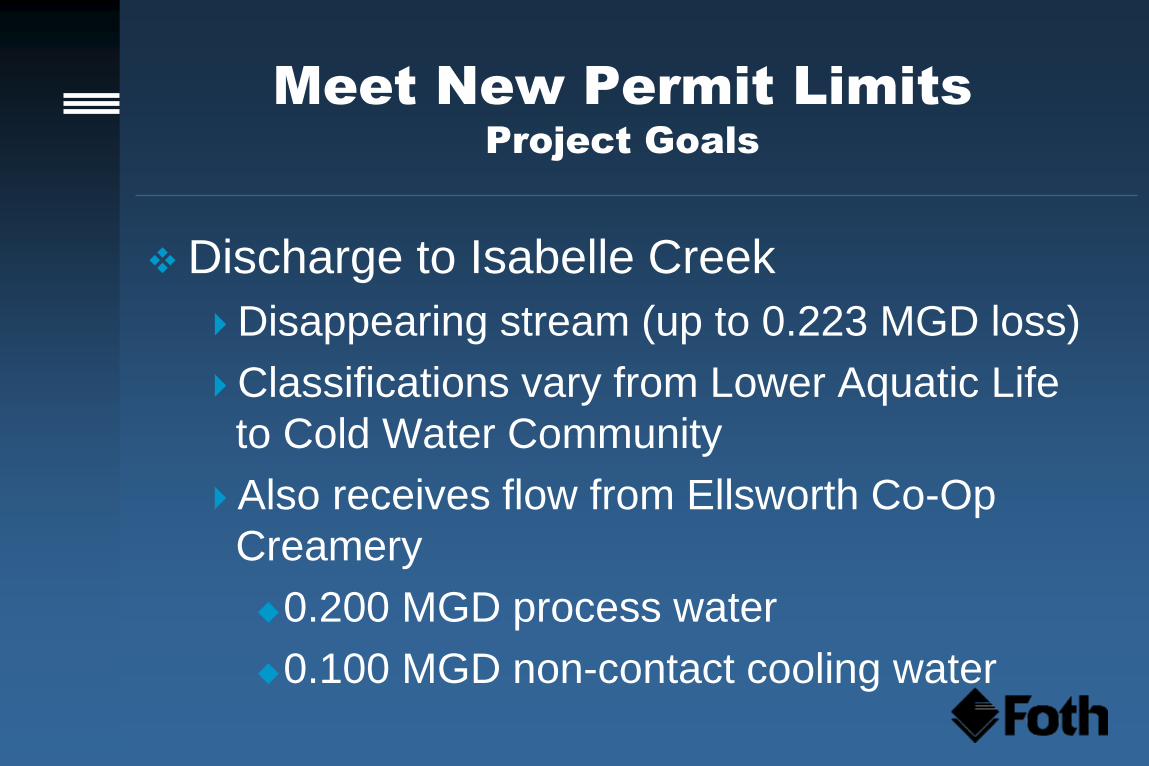
Meet New Permit Limits
Project Goals
Discharge to Isabelle Creek
Disappearing stream (up to 0.223 MGD loss)
Classifications vary from Lower Aquatic Life
to Cold Water Community
Also receives flow from Ellsworth Co-Op
Creamery
0.200 MGD process water
0.100 MGD non-contact cooling water
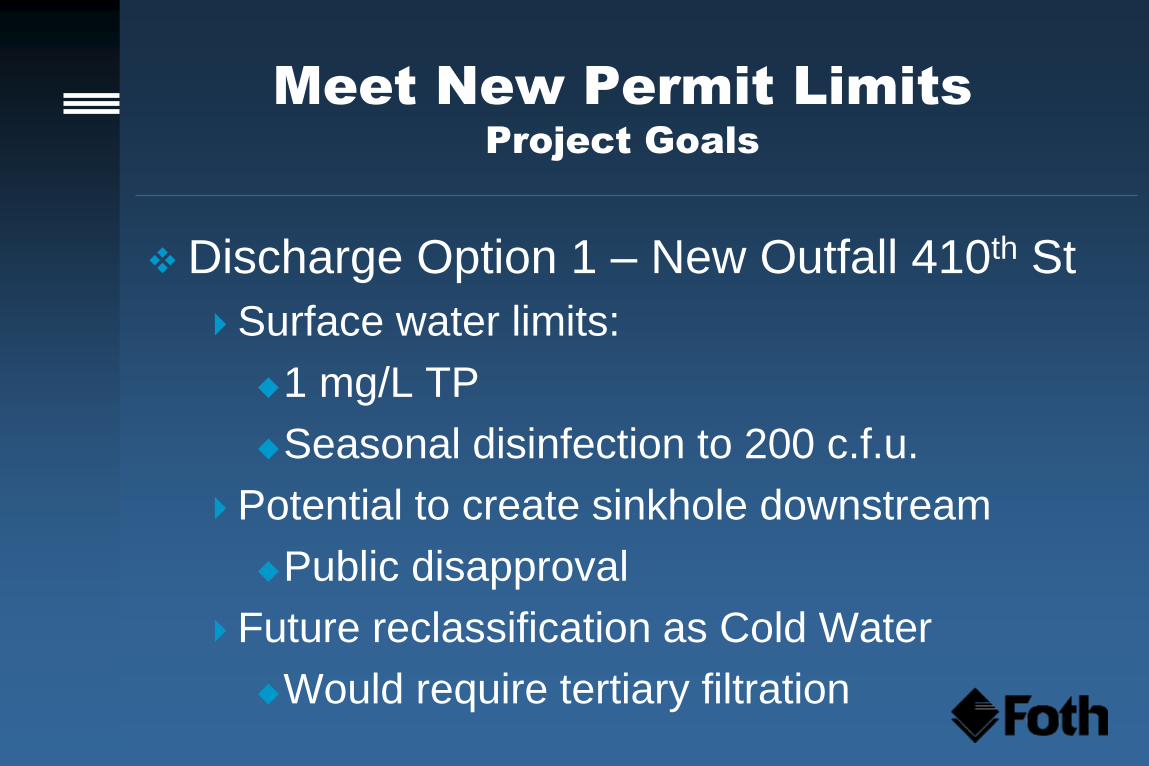
Meet New Permit Limits
Project Goals
Discharge Option 1 – New Outfall 410th St
Surface water limits:
1 mg/L TP
Seasonal disinfection to 200 c.f.u.
Potential to create sinkhole downstream
Public disapproval
Future reclassification as Cold Water
Would require tertiary filtration
Meet New Permit Limits
Project Goals
Discharge Option 2 – Existing Outfall
Surface water limits:
1 mg/L TP
Creek disappears downstream of outfall
Groundwater limits:
10 mg/L TN
325 mg/L chlorides
Year-round disinfection to 400 c.f.u.
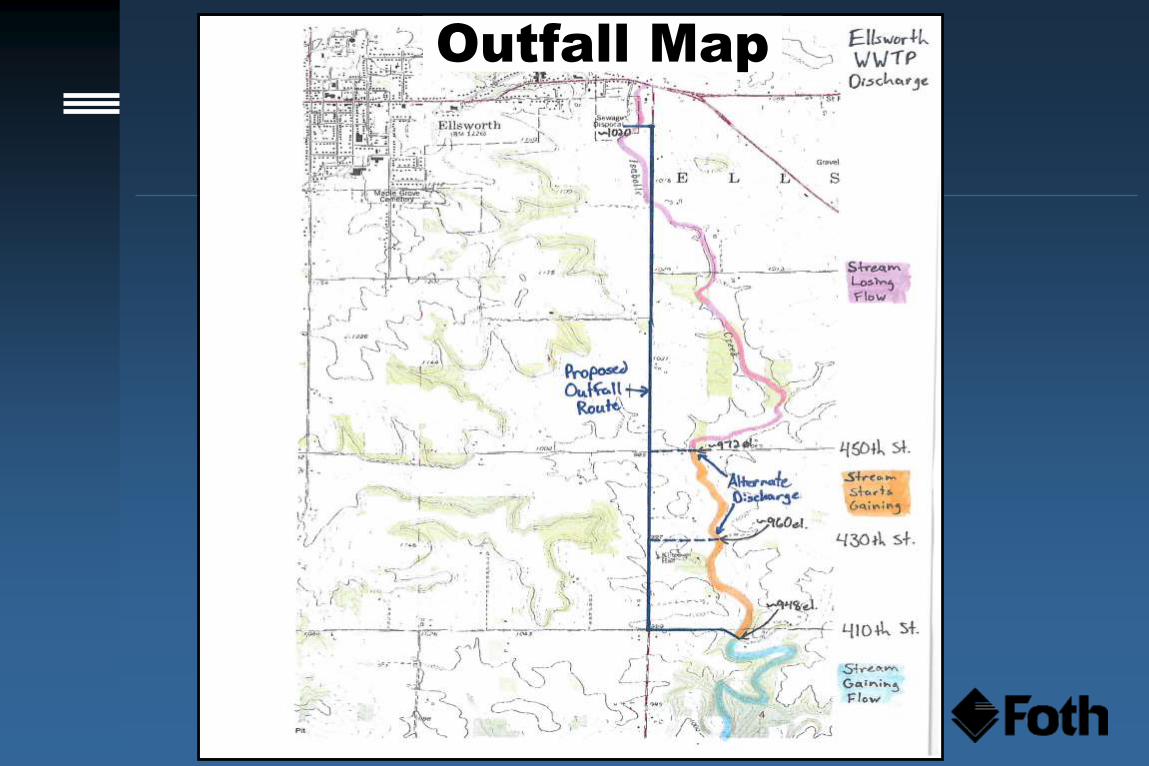
Outfall Map
Meet New Permit Limits
Project Goals
Discharge Option 2 selected
Treat for TN and work on chlorides
No effluent lift station and force main
No tertiary filtration
Lower in total present worth
No potential for sinkhole creation
Result: need biological TN and P removal
Meet New Permit Limits
Project Goals
Effluent Limits (biological)
20 mg/L BOD5 and TSS (monthly avg.)
10 mg/L TN (monthly avg.)
Seasonal NH3 limits
Daily max. as low as 7.8 mg/L
Monthly avg. as low as 3.6 mg/L
1 mg/L TP (monthly avg.)
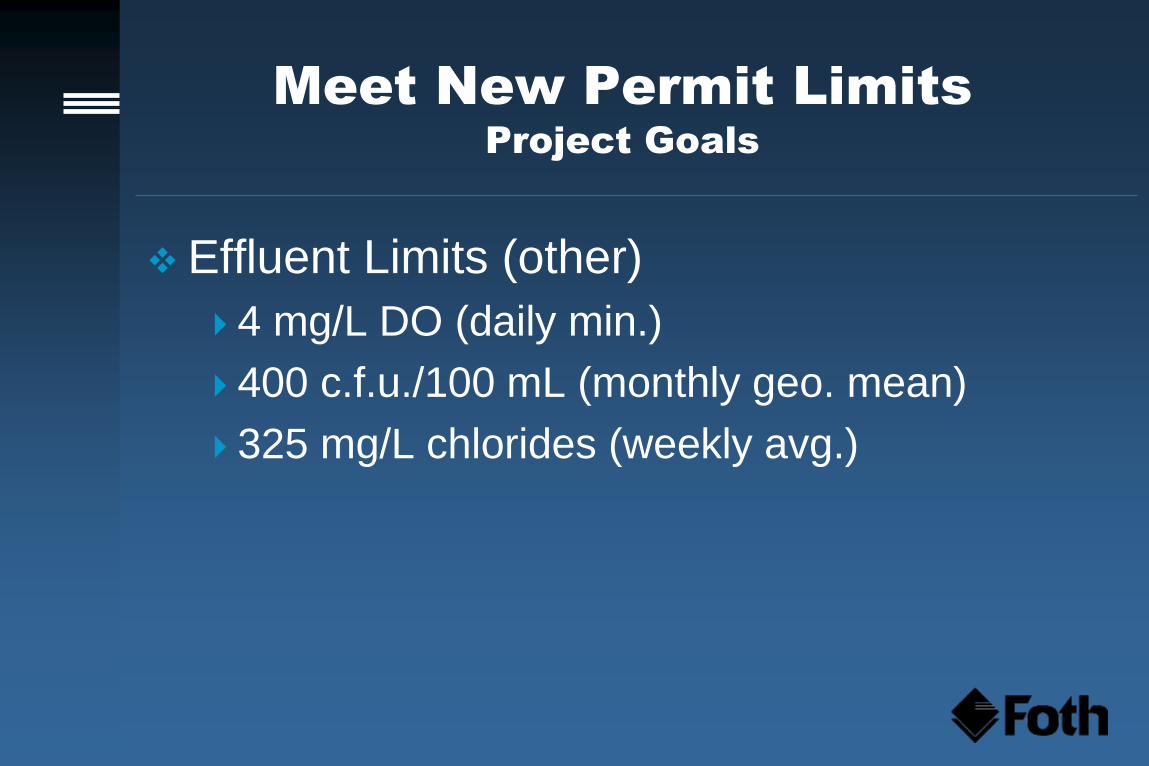
Meet New Permit Limits
Project Goals
Effluent Limits (other)
4 mg/L DO (daily min.)
400 c.f.u./100 mL (monthly geo. mean)
325 mg/L chlorides (weekly avg.)
Meet New Permit Limits
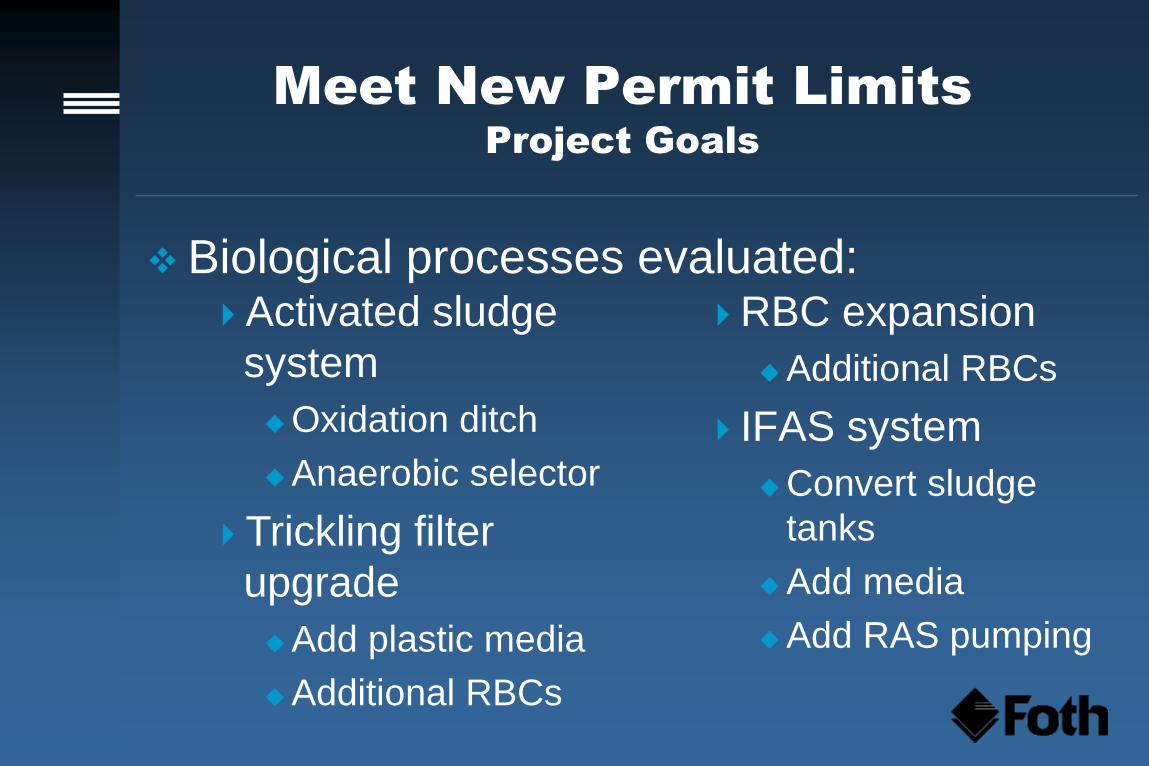
Project Goals
Biological processes evaluated: RBC expansion
Additional RBCs
IFAS system
Convert sludge
tanks
Add media
Add RAS pumping
Activated sludge
system
Oxidation ditch
Anaerobic selector
Trickling filter
upgrade
Add plastic media
Additional RBCs
Meet New Permit Limits
Project Goals
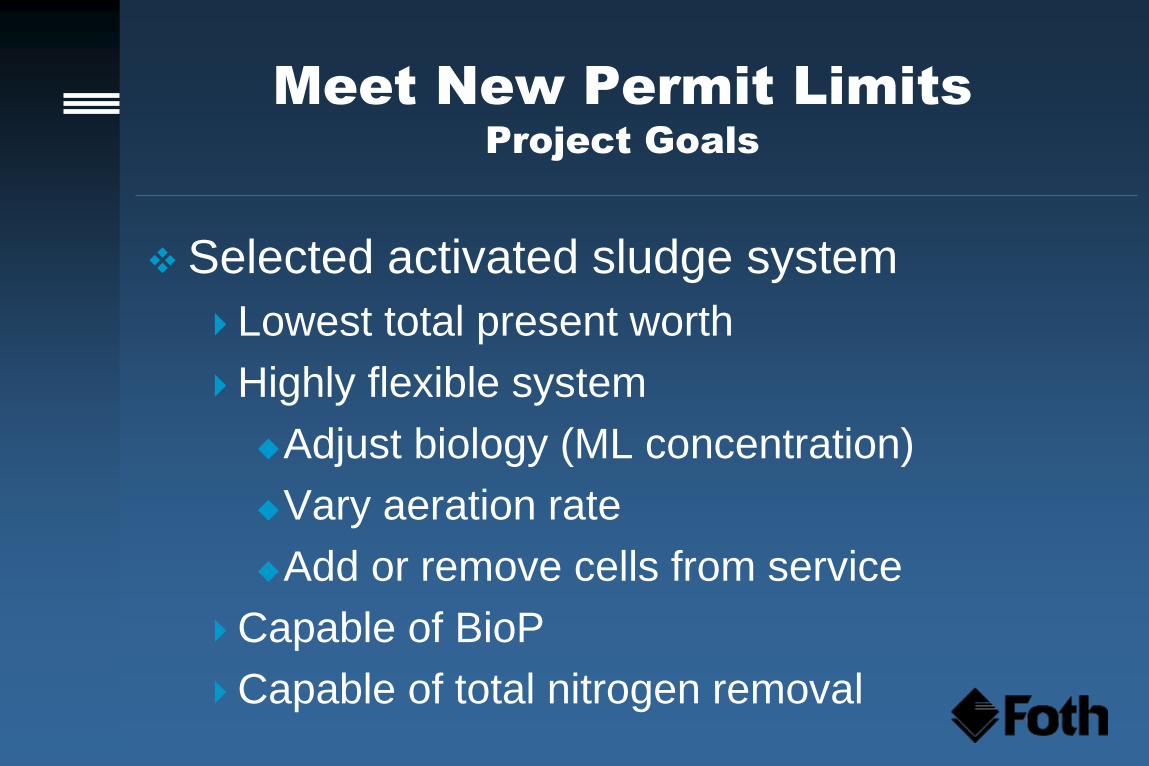
Selected activated sludge system
Lowest total present worth
Highly flexible system
Adjust biology (ML concentration)
Vary aeration rate
Add or remove cells from service
Capable of BioP
Capable of total nitrogen removal
Upgrade Existing Processes
Project Goals
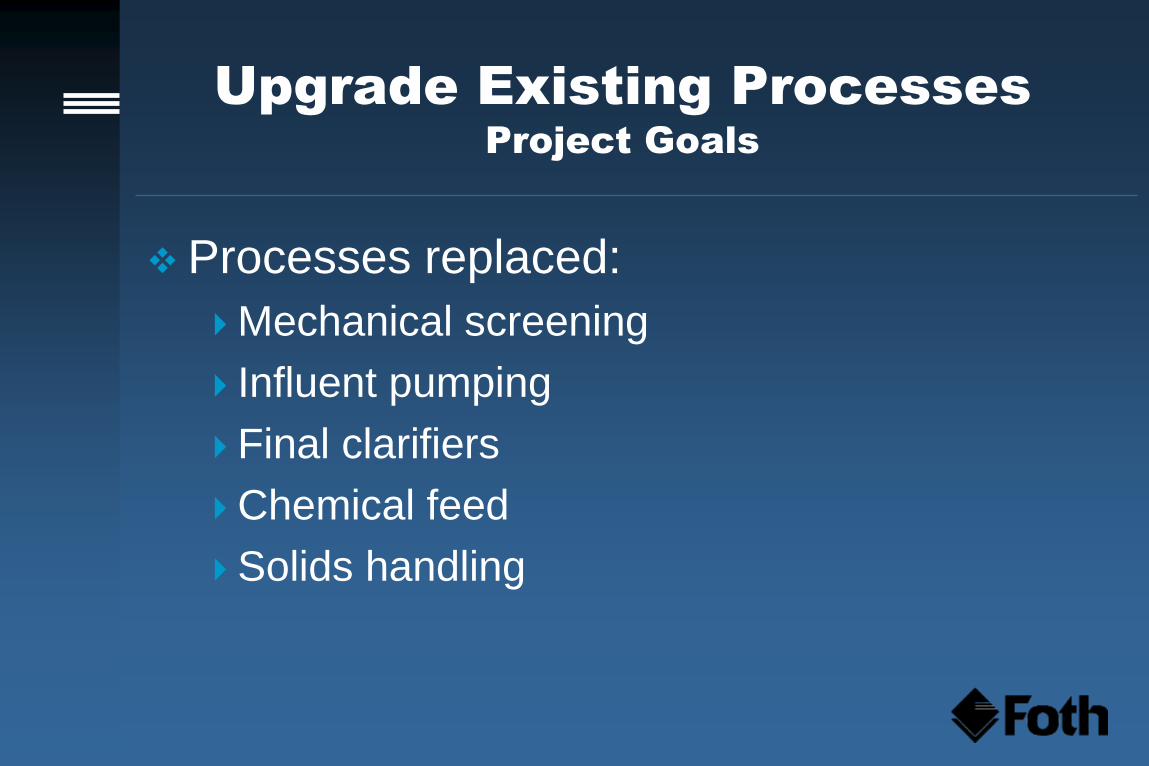
Processes replaced:
Mechanical screening
Influent pumping
Final clarifiers
Chemical feed
Solids handling
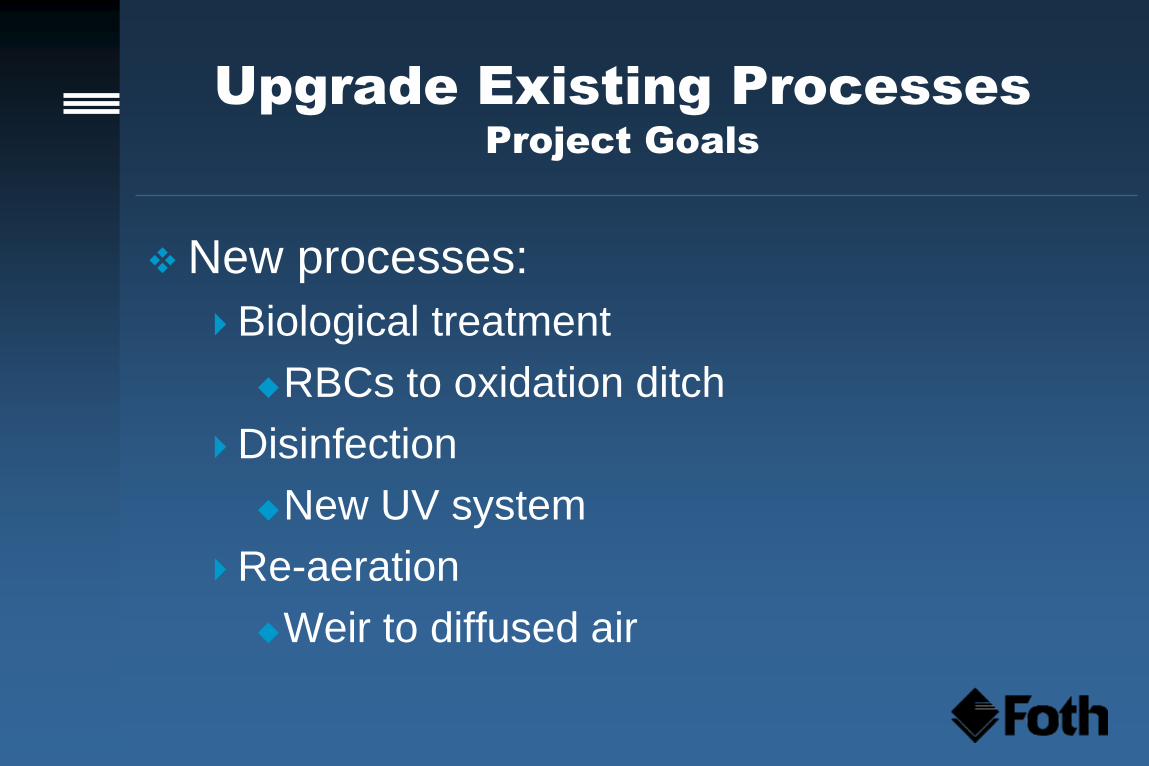
Upgrade Existing Processes
Project Goals
New processes:
Biological treatment
RBCs to oxidation ditch
Disinfection
New UV system
Re-aeration
Weir to diffused air
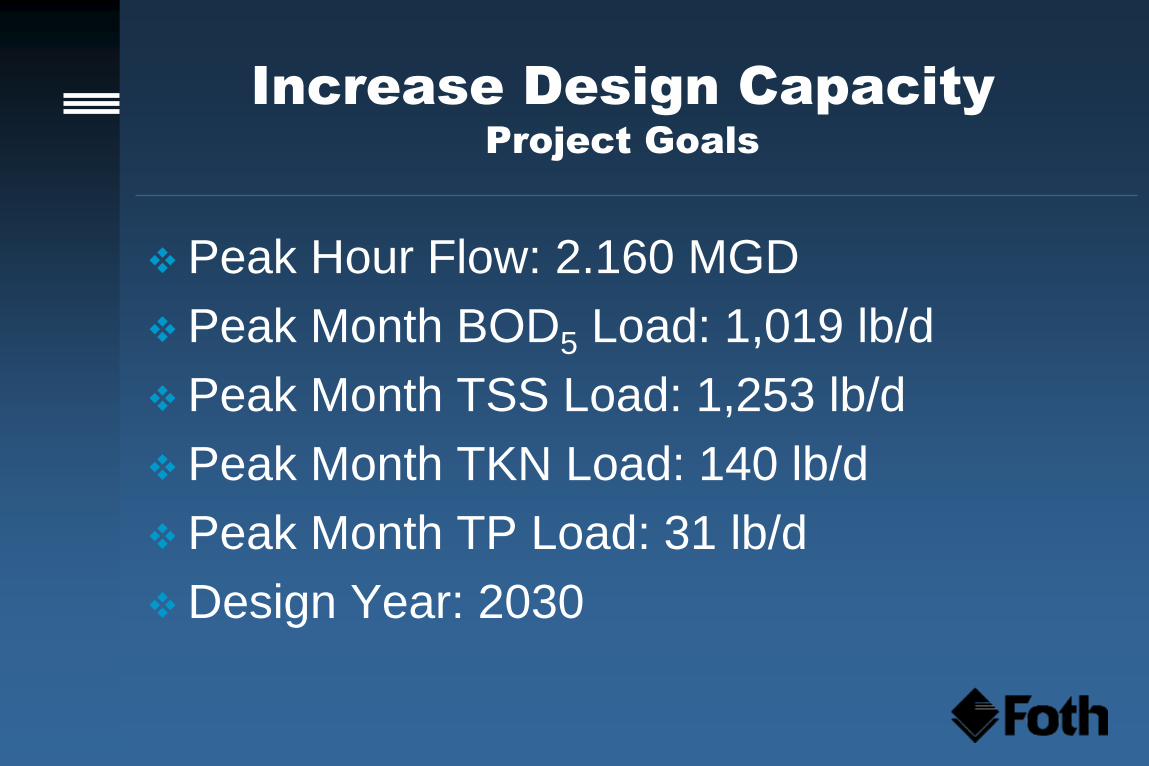
Increase Design Capacity
Project Goals
Peak Hour Flow: 2.160 MGD
Peak Month BOD5 Load: 1,019 lb/d
Peak Month TSS Load: 1,253 lb/d
Peak Month TKN Load: 140 lb/d
Peak Month TP Load: 31 lb/d
Design Year: 2030
WWTP Upgrades
WWTP overview
Biological treatment upgrades
Biological nutrient removal (BNR) design
Other upgrades
Bidding and construction
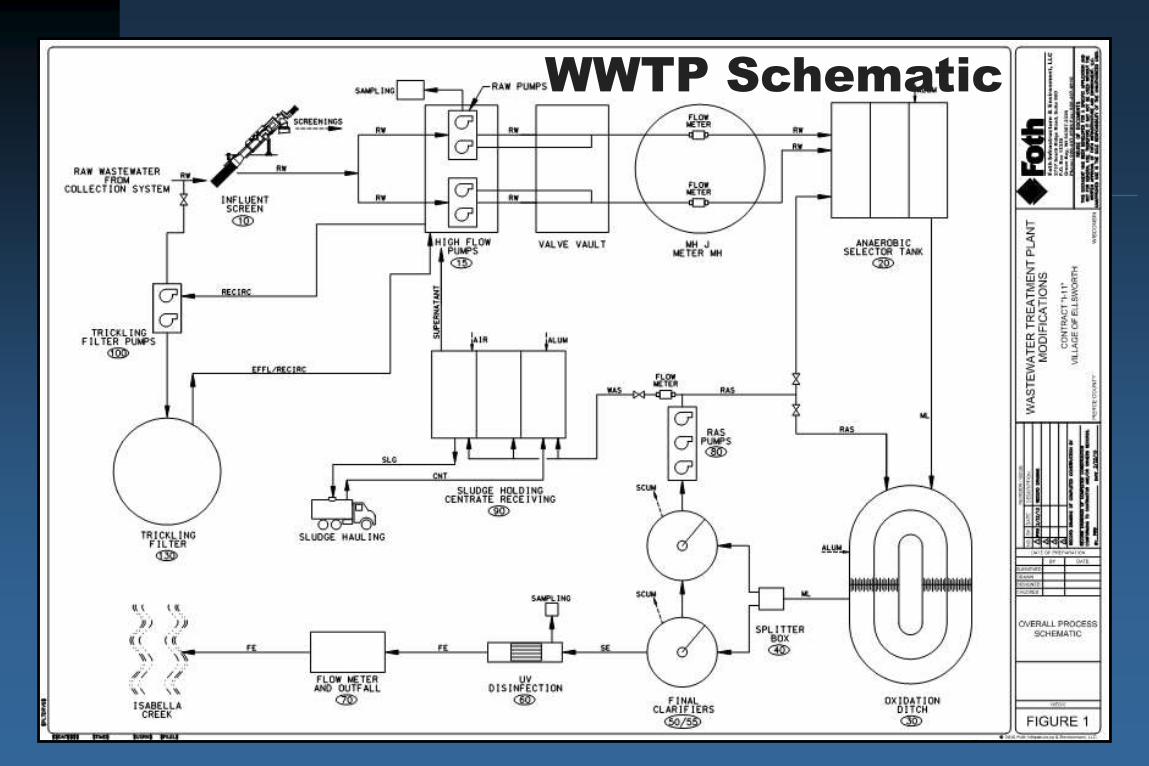
WWTP Overview
WWTP Upgrades
WWTP Schematic

WWTP Overview
WWTP Upgrades
Biological Treatment Upgrades
WWTP Upgrades
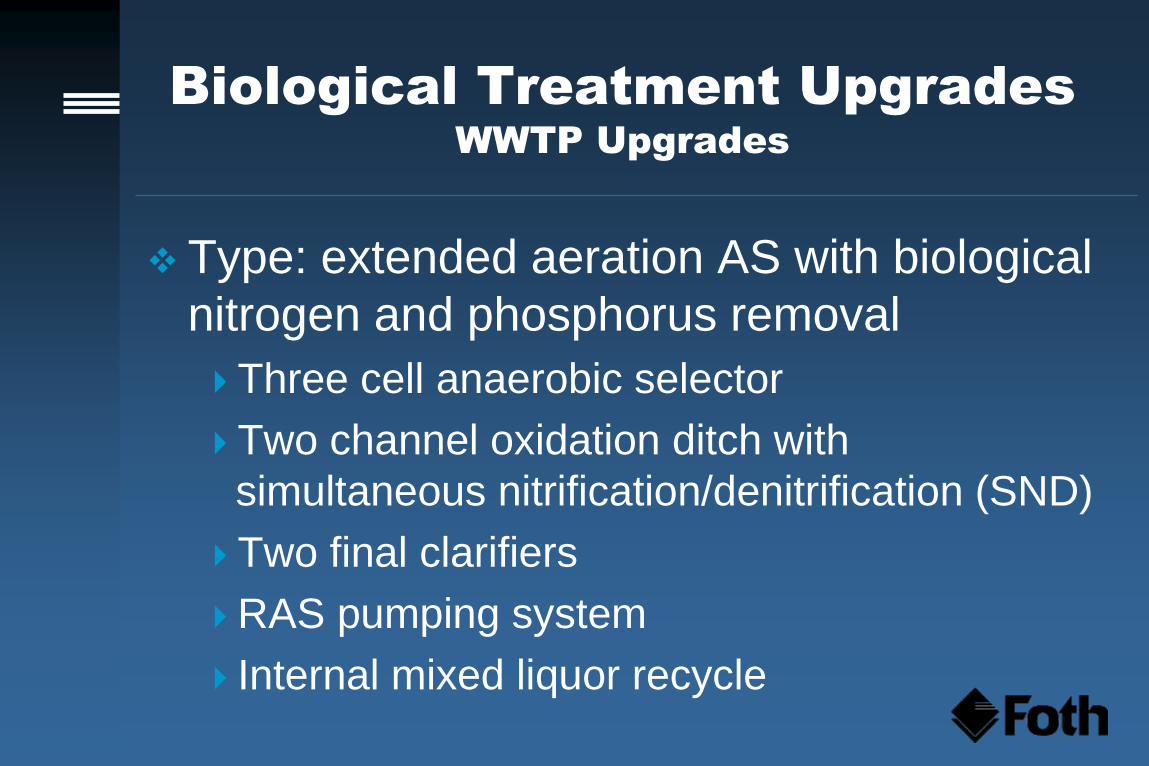
Type: extended aeration AS with biological
nitrogen and phosphorus removal
Three cell anaerobic selector
Two channel oxidation ditch with
simultaneous nitrification/denitrification (SND)
Two final clarifiers
RAS pumping system
Internal mixed liquor recycle
Biological Process Parameters
WWTP Upgrades
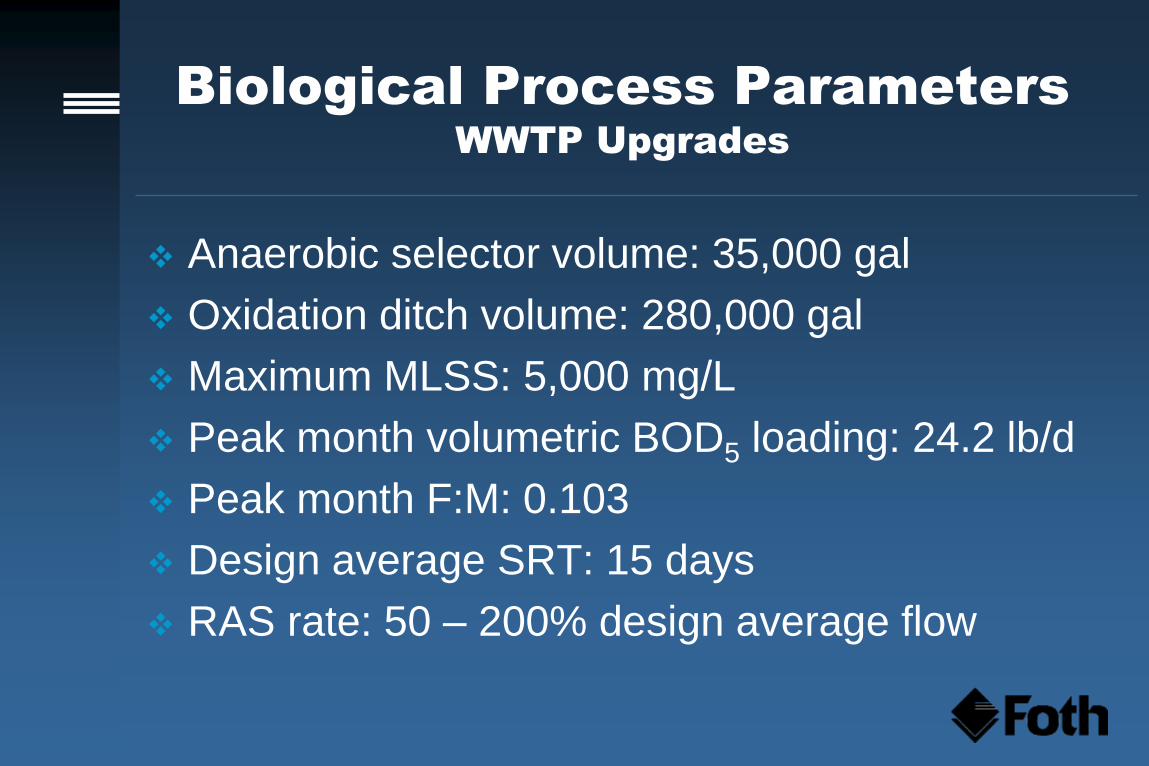
Anaerobic selector volume: 35,000 gal
Oxidation ditch volume: 280,000 gal
Maximum MLSS: 5,000 mg/L
Peak month volumetric BOD5 loading: 24.2 lb/d
Peak month F:M: 0.103
Design average SRT: 15 days
RAS rate: 50 – 200% design average flow
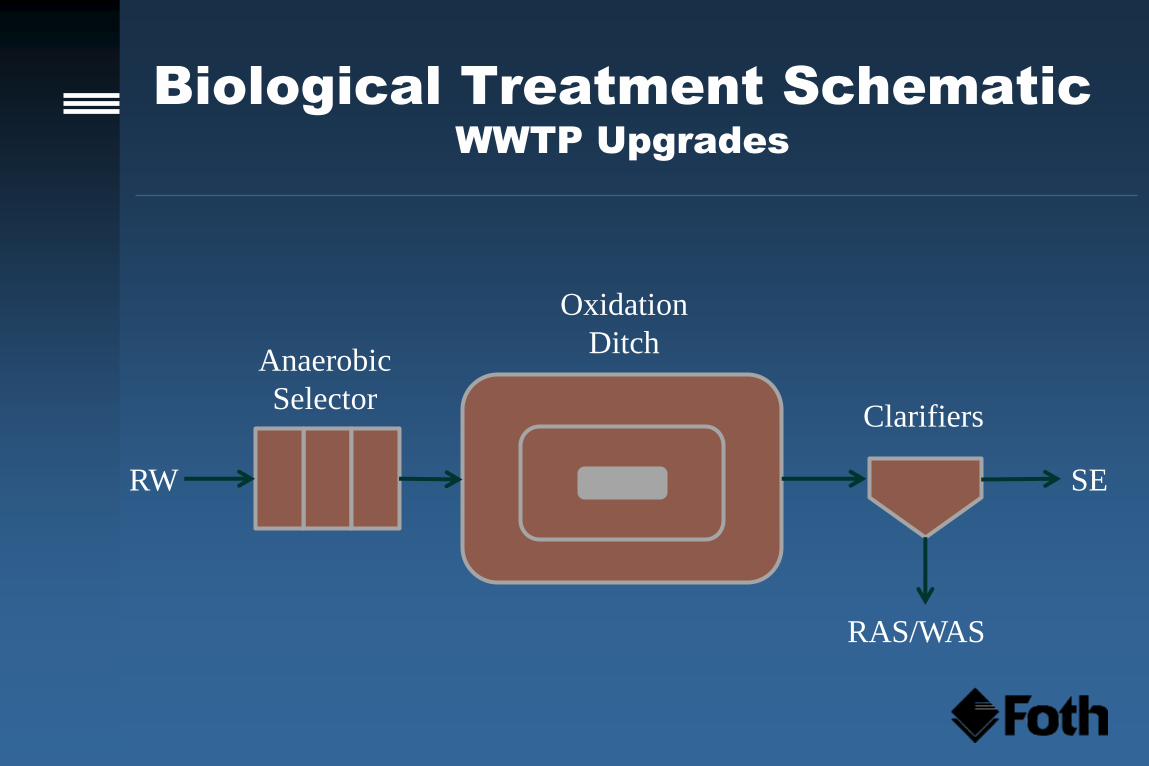
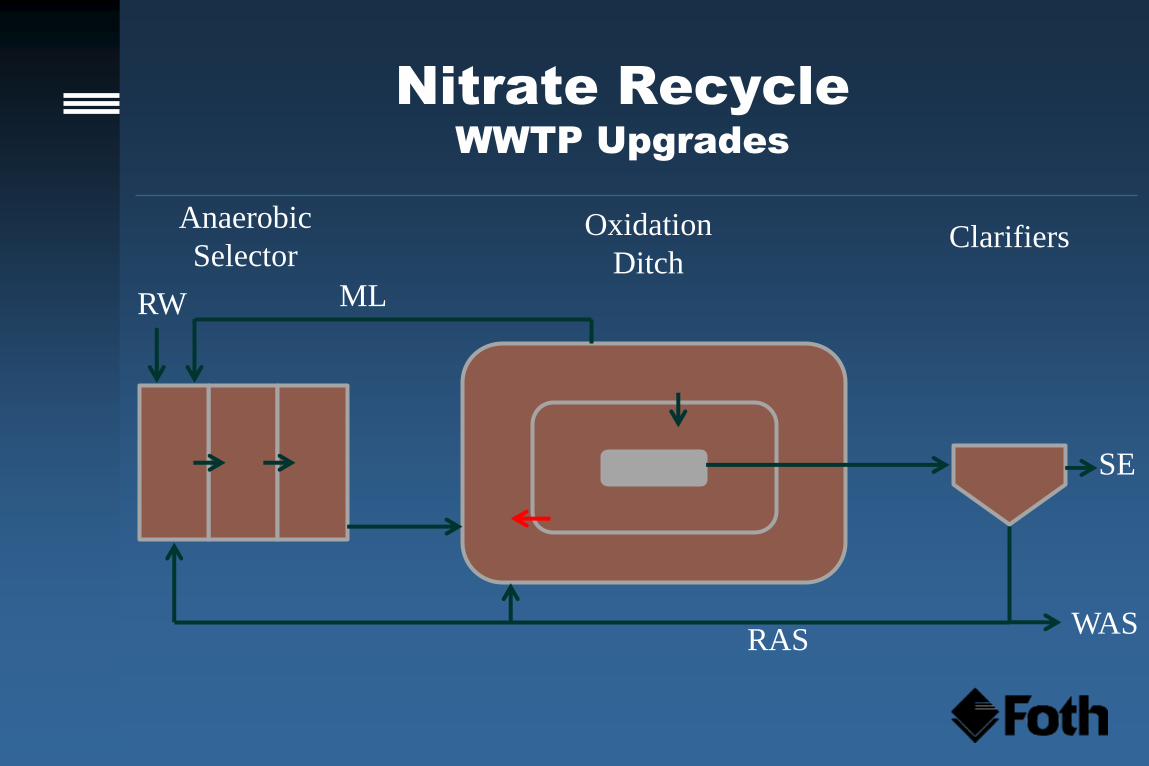
Biological Treatment Schematic
WWTP Upgrades
RW SE
RAS/WAS
Anaerobic
Selector
Oxidation
Ditch
Clarifiers
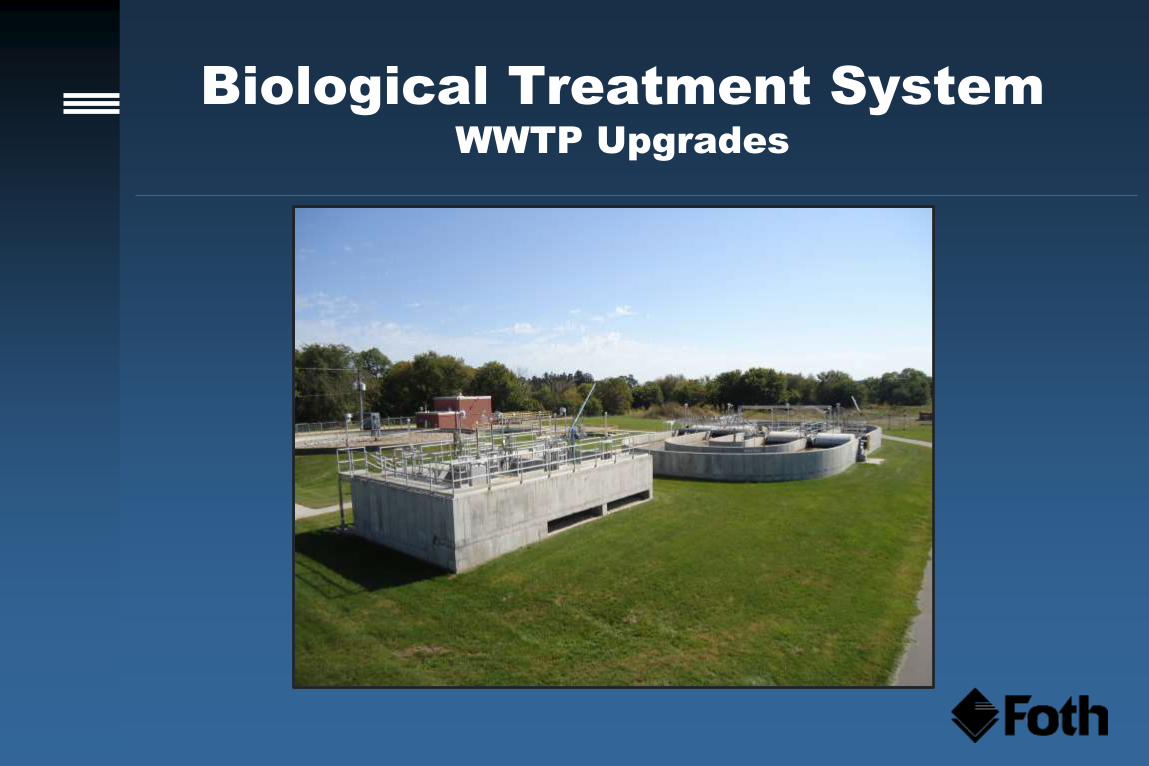
Biological Treatment System
WWTP Upgrades
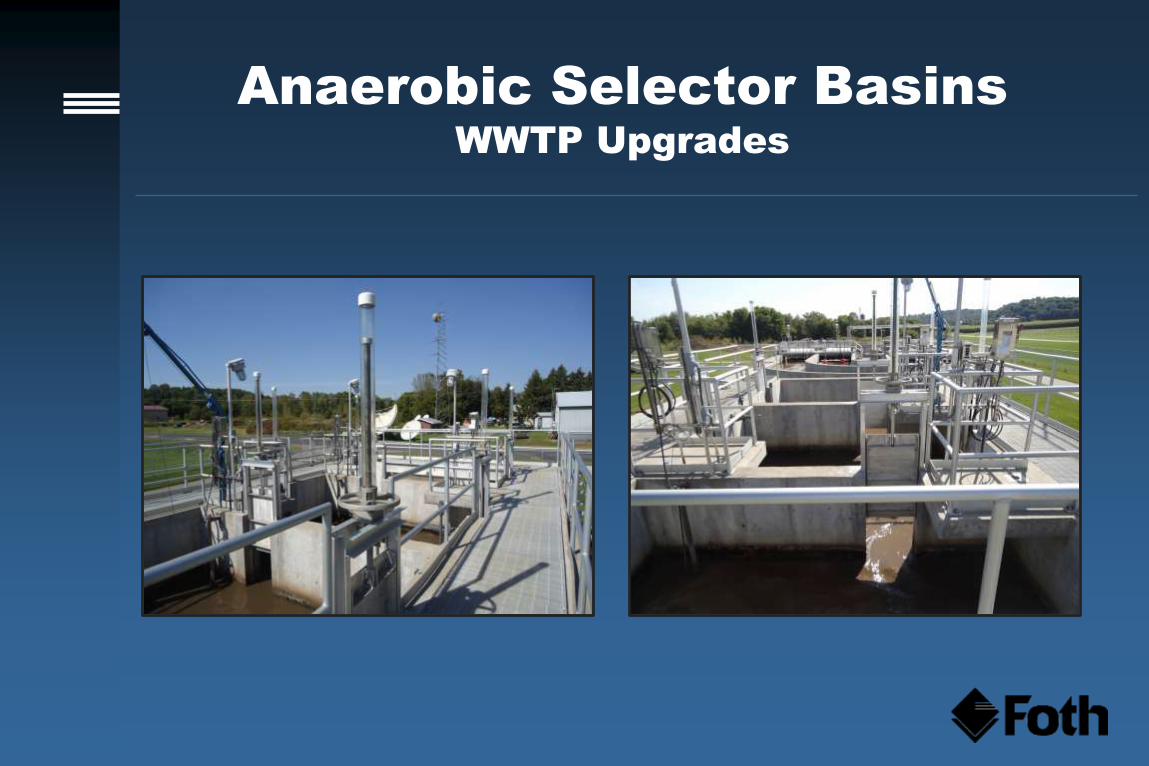
Anaerobic Selector Basins
WWTP Upgrades
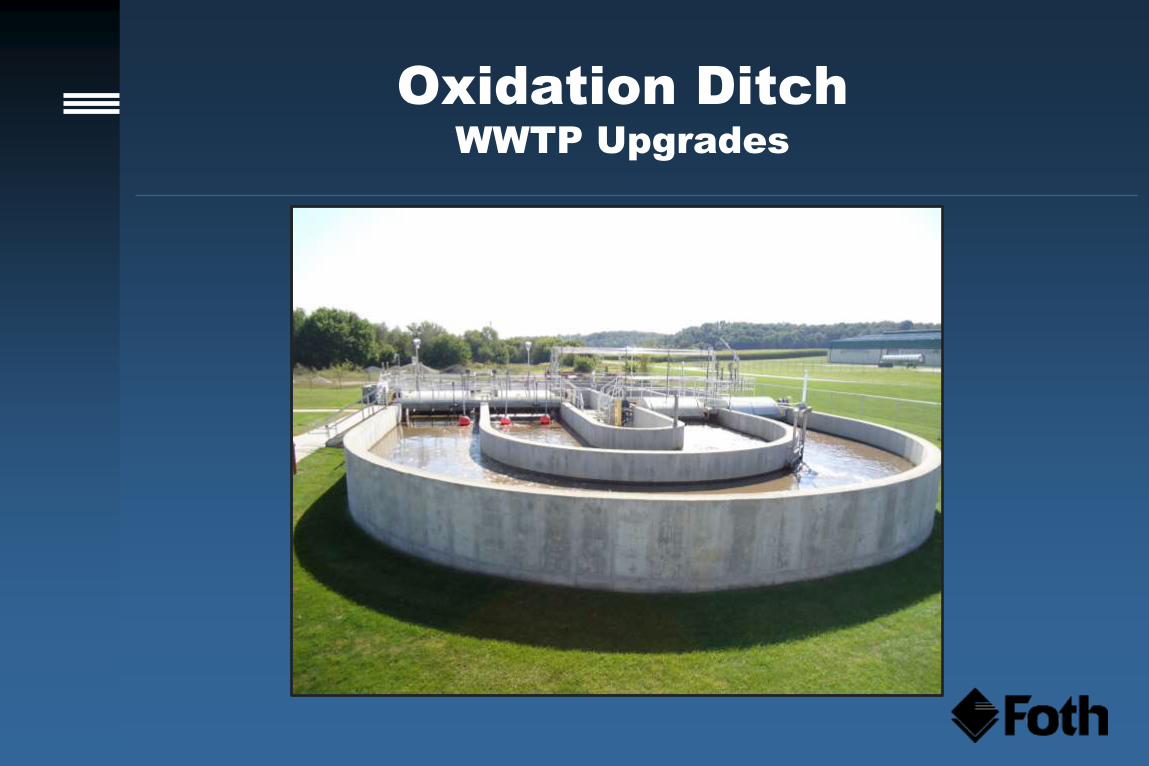
Oxidation Ditch
WWTP Upgrades
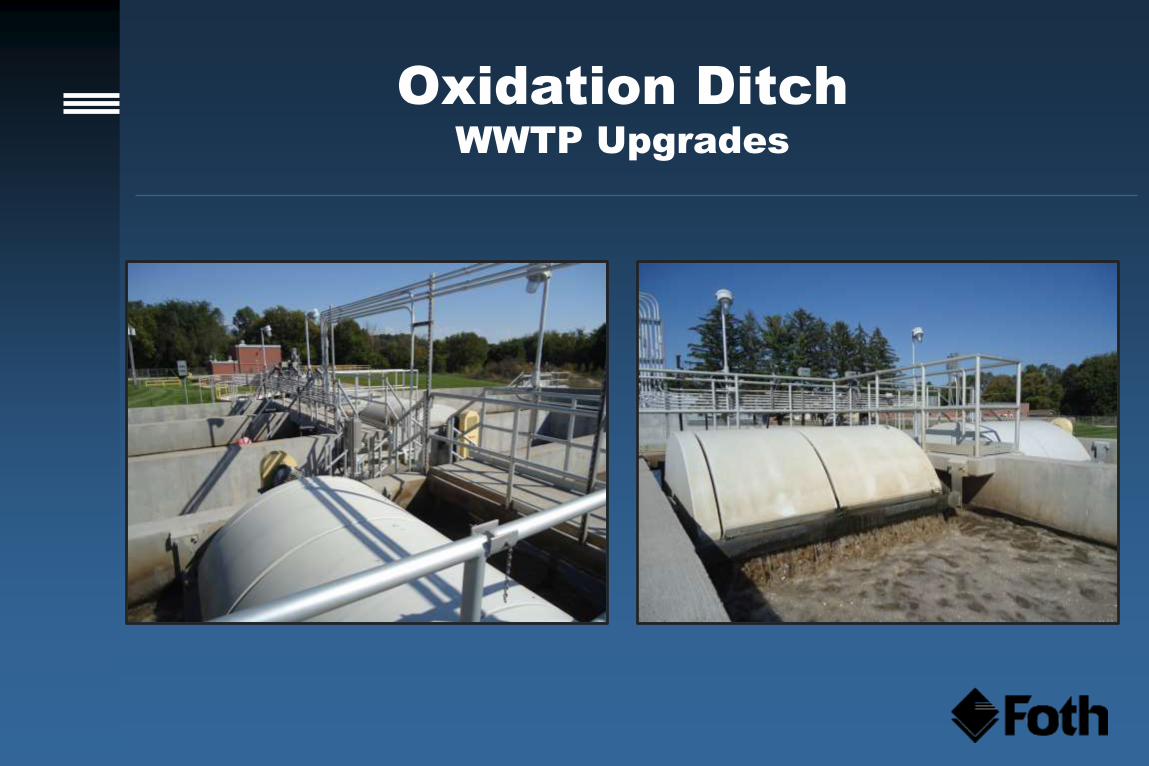
Oxidation Ditch
WWTP Upgrades
BNR Design
WWTP Upgrades
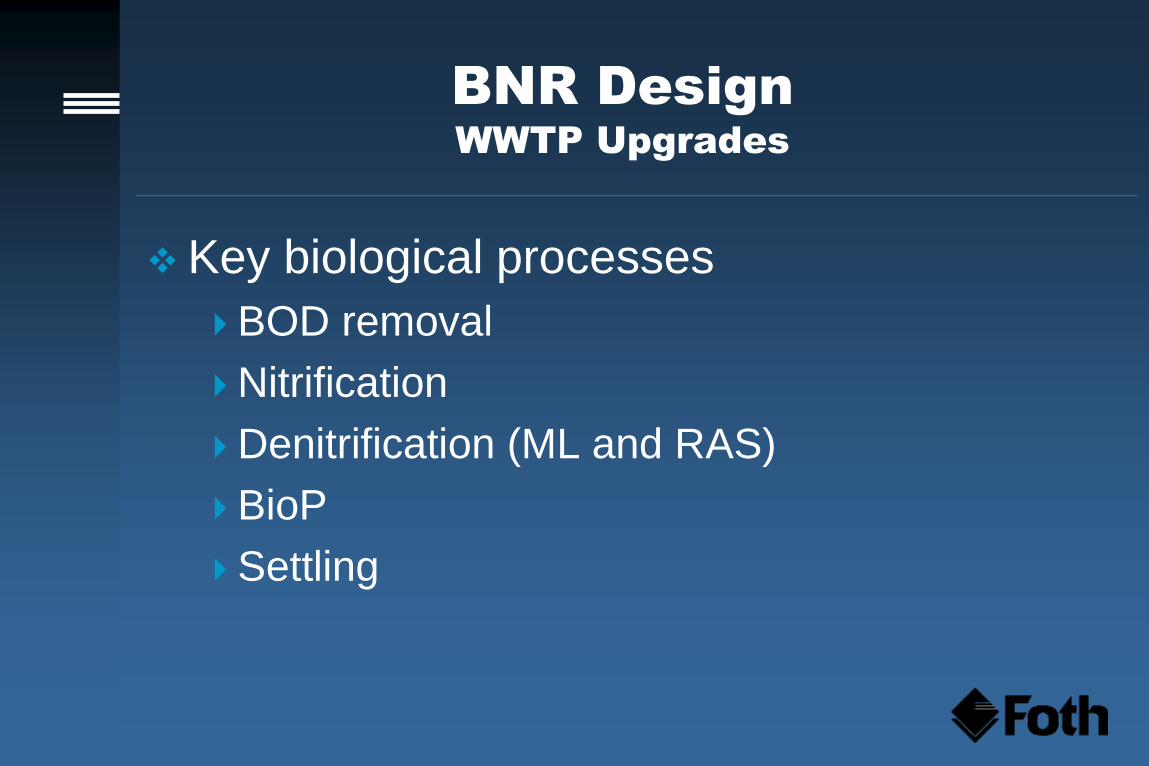
Key biological processes
BOD removal
Nitrification
Denitrification (ML and RAS)
BioP
Settling
BNR Design
WWTP Upgrades
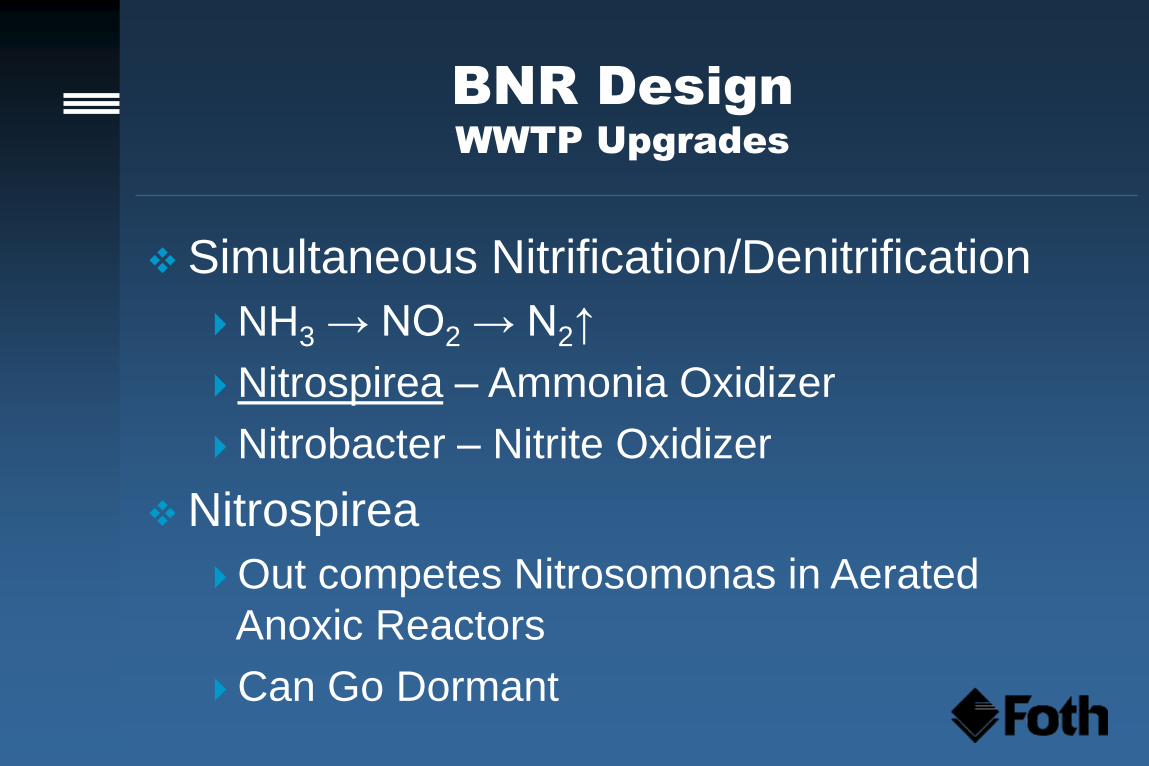
Simultaneous Nitrification/Denitrification
NH3 → NO2 → N2↑
Nitrospirea – Ammonia Oxidizer
Nitrobacter – Nitrite Oxidizer
Nitrospirea
Out competes Nitrosomonas in Aerated
Anoxic Reactors
Can Go Dormant
BNR Design
WWTP Upgrades
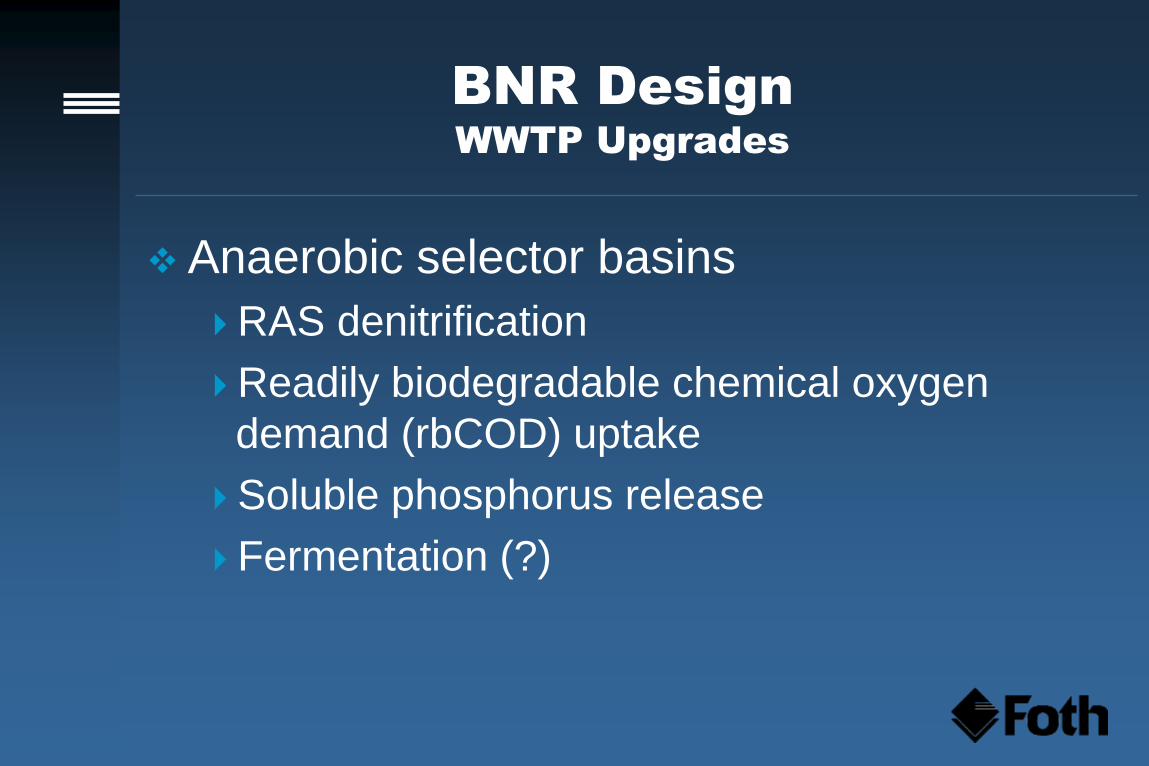
Anaerobic selector basins
RAS denitrification
Readily biodegradable chemical oxygen
demand (rbCOD) uptake
Soluble phosphorus release
Fermentation (?)
BNR Design
WWTP Upgrades
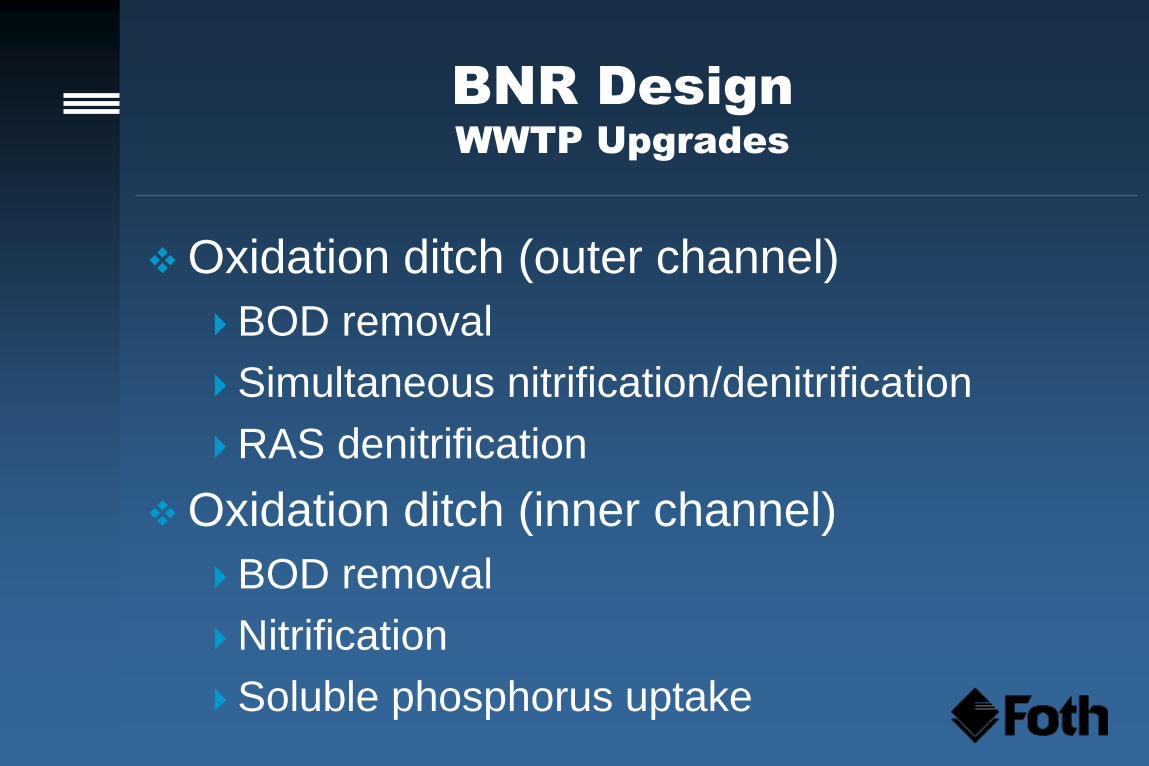
Oxidation ditch (outer channel)
BOD removal
Simultaneous nitrification/denitrification
RAS denitrification
Oxidation ditch (inner channel)
BOD removal
Nitrification
Soluble phosphorus uptake
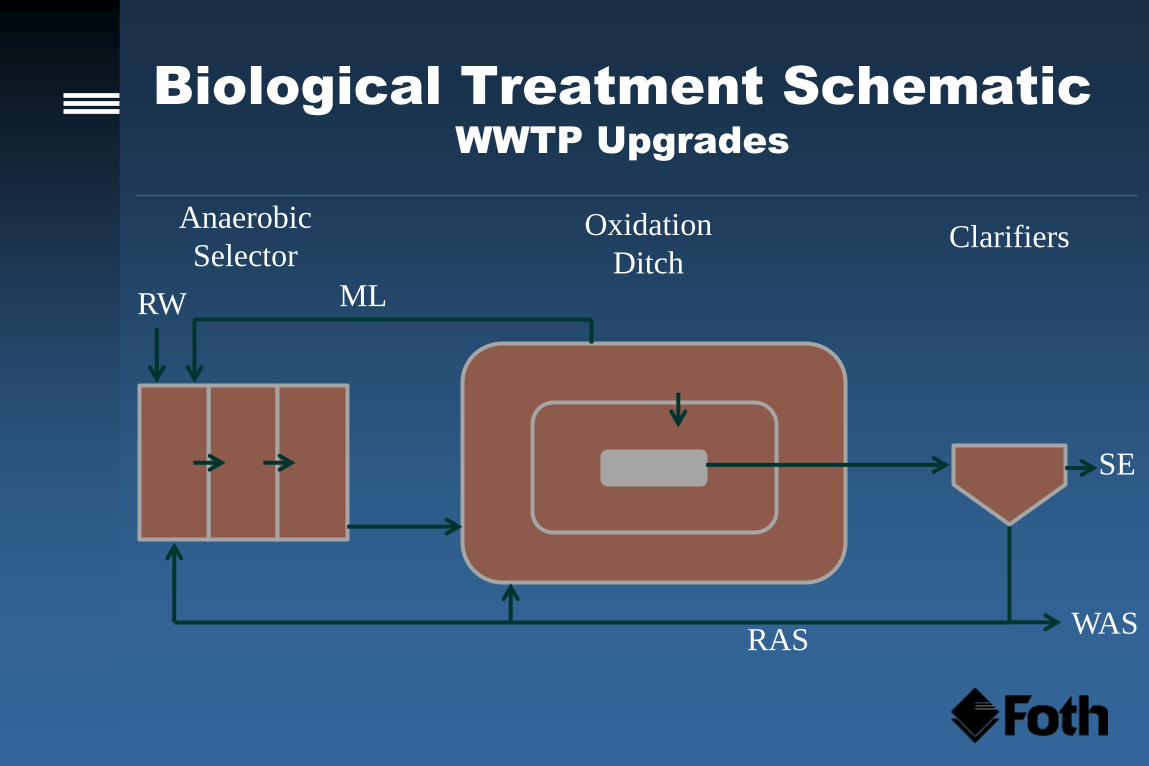
Biological Treatment Schematic
WWTP Upgrades
RW
SE
RAS
Anaerobic
Selector Oxidation
Ditch Clarifiers
WAS
ML
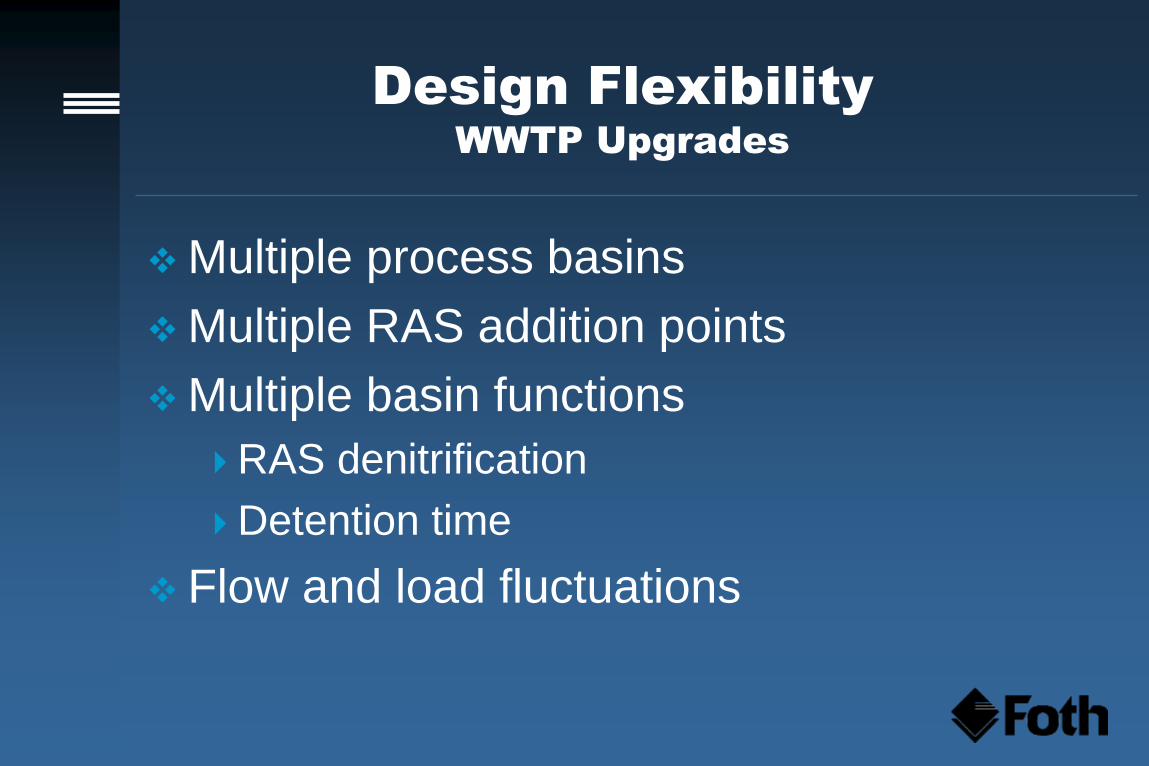
Design Flexibility
WWTP Upgrades
Multiple process basins
Multiple RAS addition points
Multiple basin functions
RAS denitrification
Detention time
Flow and load fluctuations
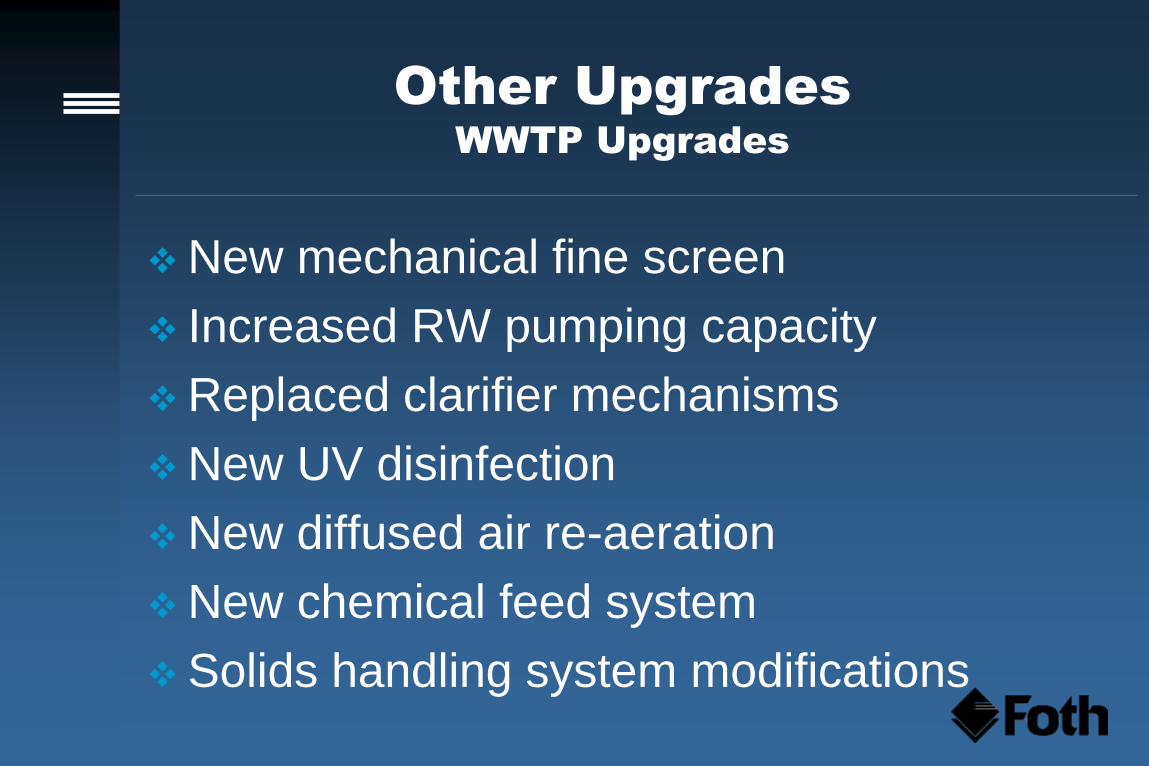
Other Upgrades
WWTP Upgrades
New mechanical fine screen
Increased RW pumping capacity
Replaced clarifier mechanisms
New UV disinfection
New diffused air re-aeration
New chemical feed system
Solids handling system modifications
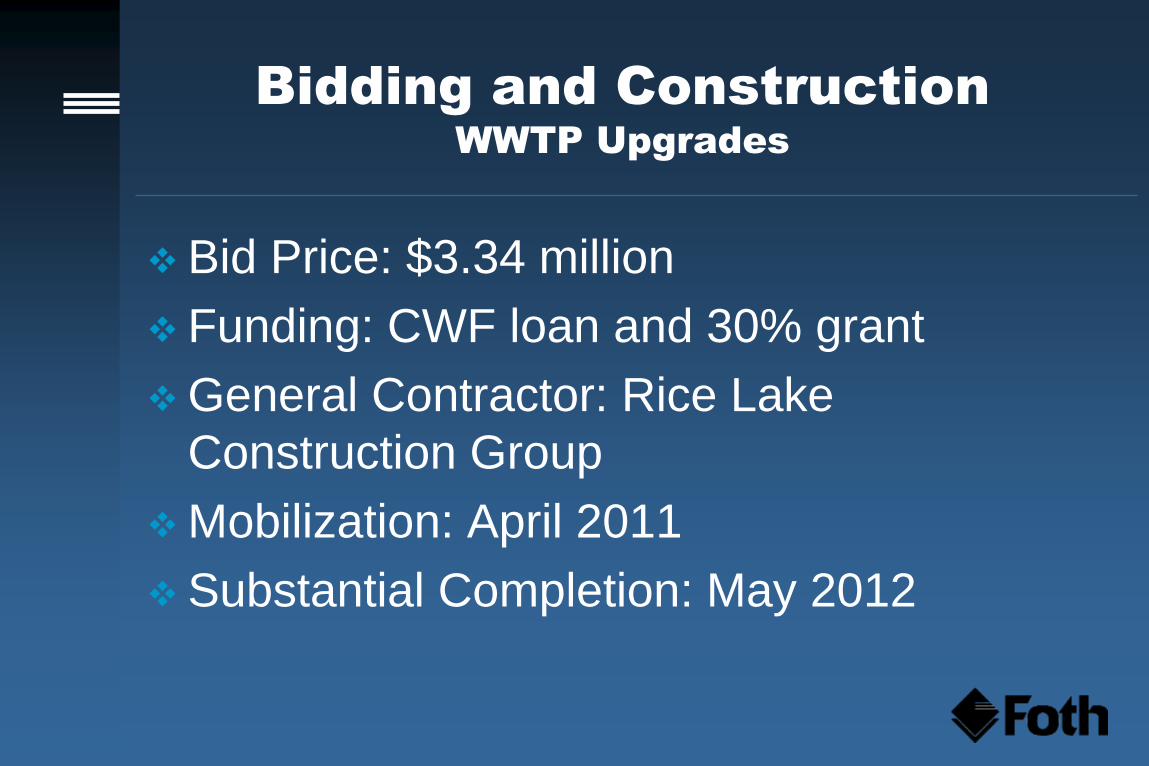
Bidding and Construction
WWTP Upgrades
Bid Price: $3.34 million
Funding: CWF loan and 30% grant
General Contractor: Rice Lake
Construction Group
Mobilization: April 2011
Substantial Completion: May 2012
Performance and Optimization
Initial performance
Operational and process optimization
Current performance
Initial Performance
Performance and Optimization
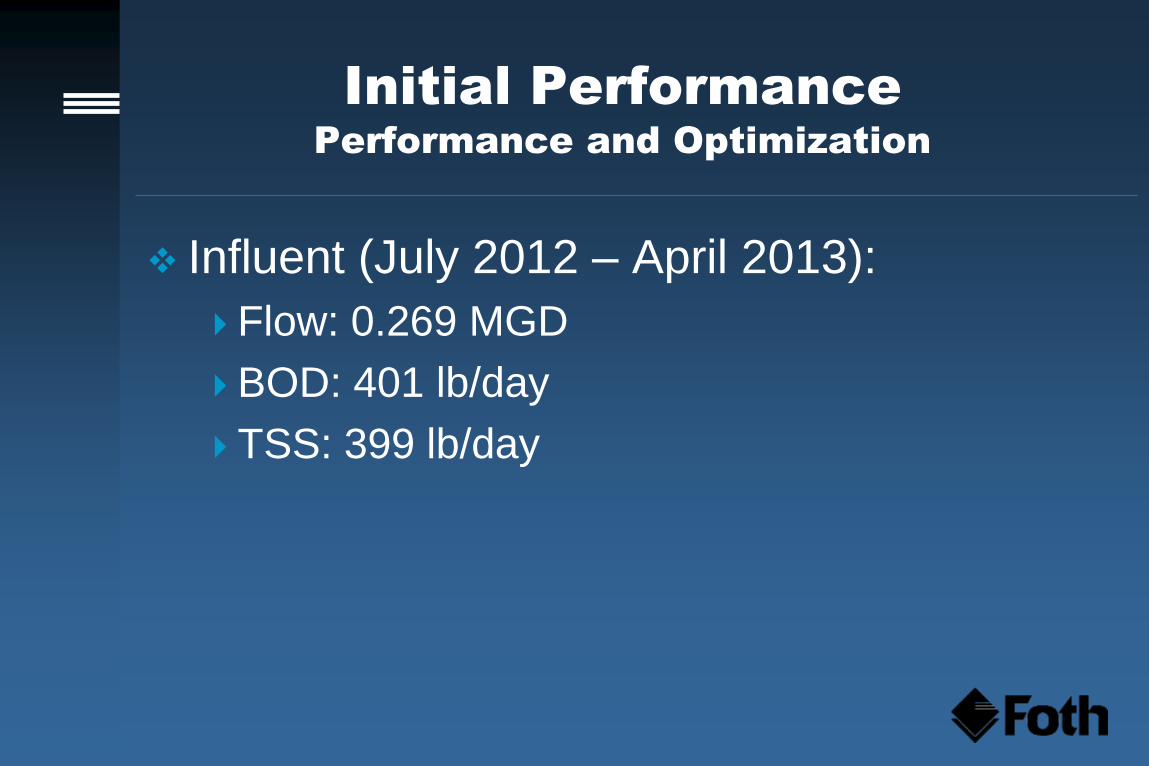
Influent (July 2012 – April 2013):
Flow: 0.269 MGD
BOD: 401 lb/day
TSS: 399 lb/day
Initial Performance
Performance and Optimization
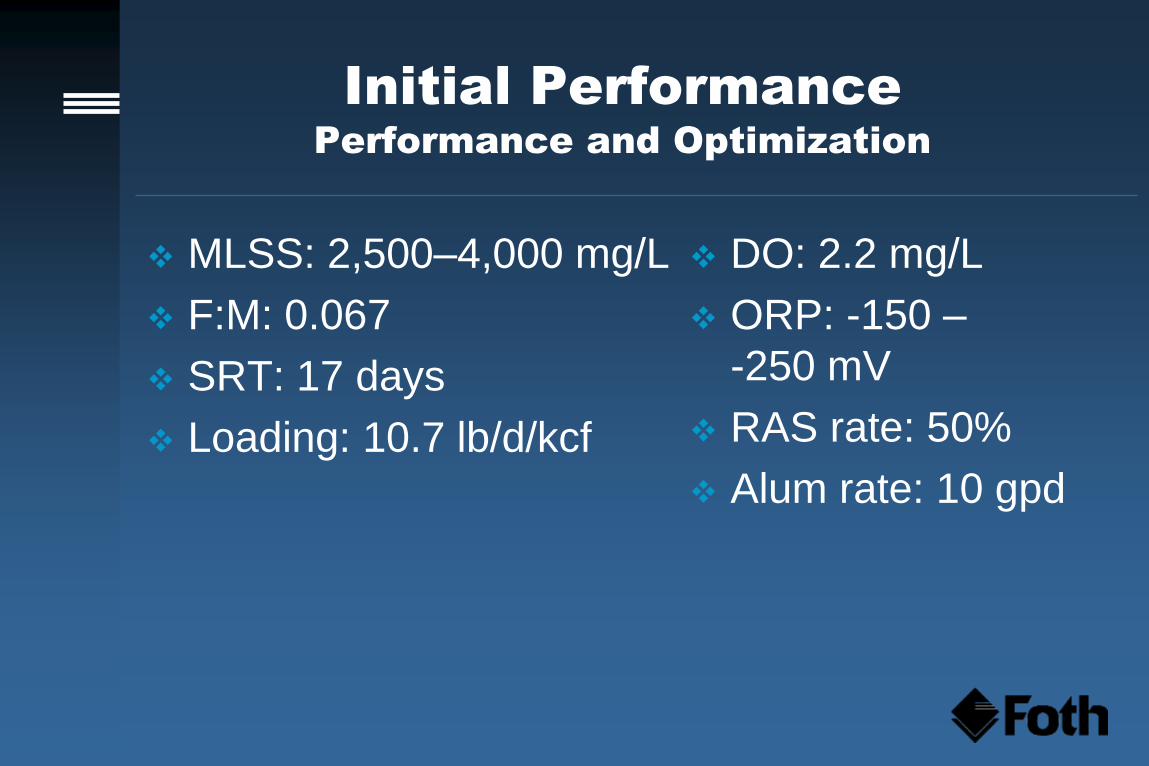
MLSS: 2,500–4,000 mg/L
F:M: 0.067
SRT: 17 days
Loading: 10.7 lb/d/kcf
DO: 2.2 mg/L
ORP: -150 –
-250 mV
RAS rate: 50%
Alum rate: 10 gpd
Initial Performance
Performance and Optimization
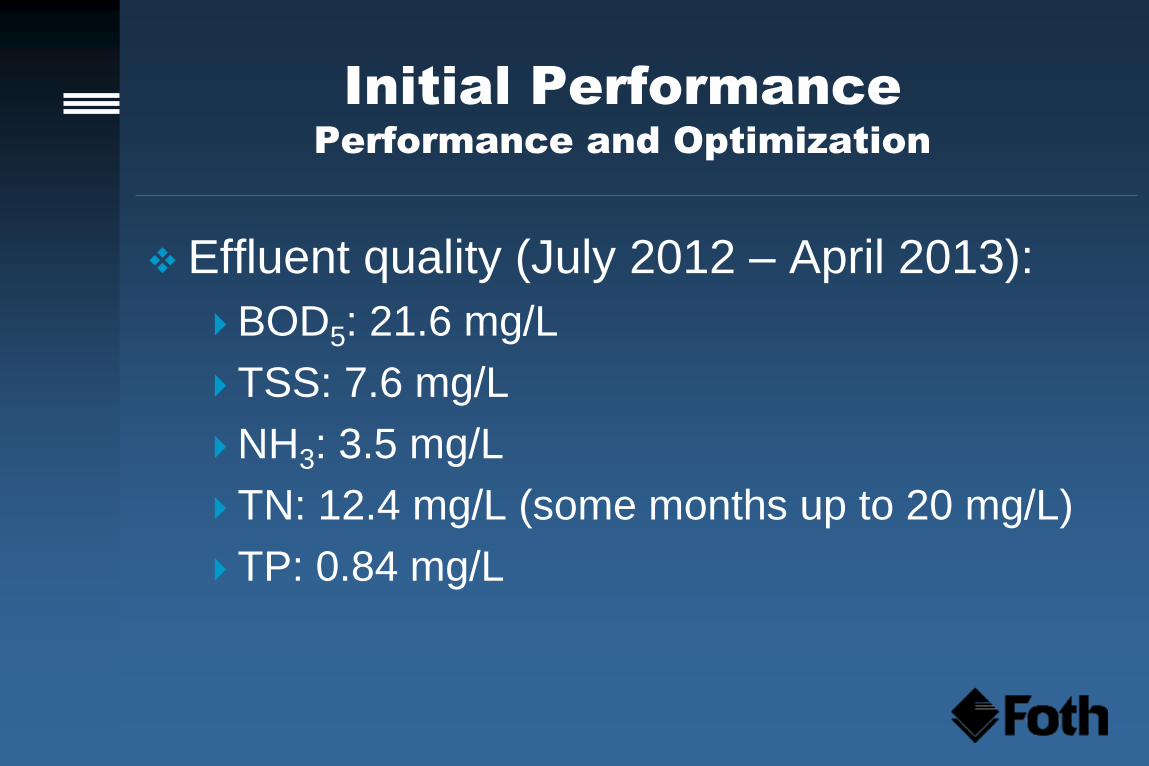
Effluent quality (July 2012 – April 2013):
BOD5: 21.6 mg/L
TSS: 7.6 mg/L
NH3: 3.5 mg/L
TN: 12.4 mg/L (some months up to 20 mg/L)
TP: 0.84 mg/L
System Optimization
Performance and Optimization
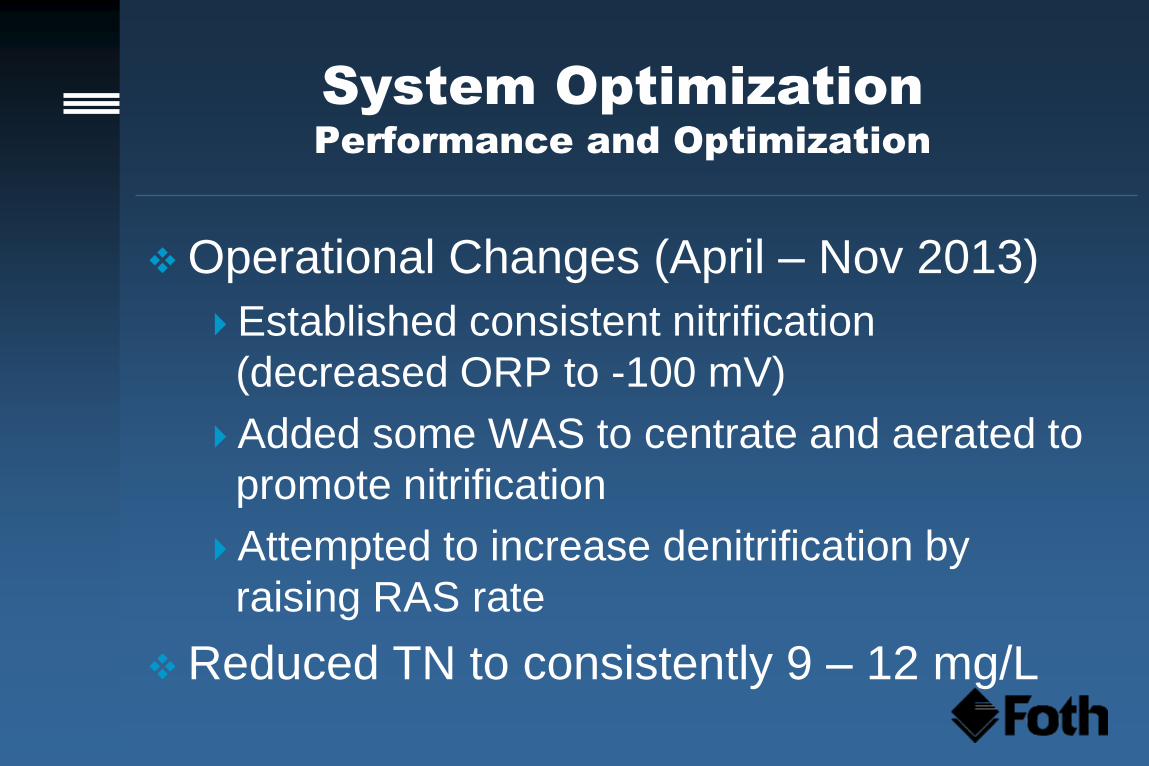
Operational Changes (April – Nov 2013)
Established consistent nitrification
(decreased ORP to -100 mV)
Added some WAS to centrate and aerated to
promote nitrification
Attempted to increase denitrification by
raising RAS rate
Reduced TN to consistently 9 – 12 mg/L
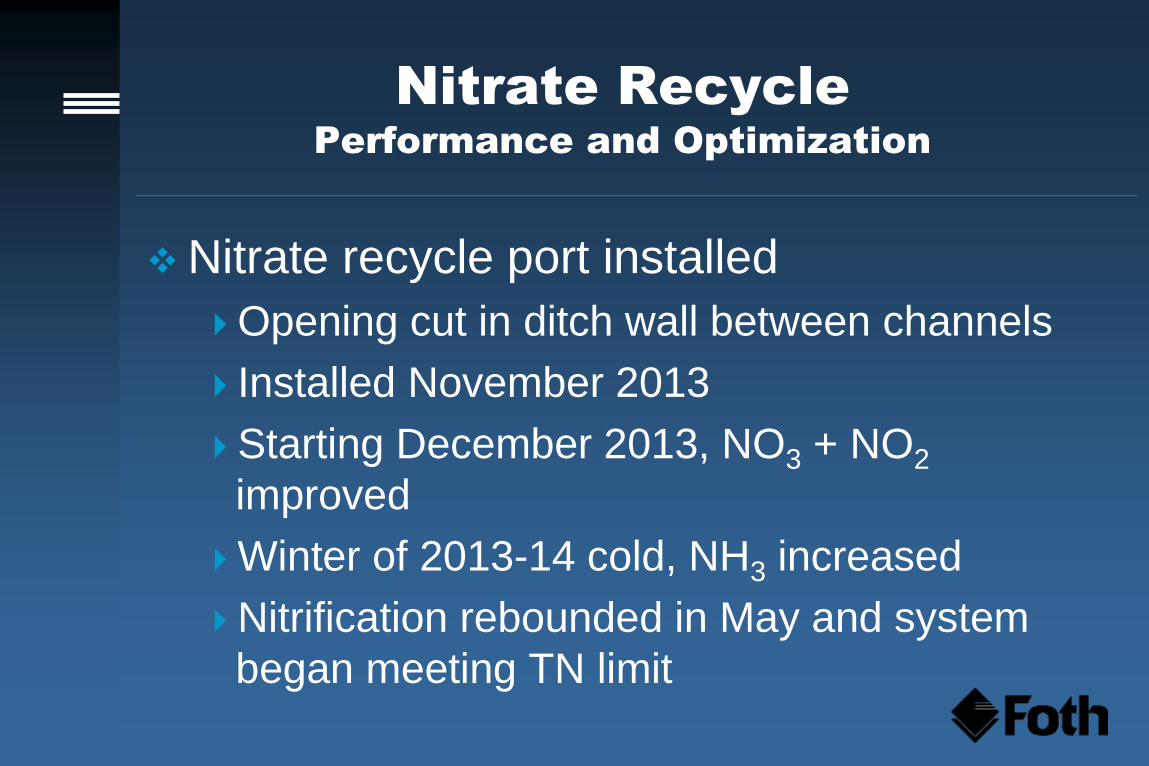
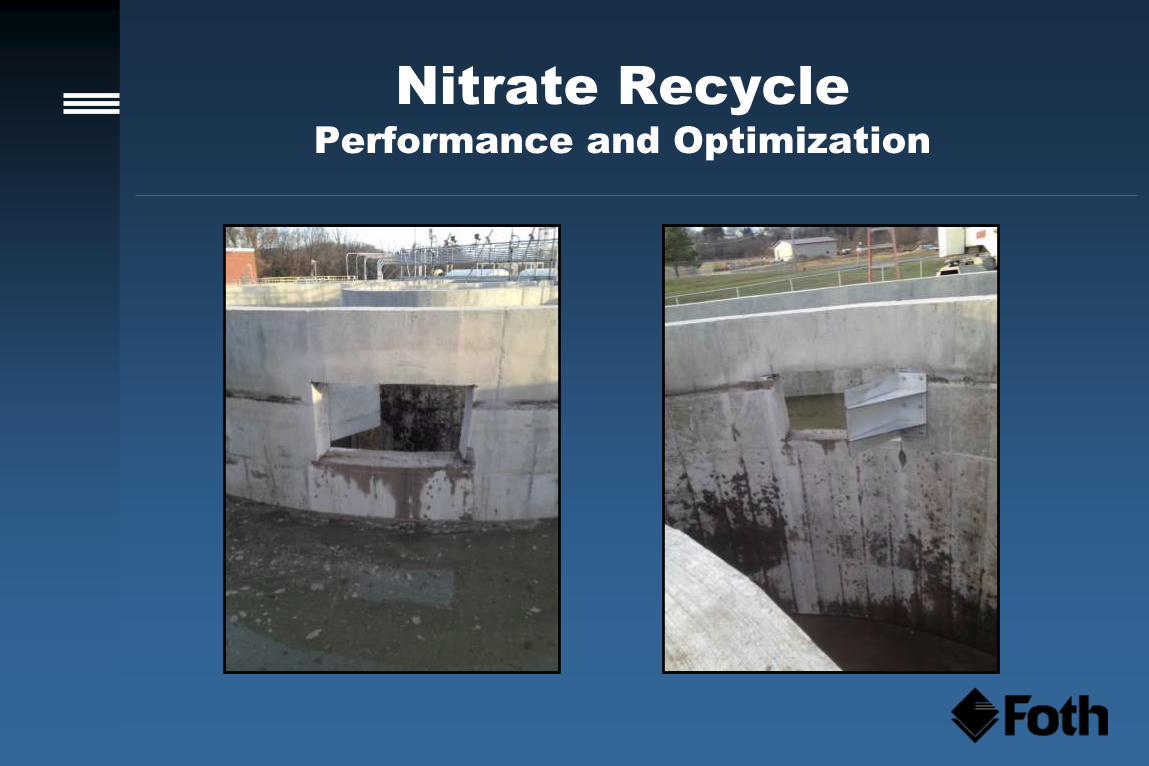
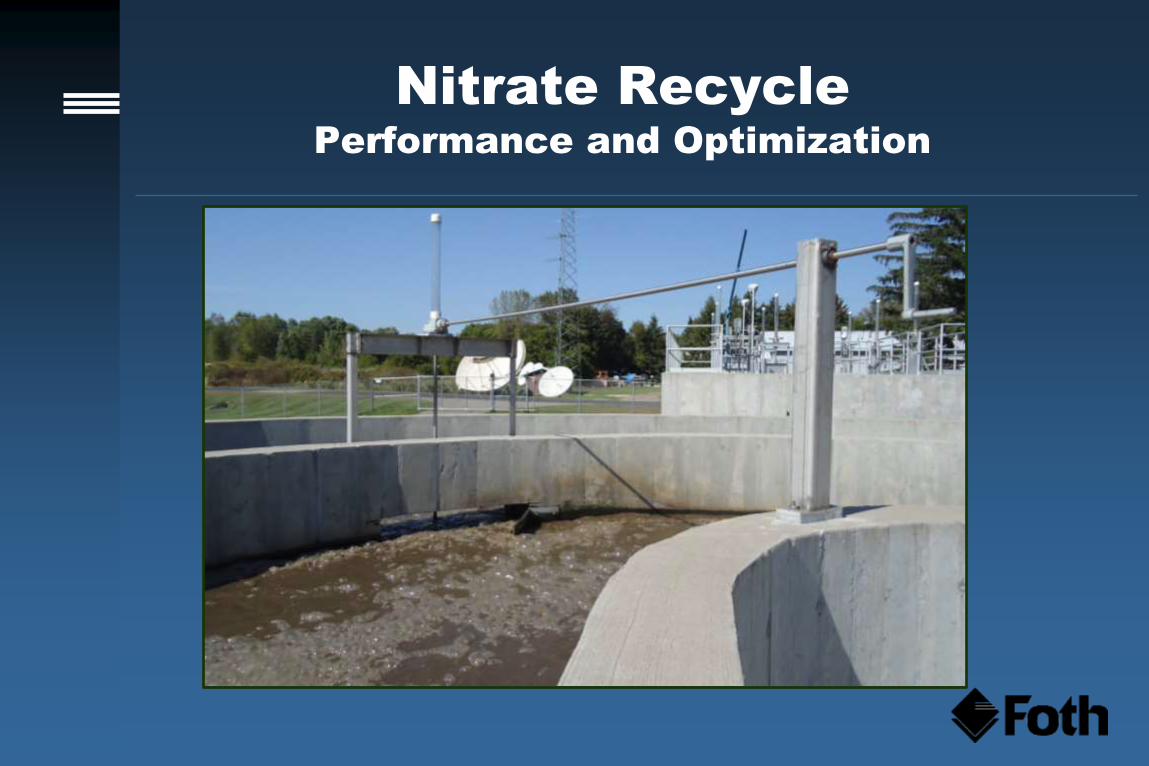
Nitrate Recycle
Performance and Optimization
Nitrate recycle port installed
Opening cut in ditch wall between channels
Installed November 2013
Starting December 2013, NO3 + NO2
improved
Winter of 2013-14 cold, NH3 increased
Nitrification rebounded in May and system
began meeting TN limit
Nitrate Recycle
Performance and Optimization
Nitrate Recycle
Performance and Optimization
Nitrate Recycle
WWTP Upgrades
RW
SE
RAS
Anaerobic
Selector Oxidation
Ditch Clarifiers
WAS
ML
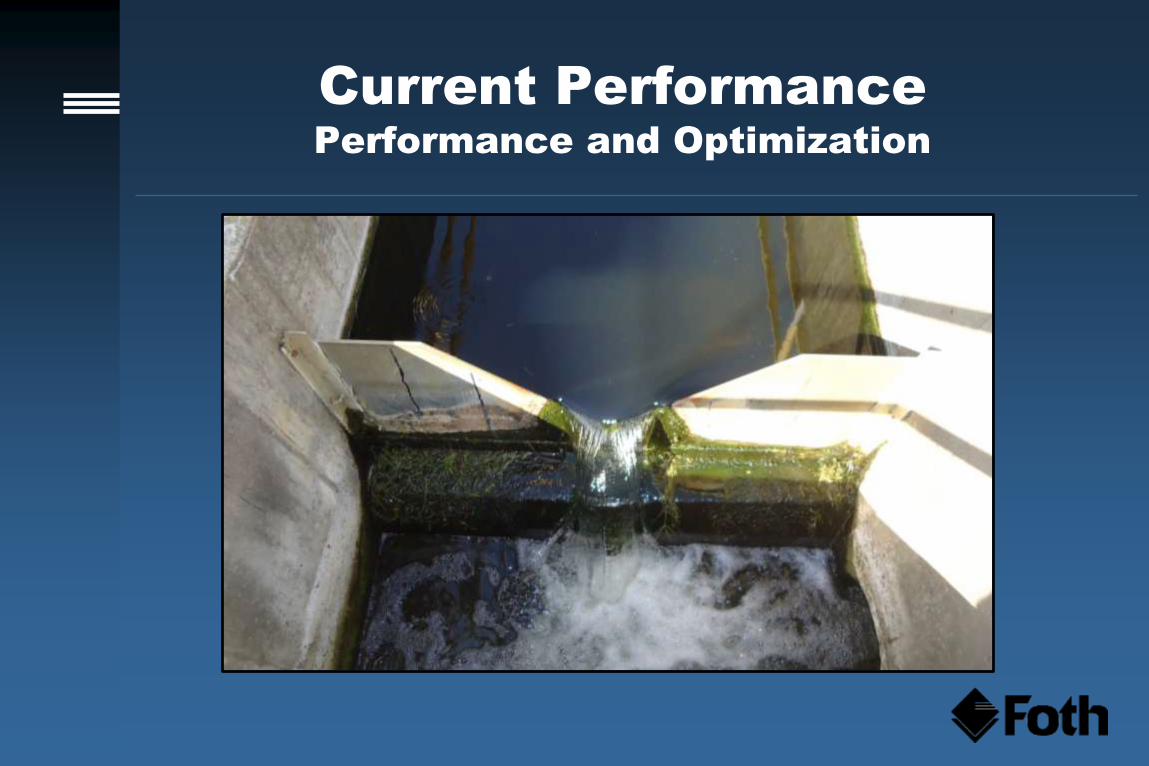
Current Performance
Performance and Optimization
Influent (May 2014 – July 2015):
Flow: 0.347 MGD
BOD: 381 lb/day
TSS: 464 lb/day
Current Performance
Performance and Optimization
MLSS: 2,500–5,500 mg/L
F:M: 0.052
SRT: 18 days
Loading: 10.1 lb/d/kcf
DO: 3.0 mg/L
ORP: -100 mV
RAS rate: 50%
Alum rate: 10 gpd
Current Performance
Performance and Optimization
Effluent quality (May 2014 – July 2015):
BOD5: 7.3 mg/L
TSS: 3.9 mg/L
NH3: 0.4 mg/L
TN: 4.5 mg/L
TP: 0.43 mg/L
Current Performance
Performance and Optimization
Conclusions
Biological process start-up is not automatic
Flexibility in design benefits future
operation
Effective TN and BioP is possible at small
WWTPs