Embed Size (px)
Citation preview

BIOLOGICAL NUTRIENT REMOVAL: WHERE WE HAVE BEEN, WHERE WE ARE GOING?
JAMES L. BARNARD
Black & Veatch, Kansas City MO ABSTRACT The paper covers the early research that led to the development of the biological nutrient removal (BNR) technology that is widely practiced today then looks at the present and future of BNR. Presently only suspended and attached growth biological processes or a combination of the two are used to reduce nitrogen concentration to around 3 mg/L. New technologies such as the SHARON® and ANAMMOX® processes are being developed to utilize autotrophic denitrification when treating high strength ammonia streams, reducing or eliminating the need for carbon addition. The concentration of recalcitrant dissolved organic nitrogen (rDON) which cannot be removed by biological processes will determine the limits to which nitrogen can be reduced. Phosphorus can be removed effectively to very low levels by using chemicals; however, biological treatment can remove phosphorus to between 0.1 and 0.15 mg/L, reducing the amount of chemical required for removal to very low levels. KEY WORDS Biological nutrient removal, phosphorus, nitrogen, limits of technology, research needs INTRODUCTION Removal of phosphorus from the effluent of municipal facilities discharging to the Great Lakes was implemented by the Great Lakes Water Quality Agreement of 1972 between the US and Canadian governments. Most utilities added chemicals to the activated sludge process to precipitate the phosphorus to less than 1 mg/L in the effluent. At this point, biological phosphorus removal was observed but not yet understood. The protection of San Francisco Bay required the removal of nitrogen. The EPA Manual on nitrogen removal (Parker, 1975) showed that 79% of the nitrogen derived from point sources and 11% from dairies and feedlots. Nitrogen was also the limiting nutrient in bays and estuaries on the East Coast and in Florida. In South Africa, the high concentration of population in the relatively dry interior resulted in indirect recycling of wastewater, and even though there had been an ammonia standard in place since 1954, discharges of nitrates and phosphorus had not been reduced. By late 1960s dense growths of blue-green algae resulted in poisoning of animals and taste and odor problems for downstream water users. Windhoek, the capital city of Namibia was running out of reliable water resources. In the late 1960s the National Institute for Water Research in South Africa launched intensive research concentrating especially on reclamation of wastewater for potable re-use. BACKGROUND OF BIOLOGICAL NITROGEN REMOVAL Nitrification was first observed in the 19th century but since the invention of the flow-through activated sludge process by Arden & Lockett (1914), it had been considered a nuisance. One of
1
WEFTEC®.06
Copyright 2006 Water Environment Foundation. All Rights Reserved©

the early and extensive studies of nitrification and denitrification was carried out by Sawyer & Bradney (1945) investigating sludge rising problems in final clarifiers. The landmark work by Downing et al. (1964a) demonstrated that a solids retention time, or sludge age, in excess of the inverse of the growth rate of Nitrosomonas was required to prevent the washout of the slow growing autotrophic bacteria. The identification by researchers such as Downing et al. (1964b) of compounds that inhibited the nitrifying organisms advanced the application of the activated sludge process for nitrogen removal.
During the 1950s denitrification gained attention as a process for the removal of nitrogen from wastewater. Johnson (1966) published a number of flow diagrams shown in Figure 1, for state-of-the-art biological nitrogen removal. Wuhrmann (1962) proposed creating a denitrification zone after the nitrification zone in a one-sludge system for denitrification using stored carbon in a high-rate process. Ludzack et al. (1962) introduced the “Semi-aerobic Activated Sludge Process” shown on Figure 1c to simulate simultaneous nitrification and denitrification observed in channel systems. Settled activated sludge was returned to the aerated section and primary effluent introduced in the semi-aerobic section. Aerated mixed liquor containing nitrates was recycled to this semi-aerobic section through the action of the aeration system “to supply dissolved nitrite and nitrate to compensate for reduced aeration in the influent zone.” Nitrogen removal with weak sewage was disappointing mainly as a result of the intentional recycling of dissolved oxygen to the semi-aerobic zone. A pilot plant at the Blue Plains plant, Washington DC tested the three-sludge system shown in Figure 1b. Organic carbon was removed in the first stage, nitrification was enhanced in the second stage and methanol was added in the third stage for denitrification. Nitrogen removal to less than 3 mg/L was reported (Schwinn et al, 1974 after Parker 1975). McCarty (1969) suggested the use of an anaerobic filter, shown in Figure 1e with methanol as carbon source for the removal of nitrates from drainage water in the San Joaquin valley in California and outlined the methanol requirements for nitrate reduction. In classical experiments he established the methanol requirements for denitrification that are still widely quoted. Balakrishnan & Eckenfelder (1970) proposed a contact-stabilization process to store as much carbon as possible in the activated sludge which could then be used as the electron donor for denitrification. Organic carbon was adsorbed on to the biological floc which was settled in the first set of clarifiers, then passed to the unaerated and mixed stabilization zone for denitrification utilizing the adsorbed carbon as shown on Figure 1(d). They achieved 85% nitrogen removal but the effluent contained only ammonia nitrogen, which was difficult to reduce further. By the end of 1971, nitrogen removal ranging from 20 to 80% was observed in extended aeration channel systems. Barnard (1973) adopted the “anaerobic filter” proposed by McCarty (1969) for the removal of nitrates, but looked for ways to reduce the nitrates as far as possible using internal carbon sources in a more structured way. He experimented with the process proposed by Balakrishnan & Eckenfelder, shown in Figure 1d. Barnard modified this flow sheet by recycling the nitrified mixed liquor from the second stage to an initial unaerated stage to use the influent carbon directly and so eliminate one set of final clarifiers. He then eliminated the remaining intermediate clarifier and recycled nitrified mixed liquor to the anoxic stage to form the two-stage Modified Balakrishnan/Eckenfelder (MBE) process that later became known as the MLE process (Figure 2a).
2
WEFTEC®.06
Copyright 2006 Water Environment Foundation. All Rights Reserved©

OX AX
OX OX AX OX
60-70%
Blue Plains Pilot
35-50% Removal
Figure 1. - Available Technology
Methanol
MCarty (1969)
95% Removal
N
Ludzack & Ettinger (1962) Semi-Aerobic Process
Balakrishnan-Eckenfelder (1969)
Wuhrman (1962)
90% Removal
Stabilization
85% Removal
Contact
NOx
N2
3
WEFTEC®.06
Copyright 2006 Water Environment Foundation. All Rights Reserved©

AX OX
AX SNDOX
AX OX SND AX
OX AXAX
AX OX AX OX AX OX AX OX
OX
OX
MLE
MLE
/SN
DBa
rden
pho
MBB
RBA
FSF
Use
Ext
erna
lC
arbo
n O
nly
Den
ite F
ilter
6.0 - 8.0
4.0 – 6.0
2.5 – 3.5
2.5 – 3.5
1.8 – 2.5
C
C
Air
C
C
CFe
Effluent Valuefor UST TN mg/LFigure 2. Existing Nitrogen Removal ProcessesProcess
6.0 -8.0
1.8 – 2.5
1.8 – 2.5
OX
Any of the Above Processes
OX
AX
(a)
(b)
(c)
(d)
(e)
(f)
(g)
(h)
(i)
Attached Grouping
4
WEFTEC®.06
Copyright 2006 Water Environment Foundation. All Rights Reserved©

A secondary anoxic zone was added to use endogenous denitrification to remove the remaining nitrates, followed by a small re-aeration zone. Mixed liquor was recycled at a rate of between 4 and 6 times the average inflow rate (Figure 2c).
Figure 3 - Four-stage pilot plant, Barnard (1973)
Shortly thereafter, by April 1972, the City of Johannesburg decided to change the design of the 750,000 population equivalent Goudkoppies plant from a high rate process followed by ammonia stripping to the four-stage process. The laboratory results were verified using a 100 m3/d pilot plant shown in Figure 3. An overall nitrogen removal of 92% was demonstrated (Barnard, 1973). At this time interest in the removal of nitrogen in the United Kingdom led to the conversion of the Rye Meads activated sludge plant to a two-stage denitrification/ nitrification plant (Cooper et al., 1977) with half the flow diverted to the second anoxic zone, which resulted in the modern concept of step-feed nitrification and denitrification.
BACKGROUND OF BIOLOGICAL PHOSPHORUS REMOVAL
Levin (1970) patented the Phostrip process shown on Figure 4. Return activated sludge (RAS) was fermented in a “stripper” where it released phosphorus. The phosphorus-rich supernatant was treated with lime and the precipitate was removed. The underflow from the stripper was returned to the aeration basin where the phosphorus was removed very efficiently. High levels of phosphorus removal were also observed at the Rilling Road WWTP in San Antonio (Vacker et al. (1967), the Hyperion WWTP in Los Angeles and the Back River WWTP in Baltimore (Milbury et al. 1971). Milbury noted that all plants that removed phosphorus were plug-flow systems and were operated not to nitrify, and secondly, that all these plants experienced a release of phosphorus near the inlet zone where no dissolved oxygen could be detected.
Barnard (1974) observed phosphorus reduction from 8 mg/L to less than 0.2 mg/L for periods lasting up to six weeks in the pilot plant, shown in Figure 3, while studying the 4-stage nitrogen removal process shown in Figure 2c. A release of phosphorus to about 30 mg/L occurred in the second anoxic zone and good phosphorus removal was achieved only when this release was taking place. When the specific configuration was changed the good phosphorus removal could not be achieved. This will be further discussed below.
5
WEFTEC®.06
Copyright 2006 Water Environment Foundation. All Rights Reserved©

Figure 4 – Phostrip Process for Phosphorus Removal (Levin et al., 1965)
Aerated Settling
Effluent
Stripper
WastedBiomass
Return Biomass
InfluentWastewater
Lime
LimeSludge
Barnard observed that nitrates interfered with biological phosphorus removal and noted that a common feature in all plants that removed phosphorus was a release of phosphorus in zones that were either intentionally or inadvertently deprived of oxygen and nitrates, and postulated that a zone free of oxygen and nitrates, followed by an aerated zone, was necessary to obtain excess biological phosphorus removal (EBPR). Nicholls (1975) investigated EPBR at Johannesburg’s Alexandra WWTP to verify the concept. Immediately afterwards anaerobic zones were also included at the Goudkoppies WWTP which was under construction. The Phoredox flow sheets for biological nitrogen and phosphorus removal (Figure 5) were presented at the monthly meeting of the Southern African Branch of the Institute of Water Pollution Control in July 1975 (Barnard, 1976). In April 1976, the biological nitrogen and phosphorus removal process flow sheets were patented only in the United States as the A/O flow sheets.
Figure 5 Phoredox Flow Sheets (Barnard, 1976)
(A) (B)
(C) (D)
Anaerobic
L e g e n d
Anoxic AerobicAnaerobic
L e g e n d
Anoxic Aerobic
6
WEFTEC®.06
Copyright 2006 Water Environment Foundation. All Rights Reserved©

Variations of the Phoredox flow sheets such as the UCT, MUCT, VIP, JHB and MJHB were proposed to ensure that nitrates do not enter the anaerobic zone. Of these the Johannesburg process with a pre-anoxic zone for denitrifying the return activated sludge, by using endogenous respiration, results in the smallest footprint. Practice has shown that any process that prevents nitrates from entering the anaerobic zone will be successful provided there is sufficient VFA or readily biodegradable carbon measured as COD (rbCOD) in the influent.
Mechanism for Biological Phosphorus Removal
While studying the Phostrip Process, Fuhs and Chen (1975) published their landmark paper, proposing a theory for biological phosphorus removal by which many organisms, later referred to as phosphate accumulating organisms (PAO), could take up VFA, especially acetic acid, in the absence of dissolved oxygen and nitrates. They derived energy for the uptake by breaking the phosphate energy bonds of previously stored phosphorus and releasing it to the liquid phase. The VFA taken up in this way is stored as poly-β-hydroxybutyrate (PHB) until the organisms reach the aerobic zone of the treatment train where they metabolize the PHB and use the energy gained to take up the phosphorus released in the anaerobic zone plus all available phosphorus in the feed, and store it as energy-rich polyphosphate chains, which in turn serve as the energy source for VFA uptake in the anaerobic zone. During the solids separation step in the final clarifiers effectively removes the phosphorus from the liquid phase. Wasting the surplus biosolids removes the phosphorus from the sludge cycle. The main theory was further researched and expanded upon by numerous researchers, notably Comeau, (1989) and Wentzel et al., (1991)
Gerber et al. (1986) demonstrated that only acetic and propionic acids could be taken up directly by the PAO’s, by adding nitrates plus either acetic, propionic, butyric or formic acid and methanol or glucose to the mixed liquor in a series of experiments. Phosphorus was released as a zero-order reaction until the substrate was used up, only with acetic or propionic acid. In the other experiments, little or no release occurred until the nitrate was eliminated, which indicated a need for fermentation of the other substrates to acetic or propionic acid before uptake by the PAOs. Wentzel et al. (1988) concluded that rbCOD can be converted in the anaerobic zone to VFA by facultative organisms in a first-order reaction in the absence of nitrates or oxygen. This would require staging the anaerobic zone for improved results. Brodisch et al. (1983) found that in all plants that removed phosphorus without sufficient VFA in the feed, Aeromonas Punctata, which had the ability to ferment rbCOD to VFA, was present. Wentzel et al. (1988) proposed a respirometric method for determining the available rbCOD but proposed that the difference in COD after ultra-filtration of the feed and effluent will give a good estimate of the rbCOD. Instead Mamais et al. (1993) flocculated colloidal material and filtered it to get comparable values. However, preliminary testing conducted as part of recent studies (WERF, 2003) showed the soluble biodegradable COD values measured, using the bioassay method, were consistently, by as much as 30%, lower than those measured by the flocculation/filtration method
Development of Fermenters for Short Chain VFA Production
The author incorporated an acid primary sludge fermenter for a plant in Kelowna British Columbia to produce additional VFA in accordance with the Fuhs and Chen theory. The supernatant from the fermenter was directed to the anaerobic zone of the Bardenpho plant. Full-scale optimization of the plant carried out by Oldham and Stevens (1984) clearly showed that at
7
WEFTEC®.06
Copyright 2006 Water Environment Foundation. All Rights Reserved©

this plant phosphorus removal would not have been possible if it were not for the additional VFA supplied by the fermenter. Barnard (1984) proposed an alternative of storing sludge in primary tanks for fermentation and the production of VFA. Oldham and Abrahams (1994) summarized the features of a number of fermenter configurations in the northwest. In all cases, sufficient VFA was produced to ensure an effluent soluble phosphorus concentration of less than 0.1 mg/L. The advantages of acid fermentation of primary sludge for achieving an effluent ortho-phosphorus concentration of less than 0.1 mg/L has been well documented (Gu et al., 2005; Baur et al., 2002)
Secondary Release of Phosphorus
Barnard (1984) noticed that when keeping phosphorus-rich sludge under conditions of no dissolved oxygen, no nitrates, and no supply of VFA, the phosphorus released cannot be removed by subsequent aeration since there was no storage of PHB involved. This phenomenon was referred to as secondary release of phosphorus. Additional VFA is required to take up phosphorus released in this way. Secondary release is the single most common reason for plants being unable to achieve effluent soluble phosphorus concentrations as low as 0.1 mg/L when all other conditions seem to favor the process (Scruggs et al., 2003).
Glycogen Accumulating Organisms GAOs compete with PAOs for rbCOD in the anaerobic zone of BNR plants by using stored glycogen as energy source. The VFA taken up in the anaerobic zone is stored as glycogen in the aeration basin and no phosphorus is taken up by the cells. At temperatures below 29ºC and neutral pH values, the PAOs will compete well for food. Rabinowitz et al (2004) reported on three plants where phosphorus removal was inhibited by GAOs at mixed liquor temperatures above 30ºC. The feeding of pure acetate at the Noosa plant resulted in very good phosphorus removal at first, but there was a population shift to GAOs. Presently molasses are fed to a fermenter which successfully produced a combination of acetate and propionate as feed for the PAOs, with excellent results (McClean et al., 2002). Randall et al. (1997) found in laboratory experiments that a combination of acetic and propionic acid will favor the growth of PAOs while feeding only acetates will result in a population shift to GAOs.
WHERE ARE WE AT PRESENT Today the technology exists to safely design either suspended or attached growth systems for removal of inorganic nitrogen to between 1 mg/L and 1.5 mg/L. The remaining nitrogen will be in the form of rDON that will vary depending on the residual concentration of rDON. Suspended growth biological systems can remove phosphorus to as low as 0.1 mg/L after filtration. Where there is not sufficient rbCOD in the feed, appropriate carbon sources should be added, either produced through fermentation (Emrick et al., 2005, Drury et al., 2005) or from an external source (deBarbadillo et al., 2005). Nitrogen Removal Extended aeration processes in many configurations have been used successfully to reduce nitrogen concentrations to low levels. However, scale, space constraints and environmental considerations require compact and cost effective solutions. A series of applicable processes are illustrated on Figure 2. The basic component of all modern plants is an MLE type configuration
8
WEFTEC®.06
Copyright 2006 Water Environment Foundation. All Rights Reserved©

for utilizing the influent carbon for denitrification. Normal domestic wastewater has a sufficient COD/TKN ratio to remove 65 to 85% of the nitrogen in this way. The shape and type of aeration basins for this basic process can range from multiple channels systems with a variety of surface aerators, subsurface mechanical aeration and fine bubble aeration systems with or without carrier media to assist with nitrification. Attached growth systems such as Biological Aerated Filters (BAF) (Stephenson et al., 2004) or a Moving Bed Bio-reactor (MBBR) (Rusten et al., 2002), could also use the same concept. After nitrification the nitrates contained in the mixed liquor or liquid, will be recycled back to the first anoxic stage for denitrification. When the process is designed for full nitrification the effluent will contain 4 to 8 mg/L of TN, depending on the aeration system used and the influent concentrations. With future emphasis on saving water, the influent concentration may increase to values between 50 and 60 mg/L as is now commonplace in Australia, resulting in higher percentage removal required to reach values as low as 3 mg/L TN. Simultaneous nitrification and denitrification (SND) in channel systems such as OrbalTM or CarouselTM can remove up to 90% nitrogen in the extended aeration mode. However it is more difficult to control them for such removals at lower SRTs. Combining SND and aeration in the MLE system is popular in Europe and has been used in the USA by the CarouselTM suppliers. The Franklin TN plant, consisting of double CarouselTM aeration channels with pre-anoxic zones produced an annual average TN concentration of less than 3.1 mg/L with an 85-percentile value of 4 mg/L compared with 8 mg/L TN when using fine bubble aeration. The 4-stage Bayou Marcus Bardenpho plant in Florida using a CarouselTM aeration basin produced an average TN concentration of 1.8 mg/L and a 90-percentile value of 3 mg/L over 5 years (deBarbadillo, 2003). Van Huyssteen et al. (1990) found that 50% of the influent nitrogen was removed in the aeration basin when using slow speed vertical spindle surface aerators. DeBarbadillo et al. (2003) converted a surface aeration plant at Kinston NC by providing unaerated zones within the basin and achieved an annual average TN of 4 mg/L. Reducing the Footprint for Nitrogen Removal Facilities Step-feed nitrogen removal has been successfully used for nitrogen removal by the City of New York and others. In a four-pass system with a feed point to the head of each pass, anoxic zones were created at every feed point. (Chandran et al., 2004). This required intensification of the biological processes such as adding alkalinity to optimize nitrifier growth rate; precise control of the oxygen supply; additional carbon for denitrification in the limited anoxic zones; and the need for extensive instrumentation. With these and other measures it will be possible to reduce the effluent TN concentration to below 4 mg/L which is the goal for 2014. McGarth (2006) used the ability of the step-feed plant for routing storm flows while still achieving high overall nitrogen removal. Integrated fixed media activated sludge (IFAS) has been used very successfully to reduce the basin requirements for nitrification. The floating media are added to the aeration zone to supply surface area for nitrifying organisms to cling to, and kept in place by screens. In an MLE configuration, mixed liquor passes through the screens and is recycled to the anoxic zone for denitrification. Pilot plant work at Broomfield CO, Cheyenne WY, and Mamaroneck, NY showed that the SRT of the suspended growth media could be reduced by 50% (Johnson et al.,
9
WEFTEC®.06
Copyright 2006 Water Environment Foundation. All Rights Reserved©

2004). Sponge media provided more than 80% of total nitrogen removal through SND in one New England plant (Masterson et al. 2004). Bio-augmentation of nitrifiers could consist of adding nitrifiers grown in sidestream processes to the mainstream plant. Processes include the BABE® (Biological Augmentation Batch Enhanced) and the In-Nitri® (Inexpensive Nitrification) processes in which an ammonia-rich return stream is treated with a portion of the return activated sludge for nitrification, and the mixed liquor containing excess nitrifiers is passed on to the mainstream process reseeding it with nitrifiers (Salem et al., 2004). Adding a continuous mass of nitrifiers makes it possible to operate the mainstream process at a lower SRT for full nitrification and thus to provide more treatment in a smaller volume. This is illustrated in Figure 6 (Daigger & Parker, 2000). Further research of this option is required Figure 6 Advantages of bio-augmentation of nitrifiers (Daigger & Parker 2000) Optimize the final clarifiers to increase the sludge loading and thus extend the SRT that in the activated sludge system. There are numerous examples where the treatment plant capacity could be increased by up to 100% by applying the most recent findings in terms of flocculation of the sludge and energy dissipation to the final clarifiers. (Ekama et al., 1997; Parker, 2006)) Attached growth systems for nitrification and denitrification have been used to reduce the footprint drastically. Figure 7 shows a view of the Davyhulme plant in England, the high rate activated sludge plant that was upgraded to remove nitrogen by adding nitrifying and denitrifying biological aerated filters (BAF) using methanol as carbon source. Rogalla et al. (2001) studied the performance of a BAF system for nitrogen and phosphorus removal in parallel with an activated sludge system in Frederikshavn, Demark, and concluded that both were operationally reliable and easy to operate and maintain with similar costs. Denitrifying filters for both solids separation and nitrate reduction is required to remove the nutrients in the solids in order to get a low effluent TN and TP concentrations. A typical installation will have a mono media fill with effective size of 2 to 3 mm to a depth of 1.8 m over 450 mm of graded support material. Bump cycles are included between backwashing cycles to
0
2
4
6
8
10
12
14
16
0 2 4 6 8 10 12 14 16
AEROBIC SRT, DAYS
EFFL
UEN
T A
MM
ON
IA N
, mg/
Return streams mixed with influent
Sidestream treatment
Return streams aerated with RAS
10
WEFTEC®.06
Copyright 2006 Water Environment Foundation. All Rights Reserved©
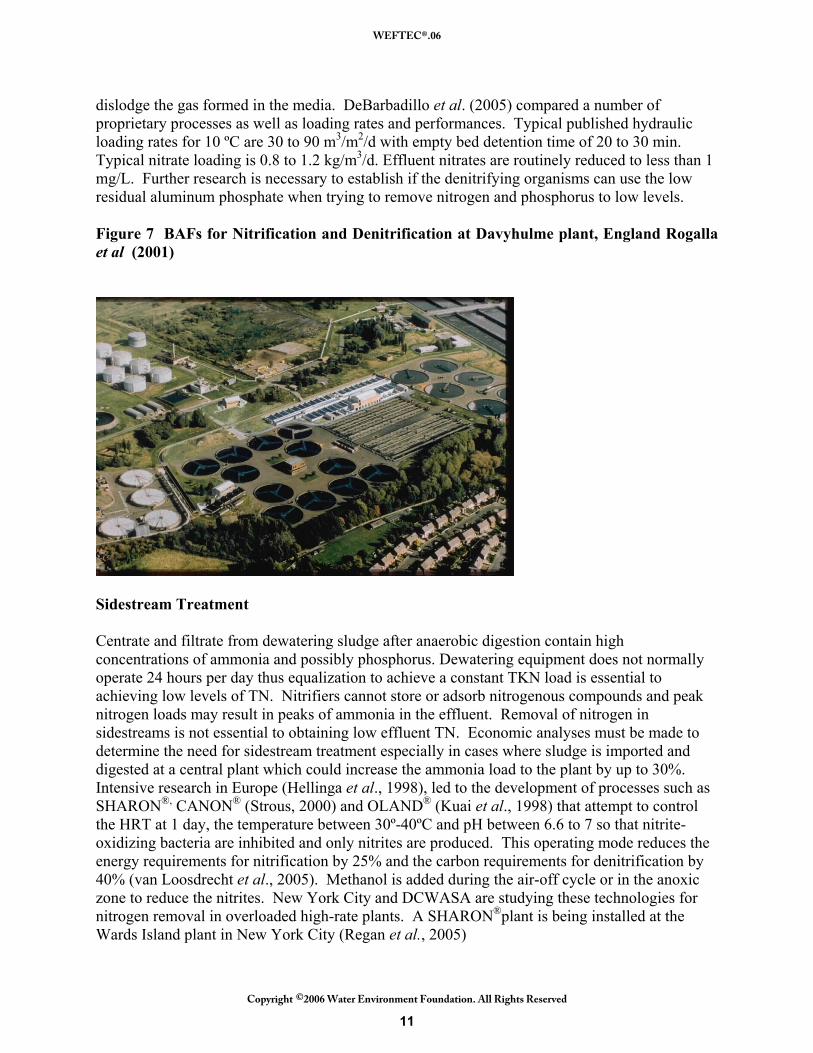
dislodge the gas formed in the media. DeBarbadillo et al. (2005) compared a number of proprietary processes as well as loading rates and performances. Typical published hydraulic loading rates for 10 ºC are 30 to 90 m3/m2/d with empty bed detention time of 20 to 30 min. Typical nitrate loading is 0.8 to 1.2 kg/m3/d. Effluent nitrates are routinely reduced to less than 1 mg/L. Further research is necessary to establish if the denitrifying organisms can use the low residual aluminum phosphate when trying to remove nitrogen and phosphorus to low levels. Figure 7 BAFs for Nitrification and Denitrification at Davyhulme plant, England Rogalla et al (2001)
Sidestream Treatment Centrate and filtrate from dewatering sludge after anaerobic digestion contain high concentrations of ammonia and possibly phosphorus. Dewatering equipment does not normally operate 24 hours per day thus equalization to achieve a constant TKN load is essential to achieving low levels of TN. Nitrifiers cannot store or adsorb nitrogenous compounds and peak nitrogen loads may result in peaks of ammonia in the effluent. Removal of nitrogen in sidestreams is not essential to obtaining low effluent TN. Economic analyses must be made to determine the need for sidestream treatment especially in cases where sludge is imported and digested at a central plant which could increase the ammonia load to the plant by up to 30%. Intensive research in Europe (Hellinga et al., 1998), led to the development of processes such as SHARON®, CANON® (Strous, 2000) and OLAND® (Kuai et al., 1998) that attempt to control the HRT at 1 day, the temperature between 30º-40ºC and pH between 6.6 to 7 so that nitrite-oxidizing bacteria are inhibited and only nitrites are produced. This operating mode reduces the energy requirements for nitrification by 25% and the carbon requirements for denitrification by 40% (van Loosdrecht et al., 2005). Methanol is added during the air-off cycle or in the anoxic zone to reduce the nitrites. New York City and DCWASA are studying these technologies for nitrogen removal in overloaded high-rate plants. A SHARON®plant is being installed at the Wards Island plant in New York City (Regan et al., 2005)
11
WEFTEC®.06
Copyright 2006 Water Environment Foundation. All Rights Reserved©
Of greater interest is the development of processes utilizing anaerobic ammonia oxidation such as ANAMMOX® (Van Loosdrecht et al., 2005). These are fully autotrophic processes with no need for organic carbon. The specialized bacteria convert ammonia directly into N2 gas under anaerobic conditions, with nitrite as electron acceptor. The growth rate of the organisms is extremely slow at 0.069/d (van de Graaf et al., 1996). Nonetheless, reactor capacities may range from 1 to 5 kgN/m3.d. The startup of the process may be as long as 18 months. Rosenwinkel et al. (2005) describes the operation of a full-scale “De-ammonification” plant treating 200 m3/d of centrate where autotrophic bacteria were grown on media in a moving bed reactor at the WWTP of Hattingen, Germany. Two years of operation showed that removal of 60% to 80% of the nitrogen was possible without adding a carbon source. Chemicals had to be added to remove scale from the media. The life cycle cost of this process was quoted as about $5/kg Nremoved. This must be put into perspective considering the cost of methanol and ethanol that is added to conventional plants at $1.06 and $1.31 per kg Nremoved respectively. Nitrogen Removal to Low Levels The removal of recalcitrant dissolved organic nitrogen (rDON) compounds and understanding the effect of them on the receiving water has a high priority due to EPA requirements to remove the effluent total nitrogen (TN) to ever lower values in some catchments. With present technology, it is possible to reduce the total inorganic nitrogen (TIN) concentration to less than 1 mg/L after coagulation and filtration, but the concentration of rDON in the effluent may vary from 0.5 to 1.5 mg/L for domestic wastewater and much higher for industrial wastewater. Randall (2006) reported of industries that had to shut down as a result of the high cost of removing these compounds. Recent studies (Sedlak et al., 2006) indicate that a portion of the rbCOD may be slowly degradable and the impact on the receiving water will depend on the length of time for the effluent to pass through the body of water. Research into the effects and removal of rDON is high on the priority list of WERF. Biological Phosphorus Removal to Low Concentrations A sufficient supply of VFA is the key to reliable removal of ortho-phosphorus to less than 0.1 mg/L. Relying on fermentation of the rbCOD in the anaerobic zone may be less effective and may require larger anaerobic zones and a larger mass of carbon. Barnard et al. (2005) concluded that when using a mixture of acetic and propionic acid, which incidentally is produced by on-site fermentation, the COD/TP ratio in the plant influent should exceed 8. However, when mostly rbCOD is available, it must be fermented in the anaerobic zone and the rbCOD/P ratio must be increased to at least 18 to 20. When fermentation of rbCOD is required in the anaerobic zone, the rate of hydrolysis is rate limiting and control of nitrates and dissolved oxygen is essential. It is not clear why the unit VFA production from primary sludge varies from one plant to another. It is possible that this could result from the use of garbage grinders in the sewer network. The amount of VFA that could be produced from primary sludge may depend on the degree to which the readily biodegradable VSS was fermented in the collection system. It can be expected that fermentation in sewer systems at low temperatures is minimal and that “readily biodegradable” particulate matter is available for fermentation on site. It is interesting to note that most plants
12
WEFTEC®.06
Copyright 2006 Water Environment Foundation. All Rights Reserved©

reporting high VFA production from on-site fermentation are in the colder regions. (Oldham et al., 1994; Emrick et al., 2002; Bauer et al., 2002) An exciting new development is the fermentation of a portion of the mixed liquor to supply VFA for phosphorus removal. The very efficient phosphorus removal observed by Barnard (1974) was attributed to mixed liquor from the second anoxic zones in Figure 3 passing back and forth through openings in the partition to a “dead zone” where fermentation produced VFA which resulted in release of phosphorus to 30 mg/L in the anoxic zone. Phosphorus uptake in the following aeration section was only observed when this release happened. Barnard et al. (2005) describe a number of plants where similar sidestream fermentation led to excellent removal of phosphorus. Tremblay et al. (2004) experimented at full-scale and found that a solids retention time of 2 days in the fermenter was optimal. How Low Can We Go With Biological Phosphorus Removal? The information in Table 1 was gathered from plants that use some form of carbon augmentation to the biological phosphorus removal process. With the exception of the McDowell Creek plant which adds a sugar waste, and the Pinery Water plant which uses fermentation of mixed liquor, all use fermentation of primary sludge. The plants that practice chemical polishing in separate post treatment are listed in the third column. Chemical consumption for meeting the effluent standards was drastically reduced for the Durham and Clarke County plants when incorporating biological removal as the first step, followed by chemical post treatment. Table 1 Biological phosphorus removal achieved in some plants
Plant Clarifier OP mg/L
Filtered Effluent TP mg/L
FE – Chem. Treatment TP mg/L
Bonnybrook, Calgary AB Canada1 0.28 Pinticton, BC, Canada1 0.3 Kalispell MT 2 0.12 McDowell Creek, Charlotte NC 3 0.1 Pinery Water, CO 4 0.1 - 0.2 0.03
Kelowna BC Canada1 0.17 Westbank BC, Canada1 0.1 0.2 Durham OR 5 0.1 – 0.2 0.07 Clarke County, NV6 0.05 0.09 Padre Dam CA7 0.101
1Rabinowitz & Barnard (1996) 2Emerick & Abraham (2002) 3Goins et al. (2003) 4Clarke (2002) 5Stephens (2004) 6Drury et al. (2006) 7Cranfield (2005)
13
WEFTEC®.06
Copyright 2006 Water Environment Foundation. All Rights Reserved©

Chemical phosphorus removal by itself may still be the preferred option for a large number of plants. However, Severn Trent Water has changed recently from using chemicals at all plants to opportunistic biological phosphorus removal at some plants in order to reduce overall consumption of ferrous sulfate, the supply of which is dwindling (Stokes 2006). Many of these are short SRT plants which can be easily converted to a Phoredox (AO) phosphorus removal process, shown in Figure 5a, by simple partitioning of the aeration basin. While the average effluent soluble phosphorus concentration from a BPR plant may be 0.1 mg/L or less, there are still some variations caused by unforeseen influences and lack of constant monitoring and adjustment. Some operators prefer to use a continuous dose of alum of 5 to 8 mg/L to make sure the effluent ortho-phosphorus concentration is less than 0.1 mg/L, primarily because of lack of good instrumentation that would enable them to intercede when something out of the ordinary happens. With better instrumentation and control in the future much of this “safety” dose may be eliminated. To achieve values substantially lower than 0.1 mg/L, post chemical treatment by standard water treatment coagulation, flocculation and filtration is required. The limits to which phosphorus can be reduced by chemical polishing range from 0.04 to 0.06 mg/L and depend on the interactions of stoichiometric precipitation, co-precipitation with metal hydroxide, and adsorption at low ortho-phosphorus concentrations (Hermanowitz, 2006). Ortho-phosphorus residuals below 0.1 mg/L require a very high Me/P ratio, and pH and solids control. Adsorption depends on age of the solids mixture, background matrix, and dosing mode. Figure 8 shows the increased Me/P ratio when aiming for low total effluent phosphorus values. Möller (2006) described an Iron Oxide Coated Sand (IOCS) reactive filter that is able to remove phosphorus to about10 µg/L. After secondary treatment, the effluent is passed through a conditioning reactor to which FeCl3 is added, and then through one or more filters in series. The process is being applied at full-scale at the Haydon, ID WWTP. Further research is required to develop this promising technology. It is claimed that this technology will eliminate the need for biological nitrogen removal. Figure 8 Molar ratios of Alum to Phosphorus requirements for reduction of phosphorus (Hermanowitz, 2006)
02468
101214161820
0.01 0.1 1 10
ortho P res (mg/L)
Al/P
(mol
/mol
)
Full Scale 6.6 - 6.75
Lab data pH 6
Lab data pH 7.2
02468
101214161820
0.01 0.1 1 10
ortho P res (mg/L)
Al/P
(m
ol/m
ol)
Full Scale 6.75 - 7
Lab data pH 7.2
14
WEFTEC®.06
Copyright 2006 Water Environment Foundation. All Rights Reserved©

MEMBRANE BIOREACTORS (MBR) MBR technology has already passed through the first or, even second, stage of development and the only reason that it is not universally applied is the power cost associated with it. Barnard (1998) discussed the future of the activated sludge process and proposed a flow sheet in which both nitrogen and phosphorus removal can be obtained. Nitrogen removal requires biological nitrification and denitrification that can be accommodated in a MBR which functions better at a solids retention time (SRT) in excess of 10 days which allows nitrification to very low ammonia concentrations. Denitrification then becomes necessary to save power and eliminate the need for alkalinity. Figure 9 Flow sheet for MBR plant at Cauly Creek (Daily, 2006) Since most existing MBRs operate in the MLE mode, effluent ammonia concentrations are quite low, but effluent TN values are around 8 mg/L. Daily (2006) stated that the Cauly Creek plant in Georgia, which was designed with an anaerobic zone in addition to the MLE configuration (Figure 9), was able to reduce phosphorus concentrations to less than 0.5 mg/L without any chemical addition, and that with the addition of either alum or ferric chloride ( FeCl3) to the membrane compartment, average effluent TP of 0.1 mg/L was achieved. The COD/TKN ratio was 11.2 and 81% nitrogen removal was achieved. Gnirss et al. (2006) operated a pilot plant in Berlin, Germany in two different modes as shown on Figure 10 and reduced the TN from 60 mg/L to 10.7 mg/L in the conventional configuration for denitrification, and to 6.7 mg/L during operation in the post-denitrification configuration. The COD/TKN ratio was 10.6. The nitrate concentration in the effluent was 4.5 mg/L, the rDON concentration was 2.2 mg/L, and the SRT (aerobic) was 8 days. When the plant was operated at a higher aerobic SRT, the concentration of nitrates in the effluent was closer to 2 mg/L. Since nothing much can be done in the MBR to remove the rDON, only the nitrates could be further reduced. The contradictory high removal rate of nitrates in the post denitrification zone may be attributable to the wastewater characteristics that allowed organic carbon to be absorbed and carried through to, and be available in the post-anoxic zones. Van Huyssteen and Barnard (1990) noticed an accelerated denitrification rate in a plant where VFA was added to the anaerobic zone, and proposed that there was some glycogen storage by bacteria that could supply carbon for denitrification, but it is unlikely to be carried through the aeration zone to assist in denitrification in the post-anoxic zone. The option of using the post-denitrification configuration
AnaerobicBasin
Anoxic4 Zones
Aerobic4 Zones
15
WEFTEC®.06
Copyright 2006 Water Environment Foundation. All Rights Reserved©

in an MBR system should be further investigated in light of the contradictory evidence about endogenous denitrification in a second anoxic zone. Figure 10 MBR Configurations for nitrogen removal (Gnriss, 2006) With membrane reactors, there is no need for filtration and the option of using a denitrification filter for removing residual nitrates has been eliminated. To achieve low effluent nitrate levels, configurations should be considered to ensure denitrification to very low levels. Barnard (2005) proposed the flow diagram shown on Figure 11 that would include an attached growth section ahead of the membrane basins where methanol-degrading organisms can grow on the media and not be washed out, ensuring less than 1 mg/L of nitrates in the effluent. McQuarrie (2006) found that when adding media to a post-anoxic zone, the rate of denitrification with methanol is doubled. It should be experimentally determined if a down flow fixed media or floating media would be the best choice for post anoxic denitrification. Figure 11 MBR Configurations with attached growth second anoxic zone
WASTEWATER CHARACTERISTICS AND MODELS Perhaps the most significant advance in BNR came about through wastewater characterization and the use thereof in mathematical models that best describe the interaction of the complex biological and chemical processes taking place in the various zones of BNR plants. There are
Anaerobic1 Zone
Anoxic4 Zones
Aerobic4 Zones
MembraneReactor
Anaerobic1 Zone
Aerobic3 Zones
MembraneReactor
Anoxic4 Zones
Wastewater
Wastewater
PermeatePermeate
Permeate
Excess Sludge
Excess Sludge
~100% ~500%
~400%
~500%
~100%
Configuration 1: Pre-Denitrification
Configuration 2: Post-Denitrification
16
WEFTEC®.06
Copyright 2006 Water Environment Foundation. All Rights Reserved©

numerous simulation programs of which the main ones used in the USA are BioWin™ and GPS-X™. Copp (2002) used a benchmark technique to compare the outputs of the simulator models. Both simulators use as the main engine, models developed by the IWA with some refinements distinguish the models from another. It can safely be said that most of the accumulated research in BNR that can be quantified today are incorporated into the models and in the computer simulations used and new findings are continuously added to perfect the simulations. Default values used reflect the average values for domestic wastewater from hundreds of plants. The publication of the 99-WWF-3 report funded by the Water Environment Research Foundation (WERF) (2003) fulfilled a great need for standardization in the determination of the wastewater characteristics required for operation of the simulation models. The studies concerning the decay rates of nitrifying organisms and the various methods, such as the high F/M test for nitrifier growth rates are some of the outstanding products of this research (Jones et al., 2003). Jones et al. (2005) developed pH modeling which contributed greatly to the usefulness of the models for predicting nitrification. Simultaneous nitrification and denitrification taking place in channel systems is difficult to simulate since there are so many different physical factors involved. Strom et al. (2004) endeavored to develop CFD models in conjunction with biological models to describe SND in Orbal™ plants but concluded that the models were too complex for producing meaningful results. It is still necessary to rely on a SND-factor, which must be determined from a full-scale calibration of each plant. Similarly secondary release of phosphorus is not monitored and must be considered in design independently from the modeling. WHAT DOES THE FUTURE HOLD FOR BNR Nitrogen removal Regulatory total maximum daily load allocations will require no load increase and thus future reductions in both the nitrogen and phosphorus concentrations from wastewater treatment plants. However, one should not loose track of the non-point sources, especially of nitrogen. The WERF Report 03-WSM-6CO (2005) showed that only 50% of nitrogen fertilizers applied ends up in the harvested product. At what point is it futile to reduce point source nitrogen at great cost and to ignore the runoff from agricultural lands and from lawns and golf courses. When considering the sources of nitrogen that is causing the zone of hypoxia in the Gulf of Mexico, only 10% is point sources while 60% is from agricultural runoff from the states of Iowa and Illinois. The greatest obstacle to reducing nitrogen below the present limits of technology of between 2 and 3 mg/L is the reduction of rDON. Future regulations should be more specific about the type of nitrogen to be removed. Preferably there should be different standards for TIN and rDON. Limits should be based on mass loadings that relate to the population equivalents of the plant. For communities that try to save water, the concentration of the effluent rDON will increase. In the example of nutrient reduction by MBR in Berlin (Gnirss et al., 2006), the rDON was 2.2 mg/L. The influent TN was 60 mg/L.
17
WEFTEC®.06
Copyright 2006 Water Environment Foundation. All Rights Reserved©

The impact of the rDON on the receiving water is also related to the size and characteristics of the bay or estuary, and when the cost of removal is very high, the cost benefit of removing inert nitrogen must be considered. Research into the nature and impact of rDON on a specific body of water should be used to frame regulations. Urine Separation Urine separating toilets are being developed and promoted in Sweden as a means of controlling the nitrogen in the effluent. About 90% of the TN and 75% of the TP from a household is in urine. Dual sewer systems are being promoted for new villages where the urine could be collected and made available to farmers. This should be seriously considered in developing countries where the populations may want to develop their own markets for growing crops, but the prospect of this in the developing world looks bleak. In terms of nitrogen it could never compete with the price of standard manufacturing practices, but for phosphorus the picture may be different as will be explained later. Phosphorus removal With existing technologies, some plants operate to remove phosphorus to levels of around 0.05 mg/L. For a 400,000 m3/d (106 mgd) plant this amounts to about 20 kg phosphorus per day (44 ppd) in the effluent. The impact of this daily mass of phosphorus on receiving water should be compared with that from diffused sources and the merit of reducing the point sources further should be studied. The Clarke County treatment plant has demonstrated that effluent phosphorus concentration of 0.05 mg/L can be achieved with a combination of biological removal and post chemical treatment. (Drury et al., 2006) These values were also achieved in MBRs with a combination of biological and chemical treatment. (Gnirss et al., 2006) Future debates will focus on the best ways of reducing the concentration from 0.05 mg/L to 0.01 and 0.02 mg/L. Because of the limitations resulting from the solubility constant of aluminum phosphate, even membrane systems may not reduce the soluble phosphorus unless reverse osmosis is applied. Möller (2006) showed that phosphorus concentration could be reduced to 0.01 mg/L through adsorption on iron coated sand filter media; however, it appears that these media also adsorb metals such as lead which may make the disposal of the removed phosphorus problematic. Table 2 summarizes the phosphorus limits that can be achieved by various process combinations. Table 2 Possible limits for phosphorus removal technologies Treatment sequence Limits
µg/L Reference
Biological treatment with chemical addition + filters 90-100 Bauer (2002) Biological or chemical treatment with post chemical + filters 50 Drury (2006) Membrane reactors with biological and/or chemical treatment 40-50 Gnirss (2006) Biological treatment plus ICOS filters 10-20 Möller (2006) Reverse osmosis. <10
18
WEFTEC®.06
Copyright 2006 Water Environment Foundation. All Rights Reserved©

Phosphorus Recovery There can be no life without phosphorus and the rate of exploitation of ore points to crises in the next century when supplies may run out. The richest ores have been used and lower grade ores are being mined. In the meantime a 400,000 m3/d (106 mgd) plant that receives a total influent phosphorus concentration of 5 mg/L has a potential of about 2 metric tons per day of phosphorus as P. In terms of a known fertilizer such as super phosphate, this will amount to 16 metric tons per day or 5,800 metric tons per year. With biological phosphorus removal, most of this phosphorus could be concentrated in the solids, then released and precipitated with lime or as struvite, which can be incorporated into domestic fertilizers. Technologies are being developed especially in Japan and in Europe to harvest the phosphorus and make it available to fertilizer manufacturers. It is interesting to note that in Germany the Phostrip process is making a recovery due to the ability to recover the phosphorus. Lime treatment and land application of sludge will also recycle phosphorus. Composting is another way of retaining the phosphorus and is used extensively in western Canada for recovery of the biological sludge and with it the nutrients that it contains. RESEARCH NEEDS At a workshop (2006) in Washington DC, research priorities have been established for reaching limits of technology (LOT) on the removal of effluent nitrogen and phosphorus. The conclusion was that research was needed over a large range of issues related to better performance of BNR plants. The needs were categorized under the main headings of 1. Policy and Information Based Research 2. Experimental Research targeting LOT permitting policy 3. Experimental Research targeting LOT Design and Operation Policy and Information Based Research involved information and technology transfer to better understand the implications of LOT operation. There is a need for better exchange of expertise developed at such plants, to better understand the skills required, the costs and benefits of designing biological systems and the benefits of MBR applications. The list of chemicals inhibitory to nitrifier growth rates need to be updated. All these must be compiled in a new Manual similar to the EPA Nitrogen Control Manual, (Parker, 1975). There is a need to evaluate permitting policies, statistically based reporting, cold weather and high flow exceptions and blending policies taking into account the limits that can be reached by present technology, such as denitrifying sand filters, membranes etc. The long-terms sustainability of such technologies must be investigated. Permitting Based Research should consider different approaches to the removal of rDON in order to focus on the portion that will have an effect on the environment. Should they be permitting separately from the TIN and on a mass basis that will not penalize water conservation? Should a distinction be made as to the origin of the nature of the rDON? Standard methods should be developed for low level phosphorus analysis. Mathematical models
19
WEFTEC®.06
Copyright 2006 Water Environment Foundation. All Rights Reserved©
represent current collective knowledge and should be fine-tuned for LOT application. Models will be the primary tools for demonstrating LOT to regulators. Experimental Research targeting LOT Design and Operation. A high priority was given to investigating on-line instrumentation for better control of biological and chemical processes, carbon sources for denitrification and biological phosphorus removal, methods for achieving low effluent P levels and nitrification control and inhibition. Other issues were phosphorus limitations on denitrification filters when trying to achieve low TN and TP values at the same plant, a better understanding and modeling of simultaneous nitrification and denitrification, continued research for better understanding the interactions of PAOs and GAOs, side stream treatment for ammonia and phosphorus removal and improving final clarifier operation. SUMMARY Great strides have been made over the last 30 to 35 years to improve processes for the removal of nitrogen and phosphorus. For standard domestic wastewater effluent phosphorus of less than 0.1 mg/L and nitrogen of less than 3 mg/L can easily be achieved with present technologies. The new challenge to push the limits of treatment to achieve even lower TN and TP has gained momentum and is the focus of many WERF Research projects. Plant owners now realize that a more sophisticated training program for plant operators and managers are essential and that high level instrumentation for monitoring and control would become a high priority as a result of the necessary decrease in safety factors in plant design. Judicious use of chemicals can help greatly in ensuring reliability. Institutions like WEFTEC and IWA are ready for the challenge to educate and inform and WERF is gearing towards making more funds available for cutting edge research to push the limits of technology. The private sector is developing new processes to meet the challenge. There are many tools at our disposal and full use should be made of these. From the regulators side there should be a re-evaluation of methods regulating certain substances, especially recalcitrant compounds that are costly to remove. Overall, there should be a holistic approach and methods of limiting non-point sources should be further researched and evaluated. At some point the cost of taking out finite concentrations of nitrogen and phosphorus must exceed the cost of at least some measures to limit or even treat non-point sources. REFERENCES Ardern, E. and Lockett W.T. (1914). Experiments on the Oxidation of Sewage without the Aid
of Filters, Journal of the Society of Chemical Industry, May 30, XXXIII(10). Balakrishnan S., and Eckenfelder, W.W. (1970) Nitrogen removal by modified activated sludge
processes. J.San Enging Div., ASCE, 96, 501-512. Barnard, J.L. (1973), Biological denitrification. Wat. Pollut. Control, 72(6), 705-720. Barnard, J.L. (1974). Cut P and N without chemicals. Water & Wastes Engineering, Part 1,
11(7), 33-36; Part 2, 11(8), 41-43. Barnard, J.L. (1976). A review of biological phosphorous removal in activated sludge process.
Water SA, 2(3), 136-144. Barnard, J.L. (1984). Activated primary tanks for phosphate removal. Water SA, 10(3), 121.
20
WEFTEC®.06
Copyright 2006 Water Environment Foundation. All Rights Reserved©

Barnard, J.L. (1998) The Development of Nutrient Removal Processes. Journal of the Chartered Institution of Water and Environmental Management Volume 12, No 5 October. Delivered at two-day International Conference “Activated Sludge into the 21st Century” Manchester UK.
Barnard, J.L. (2005) Where is BNR going now? IWA Leading-Edge Conference on Water and Wastewater Treatment Technologies, 6-8 June 2005, Sapporo, Japan
Barnard, J.L., Shaw, A. and Lindeke, D. (2005) Using alternative parameters to predict success for phosphorus removal in WWTP’s. Proceedings WEFTEC Washington DC
Baur., R (2002) Achieving Low Effluent Phosphorus Concentration in Activated Sludge Effluent - Chemical vs. Biological Methods S114 Carbon Augmentation for BNR Workshop at WEFTEC Chicago IL
Brodisch, K.E.U. and Joyner, S.J. (1983), The role of microorganisms other than Acinetobacter in biological phosphate removal in activated sludge process. Water Sci. Technol., 15, 87-103.
Chandran, K., Pape, R., Stinson, B., Anderson, J., Carrio, L.A., Sexton, J., Sapienza, V., and Gopalakrishnan, K., (2004), Enhanced Step-Feed Biological Nitrogen Removal via Simultaneous Nitrification and Denitrification at NYC WPCPs. Metcalf & Eddy of New York, Inc., New York City Department of Environmental Protection. WEFTEC Proceedings New Orleans LA
Clarke, K. (2002) Pinery Water CO. Private Communication Comeau, Y. (1989), The role of carbon storage in biological phosphate removal from
wastewater. Ph.D. Thesis, University of British Columbia, Vancouver, BC, Canada. Cooper, P.F., Drew, E.A., Bailey, D.A. and Thomas, E.V. (1977), Recent advances in sewage
effluent denitrification, Part 1. Wat. Pollut. Control, 76(3), 287-296. Copp. J.B. Editor (2002), The COST simulation benchmark – Description and simulator manual.
Directorate-General for Research Information and Communication Unit, European Commission, Brussels hhtp://europa.eu.int/comm./research/rtdinfo.html
Cranfield, G. (2006) Plant records from Padre Dam CA WWTP Daigger, G. T., and Parker, D. S. (2000). Enhancing Nitrification In North American Activated
Sludge Plants, Water Science and Technology, Vol. 41, No. 9, pp. 97-105. Daily. J. (2006) Case History - Cauley Creek Expansion WERF Workshop BNR: How low can
we go and what prevents us form going lower? Held at DCWASA Headquarters, Washington DC.
DeBarbadillo, C., Bates, V., Cauley, C., Holcomb, S., Ebron, B., Rexrode, S., and Barnard, J. (2003) Pushing the Limits of Technology: Performance and Operations Considerations for Plants Operating High-Level Nitrogen Removal. Proceedings WEFTEC Proceedings, Los Angeles
DeBarbadillo, C., Lambert, M., Parker, W., Wells, W. and Willit R. (2005) Denitrification Filters: A Comparison of Manufacturers and Review of Performance Patent and Bidding Issues. Proceedings of WEFTEC Washington DC
Dold, P.L. (1990), A general activated sludge model incorporating biological excess phosphorus removal. Proceedings. C.S.C.E. Annual Conf., Hamilton, Ontario, May, 1990.
Downing, A.L., Painter, H.A. and Knowles, G. (1964a), Nitrification in the activated sludge process. Jour. Proc. Inst. Sew. Purif.,63, 130-158.
Downing, A.L., Tomlinson, T.G. and Truesdale, G.A. (1964b), Effect of inhibitors on nitrification in the activated-sludge process. J. Proc. Inst. Sewage Purif., 63, 537-550.
21
WEFTEC®.06
Copyright 2006 Water Environment Foundation. All Rights Reserved©

Drury, D.D., Shepherd, W. and Narayanan, B. (2006) A Holistic Approach, WE&T Vol 18, No3, March.
Ekama, G.A., Barnard, J.L. Guenthert, F.W. Krebs, P. McCorquodale, J.A. Parker D.S. and Wahlberg, E.J. (1997) Secondary Settling Tanks: Theory, Modeling, Design and Operation. Scientific and Technical Report No.6 International Association on Water Quality
Emrick, J. and Abrahams K. (2002) Long term BNR operations - cold in Montana. WEFTEC 75th Annual Technical Exhibition and Conference September 28 -October 2, 2002, Chicago Session 16.
Fuhs, G.W. and Chen, M. (1975), Microbiological basis of phosphate removal in the activated sludge process for the treatment of wastewater. Microbiol. Ecol.,2(2), 119-138.
Gerber, A. and Mostert, E.H., Winter, C.T. and Villiers, R.H.d. (1986), The effect of acetae and other short-chain compounds on the kinetics of biological nutrient removal processes. Water SA, 12, 7-12.
Goins, P., Parker D., deBarbadillo C. and Wallis-Lage C. (2003) Water Environment & Technology, 15(6) July.
Gnirss, R. Lesjean, B. and Buisson H. (2006) Enhanced Biological Phosphorus Removal with Post-Denitrification in Membrane Bioreactor WERF Workshop BNR: How low can we go and what prevents us form going lower? Held at DCWASA Headquarters, Washington DC.
Gu, A.Z., Saunders, A., Neethling, J.B., Stensel, H.D, and Blackall, L.L., (2005), Investigation of PAOs and GAOs and Their Effects on EBPR Performance at Full-Scale Wastewater Treatment Plants in U.S., Proceedings of WEFTEC 2005, Washington, D.C.
Hellinga C., Schellen A.A.J.C., Mulder J.W., van Loosdrecht M.C.M. and Heijen J.J. (1998). The SHARON process: An innovative method for nitrogen removal from ammonium-rich wastewater. Wat. Sci. Tech. 37(9), pp135-142.
Hermanowicz, S (2006) Chemical Fundamentals of Phosphorus Precipitation WERF Workshop BNR:How low can we go and what prevents us form going lower? Held at DCWASA Headquarters, Washington DC.
Johnson , W.K. (1966), Removal of nitrogen by biological treatment. In Advances in Water Quality Improvement, Water Resources Symposium No. 1, University of Texas Press, Austin, 178-189.
Johnson, T. L., McQuarrie, J. P., and Shaw, A.R., (2004), Integrated Fixed-film Activated Sludge (IFAS): The New Choice for Nitrogen Removal Upgrades in the United States. Proceedings of WEFTEC 2004.
Jones, R.M., Bye, C.M., and Dold, P.L. (2003) Nitrification Parameter Measurement for Plant Design – Experience with New Methods. EnviroSim Associates Ltd. Proceedings of WEFTEC
Jones, R.M., Dold, P.L. (2005), Simulation Applications Made Possible by pH Modeling. EnviroSim Associates Ltd., Flamborough, Ontario, Canada. Flamborough, Ontario, Canada. Proceedings of WEFTEC 2005
Kuai, L.P. and Verstraete, W. (1998). Ammonium removal by the oxygen-limited autotrophic nitrification-denitrification system. Appl. Environ. Microbiol. 64, 4500-4506.
Levin, G.V. (1970), U.S. Patent No. 3,654,147. U.S. Patent Office, Washington, D.C. Ludzack, F.J. and Ettinger, M.B. (1962), Controlled operation to minimize activated sludge
effluent nitrogen. Journal WPCF, 34(9), 920-931.
22
WEFTEC®.06
Copyright 2006 Water Environment Foundation. All Rights Reserved©
Maclean, G., Wright, P., Thomas, M., and Steel, J. (2002) Reliable achievement of low effluent nutrient concentration in BNR processes. IWA Enviro 2002 conference and Exhibition, Melbourne, Australia
Mamais, D., Jenkins, D. and Pitt, P. (1993), A rapid physical-chemical method for the determination of readily biodegradable soluble COD in municipal wastewater. Water Research, 27, 195.
Masterson, T., Federico, J., Hedman, G, and Duerr, S., Upgrading for Total Nitrogen Removal with a Porous Media IFAS System. BETA Group, Inc., Lincoln, Rhode Island.
McGarth, M (2006) Maintaining Low Nitrogen Discharge with Wet weather Flows WERF Workshop BNR:How low can we go and what prevents us form going lower? Held at DCWASA Headquarters, Washington DC.
McCarty, P.L., Beck, L. and Amant, P.S. (1969), Biological denitrification of wastewaters by addition of organic materials. Proceedings of the 24th Purdue Ind. Waste Conf., Purdue University, Lafayette, Indiana.
McQuarrie, J. (2006) Performance Improvement through IFAS. WERF Workshop 05-CTS-1W, March 9.
Milbury, W.F., McCaluley, D. and Hawthorne, C.H. (1971), Operation of conventional activated sludge for maximum phosphorus removal. Journal WPCF, 43(9), 1890-1901.
Möller G. (2006) Absolute (1000-fold) Phosphorus Removal. WERF Workshop BNR:How low can we go and what prevents us from going lower? Held at DCWASA Headquarters, Washington DC.
Nicholls, H.A. (1975), Full scale experimentation on the new Johannesburg extended aeration plants. Water SA, 1(3), 121.
Oldham, W.K. and Stevens, G.M. (1984), Initial operating experiences of nutrient removal process (modified Bardenpho) at Kelowna, British Columbia. Canadian Journal of Civil Engineering, 11, 474.
Oldham, W.K. and Abraham, K. (1994), Overview of full-scale fermenter performance. Proc. of the Conference Seminar on Use of Fermentation to Enhance Biological Nutrient Removal, 67th Annual Conference & Exhibition of the Water Environment Federation, Chicago, Il, October 15-19, 1994.
Osborn, D.W., Lotter, L.H., Pitman, L.H. and Nicholls, H.A. (1986), Enhancement of biological phosphorus removal by altering process feed composition. Water Research Commission, WRC Report no., Pretoria, South Africa.
Parker D.S. (1975) Process Design Manual for Nitrogen Control. USEPA Technology Transfer.
Parker, D.S. (2006) Clarifier Design and Operation to Handle Wet Weather Flows. WERF Workshop 05-CTS-1W, March 9.
Randall, C.W. and Chapin, R.W. (1997) Acetic Acid inhibition of biological phosphorus removal. Wat. Env. Res. Volume 60, Number 5, pp 955-960
Randall, C. (2006) Refractory Dissolved Organic Nitrogen (rDON) WERF Workshop 05-CTS-1W, March 9.
Rabinowitz B., and Barnard, J.L. (1996) Biological nutrient removal plants in Western Canada, IAWQ Yearbook 1995-96.
Rabinowitz, B., Daigger, G., Jenkins, D., and Neethling, J.B., (2004), The Effect of High Temperatures of BNR Process Performance. Proceedings of WEFTEC New Orleans LA
23
WEFTEC®.06
Copyright 2006 Water Environment Foundation. All Rights Reserved©

Regan, M., Pape, R., Bowden,G., Chandran, K., Bodniewicz, B., Anderson, J., Carrio, L., Sexton, J. and Sapienz, V. (2005) Optimization of Strategies for separate centrate treatment via partial nitrification and denitrification in New York City water pollution control plants. Proceedings of WEFTEC Washington DC.
Rogalla, F., Thøgersen, T., and Hansen R. (2001) Comparing Biological Aerated Filter (BAF) and Activated Sludge (As) Operation on Full Scale. Proceedings of WEFTEC Atlanta GA.
Rosenwinkel, K., Cornelius A. and Thöle, D. (2005) Full-scale application of the de-ammonification process for the treatment of sludge water. IWA Specialized Conference – Nutrient Management in Wastewater Treatment Processes and Recycle Streams, Krakow Poland
Rusten, B., Wien, A., Wessman, F.G., Siljudalen, J.G., and Tranum, I., (2002), Treatment of Wastewater from the New Oslo Airport and Surrounding Communities Using Moving Bed Biofilm Reactors and Chemical Precipitation. Second CIWEM and Aqua Enviro Biennial Conference on Management of Wastewater, 2.
Salem, S., Berends, D.H.J.G., van der Roest, H.F., van der Kuij, R.J., and van Loosdrecht, M.C.M., (2004), Full-scale application of the BABE technology®. Wat. Sci. Tech. 50(7), pp. 87-96.
Sawyer, C.N and Bradney, L. (1945), Rising of activated sludge in final settling tanks. Sewage Works J., 17(Nov), 1191.
Scruggs, C., Barnard, J.L. and Saayman. G. (2003) Causes & Prevention of EBPR Failure – GAO’s or secondary release? WEFTEC 2003 Proceedings
Schwin, D.E. and Tozer, G.K., (1974) Largest Advanced Waste Treatment Plant in the World. Environmental Science and Technology, 8, No 10 (1974)
Sedlak, D.L. and E. Pehlivanoglu-Mantas (2006) Characterization of rDON: Moving Beyond Bulk Parameters. WERF Workshop BNR: How low can we go and what prevents us form going lower? Held at DCWASA Headquarters, Washington DC.
Stephens H. (2004) Comprehensive analysis of full-scale enhanced biological phosphorus removal facilities. WEFTEC 77th Annual Technical Exhibition and Conference October 2-6 2004 New Orleans Session 83.
Stephenson, T., Cornel, P., and Rogalla, F., (2004), Biological Aerated Filters (BAF) in Europe: 21 Years of Full Scale Experience. Proceedings of WEFTEC 2004.
Stokes L. (2006) Severn Trent Water UK. Private Communication Strom, P.F., Littleton, H.X. and Daigger, Glen. (2004) Characterization Mechanisms of
Simultatneous Biological Nutrient Removal during Wastewater Treatment. WERF Report 00-CTS-17UR
Strous M. (2000). Microbiology of anaerobic ammonium oxidation. PhD thesis, Department of Biotechnology, the Technical university of Delft, The Netherlands.
Tremblay S., Hilger H., Barnard J., deBarbadillo C., Goins P. (2005) Phosphorus Accumulating Organisms Utilization of Volatile Fatty Acids Produced by Fermentation of Anaerobic Mixed Liquor. Proceedings WEFTEC 2005
Vacker, P., Connell, C.H. and Wells, W.N. (1967), Phosphate removal through municipal wastewater treatment at San Antonia, Texas. Journal WPCF, 39(5), 750-771.
Van De Graaf A.A., Mulder A., de Bruijn P., Jetten M.S.M., Robertson L.A. and Kuenen J.G. (1996). Autotrophic growth of anaerobic ammonium oxidizing micro-organisms in a fluidised bed reactor. Microbiology 142, 2187-2196.
24
WEFTEC®.06
Copyright 2006 Water Environment Foundation. All Rights Reserved©

Van Huyssteen, J.A., Barnard, J.L. and Hendriksz, J. (1990), The Olifantsfontein nutrient removal plant. Water Sci. Technol., 22(7/8), 1.
Van Loosdrecht, M.C.M. and Salem, S. (2005) Biological Treatment of Sludge Digester Liquids. IWA Specialized Conference – Nutrient Management in Wastewater Treatment Processes and Recycle Streams, Krakow Poland
Wentzel, M.C., Loewenthal, R.E., Ekama, G.A. and Marais, G.v.R. (1988), Enhanced polyphosphate organism cultures in activated sludge systems, Part 1: Enhanced culture development. Water SA, 14, 81-92.
Wentzel, M.C., Lötter, L.H., Ekama, G.A., Loewenthal, R.E. and Marais, G.v.R. (1991), Evaluation of biochemical models for biological excess phosphorus removal. Water Sci. Technol., 23, 567.
Wuhrmann, K. (1962), Nitrogen removal in sewage treatment process. Plenary Session of Wednesday, August, 22, 15th International Congress of Limnology, Madison, Wisc.
WERF Report 99-WWF-3 Methods for Wastewater Characterization in Activated sludge Modeling (2003). Co-published by IWA Publishing and the Water Environment Federation
WERF Report 03-WSM-6CO (2006) How low can we go and what prevents us form going lower? Workshop held at Washington DC.
25
WEFTEC®.06
Copyright 2006 Water Environment Foundation. All Rights Reserved©