Embed Size (px)
Citation preview
Bioresource Technology 93 (2004) 313–319
Biological nitrogen removal using a vertically moving biofilm system
Michael Rodgers, Xin-Min Zhan *
Department of Civil Engineering, National University of Ireland, Galway, Ireland
Received 15 July 2003; received in revised form 13 August 2003; accepted 10 September 2003
Abstract
In this study, a biological nitrogen removal process using a vertically moving biofilm system was used to treat synthetic
wastewater. The process consisted of two pre-denitrification units, one combined carbonaceous removal/nitrification unit and three
nitrification units. Each unit employed biofilm growth on a plastic module. In the anoxic units, the modules were vertically moved,
while always submerged, in the bulk fluid; in the aerobic units, they were moved vertically up into the air and down into the
wastewater. Three small-scale experiments, having different recirculation ratios and influent loadings, were conducted at a controlled
temperature of 11 �C. In this system, the carbonaceous removal efficiency was in the range of 94–96% and the total nitrogen removal
efficiency was 77–82%. In the anoxic units, the denitrification efficiency was 94–98% and the areal denitrification rates, based on the
surface area of the biofilm modules, were 2.9–3.8 g NO3-N/(m2 Æ d). The nitrification efficiency occurring in the aerobic tanks was up
to 95% and the maximum areal ammonium removal rates were 1.3–1.8 g NH4-N/(m2 Æ d).� 2003 Elsevier Ltd. All rights reserved.
Keywords: Biological nitrogen removal (BNR); Denitrification; Nitrification; Vertically moving biofilm system; Wastewater treatment
1. Introduction
High concentrations of nitrates in water supplies have
led to cases of infant methaemoglobinaemia. Nitrates
can also contribute to the development of eutrophica-
tion in receiving water bodies. The European Council
Urban Wastewater Directive (91/271/EEC) gives an
impetus to reduce nitrates in wastewaters and the
European Council Nitrate Directive (91/676/EEC) aims
to reduce nitrate inputs from agricultural fertilizers. InIreland, under the Environmental Protection Act (1992),
the effluent from urban wastewater treatment plants
discharging to sensitive areas––for populations in the
range of 10,000–100,000 person equivalent (PE)––
should either have total nitrogen concentrations not
exceeding 15 mg N/l or 70–80% reduction of nitrogen
influent values. Biological nitrogen removal (BNR)
has become a common wastewater treatment practice.Many process configurations for BNR are available. A
traditional BNR system is either a separate-stage de-
*Corresponding author. Tel.: +353-91-524411x2762; fax: +353-91-
750507.
E-mail address: [email protected] (X.-M. Zhan).
0960-8524/$ - see front matter � 2003 Elsevier Ltd. All rights reserved.
doi:10.1016/j.biortech.2003.09.017
nitrification system or a single-sludge nitrification–
denitrification system (USEPA, 1993; Tchobanoglouset al., 2003). In the separate-stage denitrification system,
whether a combined carbonaceous oxidation/nitrifica-
tion unit process or a separate stage nitrification unit
process is used, denitrification is accomplished in a
separate unit process following carbonaceous removal
and nitrification. An external carbon source is added to
the denitrification unit to provide readily available car-
bonaceous matter for denitrification. The single-sludgenitrification–denitrification system, including the modi-
fied Ludzack–Ettinger process, A2/O process, UCT
process and Bardenpho process, combines carbonaceous
removal, nitrification and denitrification in the same
process and the carbon source present in the wastewater
is used to sustain denitrification.
In practice, the suspended growth activated sludge
and the attached growth biofilm are both used for BNR.In the present study, a BNR process using a vertically
moving biofilm system (VMBS) was used to treat
synthetic wastewater. This process comprised two pre-
denitrification units, a combined carbonaceous oxida-
tion/nitrification unit and three nitrification units, all in
sequence. Nitrate produced in the nitrification units was
recirculated to the first pre-denitrification unit. Each
314 M. Rodgers, X.-M. Zhan / Bioresource Technology 93 (2004) 313–319
unit process employed attached-growth micro-organ-
isms in a biofilm on the surface of a plastic biomedia
module, which was vertically moved repeatedly in the
bulk wastewater in the pre-denitrification units and into
and out of the bulk fluid in the carbonaceous oxidation
and nitrification units. In comparison with other fre-
quently used biofilm systems, including trickling filters,
biological aerated filters (BAF), fluidized bed reactors(FBR) and moving bed reactors (MBR), this VMBS has
a number of advantages (Rodgers, 1999): no back-
washing is required to prevent clogging; no complicated
air supply system is required; and maintenance and
operation are cheap and simple. These advantages have
been demonstrated in a pilot wastewater treatment plant
using a VMBS system (Rodgers et al., 2003).
The specific objective of this study was to investigatethe performance of the small-scale BNR process using
the VMBS system in nitrogen removal from a synthetic
wastewater.
2. Methods
2.1. Experimental system
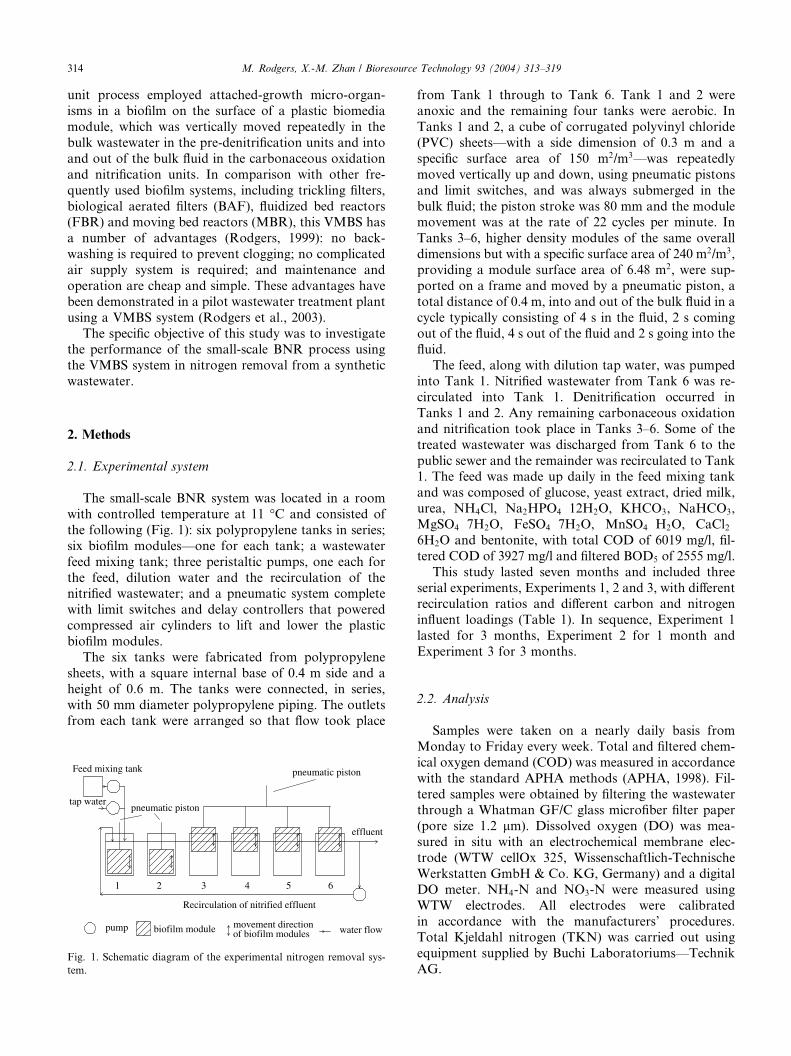
The small-scale BNR system was located in a room
with controlled temperature at 11 �C and consisted of
the following (Fig. 1): six polypropylene tanks in series;
six biofilm modules––one for each tank; a wastewater
feed mixing tank; three peristaltic pumps, one each for
the feed, dilution water and the recirculation of thenitrified wastewater; and a pneumatic system complete
with limit switches and delay controllers that powered
compressed air cylinders to lift and lower the plastic
biofilm modules.
The six tanks were fabricated from polypropylene
sheets, with a square internal base of 0.4 m side and a
height of 0.6 m. The tanks were connected, in series,
with 50 mm diameter polypropylene piping. The outletsfrom each tank were arranged so that flow took place
Recirculation of nitrified effluent
Feed mixing tank
tap water
1 2 3 4 5 6
pneumatic piston
effluent
pump biofilm module movement directionof biofilm modules water flow
pneumatic piston
Fig. 1. Schematic diagram of the experimental nitrogen removal sys-
tem.
from Tank 1 through to Tank 6. Tank 1 and 2 were
anoxic and the remaining four tanks were aerobic. In
Tanks 1 and 2, a cube of corrugated polyvinyl chloride
(PVC) sheets––with a side dimension of 0.3 m and a
specific surface area of 150 m2/m3––was repeatedly
moved vertically up and down, using pneumatic pistons
and limit switches, and was always submerged in the
bulk fluid; the piston stroke was 80 mm and the modulemovement was at the rate of 22 cycles per minute. In
Tanks 3–6, higher density modules of the same overall
dimensions but with a specific surface area of 240 m2/m3,
providing a module surface area of 6.48 m2, were sup-
ported on a frame and moved by a pneumatic piston, a
total distance of 0.4 m, into and out of the bulk fluid in a
cycle typically consisting of 4 s in the fluid, 2 s coming
out of the fluid, 4 s out of the fluid and 2 s going into thefluid.
The feed, along with dilution tap water, was pumped
into Tank 1. Nitrified wastewater from Tank 6 was re-
circulated into Tank 1. Denitrification occurred in
Tanks 1 and 2. Any remaining carbonaceous oxidation
and nitrification took place in Tanks 3–6. Some of the
treated wastewater was discharged from Tank 6 to the
public sewer and the remainder was recirculated to Tank1. The feed was made up daily in the feed mixing tank
and was composed of glucose, yeast extract, dried milk,
urea, NH4Cl, Na2HPO4 Æ 12H2O, KHCO3, NaHCO3,
MgSO4 Æ 7H2O, FeSO4 Æ 7H2O, MnSO4 ÆH2O, CaCl2 Æ6H2O and bentonite, with total COD of 6019 mg/l, fil-
tered COD of 3927 mg/l and filtered BOD5 of 2555 mg/l.
This study lasted seven months and included three
serial experiments, Experiments 1, 2 and 3, with differentrecirculation ratios and different carbon and nitrogen
influent loadings (Table 1). In sequence, Experiment 1
lasted for 3 months, Experiment 2 for 1 month and
Experiment 3 for 3 months.
2.2. Analysis
Samples were taken on a nearly daily basis from
Monday to Friday every week. Total and filtered chem-
ical oxygen demand (COD) was measured in accordance
with the standard APHA methods (APHA, 1998). Fil-
tered samples were obtained by filtering the wastewaterthrough a Whatman GF/C glass microfiber filter paper
(pore size 1.2 lm). Dissolved oxygen (DO) was mea-
sured in situ with an electrochemical membrane elec-
trode (WTW cellOx 325, Wissenschaftlich-Technische
Werkstatten GmbH & Co. KG, Germany) and a digital
DO meter. NH4-N and NO3-N were measured using
WTW electrodes. All electrodes were calibrated
in accordance with the manufacturers’ procedures.Total Kjeldahl nitrogen (TKN) was carried out using
equipment supplied by Buchi Laboratoriums––Technik
AG.
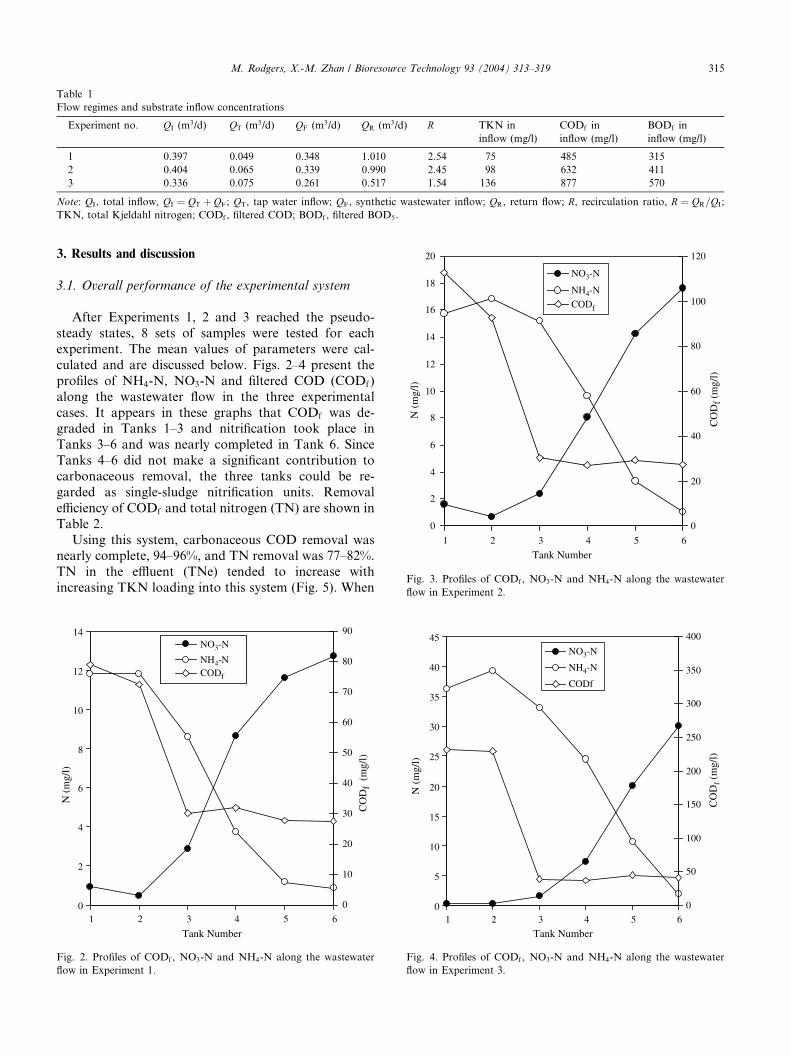
Table 1
Flow regimes and substrate inflow concentrations
Experiment no. QI (m3/d) QT (m3/d) QF (m3/d) QR (m3/d) R TKN in
inflow (mg/l)
CODf in
inflow (mg/l)
BODf in
inflow (mg/l)
1 0.397 0.049 0.348 1.010 2.54 75 485 315
2 0.404 0.065 0.339 0.990 2.45 98 632 411
3 0.336 0.075 0.261 0.517 1.54 136 877 570
Note: QI, total inflow, QI ¼ QT þ QF; QT, tap water inflow; QF, synthetic wastewater inflow; QR, return flow; R, recirculation ratio, R ¼ QR=QI;
TKN, total Kjeldahl nitrogen; CODf , filtered COD; BODf , filtered BOD5.
0
2
4
6
8
10
12
14
16
18
20
1 2 3 4 5 6
Tank Number
N (
mg/
l)
0
20
40
60
80
100
120
NO3-N
NH4-N
CODf
CO
Df (
mg/
l)
Fig. 3. Profiles of CODf, NO3-N and NH4-N along the wastewater
flow in Experiment 2.
M. Rodgers, X.-M. Zhan / Bioresource Technology 93 (2004) 313–319 315
3. Results and discussion
3.1. Overall performance of the experimental system
After Experiments 1, 2 and 3 reached the pseudo-
steady states, 8 sets of samples were tested for each
experiment. The mean values of parameters were cal-
culated and are discussed below. Figs. 2–4 present the
profiles of NH4-N, NO3-N and filtered COD (CODf)
along the wastewater flow in the three experimental
cases. It appears in these graphs that CODf was de-graded in Tanks 1–3 and nitrification took place in
Tanks 3–6 and was nearly completed in Tank 6. Since
Tanks 4–6 did not make a significant contribution to
carbonaceous removal, the three tanks could be re-
garded as single-sludge nitrification units. Removal
efficiency of CODf and total nitrogen (TN) are shown in
Table 2.
Using this system, carbonaceous COD removal wasnearly complete, 94–96%, and TN removal was 77–82%.
TN in the effluent (TNe) tended to increase with
increasing TKN loading into this system (Fig. 5). When
0
2
4
6
8
10
12
14
1 2 3 4 5 6
Tank Number
N (
mg/
l)
0
10
20
30
40
50
60
70
80
90
CO
Df
(mg/
l)
NO3-N
NH4-NCODf
Fig. 2. Profiles of CODf , NO3-N and NH4-N along the wastewater
flow in Experiment 1.
0
5
10
15
20
25
30
35
40
45
1 2 3 4 5 6
Tank Number
N (
mg/
l)
0
50
100
150
200
250
300
350
400
CO
Df (
mg/
l)
NO3-N
NH4-N
CODf
Fig. 4. Profiles of CODf, NO3-N and NH4-N along the wastewater
flow in Experiment 3.
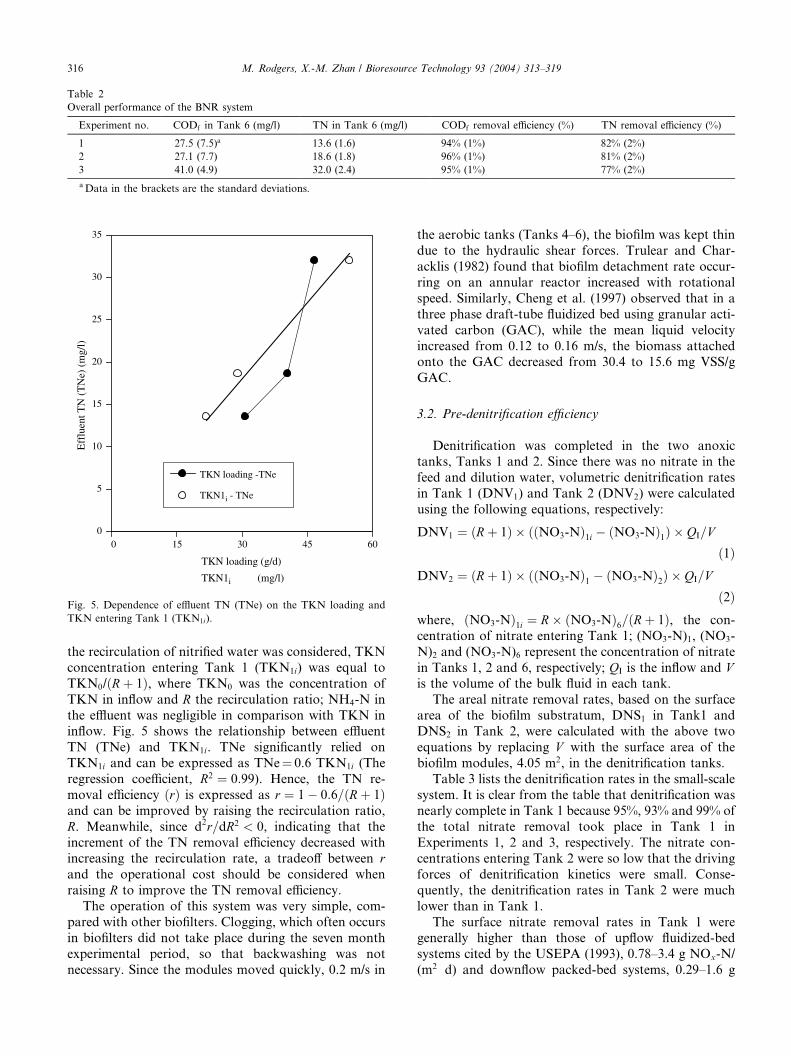
Table 2
Overall performance of the BNR system
Experiment no. CODf in Tank 6 (mg/l) TN in Tank 6 (mg/l) CODf removal efficiency (%) TN removal efficiency (%)
1 27.5 (7.5)a 13.6 (1.6) 94% (1%) 82% (2%)
2 27.1 (7.7) 18.6 (1.8) 96% (1%) 81% (2%)
3 41.0 (4.9) 32.0 (2.4) 95% (1%) 77% (2%)
aData in the brackets are the standard deviations.
0
5
10
15
20
25
30
35
0 15 30 45 60
TKN loading (g/d)
Eff
luen
t TN
(T
Ne)
(m
g/l)
TKN loading -TNe
TKN1i - TNe
TKN1i (mg/l)
Fig. 5. Dependence of effluent TN (TNe) on the TKN loading and
TKN entering Tank 1 (TKN1i).
316 M. Rodgers, X.-M. Zhan / Bioresource Technology 93 (2004) 313–319
the recirculation of nitrified water was considered, TKN
concentration entering Tank 1 (TKN1i) was equal to
TKN0/ðRþ 1Þ, where TKN0 was the concentration of
TKN in inflow and R the recirculation ratio; NH4-N in
the effluent was negligible in comparison with TKN ininflow. Fig. 5 shows the relationship between effluent
TN (TNe) and TKN1i. TNe significantly relied on
TKN1i and can be expressed as TNe¼ 0.6 TKN1i (The
regression coefficient, R2 ¼ 0:99). Hence, the TN re-
moval efficiency ðrÞ is expressed as r ¼ 1� 0:6=ðRþ 1Þand can be improved by raising the recirculation ratio,
R. Meanwhile, since d2r=dR2 < 0, indicating that the
increment of the TN removal efficiency decreased withincreasing the recirculation rate, a tradeoff between rand the operational cost should be considered when
raising R to improve the TN removal efficiency.
The operation of this system was very simple, com-
pared with other biofilters. Clogging, which often occurs
in biofilters did not take place during the seven month
experimental period, so that backwashing was not
necessary. Since the modules moved quickly, 0.2 m/s in
the aerobic tanks (Tanks 4–6), the biofilm was kept thin
due to the hydraulic shear forces. Trulear and Char-
acklis (1982) found that biofilm detachment rate occur-
ring on an annular reactor increased with rotational
speed. Similarly, Cheng et al. (1997) observed that in a
three phase draft-tube fluidized bed using granular acti-
vated carbon (GAC), while the mean liquid velocity
increased from 0.12 to 0.16 m/s, the biomass attachedonto the GAC decreased from 30.4 to 15.6 mg VSS/g
GAC.
3.2. Pre-denitrification efficiency
Denitrification was completed in the two anoxictanks, Tanks 1 and 2. Since there was no nitrate in the
feed and dilution water, volumetric denitrification rates
in Tank 1 (DNV1) and Tank 2 (DNV2) were calculated
using the following equations, respectively:
DNV1 ¼ ðRþ 1Þ � ððNO3-NÞ1i � ðNO3-NÞ1Þ � QI=V
ð1ÞDNV2 ¼ ðRþ 1Þ � ððNO3-NÞ1 � ðNO3-NÞ2Þ � QI=V
ð2Þwhere, ðNO3-NÞ1i ¼ R� ðNO3-NÞ6=ðRþ 1Þ, the con-
centration of nitrate entering Tank 1; (NO3-N)1, (NO3-
N)2 and (NO3-N)6 represent the concentration of nitrate
in Tanks 1, 2 and 6, respectively; QI is the inflow and Vis the volume of the bulk fluid in each tank.
The areal nitrate removal rates, based on the surface
area of the biofilm substratum, DNS1 in Tank1 and
DNS2 in Tank 2, were calculated with the above two
equations by replacing V with the surface area of the
biofilm modules, 4.05 m2, in the denitrification tanks.
Table 3 lists the denitrification rates in the small-scale
system. It is clear from the table that denitrification wasnearly complete in Tank 1 because 95%, 93% and 99% of
the total nitrate removal took place in Tank 1 in
Experiments 1, 2 and 3, respectively. The nitrate con-
centrations entering Tank 2 were so low that the driving
forces of denitrification kinetics were small. Conse-
quently, the denitrification rates in Tank 2 were much
lower than in Tank 1.
The surface nitrate removal rates in Tank 1 weregenerally higher than those of upflow fluidized-bed
systems cited by the USEPA (1993), 0.78–3.4 g NOx-N/
(m2 Æ d) and downflow packed-bed systems, 0.29–1.6 g
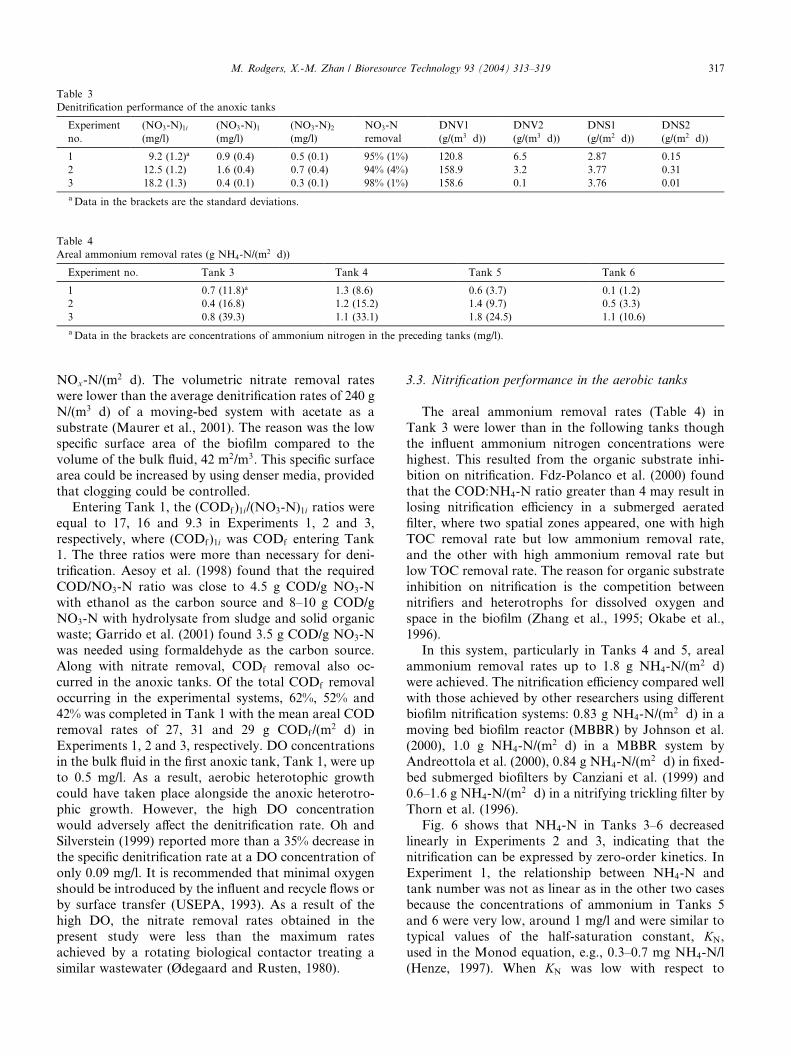
Table 3
Denitrification performance of the anoxic tanks
Experiment
no.
(NO3-N)1i(mg/l)
(NO3-N)1(mg/l)
(NO3-N)2(mg/l)
NO3-N
removal
DNV1
(g/(m3 Æ d))DNV2
(g/(m3 Æ d))DNS1
(g/(m2 Æ d))DNS2
(g/(m2 Æ d))
1 9.2 (1.2)a 0.9 (0.4) 0.5 (0.1) 95% (1%) 120.8 6.5 2.87 0.15
2 12.5 (1.2) 1.6 (0.4) 0.7 (0.4) 94% (4%) 158.9 3.2 3.77 0.31
3 18.2 (1.3) 0.4 (0.1) 0.3 (0.1) 98% (1%) 158.6 0.1 3.76 0.01
aData in the brackets are the standard deviations.
Table 4
Areal ammonium removal rates (g NH4-N/(m2 Æ d))
Experiment no. Tank 3 Tank 4 Tank 5 Tank 6
1 0.7 (11.8)a 1.3 (8.6) 0.6 (3.7) 0.1 (1.2)
2 0.4 (16.8) 1.2 (15.2) 1.4 (9.7) 0.5 (3.3)
3 0.8 (39.3) 1.1 (33.1) 1.8 (24.5) 1.1 (10.6)
aData in the brackets are concentrations of ammonium nitrogen in the preceding tanks (mg/l).
M. Rodgers, X.-M. Zhan / Bioresource Technology 93 (2004) 313–319 317
NOx-N/(m2 Æd). The volumetric nitrate removal rates
were lower than the average denitrification rates of 240 g
N/(m3 Æ d) of a moving-bed system with acetate as a
substrate (Maurer et al., 2001). The reason was the low
specific surface area of the biofilm compared to the
volume of the bulk fluid, 42 m2/m3. This specific surface
area could be increased by using denser media, provided
that clogging could be controlled.Entering Tank 1, the (CODf)1i/(NO3-N)1i ratios were
equal to 17, 16 and 9.3 in Experiments 1, 2 and 3,
respectively, where (CODf)1i was CODf entering Tank
1. The three ratios were more than necessary for deni-
trification. Aesoy et al. (1998) found that the required
COD/NO3-N ratio was close to 4.5 g COD/g NO3-N
with ethanol as the carbon source and 8–10 g COD/g
NO3-N with hydrolysate from sludge and solid organicwaste; Garrido et al. (2001) found 3.5 g COD/g NO3-N
was needed using formaldehyde as the carbon source.
Along with nitrate removal, CODf removal also oc-
curred in the anoxic tanks. Of the total CODf removal
occurring in the experimental systems, 62%, 52% and
42% was completed in Tank 1 with the mean areal COD
removal rates of 27, 31 and 29 g CODf/(m2 Æ d) in
Experiments 1, 2 and 3, respectively. DO concentrationsin the bulk fluid in the first anoxic tank, Tank 1, were up
to 0.5 mg/l. As a result, aerobic heterotophic growth
could have taken place alongside the anoxic heterotro-
phic growth. However, the high DO concentration
would adversely affect the denitrification rate. Oh and
Silverstein (1999) reported more than a 35% decrease in
the specific denitrification rate at a DO concentration of
only 0.09 mg/l. It is recommended that minimal oxygenshould be introduced by the influent and recycle flows or
by surface transfer (USEPA, 1993). As a result of the
high DO, the nitrate removal rates obtained in the
present study were less than the maximum rates
achieved by a rotating biological contactor treating a
similar wastewater (Ødegaard and Rusten, 1980).
3.3. Nitrification performance in the aerobic tanks
The areal ammonium removal rates (Table 4) in
Tank 3 were lower than in the following tanks though
the influent ammonium nitrogen concentrations were
highest. This resulted from the organic substrate inhi-
bition on nitrification. Fdz-Polanco et al. (2000) found
that the COD:NH4-N ratio greater than 4 may result inlosing nitrification efficiency in a submerged aerated
filter, where two spatial zones appeared, one with high
TOC removal rate but low ammonium removal rate,
and the other with high ammonium removal rate but
low TOC removal rate. The reason for organic substrate
inhibition on nitrification is the competition between
nitrifiers and heterotrophs for dissolved oxygen and
space in the biofilm (Zhang et al., 1995; Okabe et al.,1996).
In this system, particularly in Tanks 4 and 5, areal
ammonium removal rates up to 1.8 g NH4-N/(m2 Æ d)were achieved. The nitrification efficiency compared well
with those achieved by other researchers using different
biofilm nitrification systems: 0.83 g NH4-N/(m2 Æ d) in a
moving bed biofilm reactor (MBBR) by Johnson et al.
(2000), 1.0 g NH4-N/(m2 Æ d) in a MBBR system byAndreottola et al. (2000), 0.84 g NH4-N/(m2 Æ d) in fixed-
bed submerged biofilters by Canziani et al. (1999) and
0.6–1.6 g NH4-N/(m2 Æd) in a nitrifying trickling filter by
Thorn et al. (1996).
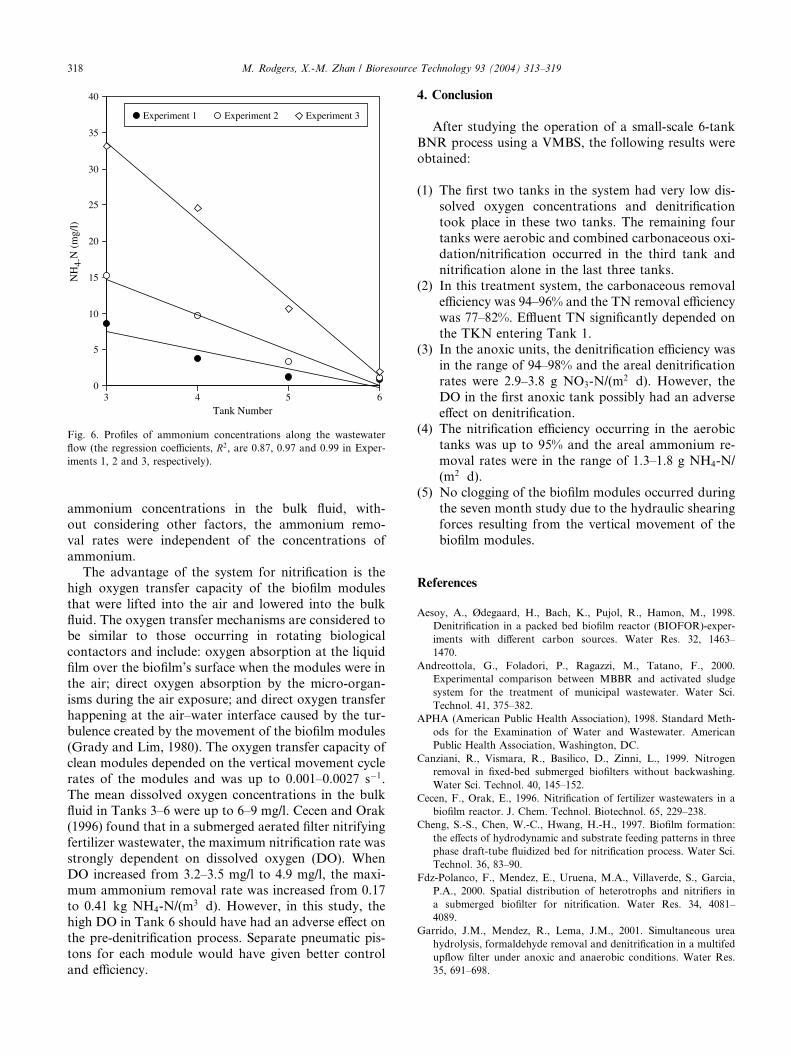
Fig. 6 shows that NH4-N in Tanks 3–6 decreased
linearly in Experiments 2 and 3, indicating that the
nitrification can be expressed by zero-order kinetics. In
Experiment 1, the relationship between NH4-N andtank number was not as linear as in the other two cases
because the concentrations of ammonium in Tanks 5
and 6 were very low, around 1 mg/l and were similar to
typical values of the half-saturation constant, KN,
used in the Monod equation, e.g., 0.3–0.7 mg NH4-N/l
(Henze, 1997). When KN was low with respect to
0
5
10
15
20
25
30
35
40
3 4 5 6Tank Number
NH
4-N
(m
g/l)
Experiment 1 Experiment 2 Experiment 3
Fig. 6. Profiles of ammonium concentrations along the wastewater
flow (the regression coefficients, R2, are 0.87, 0.97 and 0.99 in Exper-
iments 1, 2 and 3, respectively).
318 M. Rodgers, X.-M. Zhan / Bioresource Technology 93 (2004) 313–319
ammonium concentrations in the bulk fluid, with-
out considering other factors, the ammonium remo-
val rates were independent of the concentrations of
ammonium.
The advantage of the system for nitrification is the
high oxygen transfer capacity of the biofilm modules
that were lifted into the air and lowered into the bulk
fluid. The oxygen transfer mechanisms are considered tobe similar to those occurring in rotating biological
contactors and include: oxygen absorption at the liquid
film over the biofilm’s surface when the modules were in
the air; direct oxygen absorption by the micro-organ-
isms during the air exposure; and direct oxygen transfer
happening at the air–water interface caused by the tur-
bulence created by the movement of the biofilm modules
(Grady and Lim, 1980). The oxygen transfer capacity ofclean modules depended on the vertical movement cycle
rates of the modules and was up to 0.001–0.0027 s�1.
The mean dissolved oxygen concentrations in the bulk
fluid in Tanks 3–6 were up to 6–9 mg/l. Cecen and Orak
(1996) found that in a submerged aerated filter nitrifying
fertilizer wastewater, the maximum nitrification rate was
strongly dependent on dissolved oxygen (DO). When
DO increased from 3.2–3.5 mg/l to 4.9 mg/l, the maxi-mum ammonium removal rate was increased from 0.17
to 0.41 kg NH4-N/(m3 Æ d). However, in this study, the
high DO in Tank 6 should have had an adverse effect on
the pre-denitrification process. Separate pneumatic pis-
tons for each module would have given better control
and efficiency.
4. Conclusion
After studying the operation of a small-scale 6-tank
BNR process using a VMBS, the following results were
obtained:
(1) The first two tanks in the system had very low dis-
solved oxygen concentrations and denitrificationtook place in these two tanks. The remaining four
tanks were aerobic and combined carbonaceous oxi-
dation/nitrification occurred in the third tank and
nitrification alone in the last three tanks.
(2) In this treatment system, the carbonaceous removal
efficiency was 94–96% and the TN removal efficiency
was 77–82%. Effluent TN significantly depended on
the TKN entering Tank 1.(3) In the anoxic units, the denitrification efficiency was
in the range of 94–98% and the areal denitrification
rates were 2.9–3.8 g NO3-N/(m2 Æ d). However, the
DO in the first anoxic tank possibly had an adverse
effect on denitrification.
(4) The nitrification efficiency occurring in the aerobic
tanks was up to 95% and the areal ammonium re-
moval rates were in the range of 1.3–1.8 g NH4-N/(m2 Æ d).
(5) No clogging of the biofilm modules occurred during
the seven month study due to the hydraulic shearing
forces resulting from the vertical movement of the
biofilm modules.
References
Aesoy, A., Ødegaard, H., Bach, K., Pujol, R., Hamon, M., 1998.
Denitrification in a packed bed biofilm reactor (BIOFOR)-exper-
iments with different carbon sources. Water Res. 32, 1463–
1470.
Andreottola, G., Foladori, P., Ragazzi, M., Tatano, F., 2000.
Experimental comparison between MBBR and activated sludge
system for the treatment of municipal wastewater. Water Sci.
Technol. 41, 375–382.
APHA (American Public Health Association), 1998. Standard Meth-
ods for the Examination of Water and Wastewater. American
Public Health Association, Washington, DC.
Canziani, R., Vismara, R., Basilico, D., Zinni, L., 1999. Nitrogen
removal in fixed-bed submerged biofilters without backwashing.
Water Sci. Technol. 40, 145–152.
Cecen, F., Orak, E., 1996. Nitrification of fertilizer wastewaters in a
biofilm reactor. J. Chem. Technol. Biotechnol. 65, 229–238.
Cheng, S.-S., Chen, W.-C., Hwang, H.-H., 1997. Biofilm formation:
the effects of hydrodynamic and substrate feeding patterns in three
phase draft-tube fluidized bed for nitrification process. Water Sci.
Technol. 36, 83–90.
Fdz-Polanco, F., Mendez, E., Uruena, M.A., Villaverde, S., Garcia,
P.A., 2000. Spatial distribution of heterotrophs and nitrifiers in
a submerged biofilter for nitrification. Water Res. 34, 4081–
4089.
Garrido, J.M., Mendez, R., Lema, J.M., 2001. Simultaneous urea
hydrolysis, formaldehyde removal and denitrification in a multifed
upflow filter under anoxic and anaerobic conditions. Water Res.
35, 691–698.
M. Rodgers, X.-M. Zhan / Bioresource Technology 93 (2004) 313–319 319
Grady Jr., C.P.L., Lim, H.C., 1980. Biological Wastewater Treatment:
Theory and Applications. Marcel Dekker, New York. pp. 755–756.
Henze, M., 1997. Basic biological processes. In: Henze, M., Harrem-
oes, P., Jansen, J. la C., Arvin, E. (Eds.), Wastewater Treatment:
Biological and Chemical Processes. Springer Verlag, Berlin, Hei-
delberg, Germany, p. 85.
Johnson, C.H., Page, M.W., Blaha, L., 2000. Full scale moving bed
biofilm reactor results from refinery and slaughter house treatment
facilities. Water Sci. Technol. 41, 401–407.
Maurer, M., Fux, C., Graff, M., Siegrist, H., 2001. Moving-bed
biological treatment (MBBT) of municipal wastewater: denitrifica-
tion. Water Sci. Technol. 43, 337–344.
Ødegaard, H., Rusten, B., 1980. Nitrogen removal in rotating
biological contactors without the use of external carbonaceous
source. In: Proceedings of the First National Symposium/Work-
shop on Rotating Biological Contactor Technology. Champion,
Pennsylvania, vol. 1, pp. 1301–1317.
Oh, J., Silverstein, J., 1999. Oxygen inhibition of activated sludge
denitrification. Water Res. 33, 1925–1937.
Okabe, S., Oozawa, Y., Hirata, K., Watanabe, Y., 1996. Relationship
between population dynamics of nitrifiers in biofilms and reactor
performance at various C:N ratios. Water Res. 30, 1563–1572.
Rodgers, M., 1999. Organic carbon removal using a new biofilm
reactor. Water Res. 33, 1495–1499.
Rodgers, M., Zhan, X.-M., Gallagher, B., 2003. A pilot plant study
using a vertically moving biofilm process to treat municipal
wastewater. Bioresource Technol. 89, 139–143.
Tchobanoglous, G., Burton, F.L., Stensel, H.D., 2003. Wastewater
Engineering: Treatment and Reuse. Metcalf & Eddy, New York.
pp. 749–789.
Thorn, M., Mattsson, A., Sorensson, F., 1996. Biofilm development in
a nitrifying trickling filter. Water Sci. Technol. 34, 83–89.
Trulear, M.G., Characklis, W.G., 1982. Dynamics of biofilm pro-
cesses. J. Water Pollut. Control Fed. 54, 1288–1301.
USEPA, 1993. Nitrogen Control. Technomic Publishing Company,
Pennsylvania, USA, pp. 211–311.
Zhang, T.C., Fu, Y.C., Bishop, P.L., 1995. Competition for substrate
and space in biofilms. Water Environ. Res. 67, 992–1003.