Embed Size (px)
Citation preview
Biofuels from algae: technology options, energy balance and GHG emissions
Insights from a literature review
Stefania Rocca1, Alessandro Agostini1,2, Jacopo Giuntoli1, Luisa Marelli1
1European Commission, JRC, IET, Sustainable Transport Unit, Westerduinweg 3, 1755LE Petten, The Netherlands.
2ENEA, Via Anguillarese 301, Roma, Italia
Pre-BASIC Biogas Seminar
Malmoe (Sweden) 08 November 2016
Context
2 8 November 2016
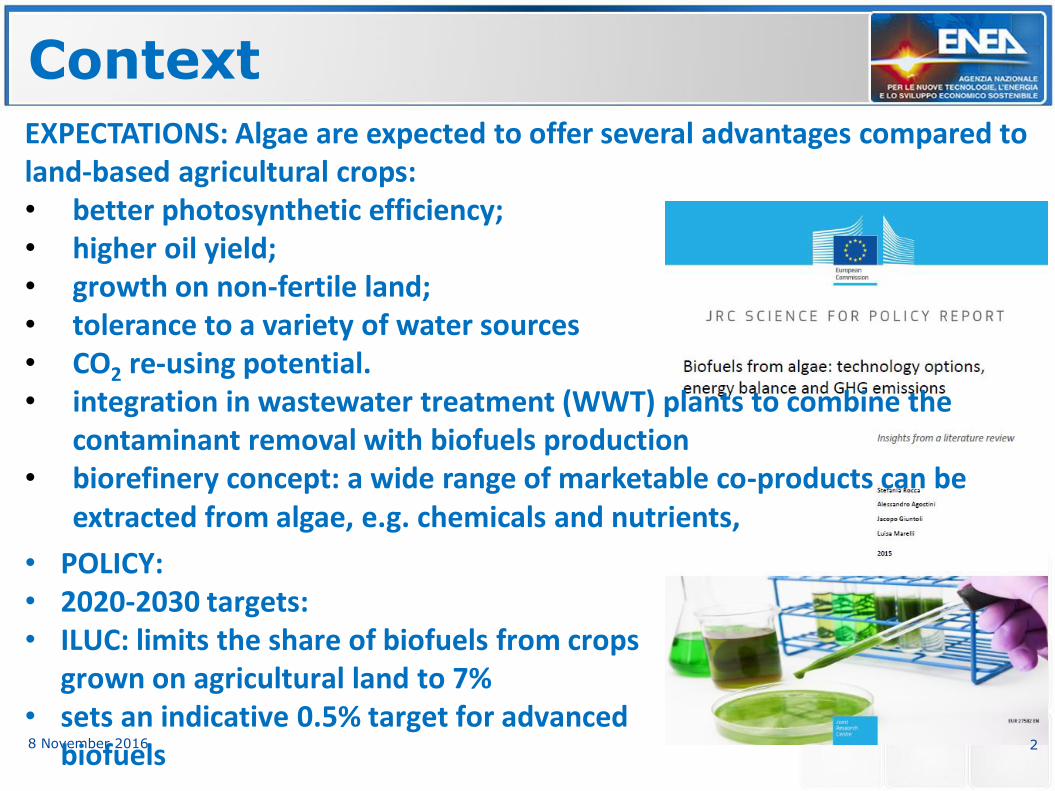
EXPECTATIONS: Algae are expected to offer several advantages compared to land-based agricultural crops: • better photosynthetic efficiency; • higher oil yield; • growth on non-fertile land; • tolerance to a variety of water sources • CO2 re-using potential. • integration in wastewater treatment (WWT) plants to combine the
contaminant removal with biofuels production • biorefinery concept: a wide range of marketable co-products can be
extracted from algae, e.g. chemicals and nutrients,
• POLICY: • 2020-2030 targets: • ILUC: limits the share of biofuels from crops
grown on agricultural land to 7% • sets an indicative 0.5% target for advanced
biofuels
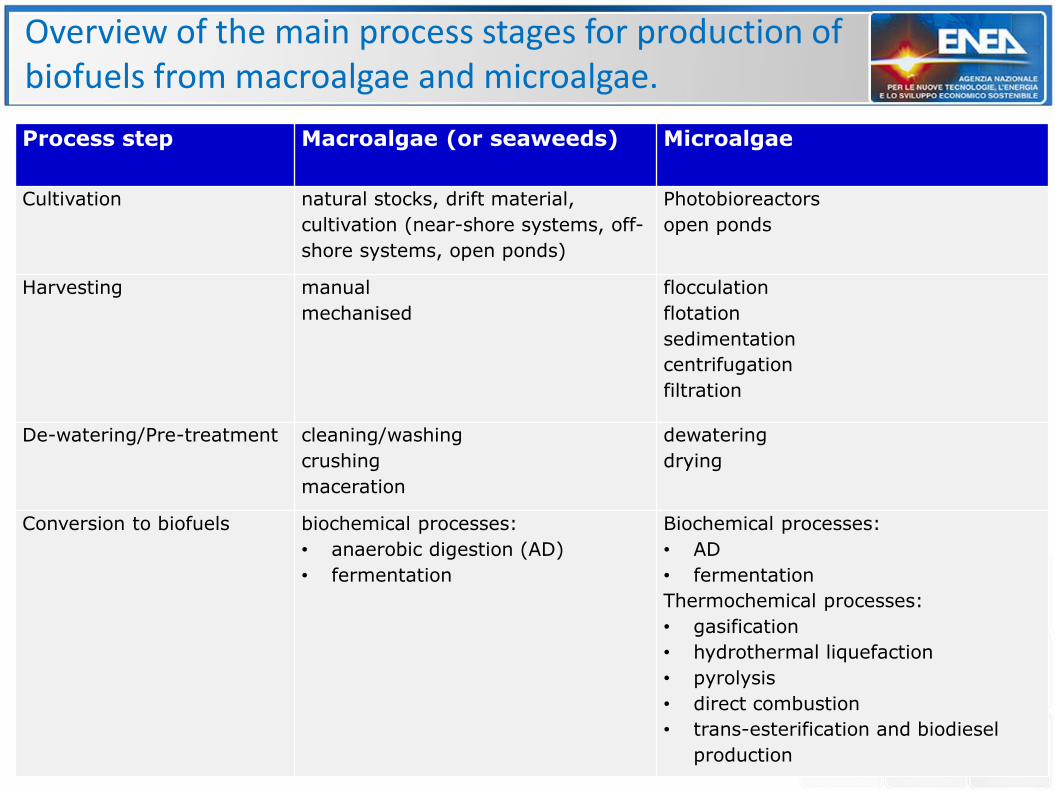
Process step Macroalgae (or seaweeds) Microalgae
Cultivation natural stocks, drift material,
cultivation (near-shore systems, off-
shore systems, open ponds)
Photobioreactors
open ponds
Harvesting manual
mechanised
flocculation
flotation
sedimentation
centrifugation
filtration
De-watering/Pre-treatment cleaning/washing
crushing
maceration
dewatering
drying
Conversion to biofuels biochemical processes:
• anaerobic digestion (AD)
• fermentation
Biochemical processes:
• AD
• fermentation
Thermochemical processes:
• gasification
• hydrothermal liquefaction
• pyrolysis
• direct combustion
• trans-esterification and biodiesel
production
Overview of the main process stages for production of biofuels from macroalgae and microalgae.
Macroalgae: cultivation
4 8 November 2016
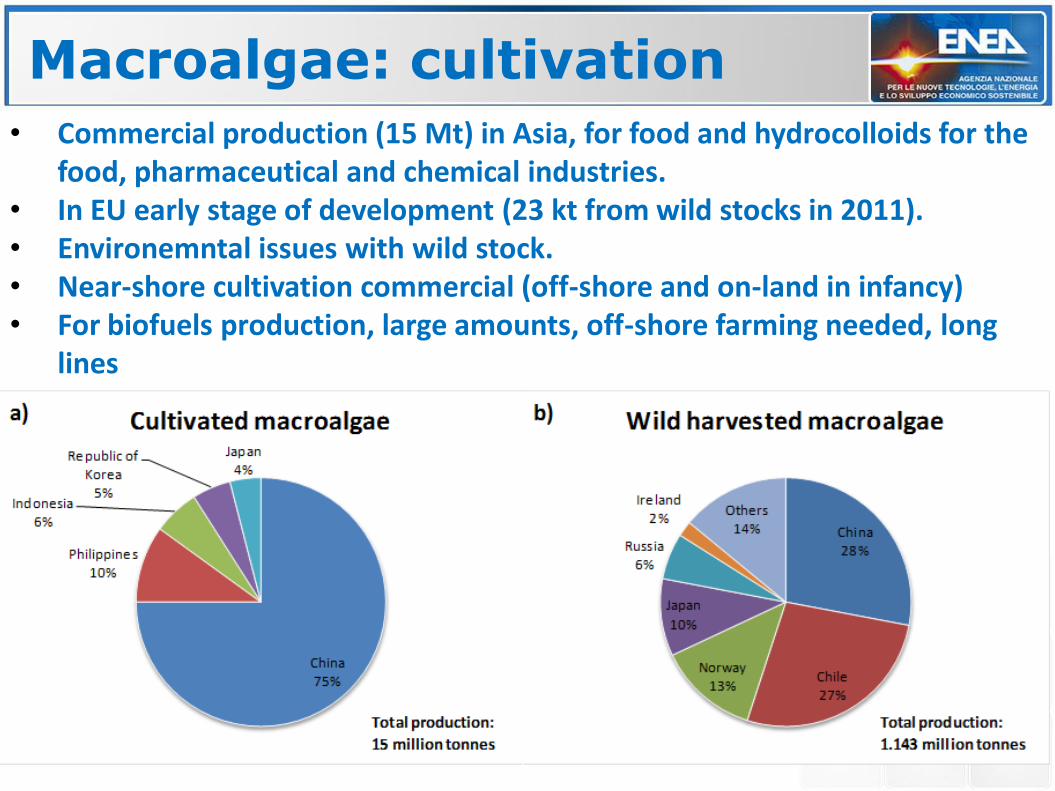
• Commercial production (15 Mt) in Asia, for food and hydrocolloids for the food, pharmaceutical and chemical industries.
• In EU early stage of development (23 kt from wild stocks in 2011). • Environemntal issues with wild stock. • Near-shore cultivation commercial (off-shore and on-land in infancy) • For biofuels production, large amounts, off-shore farming needed, long
lines
Macroalgae: Harvesting and concentration
5 8 November 2016
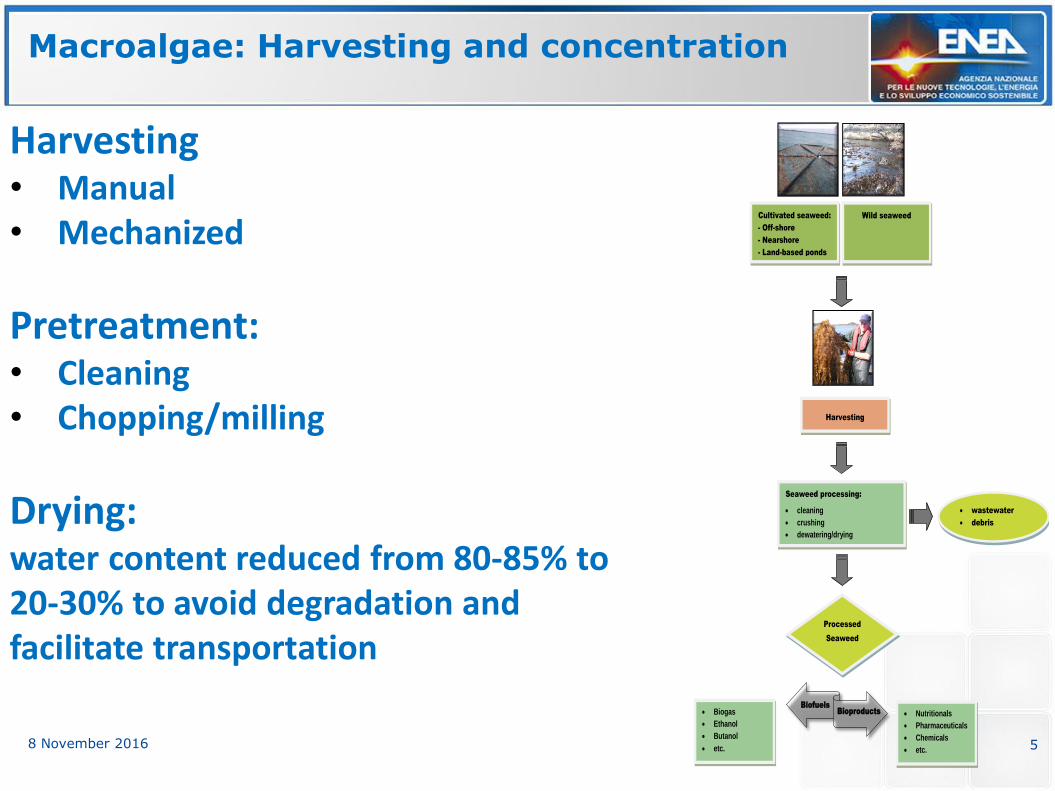
Harvesting • Manual • Mechanized
Pretreatment: • Cleaning • Chopping/milling
Drying: water content reduced from 80-85% to 20-30% to avoid degradation and facilitate transportation
BiofuelsBioproducts
Cultivated seaweed:
- Off-shore
- Nearshore
- Land-based ponds
Wild seaweed
Harvesting
Seaweed processing:
cleaning
crushing
dewatering/drying
wastewater
debris
Processed
Seaweed
Biogas
Ethanol
Butanol
etc.
Nutritionals
Pharmaceuticals
Chemicals
etc.
Macroalgae: biofuel options: biomethane
6 8 November 2016
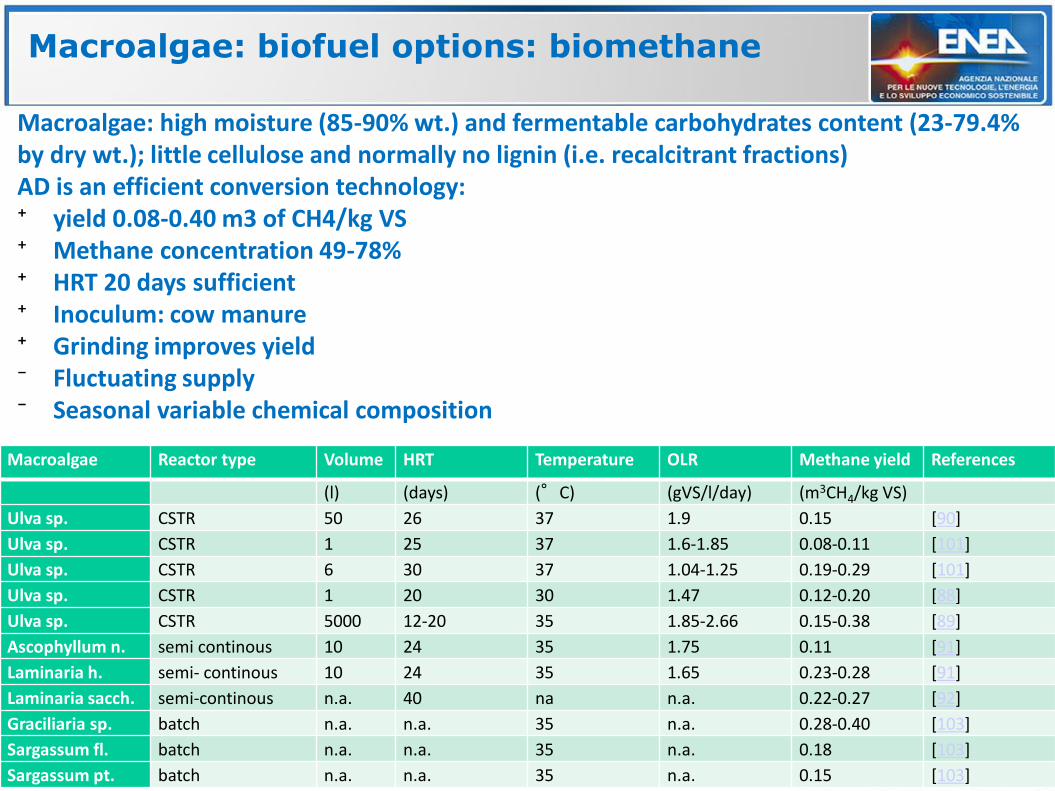
Macroalgae: high moisture (85-90% wt.) and fermentable carbohydrates content (23-79.4% by dry wt.); little cellulose and normally no lignin (i.e. recalcitrant fractions) AD is an efficient conversion technology: ⁺ yield 0.08-0.40 m3 of CH4/kg VS ⁺ Methane concentration 49-78% ⁺ HRT 20 days sufficient ⁺ Inoculum: cow manure ⁺ Grinding improves yield ⁻ Fluctuating supply ⁻ Seasonal variable chemical composition
Macroalgae Reactor type Volume HRT Temperature OLR Methane yield References
(l) (days) (°C) (gVS/l/day) (m3CH4/kg VS)
Ulva sp. CSTR 50 26 37 1.9 0.15 [90]
Ulva sp. CSTR 1 25 37 1.6-1.85 0.08-0.11 [101]
Ulva sp. CSTR 6 30 37 1.04-1.25 0.19-0.29 [101]
Ulva sp. CSTR 1 20 30 1.47 0.12-0.20 [88]
Ulva sp. CSTR 5000 12-20 35 1.85-2.66 0.15-0.38 [89]
Ascophyllum n. semi continous 10 24 35 1.75 0.11 [91]
Laminaria h. semi- continous 10 24 35 1.65 0.23-0.28 [91]
Laminaria sacch. semi-continous n.a. 40 na n.a. 0.22-0.27 [92]
Graciliaria sp. batch n.a. n.a. 35 n.a. 0.28-0.40 [103]
Sargassum fl. batch n.a. n.a. 35 n.a. 0.18 [103]
Sargassum pt. batch n.a. n.a. 35 n.a. 0.15 [103]
Macroalgae: biofuel options: bioethanol & biobutanol
7 8 November 2016
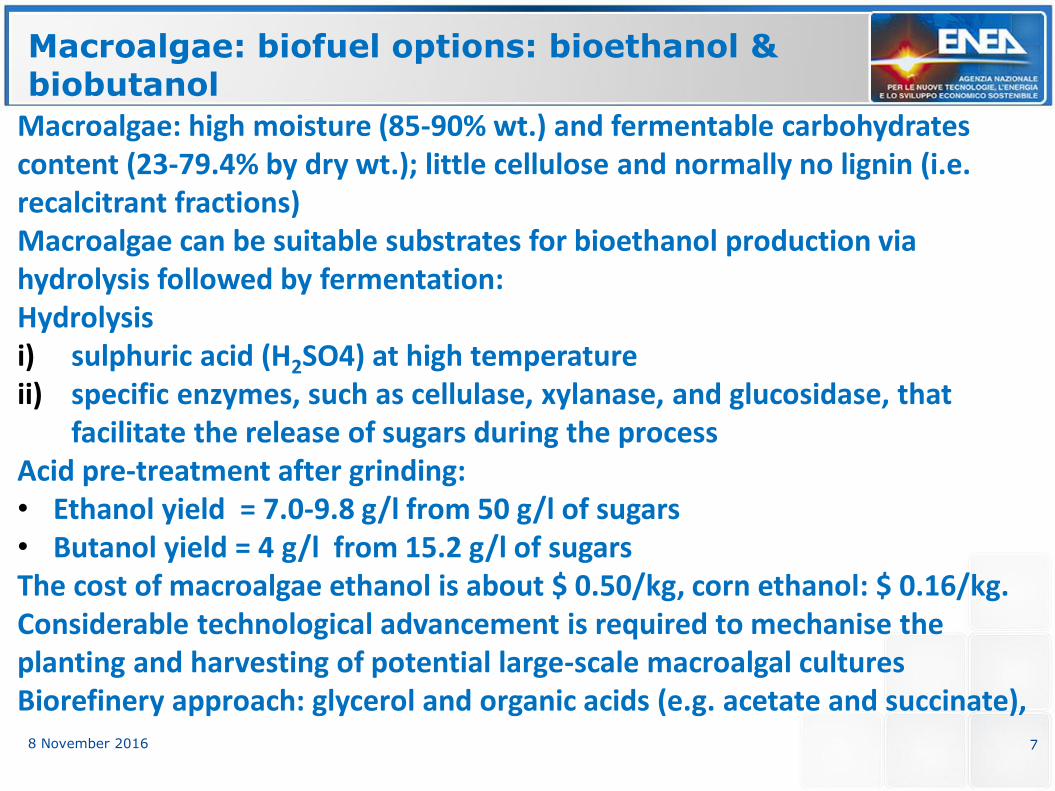
Macroalgae: high moisture (85-90% wt.) and fermentable carbohydrates content (23-79.4% by dry wt.); little cellulose and normally no lignin (i.e. recalcitrant fractions) Macroalgae can be suitable substrates for bioethanol production via hydrolysis followed by fermentation: Hydrolysis i) sulphuric acid (H2SO4) at high temperature ii) specific enzymes, such as cellulase, xylanase, and glucosidase, that
facilitate the release of sugars during the process Acid pre-treatment after grinding: • Ethanol yield = 7.0-9.8 g/l from 50 g/l of sugars • Butanol yield = 4 g/l from 15.2 g/l of sugars The cost of macroalgae ethanol is about $ 0.50/kg, corn ethanol: $ 0.16/kg. Considerable technological advancement is required to mechanise the planting and harvesting of potential large-scale macroalgal cultures Biorefinery approach: glycerol and organic acids (e.g. acetate and succinate),
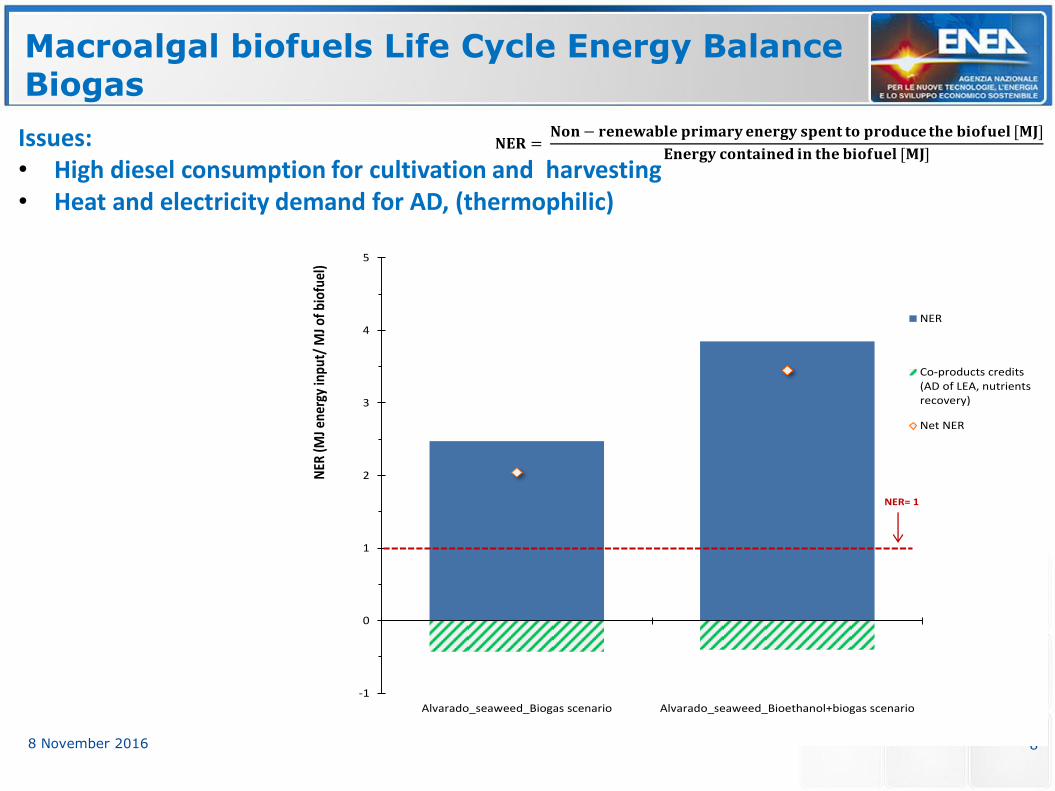
Macroalgal biofuels Life Cycle Energy Balance Biogas
8 8 November 2016
Issues: • High diesel consumption for cultivation and harvesting • Heat and electricity demand for AD, (thermophilic)
𝐍𝐄𝐑 = 𝐍𝐨𝐧− 𝐫𝐞𝐧𝐞𝐰𝐚𝐛𝐥𝐞 𝐩𝐫𝐢𝐦𝐚𝐫𝐲 𝐞𝐧𝐞𝐫𝐠𝐲 𝐬𝐩𝐞𝐧𝐭 𝐭𝐨 𝐩𝐫𝐨𝐝𝐮𝐜𝐞 𝐭𝐡𝐞 𝐛𝐢𝐨𝐟𝐮𝐞𝐥 [𝐌𝐉]
𝐄𝐧𝐞𝐫𝐠𝐲 𝐜𝐨𝐧𝐭𝐚𝐢𝐧𝐞𝐝 𝐢𝐧 𝐭𝐡𝐞 𝐛𝐢𝐨𝐟𝐮𝐞𝐥 [𝐌𝐉]
-1
0
1
2
3
4
5
Alvarado_seaweed_Biogas scenario Alvarado_seaweed_Bioethanol+biogas scenario
NER
(MJ e
nerg
y in
put/
MJ o
f bio
fuel
)NER
Co-products credits(AD of LEA, nutrientsrecovery)
Net NER
NER= 1
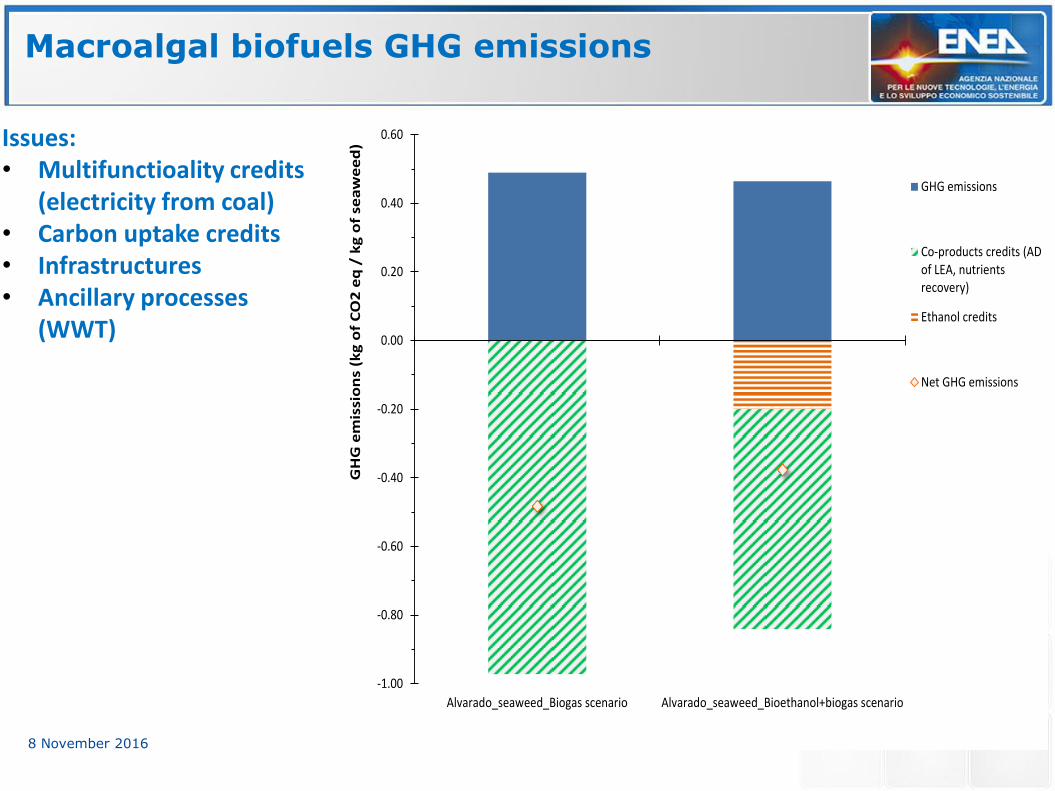
Macroalgal biofuels GHG emissions
9 8 November 2016
Issues: • Multifunctioality credits
(electricity from coal) • Carbon uptake credits • Infrastructures • Ancillary processes
(WWT)
-1.00
-0.80
-0.60
-0.40
-0.20
0.00
0.20
0.40
0.60
Alvarado_seaweed_Biogas scenario Alvarado_seaweed_Bioethanol+biogas scenario
GH
G e
mis
sio
ns
(kg
of
CO
2 e
q /
kg
of
sea
we
ed
)
GHG emissions
Co-products credits (ADof LEA, nutrientsrecovery)
Ethanol credits
Net GHG emissions
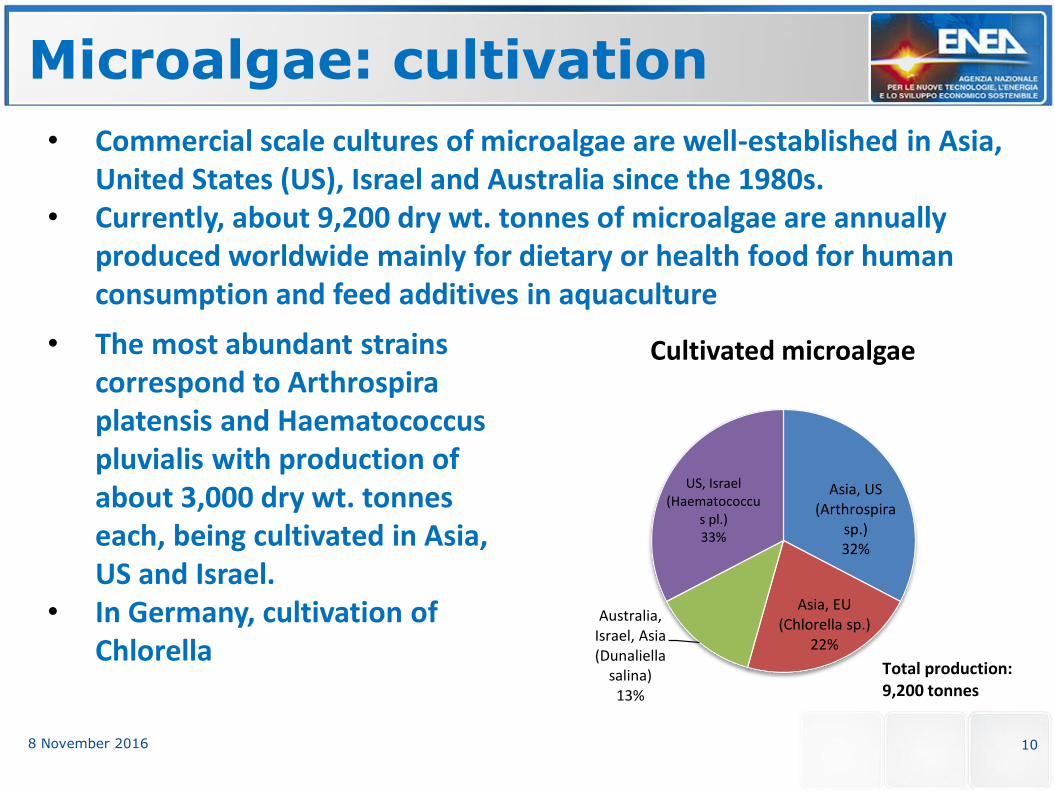
Microalgae: cultivation
10 8 November 2016
• The most abundant strains correspond to Arthrospira platensis and Haematococcus pluvialis with production of about 3,000 dry wt. tonnes each, being cultivated in Asia, US and Israel.
• In Germany, cultivation of Chlorella
Asia, US (Arthrospira
sp.)32%
Asia, EU (Chlorella sp.)
22%
Australia, Israel, Asia (Dunaliella
salina)13%
US, Israel (Haematococcu
s pl.)33%
Cultivated microalgae
Total production:9,200 tonnes
• Commercial scale cultures of microalgae are well-established in Asia, United States (US), Israel and Australia since the 1980s.
• Currently, about 9,200 dry wt. tonnes of microalgae are annually produced worldwide mainly for dietary or health food for human consumption and feed additives in aquaculture
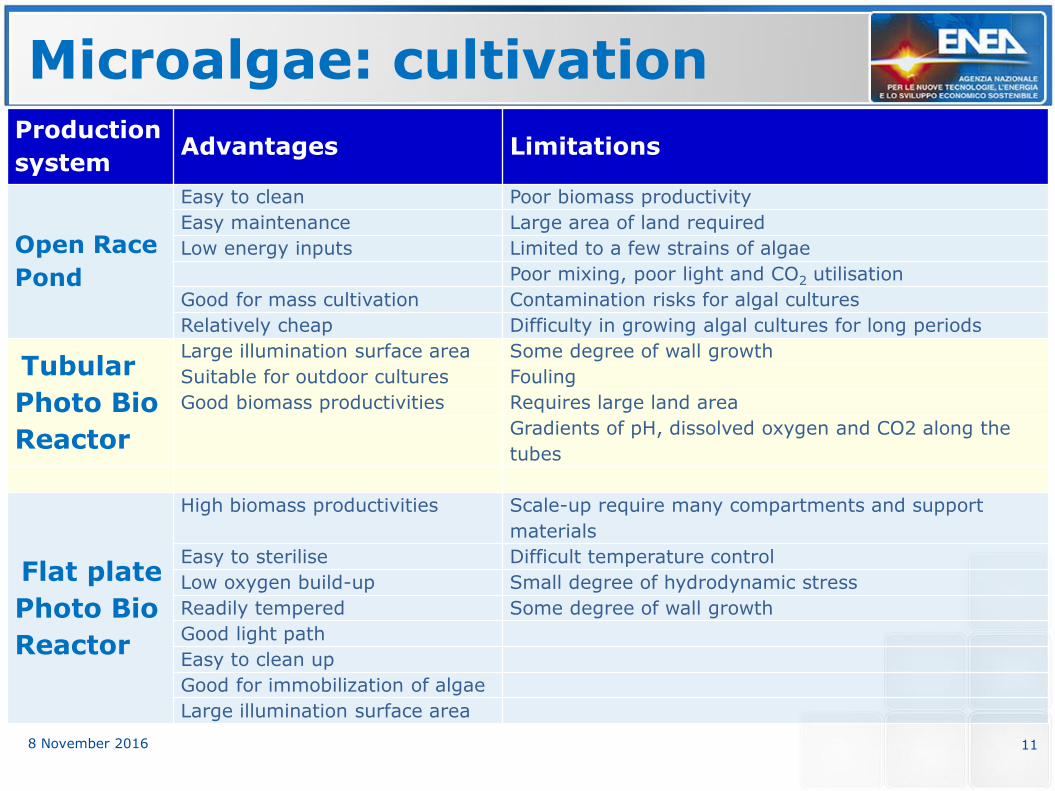
Microalgae: cultivation
11 8 November 2016
Production
system Advantages Limitations
Open Race
Pond
Easy to clean Poor biomass productivity
Easy maintenance Large area of land required
Low energy inputs Limited to a few strains of algae
Poor mixing, poor light and CO2 utilisation
Good for mass cultivation Contamination risks for algal cultures
Relatively cheap Difficulty in growing algal cultures for long periods
Tubular
Photo Bio
Reactor
Large illumination surface area Some degree of wall growth
Suitable for outdoor cultures Fouling
Good biomass productivities Requires large land area
Gradients of pH, dissolved oxygen and CO2 along the
tubes
Flat plate
Photo Bio
Reactor
High biomass productivities Scale-up require many compartments and support
materials
Easy to sterilise Difficult temperature control
Low oxygen build-up Small degree of hydrodynamic stress
Readily tempered Some degree of wall growth
Good light path
Easy to clean up
Good for immobilization of algae
Large illumination surface area
Microalgae: Harvesting and concentration
12 8 November 2016
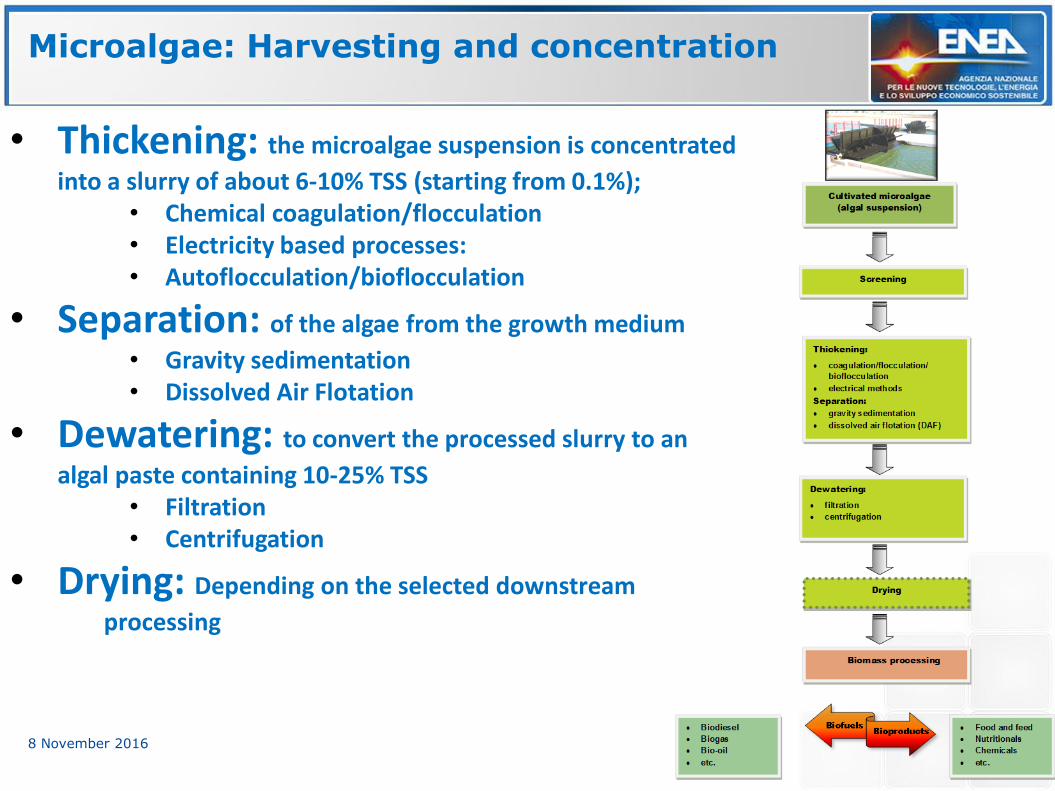
• Thickening: the microalgae suspension is concentrated
into a slurry of about 6-10% TSS (starting from 0.1%); • Chemical coagulation/flocculation • Electricity based processes: • Autoflocculation/bioflocculation
• Separation: of the algae from the growth medium
• Gravity sedimentation • Dissolved Air Flotation
• Dewatering: to convert the processed slurry to an
algal paste containing 10-25% TSS • Filtration • Centrifugation
• Drying: Depending on the selected downstream
processing
Microalgae: biofuel options: biodiesel
13 8 November 2016
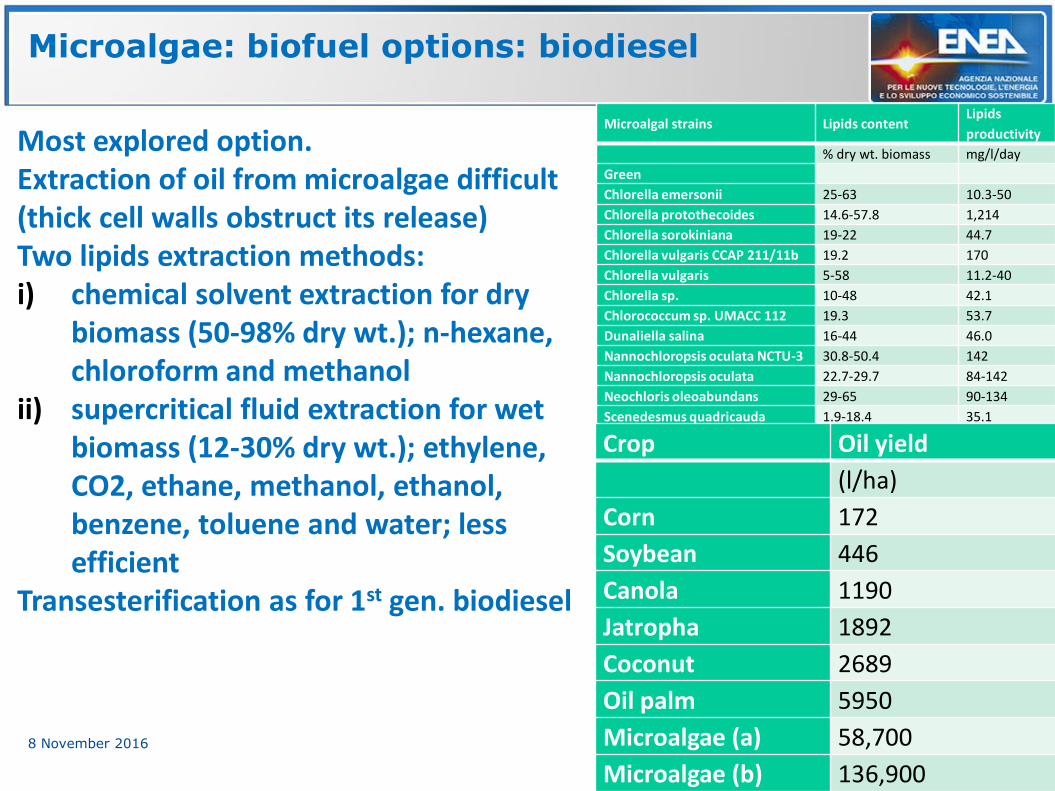
Most explored option. Extraction of oil from microalgae difficult (thick cell walls obstruct its release) Two lipids extraction methods: i) chemical solvent extraction for dry
biomass (50-98% dry wt.); n-hexane, chloroform and methanol
ii) supercritical fluid extraction for wet biomass (12-30% dry wt.); ethylene, CO2, ethane, methanol, ethanol, benzene, toluene and water; less efficient
Transesterification as for 1st gen. biodiesel
Microalgal strains Lipids content Lipids
productivity
% dry wt. biomass mg/l/day
Green
Chlorella emersonii 25-63 10.3-50
Chlorella protothecoides 14.6-57.8 1,214
Chlorella sorokiniana 19-22 44.7
Chlorella vulgaris CCAP 211/11b 19.2 170
Chlorella vulgaris 5-58 11.2-40
Chlorella sp. 10-48 42.1
Chlorococcum sp. UMACC 112 19.3 53.7
Dunaliella salina 16-44 46.0
Nannochloropsis oculata NCTU-3 30.8-50.4 142
Nannochloropsis oculata 22.7-29.7 84-142
Neochloris oleoabundans 29-65 90-134
Scenedesmus quadricauda 1.9-18.4 35.1
Schizochytrium sp. 50-57 35.1
Tetraselmis suecica 8.5-23 27-36.4
Tetraselmis sp. 12.6-14.7 43.4
Diatoms
Chaetoceros muelleri 33.6 21.8
Chaetoceros calcitrans 14.6-39.8 17.6
Phaeodactylum tricornutum 18-57 44.8
Skeletonema sp. 13.3-31.8 27.3
Skeletonema costatum 13.5-51.3 17.4
Thalassiosira pseudonana 20.6 17.4
Eustigmatophyceae
Ellipsoidion sp. 27.4 47.3
Nannochloris sp. 20-56 60.9-76.5
Crop Oil yield
(l/ha)
Corn 172
Soybean 446
Canola 1190
Jatropha 1892
Coconut 2689
Oil palm 5950
Microalgae (a) 58,700
Microalgae (b) 136,900
Microalgae: biofuel options Biomethane & Bioethanol
14 8 November 2016
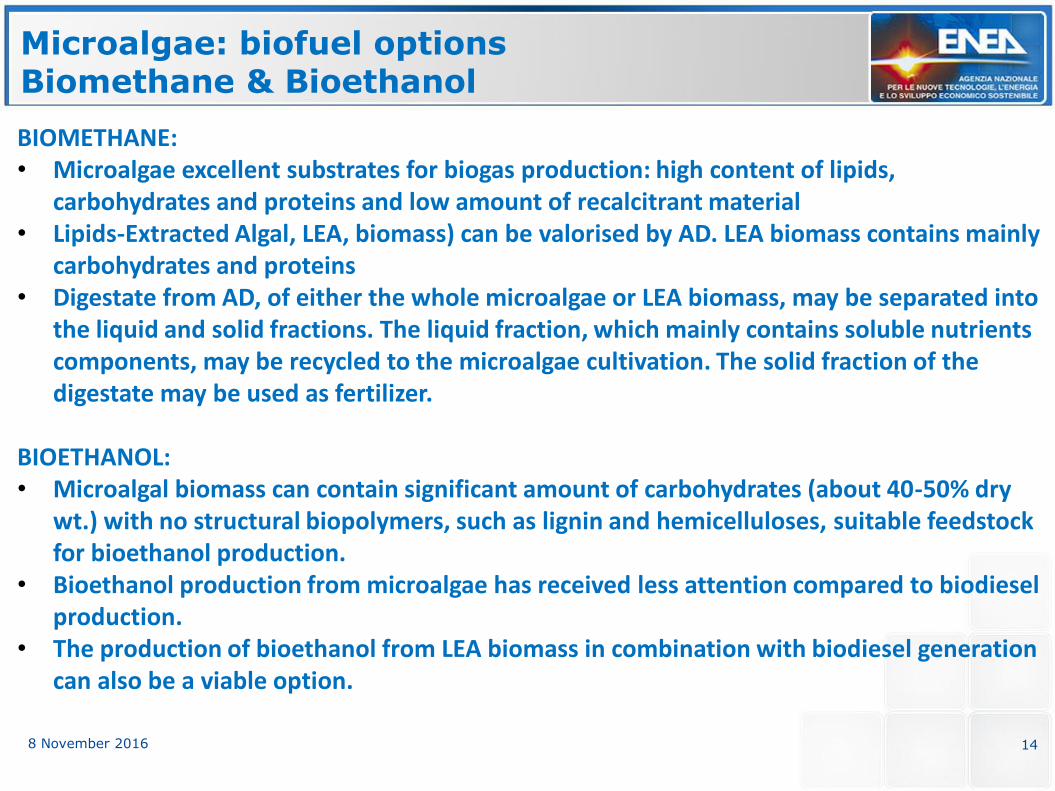
BIOMETHANE: • Microalgae excellent substrates for biogas production: high content of lipids,
carbohydrates and proteins and low amount of recalcitrant material • Lipids-Extracted Algal, LEA, biomass) can be valorised by AD. LEA biomass contains mainly
carbohydrates and proteins • Digestate from AD, of either the whole microalgae or LEA biomass, may be separated into
the liquid and solid fractions. The liquid fraction, which mainly contains soluble nutrients components, may be recycled to the microalgae cultivation. The solid fraction of the digestate may be used as fertilizer.
BIOETHANOL: • Microalgal biomass can contain significant amount of carbohydrates (about 40-50% dry
wt.) with no structural biopolymers, such as lignin and hemicelluloses, suitable feedstock for bioethanol production.
• Bioethanol production from microalgae has received less attention compared to biodiesel production.
• The production of bioethanol from LEA biomass in combination with biodiesel generation can also be a viable option.
Microalgae: biofuel options: biohydrogen and bio-oil
15 8 November 2016
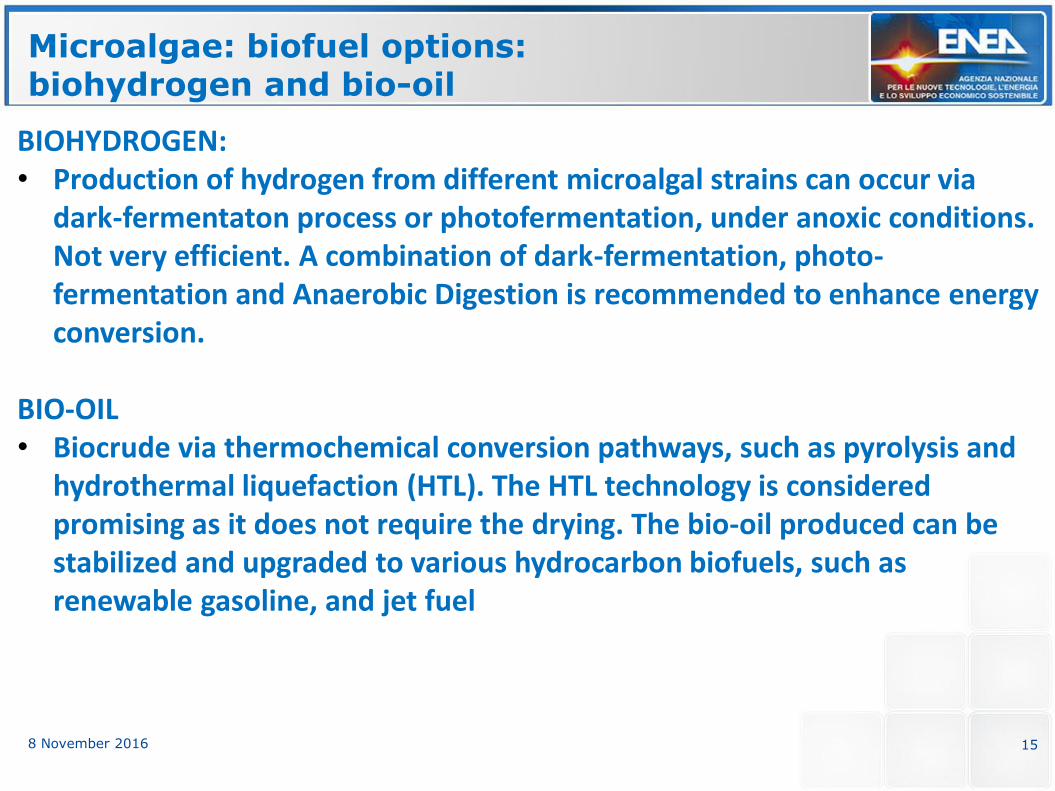
BIOHYDROGEN: • Production of hydrogen from different microalgal strains can occur via
dark-fermentaton process or photofermentation, under anoxic conditions. Not very efficient. A combination of dark-fermentation, photo-fermentation and Anaerobic Digestion is recommended to enhance energy conversion.
BIO-OIL • Biocrude via thermochemical conversion pathways, such as pyrolysis and
hydrothermal liquefaction (HTL). The HTL technology is considered promising as it does not require the drying. The bio-oil produced can be stabilized and upgraded to various hydrocarbon biofuels, such as renewable gasoline, and jet fuel
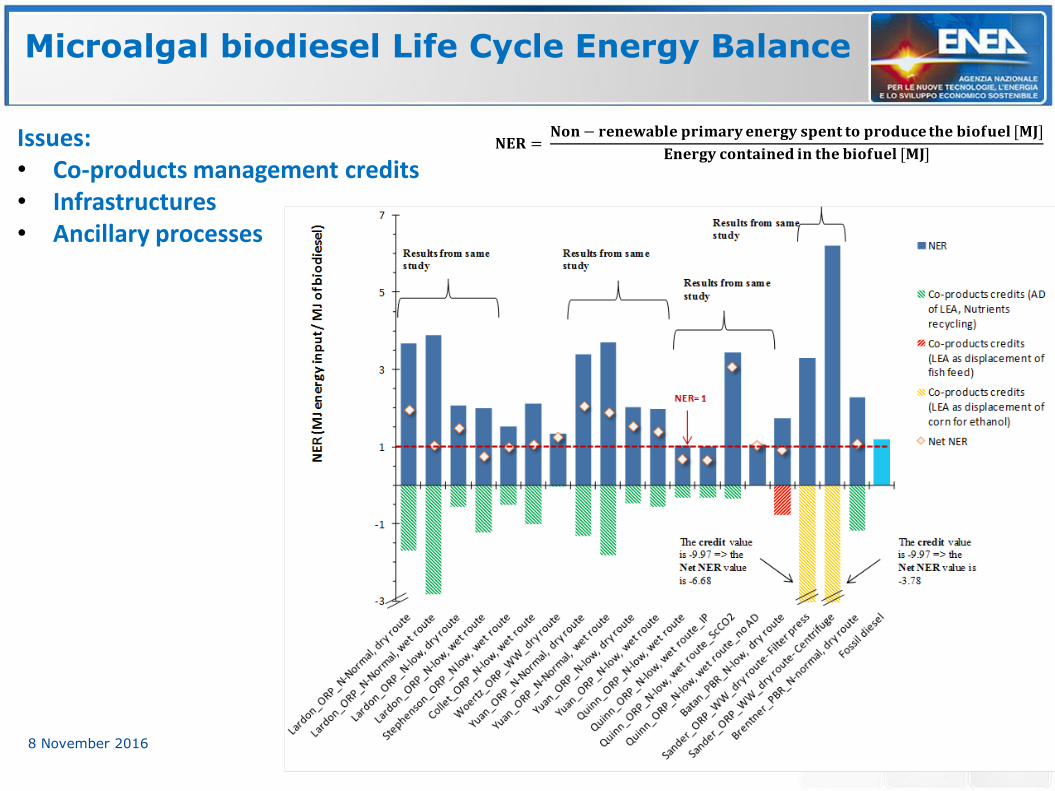
Microalgal biodiesel Life Cycle Energy Balance
16 8 November 2016
Issues: • Co-products management credits • Infrastructures • Ancillary processes
𝐍𝐄𝐑 = 𝐍𝐨𝐧− 𝐫𝐞𝐧𝐞𝐰𝐚𝐛𝐥𝐞 𝐩𝐫𝐢𝐦𝐚𝐫𝐲 𝐞𝐧𝐞𝐫𝐠𝐲 𝐬𝐩𝐞𝐧𝐭 𝐭𝐨 𝐩𝐫𝐨𝐝𝐮𝐜𝐞 𝐭𝐡𝐞 𝐛𝐢𝐨𝐟𝐮𝐞𝐥 [𝐌𝐉]
𝐄𝐧𝐞𝐫𝐠𝐲 𝐜𝐨𝐧𝐭𝐚𝐢𝐧𝐞𝐝 𝐢𝐧 𝐭𝐡𝐞 𝐛𝐢𝐨𝐟𝐮𝐞𝐥 [𝐌𝐉]
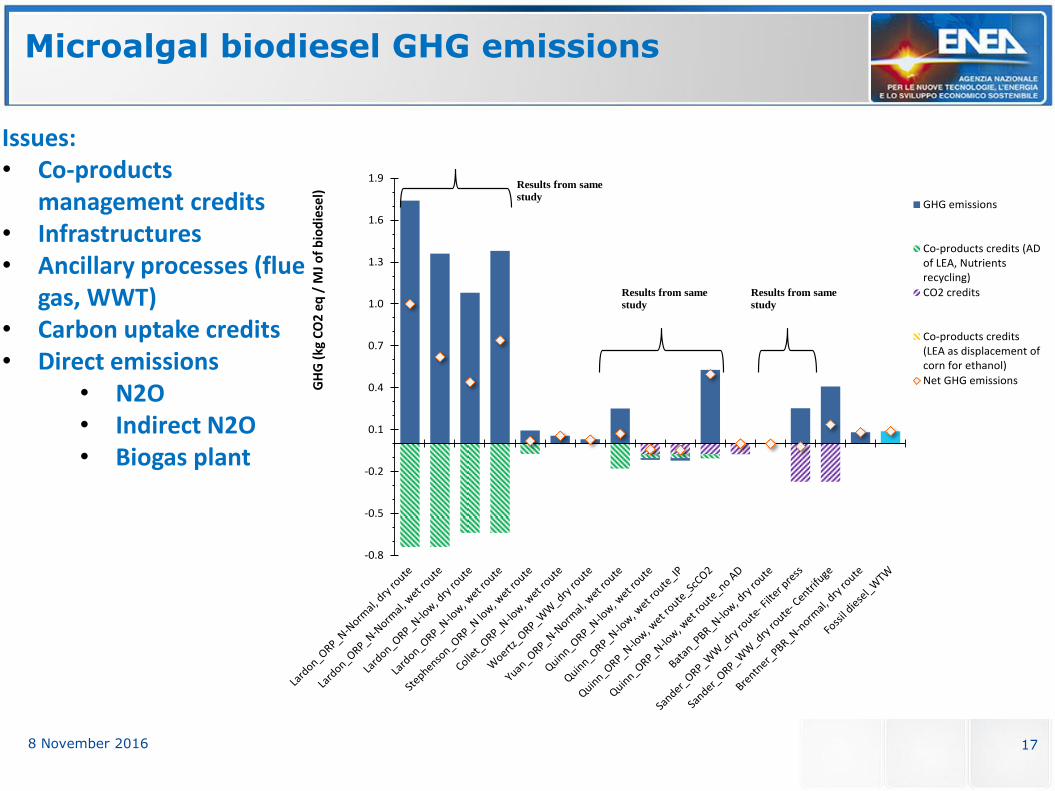
Microalgal biodiesel GHG emissions
17 8 November 2016
-0.8
-0.5
-0.2
0.1
0.4
0.7
1.0
1.3
1.6
1.9
GH
G (
kg C
O2
eq /
MJ
of
bio
die
sel)
GHG emissions
Co-products credits (ADof LEA, Nutrientsrecycling)
CO2 credits
Co-products credits(LEA as displacement ofcorn for ethanol)
Net GHG emissions
Results from same
study
Results from same
study
Results from same
study
Issues: • Co-products
management credits • Infrastructures • Ancillary processes (flue
gas, WWT) • Carbon uptake credits • Direct emissions
• N2O • Indirect N2O • Biogas plant
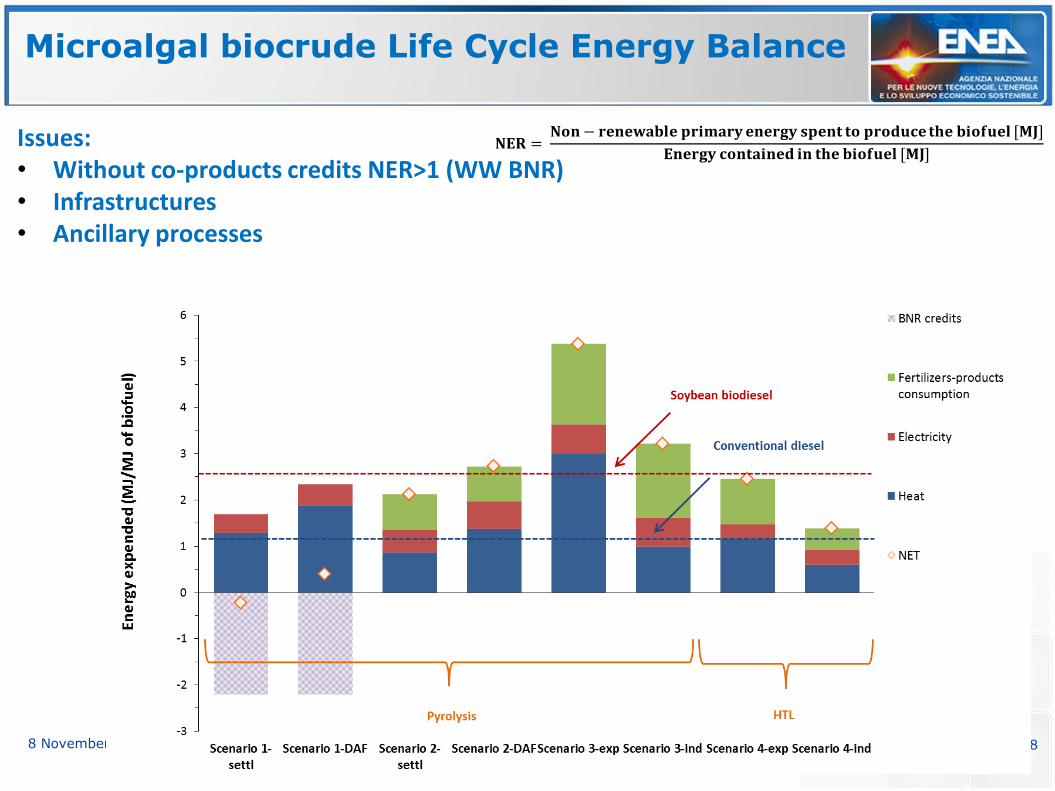
Microalgal biocrude Life Cycle Energy Balance
18 8 November 2016
Issues: • Without co-products credits NER>1 (WW BNR) • Infrastructures • Ancillary processes
𝐍𝐄𝐑 = 𝐍𝐨𝐧− 𝐫𝐞𝐧𝐞𝐰𝐚𝐛𝐥𝐞 𝐩𝐫𝐢𝐦𝐚𝐫𝐲 𝐞𝐧𝐞𝐫𝐠𝐲 𝐬𝐩𝐞𝐧𝐭 𝐭𝐨 𝐩𝐫𝐨𝐝𝐮𝐜𝐞 𝐭𝐡𝐞 𝐛𝐢𝐨𝐟𝐮𝐞𝐥 [𝐌𝐉]
𝐄𝐧𝐞𝐫𝐠𝐲 𝐜𝐨𝐧𝐭𝐚𝐢𝐧𝐞𝐝 𝐢𝐧 𝐭𝐡𝐞 𝐛𝐢𝐨𝐟𝐮𝐞𝐥 [𝐌𝐉]
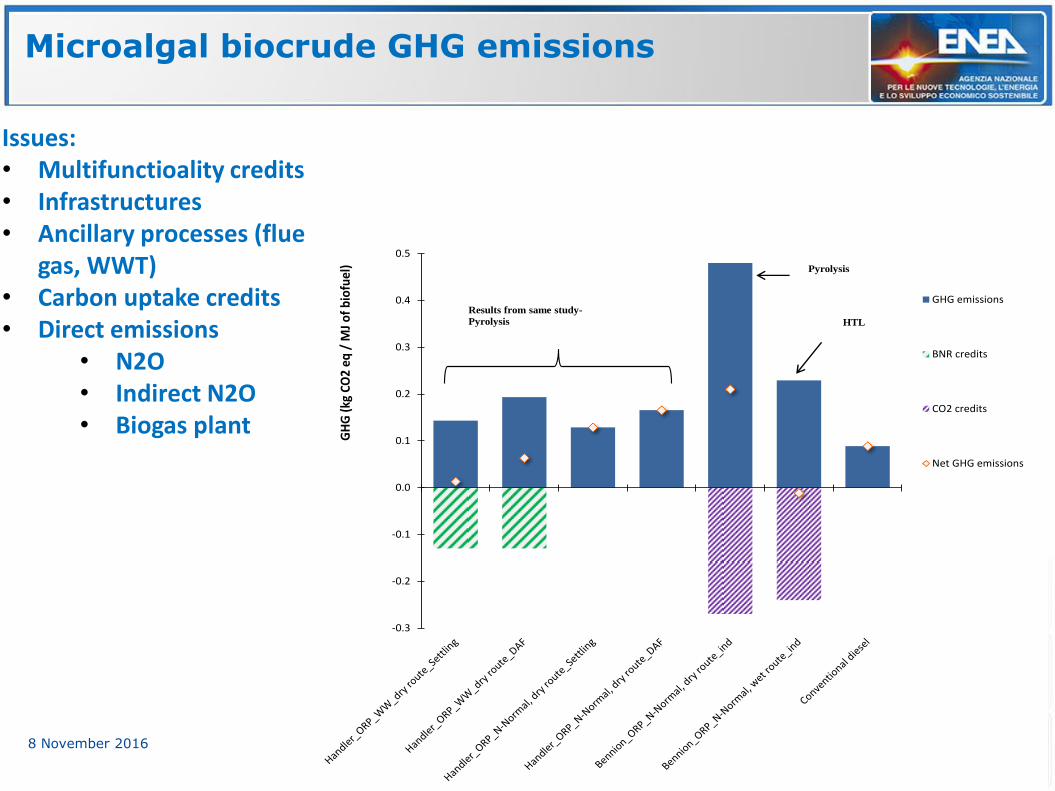
Microalgal biocrude GHG emissions
19 8 November 2016
Issues: • Multifunctioality credits • Infrastructures • Ancillary processes (flue
gas, WWT) • Carbon uptake credits • Direct emissions
• N2O • Indirect N2O • Biogas plant
-0.3
-0.2
-0.1
0.0
0.1
0.2
0.3
0.4
0.5
GH
G (
kg C
O2
eq /
MJ
of
bio
fuel
)
GHG emissions
BNR credits
CO2 credits
Net GHG emissions
Pyrolysis
Results from same study-
Pyrolysis HTL
Remarks on LCA studies
20 8 November 2016
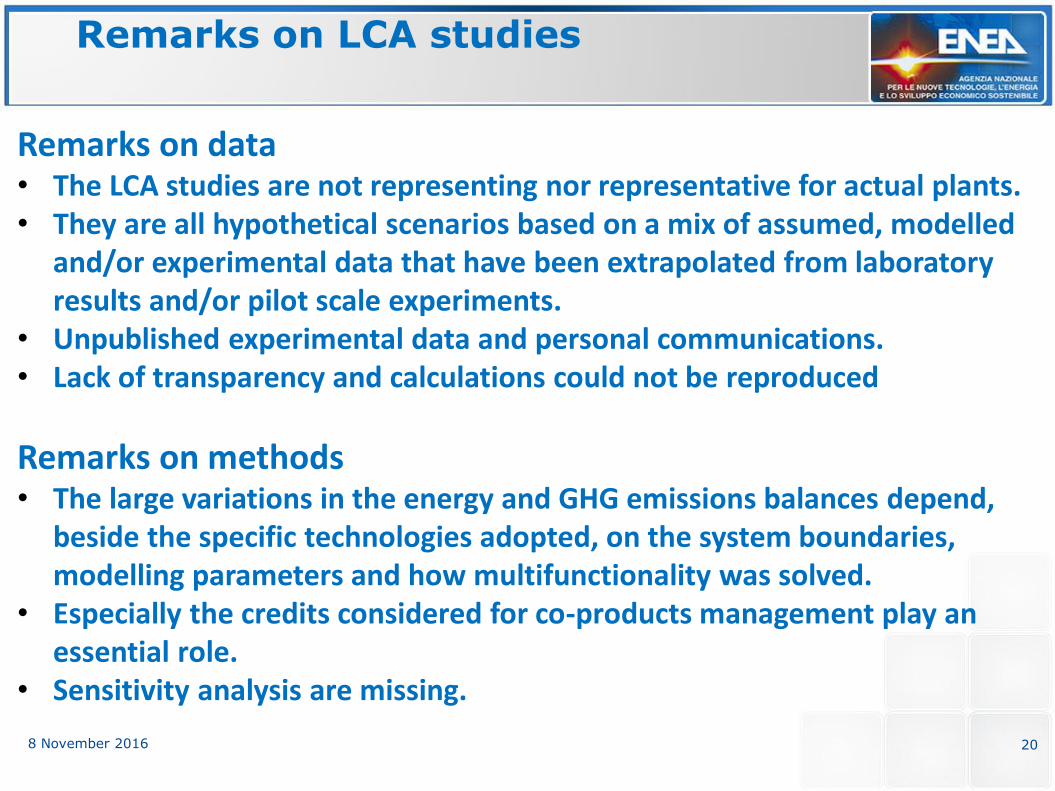
Remarks on data • The LCA studies are not representing nor representative for actual plants. • They are all hypothetical scenarios based on a mix of assumed, modelled
and/or experimental data that have been extrapolated from laboratory results and/or pilot scale experiments.
• Unpublished experimental data and personal communications. • Lack of transparency and calculations could not be reproduced
Remarks on methods • The large variations in the energy and GHG emissions balances depend,
beside the specific technologies adopted, on the system boundaries, modelling parameters and how multifunctionality was solved.
• Especially the credits considered for co-products management play an essential role.
• Sensitivity analysis are missing.
Conclusions
21 8 November 2016
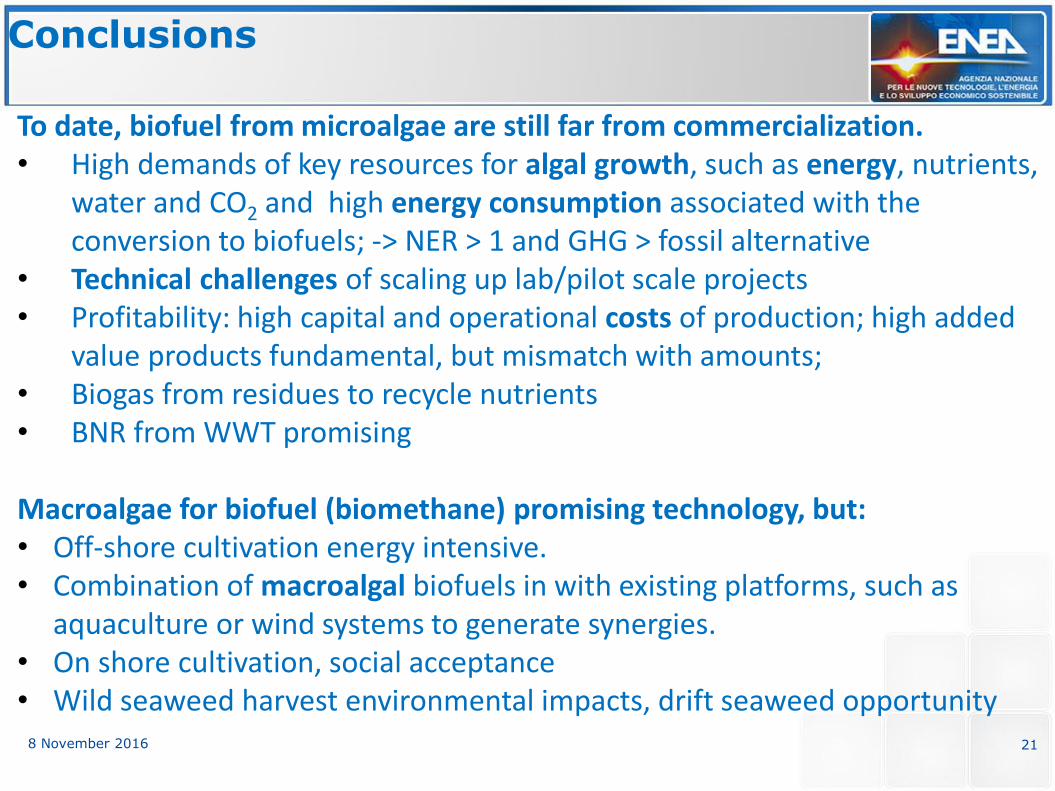
To date, biofuel from microalgae are still far from commercialization. • High demands of key resources for algal growth, such as energy, nutrients,
water and CO2 and high energy consumption associated with the conversion to biofuels; -> NER > 1 and GHG > fossil alternative
• Technical challenges of scaling up lab/pilot scale projects • Profitability: high capital and operational costs of production; high added
value products fundamental, but mismatch with amounts; • Biogas from residues to recycle nutrients • BNR from WWT promising
Macroalgae for biofuel (biomethane) promising technology, but: • Off-shore cultivation energy intensive. • Combination of macroalgal biofuels in with existing platforms, such as
aquaculture or wind systems to generate synergies. • On shore cultivation, social acceptance • Wild seaweed harvest environmental impacts, drift seaweed opportunity
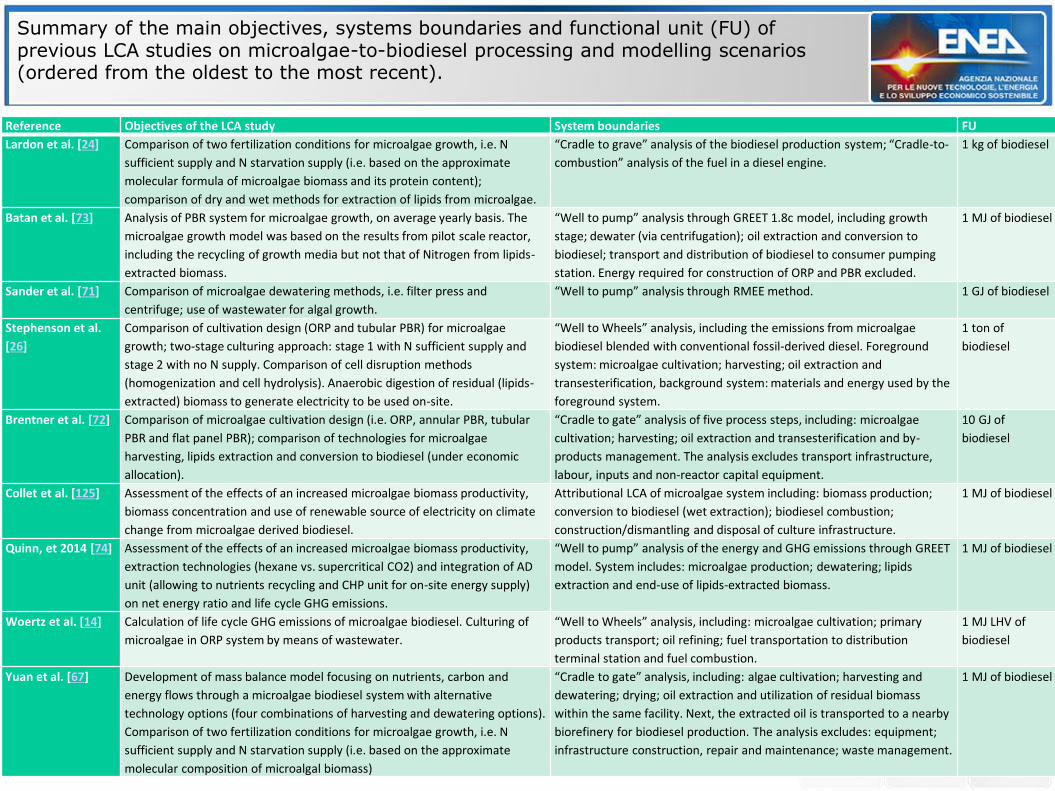
Reference Objectives of the LCA study System boundaries FU
Lardon et al. [24] Comparison of two fertilization conditions for microalgae growth, i.e. N
sufficient supply and N starvation supply (i.e. based on the approximate
molecular formula of microalgae biomass and its protein content);
comparison of dry and wet methods for extraction of lipids from microalgae.
“Cradle to grave” analysis of the biodiesel production system; “Cradle-to-
combustion” analysis of the fuel in a diesel engine.
1 kg of biodiesel
Batan et al. [73] Analysis of PBR system for microalgae growth, on average yearly basis. The
microalgae growth model was based on the results from pilot scale reactor,
including the recycling of growth media but not that of Nitrogen from lipids-
extracted biomass.
“Well to pump” analysis through GREET 1.8c model, including growth
stage; dewater (via centrifugation); oil extraction and conversion to
biodiesel; transport and distribution of biodiesel to consumer pumping
station. Energy required for construction of ORP and PBR excluded.
1 MJ of biodiesel
Sander et al. [71] Comparison of microalgae dewatering methods, i.e. filter press and
centrifuge; use of wastewater for algal growth.
“Well to pump” analysis through RMEE method. 1 GJ of biodiesel
Stephenson et al.
[26]
Comparison of cultivation design (ORP and tubular PBR) for microalgae
growth; two-stage culturing approach: stage 1 with N sufficient supply and
stage 2 with no N supply. Comparison of cell disruption methods
(homogenization and cell hydrolysis). Anaerobic digestion of residual (lipids-
extracted) biomass to generate electricity to be used on-site.
“Well to Wheels” analysis, including the emissions from microalgae
biodiesel blended with conventional fossil-derived diesel. Foreground
system: microalgae cultivation; harvesting; oil extraction and
transesterification, background system: materials and energy used by the
foreground system.
1 ton of
biodiesel
Brentner et al. [72] Comparison of microalgae cultivation design (i.e. ORP, annular PBR, tubular
PBR and flat panel PBR); comparison of technologies for microalgae
harvesting, lipids extraction and conversion to biodiesel (under economic
allocation).
“Cradle to gate” analysis of five process steps, including: microalgae
cultivation; harvesting; oil extraction and transesterification and by-
products management. The analysis excludes transport infrastructure,
labour, inputs and non-reactor capital equipment.
10 GJ of
biodiesel
Collet et al. [125] Assessment of the effects of an increased microalgae biomass productivity,
biomass concentration and use of renewable source of electricity on climate
change from microalgae derived biodiesel.
Attributional LCA of microalgae system including: biomass production;
conversion to biodiesel (wet extraction); biodiesel combustion;
construction/dismantling and disposal of culture infrastructure.
1 MJ of biodiesel
Quinn, et 2014 [74] Assessment of the effects of an increased microalgae biomass productivity,
extraction technologies (hexane vs. supercritical CO2) and integration of AD
unit (allowing to nutrients recycling and CHP unit for on-site energy supply)
on net energy ratio and life cycle GHG emissions.
“Well to pump” analysis of the energy and GHG emissions through GREET
model. System includes: microalgae production; dewatering; lipids
extraction and end-use of lipids-extracted biomass.
1 MJ of biodiesel
Woertz et al. [14] Calculation of life cycle GHG emissions of microalgae biodiesel. Culturing of
microalgae in ORP system by means of wastewater.
“Well to Wheels” analysis, including: microalgae cultivation; primary
products transport; oil refining; fuel transportation to distribution
terminal station and fuel combustion.
1 MJ LHV of
biodiesel
Yuan et al. [67] Development of mass balance model focusing on nutrients, carbon and
energy flows through a microalgae biodiesel system with alternative
technology options (four combinations of harvesting and dewatering options).
Comparison of two fertilization conditions for microalgae growth, i.e. N
sufficient supply and N starvation supply (i.e. based on the approximate
molecular composition of microalgal biomass)
“Cradle to gate” analysis, including: algae cultivation; harvesting and
dewatering; drying; oil extraction and utilization of residual biomass
within the same facility. Next, the extracted oil is transported to a nearby
biorefinery for biodiesel production. The analysis excludes: equipment;
infrastructure construction, repair and maintenance; waste management.
1 MJ of biodiesel
Summary of the main objectives, systems boundaries and functional unit (FU) of previous LCA studies on microalgae-to-biodiesel processing and modelling scenarios (ordered from the oldest to the most recent).
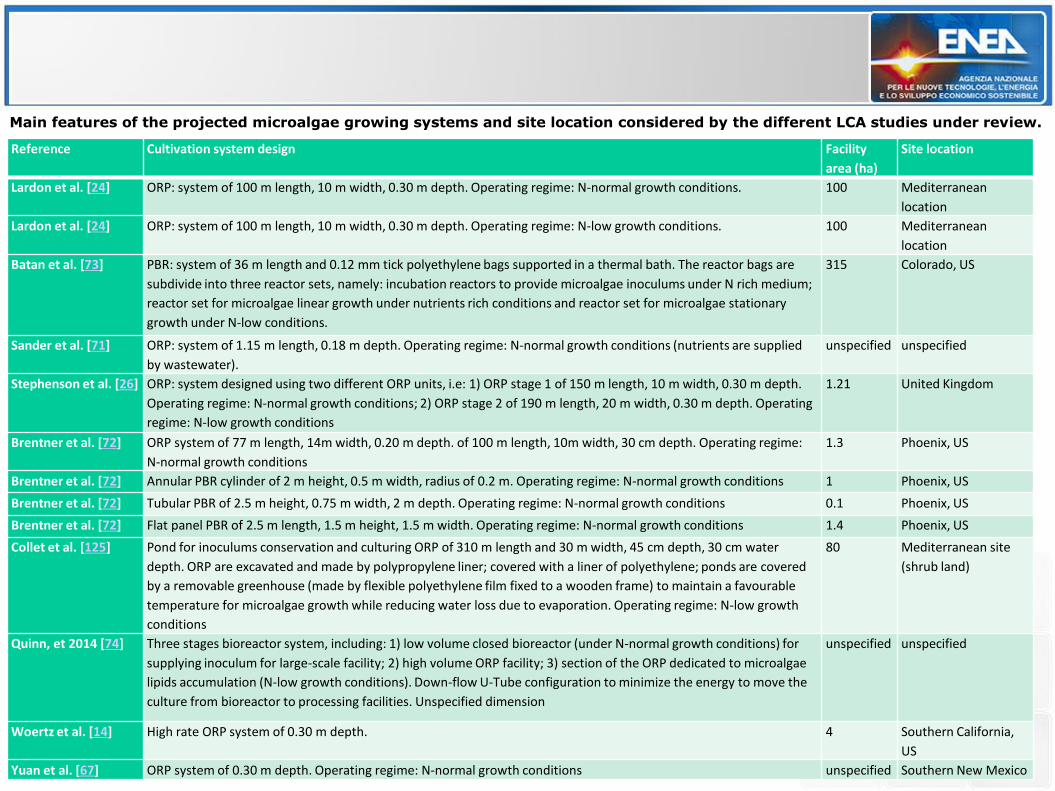
Reference Cultivation system design Facility
area (ha)
Site location
Lardon et al. [24] ORP: system of 100 m length, 10 m width, 0.30 m depth. Operating regime: N-normal growth conditions. 100 Mediterranean
location
Lardon et al. [24] ORP: system of 100 m length, 10 m width, 0.30 m depth. Operating regime: N-low growth conditions. 100 Mediterranean
location
Batan et al. [73] PBR: system of 36 m length and 0.12 mm tick polyethylene bags supported in a thermal bath. The reactor bags are
subdivide into three reactor sets, namely: incubation reactors to provide microalgae inoculums under N rich medium;
reactor set for microalgae linear growth under nutrients rich conditions and reactor set for microalgae stationary
growth under N-low conditions.
315 Colorado, US
Sander et al. [71] ORP: system of 1.15 m length, 0.18 m depth. Operating regime: N-normal growth conditions (nutrients are supplied
by wastewater).
unspecified unspecified
Stephenson et al. [26] ORP: system designed using two different ORP units, i.e: 1) ORP stage 1 of 150 m length, 10 m width, 0.30 m depth.
Operating regime: N-normal growth conditions; 2) ORP stage 2 of 190 m length, 20 m width, 0.30 m depth. Operating
regime: N-low growth conditions
1.21 United Kingdom
Brentner et al. [72] ORP system of 77 m length, 14m width, 0.20 m depth. of 100 m length, 10m width, 30 cm depth. Operating regime:
N-normal growth conditions
1.3 Phoenix, US
Brentner et al. [72] Annular PBR cylinder of 2 m height, 0.5 m width, radius of 0.2 m. Operating regime: N-normal growth conditions 1 Phoenix, US
Brentner et al. [72] Tubular PBR of 2.5 m height, 0.75 m width, 2 m depth. Operating regime: N-normal growth conditions 0.1 Phoenix, US
Brentner et al. [72] Flat panel PBR of 2.5 m length, 1.5 m height, 1.5 m width. Operating regime: N-normal growth conditions 1.4 Phoenix, US
Collet et al. [125] Pond for inoculums conservation and culturing ORP of 310 m length and 30 m width, 45 cm depth, 30 cm water
depth. ORP are excavated and made by polypropylene liner; covered with a liner of polyethylene; ponds are covered
by a removable greenhouse (made by flexible polyethylene film fixed to a wooden frame) to maintain a favourable
temperature for microalgae growth while reducing water loss due to evaporation. Operating regime: N-low growth
conditions
80 Mediterranean site
(shrub land)
Quinn, et 2014 [74] Three stages bioreactor system, including: 1) low volume closed bioreactor (under N-normal growth conditions) for
supplying inoculum for large-scale facility; 2) high volume ORP facility; 3) section of the ORP dedicated to microalgae
lipids accumulation (N-low growth conditions). Down-flow U-Tube configuration to minimize the energy to move the
culture from bioreactor to processing facilities. Unspecified dimension
unspecified unspecified
Woertz et al. [14] High rate ORP system of 0.30 m depth. 4 Southern California,
US
Yuan et al. [67] ORP system of 0.30 m depth. Operating regime: N-normal growth conditions unspecified Southern New Mexico
Main features of the projected microalgae growing systems and site location considered by the different LCA studies under review.
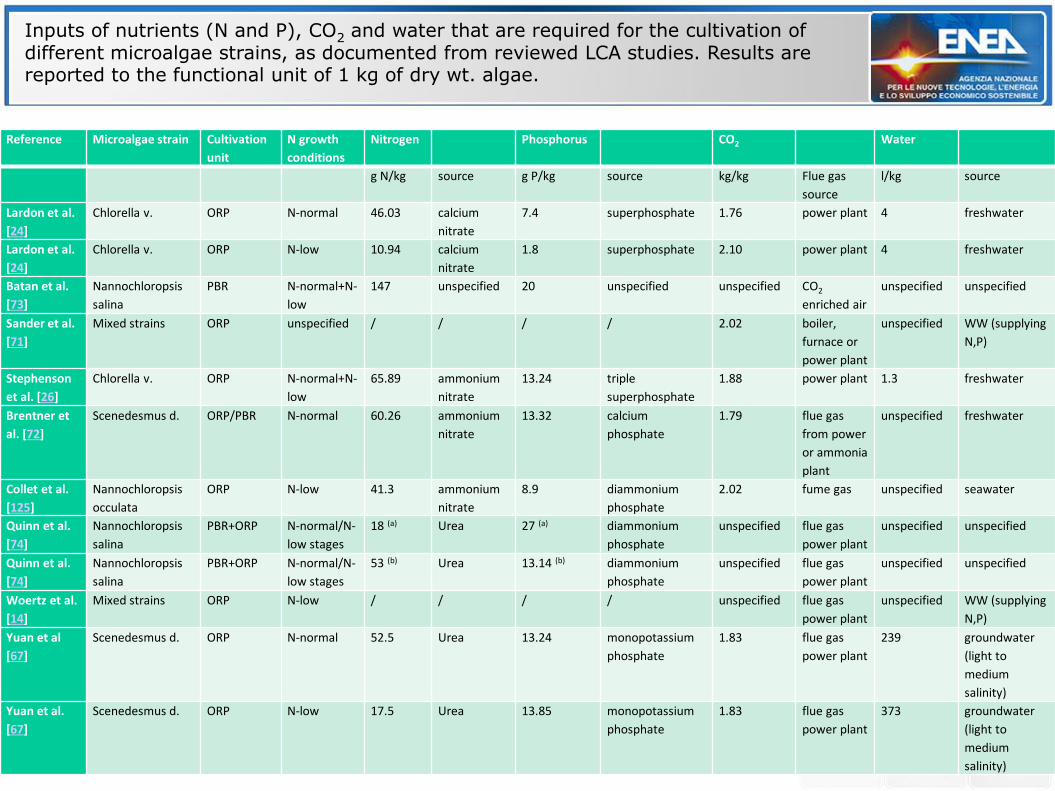
Reference Microalgae strain Cultivation
unit
N growth
conditions
Nitrogen Phosphorus CO2 Water
g N/kg source g P/kg source kg/kg Flue gas
source
l/kg source
Lardon et al.
[24]
Chlorella v. ORP N-normal 46.03 calcium
nitrate
7.4 superphosphate 1.76 power plant 4 freshwater
Lardon et al.
[24]
Chlorella v. ORP N-low 10.94 calcium
nitrate
1.8 superphosphate 2.10 power plant 4 freshwater
Batan et al.
[73]
Nannochloropsis
salina
PBR N-normal+N-
low
147 unspecified 20 unspecified unspecified CO2
enriched air
unspecified unspecified
Sander et al.
[71]
Mixed strains ORP unspecified / / / / 2.02 boiler,
furnace or
power plant
unspecified WW (supplying
N,P)
Stephenson
et al. [26]
Chlorella v. ORP N-normal+N-
low
65.89 ammonium
nitrate
13.24 triple
superphosphate
1.88 power plant 1.3 freshwater
Brentner et
al. [72]
Scenedesmus d. ORP/PBR N-normal 60.26 ammonium
nitrate
13.32 calcium
phosphate
1.79 flue gas
from power
or ammonia
plant
unspecified freshwater
Collet et al.
[125]
Nannochloropsis
occulata
ORP N-low 41.3 ammonium
nitrate
8.9 diammonium
phosphate
2.02 fume gas unspecified seawater
Quinn et al.
[74]
Nannochloropsis
salina
PBR+ORP N-normal/N-
low stages
18 (a) Urea 27 (a) diammonium
phosphate
unspecified flue gas
power plant
unspecified unspecified
Quinn et al.
[74]
Nannochloropsis
salina
PBR+ORP N-normal/N-
low stages
53 (b) Urea 13.14 (b) diammonium
phosphate
unspecified flue gas
power plant
unspecified unspecified
Woertz et al.
[14]
Mixed strains ORP N-low / / / / unspecified flue gas
power plant
unspecified WW (supplying
N,P)
Yuan et al
[67]
Scenedesmus d. ORP N-normal 52.5 Urea 13.24 monopotassium
phosphate
1.83 flue gas
power plant
239 groundwater
(light to
medium
salinity)
Yuan et al.
[67]
Scenedesmus d. ORP N-low 17.5 Urea 13.85 monopotassium
phosphate
1.83 flue gas
power plant
373 groundwater
(light to
medium
salinity)
Inputs of nutrients (N and P), CO2 and water that are required for the cultivation of different microalgae strains, as documented from reviewed LCA studies. Results are reported to the functional unit of 1 kg of dry wt. algae.
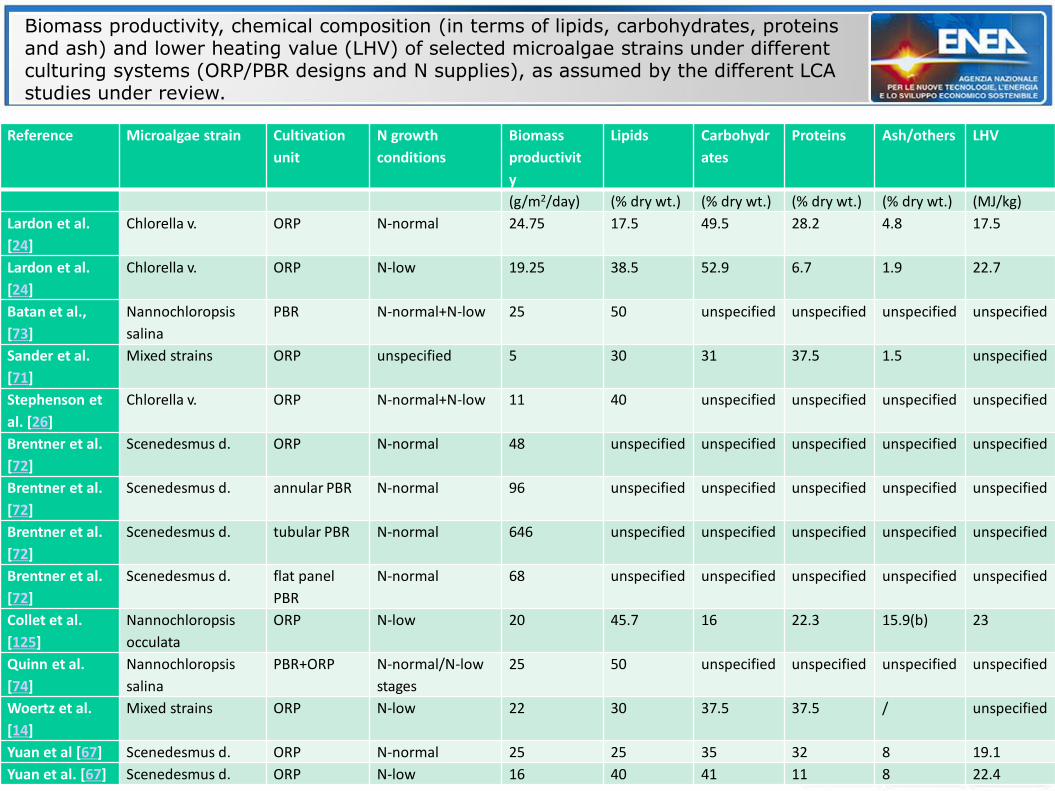
Biomass productivity, chemical composition (in terms of lipids, carbohydrates, proteins and ash) and lower heating value (LHV) of selected microalgae strains under different culturing systems (ORP/PBR designs and N supplies), as assumed by the different LCA studies under review.
Reference Microalgae strain Cultivation
unit
N growth
conditions
Biomass
productivit
y
Lipids Carbohydr
ates
Proteins Ash/others LHV
(g/m2/day) (% dry wt.) (% dry wt.) (% dry wt.) (% dry wt.) (MJ/kg)
Lardon et al.
[24]
Chlorella v. ORP N-normal 24.75 17.5 49.5 28.2 4.8 17.5
Lardon et al.
[24]
Chlorella v. ORP N-low 19.25 38.5 52.9 6.7 1.9 22.7
Batan et al.,
[73]
Nannochloropsis
salina
PBR N-normal+N-low 25 50 unspecified unspecified unspecified unspecified
Sander et al.
[71]
Mixed strains ORP unspecified 5 30 31 37.5 1.5 unspecified
Stephenson et
al. [26]
Chlorella v. ORP N-normal+N-low 11 40 unspecified unspecified unspecified unspecified
Brentner et al.
[72]
Scenedesmus d. ORP N-normal 48 unspecified unspecified unspecified unspecified unspecified
Brentner et al.
[72]
Scenedesmus d. annular PBR N-normal 96 unspecified unspecified unspecified unspecified unspecified
Brentner et al.
[72]
Scenedesmus d. tubular PBR N-normal 646 unspecified unspecified unspecified unspecified unspecified
Brentner et al.
[72]
Scenedesmus d. flat panel
PBR
N-normal 68 unspecified unspecified unspecified unspecified unspecified
Collet et al.
[125]
Nannochloropsis
occulata
ORP N-low 20 45.7 16 22.3 15.9(b) 23
Quinn et al.
[74]
Nannochloropsis
salina
PBR+ORP N-normal/N-low
stages
25 50 unspecified unspecified unspecified unspecified
Woertz et al.
[14]
Mixed strains ORP N-low 22 30 37.5 37.5 / unspecified
Yuan et al [67] Scenedesmus d. ORP N-normal 25 25 35 32 8 19.1
Yuan et al. [67] Scenedesmus d. ORP N-low 16 40 41 11 8 22.4
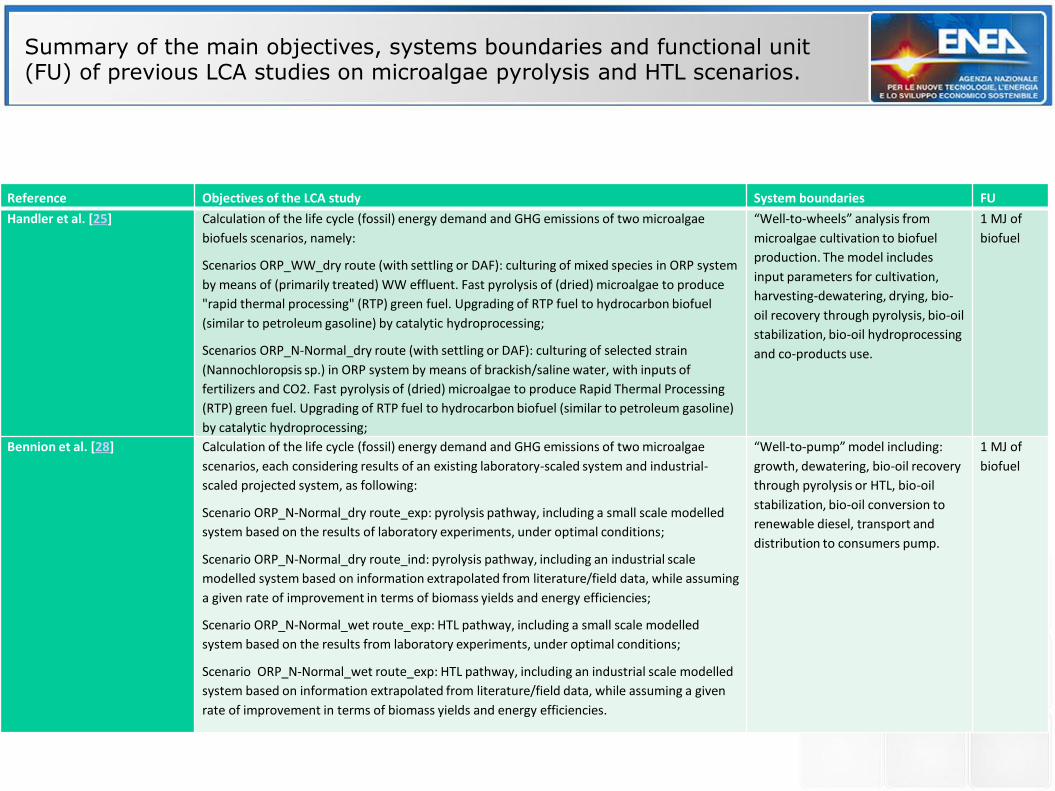
Summary of the main objectives, systems boundaries and functional unit (FU) of previous LCA studies on microalgae pyrolysis and HTL scenarios.
Reference Objectives of the LCA study System boundaries FU
Handler et al. [25] Calculation of the life cycle (fossil) energy demand and GHG emissions of two microalgae
biofuels scenarios, namely:
Scenarios ORP_WW_dry route (with settling or DAF): culturing of mixed species in ORP system
by means of (primarily treated) WW effluent. Fast pyrolysis of (dried) microalgae to produce
"rapid thermal processing" (RTP) green fuel. Upgrading of RTP fuel to hydrocarbon biofuel
(similar to petroleum gasoline) by catalytic hydroprocessing;
Scenarios ORP_N-Normal_dry route (with settling or DAF): culturing of selected strain
(Nannochloropsis sp.) in ORP system by means of brackish/saline water, with inputs of
fertilizers and CO2. Fast pyrolysis of (dried) microalgae to produce Rapid Thermal Processing
(RTP) green fuel. Upgrading of RTP fuel to hydrocarbon biofuel (similar to petroleum gasoline)
by catalytic hydroprocessing;
“Well-to-wheels” analysis from
microalgae cultivation to biofuel
production. The model includes
input parameters for cultivation,
harvesting-dewatering, drying, bio-
oil recovery through pyrolysis, bio-oil
stabilization, bio-oil hydroprocessing
and co-products use.
1 MJ of
biofuel
Bennion et al. [28] Calculation of the life cycle (fossil) energy demand and GHG emissions of two microalgae
scenarios, each considering results of an existing laboratory-scaled system and industrial-
scaled projected system, as following:
Scenario ORP_N-Normal_dry route_exp: pyrolysis pathway, including a small scale modelled
system based on the results of laboratory experiments, under optimal conditions;
Scenario ORP_N-Normal_dry route_ind: pyrolysis pathway, including an industrial scale
modelled system based on information extrapolated from literature/field data, while assuming
a given rate of improvement in terms of biomass yields and energy efficiencies;
Scenario ORP_N-Normal_wet route_exp: HTL pathway, including a small scale modelled
system based on the results from laboratory experiments, under optimal conditions;
Scenario ORP_N-Normal_wet route_exp: HTL pathway, including an industrial scale modelled
system based on information extrapolated from literature/field data, while assuming a given
rate of improvement in terms of biomass yields and energy efficiencies.
“Well-to-pump” model including:
growth, dewatering, bio-oil recovery
through pyrolysis or HTL, bio-oil
stabilization, bio-oil conversion to
renewable diesel, transport and
distribution to consumers pump.
1 MJ of
biofuel
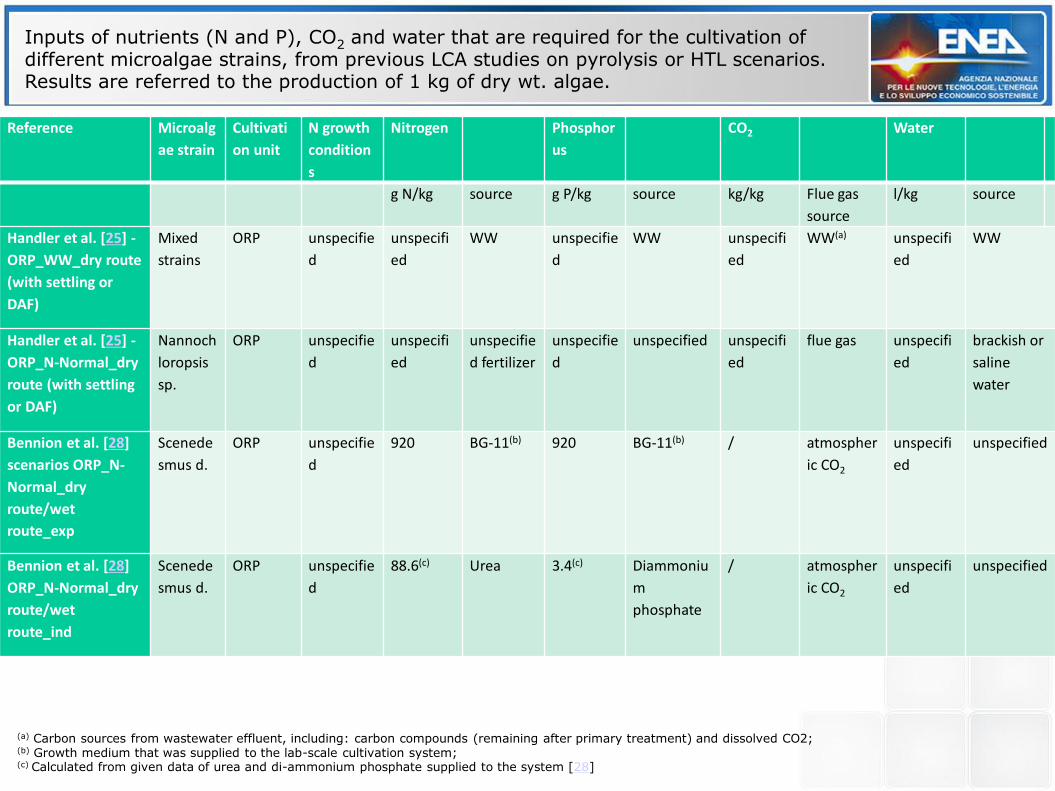
Inputs of nutrients (N and P), CO2 and water that are required for the cultivation of different microalgae strains, from previous LCA studies on pyrolysis or HTL scenarios. Results are referred to the production of 1 kg of dry wt. algae.
Reference Microalg
ae strain
Cultivati
on unit
N growth
condition
s
Nitrogen Phosphor
us
CO2 Water
g N/kg source g P/kg source kg/kg Flue gas
source
l/kg source
Handler et al. [25] -
ORP_WW_dry route
(with settling or
DAF)
Mixed
strains
ORP unspecifie
d
unspecifi
ed
WW unspecifie
d
WW unspecifi
ed
WW(a) unspecifi
ed
WW
Handler et al. [25] -
ORP_N-Normal_dry
route (with settling
or DAF)
Nannoch
loropsis
sp.
ORP unspecifie
d
unspecifi
ed
unspecifie
d fertilizer
unspecifie
d
unspecified unspecifi
ed
flue gas unspecifi
ed
brackish or
saline
water
Bennion et al. [28]
scenarios ORP_N-
Normal_dry
route/wet
route_exp
Scenede
smus d.
ORP unspecifie
d
920 BG-11(b) 920 BG-11(b) / atmospher
ic CO2
unspecifi
ed
unspecified
Bennion et al. [28]
ORP_N-Normal_dry
route/wet
route_ind
Scenede
smus d.
ORP unspecifie
d
88.6(c) Urea 3.4(c) Diammoniu
m
phosphate
/ atmospher
ic CO2
unspecifi
ed
unspecified
(a) Carbon sources from wastewater effluent, including: carbon compounds (remaining after primary treatment) and dissolved CO2; (b) Growth medium that was supplied to the lab-scale cultivation system; (c) Calculated from given data of urea and di-ammonium phosphate supplied to the system [28]
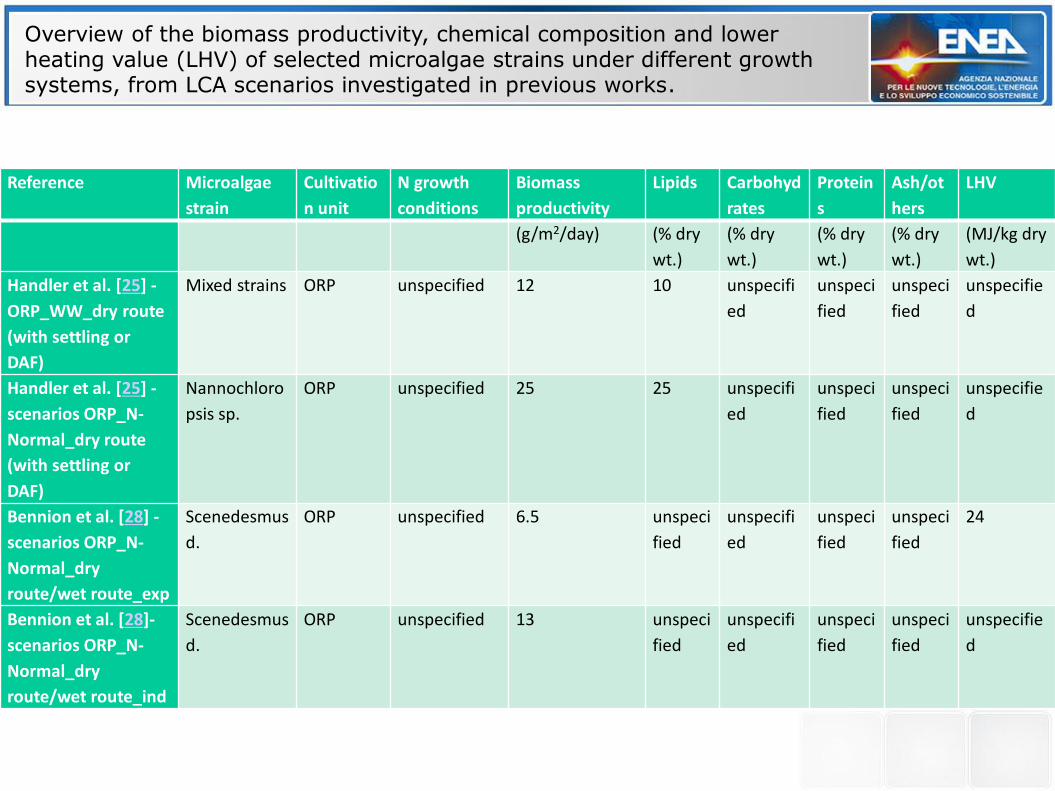
Overview of the biomass productivity, chemical composition and lower heating value (LHV) of selected microalgae strains under different growth systems, from LCA scenarios investigated in previous works.
Reference Microalgae
strain
Cultivatio
n unit
N growth
conditions
Biomass
productivity
Lipids Carbohyd
rates
Protein
s
Ash/ot
hers
LHV
(g/m2/day) (% dry
wt.)
(% dry
wt.)
(% dry
wt.)
(% dry
wt.)
(MJ/kg dry
wt.)
Handler et al. [25] -
ORP_WW_dry route
(with settling or
DAF)
Mixed strains ORP unspecified 12 10 unspecifi
ed
unspeci
fied
unspeci
fied
unspecifie
d
Handler et al. [25] -
scenarios ORP_N-
Normal_dry route
(with settling or
DAF)
Nannochloro
psis sp.
ORP unspecified 25 25 unspecifi
ed
unspeci
fied
unspeci
fied
unspecifie
d
Bennion et al. [28] -
scenarios ORP_N-
Normal_dry
route/wet route_exp
Scenedesmus
d.
ORP unspecified 6.5 unspeci
fied
unspecifi
ed
unspeci
fied
unspeci
fied
24
Bennion et al. [28]-
scenarios ORP_N-
Normal_dry
route/wet route_ind
Scenedesmus
d.
ORP unspecified 13 unspeci
fied
unspecifi
ed
unspeci
fied
unspeci
fied
unspecifie
d
-4.0
-3.0
-2.0
-1.0
0.0
1.0
2.0
3.0
4.0
5.0
Scenario 1 Scenario 2 Scenario 3 Scenario 4
Ene
rgy
exp
en
de
d (
MJ/
MJ
of
bio
die
sel) Fertlizer, P (P2O5)-credits Fertlizer, N-credits
Electricity-credits Heat-credits
Methanol Hexane
Fertlizer, P (P2O5) Fertlizer, N
Electricity Heat
NET
Soybean biodiesel
Conventional diesel
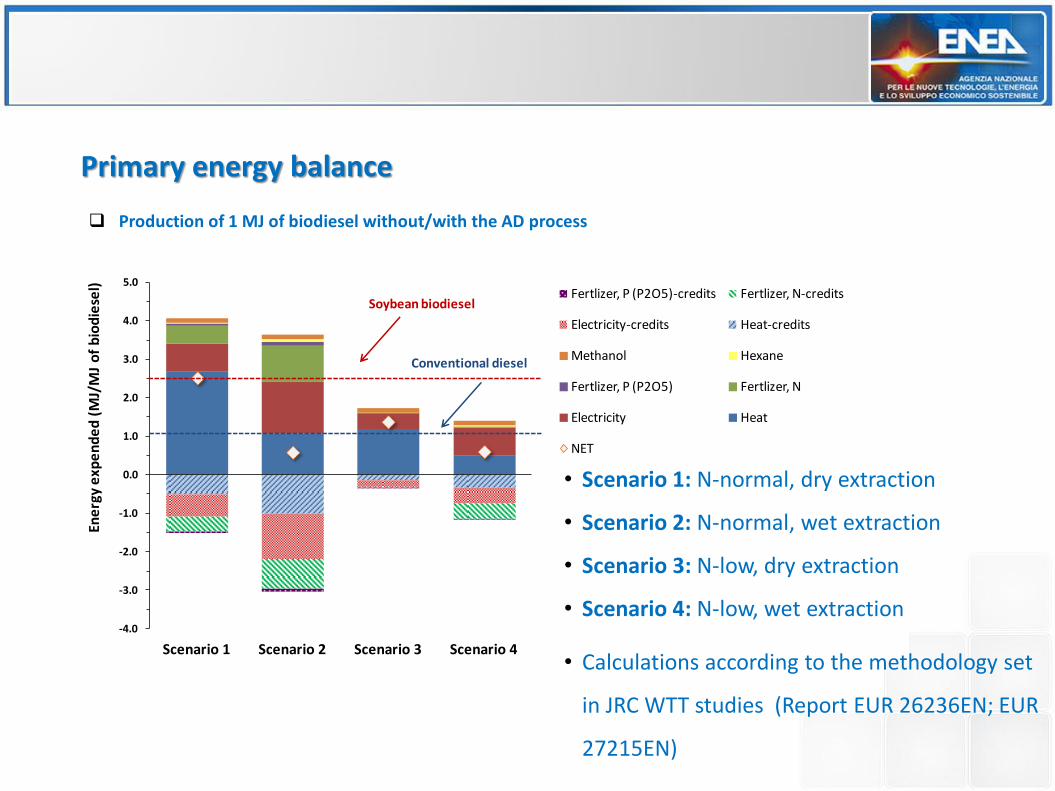
Primary energy balance
Production of 1 MJ of biodiesel without/with the AD process
• Calculations according to the methodology set
in JRC WTT studies (Report EUR 26236EN; EUR
27215EN)
• Scenario 1: N-normal, dry extraction
• Scenario 2: N-normal, wet extraction
• Scenario 3: N-low, dry extraction
• Scenario 4: N-low, wet extraction
-400
-300
-200
-100
0
100
200
300
400
500
Scenario 1 Scenario 2 Scenario 3 Scenario 4
GH
G e
mis
sio
ns
(g C
O2
eq
/MJ
of
bio
die
sel)
Fertilizers, P (P2O5)- credits Fertilizers, N- credits
Electricity- credits Heat- credits
Methanol Hexane
Fertilizers, P (P2O5) Fertilizers, N
Electricity Heat
NET
Soybean biodiesel
Conventional diesel
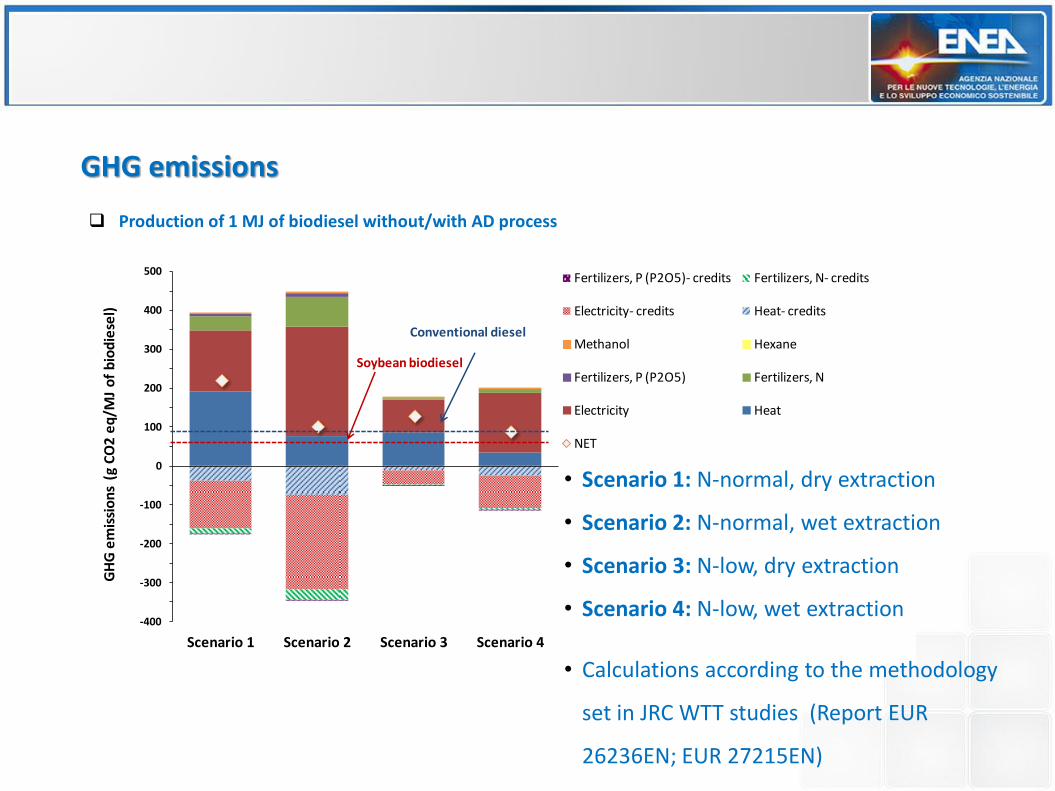
GHG emissions
Production of 1 MJ of biodiesel without/with AD process
• Calculations according to the methodology
set in JRC WTT studies (Report EUR
26236EN; EUR 27215EN)
• Scenario 1: N-normal, dry extraction
• Scenario 2: N-normal, wet extraction
• Scenario 3: N-low, dry extraction
• Scenario 4: N-low, wet extraction
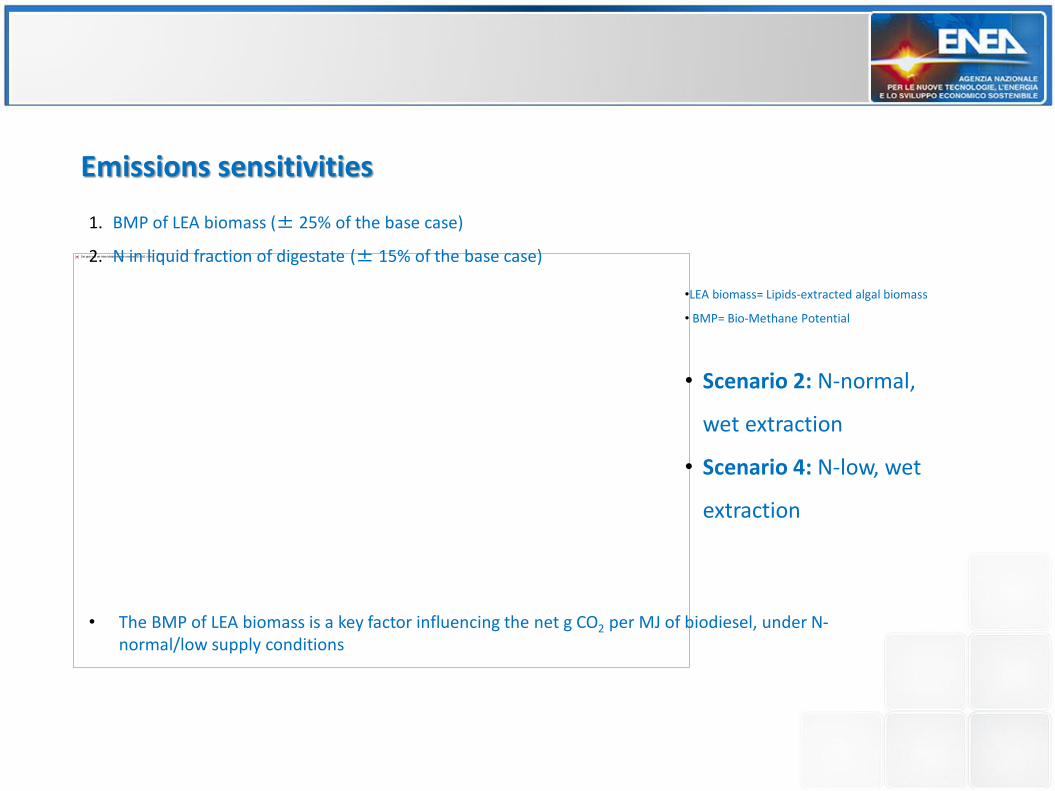
1. BMP of LEA biomass (± 25% of the base case)
2. N in liquid fraction of digestate (± 15% of the base case)
Emissions sensitivities
• The BMP of LEA biomass is a key factor influencing the net g CO2 per MJ of biodiesel, under N-normal/low supply conditions
• Scenario 2: N-normal,
wet extraction
• Scenario 4: N-low, wet
extraction
•LEA biomass= Lipids-extracted algal biomass
• BMP= Bio-Methane Potential
Macroalgae: Current applications and future perspectives
33 8 November 2016
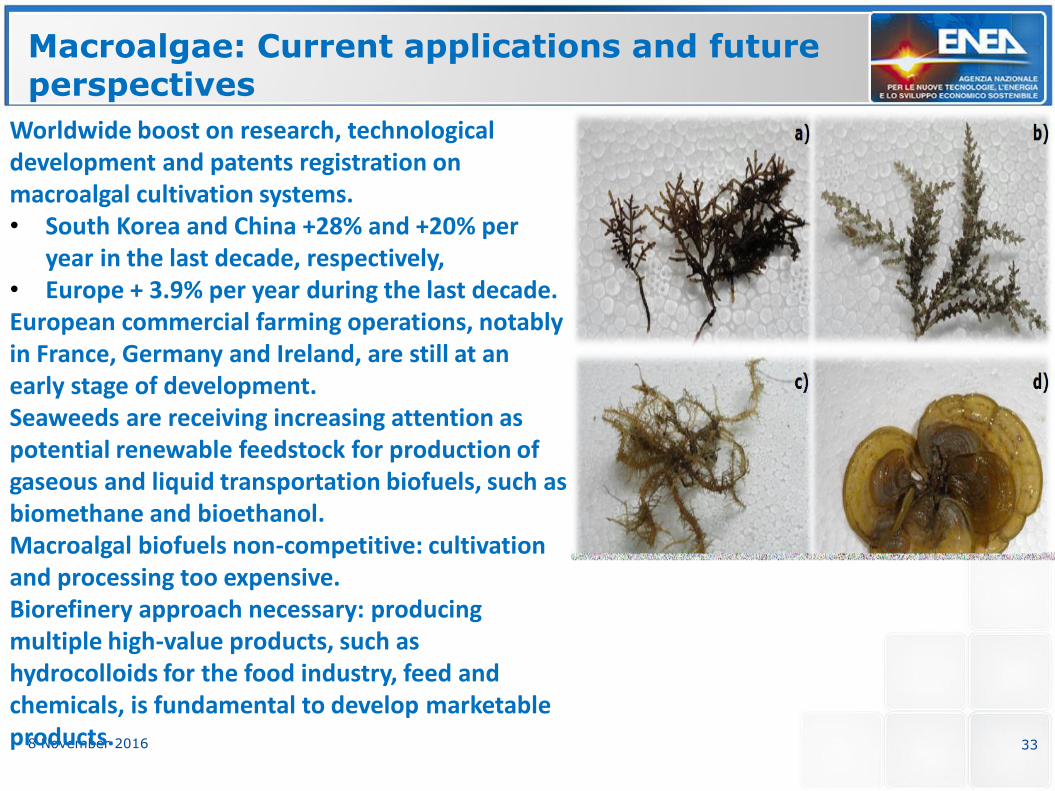
Worldwide boost on research, technological development and patents registration on macroalgal cultivation systems. • South Korea and China +28% and +20% per
year in the last decade, respectively, • Europe + 3.9% per year during the last decade. European commercial farming operations, notably in France, Germany and Ireland, are still at an early stage of development. Seaweeds are receiving increasing attention as potential renewable feedstock for production of gaseous and liquid transportation biofuels, such as biomethane and bioethanol. Macroalgal biofuels non-competitive: cultivation and processing too expensive. Biorefinery approach necessary: producing multiple high-value products, such as hydrocolloids for the food industry, feed and chemicals, is fundamental to develop marketable products.
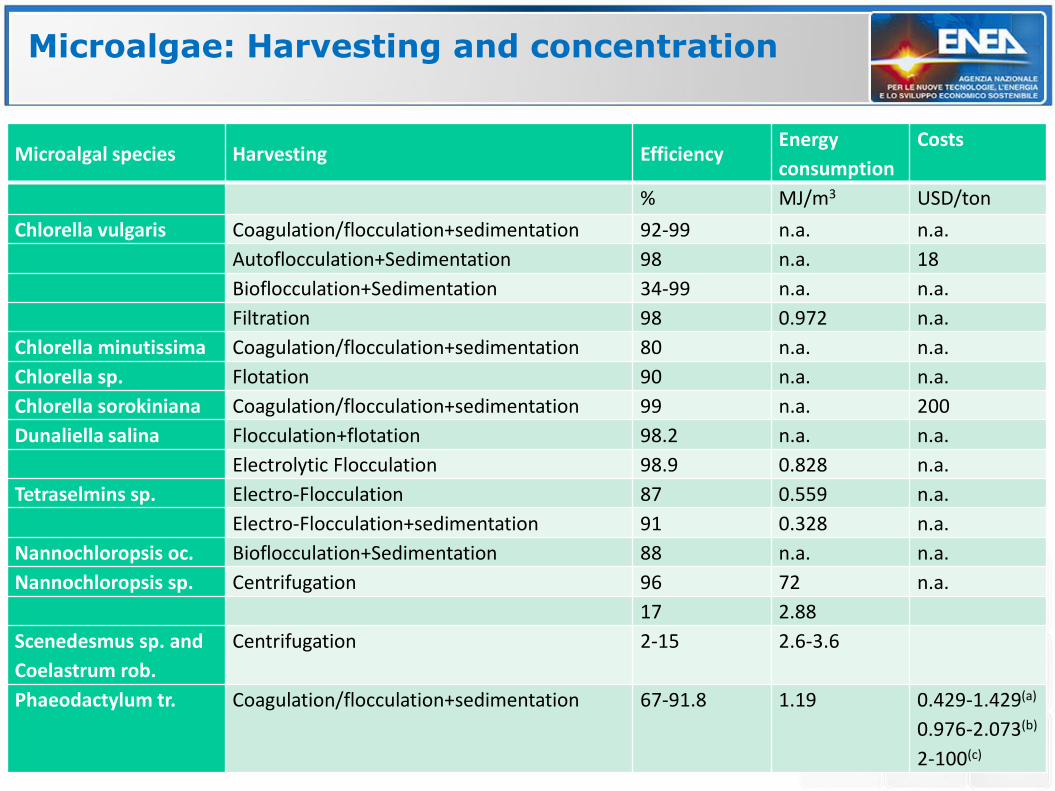
Microalgae: Harvesting and concentration
34 8 November 2016
Microalgal species Harvesting Efficiency Energy
consumption
Costs
% MJ/m3 USD/ton
Chlorella vulgaris Coagulation/flocculation+sedimentation 92-99 n.a. n.a.
Autoflocculation+Sedimentation 98 n.a. 18
Bioflocculation+Sedimentation 34-99 n.a. n.a.
Filtration 98 0.972 n.a.
Chlorella minutissima Coagulation/flocculation+sedimentation 80 n.a. n.a.
Chlorella sp. Flotation 90 n.a. n.a.
Chlorella sorokiniana Coagulation/flocculation+sedimentation 99 n.a. 200
Dunaliella salina Flocculation+flotation 98.2 n.a. n.a.
Electrolytic Flocculation 98.9 0.828 n.a.
Tetraselmins sp. Electro-Flocculation 87 0.559 n.a.
Electro-Flocculation+sedimentation 91 0.328 n.a.
Nannochloropsis oc. Bioflocculation+Sedimentation 88 n.a. n.a.
Nannochloropsis sp. Centrifugation 96 72 n.a.
17 2.88
Scenedesmus sp. and
Coelastrum rob.
Centrifugation 2-15 2.6-3.6
Phaeodactylum tr. Coagulation/flocculation+sedimentation 67-91.8 1.19 0.429-1.429(a)
0.976-2.073(b)
2-100(c)
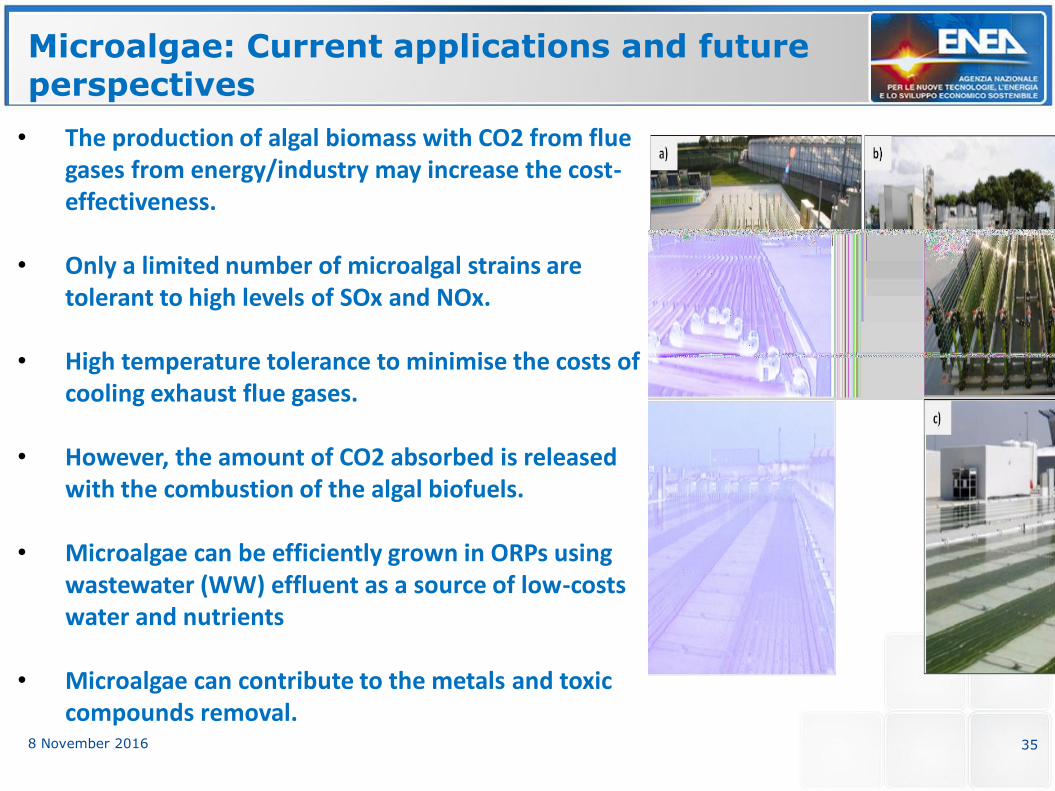
Microalgae: Current applications and future perspectives
35 8 November 2016
• The production of algal biomass with CO2 from flue gases from energy/industry may increase the cost-effectiveness.
• Only a limited number of microalgal strains are tolerant to high levels of SOx and NOx.
• High temperature tolerance to minimise the costs of cooling exhaust flue gases.
• However, the amount of CO2 absorbed is released with the combustion of the algal biofuels.
• Microalgae can be efficiently grown in ORPs using wastewater (WW) effluent as a source of low-costs water and nutrients
• Microalgae can contribute to the metals and toxic compounds removal.
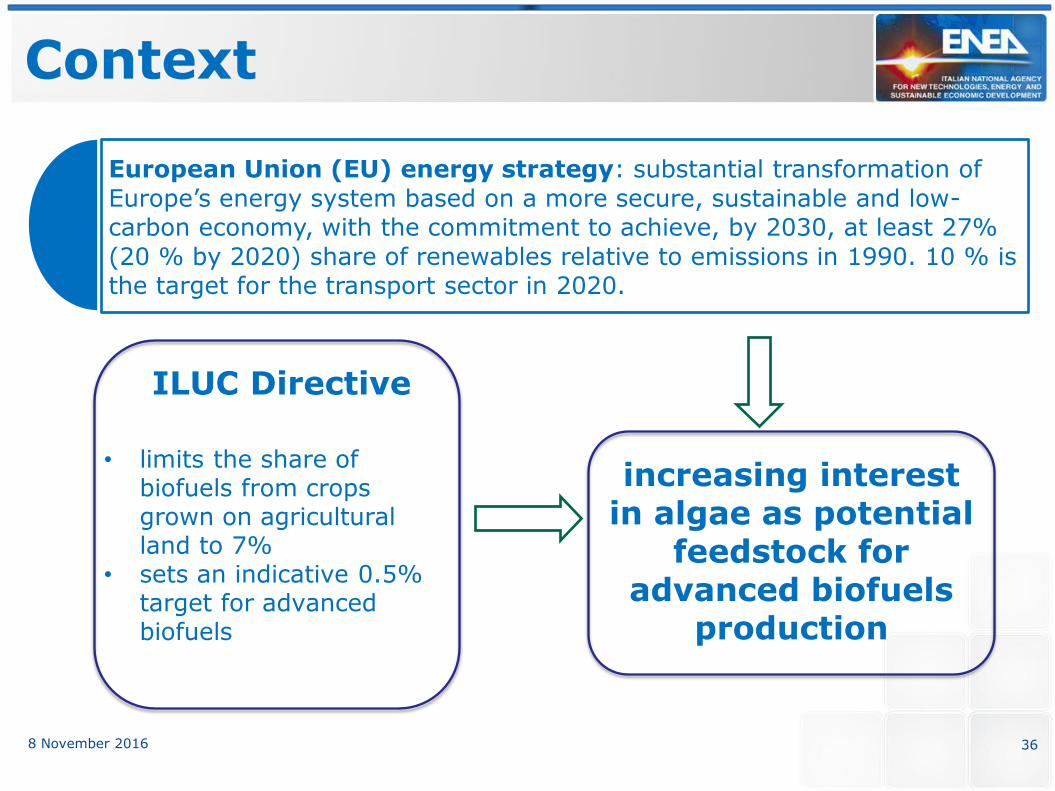
Context
European Union (EU) energy strategy: substantial transformation of
Europe’s energy system based on a more secure, sustainable and low-carbon economy, with the commitment to achieve, by 2030, at least 27%
(20 % by 2020) share of renewables relative to emissions in 1990. 10 % is the target for the transport sector in 2020.
36 8 November 2016
ILUC Directive
• limits the share of biofuels from crops grown on agricultural land to 7%
• sets an indicative 0.5% target for advanced biofuels
increasing interest in algae as potential
feedstock for advanced biofuels
production
Mandate
37 8 November 2016
As the European Commission's science and knowledge service, the Joint Research Centre's mission is to support EU policies with independent evidence throughout the whole policy cycle.
Scope The scope of this work is to report on the current status and development in the potential exploitation of algae (both macro- and microalgae species) as a feedstock for biofuels production.
Approach We carried out a comprehensive review of the most promising algal biofuel pathways, based on recent findings and developments, in terms of technological options, opportunities and limitations to their overall effectiveness.
Biofuels from algae: insights from LCA studies
38 8 November 2016
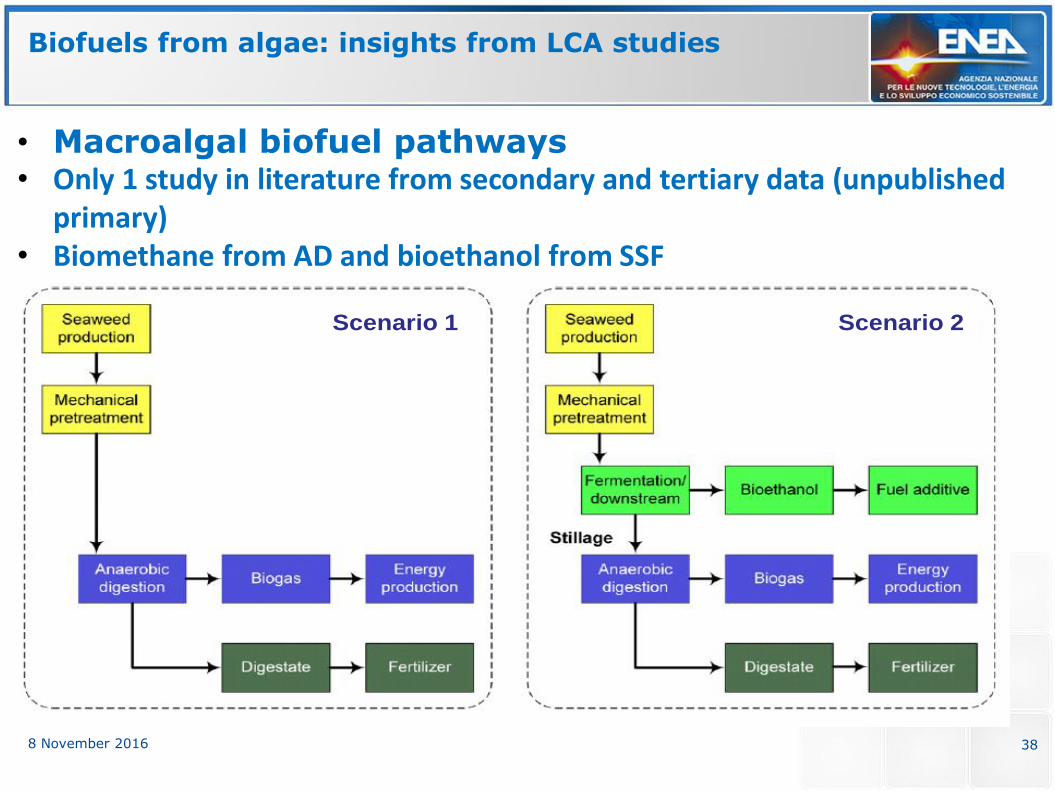
• Macroalgal biofuel pathways • Only 1 study in literature from secondary and tertiary data (unpublished
primary) • Biomethane from AD and bioethanol from SSF
Scenario 1 Scenario 2
Biofuels from algae: insights from LCA studies
39 8 November 2016
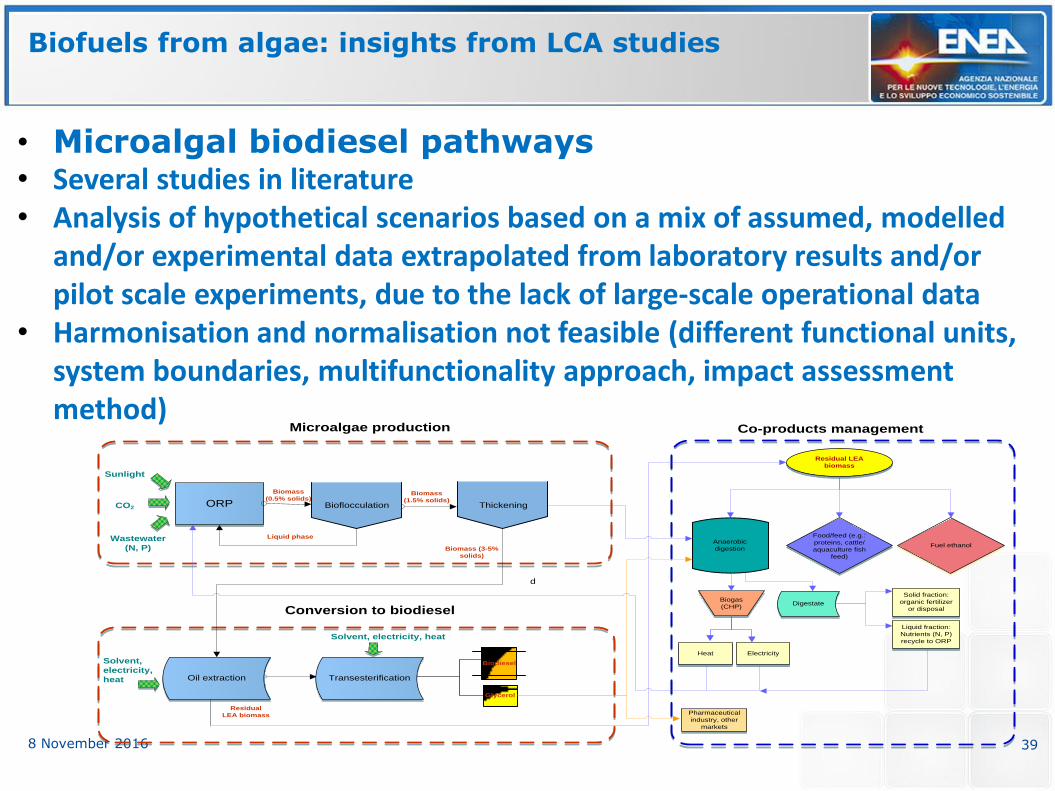
• Microalgal biodiesel pathways • Several studies in literature • Analysis of hypothetical scenarios based on a mix of assumed, modelled
and/or experimental data extrapolated from laboratory results and/or pilot scale experiments, due to the lack of large-scale operational data
• Harmonisation and normalisation not feasible (different functional units, system boundaries, multifunctionality approach, impact assessment method)
Sunlight
CO2
Wastewater
(N, P)
ORPBiomass
(1.5% solids)
Biomass (3-5%
solids)
d
Microalgae production
Bioflocculation Thickening
Liquid phase
Residual
LEA biomass
Conversion to biodiesel
Solvent, electricity, heat
TransesterificationOil extraction
Biodiesel
Glycerol
Solvent,
electricity,
heat
Biomass
(0.5% solids)
Co-products management
Anaerobic
digestion
Residual LEA
biomass
Fuel ethanol
Food/feed (e.g.:
proteins, cattle/
aquaculture fish
feed)
Biogas
(CHP)
Heat Electricity
Digestate
Solid fraction:
organic fertilizer
or disposal
Liquid fraction:
Nutrients (N, P)
recycle to ORP
Pharmaceutical
industry, other
markets
Biofuels from algae: insights from LCA studies
40 8 November 2016
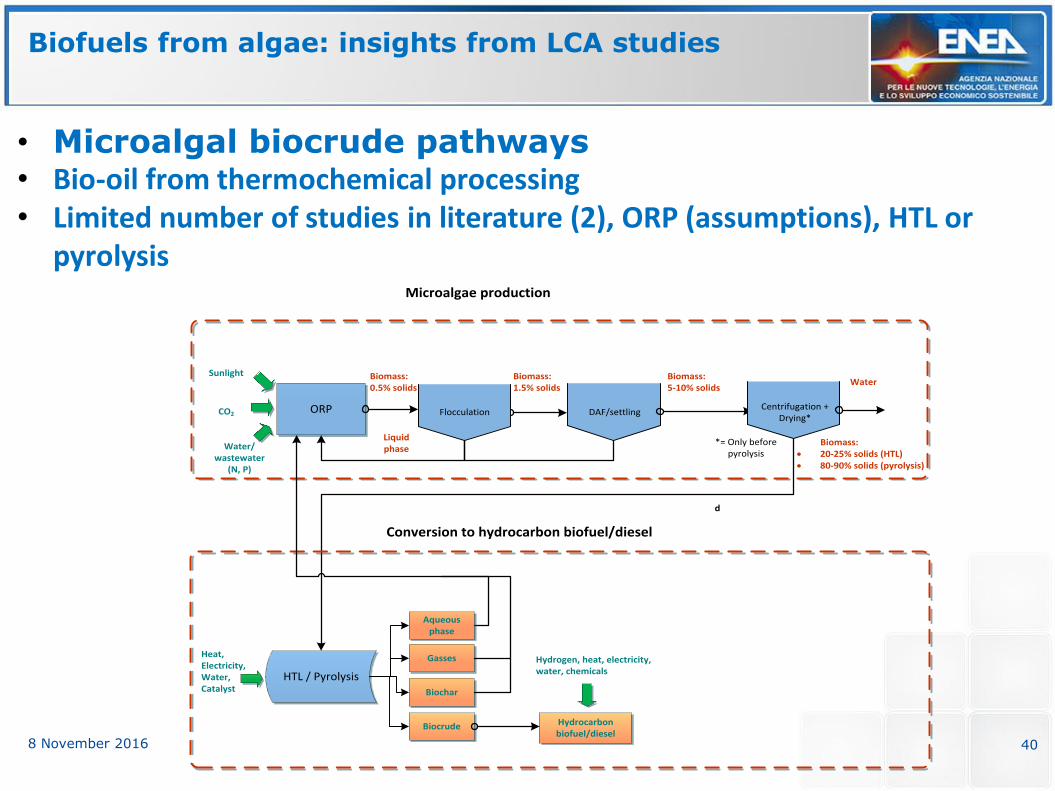
• Microalgal biocrude pathways • Bio-oil from thermochemical processing • Limited number of studies in literature (2), ORP (assumptions), HTL or
pyrolysis
Sunlight
CO2
Water/wastewater
(N, P)
ORP
Biomass: 1.5% solids
Biomass: 5-10% solids
Microalgae production
Flocculation DAF/settling
Liquid phase
HTL / Pyrolysis
Heat,Electricity,Water,Catalyst
Biomass: 0.5% solids
Water
Conversion to hydrocarbon biofuel/diesel
Biomass: 20-25% solids (HTL) 80-90% solids (pyrolysis)
Centrifugation +Drying*
d
Gasses
Biocrude
Hydrogen, heat, electricity, water, chemicals
Aqueous phase
Biochar
Hydrocarbon biofuel/diesel
*= Only before pyrolysis
Conclusions: perspectives
41 8 November 2016
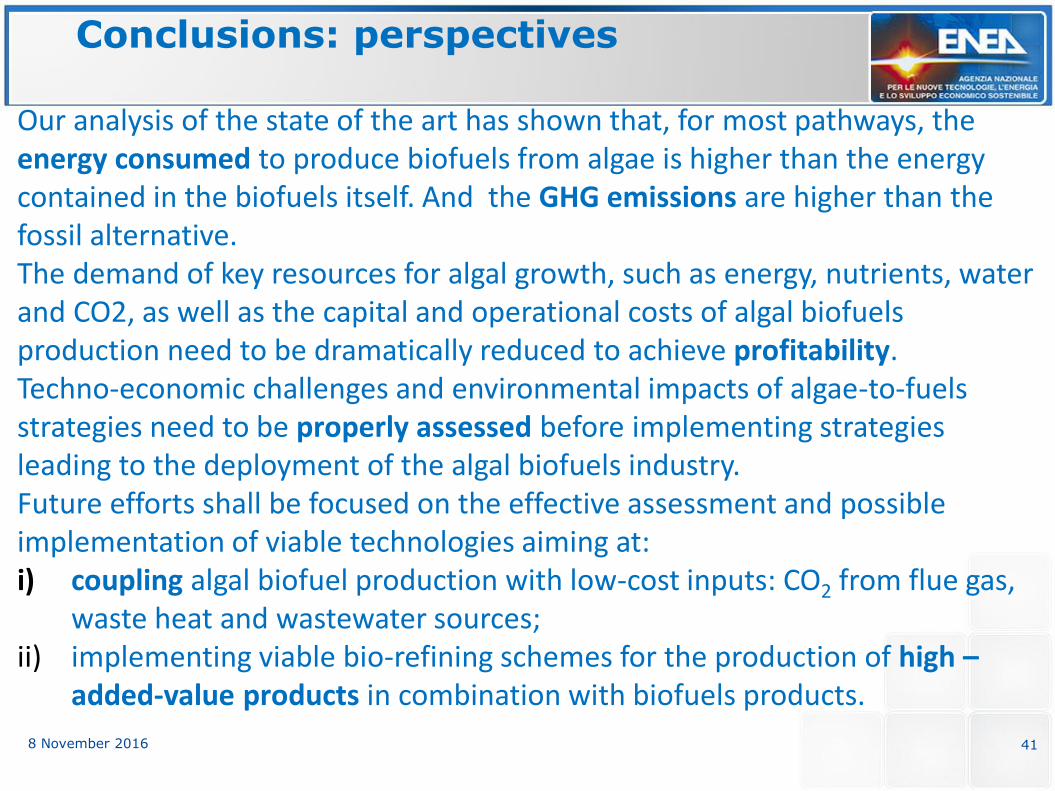
Our analysis of the state of the art has shown that, for most pathways, the energy consumed to produce biofuels from algae is higher than the energy contained in the biofuels itself. And the GHG emissions are higher than the fossil alternative. The demand of key resources for algal growth, such as energy, nutrients, water and CO2, as well as the capital and operational costs of algal biofuels production need to be dramatically reduced to achieve profitability. Techno-economic challenges and environmental impacts of algae-to-fuels strategies need to be properly assessed before implementing strategies leading to the deployment of the algal biofuels industry. Future efforts shall be focused on the effective assessment and possible implementation of viable technologies aiming at: i) coupling algal biofuel production with low-cost inputs: CO2 from flue gas,
waste heat and wastewater sources; ii) implementing viable bio-refining schemes for the production of high –
added-value products in combination with biofuels products.
Conclusions: Research needs
42 8 November 2016
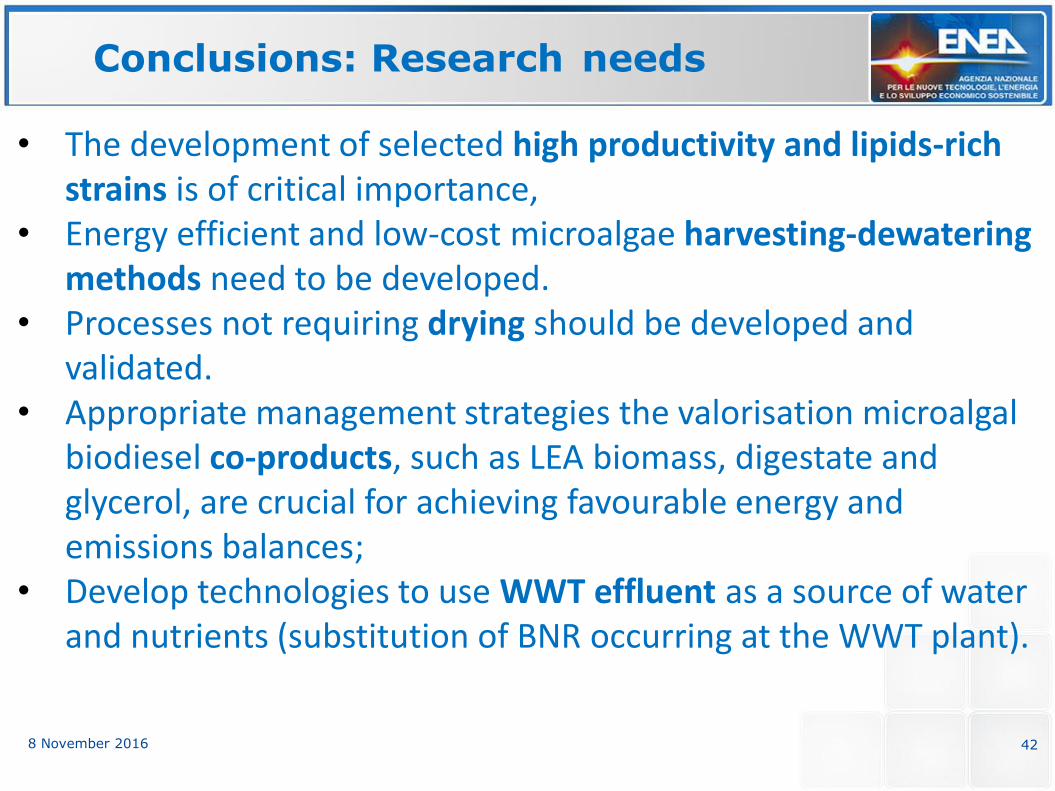
• The development of selected high productivity and lipids-rich strains is of critical importance,
• Energy efficient and low-cost microalgae harvesting-dewatering methods need to be developed.
• Processes not requiring drying should be developed and validated.
• Appropriate management strategies the valorisation microalgal biodiesel co-products, such as LEA biomass, digestate and glycerol, are crucial for achieving favourable energy and emissions balances;
• Develop technologies to use WWT effluent as a source of water and nutrients (substitution of BNR occurring at the WWT plant).


![Algae Cultures to Biofuels[1]](https://img.pdfslide.us/doc/110x75/577d36271a28ab3a6b925455/algae-cultures-to-biofuels1.jpg)