Embed Size (px)
Citation preview
Received: 2019.06.13Accepted: 2019.07.23
Published: 2019.11.09
2791 2 8 23
Bioelectrical Impedance Analysis Is Not Sufficient for Determining Water Deficit in Hypernatremic Patients
ABCDEFG 1,2 Se-Hee Yoon* ABCDE 3 Seul-gi Kim* AD 1 In-Beom Jeong AD 1 Won-Min Hwang AD 1 Sung-Ro Yun
* Se-Hee Yoon and Seul-gi Kim contributed equally to this work Corresponding Author: Se-Hee Yoon, e-mail: [email protected] Source of support: This study was supported by the Basic Science Research Program of the National Research Foundation of Korea (NRF) and fund-
ed by the Ministry of Education (grant number: NRF-2018R1D1A3B07045274)
Background: Hypernatremia is associated with poor outcomes in critically ill patients, and an accurate assessment of wa-ter volume is important to determine appropriate fluid hydration. Bioelectrical impedance analysis (BIA) is a new, noninvasive, and relatively easy method for measuring hydration status. This study aimed to investigate whether bioelectrical impedance measurements of body water could reduce the frequency of blood sampling for fluid replacement in patients with hypernatremia.
Material/Methods: Fifty-one hospitalized patients were studied with hypernatremia, defined as a serum sodium ³150 mmol/L de-termined by laboratory testing. Laboratory and BIA measurements were compared, and water deficiency was calculated with a conventional formula (sodium-corrected Watson formula) and measured by BIA.
Results: The value of the absolute fluid overload (AFO) equivalent to the overhydration (OH) value, determined using BIA, did not accurately represent water deficit in patients with hypernatremia (r=0.137, P=0.347). Although the total body water (TBW) measured by BIA showed a significant correlation with that determined by the conven-tional formula (r=0.861, P<0.001), there was a proportional bias (r=0.617, P<0.001). The intracellular water (ICW) measured by BIA underestimated the TBW level calculated by the conventional formula by about 14.06±4.0 L in the Bland-Altman analysis.
Conclusions: It is not currently possible to replace blood testing with BIA for assessing volume status in hypernatremic pa-tients. However, ICW value measured by BIA might represent plasma sodium level more accurately than extra-cellular water (ECW) or TBW value in patients with hypernatremia.
MeSH Keywords: Body Fluids • Dehydration • Electric Impedance • Hypernatremia
Full-text PDF: https://www.medscimonit.com/abstract/index/idArt/918095
Authors’ Contribution: Study Design A
Data Collection B Statistical Analysis CData Interpretation D
Manuscript Preparation E Literature Search FFunds Collection G
1 Department of Internal Medicine, College of Medicine, Konyang University, Daejeon, South Korea
2 Myunggok Medical Research Institute, College of Medicine, Konyang University, Daejeon, South Korea
3 Department of Internal Medicine, Severance Hospital, Yonsei University College of Medicine, Seoul, South Korea
e-ISSN 1643-3750© Med Sci Monit, 2019; 25: 8438-8446
DOI: 10.12659/MSM.918095
8438Indexed in: [Current Contents/Clinical Medicine] [SCI Expanded] [ISI Alerting System] [ISI Journals Master List] [Index Medicus/MEDLINE] [EMBASE/Excerpta Medica] [Chemical Abstracts/CAS]
CLINICAL RESEARCH
This work is licensed under Creative Common Attribution-NonCommercial-NoDerivatives 4.0 International (CC BY-NC-ND 4.0)
Background
Hypernatremia is not uncommon in hospitalized patients and is defined as a rise in the concentration of serum sodium lev-els above 145 mmol/L. Hypernatremia is commonly caused by water loss, but in rare cases, it can be due to the adminis-tration of hypertonic saline or sodium bicarbonate. As the so-dium level rises, the osmotic pressure increases and cerebral osmotic receptors are stimulated to induce feelings of thirst and increased water intake [1]. However, patients who pres-ent with hypernatremia usually have a severe underlying con-dition that impairs their ability to respond to thirst cues or may have a physical disability that prevents them from drink-ing enough water [1]. Hypernatremia is associated with poor outcomes in the affected patients [2,3].
Sufficient water replacement is required to correct the state of hypernatremia. Estimating water deficits, ongoing free wa-ter losses, and sodium correction rates are crucial when de-termining the required levels of fluid replacement in hyper-natremia [4]. Frequent blood sampling is required for making these measurements. Bioelectrical impedance analysis (BIA) has been used as a relatively easy, noninvasive, and reproduc-ible tool to measure fluid status [5]. The BIA method is based on measuring the body’s impedance of small electric currents. Recently, this method has been widely used to measure the fluid status in hemodialysis patients, and it has been shown to improve outcomes in these cases [6]. In hyponatremic pa-tients, BIA helps determine the differential diagnosis by mea-suring the fluid status [7]. However, the potential role of BIA in the management of hypernatremia has not been well re-ported. Alternatives to frequent blood sampling with nonin-vasive and safe methods in these patients could be transfor-mative as they would prevent the side effects associated with frequent blood sampling, such as bruising, hematoma, inju-ry to nerves or other anatomic structures, vasovagal attacks, and accidental injury and blood exposure to health workers [8]. Primary care units without the capacity to perform frequent blood tests would benefit from alternative approaches to moni-toring and treating cases of hypernatremia.
Therefore, this study aimed to investigate whether bioelec-trical impedance measurements of body water could reduce the frequency of blood sampling for fluid replacement in pa-tients with hypernatremia.
Material and Methods
Participants
This study included patients who had been admitted to Konyang University Hospital with hypernatremia (³150 mmol/L)
between October 2016 and June 2018. Patients were exclud-ed from the study if they had a unipolar cardiac pacemaker, ascites, or edema, an amputated extremity, who were preg-nant, or who could not be weighed. Fifty-one patients were included in the final study cohort after informed consent was given. All protocols used in this study were approved by the Institutional Review Board of Konyang University Hospital (IRB Number: 2016-10-003).
Study protocol
BIA measurements were performed as soon as possible after sampling of about 5 mL of blood and 10 mL of urine for lab-oratory tests. Laboratory tests included the measurement of plasma osmolality and plasma levels of hemoglobin, hema-tocrit, sodium blood urea nitrogen (BUN), creatinine, protein, and albumin, and urine osmolatity and urine levels of sodium, potassium, and creatinine. Patients were treated individually according to the physician’s opinion after enrollment into the study. The same test was performed after day 3 of enrollment to confirm whether the changes in the water content calculat-ed with each method were correlated. Patient height and body weight were also measured simultaneously on day 1 and day 3 of enrollment. Bedridden patients were weighed using a hoist.
Water deficit calculated by the conventional method
The total body water (TBW) was calculated using the Watson formula [9].
Men: 2.447–(0.09156×age)+(0.1074×height)+(0.3362×weight)Women: –2.097+(0.1069×height)+(0.2466×weight)
In dehydrated patients, the TBW was corrected by calculating the plasma sodium level. The sodium-corrected TBW was cal-culated using a previously described formula [9]:
Normal expected TBW (calculated with the Watson formula)
The Watson formula for calculating water deficit was as fol-lows [9].
TBW by Watson –TBW by Watson
Water deficit analysis using bioelectrical impedance analysis (BIA)
BIA was performed using a body composition monitor (BCM) (Fresenius Medical Care, Bad Homburg, Germany) operat-ed by a well-trained nurse and as previously described [10]. Briefly, electrodes were attached to the forearm and ipsilat-eral ankle of the patient when in a supine position. The BCM
8439Indexed in: [Current Contents/Clinical Medicine] [SCI Expanded] [ISI Alerting System] [ISI Journals Master List] [Index Medicus/MEDLINE] [EMBASE/Excerpta Medica] [Chemical Abstracts/CAS]
Yoon S.-H. et al.: BET and body water in hypernatremia© Med Sci Monit, 2019; 25: 8438-8446
CLINICAL RESEARCH
This work is licensed under Creative Common Attribution-NonCommercial-NoDerivatives 4.0 International (CC BY-NC-ND 4.0)
device was the latest bioimpedance spectroscopy (BIS) in-strument that measured 50 frequencies over a range from 5–1000 kHz to determine the electrical resistance of the TBW and the extracellular water (ECW). Based on a fluid model using these resistance measurements, the BCM calculated the ECW (liters, L), intracellular water (ICW) (L), TBW (L), the lean tissue index (LTI) (kg/m2), the lean tissue mass (LTM) (kg), the body mass (kg), the adipose tissue mass (ATM) (kg), and the fat tis-sue index (FTI) (kg/m2). All calculations were performed us-ing the BCM software (Fresenius Medical Care, Bad Homburg, Germany). The absolute fluid overload (AFO) was defined as the difference between the patient’s expected ECW under nor-mal physiologic conditions and actual ECW. Normohydration is defined as an AFO and overhydration (OH) value between the 10th and 90th percentiles for healthy age-matched and sex-matched individuals from the reference population. These val-ues were 2.1 to 1.1 L, with volumes below and above this range indicating underhydration and overhydration, respectively [11]. Water deficits were estimated using the following formula:
TBW by BCM–TBW calculated by Watson formula
Statistical analysis
Data were analyzed using R version 2.1.5.0 (R Development Core Team). Continuous data were presented as the mean ± stan-dard deviation (SD). Differences between the two groups were compared using Student’s t-test. The Bland–Altman test was used to determine the agreement between the quantitative variables in the BCM components and body water levels cal-culated using the conventional formula. P-values <0.05 were considered to be statistically significant.
Results
Baseline characteristics of the study subjects
The causes of the hospital admissions for the study partici-pants are listed in Table 1. The baseline characteristics of the study participants are presented in Table 2. The current study cohort of 51 hypernatremic patients included 25 men and 26 women, with 26 of these patients admitted to the inten-sive care unit (ICU). Eighteen patients had diabetes mellitus, 28 patients had hypertension, and two patients had chronic kidney disease. Fourteen patients were treated with furose-mide at enrolment, and nine patients were treated with furo-semide at day 3 after enrolment. Among the laboratory val-ues, the plasma osmolality and levels of sodium, protein, and albumin were significantly reduced, and the urine level of so-dium was significantly increased at day 3 after enrolment when compared with the day of enrolment. None of the body
composition monitor (BCM) results showed significant differ-ences between day 1 and day 3.
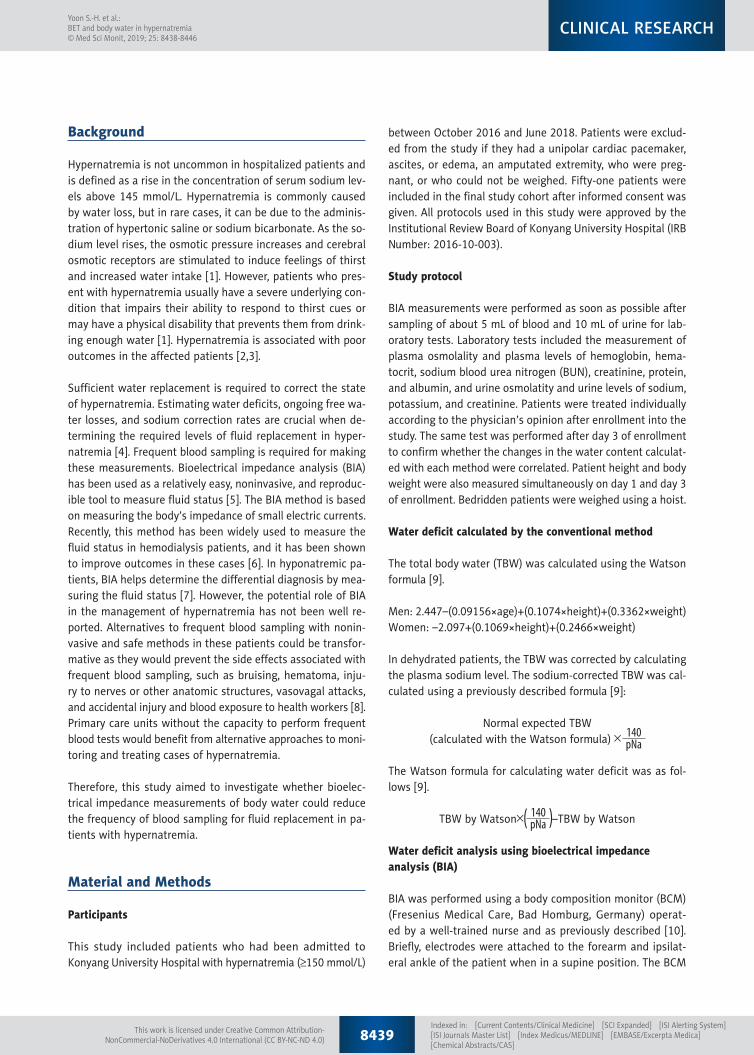
Correlations between levels of water deficit calculated by the conventional formula and levels of overhydration determined by bioelectrical impedance analysis (BIA)
The mean water deficit value calculated by the convention-al formula was 1.23±0.42 L. The mean overhydration (OH) value determined by BIA was 1.61±2.95 L. There was no sig-nificant correlation between these measurements (r=0.137, P=0.347) (Figure 1).
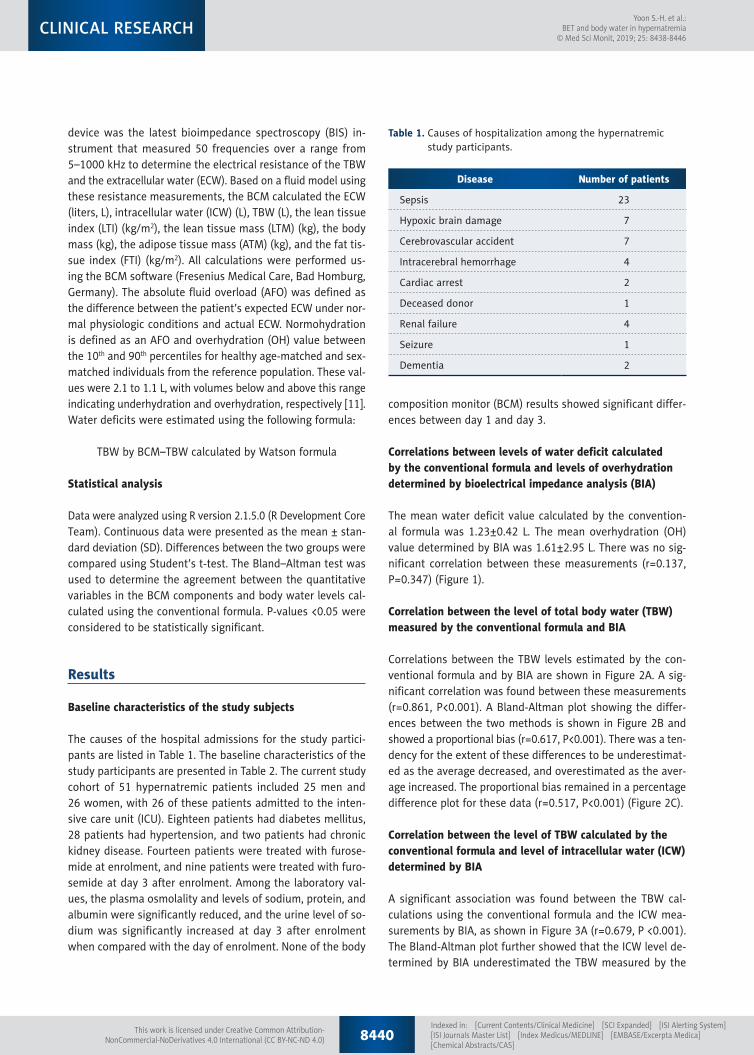
Correlation between the level of total body water (TBW) measured by the conventional formula and BIA
Correlations between the TBW levels estimated by the con-ventional formula and by BIA are shown in Figure 2A. A sig-nificant correlation was found between these measurements (r=0.861, P<0.001). A Bland-Altman plot showing the differ-ences between the two methods is shown in Figure 2B and showed a proportional bias (r=0.617, P<0.001). There was a ten-dency for the extent of these differences to be underestimat-ed as the average decreased, and overestimated as the aver-age increased. The proportional bias remained in a percentage difference plot for these data (r=0.517, P<0.001) (Figure 2C).
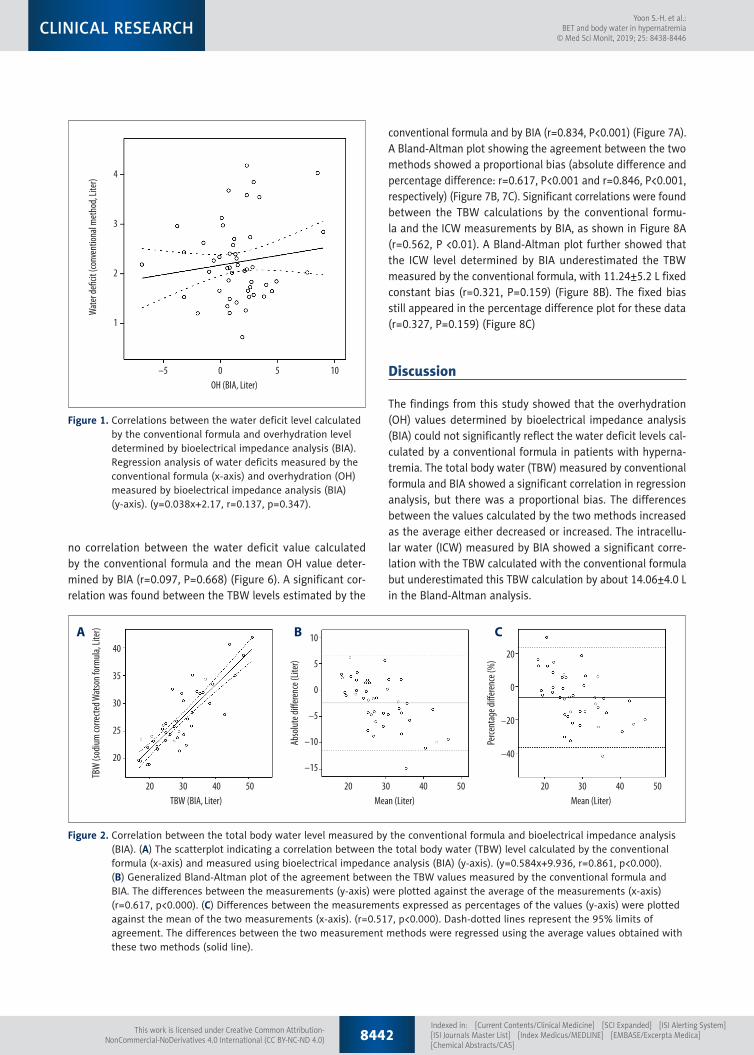
Correlation between the level of TBW calculated by the conventional formula and level of intracellular water (ICW) determined by BIA
A significant association was found between the TBW cal-culations using the conventional formula and the ICW mea-surements by BIA, as shown in Figure 3A (r=0.679, P <0.001). The Bland-Altman plot further showed that the ICW level de-termined by BIA underestimated the TBW measured by the
Disease Number of patients
Sepsis 23
Hypoxic brain damage 7
Cerebrovascular accident 7
Intracerebral hemorrhage 4
Cardiac arrest 2
Deceased donor 1
Renal failure 4
Seizure 1
Dementia 2
Table 1. Causes of hospitalization among the hypernatremic study participants.
8440Indexed in: [Current Contents/Clinical Medicine] [SCI Expanded] [ISI Alerting System] [ISI Journals Master List] [Index Medicus/MEDLINE] [EMBASE/Excerpta Medica] [Chemical Abstracts/CAS]
Yoon S.-H. et al.: BET and body water in hypernatremia
© Med Sci Monit, 2019; 25: 8438-8446CLINICAL RESEARCH
This work is licensed under Creative Common Attribution-NonCommercial-NoDerivatives 4.0 International (CC BY-NC-ND 4.0)

conventional formula, with a 14.06±4.0 L fixed constant bias (r=0.32, P=0.84) (Figure 3B). The fixed bias still appeared in the percentage difference plot for these data (r=0.052, P=0.739) (Figure 3C)
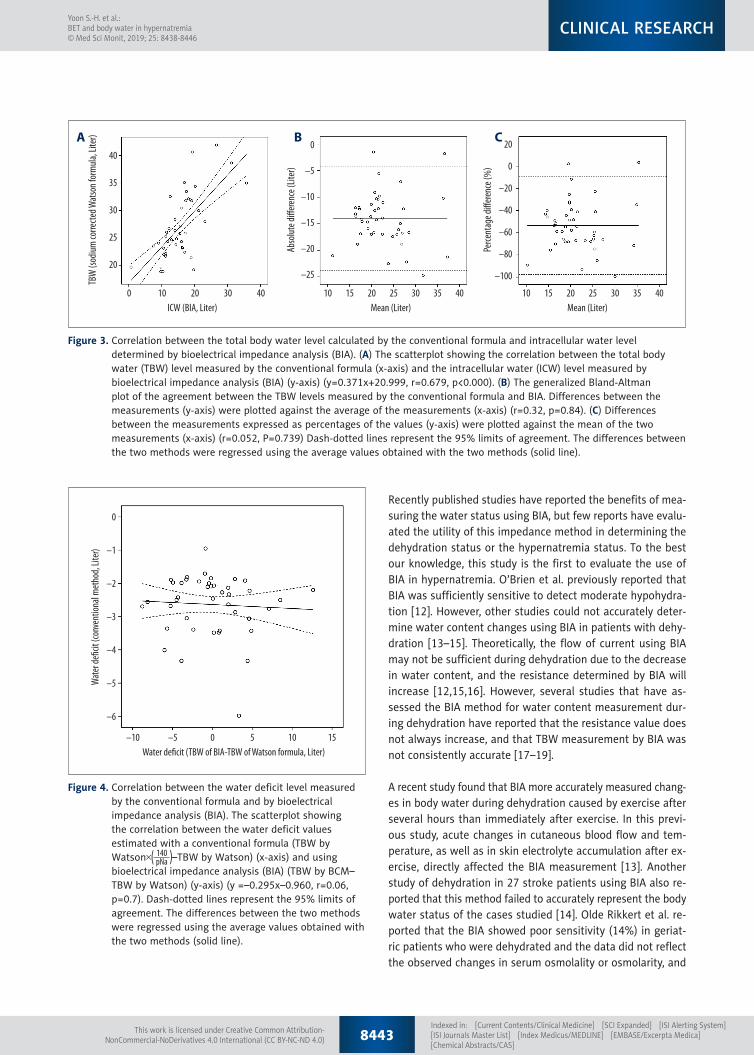
Correlation between the level of water deficit measured by the conventional formula and by BIA
The water deficit estimated by the conventional method(TBW by Watson –TBW by Watson) and by using BIA(TBW by BCM–TBW by Watson) showed no significant associ-ation (r=0.06, P=0.07) (Figure 4).
Changes in TBW measured by the conventional formula and BIA on day 1 and day 3 in the study
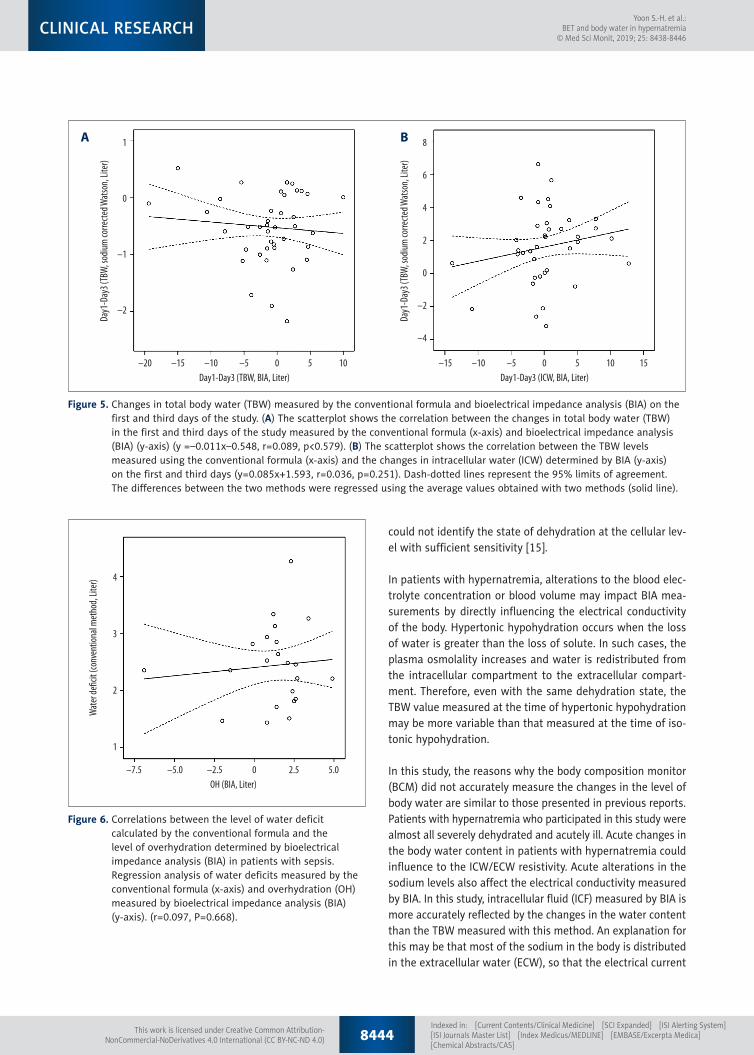
There was no correlation between the time-dependent chang-es in TBW measured by the conventional formula and the BIA methods on day 1 and day 3 (r=0.089, P=0.579) (Figure 5A). The change in ICW determined by BIA on day 1 and day 3 also showed no significant association with the change in TBW calculated by the conventional formula (r=0.036, P=0.251) (Figure 5B).
Correlation between the value of the body water compartment measured by the conventional formula and BIA in patients with sepsis
Subgroup analysis was performed to evaluate the efficiency of BIA in patients with sepsis who had hypernatremia. There was
Day 1 (mean ±SD) Day 3 (mean ±SD) P-value
Plasma
Hb (g/dL) 11.11±1.81 10.48±1.66 0.072
Hct (%) 34.26±5.82 32.35±5.20 0.281
Na (mmol/L) 153.84±4.99 148.2±6.85 0.0001
K (mmol/L) 3.70±0.64 3.716±0.62 0.925
BUN (mg/dL) 39.87±19.34 35.98±20.43 0.333
Cr (mg/dL) 1.09±0.63 1.02±0.73 0.611
Protein (g/dL) 6.03±1.04 5.58±0.73 0.014
Albumin (g/dL) 2.91±0.66 2.63±0.49 0.018
Osmolality (mOsm) 329.57±16.73 315.48±17.37 0.000
Urine
Na (mmol/L) 62.20±37.94 78.82±47.26 0.009
K (mmol/L) 30.36±10.64 32.16±15.22 0.409
Cr (mg/dL) 61.88±45.36 58.69±51.33 0.637
Osmolality (mOsm) 574.30±182.31 574.39±171.21 0.997
BCM
TBW (L) 29.81±8.21 31.20±7.47 0.383
ECW (L) 14.33±4.07 14.52±3.97 0.823
ICW (L) 16.36±7.57 16.30±4.52 0.955
ECW/TBW 0.47±0.05 0.45±0.09 0.127
Fat (kg) 14.33±8.54 13.07±7.48 0.464
ATM (kg) 19.57±11.79 17.94±10.29 0.504
LTM (kg) 33.01±12.65 34.07±10.95 0.680
LTI (kg/m2) 12.51±4.04 13.16±4.00 0.459
FTI (kg/m2) 7.60±4.84 6.94±3.90 0.485
OH 1.53±2.81 1.72±2.84 0.739
Table 2. Baseline characteristics of the 51 study participants.
Hb – hemoglobin; Hct – hematocrit; Na – sodium; K – potassium; BUN – blood urea nitrogen; Cr – creatinine; BCM – body composition monitor, TBW – total body water; ECW – extracellular water; ICW – intracellular water; ATM – adipose tissue mass; LTM – lean tissue mass; LTI – lean tissue index; FTI – fat tissue index; OH – overhydration.
8441Indexed in: [Current Contents/Clinical Medicine] [SCI Expanded] [ISI Alerting System] [ISI Journals Master List] [Index Medicus/MEDLINE] [EMBASE/Excerpta Medica] [Chemical Abstracts/CAS]
Yoon S.-H. et al.: BET and body water in hypernatremia© Med Sci Monit, 2019; 25: 8438-8446
CLINICAL RESEARCH
This work is licensed under Creative Common Attribution-NonCommercial-NoDerivatives 4.0 International (CC BY-NC-ND 4.0)
no correlation between the water deficit value calculated by the conventional formula and the mean OH value deter-mined by BIA (r=0.097, P=0.668) (Figure 6). A significant cor-relation was found between the TBW levels estimated by the
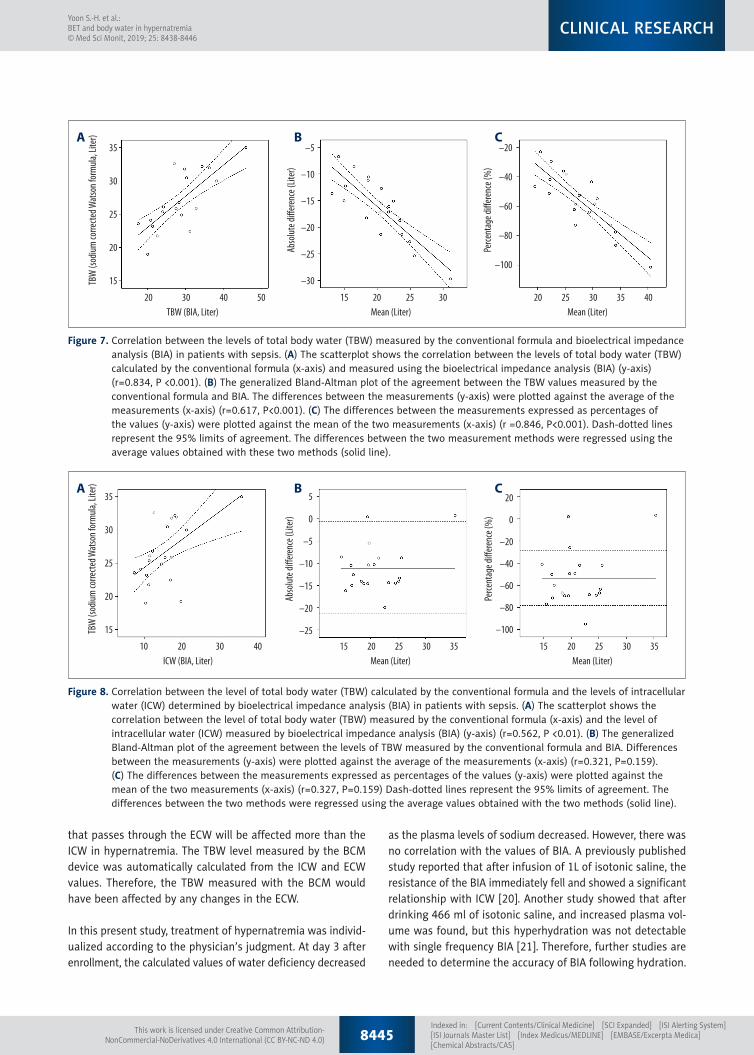
conventional formula and by BIA (r=0.834, P<0.001) (Figure 7A). A Bland-Altman plot showing the agreement between the two methods showed a proportional bias (absolute difference and percentage difference: r=0.617, P<0.001 and r=0.846, P<0.001, respectively) (Figure 7B, 7C). Significant correlations were found between the TBW calculations by the conventional formu-la and the ICW measurements by BIA, as shown in Figure 8A (r=0.562, P <0.01). A Bland-Altman plot further showed that the ICW level determined by BIA underestimated the TBW measured by the conventional formula, with 11.24±5.2 L fixed constant bias (r=0.321, P=0.159) (Figure 8B). The fixed bias still appeared in the percentage difference plot for these data (r=0.327, P=0.159) (Figure 8C)
Discussion
The findings from this study showed that the overhydration (OH) values determined by bioelectrical impedance analysis (BIA) could not significantly reflect the water deficit levels cal-culated by a conventional formula in patients with hyperna-tremia. The total body water (TBW) measured by conventional formula and BIA showed a significant correlation in regression analysis, but there was a proportional bias. The differences between the values calculated by the two methods increased as the average either decreased or increased. The intracellu-lar water (ICW) measured by BIA showed a significant corre-lation with the TBW calculated with the conventional formula but underestimated this TBW calculation by about 14.06±4.0 L in the Bland-Altman analysis.
0OH (BIA, Liter)
Wat
er de
cit
(conv
entio
nal m
etho
d, Lit
er)
–5 5 10
4
3
2
1
Figure 1. Correlations between the water deficit level calculated by the conventional formula and overhydration level determined by bioelectrical impedance analysis (BIA). Regression analysis of water deficits measured by the conventional formula (x-axis) and overhydration (OH) measured by bioelectrical impedance analysis (BIA) (y-axis). (y=0.038x+2.17, r=0.137, p=0.347).
30TBW (BIA, Liter)
TBW
(sod
ium co
rrecte
d Wat
son f
orm
ula, L
iter)
20 40 50
40
35
30
25
20
30Mean (Liter)
Abso
lute d
i�ere
nce (
Liter
)
20 40 50
10
5
0
–5
–10
–15
30Mean (Liter)
Perce
ntag
e di�
erenc
e (%
)
20 40 50
20
0
–20
–40
A B C
Figure 2. Correlation between the total body water level measured by the conventional formula and bioelectrical impedance analysis (BIA). (A) The scatterplot indicating a correlation between the total body water (TBW) level calculated by the conventional formula (x-axis) and measured using bioelectrical impedance analysis (BIA) (y-axis). (y=0.584x+9.936, r=0.861, p<0.000). (B) Generalized Bland-Altman plot of the agreement between the TBW values measured by the conventional formula and BIA. The differences between the measurements (y-axis) were plotted against the average of the measurements (x-axis) (r=0.617, p<0.000). (C) Differences between the measurements expressed as percentages of the values (y-axis) were plotted against the mean of the two measurements (x-axis). (r=0.517, p<0.000). Dash-dotted lines represent the 95% limits of agreement. The differences between the two measurement methods were regressed using the average values obtained with these two methods (solid line).
8442Indexed in: [Current Contents/Clinical Medicine] [SCI Expanded] [ISI Alerting System] [ISI Journals Master List] [Index Medicus/MEDLINE] [EMBASE/Excerpta Medica] [Chemical Abstracts/CAS]
Yoon S.-H. et al.: BET and body water in hypernatremia
© Med Sci Monit, 2019; 25: 8438-8446CLINICAL RESEARCH
This work is licensed under Creative Common Attribution-NonCommercial-NoDerivatives 4.0 International (CC BY-NC-ND 4.0)
Recently published studies have reported the benefits of mea-suring the water status using BIA, but few reports have evalu-ated the utility of this impedance method in determining the dehydration status or the hypernatremia status. To the best our knowledge, this study is the first to evaluate the use of BIA in hypernatremia. O’Brien et al. previously reported that BIA was sufficiently sensitive to detect moderate hypohydra-tion [12]. However, other studies could not accurately deter-mine water content changes using BIA in patients with dehy-dration [13–15]. Theoretically, the flow of current using BIA may not be sufficient during dehydration due to the decrease in water content, and the resistance determined by BIA will increase [12,15,16]. However, several studies that have as-sessed the BIA method for water content measurement dur-ing dehydration have reported that the resistance value does not always increase, and that TBW measurement by BIA was not consistently accurate [17–19].
A recent study found that BIA more accurately measured chang-es in body water during dehydration caused by exercise after several hours than immediately after exercise. In this previ-ous study, acute changes in cutaneous blood flow and tem-perature, as well as in skin electrolyte accumulation after ex-ercise, directly affected the BIA measurement [13]. Another study of dehydration in 27 stroke patients using BIA also re-ported that this method failed to accurately represent the body water status of the cases studied [14]. Olde Rikkert et al. re-ported that the BIA showed poor sensitivity (14%) in geriat-ric patients who were dehydrated and the data did not reflect the observed changes in serum osmolality or osmolarity, and
30ICW (BIA, Liter)
TBW
(sod
ium co
rrecte
d Wat
son f
orm
ula, L
iter)
200 10 40
40
35
30
25
20
20Mean (Liter)
Abso
lute d
i�ere
nce (
Liter
)1510 3025 35 40 201510 3025 35 40
0
–5
–10
–15
–20
–25
Mean (Liter)
Perce
ntag
e di�
erenc
e (%
)
20
0
–20
–40
–60
–80
–100
A B C
Figure 3. Correlation between the total body water level calculated by the conventional formula and intracellular water level determined by bioelectrical impedance analysis (BIA). (A) The scatterplot showing the correlation between the total body water (TBW) level measured by the conventional formula (x-axis) and the intracellular water (ICW) level measured by bioelectrical impedance analysis (BIA) (y-axis) (y=0.371x+20.999, r=0.679, p<0.000). (B) The generalized Bland-Altman plot of the agreement between the TBW levels measured by the conventional formula and BIA. Differences between the measurements (y-axis) were plotted against the average of the measurements (x-axis) (r=0.32, p=0.84). (C) Differences between the measurements expressed as percentages of the values (y-axis) were plotted against the mean of the two measurements (x-axis) (r=0.052, P=0.739) Dash-dotted lines represent the 95% limits of agreement. The differences between the two methods were regressed using the average values obtained with the two methods (solid line).
0Water de�cit (TBW of BIA-TBW of Watson formula, Liter)
Wat
er de
�cit
(conv
entio
nal m
etho
d, Li
ter)
–5–10 5 10 15
0
–1
–2
–3
–4
–5
–6
Figure 4. Correlation between the water deficit level measured by the conventional formula and by bioelectrical impedance analysis (BIA). The scatterplot showing the correlation between the water deficit values estimated with a conventional formula (TBW by Watson –TBW by Watson) (x-axis) and using bioelectrical impedance analysis (BIA) (TBW by BCM–TBW by Watson) (y-axis) (y =–0.295x–0.960, r=0.06, p=0.7). Dash-dotted lines represent the 95% limits of agreement. The differences between the two methods were regressed using the average values obtained with the two methods (solid line).
8443Indexed in: [Current Contents/Clinical Medicine] [SCI Expanded] [ISI Alerting System] [ISI Journals Master List] [Index Medicus/MEDLINE] [EMBASE/Excerpta Medica] [Chemical Abstracts/CAS]
Yoon S.-H. et al.: BET and body water in hypernatremia© Med Sci Monit, 2019; 25: 8438-8446
CLINICAL RESEARCH
This work is licensed under Creative Common Attribution-NonCommercial-NoDerivatives 4.0 International (CC BY-NC-ND 4.0)
could not identify the state of dehydration at the cellular lev-el with sufficient sensitivity [15].
In patients with hypernatremia, alterations to the blood elec-trolyte concentration or blood volume may impact BIA mea-surements by directly influencing the electrical conductivity of the body. Hypertonic hypohydration occurs when the loss of water is greater than the loss of solute. In such cases, the plasma osmolality increases and water is redistributed from the intracellular compartment to the extracellular compart-ment. Therefore, even with the same dehydration state, the TBW value measured at the time of hypertonic hypohydration may be more variable than that measured at the time of iso-tonic hypohydration.
In this study, the reasons why the body composition monitor (BCM) did not accurately measure the changes in the level of body water are similar to those presented in previous reports. Patients with hypernatremia who participated in this study were almost all severely dehydrated and acutely ill. Acute changes in the body water content in patients with hypernatremia could influence to the ICW/ECW resistivity. Acute alterations in the sodium levels also affect the electrical conductivity measured by BIA. In this study, intracellular fluid (ICF) measured by BIA is more accurately reflected by the changes in the water content than the TBW measured with this method. An explanation for this may be that most of the sodium in the body is distributed in the extracellular water (ECW), so that the electrical current
2.5OH (BIA, Liter)
Wat
er de
ficit
(conv
entio
nal m
etho
d, Li
ter)
0–2.5–5.0–7.5 5.0
4
3
2
1
Figure 6. Correlations between the level of water deficit calculated by the conventional formula and the level of overhydration determined by bioelectrical impedance analysis (BIA) in patients with sepsis. Regression analysis of water deficits measured by the conventional formula (x-axis) and overhydration (OH) measured by bioelectrical impedance analysis (BIA) (y-axis). (r=0.097, P=0.668).
0Day1-Day3 (TBW, BIA, Liter)
Day1
-Day
3 (TB
W, so
dium
corre
cted W
atso
n, Li
ter)
–5–10–15–20 5 10
1
0
–1
–2
0Day1-Day3 (ICW, BIA, Liter)
Day1
-Day
3 (TB
W, so
dium
corre
cted W
atso
n, Li
ter)
–5–10–15 5 10 15
8
6
4
2
0
–2
–4
A B
Figure 5. Changes in total body water (TBW) measured by the conventional formula and bioelectrical impedance analysis (BIA) on the first and third days of the study. (A) The scatterplot shows the correlation between the changes in total body water (TBW) in the first and third days of the study measured by the conventional formula (x-axis) and bioelectrical impedance analysis (BIA) (y-axis) (y =–0.011x–0.548, r=0.089, p<0.579). (B) The scatterplot shows the correlation between the TBW levels measured using the conventional formula (x-axis) and the changes in intracellular water (ICW) determined by BIA (y-axis) on the first and third days (y=0.085x+1.593, r=0.036, p=0.251). Dash-dotted lines represent the 95% limits of agreement. The differences between the two methods were regressed using the average values obtained with two methods (solid line).
8444Indexed in: [Current Contents/Clinical Medicine] [SCI Expanded] [ISI Alerting System] [ISI Journals Master List] [Index Medicus/MEDLINE] [EMBASE/Excerpta Medica] [Chemical Abstracts/CAS]
Yoon S.-H. et al.: BET and body water in hypernatremia
© Med Sci Monit, 2019; 25: 8438-8446CLINICAL RESEARCH
This work is licensed under Creative Common Attribution-NonCommercial-NoDerivatives 4.0 International (CC BY-NC-ND 4.0)
that passes through the ECW will be affected more than the ICW in hypernatremia. The TBW level measured by the BCM device was automatically calculated from the ICW and ECW values. Therefore, the TBW measured with the BCM would have been affected by any changes in the ECW.
In this present study, treatment of hypernatremia was individ-ualized according to the physician’s judgment. At day 3 after enrollment, the calculated values of water deficiency decreased
30TBW (BIA, Liter)
TBW
(sod
ium
corre
cted
Wat
son
form
ula,
Liter
)
20 40 50
35
30
25
20
15
25Mean (Liter)
Abso
lute
diffe
renc
e (Lit
er)
2015 30 302520 4035
–5
–10
–15
–20
–25
–30
Mean (Liter)
Perce
ntag
e diff
eren
ce (%
)
–20
–40
–60
–80
–100
A B C
Figure 7. Correlation between the levels of total body water (TBW) measured by the conventional formula and bioelectrical impedance analysis (BIA) in patients with sepsis. (A) The scatterplot shows the correlation between the levels of total body water (TBW) calculated by the conventional formula (x-axis) and measured using the bioelectrical impedance analysis (BIA) (y-axis) (r=0.834, P <0.001). (B) The generalized Bland-Altman plot of the agreement between the TBW values measured by the conventional formula and BIA. The differences between the measurements (y-axis) were plotted against the average of the measurements (x-axis) (r=0.617, P<0.001). (C) The differences between the measurements expressed as percentages of the values (y-axis) were plotted against the mean of the two measurements (x-axis) (r =0.846, P<0.001). Dash-dotted lines represent the 95% limits of agreement. The differences between the two measurement methods were regressed using the average values obtained with these two methods (solid line).
30ICW (BIA, Liter)
TBW
(sod
ium co
rrecte
d Wat
son f
orm
ula, L
iter)
20 4010
35
30
25
20
15
30Mean (Liter)
Abso
lute d
i�ere
nce (
Liter
)
20 2515 35 30252015 35
5
0
–5
–10
–15
–20
–25
Mean (Liter)
Perce
ntag
e di�
erenc
e (%
)20
0
–20
–40
–60
–80
–100
A B C
Figure 8. Correlation between the level of total body water (TBW) calculated by the conventional formula and the levels of intracellular water (ICW) determined by bioelectrical impedance analysis (BIA) in patients with sepsis. (A) The scatterplot shows the correlation between the level of total body water (TBW) measured by the conventional formula (x-axis) and the level of intracellular water (ICW) measured by bioelectrical impedance analysis (BIA) (y-axis) (r=0.562, P <0.01). (B) The generalized Bland-Altman plot of the agreement between the levels of TBW measured by the conventional formula and BIA. Differences between the measurements (y-axis) were plotted against the average of the measurements (x-axis) (r=0.321, P=0.159). (C) The differences between the measurements expressed as percentages of the values (y-axis) were plotted against the mean of the two measurements (x-axis) (r=0.327, P=0.159) Dash-dotted lines represent the 95% limits of agreement. The differences between the two methods were regressed using the average values obtained with the two methods (solid line).
as the plasma levels of sodium decreased. However, there was no correlation with the values of BIA. A previously published study reported that after infusion of 1L of isotonic saline, the resistance of the BIA immediately fell and showed a significant relationship with ICW [20]. Another study showed that after drinking 466 ml of isotonic saline, and increased plasma vol-ume was found, but this hyperhydration was not detectable with single frequency BIA [21]. Therefore, further studies are needed to determine the accuracy of BIA following hydration.
8445Indexed in: [Current Contents/Clinical Medicine] [SCI Expanded] [ISI Alerting System] [ISI Journals Master List] [Index Medicus/MEDLINE] [EMBASE/Excerpta Medica] [Chemical Abstracts/CAS]
Yoon S.-H. et al.: BET and body water in hypernatremia© Med Sci Monit, 2019; 25: 8438-8446
CLINICAL RESEARCH
This work is licensed under Creative Common Attribution-NonCommercial-NoDerivatives 4.0 International (CC BY-NC-ND 4.0)

A previous study reported that systemic inflammation increas-es vascular permeability and produces changes between the distribution of TBW. Changes in tissue physiology and integrity during sepsis may produce changes in electrical properties [22]. Even though changes of TBW were similar, patients with sepsis and peritonitis have been shown to have higher ECW values compared with patients with traumatic injury [23]. Therefore, we performed a subset analysis of data in 23 patients with sepsis and 28 patients without sepsis, which showed no sig-nificant difference. This finding might be explained by the rel-atively small size of the study population, which could influ-ence the accuracy of the analysis. Even though the patients in our study were not diagnosed with sepsis, they might have had systemic inflammation. Therefore, further larger studies are needed to evaluate the efficacy of BIA in patients with or without inflammation.
This study had several limitations. First, the water deficit for-mula used in this study was not the gold standard method for measuring the TBW. However, although isotopic dilution methods can measure body water content more accurately, the conventional water deficit formula is more frequent-ly used in clinical practice. Second, the accuracy of the body weights may have been affected as some patients could not stand and had to be weighed using a hoist and scale at the
bedside. Third, in this study, we did not examine markers that could predict inflammation, such as C-reactive protein (CRP).
Conclusions
In this study, body water measurements, using bioelectrical im-pedance analysis (BIA), did not accurately represent the body water content in patients with hypernatremia. Therefore, it is not possible to recommend replacing standard blood testing methods with BIA for the assessment of body water content in hypernatremia. However, the ICW measured by BIA may represent plasma sodium level more accurately than ECW or TBW. BIA has certain limitations, most importantly, the dif-ficulty in validating the method under varied clinical condi-tions that include abnormal hydration status, and in patients of different age and ethnicity. However, the findings from the present study may form the basis for future developments in the practical use of BIA in specific clinical conditions such as hypernatremia.
Conflict of interest
None.
References:
1. Adrogué HJ, Madias NE: Hypernatremia. N Engl J Med, 2000; 342: 1493–99
2. Sterns RH: Disorders of plasma sodium – causes, consequences, and cor-rection. N Engl J Med, 2015; 372: 55–65
3. Lindner G, Funk GC: Hypernatremia in critically ill patients. J Crit Care, 2013; 28: 216.e11–20
4. Sterns RH: Formulas for fixing serum sodium: Curb your enthusiasm. Clin Kidney J, 2016; 9: 527–29
5. López-Gómez JM: Evolution and applications of bioimpedance in manag-ing chronic kidney disease. Nefrologia, 2011; 31: 630–34
6. Covic A, Onofriescu M: Time to improve fluid management in hemodialy-sis: Should we abandon clinical assessment and routinely use bioimped-ance? Clin J Am Soc Nephrol, 2013; 8: 1474–75
7. Kim JS, Lee JY, Park H et al: Estimation of body fluid volume by bioimped-ance spectroscopy in patients with hyponatremia. Yonsei Med J, 2014; 55: 482–86
8. World Heath Orgnisation (WHO): WHO best practices for injections and re-lated procedures toolkit. WHO, Geneva, Switzerland, 2010
9. Watson PE, Watson ID, Batt RD: Total body water volumes for adult males and females estimated from simple anthropometric measurements. Am J Clin Nutr, 1980; 33: 27–39
10. Onofriescu M, Siriopol D, Voroneanu L et al: Overhydration, cardiac func-tion and survival in hemodialysis patients. PLoS One, 2015; 10: e0135691
11. Onofriescu M, Hogas S, Voroneanu L et al: Bioimpedance-guided fluid man-agement in maintenance hemodialysis: A pilot randomized controlled tri-al. Am J Kidney Dis, 2014; 64: 111–18
12. O’Brien C, Baker-Fulco CJ, Young AJ, Sawka MN: Bioimpedance assessment of hypohydration. Med Sci Sports Exerc, 1999; 31: 1466–71
13. Gatterer H, Schenk K, Laninschegg L et al: Bioimpedance identifies body fluid loss after exercise in the heat: A pilot study with body cooling. PLoS One, 2014; 9: e109729
14. Kafri MW, Myint PK, Doherty D et al: The diagnostic accuracy of multi-fre-quency bioelectrical impedance analysis in diagnosing dehydration after stroke. Med Sci Monit, 2013; 19: 548–70
15. Olde Rikkert MG, Deurenberg P, Jansen RW et al: Validation of multi-fre-quency bioelectrical impedance analysis in detecting changes in fluid bal-ance of geriatric patients. J Am Geriatr Soc, 1997; 45: 1345–51
16. O’Brien C, Young AJ, Sawka MN: Bioelectrical impedance to estimate chang-es in hydration status. Int J Sports Med, 2002; 23: 361–66
17. Pearman P, Hunter G, Hendricks C, O’Sullivan P: Comparison of hydrostat-ic weighing and bioelectric impedance measurements in determining body composition pre- and post dehydration. J Orthop Sports Phys Ther, 1989; 10: 451–55
18. Asselin M-C, Kriemler S, Chettle DR et al: Hydration status assessed by multi-frequency bioimpedance analysis. Appl Radiat Isot, 1998; 49: 495–97
19. Khaled MA, McCutcheon MJ, Reddy S et al: Electrical impedance in assess-ing human body composition: The BIA method. Am J Clin Nutr, 1988; 47: 789–92
20. Scheltinga MR, Jacobs DO, Kimbrough TD, Wilmore DW: Alterations in body fluid content can be detected by bioelectrical impedance analysis. J Surg Res, 1991; 50: 461–68
21. Matthews EL, Hosick PA: Bioelectrical impedance analysis does not de-tectan increase in total body water following isotonic fluid consumption. Appl Physiol Nutr Metab, 2019 [Epub ahead of print].
22. Malbrain ML, Huygh J, Dabrowski W et al: The use of bio-electrical imped-ance analysis (BIA) to guide fluid management, resuscitation and deresus-citation in critically ill patients: A bench-to-bedside review. Anaesthesiol Intensive Ther, 2014; 46: 381–91
23. Plank LD, Hill GL: Similarity of changes in body composition in intensive care patients following severe sepsis or major blunt injury. Ann NY Acad Sci, 2000; 904: 592–602
8446Indexed in: [Current Contents/Clinical Medicine] [SCI Expanded] [ISI Alerting System] [ISI Journals Master List] [Index Medicus/MEDLINE] [EMBASE/Excerpta Medica] [Chemical Abstracts/CAS]
Yoon S.-H. et al.: BET and body water in hypernatremia
© Med Sci Monit, 2019; 25: 8438-8446CLINICAL RESEARCH
This work is licensed under Creative Common Attribution-NonCommercial-NoDerivatives 4.0 International (CC BY-NC-ND 4.0)