Embed Size (px)
Citation preview
BIOECONOMY IN EMILIA-ROMAGNA Daniela Sani
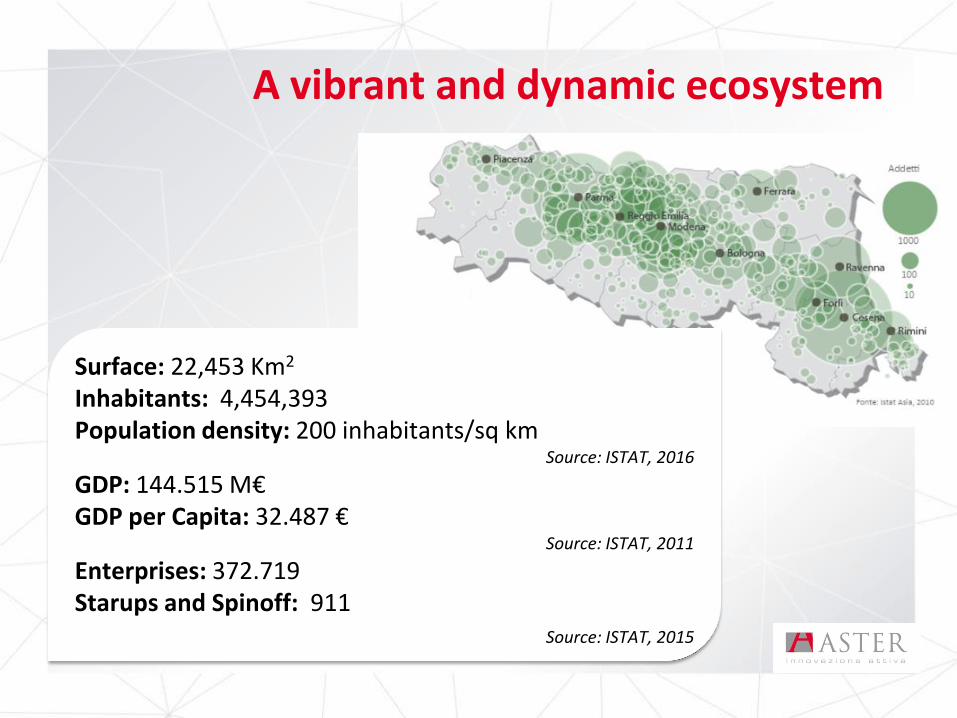
A vibrant and dynamic ecosystem
Surface: 22,453 Km2
Inhabitants: 4,454,393 Population density: 200 inhabitants/sq km
Source: ISTAT, 2016
GDP: 144.515 M€ GDP per Capita: 32.487 €
Source: ISTAT, 2011
Enterprises: 372.719 Starups and Spinoff: 911
Source: ISTAT, 2015
A vibrant and dynamic ecosystem
Surface: 22,453 Km2
Inhabitants: 4,454,393 Population density: 200 inhabitants/sq km
Source: ISTAT, 2016
GDP: 144.515 M€ GDP per Capita: 32.487 €
Source: ISTAT, 2011
Enterprises: 372.719 Starups and Spinoff: 911
Source: ISTAT, 2015
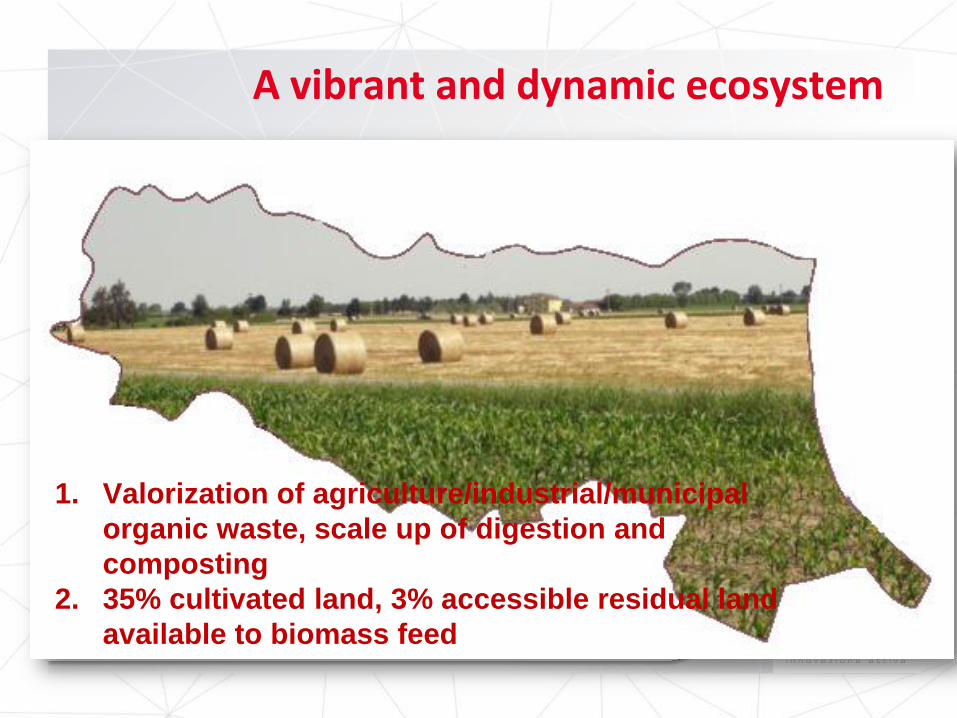
1. Valorization of agriculture/industrial/municipal
organic waste, scale up of digestion and
composting
2. 35% cultivated land, 3% accessible residual land
available to biomass feed
A vibrant and dynamic ecosystem
Surface: 22,453 Km2
Inhabitants: 4,454,393 Population density: 200 inhabitants/sq km
Source: ISTAT, 2016
GDP: 144.515 M€ GDP per Capita: 32.487 €
Source: ISTAT, 2011
Enterprises: 372.719 Starups and Spinoff: 911
Source: ISTAT, 2015
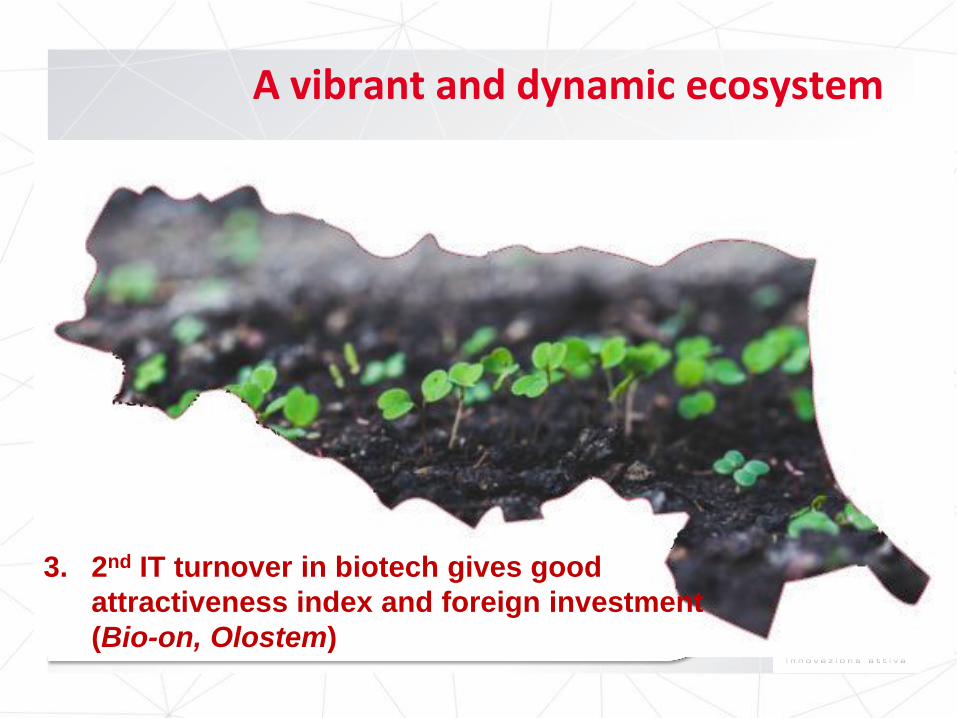
3. 2nd IT turnover in biotech gives good
attractiveness index and foreign investment
(Bio-on, Olostem)
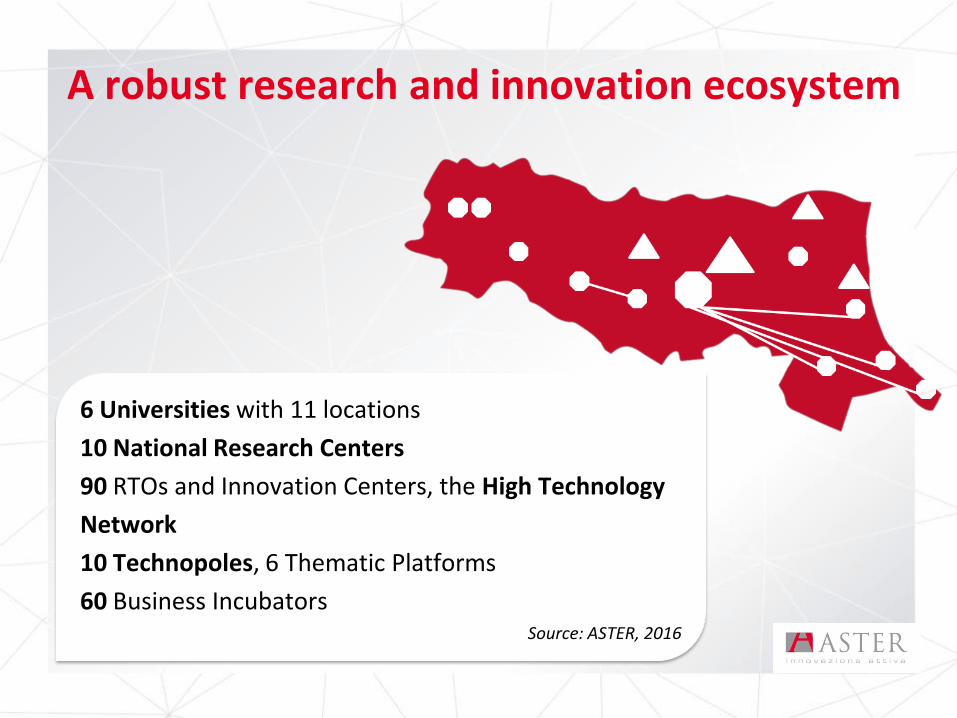
6 Universities with 11 locations
10 National Research Centers
90 RTOs and Innovation Centers, the High Technology
Network
10 Technopoles, 6 Thematic Platforms
60 Business Incubators Source: ASTER, 2016
A robust research and innovation ecosystem
6 Universities with 11 locations and 10 National
Research Centres
High Technology Network, more than 90 RTOs and
Innovation Centres
10 Technopoles, 6 Thematic Platform
60 Business Incubators Source: ASTER, 2016
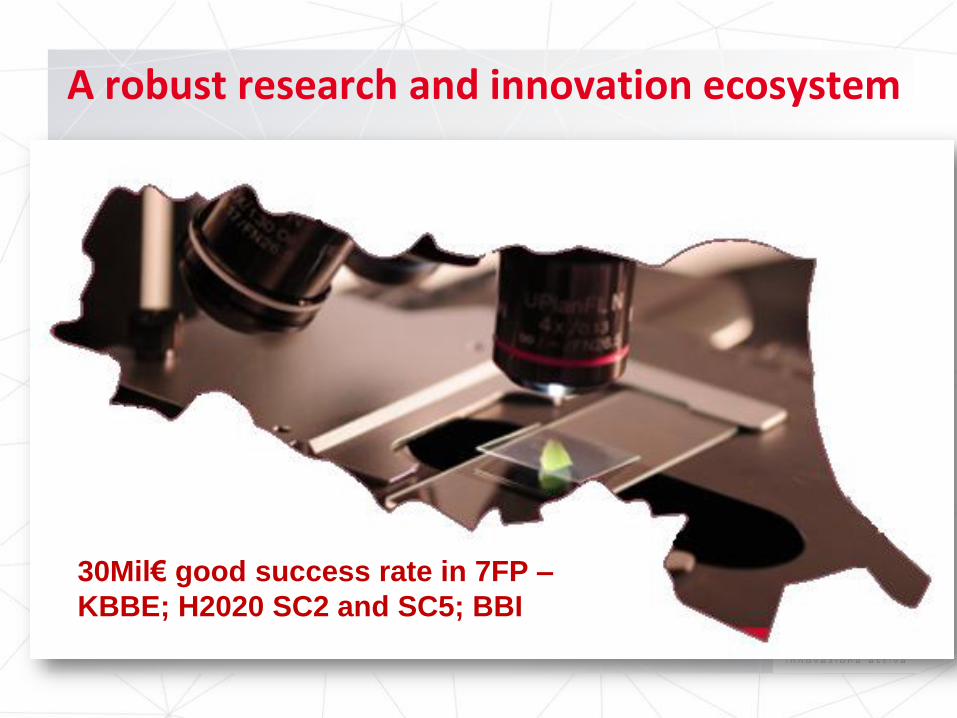
A robust research and innovation ecosystem
30Mil€ good success rate in 7FP –
KBBE; H2020 SC2 and SC5; BBI
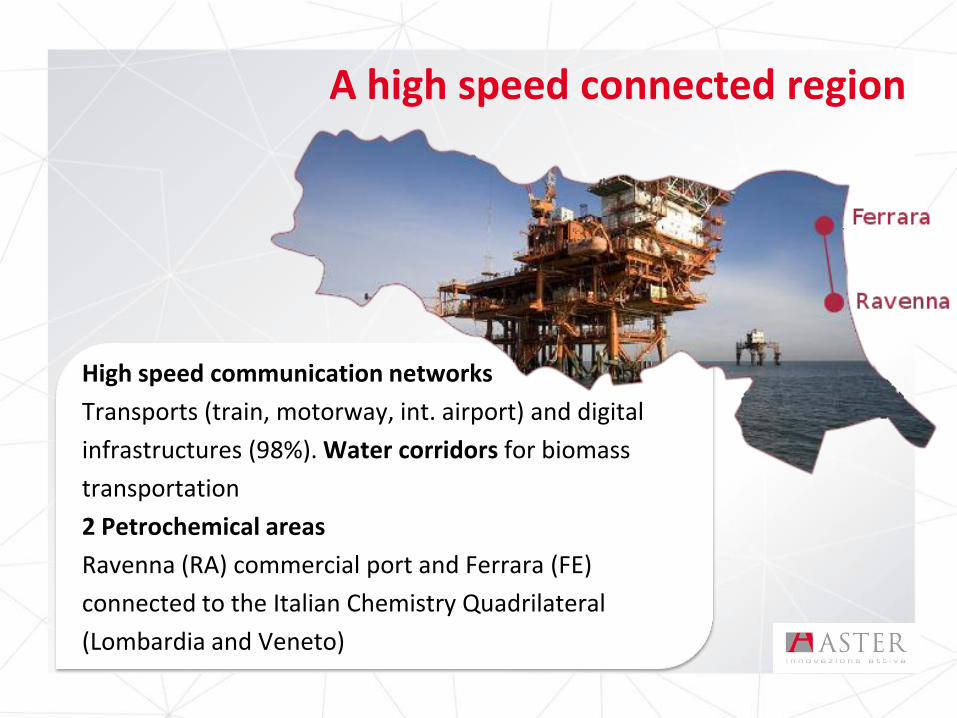
High speed communication networks
Transports (train, motorway, int. airport) and digital
infrastructures (98%). Water corridors for biomass
transportation
2 Petrochemical areas
Ravenna (RA) commercial port and Ferrara (FE)
connected to the Italian Chemistry Quadrilateral
(Lombardia and Veneto)
A high speed connected region
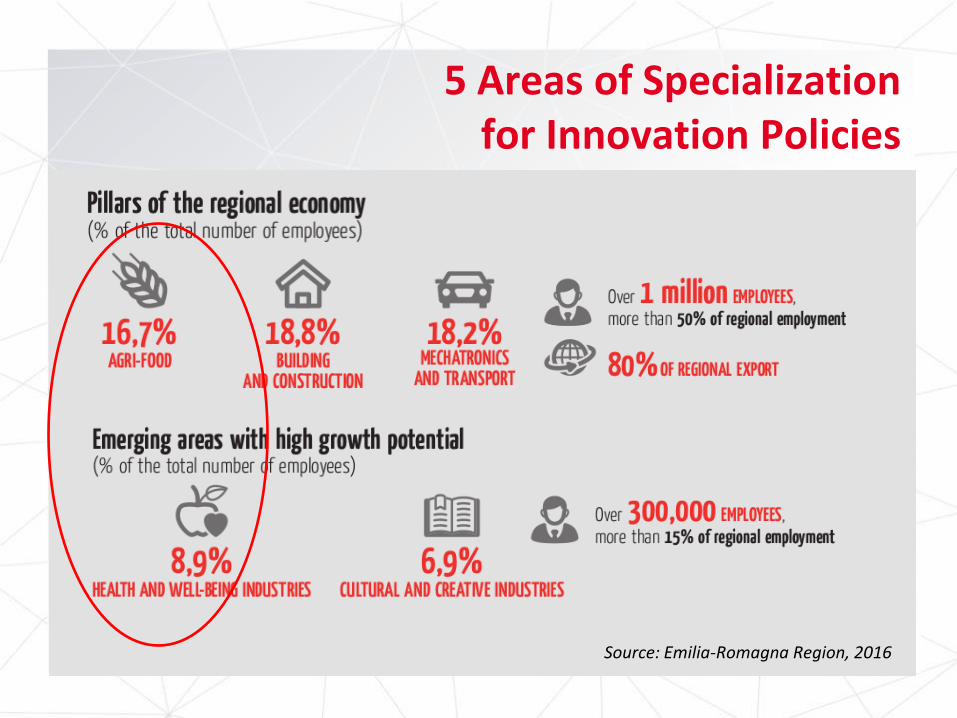
5 Areas of Specialization for Innovation Policies
Source: Emilia-Romagna Region, 2016
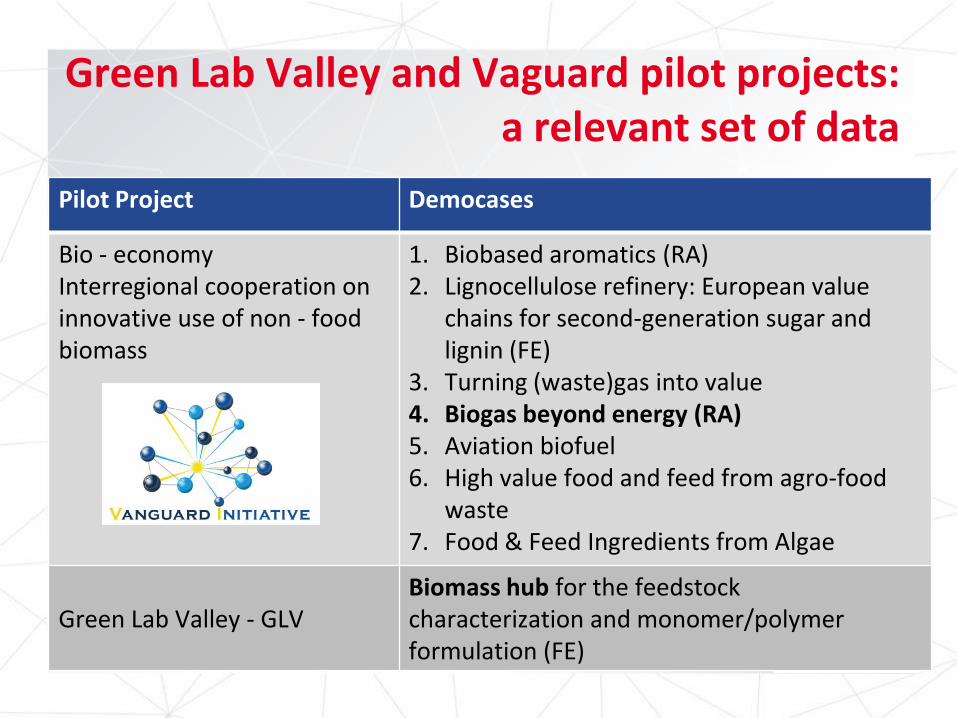
Pilot Project Democases
Bio - economy Interregional cooperation on innovative use of non - food biomass
1. Biobased aromatics (RA) 2. Lignocellulose refinery: European value
chains for second-generation sugar and lignin (FE)
3. Turning (waste)gas into value 4. Biogas beyond energy (RA) 5. Aviation biofuel 6. High value food and feed from agro-food
waste 7. Food & Feed Ingredients from Algae
Green Lab Valley - GLV Biomass hub for the feedstock characterization and monomer/polymer formulation (FE)
Green Lab Valley and Vaguard pilot projects: a relevant set of data
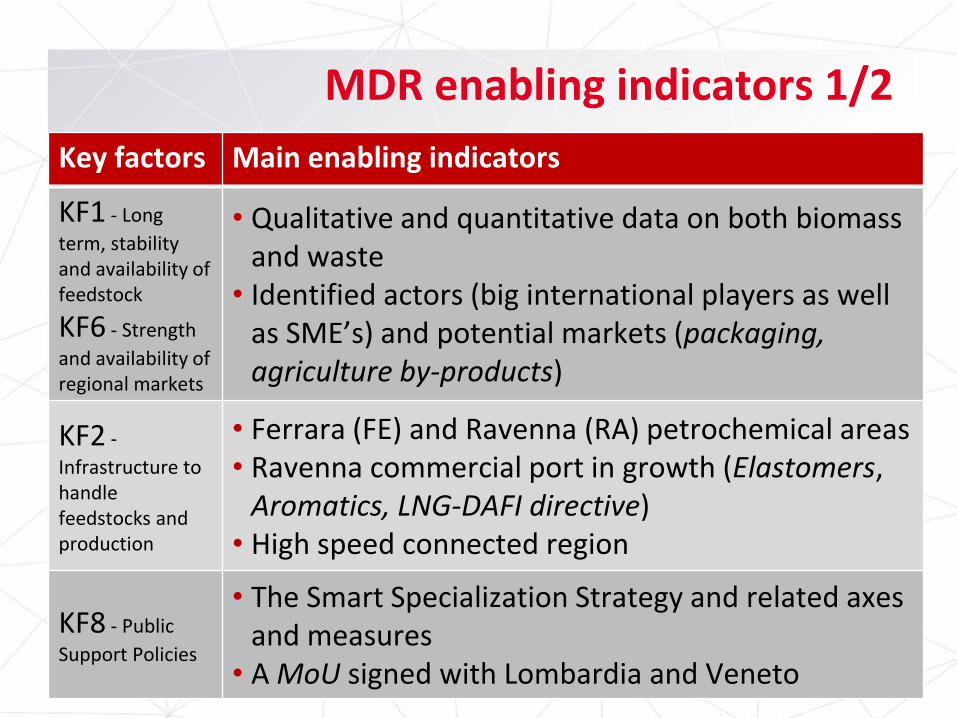
MDR enabling indicators 1/2
Key factors Main enabling indicators
KF1 - Long
term, stability and availability of feedstock
KF6 - Strength
and availability of regional markets
• Qualitative and quantitative data on both biomass and waste
• Identified actors (big international players as well as SME’s) and potential markets (packaging, agriculture by-products)
KF2 -
Infrastructure to handle feedstocks and production
• Ferrara (FE) and Ravenna (RA) petrochemical areas • Ravenna commercial port in growth (Elastomers,
Aromatics, LNG-DAFI directive) • High speed connected region
KF8 - Public
Support Policies
• The Smart Specialization Strategy and related axes and measures
• A MoU signed with Lombardia and Veneto
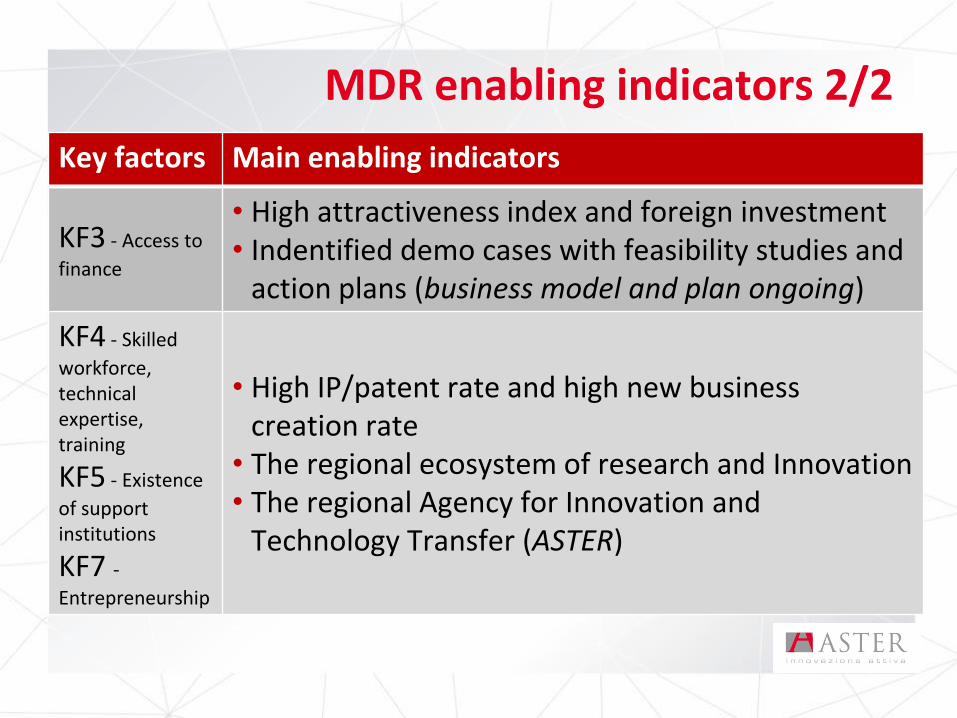
MDR enabling indicators 2/2
Key factors Main enabling indicators
KF3 - Access to
finance
• High attractiveness index and foreign investment • Indentified demo cases with feasibility studies and
action plans (business model and plan ongoing)
KF4 - Skilled
workforce, technical expertise, training
KF5 - Existence
of support institutions
KF7 - Entrepreneurship
• High IP/patent rate and high new business creation rate
• The regional ecosystem of research and Innovation • The regional Agency for Innovation and
Technology Transfer (ASTER)
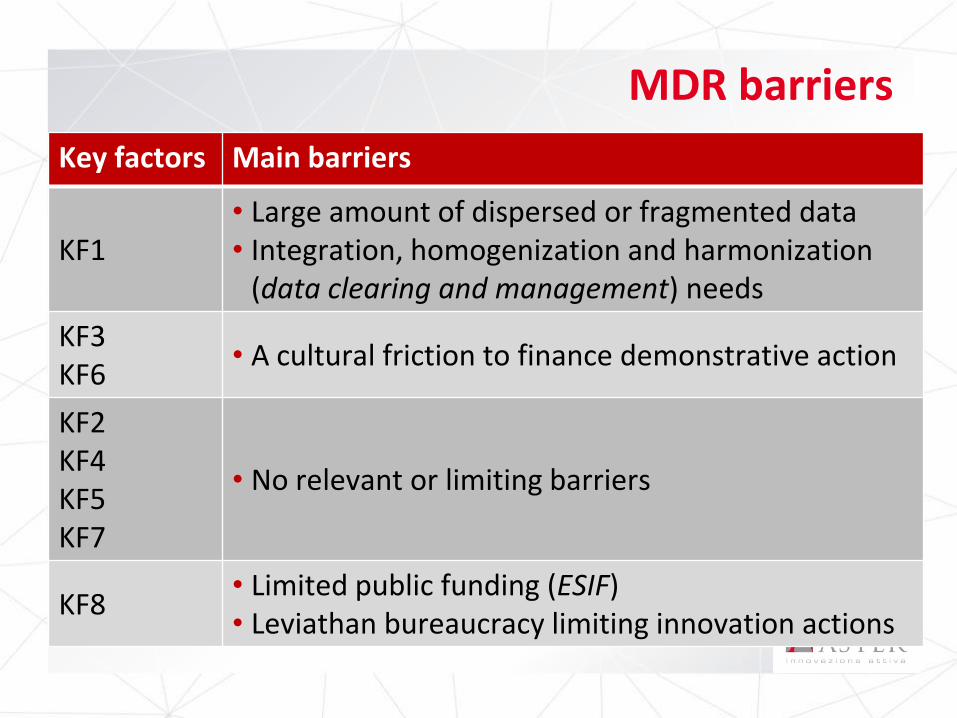
MDR barriers
Key factors Main barriers
KF1 • Large amount of dispersed or fragmented data • Integration, homogenization and harmonization
(data clearing and management) needs
KF3 KF6
• A cultural friction to finance demonstrative action
KF2 KF4 KF5 KF7
• No relevant or limiting barriers
KF8 • Limited public funding (ESIF) • Leviathan bureaucracy limiting innovation actions
Final Conference EC-ECRN: Boosting Regional Investment in Sustainable Chemicals Brusselles 14 September 2017
Daniela Sani, [email protected]