Embed Size (px)
Citation preview
SUPPLEMENTARY INFORMATION
Biodistribution studies of ultrasmall silicon nanoparticles and
carbon dots in experimental rats and tumor mice
Nadia Licciardello
1,2,3#, Sebastian Hunoldt
1#, Ralf Bergmann
1, Garima Singh
1, Constantin
Mamat1, Angélique Faramus
2,3, John L. Z. Ddungu
2,3, Simone Silvestrini
4, Michele Maggini
4,
Luisa De Cola 2,3*
, Holger Stephan1*
1Institute of Radiopharmaceutical Cancer Research, Helmholtz-Zentrum Dresden - Rossendorf,
Bautzner Landstraße 400, Dresden, D-01328, Germany
2Laboratoire de Chimie et des Biomatériaux Supramoléculaires, Institut de Science et d’Ingénierie
Supramoléculaires (ISIS), 8 allée Gaspard Monge, Strasbourg, 67000, France
3Institut fuer Nanotechnologie (INT), Karlsruher Institut fuer Technologie (KIT) Campus North,
Hermann-von-Helmholtz-Platz 1, Eggenstein-Leopoldshafen, 76344, Germany
4Department of Chemical Sciences, University of Padova, Via Marzolo 1, 35131 Padova, Italy
# These authors contributed equally.
Corresponding authors:
Dr. Holger Stephan, Helmholtz-Zentrum Dresden - Rossendorf, Institute of Radiopharmaceutical
Cancer Research, Bautzner Landstrasse 400, 01328 Dresden, Germany, Phone: +49 3512603091,
Fax: +49 3512603232, E-Mail: [email protected]
Prof. Luisa De Cola; Laboratoire de Chimie et des Biomatériaux Supramoléculaires, Institut de
Science et d’Ingénierie Supramoléculaires (ISIS), 8 allée Gaspard Monge, Strasbourg, 67000, France,
Phone: +33 368855220; Fax: +33 368855242, E-Mail: [email protected]
Electronic Supplementary Material (ESI) for Nanoscale.This journal is © The Royal Society of Chemistry 2018
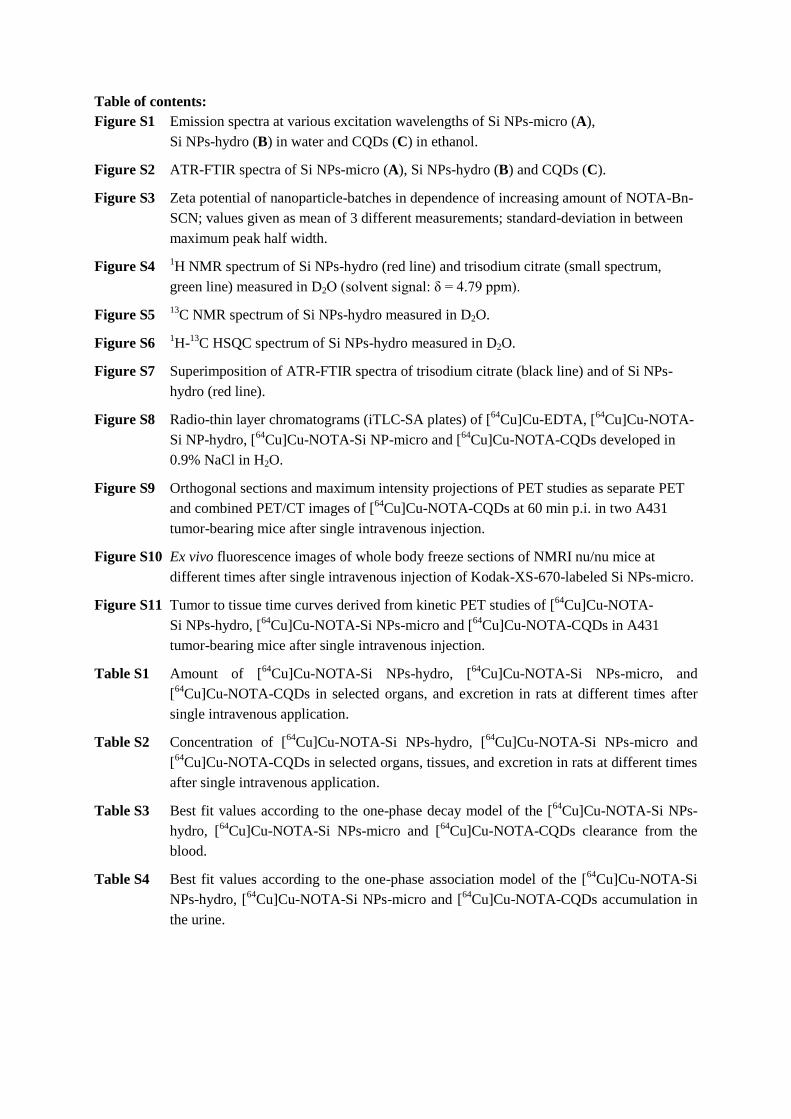
Table of contents:
Figure S1 Emission spectra at various excitation wavelengths of Si NPs-micro (A),
Si NPs-hydro (B) in water and CQDs (C) in ethanol.
Figure S2 ATR-FTIR spectra of Si NPs-micro (A), Si NPs-hydro (B) and CQDs (C).
Figure S3 Zeta potential of nanoparticle-batches in dependence of increasing amount of NOTA-Bn-
SCN; values given as mean of 3 different measurements; standard-deviation in between
maximum peak half width.
Figure S4 1H NMR spectrum of Si NPs-hydro (red line) and trisodium citrate (small spectrum,
green line) measured in D2O (solvent signal: δ = 4.79 ppm).
Figure S5 13
C NMR spectrum of Si NPs-hydro measured in D2O.
Figure S6 1H-
13C HSQC spectrum of Si NPs-hydro measured in D2O.
Figure S7 Superimposition of ATR-FTIR spectra of trisodium citrate (black line) and of Si NPs-
hydro (red line).
Figure S8 Radio-thin layer chromatograms (iTLC-SA plates) of [64
Cu]Cu-EDTA, [64
Cu]Cu-NOTA-
Si NP-hydro, [64
Cu]Cu-NOTA-Si NP-micro and [64
Cu]Cu-NOTA-CQDs developed in
0.9% NaCl in H2O.
Figure S9 Orthogonal sections and maximum intensity projections of PET studies as separate PET
and combined PET/CT images of [64
Cu]Cu-NOTA-CQDs at 60 min p.i. in two A431
tumor-bearing mice after single intravenous injection.
Figure S10 Ex vivo fluorescence images of whole body freeze sections of NMRI nu/nu mice at
different times after single intravenous injection of Kodak-XS-670-labeled Si NPs-micro.
Figure S11 Tumor to tissue time curves derived from kinetic PET studies of [64
Cu]Cu-NOTA-
Si NPs-hydro, [64
Cu]Cu-NOTA-Si NPs-micro and [64
Cu]Cu-NOTA-CQDs in A431
tumor-bearing mice after single intravenous injection.
Table S1 Amount of [64
Cu]Cu-NOTA-Si NPs-hydro, [64
Cu]Cu-NOTA-Si NPs-micro, and
[64
Cu]Cu-NOTA-CQDs in selected organs, and excretion in rats at different times after
single intravenous application.
Table S2 Concentration of [64
Cu]Cu-NOTA-Si NPs-hydro, [64
Cu]Cu-NOTA-Si NPs-micro and
[64
Cu]Cu-NOTA-CQDs in selected organs, tissues, and excretion in rats at different times
after single intravenous application.
Table S3 Best fit values according to the one-phase decay model of the [64
Cu]Cu-NOTA-Si NPs-
hydro, [64
Cu]Cu-NOTA-Si NPs-micro and [64
Cu]Cu-NOTA-CQDs clearance from the
blood.
Table S4 Best fit values according to the one-phase association model of the [64
Cu]Cu-NOTA-Si
NPs-hydro, [64
Cu]Cu-NOTA-Si NPs-micro and [64
Cu]Cu-NOTA-CQDs accumulation in
the urine.
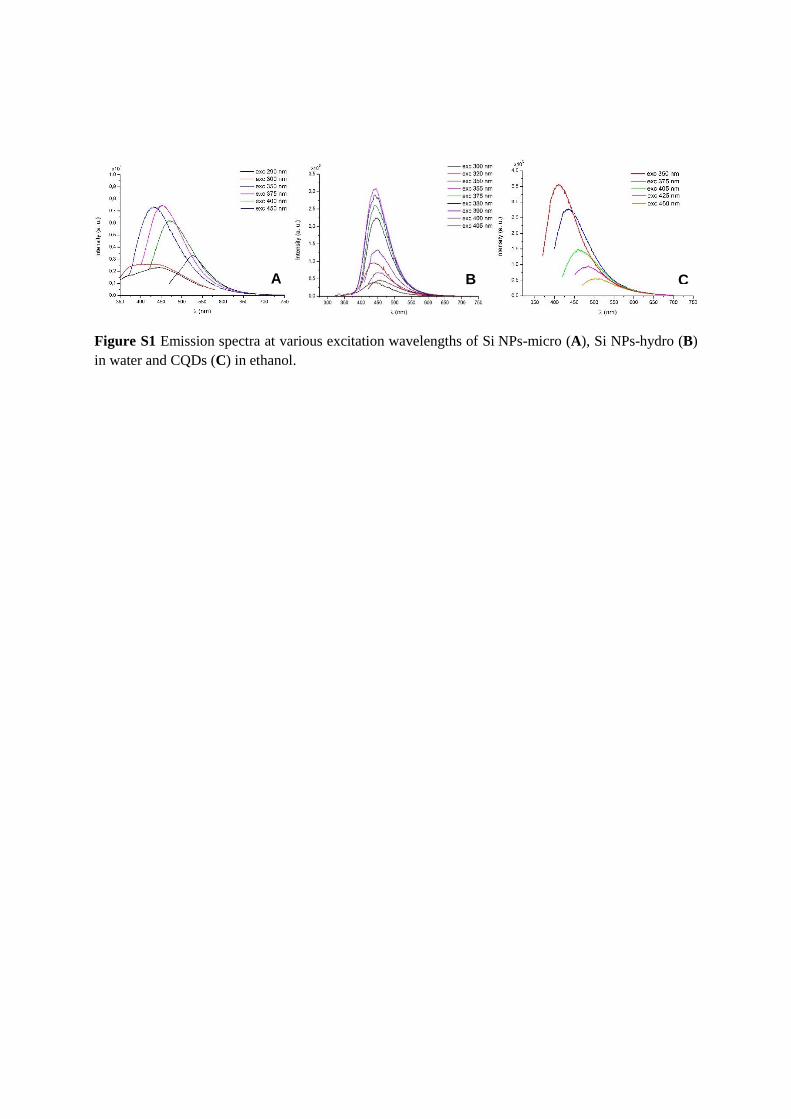
Figure S1 Emission spectra at various excitation wavelengths of Si NPs-micro (A), Si NPs-hydro (B)
in water and CQDs (C) in ethanol.
A B C
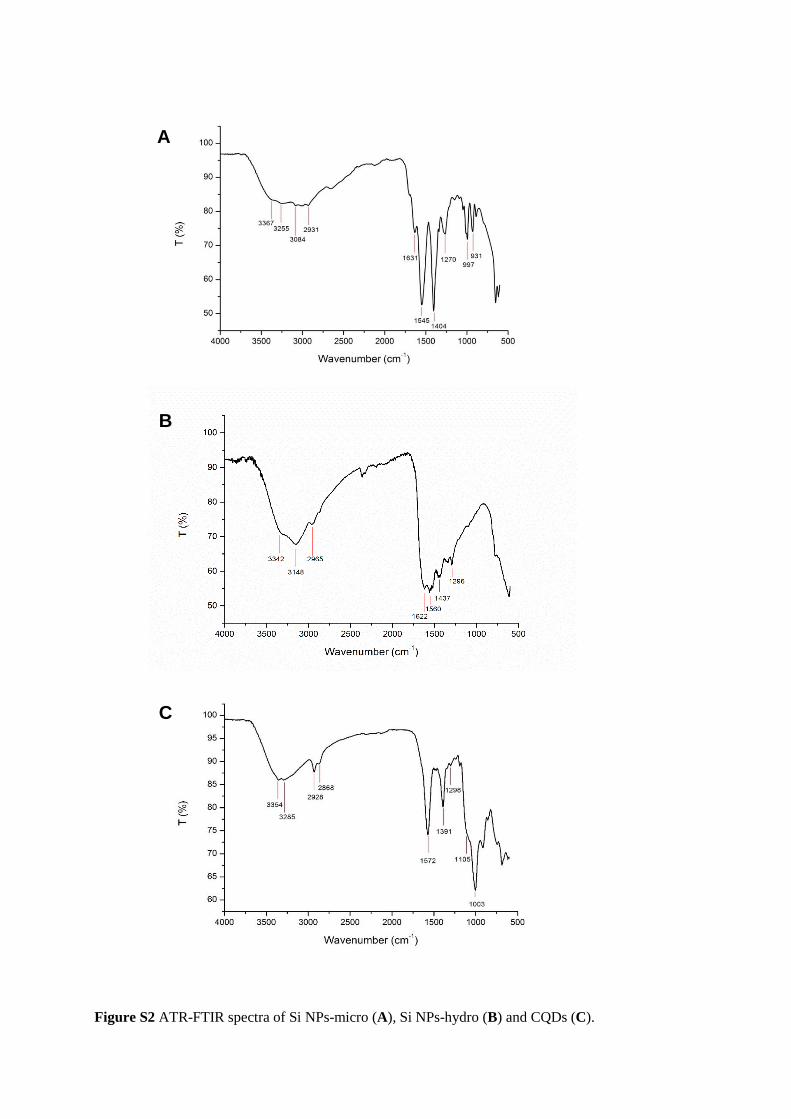
Figure S2 ATR-FTIR spectra of Si NPs-micro (A), Si NPs-hydro (B) and CQDs (C).
A
B
C
Figure S3 Zeta potential of nanoparticle-batches in dependence of increasing amount of NOTA-Bn-
SCN; values given as mean of 3 different measurements; standard-deviation in between maximum
peak half width.
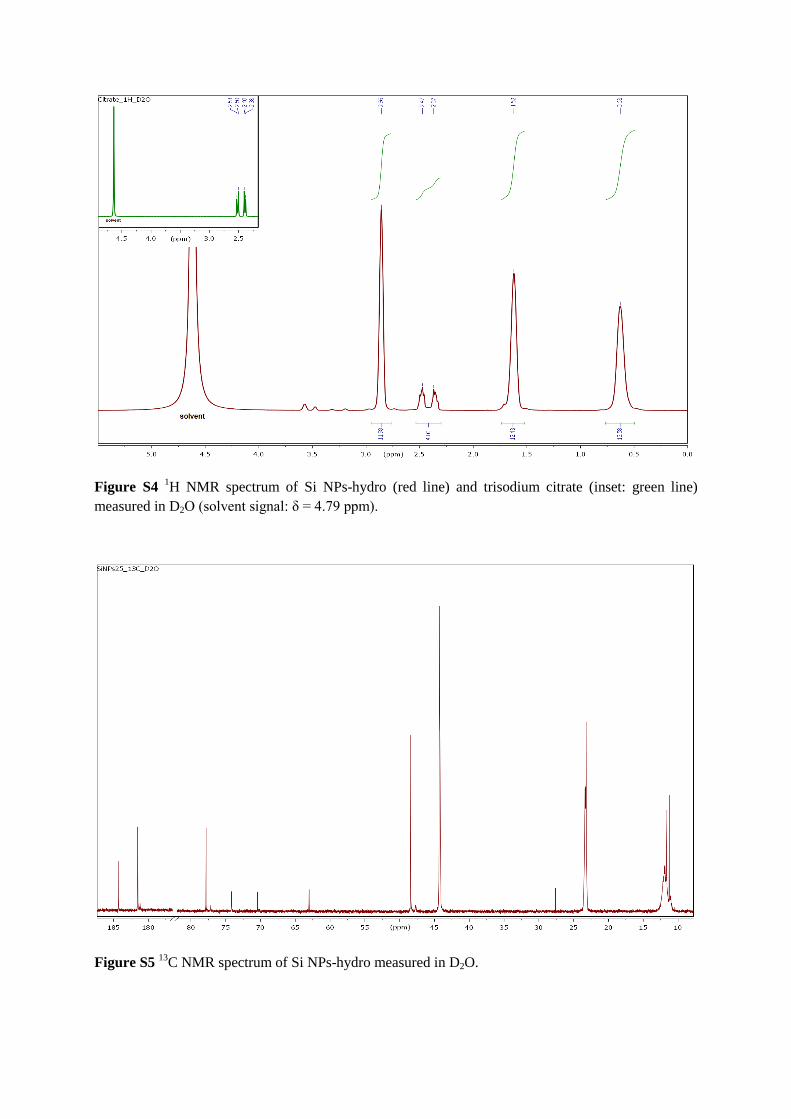
Figure S4 1H NMR spectrum of Si NPs-hydro (red line) and trisodium citrate (inset: green line)
measured in D2O (solvent signal: δ = 4.79 ppm).
Figure S5 13
C NMR spectrum of Si NPs-hydro measured in D2O.
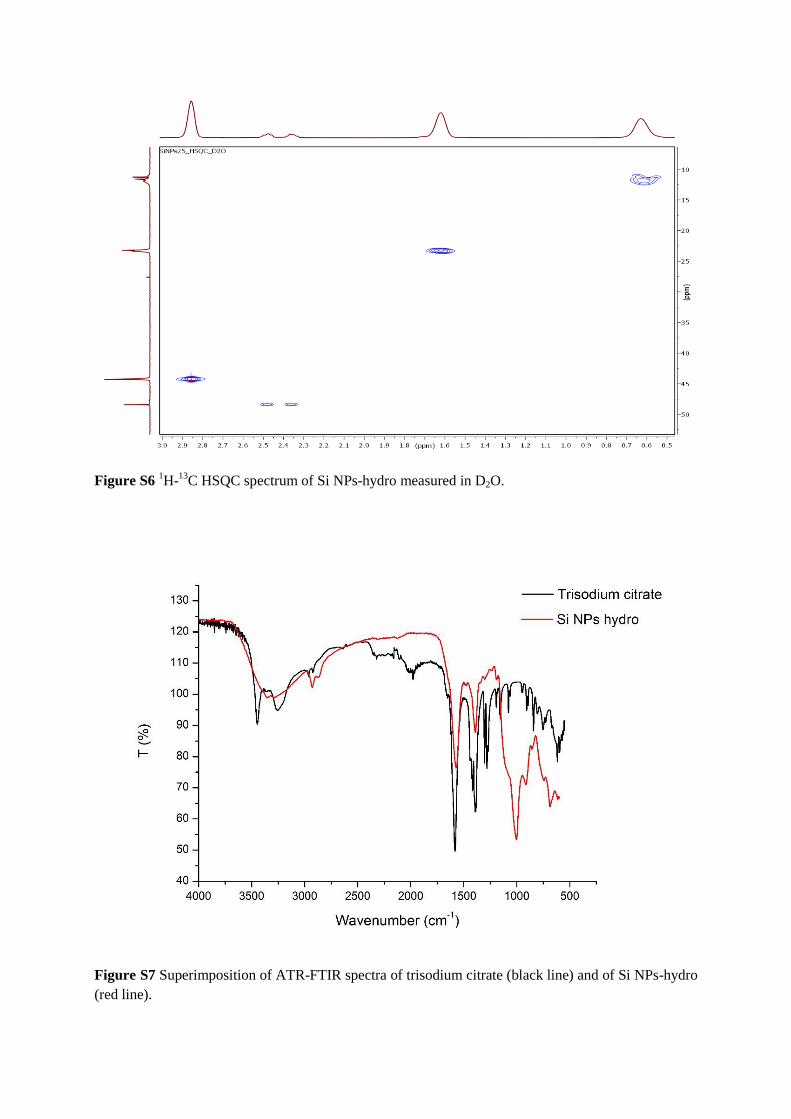
Figure S6 1H-
13C HSQC spectrum of Si NPs-hydro measured in D2O.
Figure S7 Superimposition of ATR-FTIR spectra of trisodium citrate (black line) and of Si NPs-hydro
(red line).
[64
Cu]Cu-EDTA
[64
Cu]Cu-NOTA-Si NP-micro
[64
Cu]Cu-NOTA-Si NP-hydro
[64
Cu]Cu-NOTA-CQDs
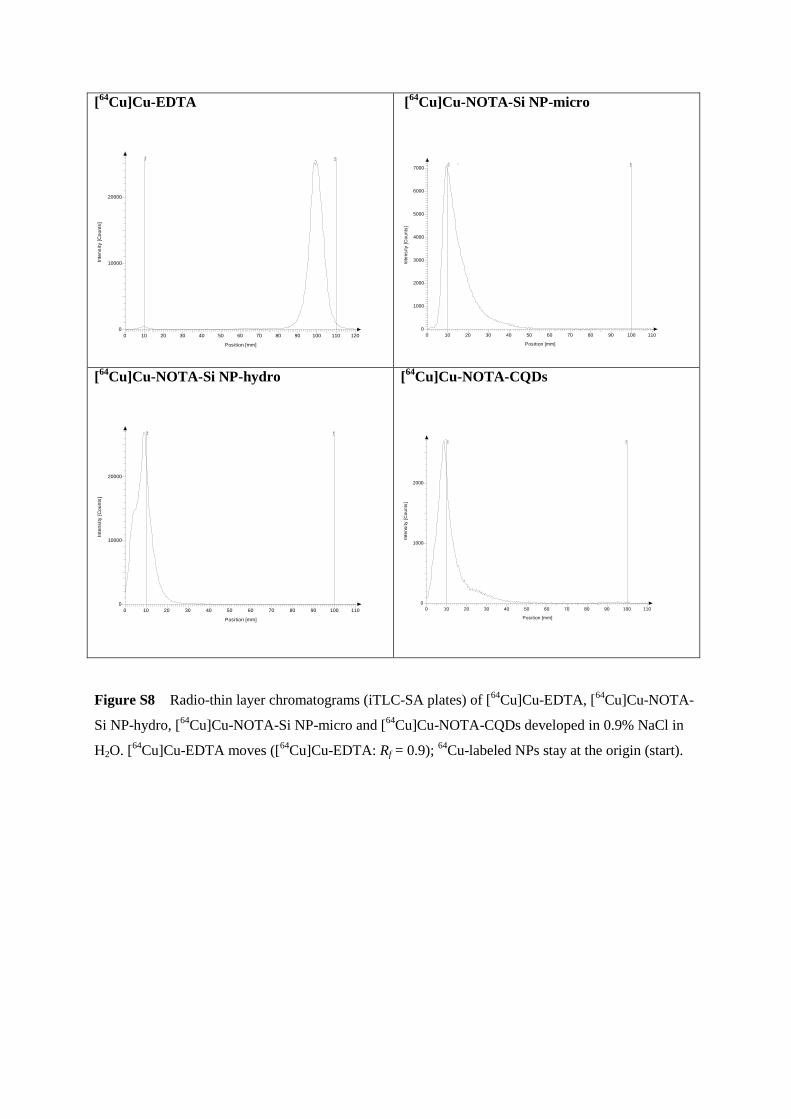
Figure S8 Radio-thin layer chromatograms (iTLC-SA plates) of [64
Cu]Cu-EDTA, [64
Cu]Cu-NOTA-
Si NP-hydro, [64
Cu]Cu-NOTA-Si NP-micro and [64
Cu]Cu-NOTA-CQDs developed in 0.9% NaCl in
H2O. [64
Cu]Cu-EDTA moves ([64
Cu]Cu-EDTA: Rf = 0.9); 64
Cu-labeled NPs stay at the origin (start).
Position [mm]
Inte
ns
ity
[C
ou
nts
]
0 10 20 30 40 50 60 70 80 90 100 110 120
0
10000
20000
Sta
rt
Fro
nt
1
Position [mm]
Inte
ns
ity
[C
ou
nts
]
0 10 20 30 40 50 60 70 80 90 100 110
0
10000
20000
Sta
rt
Fro
nt
Position [mm]
Inte
ns
ity
[C
ou
nts
]
0 10 20 30 40 50 60 70 80 90 100 110
0
1000
2000
3000
4000
5000
6000
7000
Sta
rt
Fro
nt1
Position [mm]
Inte
ns
ity
[C
ou
nts
]
0 10 20 30 40 50 60 70 80 90 100 110
0
1000
2000
Sta
rt
Fro
nt
1
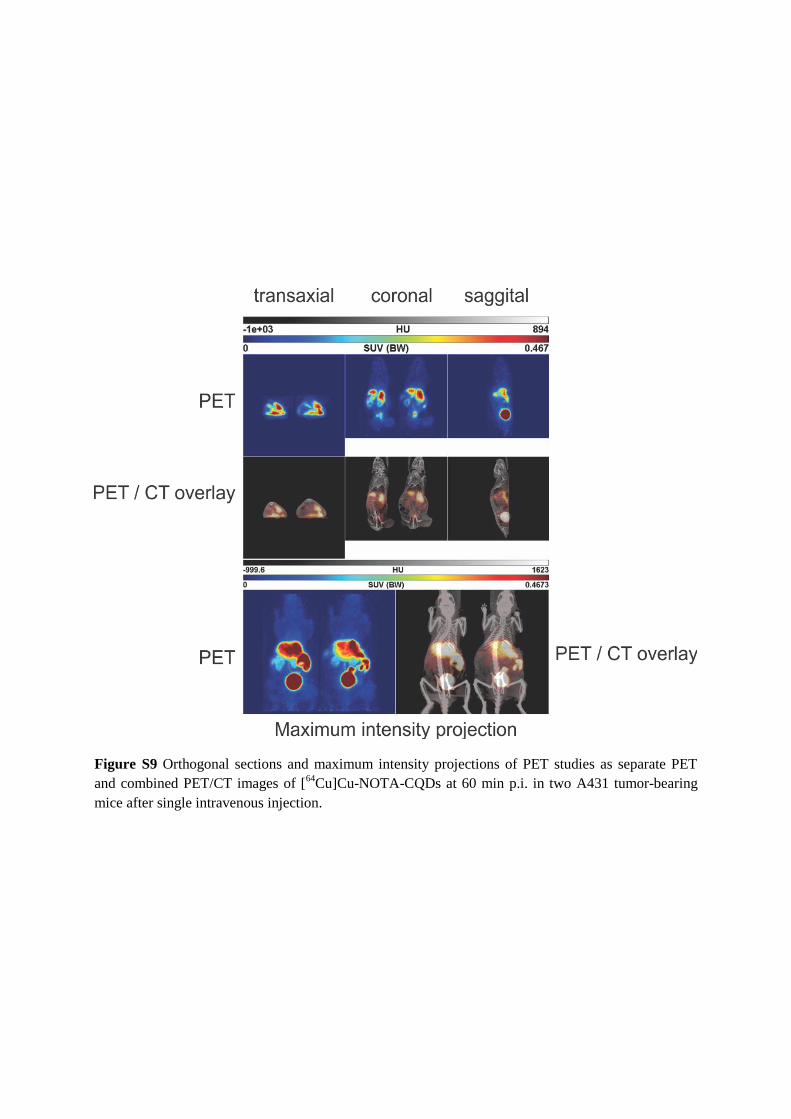
Figure S9 Orthogonal sections and maximum intensity projections of PET studies as separate PET
and combined PET/CT images of [64
Cu]Cu-NOTA-CQDs at 60 min p.i. in two A431 tumor-bearing
mice after single intravenous injection.
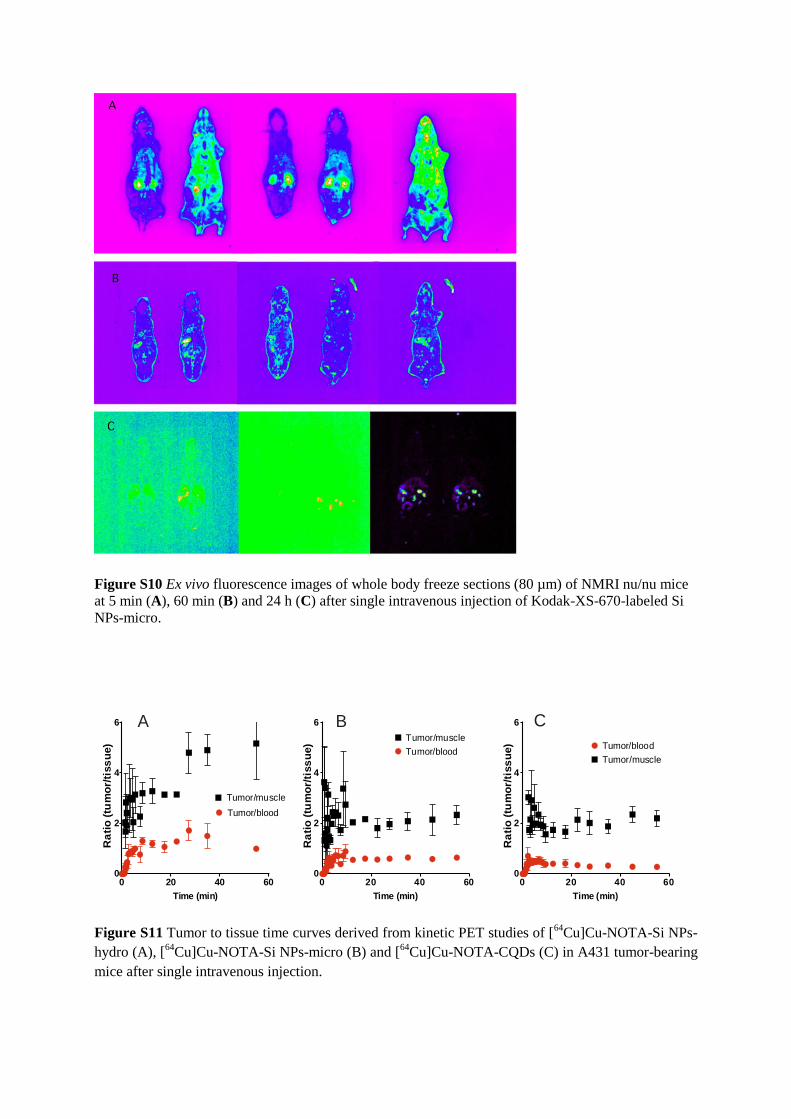
Figure S10 Ex vivo fluorescence images of whole body freeze sections (80 µm) of NMRI nu/nu mice
at 5 min (A), 60 min (B) and 24 h (C) after single intravenous injection of Kodak-XS-670-labeled Si
NPs-micro.
0 20 40 600
2
4
6
Time (min)
Ra
tio
(tu
mo
r/ti
ss
ue)
Tumor/blood
Tumor/muscle
0 20 40 600
2
4
6
Time (min)
Ra
tio
(tu
mo
r/ti
ss
ue)
Tumor/blood
Tumor/muscle
0 20 40 600
2
4
6
Time (min)
Ra
tio
(tu
mo
r/ti
ss
ue) Tumor/blood
Tumor/muscle
A B C
Figure S11 Tumor to tissue time curves derived from kinetic PET studies of [64
Cu]Cu-NOTA-Si NPs-
hydro (A), [64
Cu]Cu-NOTA-Si NPs-micro (B) and [64
Cu]Cu-NOTA-CQDs (C) in A431 tumor-bearing
mice after single intravenous injection.
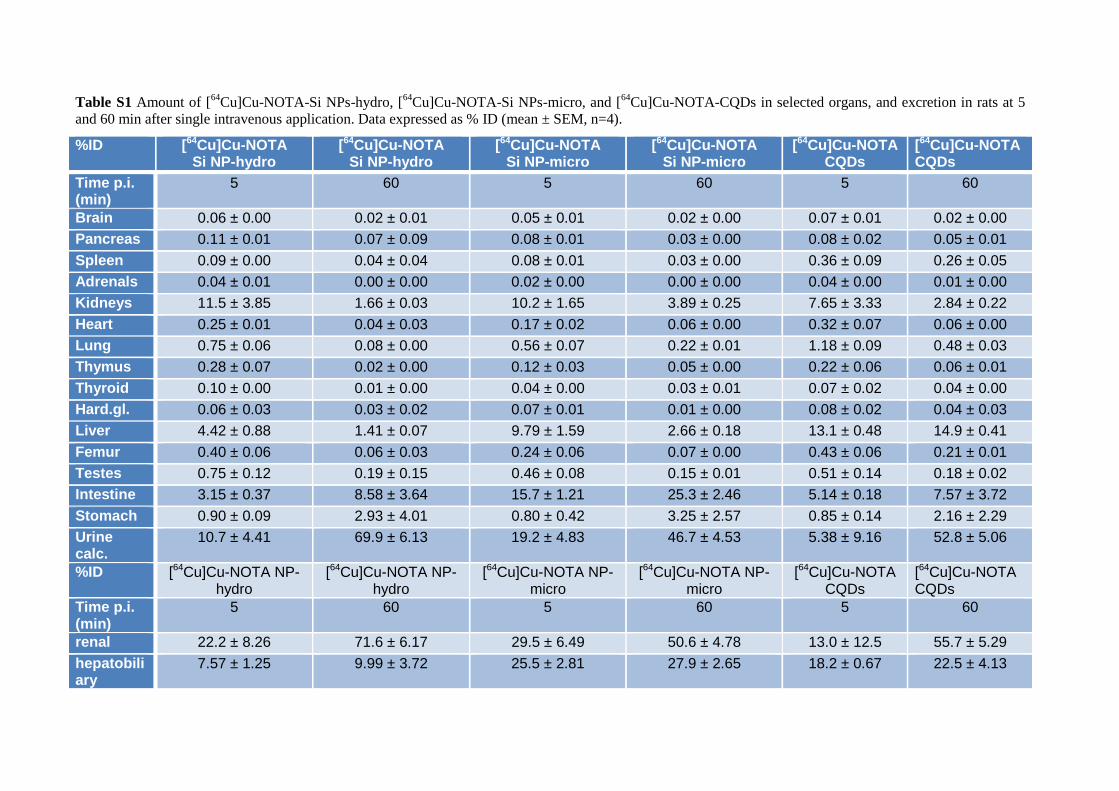
Table S1 Amount of [64
Cu]Cu-NOTA-Si NPs-hydro, [64
Cu]Cu-NOTA-Si NPs-micro, and [64
Cu]Cu-NOTA-CQDs in selected organs, and excretion in rats at 5
and 60 min after single intravenous application. Data expressed as % ID (mean ± SEM, n=4).
%ID [64Cu]Cu-NOTA Si NP-hydro
[64Cu]Cu-NOTA Si NP-hydro
[64Cu]Cu-NOTA Si NP-micro
[64Cu]Cu-NOTA Si NP-micro
[64Cu]Cu-NOTA CQDs
[64Cu]Cu-NOTA CQDs
Time p.i. (min)
5 60 5 60 5 60
Brain 0.06 ± 0.00 0.02 ± 0.01 0.05 ± 0.01 0.02 ± 0.00 0.07 ± 0.01 0.02 ± 0.00
Pancreas 0.11 ± 0.01 0.07 ± 0.09 0.08 ± 0.01 0.03 ± 0.00 0.08 ± 0.02 0.05 ± 0.01
Spleen 0.09 ± 0.00 0.04 ± 0.04 0.08 ± 0.01 0.03 ± 0.00 0.36 ± 0.09 0.26 ± 0.05
Adrenals 0.04 ± 0.01 0.00 ± 0.00 0.02 ± 0.00 0.00 ± 0.00 0.04 ± 0.00 0.01 ± 0.00
Kidneys 11.5 ± 3.85 1.66 ± 0.03 10.2 ± 1.65 3.89 ± 0.25 7.65 ± 3.33 2.84 ± 0.22
Heart 0.25 ± 0.01 0.04 ± 0.03 0.17 ± 0.02 0.06 ± 0.00 0.32 ± 0.07 0.06 ± 0.00
Lung 0.75 ± 0.06 0.08 ± 0.00 0.56 ± 0.07 0.22 ± 0.01 1.18 ± 0.09 0.48 ± 0.03
Thymus 0.28 ± 0.07 0.02 ± 0.00 0.12 ± 0.03 0.05 ± 0.00 0.22 ± 0.06 0.06 ± 0.01
Thyroid 0.10 ± 0.00 0.01 ± 0.00 0.04 ± 0.00 0.03 ± 0.01 0.07 ± 0.02 0.04 ± 0.00
Hard.gl. 0.06 ± 0.03 0.03 ± 0.02 0.07 ± 0.01 0.01 ± 0.00 0.08 ± 0.02 0.04 ± 0.03
Liver 4.42 ± 0.88 1.41 ± 0.07 9.79 ± 1.59 2.66 ± 0.18 13.1 ± 0.48 14.9 ± 0.41
Femur 0.40 ± 0.06 0.06 ± 0.03 0.24 ± 0.06 0.07 ± 0.00 0.43 ± 0.06 0.21 ± 0.01
Testes 0.75 ± 0.12 0.19 ± 0.15 0.46 ± 0.08 0.15 ± 0.01 0.51 ± 0.14 0.18 ± 0.02
Intestine 3.15 ± 0.37 8.58 ± 3.64 15.7 ± 1.21 25.3 ± 2.46 5.14 ± 0.18 7.57 ± 3.72
Stomach 0.90 ± 0.09 2.93 ± 4.01 0.80 ± 0.42 3.25 ± 2.57 0.85 ± 0.14 2.16 ± 2.29
Urine calc.
10.7 ± 4.41 69.9 ± 6.13 19.2 ± 4.83 46.7 ± 4.53 5.38 ± 9.16 52.8 ± 5.06
%ID [64Cu]Cu-NOTA NP-hydro
[64Cu]Cu-NOTA NP-hydro
[64Cu]Cu-NOTA NP-micro
[64Cu]Cu-NOTA NP-micro
[64Cu]Cu-NOTA CQDs
[64Cu]Cu-NOTA CQDs
Time p.i. (min)
5 60 5 60 5 60
renal 22.2 ± 8.26 71.6 ± 6.17 29.5 ± 6.49 50.6 ± 4.78 13.0 ± 12.5 55.7 ± 5.29
hepatobiliary
7.57 ± 1.25 9.99 ± 3.72 25.5 ± 2.81 27.9 ± 2.65 18.2 ± 0.67 22.5 ± 4.13
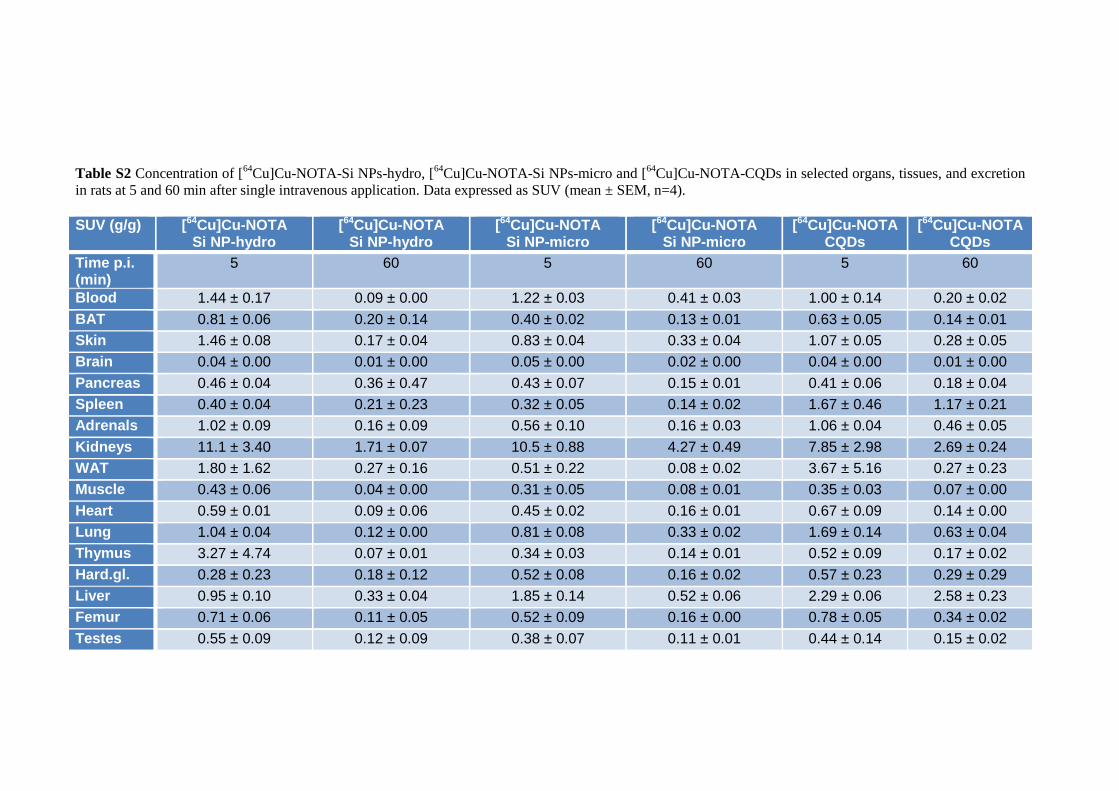
Table S2 Concentration of [64
Cu]Cu-NOTA-Si NPs-hydro, [64
Cu]Cu-NOTA-Si NPs-micro and [64
Cu]Cu-NOTA-CQDs in selected organs, tissues, and excretion
in rats at 5 and 60 min after single intravenous application. Data expressed as SUV (mean ± SEM, n=4).
SUV (g/g) [64Cu]Cu-NOTA Si NP-hydro
[64Cu]Cu-NOTA Si NP-hydro
[64Cu]Cu-NOTA Si NP-micro
[64Cu]Cu-NOTA Si NP-micro
[64Cu]Cu-NOTA CQDs
[64Cu]Cu-NOTA CQDs
Time p.i. (min)
5 60 5 60 5 60
Blood 1.44 ± 0.17 0.09 ± 0.00 1.22 ± 0.03 0.41 ± 0.03 1.00 ± 0.14 0.20 ± 0.02
BAT 0.81 ± 0.06 0.20 ± 0.14 0.40 ± 0.02 0.13 ± 0.01 0.63 ± 0.05 0.14 ± 0.01
Skin 1.46 ± 0.08 0.17 ± 0.04 0.83 ± 0.04 0.33 ± 0.04 1.07 ± 0.05 0.28 ± 0.05
Brain 0.04 ± 0.00 0.01 ± 0.00 0.05 ± 0.00 0.02 ± 0.00 0.04 ± 0.00 0.01 ± 0.00
Pancreas 0.46 ± 0.04 0.36 ± 0.47 0.43 ± 0.07 0.15 ± 0.01 0.41 ± 0.06 0.18 ± 0.04
Spleen 0.40 ± 0.04 0.21 ± 0.23 0.32 ± 0.05 0.14 ± 0.02 1.67 ± 0.46 1.17 ± 0.21
Adrenals 1.02 ± 0.09 0.16 ± 0.09 0.56 ± 0.10 0.16 ± 0.03 1.06 ± 0.04 0.46 ± 0.05
Kidneys 11.1 ± 3.40 1.71 ± 0.07 10.5 ± 0.88 4.27 ± 0.49 7.85 ± 2.98 2.69 ± 0.24
WAT 1.80 ± 1.62 0.27 ± 0.16 0.51 ± 0.22 0.08 ± 0.02 3.67 ± 5.16 0.27 ± 0.23
Muscle 0.43 ± 0.06 0.04 ± 0.00 0.31 ± 0.05 0.08 ± 0.01 0.35 ± 0.03 0.07 ± 0.00
Heart 0.59 ± 0.01 0.09 ± 0.06 0.45 ± 0.02 0.16 ± 0.01 0.67 ± 0.09 0.14 ± 0.00
Lung 1.04 ± 0.04 0.12 ± 0.00 0.81 ± 0.08 0.33 ± 0.02 1.69 ± 0.14 0.63 ± 0.04
Thymus 3.27 ± 4.74 0.07 ± 0.01 0.34 ± 0.03 0.14 ± 0.01 0.52 ± 0.09 0.17 ± 0.02
Hard.gl. 0.28 ± 0.23 0.18 ± 0.12 0.52 ± 0.08 0.16 ± 0.02 0.57 ± 0.23 0.29 ± 0.29
Liver 0.95 ± 0.10 0.33 ± 0.04 1.85 ± 0.14 0.52 ± 0.06 2.29 ± 0.06 2.58 ± 0.23
Femur 0.71 ± 0.06 0.11 ± 0.05 0.52 ± 0.09 0.16 ± 0.00 0.78 ± 0.05 0.34 ± 0.02
Testes 0.55 ± 0.09 0.12 ± 0.09 0.38 ± 0.07 0.11 ± 0.01 0.44 ± 0.14 0.15 ± 0.02
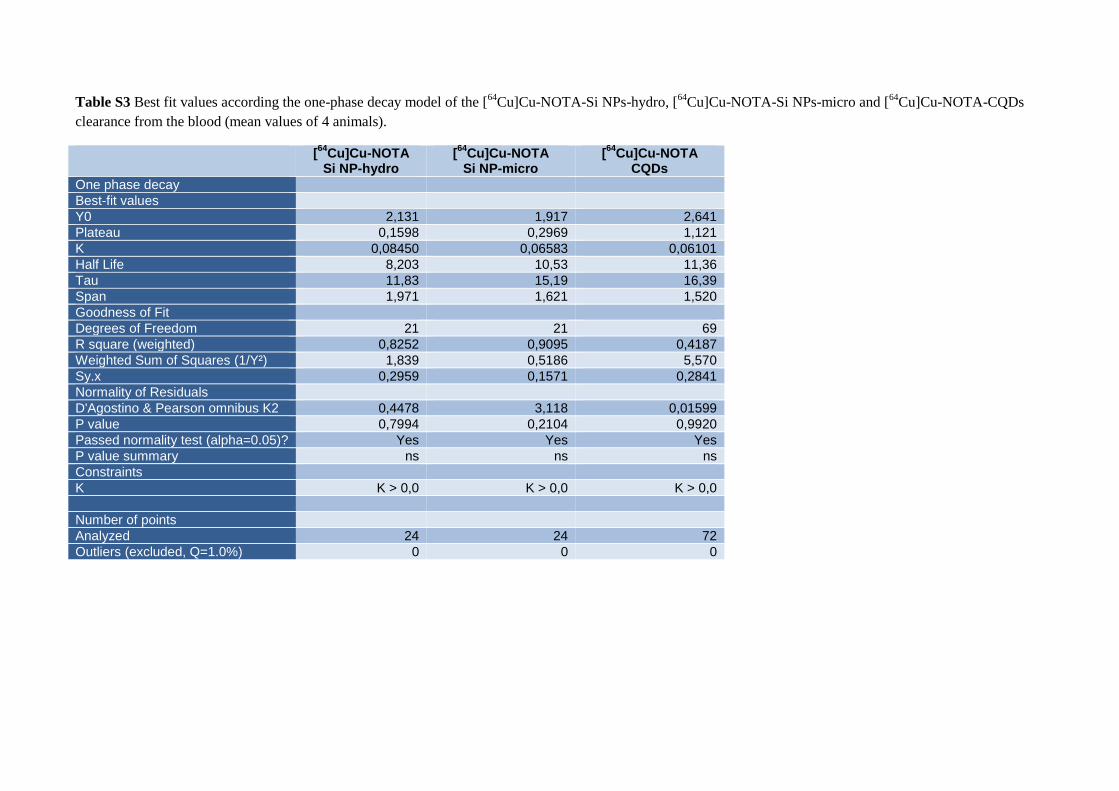
Table S3 Best fit values according the one-phase decay model of the [64
Cu]Cu-NOTA-Si NPs-hydro, [64
Cu]Cu-NOTA-Si NPs-micro and [64
Cu]Cu-NOTA-CQDs
clearance from the blood (mean values of 4 animals).
[64
Cu]Cu-NOTA Si NP-hydro
[64
Cu]Cu-NOTA Si NP-micro
[64
Cu]Cu-NOTA CQDs
One phase decay
Best-fit values
Y0 2,131 1,917 2,641
Plateau 0,1598 0,2969 1,121
K 0,08450 0,06583 0,06101
Half Life 8,203 10,53 11,36
Tau 11,83 15,19 16,39
Span 1,971 1,621 1,520
Goodness of Fit
Degrees of Freedom 21 21 69
R square (weighted) 0,8252 0,9095 0,4187
Weighted Sum of Squares (1/Y²) 1,839 0,5186 5,570
Sy.x 0,2959 0,1571 0,2841
Normality of Residuals
D'Agostino & Pearson omnibus K2 0,4478 3,118 0,01599
P value 0,7994 0,2104 0,9920
Passed normality test (alpha=0.05)? Yes Yes Yes
P value summary ns ns ns
Constraints
K K > 0,0 K > 0,0 K > 0,0
Number of points
Analyzed 24 24 72
Outliers (excluded, Q=1.0%) 0 0 0
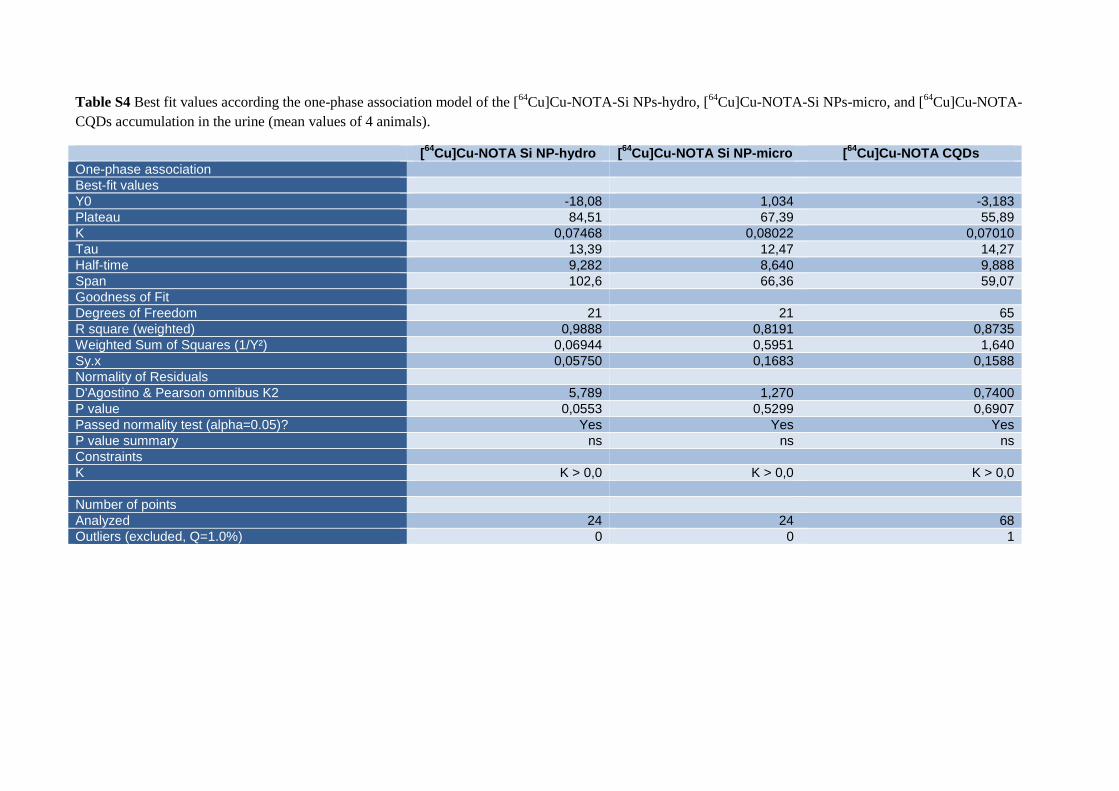
Table S4 Best fit values according the one-phase association model of the [64
Cu]Cu-NOTA-Si NPs-hydro, [64
Cu]Cu-NOTA-Si NPs-micro, and [64
Cu]Cu-NOTA-
CQDs accumulation in the urine (mean values of 4 animals).
[64
Cu]Cu-NOTA Si NP-hydro [64
Cu]Cu-NOTA Si NP-micro [64
Cu]Cu-NOTA CQDs
One-phase association
Best-fit values
Y0 -18,08 1,034 -3,183
Plateau 84,51 67,39 55,89
K 0,07468 0,08022 0,07010
Tau 13,39 12,47 14,27
Half-time 9,282 8,640 9,888
Span 102,6 66,36 59,07
Goodness of Fit
Degrees of Freedom 21 21 65
R square (weighted) 0,9888 0,8191 0,8735
Weighted Sum of Squares (1/Y²) 0,06944 0,5951 1,640
Sy.x 0,05750 0,1683 0,1588
Normality of Residuals
D'Agostino & Pearson omnibus K2 5,789 1,270 0,7400
P value 0,0553 0,5299 0,6907
Passed normality test (alpha=0.05)? Yes Yes Yes
P value summary ns ns ns
Constraints
K K > 0,0 K > 0,0 K > 0,0
Number of points
Analyzed 24 24 68
Outliers (excluded, Q=1.0%) 0 0 1


![biocompatibility cours 1 [Mode de compatibilité] - ULiege cours 1.pdf · Biochimie et Physiologie Générale Centre Interfacultaire des Biomatériaux (CEIB) ... Biocompatibility](https://img.pdfslide.us/doc/110x75/5acde5377f8b9aa1518dffe8/biocompatibility-cours-1-mode-de-compatibilit-cours-1pdfbiochimie-et-physiologie.jpg)