Embed Size (px)
Citation preview

BIOCHEMICAL AND
PHYSIOLOGICAL ASPECTS
OF OBESITY, HIGH FAT DIET,
AND PROLONGED FASTING LN
FREE-RANGING POLAR BEARS
A Thesis Submitted to the College of
Graduate Studies and Research
in Partial Fulfillment of the Requirements
for the Degree of Doctor of Philosophy
in the Department of Veterinary Pathology
University of Saskatchewan
Saskatoon
by
Marc Russell Leon Cattet
June 2000
O Marc Russell Leon Cattct, 2000. All rights reserved.

National Library 1+1 of,,, Bibliothbque nationale du Canada
Acquisitions and Acquisitions et Bibliographic Services services bibliograp hiques 395 Wellington Street 395, rue Wetlington Ottawa ON KIA ON4 Ottawa ON K I A ON4 Canada Canada
The author has granted a non- L'auteur a accorde une licence non exclusive licence allowing the exclusive permettant a la National Library of Canada to Bibliotheque nationale du Canada de reproduce, loan, distribute or sell reproduire, prgter, distribuer ou copies of this thesis in microform, vendre des copies de cette these sous paper or electronic formats. la forme de microfiche/film, de
reproduction sur papier ou sur format Bectronique.
The author retains ownership of the L'auteur conserve la propriete du copyright in this thesis. Neither the droit d'auteur qui protege cette these. thesis nor substantial extracts fiom it Ni la these ni des extraits substantiels may be printed or otherwise de celle-ci ne doivent Etre imprimes reproduced without the author's ou autrement reproduits sans son permission. autorisation.

. PERMISSION TO USE
In presenting this thesis in partial fulfillment of the requirements for a postgraduate degree
from the University of Saskatchewan, I agree that the Libraries of this University may make it freely
available for inspection. I further agree that permission for copying of this thesis in any manner, in
whole or in part, for schotarly purposes may be granted by Dr. F.A. Leighton, Dr. R.A. Nelson, or, in
their absence, by the Head of the Department of Veterinary Pathology or the Dean of the Western
College of Veterinary Medicine. It is understood that any copying or publication or use of this thesis
or parts thereof for financial gain shall not be allowed without my written permission. It is also
understood that due recognition shall be given to me and to the University of Saskatchewan in any
scholarly use which may be made of any material in my thesis.
Requests for permission to copy or to make other use of material in this thesis in whole or in
part should be addressed to:
Head of the Department of Veterinary Pathology
Western College of Veterinary Medicine
University of Saskatchewan
52 Campus Drive, Saskatoon
Saskatchewan S7N 5B4

ABSTRACT
The principle objective of this investigation was to develop an understanding of the
biochemical and physiological response of free-ranging adult polar bears (Ursus maririmus) to
prolonged fasting. A body condition index was developed from two measures, total body mass and
straight-line body length, and was used as a covariate in the analyses of all other data. Protein and
amino acid catabolism and urea synthesis were significantly lower in fasting bears when compared to
feeding bears, and in fat bears when compared to lean bears. The inference fiom these results is that
the energy metabolism in both states (fasting and fat) is one in which lipid is the predominant fuel for
energy and nitrogen is conserved. Nutritional state (feeding versus fasting) had no significant effect
on the plasma concentrations of non-esterifred fatty acid, glycerol, and ketone bodies, or on the
plasma ratio of acyl-carnitine to free carnitine. Furthermore, acetoacetate concentration was below
the level of detection (< 196 pmoVL) in all bears, and p-hydroxybutyrate concentration never
exceeded 291 pmoUL. These results suggest polar bears are able to regulate closely the synthesis,
release, and use of lipid metabolites without significant alteration in their plasma concentrations.
Fasting polar bears showed no evidence of essential fatty acid (EFA) deficiency; the proportions of
the diet-derived EFA linoleic (18:206) and a-linolenic (18:303) acids in the plasma and adipose
tissue of fasting polar bears were greater than that in feeding polar bears. Plasma triiodothyronine
concentrations and rectal temperatures were lower in fasting bears captured during summer-fall than
in feeding bears, which suggests metabolic rates were decreased during fasting to conserve body
fuels. Liver glycogen concentrations were found to be higher in fasting polar bears than in feeding
bears. Furthermore, the results from intravenous administration of glucose (glucose tolerance test) to
polar bears indicated the rates of insulin secretion and clearance in polar bears were slow relative to
rates reported for other mammals. The inference from these results is that polar bears are not as
dependent on glucose for energy as are other mammals and, as a consequence. are more lax in
regulating their body glucose stores.

ACKNOWLEDGEMENTS
There are many people and numerous agencies to which I am very grateful for their support.
I thank my supervisor Ted Leighton for his strong support and ability to provide me with both the
freedom to learn and the guidance to remain focussed; Ralph Nelson for his support, encouragement,
and enthusiasm; Malcolm Ramsay for providing me the opportunity to carry out this investigation;
Nigel Caulkett for his interest, ideas, and encouragement; and my advisory committee members
Marion Jackson, Stan Rubin, and Gary Wobeser for their effort and advice at different times during
this study. For their assistance in the field research, I thank Stephen Atkinson, Kevin Burke Jr.,
Nigel and Joan Caulkett, Marcus Dyck, Cam Elliot, Sean Farley, Al Hahn, Kerry Hudson, Ted
Leighton, Steve and Janet Miller, Susan Polischuk, and Margaret Swain. For their assistance in the
shipping and analysis of samples, I thank Susan Buczkowski, Yasmin Hasan, Victor Laxdal, Rebecca
Morgan-Boyd, Sherry Myers, Brenda Trask. Mathilakath Vijayan, Robert Wolfe, and Pat Wright.
For their assistance in the presentation of research results, I thank Kathie Caspell and Ian Shirley.
For their attention to clerical and administrative matters, I thank Jan Diederichs, Sandy Mayes, and
Barbara Zachow. For their helpful comments regarding earlier versions of the thesis chapters, I
thank Nigel Caulkett, Ralph Holman, Ted Leighton, Rebecca Morgan-Boyd, Ralph Nelson, Martyn
Obbard, Malcolm Ramsay, Jeong Sim, Ian Stirling, Mathilakath Vijayan, Paul Watts, and Pat
Wright. I also thank George Kolenosky and the Ontario Ministry of Natural Resources for
permission to use unpublished data that are presented in Chapter 2. Finally, I thank Heather and ow
children Rene, Gillian, and Liam for their unfaltering support and enthusiasm with my work.
Logistical support was provided by the Chwchill Northern Studies Centre, Churchill
Regional Health Authority, Manitoba Department of Natural Resources, and Polar Continental Shelf
Project. Financial support was provided by Canada Department of Indian Affairs and Northern
Development (Northern Science and Training Program), J. Hochglaube, Medical Research Council
of Canada, Natural Science and Engineering Research Council of Canada Polar Continental Shelf
Project, U.S. National Science Foundation, Wildlife Health Fund of the Western College of
Veterinary Medicine, and World Wildlife Fund (Canada).
iii

PERMISSION TO USE
TABLE OF CONTENTS
ABSTRACT
ACKNOWLEDGEMENTS
TABLE OF CONTENTS
LIST OF TABLES
LIST OF FIGURES
LIST OF ABBREVIATIONS
1 . GENERAL INTRODUCTION 1.1 Similar scenarios. different outcomes 1.2 An objective and a context 1.3 The dietary features of polar bears 1.4 The thesis
2 . THE DEVELOPMENT AND ASSESSMENT OF A BODY CONDITION INDEX FOR FREE-RANGING POLAR BEARS 2.1 Introduction 2.2 Materials and methods 2.3 Results 2.4 Discussion
2.4.1 Development of the BCI 2.4.2 Comparison of the BCI with other indices of body condition
3 . ASPECTS OF PROTEIN AND AMINO ACID METABOLISM IN FREE- RANGING ADULT POLAR BEARS 3.1 Introduction 3.2 Materials and methods
3.2.1 Animals and samples 3.2.2 Blood analysis 3.2.3 Liver enzyme and metabolite analysis 3.2.4 Statistical analysis
3.3 Results 3.4 Discussion
3.4.1 Season of capture, nutritional state. and the U/C ratio 3.4.2 Association with nutritional state 3.4.3 Differences between females and males 3.4.4 Association with body condition 3.4.5 Effect of anesthesia 3.4.6 Conclusions
4 . ASPECIS OF LIPID m A B O L I S M IN FREE-RANGING ADULT POLAR BEARS 4.1 Introduction 4.2 Materials and methods 4.3 Results
4.3.1 Association with nutritional state and sex 4.3.2 Association with body condition and dmg dosage
............ vii

4.4 Discussion 4.4- 1 Association with nutritional state and sex 4.4.2 Association with body condition and dnrg dosage
5 . EFFECT OF DIET AND PROLONGED FASTING ON THE FATTY ACID COMPOSITION OF PLASMA AND A D m S E TISSUE IN POLAR AND BLACK BEARS 5.1 Introduction 5.2 Materials and methods 5.3 Results
Plasma fatty acid composition in feeding polar and black bears 5.3.1 . 1 Triacy lglycerol 5.3.1.2 Non-esterified fatty acid 5.3.1.3 Phospholipid Plasma and adipose tissue fatty acid composition in feeding and fasting polar bears 5.3.2.1 Plasma lipid fractions 5.3.2.2 Plasma triacylgl ycerol 5.3.2.3 Plasma non-esterified fatty acid 5.3.2.4 Plasma phospholipid 5.3.2.5 Adipose tissue triacylglycerol Plasma and adipose tissue fatty acid composition in feeding and fasting black bears 5.3.3.1 Plasma triacylglycerol 5.3.3.2 Plasma non-esterifid fatty acid 5.3.3.3 Plasma phospholipid 5.3.3.4 Adipose tissue triacylglycerol
5.4 Discussion 5.4.1 Plasma fatty acid composition in feeding polar and black
bears 5.4.2 Plasma and adipose tissue fatty acid composition in feeding
and fasting polar bears 5.4.3 Plasma and adipose tissue fatty acid composition in feeding
and fasting black bears
6 . ASPECTS OF CARBOHYDRATE METABOLISM AND REGULATION IN FREE-RANGING ADULT POLAR BEARS 6.1 Introduction 6.2 Materials and methods 6.3 Results 6.4 Discussion
7 . GENERAL DISCUSSION 7.1 Similar scenarios . different outcomes revisited 7.2 Points of departure between polar bears and humans 7.3 The study in hindsight 7.4 Future directions
LITERATURE CITED
APPENDIX A . THE SOLUBILITY OF WATER IN LIPID AND ITS EFFECI' ON THE ESTIMATION OF BODY COMPOSITION IN MARINE AND TERRESTRIAL BEARS
A 1 Introduction

A2 Materials and methods A3 Results A4 Discussion A5 Literature Cited

LIST OF TABLES
Description of sample polar bear population by sex, age, reproductive class, and geographical location.
The association between dissectable tissue mass (kg) and the predictor variables, straight-line body length (SLBL; cm) and the body condition index (BCI), in 3 1 polar bears.
Assay conditions used for the determination of liver enzyme activity in polar bears.
Packed cell volume and concentrations of proteins, enzymes, amino acid (a-a.) groups, and nitrogen end-products in the plasma of feeding (captured during spring) and fasting (captured during summer-fall) adult polar bears.
Concentrations of free amino acids in the plasma of feeding (captured during spring) and fasting (captured during summer-fall) adult polar bears.
Body condition and the concentrations and activities of various metabolites and enzymes measured in the plasma and liver of four feeding (captured during spring) adult male polar bears, and one fasting (captured during fall) adult male polar bear.
Pairwise associations between the concentrations of specific plasma constituents in adult polar bears and the proposed biochemical significance for these associations.
Plasma concentrations of lipids, lipid precursors and metabolites, and total carnitine in free-ranging adult polar bears captured during feeding (spring) and fasting (summer-fall), and during fasting that included pregnancy and eariy lactation (winter).
Plasma concentration and kinetic of glycerol in free-ranging adult polar bears captured during feeding (spring) and fasting (summer-fall), and during fasting that included pregnancy and early lactation (winter).
Classification scheme used to describe fatty acids in the plasma of polar and black bears
Proportions and indices of fatty acids in the plasma triacylglyceml of polar and black bears during feeding and fasting.
Proportions and indices of fatty acids in the plasma non-esterified fatty acid of polar and black bean during feeding and fasting.
Proportions and indices of fatty acids in the plasma phospholipid of polar and black bears during feeding and fasting.
Proportions and indices of fatty acids in the adipose triacylgiyccrol of polar and black bears during feeding and fasting.
Proportions and indices of essential fatty acids in the plasma lipid fractions of fasting female polar bears, that were accompanied by new-born cubs, and all other fasting adult polar bears.
vii

Plasma concentrations of glucose and selected hormones, the I/G molar '
ratio, and rectal temperature in free-ranging adult polar bears captured during feeding (spring) and fasting (summer-fall), and during fasting that included pregnancy and early lactation (winter). .......... I01
Selected biochemical constituents for which values during prolonged fasting, relative to values during feeding, differ between polar bears and humans. .......... 117
Comparison of regression equations describing the relationship between body water (BWC) and body lipid content (BLC) in marine (polar) bears and terrestrial (black and brown) bears. .......... 141
viii

Curvilinear relationship between total body mass and straight-line body length in 1072 polar bears.
The cumulative frequency distribution of Body Condition Index (BCI) values for 1072 polar bears.
The association between the Body Condition Index (BCI) and straight-line body length (SLBL) in 1072 polar bears.
The association between the observed mass of dissectable tissue and that predicted by straight-line body length (SLBL) alone, or by the combination of SLBL and the Body Condition Index (BCI), in 31 polar bears.
Nomograms for estimation of the Body Condition Index (BCI) over the straight-line body length (SLBL) intervals of: a) 60 to 70 cm; b) 70 to 130 cm; c) 130 to 190 cm; and d) 190 to 270 cm.
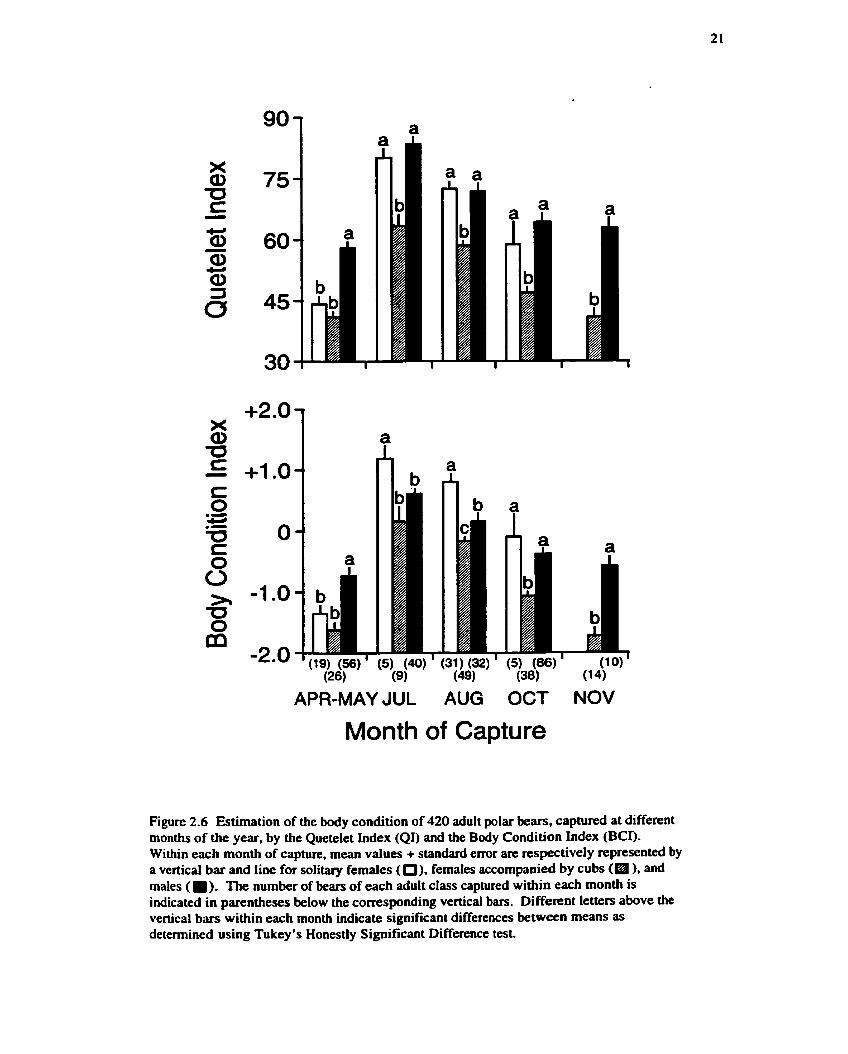
Estimation of the body condition of 420 adult polar bears. captured at different months of the year, by the Quetel'et Index (QI) and the Body Condition index (BCI).
The association between the Quetelet Index (QI) and straight-line body length (SLBL) in 1072 polar bears.
Estimation of the change in body condition of 20 polar bears, that were captured twice during the same year between July and October, by the Fatness Index (&) and by the Body Condition Index (BCI).
The association between the Fatness Index and the Body Condition Index (BCI) in polar bears.
Plasma concentration of globulin protein fractions in feeding and fasting polar bears.
The distribution of nitrogen, as a proportion of total amino acid nitrogen, among plasma amino acids containing one, two, three, and four nitrogens in feeding and fasting polar bears.
Pairwise associations between the liver urea concentration and the concentrations of plasma urea and liver ammonia and glutmine, and between the liver urea concentration and the activity of liver cdamoyl phosphate synthetase I (CPS- 1). in five adult male polar bears.
Proposed model for nitrogen metabolism in the liver of fasting polv bears.
The disappearance of '3~-glycerol from the plasma of polar bears.
Plasma concentrations of acyl-camitine (AC), free carnitine (FC) and the AC:FC ratio in feeding and fasting polar bears. Plasma concentrations of unesterified cholesterol, high density lipoprotein (HDL-) cholesterol and the total cho1esterol:M)L-cholesterol ratio in feeding and fasting polar bears

Classification and metabolic interrelationship of fatty acids detected in the plasma and adipose tissue of polar and black bears.
Comparison of dietary essential fatty acids and fatty acid groups between feeding polar and black bears.
Comparison of dietary essential fatty acids, fatty acid groups, and desaturase and elongase products between fasting and feeding polar bears.
Comparison of dietary essential fatty acids, fatty acid groups, and desaturase and elongase products between fasting and feeding black bears.
Comparison of dietary essential fatty acids, fatty acid groups, and desaturase and elongase products between fasting and feeding in the adipose tissue triacylglycerol of polar and black bears.
Plasma glucose concentrations of polar bears at 15,20, 25,30,45,75, 105, 135, and 165 minutes following chemical immobilization.
Plasma glucose and cortisol concentration of five fasting polar bears (three females and two males) at 15,30,45, and 60 minutes following inuamuscular administration of the anesthetic drug.
Plasma glucose, insulin, and glucagon concentrations, and the WG molar ratio in 10 polar bears following intravenous administration of glucose (500 mg/kg).
Plasma glucose, insulin, and glucagon concentrations, and the WG molar ratio in two polar bears of different body condition following intravenous administration of glucose (500 rngflcg).
Glycogen storage in the liver of fasting polar bears.
Fatty acid composition of subcutaneous adipose tissue in 10 polar bears and 10 black bears.
Comparison of relative solubility of water in fatty acid with the mean carbon-chain length (MCL) of subcutaneous adipose tissue fiom 10 polar bears and from 10 black bears.
The relationship between the water (AWC) and lipid content (ALC) of adipose tissue in 25 polat bears and 25 black bears.
The relationship between the body water (BWC) and the body lipid content (BLC) in marine (polar) bears and temsrrial (black and brown) bears.
The 95% prediction intervals for the relationship between body lipid (BLC) and body water content (BWC) in marine (polar) bears and terrestrial (black and brown) bears.

LIST OF ABBREVIATIONS
AC
ALC
AWC
BCI
BLC
BMR
BRANCH
BWC
DBI
DP
E:NE ratio
EFA
EP
FC
FIcl-ii ndd Fhiust FM
HDL
UG
LBM
LDL
MCL
MONO
NEFA
ODD
P
PCA
PUFA
QI
R,
Rc
SAT
SLBL
T%
Acy I-camitine
Lipid content of adipose tissue
Water content of adipose tissue
Body Condition Index
Body lipid content
Basal metabolic rate
Branched-chain fatty acid
Body water content
Double bond index
Desatwase product
Ratio of essential fatty acids and products to non-essential fatty acids and products
Essential fatty acid
Eiongase product
Free carnitine
Fatness Index: determined from the results of whole body chemical composition
Fatness Index: determined from the results of deuterium dilution
Fatness Index: determined from the results of gross tissue dissection
Fat mass
High density lipoprotein
Insulin to glucagon molar ratio
Lean body mass
Low density lipoprotein
Mean chain length in carbon atoms
Monoenoic fatty acid
Non-esterified fatty acid
Odd-chain fatty acid
Product
Perchloric acid
Polyunsaturated fatty acid
Quetelet Index
Rate of appearance
Rate of clearance
Saturated fatty acid
Straight-line body length
Half-life

T3 Triiodothyronine
T4 Thyroxine
TBM Total body mass
TFtI:TET ratio Ratio of the triene, 20:3&, to the teuaene, 20:4w6
xii

1. GENERAL INTRODUCTION
1.1 Similar scenarios, diUetcat outcomes
Of all of her 29 years, 1995 was promising to be the best for Janice. Only one year earlier,
she had been hired as a graphic artist by an innovative and highly successful group of Ottawa-based,
computer programmers. Although she had only a vague understanding of the world of computer
programming, Janice did have a remarkable ability to express her artistic talent with a keyboard,
mouse, and monitor. Thus, in only six short months, 'home pages designed by Janice' formed the
web-site frontispiece for many an Ottawa company, and were in demand by many more. Where
sudden success and a soaring salary unravel the day-to-day habits of most people, Janice remained
unchanged in much of her lifestyle and only acknowledged her newly-acquired fame and fortune
with a mixture of disbelief and modest amusement. Nevertheless, the combination of frequent
meetings with new clients and a simmering attraction for a co-worker had instilled in Janice a
burning desire to change one aspect of her life. Janice wanted to lose weight, and more strongly now
than at any other time in her life.
On December Ist, 1994, Janice weighed 93.2 kilograms on her doctor's scales, but was
otherwise in good health. Nevertheless, from scanning the Body Mass Index chart above the weigh
scale, Janice had been quick to determine that she fell into the category of individuals known as 'the
obese', her body weight being approximately 32 kilograms above the ideal body weight for her
height. Appalled at her physical designation and attributing it to years of consuming junk food,
Janice returned home following her appointment and emptied her cupboards and refrigerator of all
foods. Melba toast, rice cakes, green food, and low-fat yoghurt were to form the bulk of her new
diet, and a 45 minute morning session on the Stair-Master was to become a daily ritual. Her goal, to
lose 35 kilograms prior to her 30th birthday.
Thirteen weeks later, and with still more than one week remaining until her birthday, Janice
weighed 57 kilograms. An intense work schedule, a very low caloric diet, the morning sessions on
the Stair-Master, and perhaps the more than occasional popping of decongestant tablets had helped
to transform Janice. And yet, despite her obvious elation and assertions of "I've never felt better !",
Janice's doctor was somewhat guarded in sharing the joy. In fact, she was quite troubled by the
irregular heartbeat she had detected when listening to Janice's chest with her stethoscope. Although
irregular heartbeats most often prove to be of little significance in many people, there was a dim
recollection in the doctor's mind that an irregular heartbeat coupled with rapid and large weight loss
warned of something more serious. She would need to refer to her medical reference books on this,
but in the meantime she decided to book Janice for an electrocardiographic assessment as soon as
possible at the hospital's cardiology centre.
Janice never did attend her appointment at the cardiology centre. In fact, only two hours
after leaving her doctor, she collapsed while attending a business meeting. Attempts at
cardiopulmonary recuscitation and a rapid response by the paramedics were futile. Janice was
declared dead upon arrival at the hospital. Two days later, the pathologist's report was to explain the
cause of death as a result of myocardial degeneration, the wasting away of the muscle cells forming
the heart. Presumably, the months of extreme dieting had stripped away from Janice the proteins that
were essential to the integrity of her heart, and consequently her life, so as only to provide her with
the fuel that she needed to meet her daily schedule. In essence, her body had simply self-destructed.
At the same moment that Janice collapsed, X09111 also collapsed approximately 1700
kilometers northwest of Ottawa on the southwest coast of Hudson Bay. At 29 years of age, XO9 1 1 1
was one of the oldest polar bears (Ursus nurritimus) listed in the data records of the government
wildlife service. And this was to be the fowttenth time she had been captured by the biologists. As
X09111 slowly succumbed to the effects of the immobilizing drug, her two newly-born cubs clung to
her, their island of safety on a hostile sea of snow and ice.
Nine months earlier, X09 1 1 1 had been captured minutes after swimming ashore from one of
the last remaining pans of melting sea-ice on Hudson Bay. The biologists had guessed from her

rotund appearance, and the fact that she wasn't accompanied by other bears, that she might be
pregnant. Before releasing X09111, they fitted her with a radio-collar, collected some of her blood,
and measured her body dimensions in various ways. To the biologists, the most remarkable feat-
of X09111 was her enormous body weight, exactly 414 kilograms, of which they had no doubt that at
least half was fat.
Now, in March 1995, the biologists* guess at the pregnant state of X09111 no longer
remained in question, being unmistakably confirmed by the presence of two healthy male cubs.
Furthermore, XO9 1 1 1 had lost a whopping 2 I8 kilograms during the past nine months. her physical
stature now only a shadow of its former self. Nevertheless, this was not the first time that X09I 1 1
had lost almost hdf her body weight in less than a year. At three previous times, X09111 had lost
similar amounts of weight during fall and winter, only to turn up again during the spring with a
couple of cubs in tow.
The scenarios are similar. Both stories tell of the loss of a large amount of body weight.
The outcomes, however, are different. Where weight loss leads to death in one story, it is a
recurring feature of life in the other.
1.2 An objective and a context
How is it that the process of weight loss can be fatal in one mammal, and yet appearingly
benign in another? This question is a central theme of this thesis. In the case of humans, there is
much known about their biochemical and physiological response to food deprivation. In the case of
polar bears, there is little known to explain how these animals are able to survive extreme lengths of
total food deprivation without any apparent consequence to their health.
The primary objective of this investigation was to begin to develop some understanding of
the biochemical and physiological response of free-ranging adult polar bears to prolonged fasting.
Free-ranging bears were studied rather than captive bears because it seemed unlikely that the results
taken from a small number of captive polar bears reared within the artificial environment of a zoo or
marine park could ever be accepted to represent the species as a whole. This is not to say, however,

that future studies of captive polar bears coutd not be used to build on the information obtained in
this study of free-ranging polar bears. Adult polar bears were studied rather than younger bears
because of the possibility that biochemical and physiological mechanisms, particularly those that
facilitate the adaptive response to prolonged fasting, might not be fully developed in the younger
bears.
The interpretation of results from this study frequently was done in a comparative manner,
and most often with humans as the species for comparison. This was for two reasons. First, details
regarding the biochemical and physiological response to food deprivation in mammals are probably
most numerous, and possibly most complete, for humans. Thus. the knowledge developed from
studies of humans seemed a logical basis from which to compare and interpret the results obtained
from polar bears. Second, beyond the effects of prolonged fasting, there are effects of other dietary
features that appear to be profoundly different in humans and polar bears. Thus, in humans, obesity
and consumption of foods that are high in fat content are associated with a suite of metabolic
diseases, e-g., c o r o n q heart disease, hyperglycemia, insulin resistance, and type II diabetes mellitus.
In contrast, obesity and the consumption of foods high in fat appear to be critical factors that enable
polar bears to withstand prolonged periods without food, and do not appear to impact upon the
health of polar bears as occurs in humans. Recognizing these species differences, it would appear
that points of departure between humans and polar bears in their biochemical and physiological
response to food deprivation may be areas where further comparative investigation could provide
new insight into the pathogenesis, and perhaps the treatment, of some of the metabolic diseases in
humans.
1.3 The dietary features of polar bears
Polar bears typically consume large quantities of seal fat during the spring, whereas the
remainder of the year is characterized by intermittent fasts of variable duration ranging from days to
months. From April to July, polar bears prey intensively on fat, young-of-the-year, ringed seals
(Phoca hispida) (Stirling and Archibald 1977, Smith 1980, Hammill and Smith 1991). After killing

a seal, a polar bear ofien will eat the fat of the seal and leave the rest of the carcass (Stirling 1974).
As a result of the large fat content of young weancd seals (Stiding and McEwan 1975), coupled with
the exceptional ability of polar bears to digest large quantities of fat (Best 1984), polar bears become
fat between spring and summer (Ramsay and Stirling 1988). In Hudson Bay, seals become
unavailable to most polar bears during the open-water season of summer and fall, and bears become
inactive and fast for up to several months at a time (Nelson et al. 1983, Derocher et al. 1990, Rarnsay
et al. 1991). When sea-ice re-forms during late fall, seals become accessible again and most polar
bears return to the ice to resume hunting (Stirling 1974, Latour 198 1, Deracher and Stirling 1990).
Nevertheless, inclement weather and more wary seals (relative to the young seals captured during
spring) are believed to reduce the frequency of prey capture from that observed during spring
(Stirling and Oritsland 1995). In contrast to other adult bears, pregnant bears remain on land in
maternity dens throughout winter and emerge from their dens with one to three cubs, in March, after
8 to 9 months of continuous fasting (Ramsay and Stirling 1982. Watts and Hansen 1987). Together,
the circannual dietary features of polar bears suggest that survival of the species is contingent upon
an ability to closely regulate their accretion of adipose tissue and their metabolism of stored fuels
(lipid, protein, and glucose).
1.4 The thesis
The body of this thesis is an integrated collection of five parts. The first part (Chapter 2)
presents a body condition index (BCI) that was developed during this study to compare body
condition among individual polar bears regardless of their sex, age, reproductive class, geographical
population, or season-of-capture. The second part (Chapter 3) considers the process of protein-
sparing in polar bears by examining the effect that nutritional state (feeding versus fasting), sex
(female versus male), and body condition (lean versus fat) have upon the concentrations of proteins,
enzymes, free amino acids, and nitrogen end-products in plasma, and upon the activities and
concentrations of enzymes and metabolites in liver that are involved in the ornithine-urea cycle and
in intermediary metabolism. The third part (Chapter 4) examines the effect that nutritional state, sex,

and body condition have upon the concentrations of lipids, lipid precursors and metabolites, total
camitine, and camitine fractions in plasma, and upon the kinetics of plasma glycerol in polar bears.
The fourth part (Chapter 5) considers the effect that diet and prolonged fasting have upon the fatty
acid composition of polar and black bears (Ursus americanus) by examining the fatty acid
composition of three lipid fractions (triacylglycerol, non-esterified fatty acid, and phospholipid) in
plasma, and one lipid fraction in adipose tissue (triacylglycerol), in feeding and fasting bears. The
fifth part (Chapter 6) considers the regulation and metabolism of carbohydrate in polar bears by
examining the effect that nutritional state, sex, and body condition have upon their concentrations of
glucose, cortisol, triiudclthyronine, thyroxine, insulin, and glucagon in plasma, as well as upon the
change in their plasma insulin and glucagon concentrations following intravenous administration of
glucose (glucose tolerance test).

2. THE DEVELOPMENT AND ASSESSMENT OF A BODY CONDITION INDEX FOR
FREE-RANGING POLAR BEARS
2.1 Introduction
Body condition can be defined as a measure of the abundance of potential energy stored in
the body tissues (primarily fat and skeletal muscle) of an animal relative to its body size. As a
biological variable, body condition has been important for monitoring long-term uends in the
fluctuation of food availability in wild populations (Thomas et al. 1982, Costa et al. 1989. Hellgren
et al. 1993, Stirling et al. 1999) and for addressing ecological issues (Messier and Crete 1984, Ryg et
al. 1990, Atkinson and Ramsay 1995). Body condition can be also an important variable in
physiological and biochemical investigations because of its potentially confounding effects on other
parameters (Verrillo et al. 1988. Lewis et al. 1990, Vansant et al. 199 1).
Body condition in polar bears (Ursus maririmus) has been measured or estimated by
morphometric measurements, chemical analysis of the whole carcass, measurement of fat in bone
marrow and among muscles. bioelectrical impedance, and deuterium dilution (Watts and Hansen
1987. Cattet 1988, Cattet 1990, Arnould and Ramsay 1994, Farley and Robbins 1994. Atkinson and
Ramsay 1995, Atkinson et al. 1996a). Morphometric measurements have been imprecise, in large
part because of variation in the measurement of linear dimensions and the compounding of the
resulting error by morphomeuic prediction equations (Cattet 1990, Cattet et al. 1997). Furthermore.
the accuracy and precision of these prediction equations have been found to be significantly affected
by sex, age, reproductive class. and geographical population. Chemical analysis of the whole carcass
and the measurement of fat in bone marrow and among muscles are time-consuming techniques that
require dead bears and laboratory analysis. Bioelectrical impedance and deuterium dilution have
been advocated as the two most useful methods available to determine the body composition and
condition of living bears (Farley and Robbins 1994, Hilderbrand et al. 1998) and both techniques

have been applied to polar bears (Farley and Robbins 1994, Atkinson and Ramsay 1995, Atkinson et
ai. 19%a). Nevertheless, the relationships between chemical composition and electrical conductance
or deuterium dilution have not been determined in this species.
This investigation had two objectives. The first was to develop a body condition index
(BCI) for free-ranging polar bears which could be easily measured and used to compare individual
animals regardless of sex, age, reproductive class, geographical population, or season-of-capture.
The second was to evaluate the use of the BCI by comparing it with two other indices that have been
used in recent years to measure body condition in free-ranging polar bears.
2.2 Materials and methods
The sample population comprised 1072 free-ranging polar bears that represented three
geographical populations, both sexes, and all age and reproduc rive classes (Table 2.1 ). All bears
were captured as part of ongoing studies from 1984 to 1996 and details of capture and handling
procedures, measurements, geographical populations, and designation of sex, age, and reproductive
class, have been described previously in Kolenosky et al. (1989) and Cattet et al. (1997).
The body condition index (BCI) was developed from two measures, total body mass (TBM)
and straight-line body length (SLBL; the straight-line distance from the tip of the nose to the end of
the last tail vertebra), that were routinely recorded during the handling of captured polar bears. The
mass and length data for 1072 polar bears were transformed to natural logarithms and regression
analysis was used to describe the curvilinear relationship between the dependent variable, TBM, and
the independent variable, SLBL, separately for female (n = 494) and male (n = 578) polar bears
(SPSS" 6.1 for windows", SPSS Inc., Chicago, Illinois, USA). Slopes and intercepts for sex-
specific regression equations were then compared using large sample 2-tests for parallelism and
common intercept, respectively (Kleinbaum and Kupper 1978).
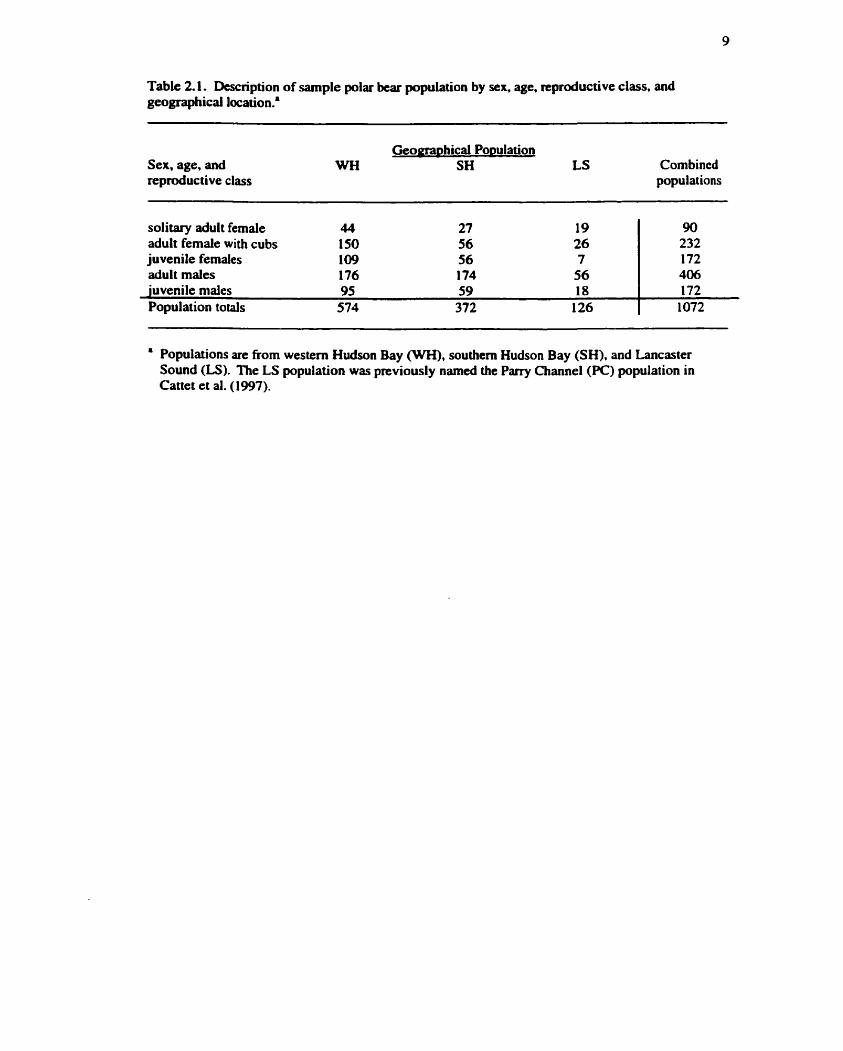
Table 2.1. Description of sample polar bear population by sex, age, reproductive class, and geographical location..
Sex, age, and Geomarthical Po~ulation
WH S H LS Combined reproductive class populations
solitary adult female 44 adult female with cubs 150 juvenile females 109 adult males 176 juvenile males 95 59 18 Population totals 574 372 126
Populations are from western Hudson Bay (WH), southern Hudson Bay (SH), and Lancaster Sound (LS). The LS population was previously named the Parry Channel (PC) population in Cattet et al. (1997).
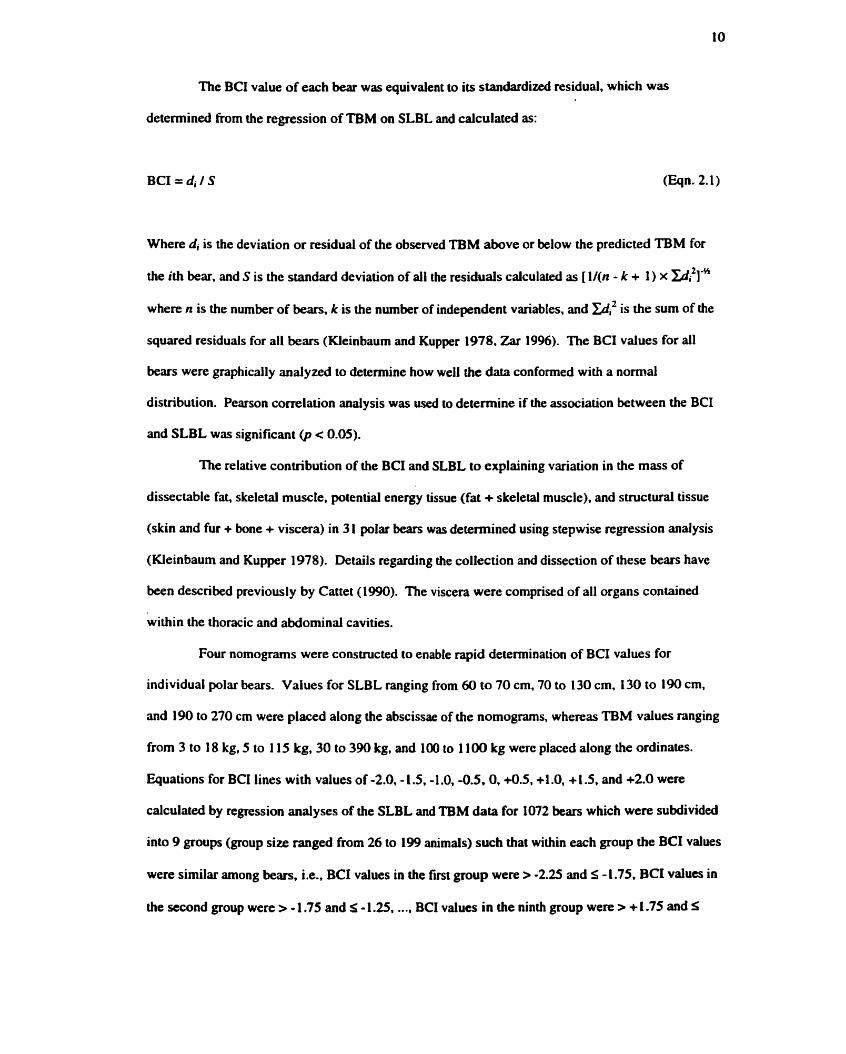
The BCI value of each bear was equivalent to its standardized residual, which was
determined from the regression of TBM on SLBL and calculated as:
(Eqn. 2.1)
Where di is the deviation or residual of the obsewed TBM above or below the predicted TBM for
the ith bear, and S is the standard deviation of all the residuals calculated as [l/(n - k + 1) x =?I-%
where n is the number of bears, k is the number of independent variables, and &i: is the sum of the
squared residuals for all bears (Kleinbaum and Kupper 1978, Zar 1996). The BCI values for all
bears were graphically analyzed to determine how well the data conformed with a normal
distribution. Pearson correlation analysis was used to determine if the association between the BCI
and SLBL was significant @ < 0.05).
The relative contribution of the BCI and SLBL to explaining variation in the mass of
dissectable fat, skeletal muscle, potential energy tissue (fat + skeletal muscle), and structural tissue
(skin and fur + bone + viscera) in 3 1 polar bears was determined using stepwise regression analysis
(Kleinbaum and Kupper 1978). Details regarding the collection and dissection of these bears have
been described previously by Cattet (1990). The viscera were comprised of all organs contained
within the thoracic and abdominal cavities.
Four nomograms were constructed to enable rapid determination of BCI values for
individual polar bears. Values for SLBL ranging from 60 to 70 cm, 70 to 130 cm, 130 to 190 cm,
and 190 to 270 cm were placed along the abscissae of the nomograms, whereas TBM values ranging
from 3 to 18 kg, 5 to 1 15 kg, 30 to 390 kg, and 100 to 1 100 kg were placed along the ordinates.
Equations for BCI lines with values of -2.0, - 1.5, -1.0, -0.5,0,+0.5, +1.0, + 1.5, and +2.0 were
calculated by regression analyses of the SLBL and TBM data for 1072 bears which were subdivided
into 9 groups (group size ranged from 26 to 199 animals) such that within each group the BCI values
were similar among bears, i.e., BCI values in the first group were > -2.25 and S -1.75, BCI values in
the second group were > - 1.75 and s - 1.25, .. ., BCI values in the ninth group were > + 1 -75 and S

+2.25. The different BCI lines were then plotted on each of the nomograms to allow an estimate of
the BCI to be made at the point of intersection between paired values for SLBL and TBM.
To evaluate the use of the BCI in estimating the body condition of different bears captured
during different months (i.e.. cross-sectional comparison). the BCI was compared with the Quetelet
Index (QI) in estimating the budy condition of 420 polar bears. The QI (also known as the Body
Mass Index) was originally developed to assess obesity in humans (Ganong 1995). However. it has
been applied recently to polar bears and in this species. is calculated as TBM + SLBL' (kglm')
(Stirling et al. 1999).
To evaluate the use of the BCI in estimating the change in body condition of the same bears
captured at two different times (i.e.. longitudinal comparison), the BCI was compared with the
Fatness Index in estimating the change in the body condition of 20 fasting polar bears captured at
two different times between July and October. The Fatness Index was developed in recent years to
estimate body condition in polar bears (Atkinson and Ramsay 1995. Atkinson et al. 1996a) and
brown bears (Ursus arctos; Hilderbrand et al. 2000). and is calculated as the proportion of fat to lean
body mass (kg/kg). The values for fat and lean body mass are calculated based on the results
obtained from body composition analysis by deuterium dilution (Farley and Robbins 1994). In this
study, the paired Fatness Index (a) values for 18 bears were calculated from the results of 36
deuterium dilutions that were reported by Arnould (1990) and Atkinson et al. (1996a). The paired
Fbd values for the other two bears were determined first by applying the deuterium dilution
technique to estimate fat and lean body mass as described by Farley and Robbins (1994). and then by
calculating the & values as described by Atkinson and Ramsay (1995).
23 Results
The relationship between total body mass (TBM) and straight-line body length (SLBL) was
described in both female and male polar bears by a curvilinear function of the form:
(Eqn. 2.2)

Where e is the base of the natural logarithm, and /& and PI are the intercept and slope of the fitted
line. Because the intercepts and slopes did not differ significantly (ZBo = 1.65 and Zgl = 1.86 , p 2
0.07) between the sex-specific equations, all data were pooled and a single regression equation was
calculated (Fig. 2.1 ).
The distribution of body condition index (BCI) values for the 1072 bears conformed closely
to the sigmoid curve defined by a normal frequency distribution (Fig. 2.2). No systematic trends
were apparent in the scatter of data points that resulted from plotting the BCI values against SLBL
(Fig. 2.3). Furthermore. the correlation between the two variables was not significant ( r = 0.005, p =
0.86, n = 1072).
The variation in the mass of fat (range: 2.3 to 163.4 kg), skeletal muscle (range: 10.1 to
199.1 kg), potential energy tissue (fat + skeletal muscle; range: 12.4 to 362.5 kg), and structural
tissue (skin and fur + bone + viscera; 18.4 to 155.7 kg) dissected from 3 1 polar bears was
significantly associated with both the SLBL (range: 122 to 247 cm) and the BCI (range: -2.1 to + 1.0)
(Table 2.2). The SLBL was more closely correlated with the mass of most tissues, except for the
dissectable fat for which the BCI was the stronger correlate. The proportion of the variation in tissue
mass that was associated with the BCI was greater for the potential energy tissue than for the
structural tissue as indicated by the respective increases in the coefficients of multiple determination
(increase in R*: 0.25 versus 0.01) following the inclusion of the BCI as a predictor variable in the
regression model (Table 2.2; Fig. 2.4).
Four nomograms were constructed to allow estimates of the BCI to be made at the points of
intersection between paired values for SLBL and TBM (Fig. 2.Sa-d). The regression equations
calculated for the different BCI lines were as follows:
TBM = e " 0 3 - ~ ~ ~ ~ 3 . 0 9 , when BCI = +2.0
TBM = e - ' 0 ' - ~ ~ ~ ~ 3 . 1 0 , when BCI = +I -5
- TBM - e " 0 . ' - ~ ~ ~ ~ 3 . 1 ' , when BCI = + I -0
TBM = e - ' 0 . 6 . ~ ~ ~ ~ 3 . m , when BCI = +O.S
(Eqn. 2.3)
(Eqn. 2.4)
(Eqn. 2.5)
(Eqn. 2.6)

Straight-Line Body Length (cm)
Figure 2.1 Curvilinear relationship between total body mass and straight-line body length in 1072 polar bears. Symbols represent females (0 ) and males (0 ).

-3 -2 -1 0 +1 +2 +3
Body Condition index
Figure 2.2 The cumulative frequency distribution of Body Condition Index (BCI) values for 1072 polar bears. The hatched tines show a close correspondence of the data distribution with a normal cumulative frequency distribution in that the cumulative frequency of BCI values at -2, - 1,0, +I. and +2 are approximately equal to the cumulative frequency of a normal distribution at -2 standard deviations (SD; 2.3%). - ISD (I 5.9%). the mean ( 50%). +ISD (65.9%). and +2SD (97.7%), respectively.

60 1 30 200 270
Straight-Line Body Length (cm)
Figure 2.3 The association between the Body Condition Index (BCI) and straight-line body length (SLBL) in 1072 polar bears.

Table 2.2 The association between dissectible tissue mass (kg) and the predictor variables, straight- line body length (SLBL; cm) and the body condition index (BCI), in 3 1 polar bears.'
Repression Models and Statistics with highest correlated variable with both predictor variables
Model R' SE Model R' SE
dissectible fat e (3.8 + 0.67Bo 0.49 0 62 eW70B" - 12.1). SLBL~.'~ 0.88 0.31
skeletal muscle e ‘ ' 3 - 5 . ~ ~ ~ ~ 3 3 a 0.87 0 22 e(O.ZIBCl - 13.6). S L B L ~ . ~ ~ 0.97 0.1 1 potential energy tissue ~ ' " - s L B L ~ . ~ 0.74 0.34 - 12."- S L B L ~ ~ ' 0.99 0.07 structural tissue e - 1 0 . 6 - ~ ~ ~ ~ L B 3 0.97 0 09 e(0.06BCI - 10.6). SLBL"'~ 0.98 0.07
Models were determined by stepwise regression analysis with the dependent variable, tissue mass (kg), and the independent variables, SLBL (cm) and BCI. The association between the dependent and independent variable(s) were highly significant @ < 0.001) in all regression models. The coefficient of multiple determination (It2) and the standard emor of the predicted mean (SE) is presented for each model. Potential energy tissue mass is equal to the combined mass of dissectable fat and skeletal muscle. Structural tissue mass is equal to the combined mass of skin and fur, bone, and viscera.

450 7 Potential Enerav Tissue /
0 90 180 270 360 450
Observed Mass (kg)
Structural Tissu4%"
0 30 60 90 120 150 Observed Mass (kg)
Figure 2.4 The association between the observed mass of dissectible tissue and that predicted by straight-line body length (SLBL) alone, or by the combination of SLBL and the Body Condition Index (BCI), in 3 1 polar bears. The regression models describing the different associations are presented in Table 2.2. The combination of SLBL and BCI (0 ) provide more accurate predictions of potential energy mass (dissectible fat mass + skeletal muscle mass) than does SLBL alone (0 ). However, the mass of stnrctural tissue (skin and fur mass + bone mass + viscera mass) that is predicted by the combination of SLBL and BCI (0 ) is only slightly more accurate than that which is predicted by SLBL alone (m 1-

Straight-Line Body Length (cm)
. . . . . . . . . . C ....... C. . ..............I...... ........... . . . . . . . . . . .......... ... ........-..................... . . . . . . . . . .
BCI +2.0
BCI
70 80 90 100 110 120 130
Straight-Line Body Length (cm)
Figure 2.5 Nomograms for estimation of the Body Condition Index (BCI) over straight-line body length (SLBL) intervals of: a) 60 to 70 cm; b) 70 to 130 cm; c) 130 to 190 cm; and d) 190 to 270 cm. The estimated BCI value is found at the point of intersection for paired valucs of SLBL and total body mass.

BCI
130 140 150 160 170 180 190
Straight-Line Body Length (crn)
. . . . . . . . . . . . . . . 1 I 1 1 I I 1 1
90200210220230240250260270
Straight-Line Body Length (cm)
BCI +2.0
Figure 2.5 continued.

TBM = e - ' 0 . 8 . ~ ~ ~ ~ 3 - 0 8 . when BCI = 0
TBM = ~'".O=SLBL~-", when BCI = -0.5
TBM = ~-".O-SLBL~.'~, when BCI = - 1.0
TBM = e-"-' -sLBL'.'~, when BCI = - 1.5
TBM = e - " 3 - ~ ~ ~ ~ 3 . 0 9 , when BCI = -2.0
(Eqn. 2.7)
(Eqn. 2.8)
(Eqn. 2.9)
(Eqn. 2.10)
(Eqn. 2.1 1)
The coefficients of multiple determination (R*) ranged from 0.995 to 0.999 and the standard errors
of the predicted means (SE) ranged from 0.027 to 0.035.
When comparing the BCI to the Quetelet Index (QI), the differences in mean values among
months within the different adult classes were similar for both indices (Fig. 2.6). Within each adult
class, mean BCI and QI values were greatest during July and August, intermediate during October,
and least during April-May and November (one-way ANOVA: F = 30.3, p < 0.001; Tukey's
Honestly Significant Difference test: p < 0.05). However, when comparing mean values among adult
classes within some months, there were differences between the BCI and the QI. In July and in
August. the mean BCI value for solitary females was significantly greater than both that for females
accompanied by cubs and that for males. In contrast, there were no significant differences in mean
QI value between solitary females and males at these times. Furthermore, in October, the mean BCI
value for solitary females was greater (but not significantly different) than that for males, whereas the
mean QI value for solitary females was less than that for males. The correlation between the QI and
SLBL was positive and highly significant ( r = 0.66, p c 0.001, n = 1072; Fig. 2.7).
When comparing the BCI to the Fatness Index (&), there were differences between
indices both with respect to the ranking of condition values among the different bears at each of the
two capture times, and with respect to the magnitude of change in the condition values for individual
bears between the two capture times (Fig. 2.8). The capture interval varied from 20 to 24 days for
nine fasting female polar bears that were accompanied by cubs, and from 66 to 92 days for 1 1 fasting
male polar bears. There was no significant association between the BCI and 5 in their respective
ranking of body condition values among the 20 bears at either capture time (Spearman correlation: r,
APR-MAYJUL AUG OCT NOV
Month of Capture
Figure 2.6 Estimation of the body condition of 420 adult polar bears, captured at different months of the year, by the Quetelet Index (QI) and the Body Condition Index (BCI). Within each month of capture, mean values + standard error are respectively represented by a vertical bar and line for solitary females ( 0). females accompanied by cubs (m ), and males ( ) . The number of bears of each adult class captured within each month is indicated in parentheses below the corresponding vertical bars. Different letten above the vertical bars within each month indicate significant differences between means as determined using Tukey's Honestly Significant Difference test.

Straight-Line Body Length (em)
Figure 2.7 The association between the Quetelet Index (QI) and straight-line body length (SLBL) in 1072 polar bears.

Fatness lndex (1 St capture)
Body Condition lndex (1 st capture)
Figure 2.8 Estimation of the change in body condition of 20 polar bears, that were captured twice during the same year between July and October, by the Fatness Index (Flu) and by the Body Condition Index (BCI). The estimated body condition values of nine females ( 0 ) and 1 1 males ( ) at fmt capture are plotted against the values at second capture. The hatched lines indicate the direction and magnitude of change in estimated body condition between captures. All points would align with the solid line if the estimate of body condition remained unchanged between captures. The numbers above the solid line correspond with individual data points below the line and provide a unique identification for each bear. The identification numbers indicate the ranking of the Q values of bears at first capture relative to each other in descending order (i.e., the Ffdd value at first capture was highest for Bear 1 and lowest for Bear 20). Fatness Index and BCI values are calculated from data reported by Amould (1990) and Atkinson (1996a).

= -0.13, p = 0.58 at first capture; r, = -0.07, p = 0.77 at second capture). There also was no
significant association between the BCI and 5 in their respective ranking of the change in body
condition values among the 20 bears between the two capture times (r, = -0.01, p = 0.97).
To further investigate the lack of association between the & and the BCI, Fatness Index
values were calculated for 3 1 polar bears that were dissected by Cattet (1990). and for I 1 polar bears
for which whole body chemical composition was determined by Watts (1983; five bears) and Cattet
(1988; six bears) (Fig. 2.9). The Fatness Indices based on tissue dissection (bust) and whole body
chemical composition (mhd) were cdculated as:
&- = dissectible fat mass in kg + (TBM - dissectible fat mass in kg) (Eqn. 2.12)
EZhkd = whole body lipid content in kg + (TBM - whole body lipid content in kg) (Eqn. 2.13)
The BCI was positively and significantly correlated with both the Lc (Pearson correlation: r =
0.84, p < 0.001, n = 3 I) and the (r = 0.76, p < 0.01. n = 1 I), but was not correlated with the
paired 5 values of 20 bears (r = 0.14, p = 0.39, n = 40).
2.4 Discussion
2.4.1 Develovment of the BCI
The primary objective of this investigation was to develop a body condition index (BCI) for
polar bears which could be measured easily and used to compare among individual animals
regardless of sex, age, reproductive class, geographical population, or season-of-capture.
The BCI is easy to measure. It is determined from two parameters, straight-line body length
(SLBL; the straight-line distance from the tip of the nose to the end of the last tail vertebra) and total
body mass (TBM), that are routinely measured during the handling of captured bears. Furthermore,
the use of nomograms based on SLBL and TBM values provides rapid determination of BCI values
without complex calculations (Fig. 2.5a-d). There is, however, potential for measurement error to
have a small effect on the determination of BCI values because variation in the measurement of

Fatness lndex Fatness lndex Fatness lndex

SLBL can occur both among and within individual persons (Cattet 1990. Eason et al. 1996. Cattet et
al. 1997). More significant error in BCI determination would be expected to occur if TBM is
estimated by morphometric measurements (e.g., heart girth), instead of measured by weigh scale,
because measurement error is compounded by the regression equation used to predict TBM (Cattet
et al. 1997).
The BCI can be used to compare among individual animals regardless of sex, age,
reproductive class, geographical population, or season-of-capture. This is because it was developed
from a sample population that was large in number; representative of all sex, age, and reproductive
classes; was comprised of members of three geographical populations; and also was comprised of
polar bears captured during most months of the year (Table 2.1). Furthermore. the ranges of values
for SLBL (62 to 256 cm) and TBM (5.9 to 654.0 kg) reported in this study are as large as the ranges
of values that have been reported previously for polar bears in these three geographical populations
(Kolenosky et al. 1989, Atkinson et al. 19%b, Derocher and Stirling 1998), and also are as wide as
values reported for polar bears in other populations (Durner and Amstrup 1996, Derocher and
Stirling 1998). Finally, because the BCI is the standardized residual for the curvilinear relationship
between SLBL and TBM (Figs. 2.1 to 2.3). it can be compared among bears without the potentially
confounding effect of variation in body size (Reist 1985, Piersma and Davidson 1991).
Although the BCI is a continuous variable that has no units and ranges in value from -3 to
+3, it is sensitive to the abundance of potential energy stored in the body tissues of a polar bear
relative to its body size. This was established by demonstrating that variation in the BCI values of
3 1 killed polar bears accounted for a large proportion of variation (25%) in the mass of potential
energy tissue (dissectibie fat + skeletal muscle) while accounting for only a small proportion (1%) of
variation in the mass of structural tissue (skin and fur + bone + viscera) (Table 2.2 and Fig. 2.4).

2.4.2 Com~arison of the BCI with Other Indices of Bodv Condition
To evaiuate the use of the BCI, it was assessed with two other indices that have been used
in recent years to measure body condition in free-ranging polar bears (Atkinson and Ramsay 1995.
Atkinson et al. 1996a, Stirling et al. 1999). Assessment of the BCI with one of the indices, the
Quetelet Index (QI), allowed comparison between these indices in a situation where the body
condition of different bears captured at different times was being determined (i-e., cross-sectional
data). Assessment of the BCI with the other index, the Fatness Index (a), allowed comparison
between these indices in a situation where the change in body condition of the same bears captured at
two different times was being determined (i.e., longitudinal data).
The pattern of differences in the mean body condition of the different classes of adult polar
bears among months was similar between the BCI and the QI. The pattern of differences among
adult classes within some months, however, were different between the two indices. The mean BCI
values for solitary females during July and August were greater than those for males, and those for
females accompanied by cubs, during the same months (Fig. 2.6). These results agree with
observations that solitary adult females captured during summer often are pregnant and obese
(Ramsay and Stirling 1988, Derocher et al. 1992) and that, relative to other adult classes, solitary
females must be in good body condition to maintain their pregnancy and undergo lactation while in a
fasting state (Watts and Hansen 1987, Atkinson and Ramsay 1995). In contrast, the mean QI values
for solitary females were similar to those for males during July and August. This could be explained
by the fact that the QI is affected by body size as was demonstrated by the strong positive correlation
between SLBL and the QI (Fig. 2.7). As a result of this size-dependency, longer bears (e-g., adult
males) were more likely to have higher QI values than were shorter bears (e.g., adult females)
independent of any differences in body condition.
There was little, if any, correspondence between the BCI and the & both with respect to
the ranking of condition values among different bears at each of two capture times, and with respect
to the magnitude of change in the condition values for individual bears between the two capture
times (Fig. 2.8). One potential explanation for a lack of agreement between these indices may be

that they were not developed to reflect the same definition for body condition. BCI values vary as
the proportion of potential energy tissue mass (fat + skeletal muscle) varies in relation to the
proportion of structural tissue mass. In contrast, E& values reflect the proportion of fat mass in
relation to the proportion of lean body mass, for which skeletal muscle is a component (Atkinson and
Ramsay 1995, Atkinson et al. 1996a).
To determine if "different definitions of body condition" could explain a lack of agreement
between these indices, BCI and Fatness Index values were calculated for 31 polar bears that were
dissected by Cattet (1990). It was necessary, however, to calculate the Fatness Index values as the
mass of dissectible fat divided by the mass of remaining body tissue (termed because
deuterium dilutions had not been done in these bears. Nevertheless, there was a significant and
positive association between the BCI and the & values which did not support the proposed
explanation (Fig. 2.9). BCI and Fatness Index values also were calculated for 11 bears for which
whole body chemical composition had been determined by Watts (1983) and Cattet (1988). For
these bears, Fatness Index values were calculated as the mass of chemically-extracted lipid divided
by the TBM less the mass of chemically-extracted lipid (termed mM4). Again, however, there
was a significant and positive association between the BCI and mhkd values (Fig. 2.9). Together,
these results suggest the lack of agreement between the BCI and the & could not be explained by
different definitions of body condition. These findings do, however, caution against the use of an
isotope dilution model developed in black (Ursus americanus) and brown bears (Farley and Robbins
1994) to estimate body lipid content in polar bears, and instead point toward a need to determine the
specific relationship between the results of deuterium dilution and whole body chemical composition
for polar bears (see Appendix A).

3. ASPECTS OF PROTEIN AND AMINO ACID METABOLISM IN FREE-RANGING
ADULT POLAR BEARS
3.1 Introduction
As time without food is extended, the distinction between fasting and starvation is
determined primarily by the ability to spare protein from net catabolism. In fasting, protein loss is
regulated in such a way as to maintain organ function and integrity. In starvation, protein loss
exceeds a critical hreshoId beyond which organ function is compromised (Young and Scrimshaw
197 1, Castellini and Rea 1992). The ability to spare protein is highly variable among species. The
exceptional capacity of penguins, seals, and bears to survive prolonged fasts lasting weeks to months
has been described previously (Castellini and Rea 1992). In these animals, protein loss is reduced
either through a marked decrease in protein catabolism, as occurs in penguins and seals (Robin et al.
1988. Nordoy et al. 1990). or through nitrogen recycling, as occurs in black and brown bears (U.
americanus and I/. arcros) (Nelson et al. 1975, Barboza et al 1997).
Polar bears (Ursus maniimus) represent an extreme of fasting-adapted mammals (see
Chapter 1), but little is known about their ability to spare body protein from net catabolism. Because
changes that occur in the ratio of serum urea to serum creatinine at the commencement of fasting are
similar among polar, black, and brown bears, it has been speculated that polar bears may use the
same efficient protein-sparing mechanisms that are used by other bear species (Derocher et al. 1990,
Ramsay et al. 199 1). Estimation of the change in the body composition of fasting polar bears has
determined, however, that the catabolism of protein appears to meet a significant proportion of
energy demands in some individual bears (Atkinson et al. 1996a, but see Appendix A).
To further examine protein-sparing in polar bears, plasma concentrations of proteins.
enzymes, fiee amino acids, and nitrogen end-products were measured in free-ranging polar bears

captured throughout the year to determine the association of these plasma constituents with
nutritional state (feeding versus fasting), sex (female versus male), and body condition (lean versus
fat). The activities and concentrations of enzymes and metabolites that are involved in the ornithe-
urea cycle and intermediary metabolism dso were measured in the livers of killed polar bears.
3.2 Materials and metbods
3.2.1 Animals and samdes
Thirty-nine, free-ranging, adul t polar bears were captured from April to November, 1995.
All bears were located by helicopter and chemically immobilized with ~ e l a z o l ~ (8 to 10 mg/kg
intramuscularly) using remote injection equipment (Stirling et al. 1989). Seventeen bears were
captured during spring (April and May) while they were hunting seals on arctic sea-ice near Resolute
Bay, Nunavut, Canada (74O00' to 76O0O9N and 93O00' to 100"SO'W). Twenty-two bears were
captured during summer and fall (July to November) while they were fasting on land along the west
coast of Hudson Bay near Churchill, Manitoba, Canada (57O00' to 58'50-N and 92O25' to
94O 15'W).
Bears were weighed (2 0.5 kg) with an electronic load scale while suspended in a sling.
Body length was measured by positioning bears in sternal recumbency and measuring the straight-
line distance (i 0.5 cm) between the distal tips of nose and tail. Body condition of captured bears
was quantified by a body condition index (BCI) based on the relationship between body mass and
length (see Chapter 2). Ages of bears previously captured were obtained from a national database
(Canadian Wildlife Service, Edmonton, Alberta). The ages of bears not previously captured were
determined by extracting, sectioning, staining, and counting cementum annuli on one first premolar .
tooth (Stoneberg and Jonkel 1966). Bears 5 years of age or older were classified as adults (Lunn et
al. 1997).
Samples of frozen liver tissue and plasma collected during 1993-94 from four adult male
polar bears killed by Inuit hunters during spring, and from a single adult male polar bear killed by
conservation enforcement officers during fall, were obtained to measure the activities and

concentrations of enzymes and metabolites involved in the ornithine-urea cycle and intermediary
metabolism. All liver samples were collected and frozen in liquid nitrogen at the time of death.
3.2.2 B l d analysis
Twenty milliliters of blood was collected from the jugular vein into ~ a c u t a i n e r ~ tubes
containing sodium heparin (Becton Dickinson and Company, Franklin Lakes, New Jersey, USA).
Blood samples were cooled immediately following collection and were centrifuged within 12 hours
to collect and freeze plasma. The packed cell volume (PCV) was determined using the
microhematocrit technique (Bush 1991). Plasma total protein, albumin, urea, creatinine, alanine
ami notransf erase (ALT), aspartate aminotransferase (AST), and y glutam y l transferase (y-GT) were
determined by the Clinical Pathology Laboratory at the Western College of Veterinary Medicine.
University of Saskatchewan, using an Abbott spectrum" Series I1 biochemistry analyzer (Abbott
Laboratories Diagnostics Division, Abbott Park, Illinois 60064, USA). The concentration of the
globulin fraction was calculated by subtracting the albumin concentration from the total protein
concentration. Globulin fractions (a,, az, $, and y) were separated and quantified by protein
electrophoresis using cellulose acetate as the supporting medium. Plasma free amino acids and
ammonia were determined at the University of Illinois Veterinary Medical Clinic, Champaign-
Urbana, using high performance liquid chromatography (Beckman System 6300 high performance
amino acid analyzer; Beckman Coulter, Inc., Fullerton, California 928343100. USA).
3.2.3 Liver enzvme and metabolite analysis
Samples of frozen liver tissue from five polar bears were obtained to measure the activity of
carbamoyl phosphate synthetase I (CPS-I), omithine transcarbamoylase (OTC), argininosuccinate
synthetase (AS), argininosuccinate lyase (AL), arginase, glutamine synthetase (GS), glutamate
dehydrogenasc (GDH), AST, ALT, lactate dehydrogenase (LDH), phosphoenolpyruvate
carboxykinase (PEPCK), pyruvate kinase (PK), and 3-hydroxyacyl-coenzyme A dehydrogenase
(HOAD). Liver concentrations of urea, ammonia, glutamine, glutamate, and uric acid also were
measured.
The activities of ornithine-urea cycle enzymes, GS, and GDH were determined at the
Department of Zoology, University of Guelph, using a Varian DMS lOOS spectrophotometer
(Varian, Inc., Palo Alto, California 94304, USA) at 340 nm and at 10°C. Liver tissue extracts were
prepared for determination of the activities of CPS-I, OTC, AS, AL, arginase, GS, and GDH by a
modification of the procedure described by Korte et al. (1997). Frozen tissue (500 mg) was thawed,
minced, homogenized with a Brinkmann ~ o l ~ t r o n ~ homogenizer (Brinlunann Instruments. Inc.,
Westbury, New York 1 1590-0207, USA) in 1 :9 w/v of extract buffer (50 mM 4-2-h ydroxyethyl- 1 -
piperazineethanesulfonic acid [HEPES] buffer, 5 0 m M KC], 0.5 mM ethylenediarnine tetra-acetic
acid [EDTA], 1 .O mM dithiothrei to1 [Dm, 10 rnM adenosine triphosphate [ATP], 25 mM MgS04,
and 5.0 mM NaHC03), and sonicated (-30 sec). Homogenates were centrifuged at 14.4- for 10
minutes. Low molecular weight (< 5000 glmole) substrates and effectors were removed from the
supernatant using a 2.5 x 10 cm (-60 ml) Sephadex G-25 column. Assays were conducted according
to the procedures described by Wright et al. (1992) and Wright et al. (1995). and the assay
conditions are provided in Table 3.1.
Assays for all other enzymes were conducted at the Department of Animal Science,
University of British Columbia. For these, liver tissue extracts were prepared by homogenizing
thawed pieces of liver in a buffer (1:4 w/v) consisting of 50 mM imidazole and I .O m M EDTA
(sodium salt), adjusted to pH 7.40 with HCI at room temperature. The homogenate was centrifuged
for 1 minute at 12,000g and the supernatant was used in subsequent assays. Assays were conducted
according to the procedures described by Vijayan et al. (1991). and the assay conditions are
provided in Table 3. I.
Protein concentrations for ALT. AST, LDH, PEPCK, PK, and HOAD activities were
determined using the bicinchoninic acid protein microplate assay described by Smith et al. (1985).
The PK activity ratio was determined as the activity of PK at low PEP concentration as a proportion
of the PK activity at high PEP concentration (Vijayan et al. 1997).

Table 3.1. Assay conditions used for the determination of liver enzyme activity in polar beus.
Enzyme Conditions
CPS
OTC
AS
AL
arginase
GDH
GS
ALT
AST
LDH
PEPCK
PK
HOAD
tissue extract was assayed both with ammonia + N-acetylglutamate and with ammonia alone, in addition to 100 m M ATP, 200 m M MgS04, 75 mM ornithine, 200 rnM NaHCO3, and 1 unit of OTC. The CPS-I activity was calculated by subtracting the CPS activity in the presence of ammonia alone from the activity with ammonia + N-acetylglutamate present.
75 mM ornithine, 50 rnM carbamoyl phosphate, 50 m M KCI, 0.5 m M DlT, and 0.25 rnM EDTA in 50 m M HEPES buffer.
50 mM aspartate, 60 mM citrulline, 100 mM ATP, 200 m M MgS04, 1 0 0 Ulml phosphoenolpyruvate (PEP), 250 m M KH2P04, 450 U/ml PK, 1000 U/ml arginase, and 10 Ulml AL in 50 mM HEPES buffer.
60 mM argininosuccinate and 1000 U/ml arginase in SO mM HEPES buffer.
100 rnM arginine, 50 mM MnC12, and 100 rnM glycine.
7.0 mM KCl, 28 m M KHC03, 5.0 m M KHtPO4, 50 m M ( m ) 2 S 0 4 , 1.0 m M EDTA, 1.0 m M ADP, 0.2 m M NADH, and 7.0 mM a-ketoglutarate (a-KG) in 30 mM HEPES buffet.
40 m M imidazole-HCI buffer, 60 rnM glutamine, t 5 m M hydroxylamine-HCI, 3.0 m M MnC12, 20 rnM sodium arsenate, and 0.4 mM ADP.
10 mM a-KG, 50 mM alanine, 25 ph4 pyridoxal5'-phosphate, 0.2 m M NADH, and excess LDH.
10 m M a-KG, 25 rnM aspartate, 50 pM pyridoxal5'-phosphate, 0.32 rnM NADH, and excess glycerol-stabilized malate dehydrogenase (MDH).
1 .O mM pyruvate and 0.12 m M NADH.
9.0 rnM PEP, 0.6 rnM 2'-deoxyguanosine 5'-diphosphate, 20 mM NaHC03, 1.0 mM MnCI2, 0.15 mM NADH, and excess MDH.
0.6 dl PEP, 20 rnM KCI, 10 mM MgC12, 6.0 mM ADP, 0.3 m M NADH, and excess PK- free LDH.
0.1 m M acetoacetyl CoA and 0. I5 rnM NADH.

Liver metabolite concentrations were determined at the Department of Zoology, University
of Guelph. For these, frozen tissue was ground to a tine powder in liquid nitrogen using a mortar
and pestle. The powdered tissue was deproteinized with I: 1 v/w of chilled 2 N HC 101 and
centrifuged at 14,000g for 10 minutes. Afierward, the powdered tissue was neuualized with KHC03
and centrifuged again. Urea was measured using the method of Rahmatullah and Boyde (1980).
Commercial diagnostic kits were used to measure concentrations of glutamine and glutamate (Sigma
WLN- I) , ammonia (Sigma # 171-A), and uric acid (Sigma M85- 10; Sigma Chemical Company, St.
Louis, Missouri 63 178, USA). All metabolite measurements were carried out at 4OC.
3.2.4 Statistical analvsis
Statistical analysis was performed using SPSS software (SPSS, Inc., Chicago, Illinois,
USA). Two-way analysis of variance (ANOVA) was used to determine differences in plasma
constituents among nutritional states (feeding and fasting), and between sexes (Zar 1996). The body
condition index (BCI) and drug dosage (mgkg) were included as covariates. Student's t-test for two
independent samples was used to compare globulin protein concentrations and amino acid groups
between seasons, and the Mann-Whitney U-test was used to compare globulin protein concentrations
between sexes within each season. Pearson (r) and first-order partial correlation (rputiA) analyses
were used to identify associations among plasma constituents. Spearman correlation analysis (r,)
was used to determine the pairwise associations between values for plasma and liver constituents
from killed polar bears (Zar 1996). For all statistical tests, significance was assigned when the
probability of a Type I error was equal to or less than 0.05. All results are reported as mean f
standard error (SE).
33 Results
Packed cell volume (PCV) and the plasma concentrations of proteins, enzymes, nitrogen
end-products, and most amino acid groups differed significantly by nutritional state, or sex, or a
combination of these factors (Table 3.2). Fasting polar bears had higher concentrations of globulin

Table 3.2 Packed cell vdumc and concc~~trotions of proteins, enzymes, amino a d (-1 p u p . n i w e n end-products in the plasma of f d n g (aphrrd during spring) ad fasting (uparrd during sunmr-f.ll) adult polar bears.'
Emim Feedinn Factor or Covanatc (spring) (summer-fall)
Plasma f m e d e f d e maie NS sex NS BCI constituent (n = 9 ) (n = 8) (n= 11) (n= 11) x sex
Values reportad as mean f SE with range presented in parentheses. Statistical comparison made by two-way ANOVA with nutritional state (NS) and sex as the factors, NS x sex as the interaction, and the Body Condition Index (BCI) as the covariate. Significance indicated by "ns" for non-significance, for p S 0.05, ** forpSO.O1, and *** f a p S0.001.
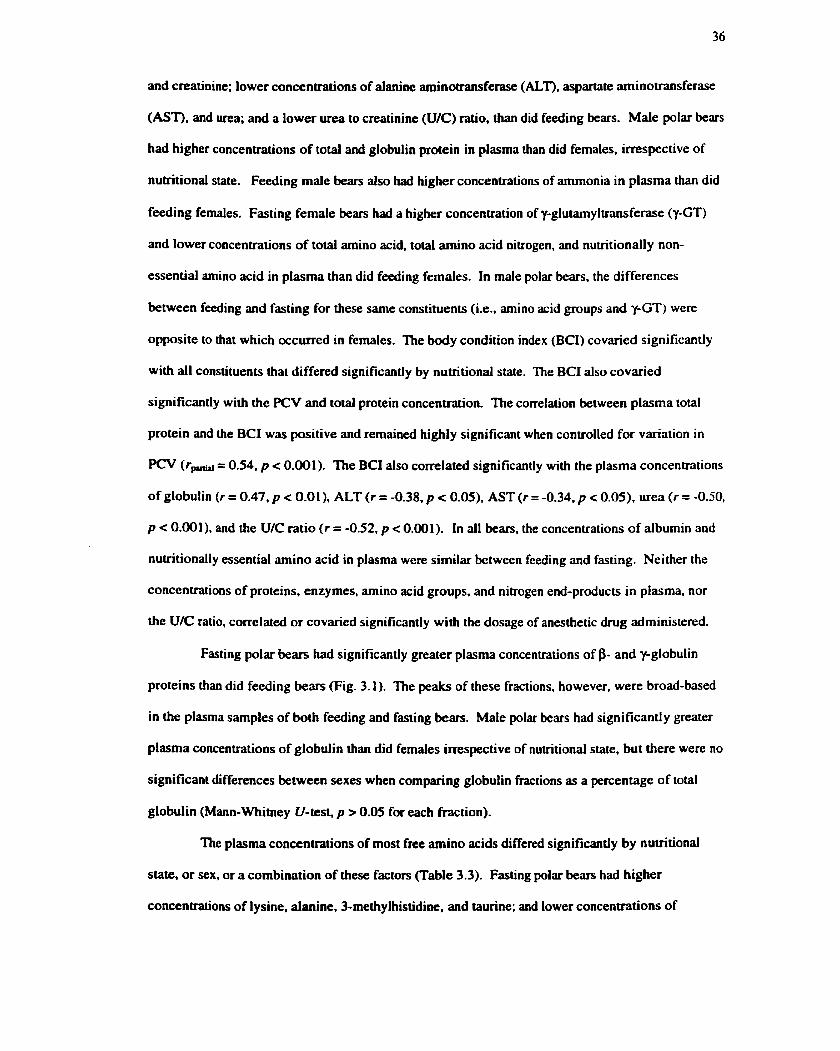
and creatinine; lower concentrations of alanine aminotransferase (ALT), aspartate aminotransferase
(AST), and urea; and a lower urea to creatinine (UfC) ratio, than did feeding bears. Male polar bears
had higher concentrations of total and globulin protein in plasma than did females, irrespective of
nutritional state. Feeding male bears also had higher concentrations of ammonia in plasma than did
feeding females. Fasting female bears had a higher concentration of y-glutamyltransferase (y-GT)
and lower concentrations of total amino acid, total amino acid nitrogen, and nutritionally non-
essential amino acid in plasma than did feeding females. In male polar bears, the differences
between feeding and fasting for these same constituents (i.e., amino acid groups and y-GT) were
opposite to that which occurred in females. The body condition index (BCI) covaried significantly
with all constituents that differed significantly by nutritional state. The BCI also covaried
significantly with the PCV and total protein concentration. The correlation between plasma total
protein and the BCI was positive and remained highly significant when controlled for variation in
PCV (r- = 0.54, p < 0.001). The BCI also correlated significantly with the plasma concentrations
of globulin (r = 0.47, p c 0.01), ALT (r = -0.38, p < 0.05). AST (r = -0.34, p < 0.05). urea ( r = -0.50,
p c 0.001 ), and the U/C ratio (r = -0.52, p < 0.001). In all bears, the concentrations of albumin and
nutritionally essential amino acid in plasma were similar between feeding and fasting. Neither the
concentrations of proteins, enzymes, amino acid groups. and nitrogen end-products in plasma, nor
the U/C ratio, correlated or covaried significantly with the dosage of anesthetic drug administered.
Fasting polar bears had significantly greater plasma concentrations of P- and y-globulin
proteins than did feeding bears (Fig. 3.1). The peaks of these fractions, however, were broad-based
in the plasma samples of both feeding and fasting bears. Male polar bears had significantly greater
plasma concentrations of globulin than did females irrespective of nutritional state, but there were no
significant differences between sexes when comparing globulin fractions as a percentage of total
globulin (Mann-Whitney U-test, p > 0.05 for each fraction).
The plasma concentrations of most free amino acids differed significantly by nutritional
state, or sex, or a combination of these factors (Table 3.3). Fasting polar bears had higher
concentrations of lysine, alanine, 3-methylhistidine, and taurine; and lower concentrations of

Globulin Fractions Figure 3.1 Plasma concentration of globulin protein fractions in feeding and fasting polar bears. The bars represent the mean values for feeding (n = 9; 0) and fasting bears (n = 9;H) with the standard deviation indicated by a vertical line. Mean values for each fraction were compared between feeding and fasting bears using a t-test for two independent samples, and significant differences are indicated by ** for p (0.01 and *** for p ~ 0 . 0 0 1 .

&dins Ems (wing) (amamu-fd)
Amino md' fbnrle nrrCe kmdc rmlc NS sex NS BQ a (#=a) (n-11) (n-11) xrex

phosphoserine. threonine, hydroxyproline, and tyrosine, than did feeding bears. Male bears had
lower concentrations of 3-methylhistidine and higher concentrations of isoleucine, methionine,
threonine, and tyrosine than did females, irrespective of nutritional state. Fasting female bears had a
higher concentration of glutamate and lower concentrations of asparagine, cystathionine, glutamine,
glycine, and serine in plasma than did feeding females. In male polar bears, the differences between
feeding and fasting for these same amino acids were opposite to that which occurred in females.
Fasting female bears had a significantly greater proportion of their total amino acid nitrogen
occurring in amino acids that contained three (histidine, ciuulline, 1-methylhistidine, and 3-
methylhistidine) and four nitrogens (arginine and carnosine) than did feeding females (Fig. 3.2).
Fasting male bears had a significantly lesser proportion of their total amino acid nitrogen occurring
in amino acids that contained one nitrogen, and a significantly greater proportion of their total amino
acid nitrogen occurring in amino acids that contained two (lysine. tryptophan, asparagine,
cystathionine, glutamine, and ornithine) and four nitrogens, than did feeding males (Fig. 3.2). The
BCI covaried significantly with all the amino acids that differed significantly by nutritional state,
except taurine. The BCI also covaried significantly with the plasma concentrations of arginine,
phenylalanine, valine, carnosine, and proline. Of the amino acids that covaried with the BCI,
significant pairwise correlations occurred between the BCI and plasma concentrations of arginine ( r
= 0.5 1, p < 0.001), lysine (r = 0.61, p < 0.001), phenylalanine (r = 0.33, p < 0.05), threonine ( r =
-0.43, p < 0.01 ), valine (r = -0.32, p < 0.05), asparagine (r = -0.36, p < 0.05), hydroxyproline ( r = -
0.39, p < 0.05), 3-methylhistidine (r = 0.53, p e 0.001), and phosphoserine (r = -0.53, p < 0.001 ).
There were no signficant pairwise correlations between the individual free amino acids and the
dosage of anesthetic drug administered, or between the individual free amino acids and the PCV.
Many of the values for the plasma and liver constituents of a single fasting male polar bear
killed during fall fell outside of the ranges of values of four feeding male polar bears killed during
spring (Table 3.4). The plasma concentrations of total protein, globulin, and creatinine; the liver
activities of argininosuccinate lyase (AL) and arginase; the pymvate kinase (PK) activity ratio; and
the liver concentrations of glutamine and uric acid were all greater in the fasting bear. The plasma


T ' 3.4 Body d t i o a .Id t& -t&w 4 of- -1iW d m c ~ d
i . ~ ~ . d l i ~ ~ f f ~ f ~ g ( e g c l l r c d d & ~ r p i a @ . ~ ~ t ~ l y * ~ b o r r ~ ~ ~ f ~ ~ (upuhd during fa) d u l r p o k b e d

concentrations of ALT, AST, y-GT, and urea; the plasma U/C ratio; the liver activities of carbamoyl
phosphate synthetase I (CPS-I). ornithine transcarbamoylase (OK) , ALT, AST, PK, and 3-
h ydroxyac y 1-coenz yme A de h ydrogenase (HOAD); and the liver concentrations of glu tamate,
ammonia, and urea and were all greater in the feeding bears. In all five bears, the liver urea
concentration correlated positively with CPS-I activity and the concentrations of plasma urea and
liver ammonia, and correlated negatively with liver glutamine concentration (Fig. 3.3). The
concentrations of ALT and AST in plasma and in liver were also significantly correlated (r, =0.90, p
< 0.05 for both enzymes).
3.4 Discussion
3.4.1 Season of caDture. nutritional state. and the UIC ratio
The differences in the urea to creatinine (UK) ratios between bears captured during spring
and bears captured during summer and fall in this study (Table 3.2) supported the assumption that
bears captured during spring and bears captured during summer-fall were respectively analogous to
feeding bears and fasting bears. The high U/C ratios measured in many of the bears captured during
spring were similar to values reported in previous studies (Derocher et al. 1990, Ramsay et al. 199 1)
and suggested that these bears were in a metabolic state consistent with feeding. Conversely, the low
U/C ratios measured in many bears captured during summer and fall indicated that these bears were
in a metabolic state consistent with fasting.
3.4.2 Association with nutritional state
The physiological role of an amino acid is difficult to ascertain from its plasma
concentration alone because amino acids are in a state of constant and rapid flux between plasma and
intracelIular compartments (Adibi 1971, Abumrad and Miller 1983). The same is also true for many
of the other plasma constituents measured in this study. Thus, additional information provided by
the measurement of enzymes and metabolites in the plasma and liver of five killed polar bears (Table
3.4) was used to determine how anabolic and catabolic processes might differentially influence the

Plasma Urea (mmoVL) CPS-I (prnoUmin/g protein) Liver Ammonia (mmoVL) Liver Glutamine (mmoVL)
Figure 3.3 Pairwise associations between the liver urea concentration and thc concentrations of plasma urea and liver ammonia and glutamine, and between the liver urea concentration and the activity of liver carbamoyl phosphate syntheme I (CPS-I), in five adult male polar bears. Associations were determined using Spearman correlation analysis.

concentrations of plasma constituents during feeding and fasting. Pairwise correlations between the
concentrations of specific constituents in plasma also were used to draw inferences of pmiculat
biochemical events or associations (Table 3.5).
Fasting polar bears had significantly lower concentrations of urea in plasma than did
feeding polar bears (Table 3.2). Further, the urea concentration in plasma was closely correlated
with that in liver, and the concentrations in both tissues were positively associated with the liver
activity of carbamoyl phosphate synthetase I (CPS-I) (Fig. 3.3), the major enzyme controlling urea
synthesis (Meijer 1995). Together, these results suggest that urea was synthesized at a slower rate in
polar bears during fasting than during feeding. Urea synthesis decreased in black and brown bears
during winter dormancy, and reduced urea synthesis has been proposed to be a mechanism by which
protein loss is minimized in these species during fasting (Nelson et al. 1975, Barboza et al. 1997). In
this study, the plasma concentrations of alaninc aminotransferase (ALT) and aspartate
aminotransferase (AST) were closely conelated with the plasma urea concentration (Table 3.5). and
the liver activity of these transarninases was lower during fasting than during feeding. These results
suggest that the rate of transamination in liver, and possibly other tissues, was closely coupled with
the rate of urea synthesis in polar bears, and that the lower rate of urea synthesis during fasting
occurred in part as a result of lower rates of protein and amino acid catabolism.
Fasting polar bears had significantly greater concentrations of p- and y-globulins in plasma
than did feeding polar bears (Fig. 3.1). A role for globulin proteins in metabolism during fasting has
not been described previously. Thus, the physiological significance of this difference is unclear.
Because feeding and fasting polar bears were captured in two different geographic localities and
represent two distinct polar bear populations, the difference in 'ycglobulin concentrations could
reflect a difference in antigenic stimulation between populations, possibly as a result of differences
in disease prevalence. Nevertheless, the fact that the concentration of $-globulin also was higher in
fasting than in feeding polar bears, and the fact that wide-based peaks occurred in both the $- and .yc
globulin regions from fasting polar bears, indicate that the differences between feeding and fasting
bears probably involved numerous proteins possessing electrical properties characteristic of 9- aid

Tablc 3.5. Pairwise associations between the concentrations of specific plasma constituents in adult polar bears and the proposed biochemical significance for these associations.'
Constituent pairs r Proposed Biochemical Significance
urea - ALT 0.57
urea - AST 0.53
urea - phosphoserine 0.78
lysine - arginine 0.85
glutamine - alanine 0.67
glutamate - ammonia 0.63
glutamate - y-GT 0.76
- urea synthesis is positively associated with amino acid catabolism
- urea synthesis is positively associated with amino acid catabolism
- urea synthesis is positively associated with the rate of glycolysis
- arginine is positively influenced by Iysine inhibition of arginase
- a significant proportion of plasma alanine is formed from glutamine
- a significant proportion of plasma glutamate is formed from ammonia
- yglutamyl cycle activity is positively associated with plasma glutarnate
Associations were determined using Pearson correlation analyses of plasma constituents in 39 adult polar bears. All associations were significant at p < 0.001.

yglobulin. Thus, although it may be that globulin proteins play a role in the metabolic response of
polar bears to fasting, the data from this study provide no insight as to what that role might be.
Fasting polar bears had higher concentrations of creatinine in plasma than did feeding polar
bears (Table 3.2). The plasma creatinine concentration is not significantly affected by nutritional
state in many mammals (Duncan et al. 1994). but it has been observed to increase during winter
dormancy in black bears (Nelson et al. 1984). and during the period of on-land fasting in polar bears
(Ramsay et aI. 199 1). Because the daily excretion of creatinine in urine is sindar from day to day
and proportional to muscle mass (Rodwell 2000b), an increase in plasma creatinine concentration
during fasting could occur as a consequence of decreased urine output. In black bears, urine
excretion has been demonstrated to decrease with the onset of winter dormancy (Brown et al. 197 1,
Nelson et al. 1975). Unfortunately, there is no published information regarding urine excretion for
polar bears during feeding and fasting, aside from a few anecdotes to suggest it may be decreased in
denning females (Harington 1968, Watts 1983).
In male polar bears, the plasma concentration of total amino acid nitrogen and the
proportion of total arnino acid nitrogen in amino acids containing more than one arnino group were
greater during fasting than feeding (Table 3.2 and Fig. 3.2). A plausible explanation for these results
is that amino acids containing a single amino group were preferentially catabolized during fasting,
and the amino group was subsequently re-incorporated into amino acids that contained more than
one amino group. A consequence of this "selective catabolism" is that the carbon skeletons of some
amino acids could be made available as substrate for carbohydrate and lipid biosynthesis while other
amino acids served to store nitrogen (particularly glutarnine and arginine) precluding its excretion
via urea synthesis. This inference is well-supported by data from male polar bears, but less so by
data from female bears in which the relevant differences between feeding and fasting were less
pronounced.
The strong positive correlation between the plasma concentrations of lysine and arginine in
polar bears could be explained as a result of competitive inhibition by lysine of arginase, the enzyme
through which arginine is converted to urea and ornithine. Lysine and ornithine are potent inhibitors,

while arginine is a potent stimulant, of arginase activity (Hunter and Downs 1945, Rodwell 2000a).
Through its inhibitory effect on arginase, lysine has been proposed to play a key role in regulating
the supply of ornithine in the thyroid gland of rats (Matsuzaki et al. 198 1). According to the
explanation hypothesized for polar bears, nitrogen flux through the ornithine-urea cycle would
become progressively inhibited at the arginase reaction as the concentration of lysine in the liver
increased. This, in turn, would cause the concentration of arginine to rise in the cytosol of liver cells
(hepatocytes) in parallel with the lysine concentration, and these concentration increases in the liver
eventually would be reflected in the plasma.
The activity of CPS-I in liver and the concentrations of urea in liver and plasma indicate
that the rate of urea synthesis in polar bears was lower during fasting than during feeding (Table 3.2
and Fig. 3.3). The results from the killed bears indicated, however, that only the activities of the
mitochondria1 enzymes CPS-I and OTC were lower during fasting (Table 3.4). In contrast, the
activities of the cytosolic enzymes argininosuccinate synthetase (AS), argininosuccinate lyase (AL),
and arginase were either similar (as with AS) or greater (as with AL and arginase) during fasting than
during feeding. This apparent lack of coordination in the enzyme activity of polar bears contrasts
with the coordinated increases in ornithine-urea cycle enzyme activities that are typical of other
mammals in response to fasting (Schimke 1962, Morris 1992). When considered together with he
hypothesis of competitive inhibition by lysine of arginase, these results suggest that urea synthesis in
fasting polar bears was down-regulated through the CPS-I reaction and inhibited through the
arginase reaction, as is illustrated in Figure 3.4. The CPS-I reaction reduced entry of ammonia
nitrogen into the ornithine-urea cycle (Meijer 1995). and lysine inhibition of arginase reduced the
entry of arginine nitrogen into urea and ornithine. As a result, ammonia nitrogen would be diverted
towards the biosynthesis of amino acids rather than urea, and nitrogen from citrulline and aspartate
would be used to synthesize arginine. This proposed scheme for nitrogen metabolism in the liver of
fasting polar bears (see Fig. 3.4) also provides a plausible explanation as to how nitrogen could be
progressively redistributed during fasting toward amino acids that contain multiple amino groups,
e.g., glutamine, arginine.

,Glutamine (2N) CMOSOL BLOOD
Amino acid biosyqthesis Glutamine ' \)( / Lysine
Glutamate (1 N) Arginine (4N)
rclinine Fumarate \
C02 + NH,+ / Argininosuccinate \
Citrulline (3N)
Figure 3.4 Proposed model for nitrogen metabolism in the liver of fasting polar bears. The reactions proposed as favored during fasting are indicated by bold lines and arrows. Inhibition of the conversion of arginine to urea and ornithine is indicated by X, and the inhibition of arginase by lysine is indicated by a dotted line. The number of nitrogens within the structure of individual amino acids is presented in round brackets following the name of the amino acid. Ornithine-urea cycle enzymes are carbamoyl phosphate synlhetasc I (CPS-I), ornithine transcarbamoylase (OTC), argininosuccinate synthctase (AS), argininosuccinate lyase (AL), and arginase.

Rates of glucose production and oxidation appeared to parallel the rate of urea synthesis in
polar bears. Fasting bears had tower concentrations of phosphoserine in plasma than did feeding
polar bears (Table 3.3), and there was a strong positive correlation between the plasma
concentrations of phosphoserine and urea in all bears (Table 3.5). Because phosphoserine is formed
from the glycolytic intermediate 3-phosphoglycerate, the plasma concentration of phosphoserine is
directly affected by the rate of glycolysis. The finding that the liver PK activity was lower during
fasting than during feeding indicated the rate of glycolysis was lower in fasting bears (Table 3.4).
Furthermore, the finding in this study that the PK activity ratio was higher (the higher the ratio, the
greater the capacity for phosphorylation of PK and the lower the flow of carbon toward
gluconeogenesis). and the finding in a concurrent study that the concentration of glycogen in liver
was greater in fasting bears than in feeding bears (see Chapter 6), are consistent with lower rates of
gluconeogenesis and glycogenolysis during fasting. Together, these results indicate that low rates of
glucose production and oxidation in fasting polar bears were associated with a low rate of urea
synthesis.
The importance of alanine as a gluconeogenic amino acid and the amount of nitrogen and
carbon exchange through the glucose-alanine cycle are likely less significant to fasting polar bears
than to fasting humans. In humans, the plasma alanine concentration decreases progressively and
significantly during prolonged fasting (> 5 weeks) because the uptake of danine from plasma by
splanchnic tissues and its subsequent use for gluconeogenesis are greater than its release into plasma
from muscle (Adibi 1968, Felig et al. 1969). In polar bears, plasma concentrations of alanine were
higher during fasting than during feeding (Table 3.3). Fasting bears also had significantly lower
concentrations of ALT in plasma (Table 3.2) and less ALT activity in liver (Table 3.4), and therefore
presumably less gluconeogenesis from alanine, than did feeding bears. Furthermore, the plasma
concentrations of glutamine and alanine were highly correlated in all bears (Table 3.5). and
supported the possibility that a significant proportion of the alanine in plasma may have arisen from
the catabolism of glutamine in the small intestine (Jungas et al. 1992), instead of through the release
of alanine from muscle.

Fasting polar bears had a higher concentration of 3-methylhistidine and a lower
concentration of hydroxyproIine in plasma than did feeding polar bears (Table 3.3). Because the
liver results did not provide additional infomation regarding the origin or fate of these particular
amino acids, suggestions regarding the physiological significance of plasma concentrations during
feeding and fasting are largely speculative. 3-Methylhistidine is released from muscle into plasma
during the intracellular breakdown of actin and myosin, and the urinary output of this amino acid has
been used as an index of the rate of myofibrillar protein breakdown in the musculature of humans
(Giesecke et al. 1989). High concentrations of 3-methylhistidine in the plasma of fasting polar bears
were unlikely to result from an increased rate of myofibrillar protein breakdown as evidence has
been provided to suggest protein and amino acid catabolism was less during fasting than during
feeding. Instead. as was suggested with the plasma creatinine concentration, the 3-methylhistidine
concentration may have been higher during fasting as a consequence of decreased urine output.
Hydroxyproline is formed from the hydroxylation of peptide-bound proline in collagen, and
its appearance in plasma has been used as an index of bone metabolism (specifically, the resorption
of calcium) in humans (Minisola et al. 1985) and domestic cattle (Goff and Horst 1997). If the
plasma concentration of this amino acid is similarly sensitive to bone metabolism in polar bears, then
the lower plasma concentrations of hydroxyproline in fasting relative to feeding bears may reflect a
lower rate of bone metabolism during fasting.
3.4.3 Differences between females and males
Plasma urea concentration was low in both sexes during fasting (Table 3.2). Thus, urea
synthesis probably occurred at similarly low rates in females and males during fasting irrespective of
other differences in the plasma constituents. Many of the differences measured between sexes may
reflect differences in protein and amino acid metabolism. but overall nitrogen conservation was
similar in females and males.
A general explanation for many of the differences in the concentrations of plasma
constituents between females and males may be found in the differences in the timing of maximal

nitrogen requirement relative to availability of food. For females, the requirement for nitrogen is
most intense during summer, fdl, and winter when food is less available or not available at all.
Females that are accompanied by cubs h a t e throughout the fasting period (Amould and Ramsay
1994) and, therefore, must catabolize their muscle protein and amino acids to provide the nitrogen
required to produce milk protein. Solitary adult females are often pregnant when food is not
available (Derocher et al. 1992) and, therefore, must cataboiize their muscle protein and amino acids
to provide the nitrogen required to form and maintain a conceptus throughout the period of gestation,
i.e., conception during April or May, followed by delayed implantation in October or November, and
parturition in December or January (L0n0 1972, Ramsay and Stirling 1988, Atkinson and Rarnsay
1995). Thus, for most females, the requirement for nitrogen is maximal when food is unavailable,
and nitrogen must be provided through the catabolism of stored body protein. In contrast, the
requirement for nitrogen in adult males is probably greatest in association with mating activity during
spring, a time when food (i.e., seal pups) is abundant. It is at this time that serum testosterone
concentrations attain their annual peak (Palmer et al. 1988). High circulating concentrations of
testosterone affect protein metabolism by increasing the rate of protein synthesis while
simultaneously lowering the rate of protein catabolism (Ganong 1995). Thus, for most males, the
requirement for nitrogen is maximal when food and, therefore, diet-derived nitrogen is available.
Males may fast for brief periods when seeking opportunities to mate, but their high serum
concentrations of testosterone protect their stored body protein from net catabolism.
Some significant differences between female and male polar bears in this study conform
well to the above general model. The plasma concentrations of total amino acid, total amino acid
nitrogen, and nutritionally non-essential amino acid were lower in fasting females than in feeding
females and, conversely, lower in feeding males than in fasting males (Table 3.2). Low
concentrations in fasting females could occur as a result of an increased requirement of plasma
amino acids for the synthesis of milk (in the case of seven lactating females captured during summer-
fall), or for the development and maintenance of a conceptus (in the case of four solitary females
captured during summer-fall). This inference is supported by the observation that the concentration

of yglutamyluansferase ( y GT) was higher in the plasma of fasting females than in thatof feeding
females or fasting males. yGlutamyltransferase (also called 'y~glutamyl transpeptidase) is an enzyme
of the y-glutamyl cycle; a biochemical pathway of major importance in the metabolism of amino
acids and their translocation between tissues, and in the synthesis of glutathione. Under pathological
conditions, a marked increase in the concentration of yGT in the plasma is most commonly
attributed to the leakage of yGT from damaged liver cells (Duncan et al. 1994, Rodwell and
Kennelly 2000). In normal health, however, y-GT can leak into plasma from other tissues because y-
GT occurs as a membrane-bound enzyme in a variety of tissues that include liver, heart, kidney,
skeletal muscle, and tissues of the testicles, mammary glands, fetus, and placenta (Rollins et al. 1981,
Puente et al. 1982, Castellon 1994, Couxtay et al. 1994, Hanigan and Frierson 1996, Leeuwenburgh
et al. 1997). Amino acids have been shown to be translocated from the maternal tissues of rats
through the yglutamyl cycle to be used by placental and fetal tissues and the lactating mammary
gland during pregnancy and lactation (Viiia et al. 1989). Thus, the higher plasma concentration of y-
GT in fasting females than in fasting males could result from higher y-glutamyl cycle activity in
females with the subsequent leakage of yGT into plasma from the tissues of the mammary gland or
fetus and placenta. and the removal of amino acids (specifically glutamine, cystine, and other neutral
amino acids) from the plasma by these tissues.
The lower concentrations of total amino acid, total amino acid nitrogen, and nutritionally
non-essential amino acid in feeding males (relative to fasting males) could occur as the net result of a
high rate of protein synthesis and a low rate of protein catabolism; both effects being induced
through high circulating concentrations of serum testosterone (Palmer et al. 1988, Ganong 1995).
Plasma concentrations of ALT, AST, y-GT, and ammonia were greater in feeding males than in
feeding females, but the plasma urea concentrations did not differ significantly ktween sexes. This
suggests that the loss of nitrogen through urea excretion was similar in both sexes, and that
transamination was greater in males as a result of anabolic processes instead of catabolic processes.
The higher concentration of y G T could reflect higher rates of amino acid metabolism and
translocation through the yglutamyl cycle in testicles and skeletal muscle. The higher concentration

of ammonia could have occurred because ammonia nitrogen was being preferentially directed into
amino acid biosynthesis instead of into storage as glutamine.
Glummine was the most abundant free amino acid in the plasma of polar bears (Table 3.3)-
Nevertheless, there were differences between females and males in that plasma concentrations of
glutamine were higher in feeding females than in fasting females and, conversely, higher in fasting
males than in feeding males. Plasma glutamine plays an important role in preserving amino acid
balance by conserving nitrogen and reducing its excretion as urea (Heitmann and Bergman 1980,
Cersosimo et al. 1986). The time when glutamine concentrations were highest in female bears
coincided with a time when food was available, net protein catabolism was minimal, and excess
nitrogen could be effectively C O ~ S ~ N ~ in plasma as glutamine. The time when glutamine
concentrations were highest in male bears coincided with a time when food was unavailable, net
protein catabolism was maximal, and nitrogen arising from protein catabolism could be effectively
conserved in plasma as glutamine.
The pattern of differences between female and male polar bears in plasma glutamate
concentration was opposite to the pattern observed with the plasma glutamine concentration (Table
3.3). Plasma concentrations of glutamate were higher in fasting females than in feeding females and.
conversely, higher in feeding males than in fasting males. Thus, in contrast to glutarnine, plasma
glutamate concentrations were highest in female and male bears at the time when their nitrogen
requirements were highest. An explanation for these observations is that conservation of nitrogen in
glutamine was less when nitrogen requirements were high, and ammonia nitrogen was preferentially
directed toward glutamate formation with subsequent biosynthesis of other amino acids and
glutathione formation. This hypothesis is supported, in part, by the highly significant and positive
correlations between the plasma concentrations of glutamate and ammonia, and between glutamate
and y-GT (Table 3.5).

3.4.4 Association with body condition
In this study, body condition was defined as the abundance of potential metabolic energy
stored in an animal's tissues (primarily adipose tissue and skeletal muscle) relative to its body size.
The body condition index (BCI) was developed to provide an estimate of the body condition of
individual polar bears relative to other bears in a sample population of 1072 animals (see Chapter 2).
Although the BCI is an index without units, it can be used in conjunction with the body length of a
bear to predict its mass of adipose tissue, skeletal muscle, o r both tissues. The range of BCI values
is distributed normally around a mean value of zero, with positive values indicating a larger
availability of potential metabolic energy and negative values indicating a smaller availability of
potential metabolic energy, relative to the mean body condition of the sample population.
The BCI was strongly correlated with many of the plasma constituents that reflected protein
and amino acid metabolism in polar bears. Furthermore, the effect of large body lipid stores
(positive BCI value) and fasting on the plasma concentrations of many constituents were similar.
These observations provide strong support to indicate that the underlying energy metabolism in both
states (fasting and fat) is one in which lipid is the predominant fuel for energy and nitrogen is
conserved. These results also support previous studies that have shown the rate of protein
catabolism during prolonged fasting in some species, including polar bears, is inversely associated
with the magnitude of body lipid stores (Forbes and Drenick 1979, Cherel e t al. 1992, Atkinson e t al.
1996a).
3.4.5 Effect of anesthesia
The anesthetic drug ~e l azo l@ has not been investigated for its effect on the concentrations
of plasma constituents associated with protein and amino acid metabolism in mammals. Thus, it is
not possibIe to clearly determine whether or not ~elazol" affected the measured variables.
Neverthetess, the uniform treatment of all bears with ~ e l a z o l ~ makes any effects of this drug a fairly
constant factor in the study which should not confound the analysis of the effects of other variables.
Furthermore, the observation that the dosage of ~elazol" administered to polar bears in this study did
not correlate with the concentrations of any plasma constituents suggests that the effects of ~elazoi'
were minimal.
3.4.6 Conclusions
Nutritional state, sex. and body condition affected the concentrations and activity of many
of the plasma and liver constituents associated with protein and amino acid metabolism in polar
bears.
Protein and amino acid catabolism and urea synthesis were significantly lower during
fasting. This may represent one mechanism by which polar bears are able to spare body protein
during prolonged fasts. Nevertheless, the sparing of protein did not appear to be absolute and some
amino acids were likely catabolized to provide substrates for carbohydrate and lipid biosynthesis.
Much of the nitrogen from protein and amino acid catabolism was not irreversibly lost through urea
excretion. but was conserved through the preferential catabolism of amino acids canying a single
nitrogen and the re-incorporation of this nitrogen into amino acids containing multiple nitrogens
(e.g.. glutamine and arginine). The diverting of amino acid nitrogen away from urea formation is
facilitated in part by an imbalance in the enzyme activity of the ornithine-urea cycle at two points.
First, ammonia nitrogen is inhibited from entering the omithine-urea cycle at the CPS-I reaction and
is, therefore. diverted into storage as glutamine or into amino acid biosynthesis through glutamate.
Second, the amino nitrogen in citrulline and aspartate is combined (via the AS and AL reactions)
eventually to form arginine. while arginine is inhibited from further entering the ornithine-urea cycle
because of competitive inhibition of the arginase reaction by lysine (Fig. 3.4).
Many of the differences in the concentrations of plasma constituents between female and
male polar bears reflect differences in protein and amino acid metabolism, but overall nitrogen
conservation was similar in both sexes. Cifferences in protein and amino acid metabolism between
female and male bears arc explained by differences in the timing of maximal nitrogen requirement
relative to availability of food. Nitrogen requirements (for lactation or pregnancy) in femafe bears
are maximal when food is unavailable, and nitrogen must be provided through the catabolism of
stored body protein. Nitrogen requirements (for mating activity) in male bears are maximal when
food and, therefore, diet-derived nitrogen is available.
The effects of large body lipid stores (positive BCI value) and fasting on the concentrations
of many plasma constituents were similar, and indicate that the underlying energy metabolism in
both states (fasting and fat) is one in which lipid is the predominant fuel for energy and nitrogen is
conserved.

4. ASPECTS OF LIPID METABOLISM IN FREE-RANGING ADULT POLAR BEARS
4.1 Introduction
High fat and low carbohydrate diet, seasonal obesity, and prolonged fasting are the usual
circannual dietary habits of the polar bear (Ursus maririmus). These habits suggest that the survival
of polar bears is contingent upon their ability to closely regulate adipose accretion and lipid
metabolism. However, aside from observations that the plasma of polar bears contains higher
concentrations of lipids than occur in the plasma of healthy humans (Ferguson and Folk 197 1,
Kaduce et al. 198 1), the metabolism of lipids by this species has not been studied.
In this study, plasma concentrations of Iipids. lipid precursors and metabolites, total
camitine, and camitine fractions were measured in free-ranging polar bears captured throughout the
year to determine the association of these plasma constituents with nutritional state (feeding versus
fasting), sex (female versus male), and body condition (lean versus fat). Plasma glycerol kinetics
also were measured in polar bears following intravenous administration of '3~-glycerol to compare
rates of lipolysis among bears of different nutritional state, sex, and body condition.
4.2 Mate& and methods
Eighty-two free-ranging, adult polar bears were captured from April 1995 to November
1996. All bears were located by helicopter and chemically immobilized with ~ e l a z o f (8 to 12
mgkg intriunuscularly) using remote injection equipment (Stirling et al. 1989). Twenty-four bears
were captured during spring (April and May) while they were hunting seals on arctic sea-ice near
Resolute Bay, Nunavut, Canada (74O00' to 76O00.N and 93O00' to 100°50'W). Fifty-eight adult
polar bears were captured during summer, fall, and winter (July to November, and March) while they
were fasting on land along the west coast of Hudson Bay near Churchill, Manitoba, Canada (57"00*

to 58°50*N and 92O25' to 94O15'W). The polar bears captured during March were comprised of ten
adult females accompanied by new-born cubs that had emerged recently (within days) from their
snow dens after 8 to 9 months of fasting that included pregnancy and early lactation.
Bears were weighed (2 0.5 kg) with an electronic load scale while suspended in a sling.
Body length was measured by positioning bears in sternal recumbency and measuring the straight-
line distance (* 0.5 cm) between the distal tips of nose and tail. Body condition of captured bears
was quantified by a body condition index (BCI) based on the relationship between body mass and
length (see Chapter 2). Ages of bears previously captured were obtained from a national database
(Canadian Wildlife Service, Edmonton, Alberta). The ages of bears not previously captured were
determined by extracting, sectioning, staining. and counting cementum annuli on one first premolar
tooth (Stoneberg and Jonkel 1966). Bears 5 years of age or older were classified as adults (Lunn et
al. 1997).
Twenty milliliters of blood was collected from the jugular vein into ~acutainer' tubes
containing sodium heparin (Becton Dickinson and Company, Franklin Lakes, New Jersey, USA).
Blood samples were cooled immediately following collection and were centrifuged within 12 hours
to collect and freeze plasma. Plasma concentrations of uiacylglycerol, non-esterified fatty acid
(NEFA), glycerol, total cholesterol, unesterified cholesterol, and high density lipoprotein (HDL-)
cholesterol were measured by Molecular Biology Institute Lipid and Lipoprotein Laboratories
(UCLA, California) using the methods of Burstein et al. (1970), Warnick (1986). and Puppione and
Charungundla ( 1994). Plasma phospholipid was measured at the Hormel Institute, University of
Minnesota, using the methods of Holman (1989). Total carnitine and free carnitine (FC) were
measured by radioenzymatic analysis at Metabolic Analysis Labs, Inc. (Madison, WI) using the
method of Parvin and Pande (1977). Acyl-carnitine (AC) was calculated as the difference in plasma
concentration between total and frce carnitine. Plasma p-hydroxybutyrate was measured by
enzymatic analysis at the University of Illinois Veterinary Medical Clinic, and acetoacetate was
measured by the nitropmsside reaction at the Clinical Pathology Laboratory, Western College of
Veterinary Medicine, University of Saskatchewan.

Plasma glycerol kinetics were measured in 36 polar bears by administering glycerol, in
which all three carbons were labeled with the stable isotope "C ( ~ - ' ~ ~ ~ - ~ l ~ c e r o l , 99%; Cambridge
Isotope Laboratories, Inc., Andover, MA), by bolus injection via a jugular catheter (dosage range:
2.4-5.0 pmoVkg). A baseline blood sample was drawn immediately prior to " ~ - ~ l ~ c e r o l
administration and samples were taken at 5, 10, 15, 30.60.90, 120, and 150 minutes following '%-
glycerol administration. The enrichment of plasma glycerol (tracee) with '3~-glycerol (tracer) was
measured as the tracer:tracee ratio by the Metabolism Unit, Shriners Burns Institute (Galveston, TX),
using the methods described in Klein et al. (1986).
Statistical analysis was performed using SPSS software (SPSS Inc., Chicago, Illinois,
USA). Two-way analysis of variance (ANOVA) was used to determine differences in plasma lipids,
lipid precursors and metabolites, and total carnitine and carnitine fractions among nutritional states
(feeding, fasting, and fasting that included pregnancy and early lactation), and between sexes (Zar
1996). The body condition index (BCI) and drug dosage (mg/kg) were included as covariates.
Tukey's Honestly Significant Difference test was used to make multiple comparisons among means
(Zar 1996). Nonlinear least squares estimation was used to calculate an exponential model of the
form y(t) = ZAie-" (tracer:tracee ratio) to describe the disappearance of " ~ - ~ l ~ c e r o l from plasma
(Draper and Smith 198 I). The criterion for best model was a minimum value for the residual sum of
squares. Kinetic parameters for glycerol were caiculated by noncompartmental analysis Wolfe
1992) as follows:
Rate of appearance (R,) ( p o l k g per min) = Tracer dose + X(A& (Eqn. 4.1)
where R, refers to the rate of appearance of glycerol in plasma (Wolfe 1992). and where Ai and k,
are the macroparameters for the nonlinear model (Draper and Smith 198 1);
Rate of clearance (Rc) (mYkg per min) = R, + glycerol plasma concentration (Eqn. 4.2)

where Rc refers to volume of plasma completely cleared of glycerol in 1 minute (Wolfe 1992); and
Half-life (Td for '3~-glycerol (rnin) = (In 2) + &
where TH refers to the time required for the injected '3~-glycerol to reach one-half its initial
concentration in plasma (Wolfe 1992).
Values for R, were estimated on the basis of total body mass (pmoVkg per rnin), fat mass
(pmoVkg FM per rnin), and lean body mass (pmol/kg LBM per rnin). Values for Rc were estimated
on the basis of total body mass (mVkg per min) and LBM (ml/kg LBM per rnin). F M was estimated
using a regression model with body length and the BCI value as the predictor variables (see Chapter
2), and LBM was calculated by subtracting FM from the total body mass. Statistical assumptions of
normality, independence, and homogeneity of variance were maintained by data transformation
(natural log or square root), as necessary. For all statistical tests, significance was assigned when the
probability of a Type I error was equal to or less than 0.05. All results are reported as mean f
standard error (SE).
4.3 Results
4.3.1 Association with nutritional state and sex
Differences in nutritional state (feeding versus fasting) had no significant effect on plasma
concentrations of non-esterified fatty acid (NEFA), glycerol, acetoacetate, or P-hydroxybutyrate, or
the NEFA:glycerol ratio (Table 4.1). However, the sex of bear did have an effect on plasma NEFA
concentration; values for females were significantly higher than values for males (F = 6.38, p < 0.05,
n = 72). Acetoacetate concentration was below the level of detection (< 196 pmollL) in all bears and
P-hydroxybutyrate concentration never exceeded 29 1 pmoYL.
The disappearance of " ~ - ~ l ~ c e r o l from plasma fit best an exponential model that was
comprised of two exponents, y(t) = ~ ' e - " + (Fig. 4.1). The residual sum of squms as a
proportion of the corrected sum of squares, for the 36 bears. was equal to 0.05f0.02. There were no


I I 1 1 7 7
0 30 60 90 120 150
Time Following 3C-Glycerol Administration (min)
Figure 4.1 The disappearance of 13C-glycerol from the plasma of polar bears. Me- + standard error bars arc presented for 13 feeding bears (0 ), 18 fasting bears ( ), and five fasting female bears captured during winter (e ). Females captured during winter were accompanied by new-born cubs and had recently (within days) emerged from a snow den. Lines represent disappearance curves for 13C-glycerol that were calculated using the method of nonlinear least squares regression. The asterisk indicates female bears captured during winter had a significantly @ ~ 0 . 0 5 ) greater tracer:tracce ratio than other bears at the particular sampling time.

significant differences between feeding bears and fasting bears captured during summer-fall in their
mean tracer:tracee ratio at each sampling time following " ~ - ~ l ~ c e r o l administration. However.
although the sampling of female bears captured during winter did not begin until 30 minutes
following " ~ - ~ l ~ c e r o l administration, their mean tracer:tracee ratio at this time, as well as at all
sampling times afterward, was significantly greater than that of bears captured during other times of
the year. The calculated rates of appearance (R,) and clearance (R,) of plasma glycerol varied
greatly among individual bears irrespective of nutritional state, but overall the mean R, and Rc values
were significantly lower (F = 2.75 to 5.14, p < 0.05) in fasting females captured during winter than
in feeding or fasting bears captured at other times of year (Table 4.2). Furthermore, the half-life
calculated for the disappearance of '3~-glyceml tiom plasma was significantly greater ( F = 6.53. p <
0.001) in fasting females captured during winter than in polar bears captured at other times of year.
Differences in nutritional state, sex, or in the interaction of nutritional state and sex did have
a significant effect on plasma concentrations of total lipid, total cholesterol, phospholipid,
triacylglycerol, and total carnitine (Table 4.1). Among female polar beats, plasma total lipid. total
chotesterol, and phospholipid values were greater in feeding bears, and in fasting bears captured
during winter, than in fasting bears captured during summer-fall (one-way ANOVA: F = 6.79 to
24.12, p < 0.01, n = 38). Feeding females and fasting females captured during summer-fall had
'higher plasma triacylglycerol values than did fasting females captured during winter ( F = 4.26, p <
0.05). Conversely, fasting females captured during winter had higher total carnitine values than did
feeding and fasting females captured at other times of the year (F = 35.75, p < 0.001). Among male
polar bears, plasma concentrations of total lipid, total cholesterol, and phospholipid did not differ
significantly between feeding and fasting bears (t = 0.26 to 1.75, p 2 0.10, n = 44). However, fasting
males had significantly higher triacylglycerol (t = 3.1 1, p c 0.01) and lower total camitine values ( t =
1.99, p 5 0.05) than did feeding males. Among feeding bears, females had significantly higher
plasma concentrations of total lipid, total cholesterol, phospholipid, and triacylglycerol than did
males (t = 2.22 to 4.35, p < 0.05, n = 24). Conversely, fecding males had significantly higher plasma
concentrations of total carnitine than did feeding females (t = 2.06, p S 0.05). There were no

Table 4.2 Plasma concentration and kinetic parameters of glycerol in free-ranging adult polar bears captured during feeding (spring) and fasting (summer-fall), and during fasting that included pregnancy and early lactation (winter).'
Constituent or kinetic parameter Nutritional State Factor or Covariate
feeding fasting fasting+b nutritional sex nutritional BCI (N = 13) (n = 18) (11 = 5) slate state x sex
plasma glycerol (mmoUL) 2.7f0.69 (0.8-9.8)
rate of appearance: R, (pmokg per min) O.783H.i 9 (0.002-2.47 1)
- R, (pmokg FM per min) 6.5 13f1.745 (0.01 6- 19.591)
- R, (pmoykg LBM per min) 0.907f0.254 (0.003-2.828)
rate of clearance: Rc (mVkg per min) 0.363f0.093 (0.001 -0.878)
- Rc (mVkg LBM per min) 0.4 15M. 105 (0.002-0.974)
half-life for '3~-glycerol: TH (min) 3.4M.65 (0.3-7.4)
Values reported as mean f SE with range presenrcd in parentheses. Statistical comparison made by two-way ANOVA with nutritional state and sex as the factors, nutritional state x sex as the interaction, and the Body Condition Index (BCI) as the covariate. R, and R, values were transformed to their square root prior to analysis, and are expressed per unit body mass (pmolkg per rnin or mlkg per rnin), per unit fat mass (pmoYkg FM per rnin), and per unit lean body mass (pnoVkg LBM per rnin or mVkg LBM per min). Significance indicated by "ns" for non-significance, * for p 5 0.05, and *** for p 5 0.001.
b Adult female bears captured during winter that were accompanied by new-born cubs, and L a had emerged recently (within days) from their snow dens.

significant differences between sexes in the concentrations of plasma constituents among fasting
bears captured during summer-fall.
Differences in nutritional state, and in the interaction between nutritional state and sex, had
a significant effect on the plasma concentrations of acylcarnitine (AC) and free carnitine (FC) (Fig.
4.2). Among female polar bears, AC and FC values were twice as high in fasting females captured
during winter as in females captured at other times of the year (F = 9.65 to 35.36, p < 0.001, n = 38).
Among males, the plasma AC concentration was significantly higher in feeding mates than in fasting
males (t = 2.21, p c 0.05, n = 44). and the plasma FC concentration did not differ significantly
between feeding and fasting males (t = 1.63, p = 0.1 1). The AC:FC ratio was higher in fasting
females than in fasting males (t = 2.31, p < 0.05, n = 48).
The interaction of nutritional state and sex had a significant effect on the plasma
concentration of unesterified cholesterol (F = 12.17, p c 0.001); the concentration was higher in
feeding females than in fasting females and, conversely, lower in feeding males than in fasting males
(Fig. 4.3). The plasma concentration of high density lipoprotein (HDL-) cholesterol was
significantly higher in fasting females captured during winter than in females captured at other times
of the year (one-way ANOVA: F = 4.%, p < 0.05, n = 38), and higher in feeding males than in
fasting males (t = 2.12, p < 0.05, n = 44). Differences in nutritional state did not have a significant
effect on the total cholesterol:HDL-cholesterol ratio in females, but did have a significant effect in
males; the ratio was higher in fasting males than in feeding males (t = 2.09, p < 0.05).
4.3.2 Association with body condition and drug dosage
The body condition index (BCI) covaried significantly with the plasma concentrations of
total lipid, total cholesterol, unesterified cholesterol, phospholipid, total carnitine, acyl-camitine
(AC), and free carnitine (FC) (Table 4.1). Furthermore, the correlation of the BCI with the plasma
values of each of these constituents was negative, the plasma concentrations of each constituent
being lower in bears with higher amounts of body fat (total lipid: r = -0.4 1, p < 0.001, n = 82; total
cholesterol: r = -0.32, p < 0.01; unesterified cholesterol: r = -0.32, p < 0.01 ; phospholipid: r = -0.37,

Feeding Fasting Fasting+ (spring) (summer-fall) (winter)
Nutritional State (season)
Figure 4.2 Plasma concentrations of afyl-camitine (AC). free camitine (FC). and the AC:FC ratio in feeding and fasting polar bears. Values are presented as a bar for the mean plus a vertical line for the standard emr. The bars represent females (0) and males ( captured during winter were accompanied by new-born cubs and had recently (within days) emerged from a snow den. Number of bears captured by season and sex is presented in parentheses. The asterisk indicates a significant difference @ 0 . 0 5 ) in mean values between female and male bears during a particular season.

Feeding Fasting Fasting+ (spring) (summer-fall) (winter)
Nutritional State (season)
Figure 4.3 Plasma concentrations of unestdied cholesterol. high density lipoprotein (HDL-) cholesterol. and the total cholestcrol:HDL cholestcroi ratio in feeding and fasting polar burs. Values arc presented as a bar for the mean plus a vertical line for the standard error. The bus represent females (0) and males (I ). Females captured during winter w e n accompanied by new-born cubs and had recently (within days) emerged from a snow den. Number of bears captured by season and wx is presented in parentheses. The asterisk indicates a significant difference @ ~ 0 . 0 5 ) in mean values between female and male bears during a particulv season.

p < 0.00 1; total carnithe: r = -0.40, p < 0.001; AC: r = -0.28, p c 0.05; FC: r = -0.40, p < 0.001 ).
There were no significant correlations of drug dosage with the concentrations of plasma
constituents or with the kinetic parameters for plasma glycerol.
4.4 Discussion
4.4.1 Association with nutritional state and sex
In the polar bears of this study, plasma concenuations of non-esterified fatty acid (NEFA),
glycerol, acetoacetate, and $-hydroxybutyrate, and the NEFA:glycerol ratio were not affected by
differences in nutritional state (Table 4.1). This contrasts with other mammals (for example, humans
- Cahill et al. 1966, Owen et al. 1998; hibernating rodents - Krilowicz 1985, Yeh et al. 1995; black
bears, Ursus americanus - Ahlquist et al. 1984, Hasan 1997) and suggests that food availability
either had tittle effect on the proportional use of lipid-based (relative to protein- and carbohydrate-
based) fuel for energy by polar bears or, if there was an effect, it was not reflected by differences in
the plasma concentrations of these lipid metabolites. Results from the investigation of protein and
carbohydrate metabolism in polar bears (see Chapters 3 and 6) indicate that protein and amino acid
metabolism, and to a lesser extent glucose metabolism, are affected by differences in nutritional
state. Thus, it seems unlikely that the proportional use of lipid, protein, and carbohydrate for energy
metabolism would not be affected by food availability. Alternatively, for polar bears to balance the
synthesis (lipogenesis and ketogenesis), release (lipolysis), and use (oxidation of fatty acids and
ketone bodies, gluconeogenesis from glycerol) of lipid metabolites without significant alteration in
their plasma concentrations, there must be feedback controls of great precision. This contrasts
strongly with the mismatch between fatty acid supply and lipid oxidation that is typical of other
mammals during fasting (Hales et al. 1978, Coppack et al. 1994). This apparent ability to control
lipid metabolism with great precision may be essential in polar bears which normally consume a diet
high in fat and low in carbohydrate.
The rate of appearance (R,) of plasma glycerol was extremely slow in polar bears (Table
4.2) relative to values reported for other species (for example, humans - R, = 2.59f0.22 poUkg per

min, Klein et al. 1986; dogs - R, = 1.87M. 15 pmoVkg per min, Revis et al. 19%; goats - R, =
3.8339.1 1 pmoYkg per min, Weber et al. 1W3). In many species, the R, of glycerol is thought to
reflect accurately the rate of hydrolysis of triacylglycerol into fatty acids and glycerol (lipolysis) in
adipose tissue because, typically, there is little glycerol kinase activity in this tissue (Margolis and
Vaughn 1962, Lin 1977)- Therefore, glycerol is released quantitatively from adipose tissue into the
plasma (Wolfe 1992). However, it appears that the R, values for glycerol calculated for polar bears
in this study were considerably less than the actual rates of lipolysis since the energy which could be
made available for lipid oxidation from the calculated R, values would only provide a small portion
of the total energy requirements for an adult polar bear. For example, the highest R, value for
glycerol calculated in this study was 2.62 poVkg per min and, if the concurrent NEFA R, was
assumed to be 3 x glycerol R, = 7.86 pmoVkg per min and these NEFA were completely oxidized,
the daily energy production from lipid oxidation would be 11.3 kJkg (based on 1 pmol of lipid =
13.9 kJ; Blaxter 1989). This, in tum, would account for approximately 20% of the estimated daily
basal metabolic rate (BMR) of polar bears. the body masses of which ranged from 100 to 500 kg
(based on BMR = 293-mass0-"; Kleiber 1975). One explanation that could account for the low R,
values for glycerol in polar bears is that much of the glycerol released through lipolysis remains
within adipocytes and is used to re-synthesize triacylglycerol (lipogenesis) via the activation of
glycerol kinase. The presence and activity of glycerol kinase in polar bear adipose tissue has not
been determined, but glycerol kinase activity has been observed to increase in humans and rats in
association with obesity, consumption of high fat diets, and high plasma concentrations of glycerol
or insulin (Persico et al. 1975, Stem et al. 1983, Chakrabarty et al. 1984), all of which are
characteristic of polar bears. An enhanced activity of glycerol kinase in the adipose tissue of polar
bears relative to that in other mammals also could function as a mechanism to regulate the supply of
fatty acids to meet (and not exceed) the demand for fatty acid oxidation.
The rate of clearance (R,) of plasma glycerol also was extremely slow in polar bears relative
to values calculated for other s p i e s (for example, humans - Rc = 5 l .M.4 mUkg per min, Beylot et
al. 1987; dogs - Rc = 5OSf 1.4 mYkg per min, Previs et al. 19%; goats - Rc = 42.6k3.2 mykg per

min, Webcr et al. 1993). Furttrennore, the plasma glycerol concentration in polar bears was much
higher than values reported for a wide range of other mammalian species (40-400 poYL, reported in
Lin 1977). These results indicate that the rate of tissue uptake of plasma glycerol and its loss by
other routes, such as urine, were slow in polar bears relative to rates measured in other mammals.
These results also are consistent with the finding of a previous study (Nelson et al. 1983) that the rate
of disappearance of ' ' ~ - ~ l ~ c e r o l from the plasma of free-ranging polar bears captured during
summer was slower than rates observed for black bears both during summer activity and during
winter dormancy (Ahlquist et al. 1984).
The R, and R, values for glycerol in polar bears were affected by differences in nutritional
state (Table 4.2). Female polar bears captured during winter after emerging from their snow dens
had significantly lower values than feeding bears. and fasting bears captured during summer-fall had
values that were intermediate to those of feeding bears and fasting females captured during winter.
Nevertheless, because it is unlikely that the glycerol R, accurately reflected the rate of lipolysis, and
because the fate of '3~-glycerol in plasma was not determined, the significance of these differences is
not known and requires further investigation.
Despite differences between feeding and fasting bears in plasma concentrations of acyl-
carnitine (AC), free camitine (FC), and total carnitine, the AC:FC ratio was not affected by
nutritional state (Table 4.1 and Fig. 4.2). Typically, in a fasting mammal, carnitine biosynthesis and
the release of carnitine stored in muscle are not sufficient to maintain a constant plasma
concentration of FC in the face of the increased rate of carnitine acylation that occurs concomitantly
with an increased rate of fatty acid oxidation (Hoppel and Genuth 1980). Thus. plasma AC values
increase, plasma FC values decrease. and the AC:FC ratio rises as the rate of oxidation of NEFA
rises. The fact that in polar bears the AC:FC ratio was not affected by nutritional state, and that the
AC:FC ratio was low (< 1.0) in all animals, provides further support for the proposition that polar
bears are able to balance precisely the synthesis, release, and use of lipid metabolites for energy
metabolism whether the source is food or stored lipid in adipose tissue.
Fasting female polar bears captured during winter had significantly higher plasma

concentrations of AC and FC than did feeding or fasting bears captured during other seasons (Fig.
4.2). This indicates that these bears were well able to maintain a supply of carnitine through protein
catabolism despite undergoing 8-9 months of fasting that was combined with pregnancy and 3-4
months of lactation. It is not clear why AC and FC values were two to three times higher in female
polar bears captured after emerging from their winter dens than in polar bears captured during other
seasons. It is possible that these higher values reflected an intense state of energy mobilization, as
females captured after emerging from dens also have been found to have high plasma concentrations
of glucagon, glucose, and cortisol, and a low insu1in:glucagon molar ratio, when compared to bears
captured during other seasons (see Chapter 6).
Plasma concentrations of AC and FC were higher in feeding males than in fasting males, but
lower in feeding females than in fasting females (Fig. 4.2). The demand on body energy stores is
greatest for females during summer-fall (in association with pregnancy and lactation) when food is
less available or not available at all. Thus, protein catabolism should be greater in females during
summer-fall than during spring, and their higher plasma AC and FC values may have reflected a
concomitantly greater rate of carnitine biosynthesis (from lysine and methionine) and release (from
muscle). Conversely, the demand on body energy stores is greatest for males during spring (in
association with breeding activity) when, despite the availability of food, males will fast
intermittently while seeking a mate. Thus, protein catabolism, and associated camitine biosynthesis
and release, should be greater for males during spring than during summer-fall. A similar interaction
between sex and nutritional state affected the plasma concentration of total amino acids in polar
bears (Chapter 3).
In mammals, cholesterol synthesis is reduced during fasting (Mayes 1993). The
observation that plasma concentrations of total cholesterol, unesterified cholesterol, and HDL-
cholesterol were lowest among female polar bears in fasting bears captured during summer-fall is
consistent with this general statement (Table 4.1 and Fig. 4.3). The fact that female polar bears
capturing during winter afkr emerging from their dens did not also have low cholesterol values, as
would be expected given their fasting state, may have reflected an increased rate of metabolism in

these females relative to those captured during summer-fall. Metabolic rates for female polar bears
captured during winter after emerging from snow dens have not been determined, but relative
differences in rectal temperature and plasma thyroid hormone concentrations between fasting bears
captured during summer-fall and fasting females captured during winter support the proposition that
metabolic rates may be higher following den emergence (see Chapter 6).
The total cholesterol:HDL-cholesterol ratio ranged from 1.2 to 3.9 in the polar bears of this
study (Fig. 4.3). These values are significantly lower than mean values measured in humans
(females = 4.4, males = 5.0; Mayes 1993), but are similar to mean values determined for black bears
(active = 1.6, denning = 2.7; Hasan 1997). The low ratios in polar and black bears indicate that
HDL is the dominant lipoprotein in these species. Low density lipoprotein &DL) is the predominant
lipoprotein class in humans. In studies of comparative lipid and lipoprotein metirbolism, species are
classified as LDL versus HDL mammals (Bauer 1996). LDL mammals have a predominance of
LDL-cholesterol which readily increases in concentration in response to high dietary fat and
cholesterol consumption. In humans and some other species, these diet-induced increases in LDL-
cholesterol are associated with atherogenesis, the formation of abnormal masses of lipid in arterial
walls. By comparison, HDL mammals have a predominance of HDL which is thought to provide
resistance to LDL-cholesterol elevations and associated atherogenesis.
Plasma uiacylglycerol concentration was significantly affected by differences in nutritional
state, but in a way that was dissimilar between sexes (Table 4.1). Female polar bears captured
during winter after emerging from snow dens had lower values than females captured during other
times of the year. Given that females appear to be in a state of intense energy mobilization following
the emergence from their snow dens (see Chapter 6), low plasma levels of triacyglycerol may have
reflected a low rate of hepatic lipogenesis. Fasting male bears had higher triacylglycerol values than
did feeding male bears, but the reason for this is not known.
Differences among bears in plasma phospholipid concentration paralleled the differences
among bears in HDL-cholesterol concentration (Table 4.1). This result is not surprising, given that
the HDL-cholesterol of polar bears contains approximately 80% of the total phospholipid in plasma

(Kaduce et al. 198 1).
4.4.2 Association with body condition and drug dosage
In this study, body condition was defined as the abundance of potential metabolic energy
stored in an animal's tissues (primarily adipose tissue and skeletal muscle) relative to its body size.
The body condition index (BCI) was developed to provide an estimate of the body condition of
individual polar bears relative to other bears in a total sample population of 1072 animals (see
Chapter 2). Although the BCI is an index without units, it can be used in conjunction with the body
length of a bear to predict its mass of adipose tissue, skeletal muscle, or both. The range of BCI
values is distributed normally around a mean value of zero, with positive values indicating a larger
availability of potential metabolic energy and negative values indicating a smaller availability of
potential metabolic energy, relative to the mean body condition of the sample population.
The BCI was negatively correlated with plasma concentrations of AC and FC, but was not
correlated with the AC:FC ratio. This indicates that fat bears (BCI > 0) had lower AC and FC values
than lean bears (BCI S 0). The most likely explanation for this is that protein catabolism was slower
in fat bears and, therefore, the biosynthesis and release of carnitine also was slower than in lean
bears. Plasma concentrations of total cholesterol, unesterified cholesterol, and phospholipid also
tended to be lower in fat bears than in lean bears.
The anesthetic drug ~elazol' has not been demonstrated to have an effect on the plasma
concentrations of lipids in a variety of mmmals (Van Heerden et al. 199 1, Lin et al. 1993, Peinado
et al. 1993). The dosage of ~ e l a z o l ~ administered to polar bears in this study did not correlate with
either the plasma concentrations of lipids or the kinetic parameters of plasma glycerol. This suggests
that the anesthetic protocol used with polar bears did not have a significant effect on the results of
this study.

5. EFFECT OF DIET AND PROLONGED FASTING ON THE FATTY ACID
COMPOSITION OF PLASMA AND ADIPOSE TISSUE IN POLAR AND BLACK BEARS
5.1 Introduction
Fatty acids are a heterogeneous group of compounds of biomedical importance. Aside from
playing a prominent role in energy metabolism, fatty acids are required for somatic growth,
reproduction. a responsive immune system, and the normal function of mitochondria. cell
membranes, and skin. Their diversity of essential physiological roles is underscored by the many
diseases linked to essential fatty acid (EFA) deficiency and imbalance. These include chronic
malnutrition and anorexia nervosa (Holman et al. 198 1, Holman et al. 1995), heart disease and
atherosclerosis (Seidelin et al. 1992. Siscovick et ai. 1995). depression and attention-deficit
hyperactivity disorder (Hibbeln and Salem 1995, Stevens et al. 1995). childhood asthma and cystic
fibrosis (Hodge et al. 1996, Lloyd-Still et al. 1996), and Reye's syndrome and Crohn's disease
(Ogburn et al. 1982. Belluzzi et al. 1996).
Mammals have some metabolic capacity to alter or synthesize fatty acids through desaturase
and elongase enzyme systems (Fig. 5.1). Nevertheless, normal fatty acid balance in tissues depends
largely on diet because the dietary EFA's, linoleic (1 8:206)' and a-linolenic (1 8 : 3 d ) acids, cannot
be synthesized by mammals (Hadley 1985). Furthermore, because linoleic and a-linolenic acids are
competitive substrates in the same metabolic cascade (Fig. 5.1). a diet must contain these EFA in
correct proportions (Collier and Sinc lair 1993).
I The "6.w" notation is used to indicate the position of double bonds in unsaturated fatty acids instead of the "n-x" notation recommended by the International Union of Pure and Applied Chemistry - International Union of Biochemistry (IUPAC-IUB Commission on Biochemical Nomenclature 1977). This nomenclature is used in recognition that the "m" notation was initiated in 1963 by Dr. Ralph T. Holman, a co-author on a version of this chapter which is to be submitted for publication.

Polar bears (Ursus maritimus) and black bears (U. americanus) have different diets but
similar feeding strategies. Polar bears are marine carnivores that feed primarily on seals. Black
bears are terrestrial omnivores, and consume largely vegetation. Both species fast annually for
periods lasting 4-5 months in most cases, and as long as 8 months in the case of pregnant polar bears.
In humans, fatty acid deficiency can develop rapidly during fasting or fat-free feeding (Imaichi et al.
1963, Paulsrud et al. 1972), as well as during pregnancy and lactation (Holman et al. 1991).
Whether the proportions of EFA's are similar or differ between feeding and fasting bears has not
been established.
In this study. the fatty acid composition of three lipid fractions (triacylglycerol, non-
esterified fatty acid, and phospholipid) in plasma, and one lipid fraction in adipose tissue
(triacylglycerol), was determined in polar and black bears during feeding and fasting. me objectives
were to determine if the fatty acid composition of feeding polar bears and black bears was associated
with the different diets, and to determine how the fatty acid composition of plasma and adipose
tissue was associated with nutritional state (feeding versus fasting) within each species.
5.2 Materials and methods
One hundred and seven. fiee-ranging, adult polar bears were captured between July 1993
and November 1995. All bears were located from a helicopter and then anesthetized with ~elazol'
(8 to 10 mgkg intramuscularly) using remote injection equipment (Stirling et al. 1989). Twenty-five
adult polar bears were captured during spring (April and May) while they were hunting seals on
arctic sea-ice near Resolute Bay, Northwest Territories, Canada (74O00' to 76'00'N and 93'00' to
I0O050'W). Eighty-two adult polar bears were captured during summer, fall, and winter (July to
March) while fasting on land along the west coast of Hudson Bay near Churchill, Manitoba. Canada
(57O00' to SS050'N and 92O25' to 94O15'W). Twenty milliliters of blood was collected from the
jugular vein into vacutainerB tubes containing sodium heparin (Becton Dickinson and Company,
Franklin Lakes, New Jersey, USA). Blood samples werc cooled immediately following collection
and werc centrifuged within 12 h o w to collect and freeze plasma. Subcutaneous adipose tissue was

obtained by punch biopsy (6mm diameter), from the gluteal region of 13 feeding bears and 15 fasting
bears, and was flash-frozen in liquid nitrogen. The frozen plasma and adipose tissue were shipped to
the Hormel Institute, University of Minnesota, for determination of fatty acid composition using
techniques previously described (Holman et al. 1994).
Thirty plasma and six adipose tissue samples were collected from 1989 to 199 1 from three
captive adult male black bears housed at the Carle Foundation Bear Research Facility in Urbana,
Illinois. Food and water were provided ad libitum. Food was a complete commercial ration
prepared with vegetable and terrestrial animal products and supplemented with vitamins and
minerals. It contained a minimum of 22% crude protein, 9% crude fat, and 53% carbohydrate. The
bears did not eat during winter dormancy (late November to mid-March) despite access to food and
water. All bears were anesthetized with ~elazol@ (4 to 6 mgkg intramuscularly) prior to collecting
blood from their femoral vein and subcutaneous adipose tissue from their gluteal region. Ten blood
samples were collected from each bear over a 3-year period, during different months, such that five
samples were collected during feeding (late March to mid-November), and five during winter
dormancy. Two adipose tissue samples were collected from each bear during 199 1, such that one
sample was collected during feeding and the other during winter dormancy. Blood plasma and
adipose tissue samples were handled, processed. and analyzed as described for polar bears.
Chromatographic analyses detected fatty acids ranging from lauric (1 2:O) to lignocenc
(24:O) acids, and included all saturated, unsaturated, branched-, and odd-chain fatty acids within this
range (see Fig. 5.1). Fatty acid content was expressed as a percentage of total fatty acids within a
lipid fraction.
Statistical analysis was performed using SPSS software (SPSS, Inc., Chicago, IIlinois,
USA). Student's t-test was used to test for significant differences in the proportions of individual
fatty acids and groups of fatty acids and in the mean valucs of indices that are used to assess the
proportions of essential fatty acids (EFA) in humans (see Table 5. I; Holman 1968, Holman et al.
1991), between species during feeding, and between feeding and fasting bears within each species
(Zar 1996). The paired t-test was used to compare proportions of fatty acids in the adipose tissue
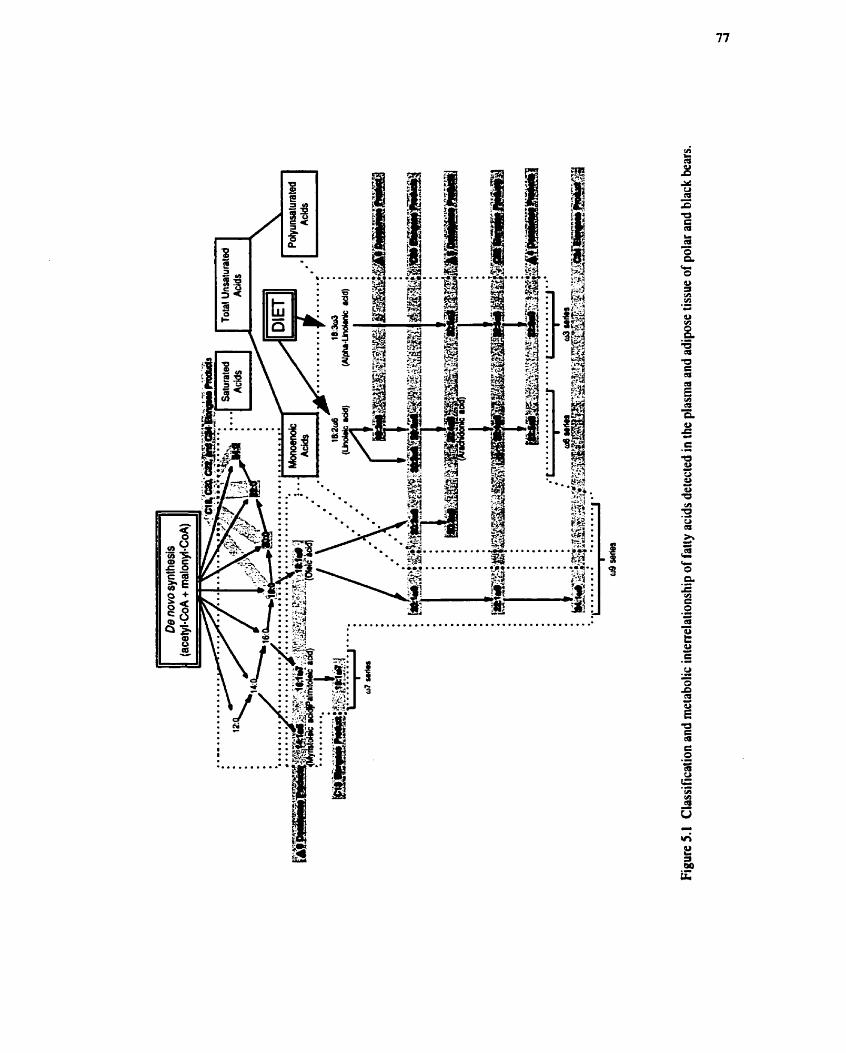

Table 5.1 Classification scheme used to describe fatty acids in the plasma of polar and black bears (see also Fig. 5.1).
Classification Description
A. Structural Grou~ings
mUFA CMONO ZS AT CBRANCH ZODD
B. Series Grouvinns
C. ksaturase Product Grou~inas
D. Elonaase Product Groupings
- sum of polyunsaturated fatty acids - sum of monoenoic fatty acids - sum of saturated fatty acids - sum of branched chain fatty acids of 16:0, 17:0, and 18:O - sum of odd-chain fatty acids, 1 5 0 and 17:O
- sum of w6 series - sum of products of 18:206 (linoleic acid) - sum of 03 series - sum of products of 18:3& (a-linolenic acid) - sum of c119 series - sum of products of 18: 1@ (oleic acid) - sum of a7 series - sum of product of 16: l a7 (palmitoleic acid)
- sum of product of A6 desaturase - sum of products of AS desaturase - sum of products of A4 desaturase - sum of products of A9 desaturase
- sum of product of 18 carbon elongase - sum of products of 20 carbon elongase - sum of products of 22 carbon elongase - sum of product of 24 carbon elongase
TRI:TET ratio E:NE ratio
06: 03 ratio MCL
DBI
- ratio of the triene, 20:3&, to the tetraene, 20:4w6 - ratio of dietary essential fatty acids and products (Co6 + Co3) to non-
essential fatty acids and products - ratio of Xu6 to M - mean chain length in carbon atoms, calculated as the average number
of carbon atoms per fatty acid within a lipid fraction - double bond index, calculated as the average number of double bonds
per fatty wid within a lipid fraction

collected from black bears during feeding and winter dormancy. Because of the high degree of
interdependency between variables (as a result of being expressed as a percentage) and because of
the largc number of pairwise comparisons, the ~unn-S i& method (Ury 1976) was used to calculate
a more conservative value for statistical significance, p 10.017, rather than the commonly used value
of p s 0.05.
J
5 -3.1 .1 Triacylglycerol
The proportions and indices of fatty acids and fatty acid groupings in triacylglycerol
differed markedly between species (Table 5.2 and Fig. 5.2). Despite a relative abundance of w3 fatty
acids in polar bears, and wd fatty acids in black bears, there were no statistically significant
differences between species in the ratio of the sum of dietary EFA's and products to the sum of non-
essential fatty acids and products (E:NE ratio), or in the sum of polyunsaturated fatty acids
(ZPUFA). On average, the triacylglycerol fatty acids of polar bears were longer and more
unsaturated than those of black bears.
5.3.1.2 Non-esterified fatty acid
The proportions and indices of fatty acids and fatty acid groupings in non-esterified fatty
acid differed markedly between species, and many of these differences were similar to those in the
triacylglycerol fraction (Table 5.3 and Fig. 5.2). Some exceptions, however, were that the
proportion of 2 0 : M was greater in black bears than in polar bears. and the proportion of 18: l@
and the ratio of the proportion of the trient 20:3@ to the proportion of the tetracne 20:406
(TR1:TET) were similar in both species.

P m p a c i o n r u p a r a d m m a n ~ ~ f t ~ f o y ~ ~ ~ d y c a d f ~ e m r r o f ~ ktydtbuaceurrrdu l c r e i r ~ l ~ ~ t ~ b e d e L s n s d u ~ ~ b y y n b . . f ~ ~ ~ ' S f u d c a t ' s r - m r ~ u m l m ~ b a r a . ~ ~ ~ ~ ~ p o d ~ ~ s 0 . 0 l 7 b . u d o n ~ r ~ u r m - ~ i 0 1 l n n h o d ( ~ ~
1976) rrd indiutsd by "N" fa wm-si@i- .a focp 5 0.017. a d Om* fap S 0.001.

Triacylglycerol Non-esterified Fatty Acid Phospholipid
Figure 5.2 Comparison of dietary essential fatty acids and fatty acid groups between feeding polar and black bears. Ratios of mean values (i.e., [mean value for polar bear] + [mean value for black bear]) are indicated on a logarithmic scale by bars for individual fatty acids and groups of fatty acids. The direction and length of the bars indicate the value of the ratio in relation to a value of I , as well as the magnitude of difference between the groups being compared. The shading of the bars indicates the degree of significance: open bars are non-significant, cross-hatched bars are p <0.01, and black bars are p 10.001 for the comparison of ratios.

B- IPPsa m T E T rria mrxio r6:drdo M a DBI
-15 an- - - 3.1- rrrarnal 01QtOl)l
a- - -10 la2lMso - -1
1L- -19 Q l m
.L
1- -16
QW
usam 21- 9-13 47sm.17 QJHnnr - -1
mnmm 034am
nun

5 -3.1.3 Phospholipid
As in the other lipid fractions, the proportions and indices of fatty acids and fatty acid
groupings in phospholipid differed markedly between species (Table 5.4 and Fig. 5.2). However,
there also were species differences. as well as features of the fatty acid composition of phospholipid
in both species, that contrasted with those in the triacylglycerol and non-esterified fatty acid
fractions. The proportion of 20:4w6 was higher in phospholipid than in the other fractions and, when
comparing species, the proportion of 20:- was greater in polar bears. Fatty acids of the 07 series
(-7) and 14: 1 d were less prominent in phospholipid than in other fractions, especially in polar
bears, whereas 18:O was more prominent and the ratio of the sum of the 06 series to the sum of the
series (&:a3 ratio) was higher in both species.
5.3.2 Plasma and adiwse tissue fattv acid commsition in feeding and fastina ~olar bears
5 -3.2.1 Pbsma lipid fractions
Differences in the proportions and indices of fatty acids and fatty acid groupings in the
plasma lipid fractions between feeding and fasting polar bears were generally of lesser magnitude
than many of the differences between species described above (Tables 5.2 to 5.4 and Fig. 5.3). The
E:NE ratio did not differ significantly between feeding and fasting bears in any of the lipid fractions.
The proportions of 18:206 and 18:303 were greater in the lipid fractions of fasting bears than in
those of feeding bears. The d:o3 ratio also was greater in fasting bears, largely as a result of
corresponding inverse differences in the proportions of 18:206 and 20503. The proportion of
20:406 remained similar in both non-esterified fatty acid and phospholipid fractions between feeding
and fasting bears. and was slightly lower in the triacylglycerol fraction of fasting bears.
5.3 -2.2 Pbsma rriacylglycerol
Fatty acids in the triacylglycerol fraction of fasting polar bears generally were shorter. less
saturated, and of greater diversity than in feeding potar bears (Table 5.2 and Fig. 5.3). The ratio of
20:3w9 to 20:4& (TRI:TET ratio) was greater in fasting bears, but well within the range indicative


Z n . i g 8 ! 'Baj / Wi3 1 ;$ i o o o o v u l u l w g g 3 C s i g q i 2 i O k n a a p = a a , g 8 g 3 I
3
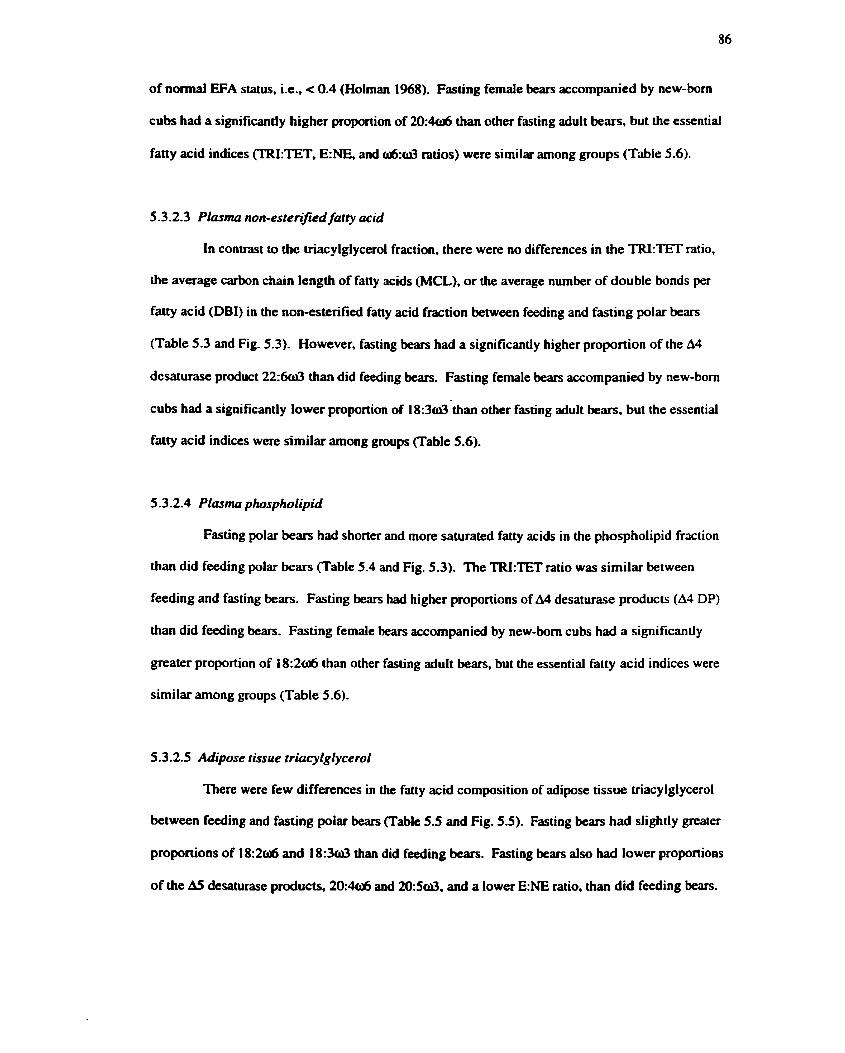
of normal EFA status, i.e., < 0.4 (Holman 1968). Fasting female bears accompanied by new-born
cubs had a significantly higher proportion of 20:- than other fasting adult bears, but the essential
fatty acid indices (TRI:TET, E:NE, and w6:& ratios) were similar among groups (Table 5.6).
5.3.2.3 Plasma non-estenBed fatty acid
In contrast to the triacylglycerol fraction, there were no differences in the TRI:TET ratio,
the average carbon chain length of fatty acids (MCL), or the average number of double bonds per
fatty acid (DBI) in the non-esterified fatty acid fraction between feeding and fasting polar bears
(Table 5.3 and Fig. 5.3). However, fasting bears had a significantly higher proportion of the A4
desaturasc product 2 2 : W than did feeding bears. Fasting female bears accompanied by newborn
cubs had a significantly lower proportion of 18:3&-than other fasting adult bears, but the essential
fatty acid indices were similar among groups (Table 5.6).
5.3 -2.4 Plasma phospholipid
Fasting polar bears had shorter and more saturated fatty acids in the phospholipid fraction
than did feeding polar bears (Table 5.4 and Fig. 5.3). The TRI:TET ratio was similar between
feeding and fasting bears. Fasting bears had higher proportions of A4 desaturase products (A4 DP)
than did feeding bears. Fasting female bears accompanied by new-born cubs had a significantly
greater proportion of 18:2wd than other fasting adult bears, but the essential fatty acid indices were
similar among groups (Table 5.6).
5.3.2.5 Adipose tissue triPcylglycero1
There were few differences in the fatty acid composition of adipose tissue triacylglycerol
between feeding and fasting polar bears (Table 5.5 and Fig. 5.5). Fasting bears had slightly greater
proportions of 18:206 and 18:3clr3 than did feeding bears. Fasting bears also had lower proportions
of the AS desaturase products, 20:- and 20:Scr13, and a lower E:NE ratio, than did feeding bears.

- w- 0) - m- -a, Fdm CnD
C- in @= in c.- 3) cll-n

5.3.3 Plasma and adiuose tissue fattv acid composition in feeding and fasting black bears
Differences in the proportions and indices of fatty acids and fatty acid groupings in the
different lipid fractions between feeding and fasting black bears were generally of lesser magnitude
than many of the differences between species described above (Tables 5.2 to 5.4 and Fig. 5.4).
Fasting black bears had a lower proportion of 18:2w6 in all lipid fractions, and a lower proportion of
18:303 in triacylglycerol and phospholipid ftactions. than did feeding black bears.
5 -3.3.1 Plasma triacylglycerol
Fatty acids in the triacylglycerol fraction of fasting black bears were generally shorter and
less saturated than in feeding black bears (Table 5.2 and Fig. 5.4). The proportions of the diet-
derived EFA, 18:2w6 and 18:303. were significantly lower in fasting bears, as were the TRI:TET
and E:NE ratios. However, the proportions of 20:4w6 and the 03 products (03 P), 22 :5d and
22:W. were greater in fasting bears than in feeding bears.
5.3.3.2 PIasma nun-esterijied furry acid
The differences in the proportions and indices of fatty acids and fatty acid groupings in the
non-esterified lipid fraction between feeding and fasting black bears contrasted in some ways with
the differences that occurred in the triacylglycerol fraction (Table 5.3 and Fig. 5.4). The E:NE ratio,
ZPUFA. and proportions of 18:2& and 20:4w6 were lower in fasting bears than in feeding bears,
whereas the TRI:TET ratio did not differ between the two groups and the proportion of 18:303 was
greater in the fasting bears.
5.3.3.3 Plasma phospholipid
The differences in the proportions and indices of fatty acids and fatty acid groupings in the
phospholipid fraction between feeding and fasting black bears were similar to the differences that
occurred in the triacylglycerol fiaftion (Table 5.4 and Fig. 5.4). The proportions of l8:2& and
18:3w3 and the TRI:TET ratio were lower in fasting bears than in feeding bears, but the E:NE ratio


and CPUFA did not differ between groups. Fasting bears had greater proportions of 2 0 M and the
03 products, 22:5& and 22:603, than did feeding bears.
5.3.3.4 Adipose tissue triacylglycerol
There were numerous differences in the fatty acid composition of adipose tissue
triacylglycerol between feeding and fasting black bears (Table 5.5 and Fig. 5.5). Fasting bears had
significantly lower proportions of 18:206,20:4w6, 18:3c3, and 03 products (d P) than did feeding
bears. Consequently, the E:NE ratio was significantly lower in fasting bears.
5.4 Discussion
5.4.1 Plasma fattv acid com~osition in feedine wliv and black bears
No published data exist on the fatty acid composition of plasma in free-ranging black bears.
The captive black bears sampled in this study were not consuming a natural diet but consumed food
of terrestrial origin as do free-ranging black bears under natural conditions. The captive bears also
underwent a 4-month period of winter dormancy each year, as do free-ranging black bears. Thus, the
basic comparisons between species during feeding, and between feeding and fasting black bears, are
broadly legitimate.
The fatty acid composition of plasma lipid fractions differed markedly between feeding
polar and black bears, and appeared to be strongly influenced by diet. Of the three lipid fractions
considered. triacylglycerol was probably most affected by diet because much of the triacylglycerol in
plasma is absorbed directly from food (Ganong 1995). The plasma triacylglycerol of polar bears
contained a large proportion of & fatty acids (Table 5.2 and Fig. 5.2). especially eicosapentaenoic
(20:Sd) and docosahexaenoic (22:W) acids, as has been reported previously (Kaduce et al. 1981,
Innis and Kuhnlein 1987). These acids are synthesized by marine algae and phytoplankton and are
transferred through the food chain to fish and marine mammals, and ultimately to carnivorous
mammals which consume them. In contrast, the plasma triacylglycerol of black bears contained a


large proportion of linoleic acid (18:2w6), the dietary essential PUFA which is found in highest
concentration in terrestrial plant sources, especially vegetables, nuts, and seeds.
The fatty acid composition of the non-esterified fatty acid fixtion was similar in both
species to that of the triacylglycerol fraction except that the proportion of arachidonic acid (20:4&)
was greater in non-esterified fatty acid, especially in black bears (Table 5.3). This was more likely an
effect of the conversion of linoleic (18:206) to arachidonic acid through desaturase and elongase
enzyme activity rather than an effect of diet; in both species the difference in the proportions of
linoleic acid between non-esterified fatty acid and triacylglycerol fractions corresponded
approximately with the difference in the proportions of arachidonic acid between fractions, but in
opposite directions. Because non-esterified fatty acids are primarily products of lipolysis in adipose
tissue, their composition of fatty acids is influenced by desaturase and elongase enzyme activity and
fatty acid biosynthesis (lipogenesis), as well as by diet.
Differences in the fatty acid composition of phospholipid between species were similar to
the differences described for the other fractions (Table 5.4 and Fig. 5.2). However, the fatty acid
composition of the phospholipid fraction in both species differed from that of the other lipid
fractions. primarily as a result of greater proportions of arachidonic (20:4&) and stearic ( 18:O)
acids, and lower proportions of myristoleic acid (14: 105) and 0 7 fatty acids. The fatty acid
composition of phospholipid typically is similar between plasma and tissue (Holman 1986). and is
dictated by the requirement of cell membranes and the immune system to maintain normal function.
The results from polar and black bears suggest that diet did not influence the fatty acid composition
of the phospholipid fraction as much as it may have influenced that of the other fractions, and imply
that dietary and endogenously-synthesized fatty acids were selectively used during phospholipid
biosynthesis.
5.4.2 Plasma and adipose tissue fattv acid commsition in feedinn and fasting wlar bears
There was no evidence of EFA deficiency during prolonged fasting in polar bears (Tables
5.2 to 5.5 and Figs. 5.3 and 5.5). Essential fatty acid deficiency typically is characterized by low

proportions of od and 03 fatty acids and concurrent high proportions of monoenoic acids and the
polyenoic products of oleic acid (18: l d ) . i.e., 20:2& and 20:3@ (Holman, 1968). The TRI:TET
ratio (20:3<119 + 20:406) was originally proposed as an index of EFA status sensitive to deficiency of
linoleic acid (18:2w6) (Holman 1960), and is useful as a measure of simple nutritional 06 fatty acid
deficiency. The E:NE ratio also was used in this study as an index sensitive to change in the total
content of EFA's and their products. relative to the content of all other fatty acids. In polar bears,
the TRI:TET ratio did not differ significantly between feeding and fasting bears in the plasma non-
esterifid fatty acid and phospholipid fractions, or in the adipose tissue triacylglycerol. The E:NE
ratio did not differ significantly between feeding and fasting bears in any plasma lipid fraction.
Thus, the polar bears were able to maintain adequate amounts of EFA's during prolonged fasting.
There also was no evidence of EFA deficiency during pregnancy and lactation in fasting
polar bears (Table 5.6). Five of the 82 fasting polar bears sampled in this study were adult females
accompanied by new-born cubs and were captured after 8-9 months of fasting. during which time all
of post-implantation gestation and early lactation occurred. Although there were differences in the
proportions of some individual EFA's, there were no significant differences in the TRI:TET, E:NE,
and w 6 : d ratios in any plasma lipid fraction between these 5 bears and the other 77 fasting polar
bears. This implies that fasting female polar bears also were able to meet their additional
requirement for EFA's for pregnancy and lactation without showing any evidence of EFA deficiency.
There are two possible mechanisms by which polar bears were able to maintain adequate
amounts of EFA's during prolonged fasting; either by storage of diet-derived EFA's in adipose tissue
or by biosynthesis of linoleic (18:206) and a-linolenic (18:3w3) acids. The storage and conservation
of EFA's in adipose tissue during feeding for later use in phospholipid and eicosanoid biosynthesis
during fasting has been suggested to occur in obese humans undergoing rapid weight loss while
consuming very-low-calorie diets (Phinney et al. 1990, Phinney et al. 1991). Adult polar bears
typically accumulate large amounts of body fat while feeding during late spring (Ramsay and Stirling
1988, Atkinson et al. 1996a) and may have been able to store a sufficient quantity of linoleic and a-
linolenic acids in adipose tissue while feeding to maintain their EFA requirements while fasting. The

Table 5.6 Proportions and indices of essential fatty acids in the plasma lipid fractions of fasting female polar bears, that were accompanied by new-born cubs, and ail other fasting adult polar bean.'
Classification Fasting female bears with cubs Other fasting adult bears comparisonb (n = 5) (n = 77)
1. Triacvlnlvcerol 18:206 7.39iO.25 2 0 : M 2 S M . 19 18:3& 0.72f0.03 TRI:TET ratio 0.006M.006 E:NE ratio 0.7OiO.07 d : w 3 ratio 0.37f0.03
2. Non-Esterified Fattv Acid 18:2w6 3.8 lf0.40 20:4w6 2.29f0.63 18:303 0.53f0.0 1 TRI:TET ratio 0.037f0.009 E:NE ratio 0.37f0.03 a%:& ratio 0.36M.05
3. Phos~holitlid 18:2w6 8.23f0.59 20:4d 12.92M.85 18:3w3 0.03f0.0 1 TRI:TET ratio 0.0 14M.00 1 E:NE ratio 0.67f0.06 06:d ratio 1.69f0.12
Proponions expressed as mean percentage of total fatty acids in lipid fraction 2 standard error of mean. Student's t-test was used to compare between groups. Significance was assigned at p S 0.017 based on the Dunn- ~idi-ik method Wry 1976) and is indicated by "ns" for non-significance, ** forp S 0.017, and *** forp IO.001.
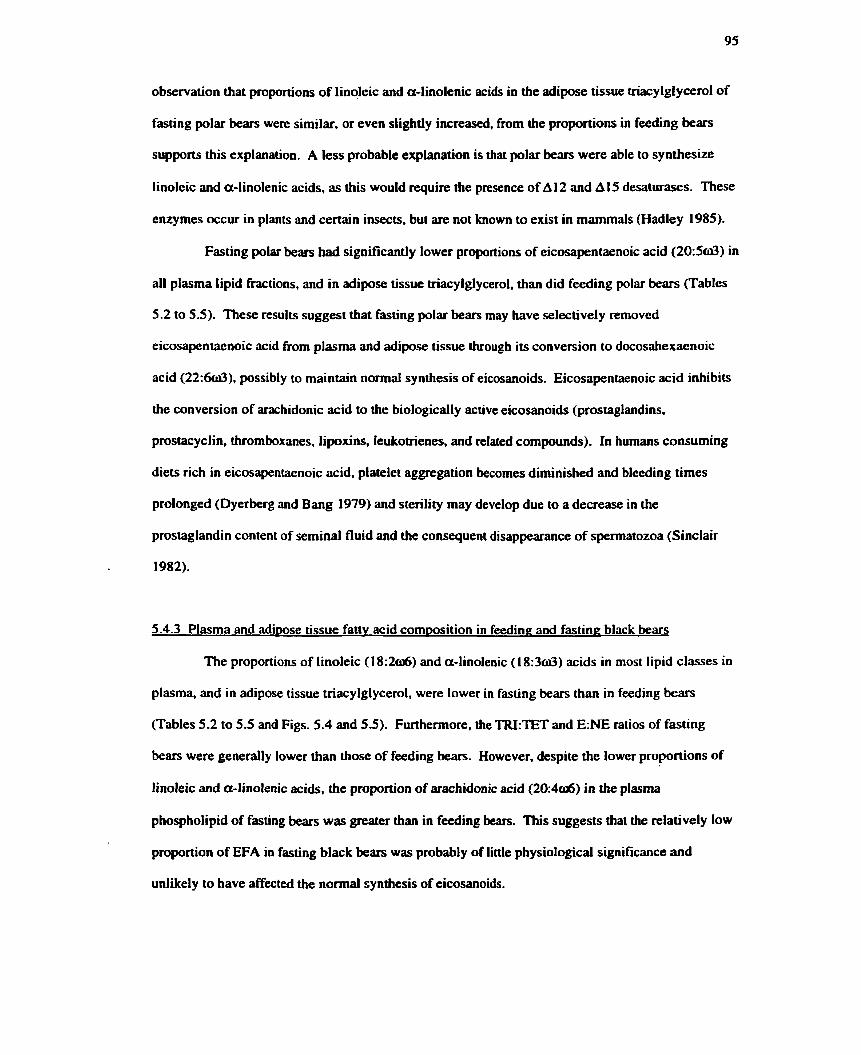
observation that proportions of linoleic and a-linolenic acids in the adipose tissue triacylglycerol of
fasting polar bears were similar, or even slightly increased, fiom the proportions in feeding bears
supports this explanation. A less probable explanation is that polar bears were able to synthesize
linoleic and a-linolenic acids, as this would require the presence of A12 and A15 desaturases. These
enzymes occur in plants and certain insects, but are not known to exist in mammals (Hadley 1985).
Fasting polar bears had significantly lower proportions of eicosapentaenoic acid ( 2 0 5 3 ) in
all plasma lipid fractions, and in adipose tissue triacylglycerol, than did feeding polar bears (Tables
5.2 to 5 5 ) . These results suggest that fasting polar bears may have selectively removed
eicosapentaenoic acid from plasma and adipose tissue through its conversion to docosahe~aenoic
acid ( 2 2 : 6 3 ) , possibly to maintain normal synthesis of eicosanoids. Eicosapentaenoic acid inhibits
the conversion of arachidonic acid to the biologically active eicosanoids (prostaglandins.
prostacyclin, thromboxanes, lipoxins. leukotrienes, and related compounds). In humans consuming
diets rich in eicosapentaenoic acid, platelet aggregation becomes diminished and bleeding times
prolonged (Dyerberg and Bang 1979) and sterility may develop due to a decrease in the
prostaglandin content of seminal fluid and the consequent disappearance of spermatozoa (Sinclair
1982).
5.4.3 Plasma and adimse tissue fattv acid composition in feeding and fastinv black bears
The proportions of linoleic (1 8:206) and a-linolenic (18:33) acids in most lipid classes in
plasma, and in adipose tissue uiacylglycerol, were lower in fasting bears than in feeding bears
(Tables 5.2 to 5.5 and Figs. 5.4 and 5.5). Furthermore, the TRI:TET and E:NE ratios of fasting
bears were generally lower than those of feeding bears. However, despite the lower proportions of
linoleic and a-linolenic acids, the proportion of arachidonic acid (20:406) in the plasma
phospholipid of fasting beats was greater than in feeding bears. This suggests that the relatively low
proportion of EFA in fasting black bears was probably of little physiological significance and
unlikely to have affected the normal synthesis of eicosanoids.

The reason why the proportion of EFA in plasma and adipose tissue was similar between
feeding and fasting polar bears, but lower in fasting black bears than in feeding black bears, was not
determined. It is possible that the complete commercial ration consumed by the captive black bears
did not contain linoleic (1 8:206) and a-linolenic (18:303) acids in sufficient quantity to prevent the
proportion of EFA stored in body fat fiom decreasing during winter dormancy. Alternatively, it may
be that polar bears are better able to maintain EFA's during prolonged fasting than are black beats,
either as a consequence of their different diets or as a consequence of differences in their metabolism
of fatty acids. Determination of the fatty acid composition of plasma and adipose tissue from free-
ranging black bears that are consuming a natural diet would help to evaluate the role of diet in
maintaining EFA's during prolonged fasting.

6. ASPECTS OF CARBOHYDRATE METABOLISM AND REGULATION XU FREE-
RANGING ADULT POLAR BEARS
6.1 Introduction
High fat and low carbohydrate diet, seasonal obesity, and prolonged fasting are the usual
circannual dietary habits of the polar bear (Ursus maririrmcs). In humans and laboratory animals,
high dietary fat is an important factor contributing to the development of obesity (Salmon and FIatt
1985; Schutz et al. 1989, reviewed in Hill and Peters 1998). Obesity, in turn, is associated with
hyperglycemia, insulin resistance, and type II diabetes mellitus (Randle et al. 1965, Boden et al.
1983, reviewed in Kissebah and Ktakower 1994). High dietary fat dso contributes directly to the
development of insulin resistance and type 11 diabetes mellitus in non-obese individuals through the
progressive enhancement of pyruvate dehydrogenase kinase activity in oxidative tissues (Sugden et
al. 1995). In both normal-weight and obese humans, prolonged fasting results in the mobilization of
fatty acids and glycerol from adipose tissue. an adaptive response initiated by low dietary
carbohydrate and the concurrent decline in blood glucose (Klein et al. 1990, Klein and Wolfe 1992).
The regulation and metabolism of carbohydrate by polar bears during feed and fast has not
been studied. However, the annual cycle of high fat diet, seasonal obesity, and prolonged fasting
suggest that polar bears do not suffer the severe health effects experienced by obese or starving
humans. In this study, plasma concentrations of glucose, cortisol, triiodothyronine, thyroxine,
insulin. and glucagon were measured in free-ranging polar bears captured throughout the year to
determine the association of these plasma constituents with nutritional state (feeding versus fasting),
sex (female versus male), and body condition (lean versus fat). Plasma insulin and glucagon
concentrations also were measured in polar bears following the intravenous administration of glucose

to compare changes in the plasma concentrations of these key glucoregulatory hormones among
bears of different nutritional state and body condition.
6.2 Mate* and methods
One hundred and fifty-one, free-ranging, adult polar bears were captured from August 1994
to November 19%. All bears were located by helicopter and chemically immobilized with ~ e l a z o l ~
(8 to 12 mglkg intramuscularly) using remote injection equipment (Stirling et al. 1989). Sixty-eight
bears were captured during spring (April and May) while they were hunting seals on arctic sea-ice
near Resolute Bay, Nunavut, Canada (74O00' to 76O00'N and 93O00' to 100°50'W). Eighty-five
adult polar bears were captured during summer, fall, and winter (July to November, and March)
while they were fasting on land along the west coast of Hudson Bay near Churchill, Manitoba,
Canada (57O00' to 58O50'N and 92O25' to 94O 1 S'W). The polar bears captured during March were
comprised of six adult females accompanied by new-born cubs that had emerged recently (within
days) from their snow dens after 8 to 9 months of fasting that included pregnancy and early lactation.
Bears were weighed (* 0.5 kg) with an electronic load scale while suspended in a sling.
Body length was measured by positioning bears in sternal recumbency and measuring the straight-
line distance (* 0.5 cm) between the distal tips of nose and tail. Body condition of captured bears
was quantified by a body condition index (BCI) based on the relationship between body mass and
length (see Chapter 2). Rectal temperatures were recorded with a digital thermometer (AMG
Medical, Montreal, Quebec, Canada) at 10 minute intervals throughout the 3-hour handling period.
Ages of bears previously captured were obtained from a national database (Canadian Wildlife
Service, Edmonton, Alberta). The ages of bears not previously captured were determined by
extracting, sectioning, staining. and counting cementum annuli on one first premolar tooth
(Stoneberg and Jonkel 1966). Bears 5 years of age or older were classified as adults (Lunn et d.
1 997).
Twenty milliliters of blood was collected from the jugular vein into vacutainers tubes
containing sodium heparin (Becton Dickinson and Company, Franklin Lakes, New Jersey, USA).

Blood samples were cooled immediately following collection and were centrifuged within 12 hours
to collect and freeze plasma. Plasma glucose, cortisol, and thyroid hormone concentrations were
determined by the Clinical Pathology Laboratory at the Western College of Veterinary Medicine,
University of Saskatchewan. Saskatchewan, Canada The glucose was measured using an Abbott
spectrume Series Il biochemistry analyzer (Abbott Laboratories Diagnostics Division, Abbon Park,
Illinois 60064, USA) and plasma concentrations of total cortisol, triiodothyronine, and thyroxine
were measured directly, without extraction, using a fluorescence polarization immunoassay (TDx
System. Abbott Laboratories, Irving, TX, USA). Plasma insulin and glucagon concentrations were
measured by Bio-Stress Research (Waterloo, Ontario, Canada) using commercially available
radioimmunoassay kits (Inter-Medico, Willowdale, Ontario, Canada). Both assays were confirmed
to give valid results using the procedures of parallelism and quantitative recovery.
A total of 10 polar bears captured during different seasons were administered glucose to
determine and compare changes in plasma glucose, insulin, and glucagon concentrations in
association with nutritional state and body condition. Glucose (Dextrose 50%. Vetoquinol N.-A.
Inc., Lavaltrie, Quebec, Canada) was administered by slow bolus injection, via an intravenous
catheter, into the jugular vein at 500 mg glucose per kg body mass. A baseline blood sample was
drawn immediately prior to glucose administration and samples were taken at 5, 10, 15, 30,45,60,
90, 120, and 150 minutes following glucose administration. Blood samples were centrifuged, the
plasma frozen, and plasma glucose, insulin, and glucagon were measured as described above.
Samples of frozen liver collected during 1993-94 from nine feeding adult male polar bears
killed by Inuit hunters during spring, and from three fasting adult polar bears (two females and one
male) killed by conservation enforcement officers during fall, were obtained to measure hepatic
glycogen content. All liver samples were collected and frozen in liquid nitrogen at the time of death.
To measure the glycogen concentration, 400 mg of each sample was homogenized and acidified with
100 pl of 0.6 N perchloric acid (PCA). The acidified homogenate was neutralized with I: 1 v/w of I
M KHCQ, and the glucose concentration was measured with an Abbott ~pectrurn' Series II
biochemistry analyzer (Abbott Laboratories Diagnostics Division, Abbott Park, Illinois 60064,

USA). An aliquot (-50 @) of homogenate was hydrolyzed with 500 @ of amyloglucosidase (Sigma
Chemical Co., St. Louis, Missouri, USA) in 500 pl of acetate buffer, and incubated at 40°C for 2
hours. The hydrolyzed homogenate was acidified with 0.6 N PCA (25pl) and centrifuged at 14,000g
for 10 minutes. The supernatant was collected, its glucose concentration was measured, and the
glucose contributed by the amyloglucosidase was subtracted to give the glucose concentration for the
hydrolyzed supernatant. Glycogen concentration (pmol glucosyl unitsfg liver weight) was calculated
by subtracting the concentration of glucose in the homogenate from that in the hydrolyzed
supernatant.
Statistical analysis was performed using SPSS software (SPSS Inc., Chicago, Illinois,
USA). Two-way analysis of variance (ANOVA) was used to determine differences in plasma
glucose. hormones. and the insulin-to-glucagon mol& ratio (UG molar ratio; Unger 1971) among
nutritional states (feeding, fasting, and fasting that included pregnancy and early lactation), and
between sexes (Zar 1996). The body condition index (BCI) and drug dosage (mg/kg) were included
as covariates. Pairwise associations between plasma constituents and the BCI were measured using
Pearson (r) 2nd partial (r-) correlation analyses. Repeated measures ANOVA was used to
determine the significance of changes over time in the plasma concentrations of glucose, cortisol.
insulin, and glucagon, and in the VG ratio, of individual bears (Zar 1996). Tukey's Honestly
Significant Difference test was used to make multiple comparisons among means (Zar 1996). The
Mann-Whitney U-test was used to compare liver glycogen concentration between feeding and fasting
bears. For all statistical tests, significance was assigned when the probability of a Type I error was
equal to or less than 0.05. All results are reported as mean f standard error (SE).
6.3 Results
The plasma concentrations of glucose, cortisol, insulin, and glucagon, and the
insulin:glucagon (UG) molar ratio, covaried significantly with the Body Condition Index ( X I ) of
individual polar bears (Table 6.1). The pairwise correlations of these plasma constituents with the
BCI also were significant with the association being negative for glucose (r = -0.26, p < 0.01, n =

Table 6.1 Plasma concentrations of glucose and selected hormones, the UG molar ratio, and rectal temperature in free-ranging adult polar bears captured during feeding (spring) and fasting (summer-fall), and during fasting that included with pregnancy and early lactation (winter).'
Feeding Fasling ~as t ina+~ Factor or Covariate (spring) (summer-fall) (winter)
Plasma constituent female male female male female nutritional sex nutritional BCI (n = 7-38) (n = 7-30) (n = 6-49) (n = 10-28) (n = 3-6) state state x sex
glucose (mmoUL)
cortisol (nmol/L)
insulin (pmoVL)
glucagon (pgW
UG molar ratio
triiodothyronint (nmoVL)
thyroxine (nmoVL)
rectal temperaturec ("C)
' Values reported as mean f SE with range presented in parentheses. Statistical comparison made by two-way ANOVA with nutritional state and sex as the factors, nutritional slate x sex as the interaction, and the Body Condition Index (BCI) as the covariate. Significance indicated by "ns" for non-significance, * for p 5 0.05, ** for p S 0.01, and *** for p 5 0.001.
b Adult female bears captured during winter that were accompanied by new-born cubs, and that had emerged recently (within days) from their snow dens. Values reported for rectal temperature were recorded at 30 minutes following capture.
c..
E

109), cortisol (r = -0.35, p < 0.01, n = 82), and glucagon (r = -0.32, p < 0.05, n = 45), and positive
for insulin (r = 0.37, p < 0.05, n = 45) and the VG molar ratio (r = 0.55, p < 0.001, n = 45). Plasma
glucose, glucagon, and triiodothyronine (T3) concentrations were affected by nutritional state, with
fasting females captured during winter having significantly higher values than feeding or fasting
bears captured at other times of the year. In feeding polar bears, plasma T3 and thyroxine (T4)
values were significantly greater in females than in males. The pattern was opposite in fasting polar
bears captured during summer-fall, with thyroid hormone values greater in males than in females.
Plasma T3 and T4 values, however, did not differ between feeding and fasting males. Rectal
temperature values at 30 minutes following capture were significantly lower in fasting bears captured
during summer-fall than in bears captured during other times of the year. Plasma cortisol
concentration was significantly higher in females than males, irrespective of numtional state. There
were no significant correlations of drug dosage with the concentrations of any of the plasma
constituents, the UG molar ratio, or rectal temperature.
Throughout the 3-hour period in which captured bears were handled and sampled. the
plasma glucose concentration of fasting females captured during winter was significantly higher (F =
3.87, p < 0.05) than that of other feeding or fasting bears. but it increased significantly (repeated
measures ANOVA; F = 4.63, p < 0.001, n = 54) in all polar bears during handling, irrespective of
their nutritional state (Fig. 6.1). The plasma glucose concentration also was measured in five fasting
bears at I5 minute intervals for one hour following capture, but values in these bears increased only
slightly and not significantly (F = 2.33, p = 0.13) (Fig. 6.2). The plasma cortisol concentration,
however, decreased significantly (F = 19.34, p < 0.001) over the same time.
Plasma concentrations of glucose, insulin. and the YG molar ratio in ten polar bears
changed significantly (repeated measures ANOVA; F = 6.19 to 83.54, p < 0.00 1 ) over a 150 minute
period following the intravenous administration of glucose (Fig. 6.3). However. the plasma
glucagon concentration did not change significantly over this time (F = 1 .O3, p = 0.42). The plasma
concentrations of glucose and glucagon were significantly affected by nutritional state, with the one
adult female captured during winter (while accompanied by cubs) having higher values than other

Time following Immobilization (min)
Figure 6.1 Plasma glucose concentrations of polar bears at 15, 20, 25,30,45,75, 105, 135, and 165 minutes following chemical immobilization. Values are presented as the mean A standard error bars for polar bears captured during feeding (spring; 0 ; n = 25) and fasting (summer-fall; ; n = 24). and during fasting that included pregnancy and lactation (winter; 0 ; n = 5). Bears captured during winter were adult females that were accompanied by new-
born cubs, and that had emerged recently (within &ys) from their snow dens. Statistical comparison by repeated measures ANOVA indicated a significant (F = 4.63, p < 0.01) increase over time in the plasma glucose concentration of bears, irrespective of their nutritional state.

Time following Injection (min)
Figure 6.2 Plasma glucose and cortisol concentration of five fasting polar bears (three females and two males) at 15.30.45, and 60 minutes following intramuscular administration of the anesthetic drug. Valucs are presented as the mean &standard error bars. Statistical comparisons by repeated measures ANOVA indicated no significant (F = 2.33, p = 0.13) change over time in plasma glucose concentration. but a significant (F = 19.34 p < 0.001 decrease over time in plasma cortisol concentration.

Time Following Intravenous Glucose Administration (min)
Figure 6.3 Plasma glucose, insulin, and glucagon concentrations. and the YG molar ratio in 10 polar bears following intravenous administration of glucose (500 mg/kg). Values art plotted as the mean with vertical lines indicating the standard error of the mean for nine polar bears captured during spring or summer-fall (0 ). a single female polar bear captured during winter within days after emerging from her snow den with two new-born cubs ( 0 ). and all 10 polar bears combined ( ). Statistical comparisons by repeated measures ANOVA indicated significant changes over time in the plasma concentrations of glucose and insulin, and the VG molar ratio (F = 6.19 to 83.54, p < 0.001). but not in the plasma glucagon concentration (F = 1.03, p = 0.42).

bears for both constituents (glucose: F = 8.37, p < 0.05; and glucagon: F = 2.91, p < 0.05) at most
sampling times. The plasma insulin concentration and the UG molar ratio covaried significantly
(insulin: r = 3.94, p < 0.01; UG molar ratio: t = 3.47, p c 0.05) with the body condition of the
individual bears. Of two feeding bears captured during spring, an adult male with a BCI value of
0.27 (approximately 29% body fat; see Chapter 2) had markedly higher plasma insulin
concentrations and I/G molar ratio, and larger changes in plasma glucagon concentration, than did an
adult female with a BCI value of - 1.89 (approximately I 1% body fat) (Fig. 6.4).
Associations between the plasma insulin concentration and the concentrations of other
plasma constituents were determined, while controlling for variation in the BCI value, using plasma
values measured concurrently during two other studies (see Chapters 3 and 4). Insulin values were
positively correlated with the plasma glucose concentration (rmd = 0.40, p c 0.01, n = 45), but not
with the plasma concentrations of alanine (re = -0.28, p = 0.28, n = 20). non-esterified fatty acid
(rw = 0.24, p = 0.30, n = 20). glycerol (r- = -0.13, p = 0.56, n = 20), or total ketone bodies
(acetoacetate + &hydroxybutyrate; r- = 0.07, p = 0.78. n = 20).
The liver glycogen concentration for three fasting polar bears captured during fall was
signficantly greater than that for nine feeding polar bears captured during spring (U = 2.3 1, p < 0.05;
Fig. 6.5b).
6.4 Discussion
In this study, body condition was defined as the abundance of potential metabolic energy
stored in an animal's tissues (primarily adipose tissue and skeletal muscle) relative to its body size.
The body condition index (BCI) was developed to provide an estimate of the body condition of
individual polar bears relative to other bears in a sample population of 1072 animals (see Chapter 2).
Although the BCI is an index without units, it can be used in conjunction with the body length of a
bear to predict its mass of adipose tissue, skeletal muscle, or both tissues. The range of BCI values
is distributed normally around a mean value of zero, with positive values indicating a larger

0 30 60 90 120 150
Time Following Intravenous Glucose Administration (min)
Figure 6.4 Plasma glucose. insulin, and glucagon concentrations. and the UG molar ratio in two polar bears of different body condition following intravenous administration of g l u c o ~ (500 mg/kg). Individual values at differcnt sampling times arc plotted for an adult male that was fat (BCI = 0.27. which indicates the body fat content was approximately 29% of total body mas: . ) and an adult female that was lean (BCI = - 1.89. which indicates the body fat content w& approximately 11% of total body mass; 0 ).

feeding fasting (spring) (fall)
Nutritional State (season-of-capture)
Figure 6.5 Glycogen storage in the liver of fasting polar bears. a) A histologic section of liver colIected from an adult male polar bear following 4 months of fasting contains large stores of glycogen. The glycogen appears deep pink following staining of the section with Periodic acid-Schiff (PAS) stain. Magnification - 1 Ox objective. b) Liver glycogen concentration in nine feeding polar bears captured during spring and three fasting polar bears captured during fall.

availability of potential metabolic energy and negative values indicating a smaller availability of
potential metabolic energy, relative to the mean body condition of the sample population.
Body condition was an important factor influencing the metabolism and regulation of
glucose in polar bears. Plasma concentrations of glucose, cortisol, and glucagon were lower, and the
plasma insulin concentration and insulin:glucagon (WG) molar ratio were higher in fat bears (BCI >
0) when compared with lean bears (BCI 5 0) (Table 6. I). Furthermore, changes in the plasma
insulin concentration and I/G molar ratio of bears following intravenous administration of glucose
(glucose tolerance test) were greatly exaggerated in fat bears relative to the changes observed in lean
bears (Fig. 6.4). Together, these results indicate that greater body condition in polar bears was
associated with either a large amount of insulin secretion, or a slow rate of insulin clearance from
plasma, or a combination of both factors. Because changes in plasma glucose concentration
following the intravenous administration of glucose were similar among bears that varied widely in
body condition (BCI values from - 1.97 to +0.72, or from approximately 10% to 37% body fat), the
high insulin values in fat bears were more likely affected by a slow rate of insulin clearance than by a
large amount of insulin secretion. Insulin clearance is a function of the uptake of insulin from
plasma by insulin receptors on target cells and a slow rate of insulin clearance often reflects a low
sensitivity of tissues (e-g., due to a low number of receptors or a decrease in the affinity of receptors)
to insulin, a condition termed insulin resistance (Cotran et d. 1999). The results of this study
suggest that insulin resistance is a normal response of polar bears to alterations in stored potential
metabolic energy, waxing or waning as their body condition increases or decreases.
In contrast to humans, insulin resistance in polar bears is not known to be associated with
metabolic disease, e.g., type I1 diabetes mellitus, dyslipidemia. This suggests the effects of insulin
resistance are different between these species. In humans, plasma concentrations of glucose, alanine,
non-esterified fatty acid, glycerol, and total ketone bodies (acetoacetate and B-hydroxybutyrate) are
higher in obese than in normal-weight subjects, and arc significantly associated with both the plasma
insulin concentration and the degree of obesity (Golay et al. 1986, Robertson et al. 199 1). The
metabolic features underlying these plasma differences arc a decreased sensitivity of peripheral

tissues to insulin-stimulated glucose uptake, a decreased sensitivity of liver to insulin-inhibited
gluconeogenesis, and a reduction in the suppression of fatty acid metabolism by insulin (Groop et al.
1989, G m p et al. 1992, Ferrannini 1995). In polar bears, the plasma glucose concentration of fat
bears was slightly lower than that of lean bears, and the BCI was not a signticant covariate with the
plasma concentrations of alanine, non-esterifid fatty acid, glycerol, or total ketone bodies (see
Chapters 3 and 4). Furthermore, the plasma insulin concentration was only associated with the
plasma glucose concentration and not with the concentrations of other plasma constituents. The
metabolic features of polar bears that account for these differences from humans are not known.
Nevertheless, these results suggest that insulin resistance in polar bears is associated with decreased
use of glucose by peripheral tissues without significant alterations in fatty acid metabolism. If this is
the case, polar bears may be increasingly able to spare glucose (and, therefore, protein and amino
acids), while using fatty acids for energy, as their quantity of body fat increases.
The piasma glucose concentrations of bears in this study were high when compared to
normal reference values for humans and domestic mammals (Tieu et al. 1990, Duncan et al. 1994),
and exceeded the 95% confidence interval for the blood glucose concentration of 73 other
mammalian species when scaled to body mass (Umminger 1975). It is likely that these high values
were associated with acute stress arising from the capture procedure, as evidenced by the concurrent
high concentrations of plasma cortisol at the initial sampling time relative to later sampling times.
The finding that the high concentrations of plasma glucose persisted, and often increased, in
polar bears throughout the 3 hour handling period that followed their capture (Fig. 6. I), irrespective
of the differences in body condition among bears, is difficult to explain. It is most likely that the
persistence of high glucose values reflected both a delayed secretion of insulin and a slow clearance
of glucose from plasma, rather than a high rate of gluconeogenesis induced by stress or possibly
anesthesia. This is supported by observations that, following the administration of ~ ~ U C O S ~
intravenously, the rise in plasma insulin concentration and the return of plasma glucose concentration
to baseline values in polar bears (that varied widely in body condition) was prolonged (Figs. 6.3 and
6.4) relative to rates typically encountered in humans and domestic mammals [e.g., in domestic

species, insulin concentrations typically peak at 5 minutes and peak glucose values decrease by one-
half within 45 minutes (Seltzer et al. 1%7, Duncan et al. 1994)J. This suggests that insulin secretion
and clearance may normaily be slow in polar bears, relative to other mammals, independent of the
effect of body condition. In regard to stress effects, the plasma cortisol concentration of bears
decreased by approximately 40-50% during the first hour following capture (Fig. 6.2). Although the
physiological effects of cortisol may continue well after its plasma concentration decreases, plasma
glucose concentration typically returns to pre-stress values in response to a rise in plasma insulin
concentration (Goldstein et al. 1993). The anesthetic drug ~elazol@ has not affected plasma glucose
concentrations in a variety of mammals (Van Heerden et al. 1991, Lin et al. 1993, Peinado et al.
1993). Furthermore, the dosage of ~elazol" administered to polar bears in this study did not
correlate with their plasma glucose concentration.
Relative to body condition, nutritional state (feeding or fasting) appeared to have little
effect on the regulation of plasma glucose in polar bears, but did have a significant effect on the total
energy metabolism of polar bears. In females captured shortly after emerging from their winter dens,
the plasma concentrations of glucose, glucagon, cortisol, and triiodothyronine 03) were high, and
the UG molar ratios were low, relative to bears captured during other seasons (Table 6.1 and Fig.
6.3). Furthermore, the plasma concentration of thyroxine (T4) and the rectal temperatures of fasting
females captured during winter were high relative to fasting bears captured during summer-fall, but
similar to values measured in feeding bears. Together, these results suggest females emerging from
their winter dens had high metabolic rates (relative to other fasting bears) and were mobilizing their
energy stores. Higher plasma glucagon values combined with lower UG molar ratios would result in
a higher rate of gluconeogenesis and the mobilization of glucose stored in glycogen (glycogenolysis)
(Unger 1971). Higher plasma cortisol values would contribute to the permissive role this hormone
plays in affecting the action of glucagon during fasting (Ganong 1995). And lastly, higher plasma
concentrations of T3 and T4 and a higher rectal temperature in fasting females captured during
winter indicates they had a higher metabolic rate than fasting bears captured during summer-fall
(Ganong 1995).

The demand on body energy stores is greatest for female polar bears during summer-fall (in
association with pregnancy and lactation) when food is less available or not available at all. Thus, a
depression of metabolic activity as indicated by their lower values for plasma T3 and T4 and rectal
temperature (relative to feeding females) conserves stored body fuels (fat and protein) during
prolonged fasting (Hochachka and Guppy 1987). In males, the demand on body energy stores is
probably greatest during spring (in association with breeding activity) when, despite the availability
of food, they will fast intermittently while seeking a mate. The lower T3 and T4 values in feeding
males relative to feeding females may have reflected a slower metabolic rate. The fact, however, that
rectal temperatures were similar between feeding males and females, and that normal sexual function
is dependent on normal thyroid secretion (Guyton 1986), suggest any difference in metabolic rate
between feeding males and females probably was small. In contrast, fasting males had higher
plasma T3 and T4 values than fasting females. Rectal temperatures, however, were similar between
males and females, but lower than the values recorded in feeding bears. Together, these results
suggest that, as in female bears, the metabolic rate of fasting males was slower than that of feeding
males, but the magnitude of difference in metabolic rates between feeding and fasting was probably
not as extreme in males as it was in females. Similar interactions between sex and nutritional state
affected the plasma concentration of total amino acids (Chapter 3) and the piasma concentrations of
acyl-carnitine and free camitine (Chapter 4) in polar bears.
During a routine histologic examination of tissues collected from a killed adult male polar
bear, an abundance of glycogen was observed in sections of liver (Fig. 6.5a). Because the bear had
been killed dwing fall after approximately 4 months of fasting, the presence of glycogen was an
unexpected finding and prompted the subsequent determination of glycogen concentrations in the
livers of feeding and fasting polar bears (Fig. 6.5b). The presence of liver glycogen following
prolonged fasting, coupied with the finding that rates of insulin secretion and clearance appear to be
slow in polar bears, suggest that polar bears are not as dependent on glucose for energy as are other
mammals and, as a consequence, are more lax in regulating their body glucose stores.

7. GENERAL DISCUSSION
7.1 Similar scenarios, difkrent outcomes revisited
Why did the loss of body weight lead to the death of Janice the computer artist, but appear
to be of little consequence to the health of the polar bear X0911 l? From the large amount of
research that has been carried out on the need for f d in humans, we can speculate on the likely
sequence of biochemical and physiological events that occurred in Janice, eventually leading to her
death. At the outset, it is important to realize that not only did Janice drastically decrease her daily
consumption of calories for a prolonged period, but her daily physical activity also increased
substantially. The net effect of these lifestyle changes was that Janice became heavily dependent on
the chemical constituents of her body to provide the fuel necessary to meet her daily energy demand.
During the first week of her diet, it was likely that Janice completely depleted the glycogen
that was stored in her liver. This stage is termed Phase I in a fasting mammal (i.e., one that is totally
deprived of food) and represents the body's effort to maintain the plasma glucose concentration at its
pre-fast value (Cherel et al. 1988, Belkhou ct al. 1991). As glycogen from Janice's liver was being
released into her blood as glucose, her adipose tissue also was releasing non-esterified fatty acids and
glycerol in increased quantities into her blood. As a result, Janice began to rely more on the
oxidation of fatty acids for energy while simultaneously reducing her oxidation of glucose (glucose-
sparing) and her catabolism of protein (protein-sparing).
As Janice's dependency on the oxidation of fatty acids increased, she entered into a
biochemical stage that is tcrmcd as Phase II in a fasting mammal (Cherel et al. 1988, Belkhou et al.
1991). During this stage, not only did her rate of fatty acid oxidation increase, but her production
and use of ketone bodies also increased. Ketone bodies are a product of fatty acid catabolism which,
unlike non-esterifred fatty acids, can cross the blood-brain barrier and act as a fuel source to the
brain. Thus, the production and use of ketone bodies was another means by which Janice reduced

her demand for glucose. As a consequence of her reduced need for glucose, less protein was
required to provide precursors for gluconeogtnesis. Unfortunately, however, the high production of
ketone bodies and their rising concentration in Janice's blood made it difficult for her to maintain
acid-base balance. To preserve acid-base balance and prevent the occurrence of metabolic acidosis
(or ketosis), it was necessary for Janice to increase her production of ammonium. Thus, although the
use of glucose for energy had been reduced significantly, the net breakdown of protein could not be
completely stopped because protein catabolism was now required to produce the ammonium needed
to presetve acid-base balance.
The fact that protein catabolism could be reduced, but not stopped, eventually proved to be
fatal for Janice. While she was fully aware that her M y lipid stores were diminishing by the day,
she did not realize that over the months the protein from her skeletal muscle also was disappearing to
provide the small amounts of giucose required by her brain for energy and the ammonium required to
preserve her acid-base balance. At the time Janice made her final visit to her doctor, she still had an
adequate supply of lipid available for energy, but her body protein had become severely depleted.
As a result, the loss of protein from Janice's heart had exceeded a limit beyond which normal heart
function could be maintained. The irregular heartbeat that Janice's doctor had detected was a
ventricular arrhythmia, a sign of severe cardiovascular disease.
In many ways, the weight loss in bear X09111 appeared to occur under far more difficult
conditons than faced by Janice. At the time when bear X091 I 1 was captured with her two male
cubs, she had endured 8 to 9 months of continuous fasting. In contrast, Janice had only endured 6
months on a diet that contained a very low number of calories. While fasting, bear X09111 had
undergone all of post-implantational pregnancy' and 4 months of lactation. Janice was neither
pregnant nor lactating. Finally, bear X091 I1 had lost 47% of her initial body weight, while Janice
had lost only 39%. Nevertheless, despite the evidently greater demand on the body he1 stores of
I The implantation of the blastocyst in the uterine wall of polar bears is delayed for approximately 3 to 4 months following conception (Len0 1972). Thus, mating in polar bears occurs sometime during April or May, but the development of the blastocyst is arrested until August or September, at which time the blastocyst becomes attached to the uterus and resumes its development. This process is termed delayed implantation.

bear X09111, there was nothing to suggest that the extreme loss of weight was of any ill-
consequence to her health. In fact, as the records fiom her previous captures indicated, large
fluctuations in body weight appeared to be a normal feature of her life.
There is very little known about the sequence of biochemical and physiological events that
occurs in polar bears during prolonged fasting. From the results of this study, however, there are two
pieces of relevant information which can be deduced. First, the response to fasting in polar bears
does not conform with the scheme of biochemical responses to fasting that has been described for
other mammals (Cherel et al. 1988, Belkhou et al. 1991, Castellini and Rea 1992). According to this
scheme, Phase I represents a short initial period where liver glycogen stores are depleted, Phase II
represents a long intermediate period where energy demands are met mostly through the oxidation of
fatty acids and ketone bodies, and Phase III represents terminal starvation and occurs when 3@509?1
of the body protein has been depleted. Polar bears do not deplete, but instead maintain or increase,
their liver glycogen stores during fasting (Chapter 6). Thus, polar bears do not show evidence for
Phase I of fasting. Plasma concentrations of ketone bodies are extremely low in fasting polar bears
relative to concentrations measured in other fasting mammals. and are similar to values measured in
feeding polar bears (Chapter 4). Thus, polar bears do not show evidence for Phase Il of fasting.
Lastly, none of the 184 adult polar bears handled during this study appeared to be in a state of
terminal starvation. Even the fasting bears with the lowest BCI values (< -2.0) also had low
concentrations of plasma urea (< 9.0 mmol/L) and low ratios of plasma urea to plasma creatinine
(UK ratios < 12.0). which suggests these animals were able to conserve body nitrogen (Chapter 3).
This is not to say, however, that some polar bears do not starve to death, but rather to say that most
bears are able to fast continuously for many months duration.
The most likely explanation for why the biochemical response to fasting in polar bears does
not conform to the scheme of biochemical responses to fasting described for other mammals (Cherel
et al. 1988, Belkhou et al. 1991, Castellini and Rea 1992) is because, in contrast to many other
mammals, polar bears subsist on a diet that is high in lipid content and low in carbohydrate content.
As a consequence of this, fatty acids are the major metabolic fuel for polar bears, whether fetding or
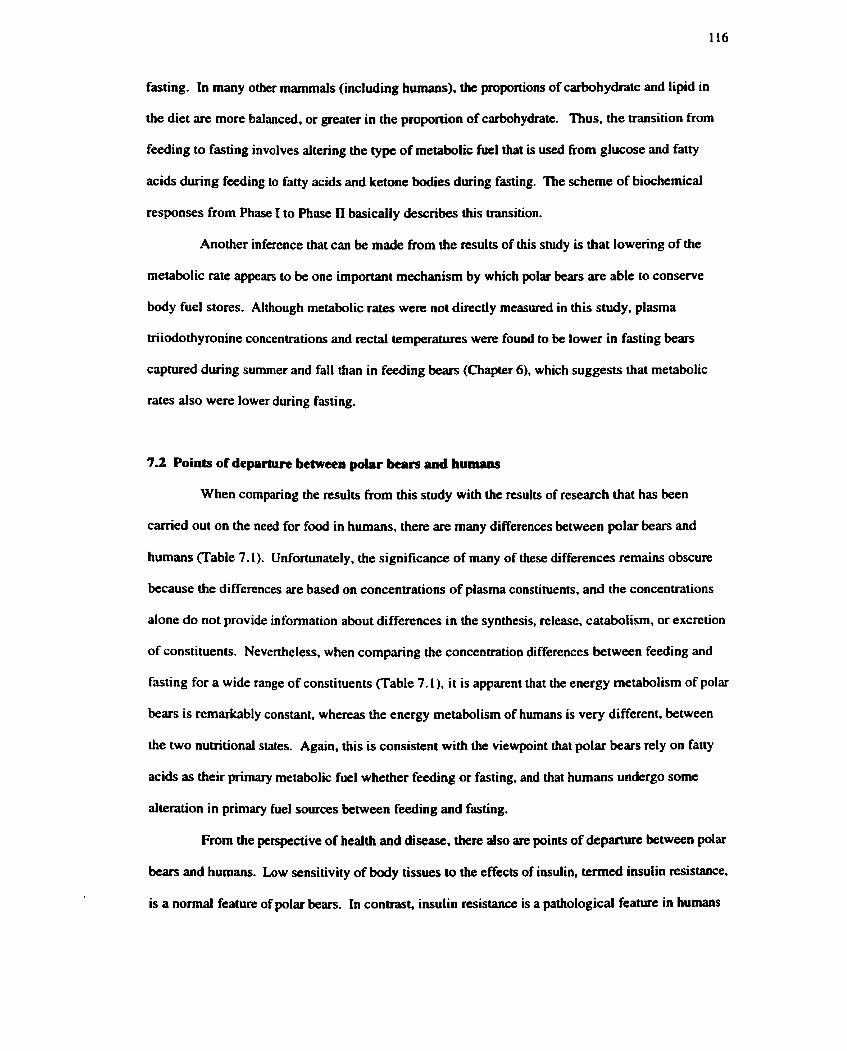
fasting. In many other mammals (including humans), the proportions of carbohydrate and lipid in
the diet are more balanced, or greater in the proportion of carbohydrate. Thus, the transition from
feeding to fasting involves altering the type of metabolic fuel that is used from glucose and fatty
acids during feeding to fatty acids and ketone bodies during fasting. The scheme of biochemical
responses from Phase I to Phase II basically describes this transition.
Another inference that can be made from the results of this study is that lowering of the
metabolic rate appears to be one important mechanism by which polar bears are able to conserve
body fuel stores. Although metabolic rates were not directly measured in this study, plasma
triiodothyronine concentrations and rectal temperatures were found to be lower in fasting bears
captured during summer and fall than in feeding bears (Chapter 6), which suggests that metabolic
rates also were lower during fasting.
7.2 Points of departure between polar beaft and humans
When comparing the results from this study with the results of research that has been
carried out on the need for food in humans, there are many differences between polar bears and
humans (Table 7.1). Unfortunately, the significance of many of these differences remains obscure
because the differences are based on concentrations of plasma constituents, and the concentrations
alone do not provide information about differences in the synthesis, release, catabolism, or excretion
of constituents. Nevertheless, when comparing the concentration differences between feeding and
fasting for a wide range of constituents (Table 7. I ) , it is apparent that the energy metabolism of polar
bears is remarkably constant, whereas the energy metabolism of humans is very different, between
the two nutritional states. Again, this is consistent with the viewpoint that polar bears rely on fatty
acids as their primary metabolic fuel whether feeding or fasting, and that humans undergo some
alteration in primary fuel sources between feeding and fasting.
From the perspective of health and disease. there also are points of departure between polar
bears and humans. Low sensitivity of body tissues to the effects of insulin, termed insulin resistance,
is a normal feature of polar bears. In contrast, insulin resistance is a pathological feature in humans

Table 7.1 Selected biochemical constituents for which values during polongtd fasting relative to values during feeding differ between polar bears and humans?
- -- - - - -
Fastinn Value in Relation to Feedinn Value
Biochemical Constituent polar bears humansb
A. Wtein and amino acid mctabolisq
plasma total protein concentration plasma albumin concentration plasma globulin concentration plasma essential amino acid conantration plasma alaninc aminotmnsferasc concentration plasma alaninc concentration plasma crtatininc concentration liver argininosuccinatc synthctase activity
liver argininosuccinatc lyase activity liver arginase activity
B. Lipid metabolism
plasma total lipid concentration plasma non-esterifred fatty acid concentration
plasma glycerol concentration plasma acetoacetate concentration
plasma $-hydmxybutyratc concentration plasma acy I-camitinc concentration plasma free carnitine concentration rate of appearance of glycerol in plasma
plasma glucose concentration liver glycogen concentration
D. Hormone concentrations
plasma insulin plasma glucagon plasma cortisol
indicates fasting values arc greater than fading values. 1 indicates fwing values am less than f d i n g vducs. and 0 indicates there am no significant differences between fasting atxi feeding values. Comparative information for humans was extracted from Owen et al. (1969). Chill (1970). Marlis et d. ( 1910). Streja et al. (1977). H o w l and Genuch (1980). Hmnaford et al. (1 982). Klein et al. (1986). Clorc et al. (1989). and Owen et al. (1998).

that often heralds the development of type II diabetes mellitus (Groop et al. 1989, Sugden et al.
1995, Walker 1993). It is with such points of departure, involving health in polar bears and disease
in humans, that further investigation of the energy metabolism of polar bears could provide valuable
comparative data for understanding, and perhaps treating, some of the metabolic diseases that occur
in humans.
7.3 The study in retrospect
In the general introduction to h i s work, the body of the thesis is described as "an integrated
collection of five paits." There were times during the course of this investigation, however, where
the integration of the different studies appeared questionable, if not impossible.
At the onset of this investigation, it was anticipated that the use of stable isotope tracers
would provide the bulk of the data regarding the biochemical response of polar bears to prolonged
fasting. In fact, stable isotope tracers were used in the studies of protein and amino acid (%-urea
and "c-urea), lipid ('3~-glycerol and 13~-propionic acid). and carbohydrate metabolism
('H-glucose}. In many cases. measurement of the concentrations of different plasma constituents was
made to support the results anticipated from the stable isotope studies. At the mid-point of the study,
however. it became apparent that the stable isotope studies were not working and that plasma
biochemistry was to provide the bulk of the data. The most obvious sign of this salvage is the large
variation in sample sizes, both within (e.g.. between nutritional states, between sexes) and between
studies.
The stable isotope studies failed largely because most of the stable isotope tracers, with the
exception of '3~-glycerol, were administered at dosages that were too low to give reliable results.
Nevertheless. stable isotope studies continue to offer potential for further understanding the energy
metabolism of polar bears. In future, however, it will be necessary to conduct pilot studies with
selected stable isotope tracers to determine effective dosages prior to carrying out till-scale
metabolic studies. Such pilot studies could be conducted safely and most effectively with captive
polar bears.

7.4 Future directions
Should future studies arise from this investigation, the objectives for these studies will
likely be dictated as much by the research interests of the individuals involved as by any questions
raised during this investigation. Nevertheless, each of the individual studies described in Chapters 3
to 6 offers questions that could provide a basis for further study. In regard to protein and amino acid
metabolism (Chapter 3), the proposed model for nitrogen metabolism in the liver of fasting polar
bears (Fig. 3.4) will need to be tested, and either verified or replaced with a better model. In regard
to lipid metabolism (Chapter 4), the role of glycerol kinase in adipose tissue as a mechanism to finely
regulate the release of fatty acids into blood will need to be determined. In regard to fatty acid
composition (Chapter 5), the ability of polar bears to avoid the potentidly toxic effects of large
concentrations of eicosapentaenoic acid (20:Sd) in body tissues will need to be explained. Finally,
in regard to carbohydrate metabolism (Chapter 6), the hypothesis that glucose has only a minor role
as an energy substrate in polar bears will need to be tested in feeding and fasting bears, possibly
through the use of stable isotope tracers.

LITERATURE CITED
Abumrad NN, Miller B. 1983. The physiologic and nutritional significance of plasma-fiee amino
acid levels. Journal of Parented and Enteral Nutrition 7: 163- 170.
Adibi SA. 1968. Influence of dietary deprivations on plasma concentration of free amino acids of
man. Journal of Applied Physiology 25: 52-57.
Adibi SA. 197 1. Interrelationships between level of amino acids in plasma and tissues during
starvation. American Journal of Physiology 221: 829-838.
Ahlquist DA. Nelson RA, Steiger DL, Jones ID, and Ellefson RD. 1984. Glycerol metabolism in
the hibernating black bear. Journal of Comparative Physiology B 155: 75-79.
Arnould JPY. 1990. The energetics of lactation in polar bears (Ursus mardimus Phipps). MSc
thesis, University of Saskatchewan, Saskatwn, Saskatchewan.
Arnould JPY, Ramsay MA. 1994. Milk production and milk consumption in polar bears during the
ice-free period in western Hudson Bay. Canadian Journal of Zoology 72: 1365- 1370.
Atkinson SN. Nelson RA, Ramsay MA. 19%a Changes in the body composition of fasting polar
bears (Ursus maritimus): the effect of relative fatness on protein conservation.
Physiological Zoology 69: 304-3 16.
Atkinson SN, Ramsay MA. 1995. Effects of prolonged fasting on the body composition and
reproductive success of adult female polar bears (Ursus mrir imus). Functional Ecology 9:
559-567.
Atkinson SN, Stirling I, Ramsay MA. 19%b. Growth in early life and relative body size among
adult polar bears (Ursus maritimw). Journal of Zoology, London 239: 225-234.
Barboza PS, Farley SD, Robbins CT. 1997. Whole-body urea cycling and protein turnover during
hyperphagia and dorxnancy in growing bears (Ursus amen'canrrs and U. arctos). Canadian
Journal of Zoology 75: 2129-2136.

Bauer JE. 1996. Comparative lipid and lipoprotein metabolism. Veterinary Clinical Pathology 25:
49-56.
Belkhou R, Cherel Y, Heitz A, Robin EP, Le Maho Y. 1991. Energy contribution of proteins and
lipids during prolonged fating in the rat. Nutrition Research 1 I: 365-374.
Belluui A, Brignola C, Campieri M, Pera A, Boschi S, Miglioli M. 1996. Effect of an enteric-
coated fish-oil preparation on relapses in Crohn's disease. The New England Journal of
Medicine 334: 1557- 1560.
Best RC. 1984. Digestibility of ringed seals by the polar bear. Canadian Journal of Zoology 63:
1033- 1036.
Beylot M, Martin C, Beaufrere B, Riou JP, Momex R. 1987. Determination of steady state and
nonsteady-state glycerol kinetics in humans using deuterium-labeled tracer. Journal of
Lipid Research 28: 4 14-422.
Blaxter KL. 1989. Energy Metabolism in Animals and Man. Cambridge University Press,
Cambridge, England. 336 pp.
Boden G, Ray TK, Smith RH. Owen OE. 1983. Carbohydrate oxidation and storage in obese non-
insulin dependent diabetic patients. Effects of improving glycemic control. Diabetes 32:
982-987.
Brown DC, Mulhausen RO, Andrew DJ, Seal US. 1971. Renal function in anesthetized dormant
and active bears. American Journal of Physiology 220: 293-298.
Burstein M, Scholnick HR, Morfin R. 1970. Rapid method for the isolation of lipoproteins from
human serum by precipitation with polyanions. Journal of Lipid Research 1 I: 583-595.
Bush BM. 1991. Interpretation of Laboratory Results for Small Animal Clinicians. Blackwell
Science Ltd., Oxford, United Kingdom. 515 pp.
Cahill GF. 1970. Starvation in man. New England Journal of Medicine 282: 668-675.
Cahill GF, Herrcra MG, Morgan AP, Soeldner JS, Steinke J, Levy PL, Rcichard GA, Jr., Kipnis
DM. 1%6. Hormone-fuel internlationships during fasting. Journal of Clinical
Investigation 45: 175 1 - 1769.

Castellini MA, Rea LD. 1992. The biochemistry of natural fasting at its limits. Experientia 48:
575-582.
Castellon EA. 1994. Glutathione and gamma-glutamyl cycle enzymes in rat testis during sexual
maturation. Archives of Andrology 33: 179-185.
Cattet M. 1988. Aspects of physical condition in black and polar bears. MSc thesis, University of
Alberta, Edmonton, Alberta.
Cattet M. 1990. Predicting nutritional condition of black bears and polar bears on the basis of
morphological and physiological measurements. Canadian Journal of Zoology 68: 32-39.
Cattet MRL, Atkinson SN, Polischuk SC, Ramsay MA. 1997. Redicting body mass in polar bears:
is mophometry useful? Journal of Wildlife Management 61: 1083-1090.
Ccrsosimo E, Williams PE, Radosevich PM, Hoxworth BT, Lacy WW, Abumrad NN. 1986. Role
of glutamine in adaptations in nitrogen metabolism during fasting. American Journal of
Physiology 250: E622-E628.
Chakrabarty K, Tauber JW, Sigei B, Bombeck CT, Jeffay H. 1984. Glycerokinase activity in
human adipose tissue as related to obesity. International Journal of Obesity 8: 609-622.
Cherel Y, Burnol AF, Leturque A, Le Maho Y. 1988. In vivo glucose utilization in rat tissues
during the three phases of starvation. Metabolism 37: 1033- 1 OW.
Cherel Y, Robin JP, Heitz A, Calgari C, Le Maho Y. 1992. Relationships between lipid availability
and protein utilization during prolonged fasting. Journal of Comparative Physiology 162:
305-3 13.
Clore JN, Glickman PS, Helm ST, Nestler JE, Blackard WG. 1989. Accelerated decline in hepatic
glucose production during fasting in normal women compared with men. Metabolism 38:
1 103- 1 107.
Collier GR, Sinclair AJ. 1993. Role of n-6 and g-3 fatty acids in the dietary treatment of metabolic
disorders. Annals of the New York Academy of Sciences 683: 323-330.
Coppack SW, Jensen MD, Miles IM. 1994. In vivo regulation of lipolysis in humans. Journal of
Lipid Research 35: 177-193.

Costa DP. Croxall JP, Duck CD. 1989. Foraging energetics of Antarctic fur seals in relation to
changes in prey avai!ability. Ecology 70: 596-606.
Cotran RS, Kurnar V, Collins T. 1999. Robbins Pathologic Basis of Disease, 6th Edition. W.B.
Saunders Company, Philadelphia New Jersey. 1425 pp.
Courtay C, Heisterkamp N, Siest G, Groffen J. 1994. Expression of multiple gamma-
glutarn y Itransferase genes in man. Biochemical Journal 297: 503-508.
Derocher AE, Nelson RA, Stitling I, Ramsay MA. 1990. Effects of fasting and feeding on serum
urea and serum creatinine levels in polar bears. Marine Mammal Science 6: 196-203.
Derocher AE, Nelson RA, Stirling I, Ramsay MA. 1990. Effects of fasting and feeding on serum
urea and serum creatinine levels in polar bears. Marine Mammal Science 6: 196-203.
Derocher AE. Stirling I, Andriashek D. 1992. Pregnancy rates and serum progesterone levels of
polar bears in western Hudson Bay. Canadian Journal of Zoology 70: 561-566.
Derocher AE, Stirling I, Andriashek D. 1992. Pregnancy rates and serum progesterone levels of
polar bears in western Hudson Bay. Canadian Journal of Zoology 70: 561-566.
Derocher AE. Stirling I. 1990. Distribution of polar bears (Ursus maritimus) during the ice-free
period in western Hudson Bay. Canadian Journal of Zoology 68: 1395-1403.
Derocher AE, Stirling I. 1998. Geographic variation in growth of polar bears (Ursus maririmus).
Journal of Zoology, London 245: 65-72.
Draper N, Smith H. 198 1. Applied Regression Analysis, 2nd Edition. John Wiley and Sons, New
York, New York. 709 pp.
Duncan JR, Rasse KW, Mahaffey EA. 1994. Veterinary Laboratory Medicine: Clinical Pathology,
3rd Edition. Iowa State University Press, Amcs, Iowa. 300 pp.
Durner GM, Amsmp SC. 1996. Mass and bodydimension relationships of polar bears in northern
Alaska. Wildlife Society Bulletin 24: 480-4434,
Dyerberg J, Bang HO. 1979. Hacmostatic function and platelet polyunsaturated fatty acids in
Eskimos. Lancet 2: 433-435.

Eason TH, Smith BH, Pelton MR. 1996. Restarcher variation in collection of morphometrics on
black bears. Wildlife Society Bulletin 24: 485-489.
Farley SD, Robbins CT. 1994. Development of two methods to estimate body composition of
bears. Canadian Journal of Zoology 72: 220-226.
Felig P, Owen OE, Wahren J, Cahill GF, Jr. 1969. Amino acid metabolism during prolonged
starvation. The Journal of Clinical Investigation 48: 584-594.
Ferguson JH. Folk GE, Jr. 197 1. Free fatty acid levels in several species of arctic carnivores.
Comparative Biochemistry and Physiology 40B: 309-3 12.
Ferrannini E. 1995. Physiological and metabolic consequences of obesity. Metabolism 44 (Suppl
3): 15-17.
Forbes GB. Drenick H. 1979. Loss of body nitrogen on fasting. The American Journal of Clinical
Nutrition 32: 1570- 1574.
Ganong WF. 1995. Review of Medical Physiology, 17th Edition. Appleton and Lange, Norwalk,
Connecticut. 781 pp.
Giesecke K. Magnusson I, Ahlberg M, Hagenfeldt L, Wahrcn J. 1989. Protein and amino acid
metabolism during early starvation as reflected by excretion of urea and methylhistidines.
Metabolism Clinical and ExperimentaI 38: 1 196- 1200.
Gaff JP, Horst RL. 1997. Effects of the addition of potassium or sodium, but not calcium, to
preparturn ratios on milk fever in dairy cows. Journal of Dairy Science 80: 176- 186.
Golay A, Swislocki ALM, Chen YDI, Jaspan JB, Reaven GM. 1986. Effect of obesity on ambient
plasma glucose, free fatty acid, insulin, growth hormone, and glucagon concentrations.
Journal of Clinical Endocrinology and Metabolism 63: 48 1-484.
Goldstein RE, Wassetman DH. McGuinness OP, Lacy DB, Chemngton AD, Abumrad NN. 1993.
Effects of chronic elevation in plasma cortisol on hepatic carbohydrate metabolism.
American Journal of Physiology 264: E 1 19-E 127.
Groop LC, Bonadonna RC, DelRato S, Ratheiser K, Zyck K, Ferrannini E, DeFronzo RA. 1989.
Glucose and free fatty acid metabolism in non-insulin-dependent diabetes mellitus -

evidence for multiple sites of insulin resistance. Journal of Clinical Investigatidn 84: 205-
213.
Groop LC, Bondonna RC, Simonson DC, Petrides AS, Shank M, DcFronzo RA. 1992. Effect of
insulin on oxidative and nonoxidative pathways of free fatty acid metabolism in human
obesity. American Journal of Physiology 263: E79-E84.
Guyton AC. 1986. Textbook of Medical Physiology, 7th Edition. W. B. Saunders Company,
Philadelphia, Pennsylvania. 1057 pp.
Hadley NF. 1985. The adaptive role of lipids in biological systems. John Wiley and Sons, Inc.,
New York, NY. 3 19 pp.
Hales CN, Luzio JP, Siddle K. 1978. Hormonal control of adipose tissue lipolysis. Biochemical
Society Symposia 43: 97- 135.
Hammill MO, Smith TG. 1991. The role of predation in the ecology of the ringed seal in Barrow
Strait, Northwest Territories. Marine Mammal Science 7: 123- 135.
Hanigan MH, Frierson HF, Jr. 19%. hmunohistochemical detection of gamma-gfutamyl
transpcptidase in normal human tissue. Journal of Histochemistry and Cytochemistry 44:
1101-1 108.
Hannaford MC, Leiter LA, Josse RG, Goldstein MB, Marliss EB, Halperin ML. 1982. Protein
wasting due to acidosis of prolonged fasting. American Journal of Physiology 243: E25 1 -
E256.
Harington CR. 1968. Denning habits of the polar bear (Ursus maririmus Phipps). Canadian
Wildlife Service Report Series No. 5. Ottawa. 30 pp.
Hasan Y. 1997. Camitine levels in the denning black bear. MSc thesis, University of Illinois at
Urbana-Champaign, Urbana, Illinois.
Heitrnann RN, Bergman EN. 1980. Integration of amino acid metabolism in sheep: effects of
fasting and acidosis. American Joumal of Physiology 239: E248-E254.

Hellgren EC, Rogers LL, Seal US. 1993. Serum chemistry and hematology of black bears:
physiological indices of habitat quality or seasonal patterns? Journal of Mammalogy 74:
304-3 15.
Hibbeln JR, Salem N. 1995. Dietary polyunsaturated fatty acids and depression: when cholesterol
docs not satisfy. American Journal of Clinical Nutrition 62: 1-9.
Hilderbrand GV, Farley SD, Robbins CT. 1998. Predicting body condition of bears via two field
methods. Journal of Wildlife Management 62: 406-409.
Hilderbrand GV, Schwartz CC, Robbins CI', Hanky TA. 2000. Effect of hibernation and
reproductive status on body mass and condition of coastal brown bears. Journal of Wildlife
Management 64: 178- 183.
Hill JO, Peters JC. 1998. Environmental contributions to the obesity epidemic. Science 280: 137 1-
1 374.
Hochachka PW, Guppy M. 1987. Metabolic Arrest and the Control of Biological Time. Harvard
University Press, Cambridge, Massachusetts. 227 pp.
Hodge L, Salome CM, Peat JK, Haby MM, Xuan W, Woolcock AJ. 1996. Consumption of oily fish
and childhood asthma risk. Medical Journal of Australia 164: 137- 140.
Holman RT. 1960. The ratio of trienoic:tetraenoic acids in tissue lipids as a measure of essential
fatty acid requirement. Joumal of Nutrition 70: 405-410.
Holman RT. 1%8. Essential fatty acid deficiency. In: Holman RT (ed). Rogress in the chemistry
of fats and other lipids. Pergamon Ress, Oxford, England. 9: 275-348.
Holman RT. 1986. Control of polyunsaturated acids in tissue lipids. Journal of the American
College of Nutrition 5: 183-21 1.
Holman RT, Adams CE, Nelson RA, Grater SJE. Jaskiewicz JA, Johnson SB, Erdman JW, Jr. 1995.
Patients with anorexia nervosa demonstrate deficiencies of selected essential fatty acids,
compensatory changes in nonessential fatty acids and decreased fluidity of plasma lipids.
Journal of Nutrition 125: 90 1-907.

Holman RT, Bibus DM, Jeffrey GH, Smethurst P, Crofts JW. 1994. Abnormal plasma lipids of
patients with Retinitis pigmentoso. Lipids 29: 61 -65.
Holman RT, Johnson SB, Mercuri 0, I tme HJ, Rodrigo MA, F)e Tomas ME. 1981. Essential fatty
acid deficiency in malnourished children. The American Journal of Clinical Nutrition 34:
1534- 1539.
Holman RT, Johnson SB, Ogburn PL. 1991. Deficiency of essential fatty acids and membrane
fluidity during pregnancy and lactation. Roceedings of the National Academy of Sciences
USA 88: 48354839.
Hoppel CL, Genuth SM. 1980. Carnitine metabolism in normal-weight and obese human subjects
during fasting. American Journal of Physiology 238: E409-E415.
Hunter A, Downs CE. 1945. The inhibition of arginase by amino acids. Journal of Biological
Chemistry 157: 157: 427-446.
Imaichi K, Michaels GD, Holton S, Kinsell LW. 1963. Plasma lipid fatty acids during fasting.
American Journal of Clinical Nutrition 13: 226-23 1.
Innis SM, Kuhnlcin HV. 1987. The fatty acid composition of northern Canadian marine and
terrestrial mammals. Acta Medica Scandinavica 222: 105- 109.
IUPAC-IUB Commission on Biochemical Nomenclature. 1977. The nomenclature of lipids:
recommendations 1976. Lipids 12: 455-468.
Jungas RL, Halperin ML, Brosnan JT. 1992. Quantitative analysis of amino acid oxidation and
related gluconeogenesis in humans. Physiological Reviews 72: 419-448.
Kaduce TL, Spector AA, Folk GE, Jr. 1981. Characterization of the plasma lipids and lipoproteins
of the polar bear. Comparative Biochemistry and Physiology 69B: 541-545.
Kissebah AH, Krakower GR. 1994. Regional adiposity and morbidity. Physiological Reviews 74:
761-811.
Kleiber M. 1975. The Fire of Life: An Introduction to Animal Energetics. Robert E. Kreiger, New
York. 454 pp.

Klein S, Young VR, Blackburn GL, Bistrian BR, Wolfe RR. 1986. Palmi* and glycerol kinetics
during bricg stamation in normal weight young adult and elderly subjects. Journal of
Clinical Investigation 78: 928-933.
Kleinbaum DG, Kupper LL. 1978. Applied Regression Analysis and Other Multivariable Methods.
Duxbury Press, Boston, Massachusetts. 556 pp.
Kolenosky GB, Lunn NJ, Greenwood CI, Abraham KF. 1989. Estimating the weight of polar bears
from body measurements. Journal of Wildlife Management 53: 188-190.
Korte JJ, Salo WL, Cabrcra VM. Wright PA, Felskie A, Anderson PM. 1997. Expression of
czubamoyl-phosphate synthetase Ill mRNA during the early stages of development and in
muscle of adult rainbow trout (Oncorhynchus mykiss). Journal of Biological Chemistry
272: 6270-6277.
Krilowicz BL. 1985. Ketone body metabolism in a ground squiml during hibernation and fasting.
American Journal of Physiology 249: R462-R470.
Latour PB. 198 1. Spatial relationships and behaviour of polar bears (Ursus maririmus Phipps)
concentrated on land during the ice-free season of Hudson Bay. Canadian Journal of
Zoo10g~ 59: 1763- 1764.
Leeuwenburgh C, Hollander J , Leichtweis S, Griffiths M, Gore M, Ji LL. 1997. Adaptations of
glutathione antioxidant system to endurance training are tissue and musde fiber specific.
American Journal of Physiology 272: R363-R369.
Lewis GF, O'Meara NM, Soltys PA, Blackman JD, Iverius PH, Druetzler AF, Getz GS, Polonsky
KS. 1990. Postprandial lipoprotein metabolism in normal and obese subjects: comparison
after the vitamin A fat-loading test. Journal of Clinical Endocrinology and Metabolism 7 1 :
1041-1050.
Lin ECC. 1977. Glycerol utilization and its regulation in mammals. Annual Review of
Biochemistry 46: 765-795.

Lin HC, Thurmon JC, Benson GJ, Tranquilli WJ. 1993. ~elazol' - a review of its pharmacology
and use in veterinary medicine. Journal of Veterinary Pharmacology and Therapeutics 16:
383-4 18.
Lloyd-Still JD, Bibus DM, Powers CA, Johnson SB. Holman RT. 1996. Essential fatty acid
deficiency and predisposition to lung disease in cystic fibrosis. Acta Paediatrica 85: 1426-
1432.
L0n0 0. 1972. Polar bear fetuses found in Svalbard. Norsk Polarinstitutt Arbok 149: 294-298.
Lunn NJ, Stirling I, Andriashek D, Kolenosky GB. 1997. Re-estimating the size of the polar bear
population in western Hudson Bay. Arctic 50: 234-240.
Margolis S. Vaughn M. 1962. Alpha-gl ycerophosphate synthesis and breakdown in homogenates of
adipose tissue. Journal of Biological ~hemi'suy 237: 44-48.
Marliss EB, Aoki 'lT, Unger RH, Soeldner JS, Cahill GF Jr. 1970. Glucagon levels and metabolic
effects in fasting. Journal of Clinical Investigation 49: 2256-2270.
Matsuzaki S, Suzuki M, Hamana K. 198 1. A possible role of arginasc in the regulation of
polyamine biosynthesis in the rat thyroid. Acta Endocrinologica 98: 57-61.
Mayes PA. 1993. Cholesterol synthesis, transport, and excretion. In: Mumay RK, Granner DK,
Mayes PA, Rodwell VW (eds.). Harper's Biochemistry, 23rd Edition. Appleton and
Lange, Norwalk, Connecticut. p. 266-278.
Meijer AJ. 1995. Urea synthesis in mammals. In Walsh PJ, Wright PA (eds). Nitrogen
Metabolism and Excretion. CRC Press, Inc., Boca Raton, Florida, USA. pp. 193-204.
Messier F, Crete M. 1984. Body condition and population regulation by food resources in moose.
Oecologia 65: 44-50.
Minisola S, Antonelli R, Mazzuoli G. 1985. Clinical significance of h e plasma hydroxyproline
measurement in metabolic bone disease. Journal of Clinical Chemistry and Clinical
Biochemistry 23: 5 15-5 19.
Moms SM. 1992. Regulation of enzymes of urea and arginine synthesis. Annual Review of
Nutrition 12: 81-101.

Nelson RA, Beck TDI, Sttiger DL. 1984. Ratio of strum urea and serum crcatinine in wild black
bears. Science 226: 84 1-842.
Nelson RA, Folk GE, Jr., Pfeiffer EW, Craighead JJ, Jonkel CJ. Steiger DL. 1983. Behavior,
biochemistry, and hibernation in black, grizzly, and polar bears. International Conference
on Bear Research and Management 5: 284-290.
Nelson RA, Jones JD, Wahner HW, McGiH DB, Code CF. 1975. Nitrogen metabolism in bears:
urea metabolism in summer starvation and in winter sleep and role of urinary bladder in
water and nitrogen conservation. Mayo Clinic Proceedings 50: 14 t - 146
Nordoy FS. Ingebretsen OC, Blix AS. 1990. Depressed metabolism and low protein catabolism in
fasting grey sed pups. Acta Physioiogica Scandinavica 139: 36 1-36!).
Ogburn PL, Sharp H, Lloyd-Still JD, Johnson SB, Holman RT. 1982. Abnormal polyunsaturated
fatty acid patterns of serum lipids in Reye's syndrome. Proceedings of the National
Academy of Sciences USA 79: 908-9 1 1.
Owen OE, Felig P, Morgan AP, Wahrcn 3, Cahill GF Jr. 1969. Liver and kidney metabolism during
prolonged starvation. The Journal of Clinical Investigation 48: 574-583.
Owen OE, Smalley KJ, D'Alessio DA, Mozzoli MA, Dawson EK. 1998. Rotein, fat, and
carbohydrate requirements during starvation: anaplerosis and cataplerosis. American
Journal of Clinical Nutrition 68: 12-34.
Palmer SS, Nelson RA, Ramsay MA, Stirling I, Bahr JM. 1988. Annual changes in serum sex
steroids in male and female black (Ursus americanus) and polar (Ursus moritimus) bears.
Biology of Reproduction 38: 1044- 1050.
Parvin R, Pande SV. 1977. Microdetermination of (-) carnitine and carnitine acetyl mansferase.
Analytical Biochemistry 79: 190-201.
Paulsrud JR, Pensler L, Whitten CF, Stewart S, Holman RT. 1972. Essential fatty acid deficiency in
infants induced by fat-free intravenous feeding. American Journal of Clinical Nutrition 25:
897-904.

Peinado VI, Fernandez-Arias A, Viscor G, Palomeque J. 1993. Hematology of Spanish ibex (Copra
p y r w k a hispmica) festrained by physical and chemical means. The Veterinary Record
132: 580-583.
Persico PA, Cerchio GM, Jeffay H. 1975. Glycerokinase in mammalian adipose tissue: stimulation
by lipogenic substances. American Journal of Physiology 228: 1868- 1874.
Phinney SD. Davis ffi, Johnson SB, Holman RT. 1991. Obesity and weight loss alter serum
polyunsaturated lipids in humans. American Journal of Clinical Nutrition 53: 83 1-838.
Phinney SD, Tang AB, Johnson SB, Holman RT. 1990. Reduced adipose 18:303 with weight loss
by very low calorie dieting. Lipids 25: 798-806.
Piersma T, Davidson C. 1991. Confusions of mass and size. Auk 108: 44 1-444.
Previs SF, Martin SK, Hazey JW, Soloviev MV, Keating AP, Lucas D, David F, Koshy J,
Kirschenbaum DW, Tserng K-Y, Brunengrabcr H. 1996. Contributions of liver and
kidneys to glycerol production and utilization in the dog. American Journal of Physiology
271: E l 118-El 124.
Puente J, Castellon E, Sapag-Hagar M. 1982. Glutathione and gamma-glutamyl cycle enzymes in
rat mammary gland. Experientia 38: 53 1-532.
Puppione DL, Chmngundla S. 1994. A microprecipitation technique suitable for measuring a-
lipoprotein cholesterol. Lipids 29: 595-597.
Rahmatullah M, Boyde TRC. 1980. Improvements in the determination of urea using diacetyl
monoxime; methods with and without deproteinisation. Clinica Chimica Acta 107: 3-9.
Ramsay MA, Nelson RA, Stirling I. 1991. Seasonal changes in the ratio of serum urea to creatinine
in feeding and fasting polar bears. Canadian Journal of Zoology 69: 298-302.
Ramsay MA, Stirling I. 1982. Reproductive biology and ecology of female polar bears in western
Hudson Bay. Naturaliste Canadien 109: 94 1-946.
Ramsay MA, Stirling I. 1988. Reproductive biology and ecology of female polar bears (Ursw
maritimus). Journal of Zoology (London) 2 14: 60 1-634.
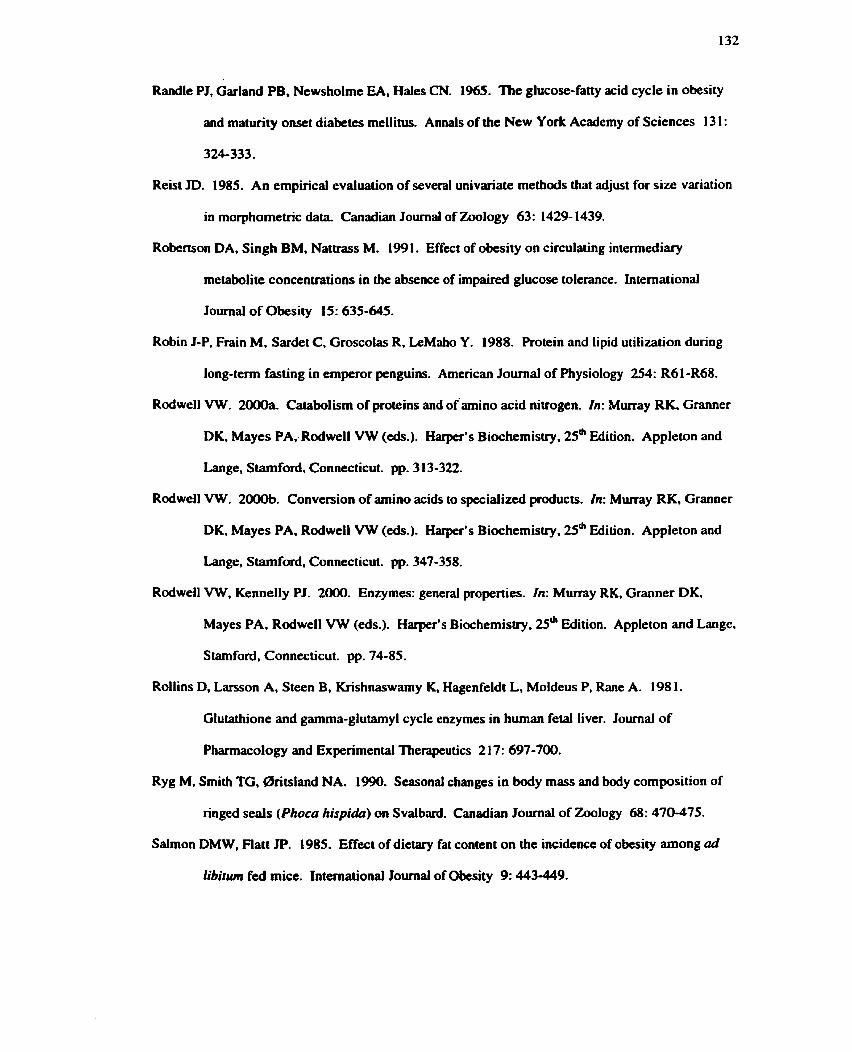
Randle PJ, Garland PB, Newsholme EA, Hales CN. 1965. The glucose-fatty acid cycle in obesity
and maturity onset diabetes mellitus. Annals of the New York Academy of Sciences 13 1 :
324-333.
Reist JD. 1985. An empirical evaluation of several univariate methods that adjust for size variation
in morphometric data. Canadian Journal of Zoology 63: 1429- 1439.
Robertson DA, Singh BM, Nattrass M. 199 1. Effect of obesity on circulating intermediary
metabolite concentrations in the absence of impaired glucose tolerance. International
Journal of Obesity 15: 635-645.
Robin J-P, Frain M, Sardet C, Groscolas R. LeMaho Y. 1988. Rotein and lipid utilization during
long-term fasting in emperor penguins. American Journal of Physiology 254: R6 1 -R68.
Rodwell VW. 2000a. Catabolism of proteins and of amino acid nitrogen. In: Murray RK. Granner
DK, Mayes PA,-Rodwell VW (cds.). Harper's Biochemistry, 25* Edition. Appleton and
Lange, Stamford, Connecticut. pp. 3 13-322.
Rodwell VW. 2000b. Conversion of amino acids to specialized products. In: Murray RK. Granner
DK, Mayes PA, Rodwell VW (eds.). Harper's Biochemistry, 2s4 Edition. Appleton and
Lange, Stamford, Connecticut. pp. 347-358.
Rodwell VW, Kennelly PJ. 2000. Enzymes: general properties. In: Murray RK, Granner DK,
Mayes PA, Rodwell V W (eds.). Harper's Biochemistry. 25* Edition. Appleton and Lange,
Stamford, Connecticut. pp. 74-85.
Rollins D, Larsson A, Steen B. Krishnaswamy K, Hagenfeldt L, Moldeus P, Rane A. 198 1.
Glutathione and gamma-glutamyl cycle enzymes in human fetal liver. Journal of
Pharmacology and Experimental Therapeutics 2 17: 697-700.
Ryg M, Smith TG, Oritsland NA. 1990. Seasonal changes in body mass and body composition of
ringed seals (Phoca hispi&) on Svalbard. Canadian Journal of Zoology 68: 470-475.
Salmon DMW, Hatt JP. 1985. Effect of dietary fat content on the incidence of obesity among ad
libitum fed mice. International Journal of Obesity 9: 443-449.

Schimke RT. 1%2. Differential effects of fasting and protein-free diets on levels of urea cycle
enzymes in rat liver. Journal of Biological Chemistry 237: 1921- 1924.
Schutz Y, Flatt JP, Jdquier E. 1989. Failure of dietary fat intake to promote fat oxidation: a factor
favoring the development of obesity. American Journal of Clinical Nutrition 50: 307-3 14.
Seidelin KN, Myrup B, Fischer-Hansen B. 1992. fi-3 fatty acids in adipose tissue and coronary
artery disease are inversely related. American Journal of Clinical Nutrition 55: 1 1 1 7- 1 1 19.
Seltzer HS, Allen EW, Herron AL, Jr., Brcnnan MT. 1967. Insulin secretion in response to
glycemic stimulus: relation of delayed initial release to carbohydrate intolerance in mild
diabetes mellitus. Journal of Clinical Investigation 46: 323-335.
Sinclair HM. 1982. The relative importance of essential fatty acids of the linoleic and Linolenic
families: studies with an Eskimo diet. Rogress in Lipid Research 20: 897-899.
Siscovick DS, Raghunathan TE, King I, Weinmann S, Wicklund KG, Albright J, Bovbjerg V,
Arbogast P, Smith H, Kushi LH et al. 1995. Dietary intake and cell membrane levels of
long-chain g-3 polyunsaturated fatty acids and the risk of primary cardiac arrest. Journal of
the American Medical Association 274: 1363- 1367.
Smith PK, Krohn RI, Hermanson GT, Mallia AK, Gartncr FH, Provenzano MD, Fujimoto EK,
Goeke NM, Olson BJ, Klenk DC. 1985. Measurement of protein using bicinchoninic acid.
Analytical Biochemistry 150: 76-85.
Smith TG. 1980. Polar bear predation of ringed and bearded seals in the land-fast sea ice habitat.
Canadian Journal of Zoology 58: 2201-2209.
Stem JS, Hirsch 1, Drewnowski A, Sullivan C, Johnson PR, Cohn CK. 1983. Glycerolkinase
activity in adipose tissue of obese rats and mice: effects of diet composition. Journal of
Nutrition 1 1 3: 7 14-720.
Stevens U, Zentall SS, Deck JL, Abate ML, Watkins BA, Lipp SR, Burgess JR. 1995. Essential
fatty acid metabolism in boys with attention-deficit hyperactivity disorder. American
Journal of Clinical Nutrition 62: 761-768.

Stirling I. 1974. Midsummer observations on the behavior of wild polar bears (Ursw matifimus).
Canadian Journal of Zoology 52: 1191-1 198.
Stirling I, Archibald WR. 1977. Aspects of predation of seals by polar bears in the eastern Beaufort
Sea. Joumal of the Fisheries Research Board of Canada 34: 1 126- 1 129.
Stirling I, Lunn NJ, Iacoua J. 1999. Long-term trends in the population ecology of polar bears in
western Hudson Bay in relation to climatic change. Arctic 52: 294-306.
Stirling I, McEwan EH. 1975. The caloric value of whole ringed seals (Phoca hispi&) in relation
to polar bear (Ursw moritimus) ecology and hunting behavior. Canadian Journal of
Zoology 53: 1021-1027.
Stirling I, 0ritsland NA. 1995. Relationships between estimates of ringed seal (Phoca hispida) and
polar bear (Ursur maritimus) populations in the Canadian Arctic. Canadian Journal of
Fisheries and Aquatic Sciences 52: 2594-261 2.
Stirling I, Spencer C, Andriashek D. 1989. Immobilization of polar bears (Ursus maritimus) with
~elazol" in the Canadian Arctic. Journal of Wildlife Diseases 25: 159- 168.
Stoneberg RP, Jonkel CJ. 1966. Age determination of black bears by cementum layers. The
Journal of Wildlife Management 30: 41 1-414.
Streja DA, Marliss EB, Steiner G. 1977. The effects of prolonged fasting on plasma uiglyceride
kinetics in man. Metabolism 26: 505-5 16.
Sugden MC, Orfali KA, Holness MJ. 1995. The pyruvate dehydrogenase complex: nutrient control
and the pathogenesis of insulin resistance. Journal of Nutrition 125: 1746s- 17523.
Thomas DC, Russell RH, Broughton E, Madore PL. 1976. Investigations of Peary caribou
populations on Canadian Arctic islands, March-April 1975. Canadian Wildlife Service
Progress Note No. 64. 13 pp.
Tietz NW, Finley PR, Ruden EL. 1990. Clinical Guide to Laboratory Tests, 2nd Edition. W.B.
Saunders Company, Philadelphia, Pennsylvania. 93 1 pp.
Umrninger BL. 1975. Body size and whole blood sugar concentrations in mammals. Comparative
Biochemistry and Physiology 52A: 455-458.
Ungcr RH. 197 1. Glucagon and the insulin:glucagon ratio in diabetes and other catabolic illnesses.
Diabetes 20: 834-838.
Ury HK. 1976. A comparison of four procedures for multiple comparisons among means (pairwise
contrasts) for arbitrary sample sizes. Technomttrics 18: 89-97.
Van Heerden J, Burroughs REJ, Dauth J, Dreyer MJ. 1991. Immobilization of wild dogs (Lycaon
pictus) with a tiletarnine hydrochloride/zolazepam hydrochloride combination and
subsequent evaluation of selected blood chemistry parameters. Journal of Wildlife Diseases
27: 225-229.
Vansan t G, Van Gad L, Van Acker K. De Leeuw I. 1 99 1. Importance of glucagon as a determinant
of resting metabolic rate and glucose-induced thennogenesis in obese women. Metabolism
40: 672-675.
Verrillo A, de Teresa A, Martino C, di Chiara G, Vemllo L. 1988. Somatostatin response to
glucose before and after prolonged fasting in lean and obese non-diabetic subjects.
Regulatory Peptides 2 1 : 185- 195.
Vijayan MM, Ballanty ne JS, hatherland JF. 199 1. Cortisol-induced changes in some aspects of the
intermediary metabolism of Salvelinus fontinalis. General and Comparative Endocrinology
82: 476-486.
Vijayan MM, Pereira C, Grau EG, Iwama GK. 1997. Metabolic responses associated with
confinement stress in tilapia: the role of cortisol. Comparative Biochemistry and
Physiology 1 16C: 89-95.
Viiia JR, Palacin M, Puertes IR, Hernandez R, Viiia J. 1989. Role of the yglutamyl cycle in the
regulation of amino acid translocation. American Journal of Physiology 257: E916E922.
Walker M. 1995. Obesity, insulin resistance, and its link to non-insulin-dependent diabetes mellitus.
Metabolism 44: 18-20.
Warnick GR. 1986. Enzymatic methods for quantification of lipoprotein lipids. Methods of
Enymology 129: 101-123.

Watts PD. 1983. Ecological energetics of denning p la t bears and related species. DSc thesis,
University of Oslo, Oslo, Norway.
Watts PD, Hansen SE. 1987. Cyclic starvation as a reproductive strategy in the polar bear.
Symposium of the Zoological Society of London 57: 305-3 18.
Weber J-M, Roberts TJ, Taylor CR. 1993. Mismatch between lipid mobilization and oxidation:
glycerol kinetics in running African goats. American Journal of Physiology 33: R797-
R803.
Wolfe RR. 1992. Radioactive and Stable Isotope Tracers in Biomedicine - Principles and Practice
of Kinetic Analysis. Wiley-Liss, Inc., New York, New York. 47 1 pp.
Wright PA, Felskie A, Anderson PM. 1995. Induction of ornithine-urea cycle enzymes and nitrogen
metabolism and excretion in rainbow trout (Oncorhynchus mykiss) during early life stages.
Journal of Experimental Biology 198: 127- 135.
Wright PA, Packer RK, Garcia-Perez A, Kncpper MA. 1992. Time course of renal glutamate
dehydrogenase induction during -1 loading in rats. American Journal of Physiology
262: F999-F 1006.
Yeh I, Tam CF, Catuira E, J.,e IT, Papa V, Pena L, Vasquez M, Vu C, Wang S, Lopez GA. 1995.
Changes in various plasma lipid components, glucose, and insulin in Spermophilus lateralis
during hibernation- Comparative Biochemistry and PhysioIogy 1 118: 651-663.
Young VR, Scrimshaw NS. 197 1. The physiology of starvation. Scientific American 225: 14-21.
Zar M. 1996. Biostatistical Analysis, 3rd Edition. Rentice Hall, Upper Saddle River, New Jersey.
662 pp.

APPENDIX A. THE SOLUBILITY OF WATER IN LJPID AND ITS EFFECT ON THE
ESTIMATION OF BODY COMPOSITION IN MARINE AND TERRESTRIAL BEARS
Al . Introduction
The assessment of body composition requires knowledge of the lipid (or fat) and lean body
(or non-fat) mass of an animal which, when added together, equal its total body mass. Because water
is relatively insoluble in lipid. most body water occurs in the lean body mass. Thus, by measuring
the body water content and the total body mass of an animal, and by knowing the relationship
between its body water and body lipid content, the body composition of an animal can be estimated
(Sheng and Huggins 1979, Robbins 1993). On this basis, measurement of body water content by
isotope dilution has been used to estimate body composition in a variety of animals (Rumpler et al.
1987, Reilly and Fedak 1990, Farley and Robbins 1994, Hilderbrand et al. 1998).
The relationship between M y water and body lipid content varies among species, and
several authors have recommended that the estimation of body composition in live animals be based
on data derived solely from the species under investigation (Sheng and Huggins 1979, Reitly and
Fedak 1990, Gales et al. 1994). Sources of interspecific variation include differences in body
conformation and in the biochemical composition of lean body mass and adipose tissue (Dawson et
al. 1972, Sheng and Huggins 1979, Gales et al. 1994). The biochemical composition of adipose
tissue also can vary within a species, especially with regard to water and lipid content (Worthy and
Lavigne 1983, Lockyer 199 1, Bowen ct al. 1992, Gales et al. 1994). Adipose tissue may account for
a significant proportion of total body mass in some mammals (e.g., 20 to 50% in seals, whales, and
bears: McLarcn 1 958, Ryg et a]. 1990, Lockyer 199 1, Pond et al. 1992, Pond and Ramsay 1992).
Thus, factors that influence the water content of adipose tissue may have important implications for
estimation of body composition based on body water content and total body mass.

The insolubility of water in lipid is not absolute. A small but variable q u a n t i ~ of water may
be mixed in lipid, depending on temperature and the carbon-chain length of the constituent fatty
acids (Ralston and Hoem 1942). The solubility of water in lipid decreases as the chain length of the
constituent fatty acids increases. It follows that fatty acid composition may significantly influence
the proportions of water and lipid in adipose tissue. Fatty acid composition in adipose tissue is
influenced by diet (Innis and Kuhnlein 1987). Fatty acids in marine food webs tend to be longer than
fatty acids in terrestrial food webs (Brockerhoff et al. 1966, Sargent 1976, Innis and Kuhnlein 1987,
Rouvinen et al. 1992). Therefore, the water content (relative to the lipid content) of adipose tissue in
mammals consuming food of marine origin should be less than that of mammals consuming food of
terrestrial origin. To test this hypothesis, the water and lipid content of adipose tissue, the fatty acid
composition of adipose tissue, and the body water and body lipid content were compared among
polar bears (Ursus maririmus), brown bears (U. arctos), and black bears (U. americanrcs). Polar
bears feed on marine organisms while black and brown bears feed on terrestrial organisms (Jonkel
and McTaggart-Cowan 197 1, Stifling and McEwan 1975, Smith 1980, Hellgren et al. 1989). These
comparisons were used to determine whether or not differences in the relationship between water and
lipid content between marine and terrestrial bears could significantly affect the calculation of body
composition in bears by means of isotope dilution.
A2. Materials and methods
Details of the sources of polar and black bears used for the determination of adipose water
(AWC) and adipose lipid content (ALC) and fatty acid composition of adipose tissue have been
described previously in Cattet (1988) and Cattet (1990). Subcutaneous adipose tissue (40 to 80 g)
was collected From the mid-dorsum of 25 polar bears and 25 black bears from September 1984 to
November 1986. Immediately following collection, samples were sealed in air-tight plastic bags and
frozen at -15°C. Duplicate subsamples (10 to 20 g) of adipose tissue from each bear were
homogenized and freeze-dried to constant weight to determine AWC. The ALC was determined by
extracting neutral lipids from the dried homogenate for 4 hours in a Soxhlet apparatus, with

petroleum ether as the solvent (AOAC 1980). Subsamples of Frozen adipose tissue were randomly
selected from ten animals of each species and submitted to the Department of Agricultural, Food and
Nutritional Science, University of Alberta, for lipid separation and determination of fatty acid
composition by gas chromatography (Cherian et al. 1995). Mean chain length (MCL) was calculated
from the fatty acid profile of each animal using the equation:
MCL = C(CL x Na) (Eiqn. AI)
where CL is the carbon-chain length from 14 to 22, and Nm is the quantity of fatty acids at a specific
chain length as a proportion of total fatty acid (Holman et al. 199 1).
Values for the body water (BWC) and body lipid content (BLC) of five polar bears were
derived from Watts (1983). and values for six polar bears and five black bears were derived from
Cattet (1988). Bears used in the former study were adult females; those used in the latter study were
of both sexes, and included cubs and adults. In both studies, bears were killed either under a
government management program or for subsistence. After death, bears were weighed to f 0.5 kg
and d l ingesta were removed from the gastrointestinal tract. The ingesta-free carcass and viscera
were then double-wrapped in plastic, weighed, and stored for 2 weeks to 6 months at -15°C. Prior to
determining BWC and BLC, the carcass and viscera were re-weighed to determine water loss during
storage. All tissues were then homogenized in a commercial whole-body grinder, the homogenate
being passed through the grinder three times to ensure thorough mixing. Subsamples of homogenate
(300 to 500 g) from each animal were collected for water and lipid analysis. The BWC was
determined by weighing, freeze-drying, re-weighing subsamples, and correcting for dehydration
during storage. The dried homogenate was finely ground with dry ice in a Wiley Mill and used for
the lipid analysis. In the study by Watts (1983). total lipids were extracted for 18 hours using a
Soxhlet apparatus with a 1:2 chloroform-methanol mixture as the solvent (Folch et al. 1957). In the
study by Cattet (1988). only neutral lipids were extracted using the method described above for
adipose tissue samples. Therefore, to estimate total lipid content of bears in the latter study, a

correction factor was added to the neutral lipid content based on the observation that polar lipids
account for approximately 2-58 of total lipid in lean body tissues and 0.4% of total lipid in adipose
tissue (Worthy and Lavigne 1983). All assays were carried out in duplicate and mean values were
used in all subsequent calculations. Additional comparative data for the BWC and BLC of 13 black
bears and 6 brown bears were derived from Farlcy and Robbins (1 994).
All data were statistically analyzed using SPSS@ 6.1 for windowse (SPSS Inc., Chicago.
Illinois, USA). Carbon-chain length and MCL values were compared between polar and black bears
using a t-test for two independent samples (Zar 19%). The relationship between AWC and ALC.
and between BWC and BLC, was described using simple linear regression. Slopes and intercepts for
regression models were compared using small sample t-tests for parallelism and common intercept,
respectively (Kleinbaum and Kupper 1978). Where slopes and intercepts did not differ significantly
between two data sets, data were pooled to re-calculate a common regression model. For most
statistical tests. significance was assigned when the probability of a Type I error was equal to or less
than 0.05. When comparing carbon-chain length between polar and black bears, the interdependency
of the mean carbon-chain length values in each species warranted a more conservative value for
statistical significance @ 5 0.007), which was calculated by using the ~unn-$id* method (Ury
1976). All results are reported as mean f standard deviation (SD).
A3. R d t s
The fatty acid composition of subcutaneous adipose tissue differed significantly between
polar and black bears (Fig. Al). Myristic acid (C14:O) and fatty acids of 20 and 22 carbons were
higher in polar bears, whereas fatty acids of 18 carbons predominated the profile of black bears. The
relative abundance of long-chain fatty acids in polar bears was reflected by a significantly greater
MCL in this species than that calculated for black btars (polar bears: 18.0 f 0.2 versus black bears:
17.1 f 0.1; t = 10.6, p < 0.001). By plotting the mean MCL value for each species on a solubility
curve. water content in the adipose tissue (AWC) of polar bears was predicted to be approximately
71% of the AWC in black bears at equal lipid content (Fig. A2).


Mean Carbon-Chain Length
Figure A2. Comparison of relative solubility of water in fatty acid with the mean carbon-chain length (MCL) of subcutaneous adipose tissue from 10 polar bears and from 10 black bears. The solubility curve is adapted from Table I1 in Ralston and Hoerr (1942). Shaded areas represent the range of relative solubility values from the smallest to the largest MCL value for each individual bear within each species as labeled.

The relationship between AWC and ALC was different in polar and black bears (Fig. A3).
Although there was no significant difference between species in the regression slopes ( r = 1-57. p >
0.05), there was in the intercepts (t = 2.13, p < 0.05). From the regressions for each species. the
AWC of polar bears was calculated to be approximately 75% of the AWC for black bears at equal
lipid content.
To compare the M y water (BWC) and body lipid content (BLC) data of Watts (1983) and
Cattet (1988) with that of Fariey and Robbins (1994). it was necessary first to make an adjustment to
the values of Cattet (1988) as the combined mass of chemical components (water, protein, lipid. and
ash) measured in this study accounted for only 97.9 f 1.9% of the total body mass (TBM) of polar
bears, and 98.3 f 0.7% of the TBM of black bears. The difference between TBM and the combined
mass of the chemical components was assumed to be entirely due to evaporative water loss. The
proportions of water, protein, lipid, and ash in each bear were multiplied by the TBM of each bear to
determine the mass for each component. The summed mass of chemical components was then
subtracted from the TBM. and this difference was added to the water mass. Following this, the
proportions of chemical components were re-calculated with the adjusted water mass such that the
combined proportions of chemical components in each bear accounted for 100% of their TBM.
Water loss was assumed to be negligible in the studies of Watts (1983) and of Farley and Robbins
(1994) as the chemical components accounted for 99.3 f 2.7% and 100.7 f 0.6% of the TBM of
bears sampled in the respective studies.
Linear regression models describing the relationship between BWC and BLC were derived
separately for each set of data and compared for significant differences between slopes and between
intercepts (Table Al). Data sets with equal slopes and equal intercepts were pooled to derive a
common model. The slope for marine (polar) bears differed significantly from that calculated for
terrestrial (black and brown) bears. The different slopes indicated that, as BLC increased within
each group of bears, the difference in B WC between groups also increased (Fig. A4).
The relationships between BWC and BLC for marine and terrestrial bears were transposed
[marine - BLC (8) = 82.83 - I. I 1-BWC (%); terrestrial - BLC (%) = 91.93 - 1.24-BWC (%)I,

a Black Bears AWC = 50.4 - 0.48.ALC, n = 25 R2 = 0.69, SE = 6.6, p < 0.001
Polar Bears AWC = 37.9 - 0.34*ALC, n = 25
Lipid Content of Adipose Tissue (%) Figurc A3. The relationship between the water (AWC) and lipid content (ALC) of adipose tissue in 25 polar bears (0 ) and 25 black bears ( 0 ). The coefficient of multiple determination is indicated by R2 and the standard error of the predicted mean is indicated by SE.

0 Terrestrial Bears
\ BWC = 73.51 - 0.78-BWL, R2 = 0.98
BWC = 74.19 - 0.88BWL, SE= 1.3, n=11
35 0 10 20 30 40 50
Body Lipid Content (%)
Figure A4. The relationship between the body water (BWC) and the body lipid content (BLC) in marine (polar) bears and terrestrial (black and brown) bears. Polar bear data are from Watts (1983) (n = 5; 0 ) and Cattet (1988) (n = 6; 0 ). Black bear data a n from Catkt (1988) (n = 5;. ) and a combination of black (n = 13) and brown bear (n = 6) data are from Farley and Robbins (1994) ( ). The coefficient of multiple determination is indicated by R2 and the standard error of the predicted mean is indicated by SE.

because measurements of BWC are frequently used to predict BLC in studies of body composition.
The 95% prediction intervals for BLC in each group were then calculated and plotted on a graph to
assess the amount of overlap in the prediction interval between groups of bears across a range of
BWC values from 35% to 70% of TBM (Fig. AS). The prediction interval for marine bears was
lower than that for terrestrial bears across most of the range of BWC values. The prediction
intervals overlapped from 52% to 84% when BWC was high (2 52.5% of TBM), but only from 24%
to 52% when BWC was low (I 52.5% of TBM). When BWC S 38.5% of TBM, the predicted BLC
value for terrestrial bears was greater than the upper limit of the 95% prediction interval for BLC in
marine bears. Conversely, when BWC S 40.496, the predicted BLC value for marine bears was less
than the lower limit of the 95% prediction interval for BLC in terrestrial bears.
A4. Discussion
Two observations from this analysis support the hypothesis that the water content of
adipose tissue (AWC) in mammals consuming a marine diet should be lower than that in mammals
consuming a terrestriai diet. First, the AWC in marine (polar) bears was significantly less than that
in terrestrial (black) bears at equal lipid content (ALC) (Fig. A3). Second, the difference in AWC
calculated from the regression equations for each group was similar to that predicted by the solubility
of water in lipid at different MCL (Fig. A2) [i.e., the AWC of marine bears was predicted to be 75%
(by regression) and 7 1 % (by solubility curve) of the AWC of terrestrial bears at equal lipid content].
Nevertheless, the relationship between AWC and ALC varied sufficiently among individuals within
both groups of bears to indicate other undetermined factors also may have influenced the
relationship. Fwther testing of the hypothesis would require controlled experimentation with
animals similar in all respects (e.g., species, sex, and age) except diet (marine- vs. terrestrial-based).
The hypothesis and supporting data have important practical implications for estimating
body composition (fat mass and lean body mass) in bears based on the measurement of body water
content (BWC). First, if fatty acid composition affects AWC as the results suggest, it follows that
fatty acid composition also may affect BWC, especially in fat bears. In the comparison of body
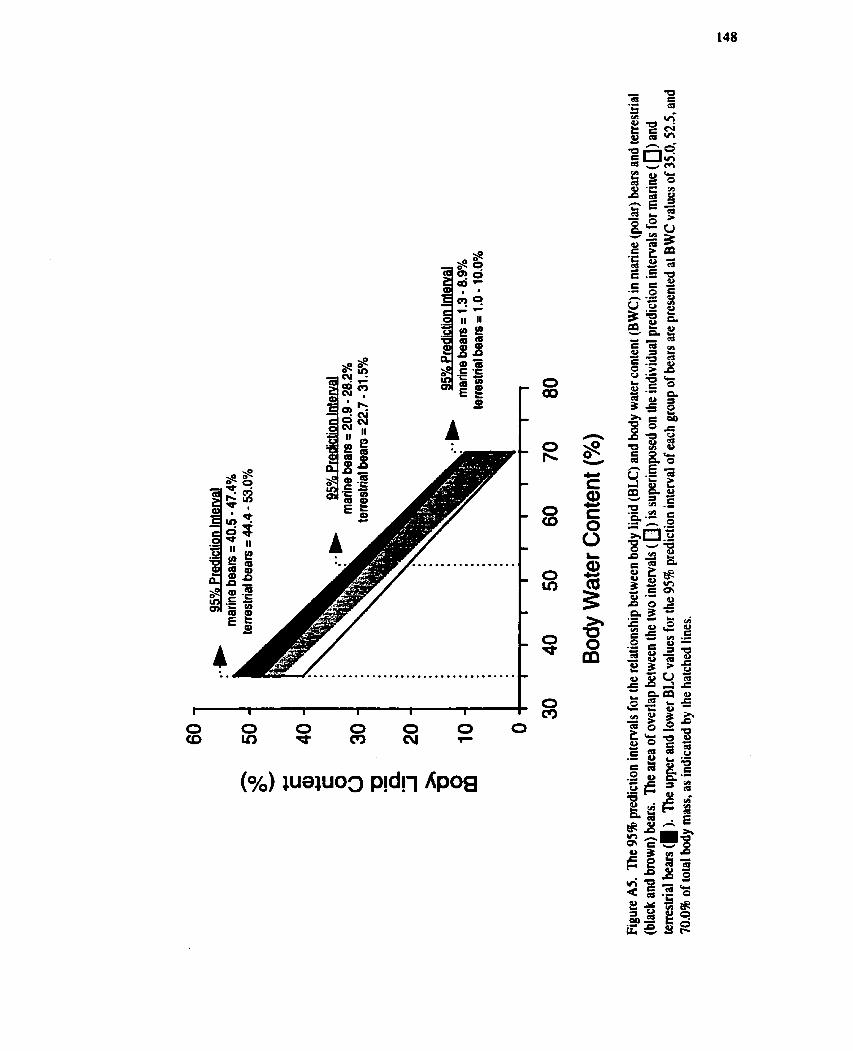
fatty acid composition also may affect BWC, especially in fat bears. In the comparison of body
composition data, differences in BWC between marine and ternstrial (black and brown) bears
became more apparent as body lipid content (BLC) increased (Table A1 and Fig. A4). The pattern
of difference was consistent with the hypothesis of this study, but any conclusions from these results
must be considered tentative, since variation in other factors, including methodology, also may have
had significant effect on the analysis.
A second implication is that the use of an isotope dilution model developed from the
relationship between BLC and BWC measured in one species may lead to inaccurate estimates of
body composition if applied to a different species, especially if there are large differences in dietary
fatty acid composition between those spccies. This was illustrated by plotting the 95% prediction
intervals for BLC in marine and terrestrial bears on a graph to assessing the amount of overlap in the
prediction interval between groups (Fig. As). When BWC was equal to 70% of TBM, the BLC
values predicted by the regression equations for each group were equal (i.e., 5.1 3% of TBM). At
BWC values lower than 704b of TBM, however, the predicted BLC values differed between groups
such that the magnitude of difference became greater as the BWC value became less. Thus, when
BWC was equal to 35% of TBM, the regression equation for terresmal bears significantly over-
predicted the BLC in marine bears (i.e., 48.5% of TBM predicted by equation for terrestrial bears
versus the 95% prediction interval of 40.5% to 47.4% of TBM for marine bears). Conversely, the
regression equation for marine bears significantly under-predicted the BLC in terrestrial bears (i-e.,
44.0% of TBM predicted by equation for marine bears versus the 95% prediction interval of 44.4%
to 53.0% of TBM for terrestrial bears). In the application of isotope dilution to estimate body
composition in bears, this error in the prediction of BLC could be increased if the relationship
between BWC as measured by freeze-drying, and BWC as predicted by isotope dilution, also differs
between groups of bears.
A final implication is that the accuracy of an isotope dilution model to estimate body
composition within a species may be affixed by variation in the fatty acid composition among
individual animals. The fatty acid composition of adipose tissue lipids (phospholipids, free fatty
acids, and triacylglycemls) in polar and blsrk bears is highly variable among individual animals
within each species (see Chapter 4), and probably reflects individual differences in diet selection and
in the metabolism of dietary and stored lipids. In this regard, the large 95% prediction intervals for
BLC in marine and terrestrial bears that were calculated in this study might be explained in part by
differences in fatty acid composition among individual bears within each group.
AS. Literature Cited
Association of Official Analytical Chemists. 1980. Official methods of analysis (13th edition).
Association of Analytical Chemists, Washington, D.C. Section 10.132.
Bowen WD, Oftcdal OT, Boness DJ. 1992. Mass and energy transfer during lactation in a small
phocid, the harbour seal ( P h u vitulim). Physiological Zoology 65: 844-8456
Brockettroff H, Hoyle RJ, Huang PC. 1%6. Positional distribution of fatty acids in the fats of a
polar bear and a seal. Canadian Journai of Biochemistry 44: 15 19- ISZ.
Cattet MRL. 1988. Aspects of physical condition in black bears and polar bears. MSc thesis,
University of Alberta, Edmonton. Alberta.
Cattet M. 1990. Predicting nutritional condition in black bears and polar bears on the basis of
morphological and physiological measurements. Canadian Journal of Zoology 68: 32-39.
Cattet MRL. Atkinson SN, Polischuk SC, Ramsay MA. 1997. Predicting body mass in polar bears:
is morphometry useful? Journal of Wildlife Management 61: 1083-1090.
Cherian G, Li SX, Sim JS. 1995. Dietary alpha-linolenic acid and laying hen strain: fatty acids of
liver. adipose tissue, white meat, dark meat, and egg yolk. Journal of Agricultural and Food
Chemistry 43: 2553-2559.
Dawson NJ, Stephenson SK, F d l i n e DK. 1972. Body composition of mice subjected to genetic
selection for different body proponions. Comparative Biochemistry and Physiology 42B:
679-69 1.
Farley SD, Robbins CI: 1994. Development of two methods to estimate body composition of
bears. Canadian Jounral of Zoology 72: 220-226.

Folch J, Lees M, Sloane-Stanley GH. 1957. A simple method for isolation and purification of total
lipids from animal tissues. Journal of Biological Chemistry 226: 497-509.
Gales R, Renouf D, Noseworthy E. 1994. Body composition of harp seals. Canadian Journal of
Zoology 72: 545-55 1.
Hellgren EC, Vaughn MR, Kirkpatrick RL. 1989. Seasonal patterns in physiology and nutrition of
black bears in Great Dismal Swamp, Virginia - North Carolina. Canadian Journal of
Zool~gy 67: 1837- 1850.
Hilderbrand GV, Farley SD, Robbins m. 1998. F'redicting body condition of bears via two field
methods. Journal of Wildlife Management 62: 406-409.
Innis SM, Kuhnlein HV. 1987. The fatty acid composition of Northern-Canadian marine and
terrestrial mammals. Acta Medica Scandinavica 222: 105- 109.
Holman RT, Johnson SB, Ogburn PL. 1991. Deficiency of essential fatty acids and membrane
fluidity during pregnancy and lactation. Proceedings of the National Academy of Sciences
USA 88: 48354839.
Jonkel CJ, McTaggart-Cowan I. 1971. The black bear in the spruce-fir forest. Wildlife Monograph
27.
Kleinbaum DG, Kupper LL. 1978. Applied Regression Analysis and Other Multivariable Methods.
Duxbury Ress, Boston, Massachusetts. 556 pp.
Lockyer C. 199 1. Body composition of the sperm whale, Physeter carodon, with special reference
to the possible functions of fat depots. Rit Fiskideildar 12(2): 1-24.
McLaren IA. 1958. The economics of seals in the eastern Canadian Arctic. Fisheries Research
Board of Canada Arctic Unit Circulation No. 1.
Pond CM, Mattacks CA, Colby RH, Ramsay MA. 1992. The anatomy, chemical composition, and
metabolism of adipose tissue in wild polar bears (Ursus maritimus). Canadian Journal of
Zoology 70: 326-34 1.
Pond CM, Rarnsay MA. 1992. Allometry of the distribution of adipose tissue in Carnivora.
Canadian Journal of Zoology 70: 342-347.

Ralston AW, Hoerr CW. 1942. The solubilities of the normal saturated fatty acids. Journal of
Organic Chemistry 7: !i46-555.
Reilly JJ, Fedak MA. 1990. Measurement of the body composition of living gray seals by hydrogen
isotope dilution. Journal of Applied Physiology 69: 885-89 1.
Robbins CT. 1993. Wildlife Feeding and Nutrition (2nd Edition). Academic Ress, Inc., New
York, New York. 352 pp.
Rouvinen K, Miikela J, Kiiskinen T, Nummela S. 1992. Accumulation of dietary fish fatty acids in
the body fat reserves of some carnivorous fur-bearing animals. Agricultural Science in
Finland 1 : 483489.
Rumpler WV, Allen ME, Ullrey DE. 1987. Body composition of white-tailed deer estimated by
deuterium oxide dilution. Canadian Journal of Zoology 65: 204-208.
Ryg M, Lydersen C, Markussen NH, Smith TG, Oritsland NA. 1990. Estimating the blubber
content of phocid seals. Canadian Journal of Fisheries and Aquatic Sciences 47: 1223-
1227.
Sargent JR. 1976. The structure. metabolism and function of lipids in marine organisms. In Malins
DC, Sargent JR (eds.). Biochemical and Biophysical Perspectives in Marine Biology,
Volume 3. Academic Ress, London, U.K. pp. 149-2 12.
Sheng HP, Huggins RA. 1979. A review of body composition studies with emphasis on total body
water and fat. The American Journal of Clinical Nutrition 32: 630-647.
Smith TG. 1980. Polar bear predation of ringed and bearded seals in the landfast ice habitat.
Canadian Journal of Zoology 58: 220 1-2209.
Stirling I, McEwan EH. 1975. The caloric value of whole ringed seals (Phoca hispi&) in relation
to polar bear (Ursu mcrritimus) ecology and hunting behavior. Canadian Journal of
Zoology 53: 1021-1027.
Ury HK. 1976. A comparison of four procedures for multiple comparisons among means (pairwise
contrasts) for arbitrary sample sizes. Tcchnometrics 18: 89-97.

Watts PD. 1983. Ecologicai energetics of &nning polar bears and rel* sptcies. DSc thesis,
University of Oslo, Oslo, Norway.
Worthy GAJ, Lavigne DM. 1983. Energetics of fasting and subsequent growth in weaned harp seal
pups, Phoca groenlandica. Canadian Journal of Zoology 61 : 447456.
Zar JH. 19%. Biostatistical Analysis, 3rd Edition. Rentice Hall, Upper Saddle River, New Jersey.
662 PP-