Embed Size (px)
Citation preview

A SINGLE-CRYSTAL EPR STUDY OF RADIATION-INDUCED
DEFECTS IN SELECTED SILICATES
A Thesis Submitted to the College of
Graduate Studies and Research
In Partial Fulfillment of the Requirements
For the Degree of Doctor of Philosophy
In the Department of Geological Sciences
University of Saskatchewan
Saskatoon
By
Mao Mao
Copyright Mao Mao, October, 2012. All rights reserved.
i
Permission to Use
In presenting this thesis in partial fulfilment of the requirements for a Doctor of
Philosophy degree from the University of Saskatchewan, I agree that the Libraries of
this University may make it freely available for inspection. I further agree that
permission for copying of this thesis in any manner, in whole or in part, for scholarly
purposes may be granted by the professor or professors who supervised my thesis
work or, in their absence, by the Head of the Department or the Dean of the College
in which my thesis work was done. It is understood that any copying or publication or
use of this thesis or parts thereof for financial gain shall not be allowed without my
written permission. It is also understood that due recognition shall be given to me and
to the University of Saskatchewan in any scholarly use which may be made of any
material in my thesis.
Requests for permission to copy or to make other use of material in this
thesis in whole or part should be addressed to:
Head of the Department of Geological Sciences
114 Science Place
University of Saskatchewan
Saskatoon, Saskatchewan
S7N5E2, Canada

ii
Abstract
This thesis presents a series of single-crystal electron paramagnetic resonance
(EPR) studies on radiation-induced defects in selected silicate minerals, including
apophyllites, prehnite, and hemimorphite, not only providing new insights to
mechanisms of radiation-induced damage in minerals but also having direct relevance
to remediation of heavy metalloid contamination and nuclear waste disposal.
The NH2 free radical, which is one of the most studied triatomic molecules
and is widely used as spin labels in biophysical and biomedical research, in
fluorapophyllite has been observed and characterized by single-crystal EPR spectra.
Fourier-transform infrared (FTIR) spectrum supports electron-microprobe analyses
that fluorapophyllite on the cavity walls in a phonolite (North Bohemia, Czech
Republic) contains ammonium NH4+. The spin-Hamiltonian parameters of the NH2
free radical show that this molecule is oriented parallel to (and rapidly rotated about)
the crystallographic c axis. The NH2 free radical in fluorapophyllite, most likely
formed from radiolysis of the NH4+ ion, remains stable after annealing at 300°C, but
is bleached at 340°C. This is the first report of the NH2 free radical in a mineral
lattice.
An O- center and its biradicals in hydroxylapophyllite have been investigated
by use of single-crystal and powder EPR spectroscopy at 290 and 90 K and
three-pulse electron spin echo envelope modulation (ESEEM) spectroscopy at 25 K.
The spin-Hamiltonian parameters show that the O- center (σ-type) represents an
unpaired electron in the 2pz orbital of the hydroxyl oxygen atom. A series of weak

iii
satellite peaks accompanying the main lines have been attributed to four
geometrically distinct pairs of neighboring O- centers (i.e., biradicals). These
biradicals have a point-dipole character and further support the O- model and its
location. The O- center in hydroxylapophyllite is most likely produced by natural
radiation and can be enhanced by gamma-ray irradiation. It is bleached at 300°C but
can be restored readily by gamma-ray irradiation.
An Al-O- center in gamma-ray-irradiated prehnite has been investigated by
single-crystal EPR spectroscopy at 298 and 160 K. The spin-Hamiltonian parameters
g and A(27Al) at 298 K show that the hole traps on an apical hydroxyl oxygen of the
octahedral O4Al(OH)2 group, after removal of the proton. Pulsed electron nuclear
double resonance (ENDOR) spectra measured at 25 K further confirm the structural
model of the Al-O- center. Isothermal and isochronal annealing experiments show that
the Al-O- center exhibits second-order decay kinetics. The Al-O- center is bleached
after annealing at 375°C but can be restored by gamma-ray irradiation. These results
from the Al-O- center in prehnite provide support for and new insights into Clozel et
al. (1995)’s VIAl−O−−
VIAl model for the B center in kaolinite.
Two arsenic-centered oxyradicals ([AsO4]4- and [AsO4]
2-) in gamma-ray
irradiated hemimorphite (Mapimi, Durago, Mexico) have been observed and
characterized by single-crystal EPR at ~295 K. The spin-Hamiltonian parameters
suggest that the [AsO4]4- radical is produced from electron trapping by a locally
uncompensated [AsO4]3- group substituting for the [SiO4]
4- group. The
spin-Hamiltonian parameters of the [AsO4]2- radical, including its 29Si and 1H

iv
superhyperfine coupling constants, suggest hole trapping on the bridging oxygen
linked to a Si4+ ion. Hydrothermal experiments at 200 °C and ~9.5 MPa show that
hemimorphite is able to accommodate up to 2.5 wt% As2O5. These results
demonstrate that hemimorphite is capable of sequestering arsenate in its crystal lattice,
so it is a natural sink for attenuating As in supergene non-sulfide Zn deposits and Zn
mine tailings.
Hemimorphite commonly contains elevated contents of heavy metalloids such
as As, Cu, Cd, and Pb. Cation-exchange experiments of hemimorphite with 0.1M
CaCl2 solution at 110°C show that As and Cu are retained, whereas Cd and Pb are
readily exchanged. This exchange behavior of Cd and Pb suggests that they may
reside in the channel. Single-crystal EPR results at 295 and 120 K show that Cu2+
resides at the tetrahedral Zn site, not in the channel as previously suggested by the
powder EPR study of Gallegos et al. (2009). These results suggest that hemimorphite
is potentially useful for the remediation of heavy metalloid contamination.
Single-crystal EPR spectra of gamma-ray-irradiated hemimorphite after
storage at room temperature for three months reveal a hydroperoxy radical HO2 with
complex proton hyperfine and superhyperfine structures. The single-crystal EPR
spectra of this HO2 radical, measured from 4 K to 275 K, confirm two reversible
phase transitions at ~98 K and ~21 K. Spin-Hamiltonian parameters show that the
HO2 radical at 110 K forms from the H2O molecule in the channel and interacts with
two equivalent protons of the nearest hydroxyl groups. The HO2 radical changes in
site symmetry from monoclinic to triclinic across the ~98 K phase transitions and

v
confirms dynamic ordering and rotation of its precursor water molecule in the channel
at <98 K. The EPR spectra of the HO2 radical at <21 K and results from density
functional theory (DFT) calculations suggest that hemimorphite adopts the
monoclinic space group Im with completely ordered O−H systems at low temperature.
vi
Acknowledgements
I would have never completed this research without my supervisor Dr.
Yuanming Pan. He has taught me the way to do research and pushed me to work hard.
I am grateful to him for the time and patience that he has generously spent on my
research in these years. I also thank the members of my advisory committee: Dr.
Kevin Ansdell, Dr. Jim Merriam, Dr. Ingrid Pickering, Dr. Robin W. Renaut, and Dr.
Robert Scott, as well as my external examiner Dr. Mostafa Fayek, for incisive
criticisms and helpful suggestions.
Special thanks to Dr. Mark J. Nilges for the collaborative work with ESEEM
and ENDOR experiments at Illinois EPR Research Center, and Dr. Ramaswami
Sammynaiken of Saskatchewan Structural Science Centre for his assistance on the
X-band EPR experiments. I am very grateful to Mr. T. Bonli, Dr. J. Fan, Dr. Z. Li,
and Mr. B. Novakovski of the Department of Geological Science for their assistance
with electron microprobe analysis, inductively-coupled plasma mass spectroscopy
analysis, DFT calculations, and sample preparation, respectively.
I also want to express my gratitude to my family for their support and
encouragements. They have been always proud of my achievement and encouraged
me when I faced problems on research. At last, I gratefully thank Natural Science and
Engineering Research Council of Canada, Areva Resources Canada Scholarship, and
University of Saskatchewan Graduate Teaching Fellowship for financial support to
my research.
vii
TABLE OF CONTENTS
PERMISSION TO USE ................................................................................................. i
ABSTRACT.................................................................................................................. ii
ACKNOWLEDGEMENTS ......................................................................................... vi
TABLE OF CONTENTS............................................................................................ vii
LIST OF TABLES ...................................................................................................... xii
LIST OF FIGURES.................................................................................................... xiv
1.INTRODUCTION AND OBJECTIVES ..................................................................1
1.1 STUDY OVERVIEW ................................................................................................................... 1
1.1.1 Defects.......................................................................................................... 1
1.1.2 The selected silicates.................................................................................... 4
1.2 RESEARCH OBJECTIVES AND RATIONALE .......................................................................... 7
1.3 THESIS OUTLINE .....................................................................................................................10
1.4 REFERENCES ...........................................................................................................................12
2.RADIATION-INDUCED DEFECTS IN APOPHYLLITES. I. THE NH2 FREE
RADICAL IN FLUORAPOPHYLLITE ................................................................22
2.1 INTRODUCTION ......................................................................................................................23
2.2 SAMPLE AND EXPERIMENTAL TECHNIQUES ....................................................................24
2.3 RESULTS ..................................................................................................................................26
2.3.1 Chemical composition and FTIR spectrum................................................ 26
2.3.2 Single-crystal EPR spectra ......................................................................... 27
2.3.3 Powder EPR spectra ................................................................................... 32
2.4 DISCUSSION ............................................................................................................................33
2.4.1 Identification and spin-Hamiltonian parameters of the NH2 free radical... 33
2.4.2 Formation and thermal stability of the NH2 free radical in fluorapophyllite
............................................................................................................................. 36
2.5 CONCLUSIONS .....................................................................................................39
2.6 REFERENCES ...........................................................................................................................39

viii
3.RADIATION-INDUCED DEFECTS IN APOPHYLLITES. II. AN O- CENTRE
AND RELATED O--O- PAIRS IN HYDROXYLAPOPHYLLITE ......................45
3.1 INTRODUCTION.......................................................................................................................46
3.2 SAMPLES AND EXPERIMENTAL TECHNIQUES ..................................................................48
3.3 RESULTS...................................................................................................................................51
3.3.1 Chemical composition and FTIR spectrum................................................ 51
3.3.2 Single-crystal EPR spectra ......................................................................... 53
3.3.3 Powder EPR spectra and thermal stability ................................................. 60
3.3.4 ESEEM spectra .......................................................................................... 61
3.4 DISCUSSION.............................................................................................................................67
3.4.1 O- centres in apophyllites ........................................................................... 67
3.4.2 O--O- pairs in hydroxylapophyllite............................................................. 72
3.4.3 Comparison with O- centres in other layer silicates................................... 75
3.5 CONCLUSIONS ....................................................................................................77
3.6 REFERENCES ...........................................................................................................................77
4.SINGLE-CRYSTAL EPR AND ENDOR STUDY OF AN AL-O- CENTER IN
PREHNITE: IMPLICATIONS FOR ALUMINUM-ASSOCIATED OXYRADICALS
IN LAYER SILICATES ............................................................................................82
4.1 INTRODUCTION.......................................................................................................................83
4.2 SAMPLES AND EXPERIMENTAL TECHNIQUES ..................................................................86
4.2.1 Prehnite crystals and sample preparation ................................................... 86
4.2.2 Single-crystal CW-EPR experiments ......................................................... 87
4.2.3 Pulsed ENDOR experiments...................................................................... 88
4.3 RESULTS...................................................................................................................................89
4.3.1 Single-crystal CW-EPR spectra ................................................................. 89
4.3.2 Optimization of spin Hamiltonian parameters ........................................... 91
4.3.3 Single-crystal CW-EPR spectra of annealed prehnite................................ 95
4.3.4 Pulsed ENDOR spectra .............................................................................. 97
4.4 DISCUSSION.......................................................................................................................... 101

ix
4.4.1. Structural model and origin of the Al-O- center in prehnite ................... 101
4.4.2. Thermal stability and coloration ............................................................. 106
4.4.3 Implications for aluminum-associated oxyradicals in layer silicates....... 107
4.5 CONCLUSIONS ..................................................................................................................... 110
4.6 REFERENCES .....................................................................................................111
5.HEMIMORPHITE AS A NATURAL SINK FOR ARSENIC IN ZINC DEPOSITS
AND RELATED MINE TAILINGS: EVIDENCE FROM SINGLE-CRYSTAL EPR
SPECTROSCOPY AND HYDROTHERMAL SYNTHESIS ..................................117
5.1 INTRODUCTION.................................................................................................................... 119
5.2 SAMPLES AND EXPERIMENTAL TECHNIQUES ............................................................... 121
5.2.1. Samples and trace element analyses........................................................ 121
5.2.2 EPR measurements................................................................................... 122
5.2.3 Hydrothermal synthesis............................................................................ 124
5.3 RESULTS................................................................................................................................ 125
5.3.1 Crystals and compositions of natural hemimorphite................................ 125
5.3.2 Single-crystal EPR spectra of natural hemimorphite ............................... 127
5.3.3 Spin Hamiltonian parameters of the [AsO4]4- and [AsO4]
2- radicals ....... 130
5.3.4 Synthetic hemimorphite ........................................................................... 135
5.4 DISCUSSION.......................................................................................................................... 139
5.4.1 Structures and formation of the [AsO4]4- and [AsO4]
2- radicals in
hemimorphite .................................................................................................... 139
5.4.2 Factors affecting the incorporation of As in hemimorphite ..................... 142
5.4.3 Hemimorphite as a natural sink for As in Zn deposits and related mine
tailings ............................................................................................................... 143
5.5 CONCLUSIONS ..................................................................................................................... 147
5.6 REFERENCES ........................................................................................................................ 148
6.NATURE OF HEAVY METALS IN HEMIMORPHITE: A
CATION-EXCHANGE AND SINGLE-CRYSTAL EPR STUDY ....................157
6.1 INTRODUCTION.................................................................................................................... 159

x
6.2 BACKGROUND INFORMATION ON THE STRUCTURE OF HEMIMORPHITE................. 161
6.3 SAMPLES AND EXPERIMENTAL METHODOLOGY ........................................................ 162
6.4 RESULTS................................................................................................................................ 163
6.4.1 Cation-exchange experiments and UV-Vis-NIR spectrum...................... 163
6.4.2 Single-crystal EPR spectra ....................................................................... 165
6.4.3 Spin Hamiltonian parameters of Cu2+ ...................................................... 167
6.5 DISCUSSION.......................................................................................................................... 172
6.5.1 Site occupancies of heavy metals in hemimorphite and implications...... 178
6.6 CONCLUSIONS ..................................................................................................179
6.7 REFERENCES ........................................................................................................................ 180
7.PHASE TRANSITIONS AND PROTON ORDERING IN HEMIMORPHITE:
NEW INSIGHTS FROM SINGLE-CRYSTAL EPR EXPERIMENTS AND DFT
CALCULATIONS .................................................................................................189
7.1 INTRODUCTION.................................................................................................................... 190
7.2 SAMPLE AND EXPERIMENTAL METHODOLOGY ............................................................ 193
7.2.1 Single-crystal EPR measurements ........................................................... 193
7.2.2 DFT computation methodology ............................................................... 194
7.3 RESULTS AND DISCUSSION ............................................................................................... 195
7.3.1 Single-crystal EPR spectra ....................................................................... 195
7.3.2 Optimization of spin Hamiltonian parameters ......................................... 198
7.3.3 Monoclinic structures optimized by DFT calculations ............................ 205
7.3.4 Phase transitions and proton ordering in hemimorphite........................... 206
7.4 CONCLUSIONS ..................................................................................................208
7.5 REFERENCES ........................................................................................................................ 209
8.CONCLUSIONS .................................................................................................215
APPENDIX A. A REVIEW OF EPR, ENDOR, AND ESEEM TECHNIQUES .....218
A.1 ELECTRON PARAMAGNETIC RESONANCE SPECTROSCOPY ...............................218
A.1.1 Fundamental Principles ...........................................................................219
A.1.2 The spin Hamiltonian and g tensor ..........................................................221

xi
A.1.3 EPR Spectrometer ...................................................................................223
A.2 ELECTRON-NUCLEAR DOUBLE RESONANCE SPECTROSCOPY ............................225
A.2.1 Fundamental Principles of CW ENDOR .................................................226
A.2.2 Fundamental Principles of pulsed ENDOR .............................................228
A.3 ELECTRON SPIN ECHO ENVELOPE MODULATION SPECTROSCOPY ......................229
A.4 REFERENCES ....................................................................................................232
APPENDIX B. A REPORT OF EPR SAMPLE PREPARATION, EXPERIMENTAL
METHODS, EPR SPECTRA, DATA-FITTING INPUT, AND OUTPUT FILES ..234
B.1 SAMPLE PREPARATION .....................................................................................234
B.2 EPR EXPERIMENTS ...........................................................................................235
B.3 RADIATION AND ANNEALING PROCEDURES .....................................................238
B.4 LIST OF EPR SPECTRA AND DATA-FITTING FILES ..............................................238
APPENDIX C. A REPORT OF ALL GEOCHEMICAL DATA .............................241
C. 1 EMPA DATA ...................................................................................................241
C. 2 ICP-MS DATA .................................................................................................243

xii
LIST OF TABLES
Table 2.1 Chemical composition of fluorapophyllite from North Bohemia, Czech
Republic. ..................................................................................................... 28
Table 2.2 Spin-Hamiltonian parameters of the NH2 free radical in γ irradiated
fluorapophyllite. .......................................................................................... 32
Table 2.3 Literature data of the NH2 free radical in selected matrices............... 38
Table 3.1 Composition of hydroxylapophyllite.................................................. 52
Table 3.2 Spin Hamiltonian parameters of the O- centre in hydroxylapophyllite
..................................................................................................................... 57
Table 3.3 Spin Hamiltonian parameters of the four O--O- pairs in
hydroxylapophyllite at 90 K........................................................................ 58
Table 3.4 Orientations and distances from the OH group to selected Si, H and K
atoms in hydroxylapophyllite...................................................................... 68
Table 3.5 Distances and orientations of O--O- pairs in hydroxylapophyllite...... 74
Table 4.1 Spin Hamiltonian parameters of the Al-O- center in prehnite. ........... 94
Table 4.2 Next-nearest Al and H to an apical oxygen of an Al octahedron in
prehnite...................................................................................................... 104
Table 5.1 Summary of hemimorphite samples investigated in this study. ....... 126
Table 5.2 Spin Hamiltonian parameters of [AsO4]4- and [AsO4]
2- in
hemimorphite at 290 K.............................................................................. 131
Table 5.3 Hydrothermal synthesis of hemimorphite at 200 °C and ~9.5 MPa. 138
Table 6.1 Heavy metals in hemimorphite after exchange experiments ............ 164
Table 6.2 Spin Hamiltonian parameters of the Cu2+ center in hemimorphite .. 170
Table 7.1 Spin Hamiltonian parameters of the HO2 radical at different
temperatures .............................................................................................. 200
Table 7.2 Spin Hamiltonian parameters of the HO2 radical in selected hosts .. 202
Table 7.3 Unit-cell parameters and fractional coordinates of atoms in monoclinic
hemimorphite optimized by DFT calculations.......................................... 207

xiii
Table B.1 The list of experiments, spectra, and data-fitting files in this thesis 239
Table C.1 The EMPA results of apophyllites ...................................................242
Table C.2 The EMPA results of prehnite .........................................................243
Table C.3 The minimum detection limit of apophyllite and prehnite ..............243
Table C.4 The ICP-MS data of hydroxylapophyllite .......................................244
Table C.5 The ICP-MS data of hemimorphite .................................................246
Table C.6 The ICP-MS data of hemimorphite .................................................248
Table C.7 The ICP-MS data of hemimorphite .................................................251
Table C.8 The ICP-MS data of cation-exchange experiments .........................252
Table C.9 The ICP-MS data of cation-exchange experiments .........................253

xiv
LIST OF FIGURES
Figure 2.1 FTIR spectrum of fluorapophyllite from North Bohemia, Czech
Republic.. .................................................................................................... 29
Figure 2.2 Representative single-crystal EPR spectra of γ irradiated
fluorapopphyllite ......................................................................................... 30
Figure 2.3 The angle dependence of line position data (i.e., roadmap) of the NH2
free radical................................................................................................... 31
Figure 2.4 Comparison of powder EPR spectra of γ irradiated fluorapophyllite.
..................................................................................................................... 35
Figure 3.1 Projection of the hydroxylapophyllite structure on the (100) plane. 49
Figure 3.2 Single-crystal EPR spectra of hydroxylapophyllite measured at ~90 K.
..................................................................................................................... 54
Figure 3.3 Angle-dependence of line-position data of four sets of satellite peaks
in the (001) and (110) planes....................................................................... 56
Figure 3.4 Room-temperature powder EPR spectra of hydroxylapophyllite
before and after isochronal annealing. ........................................................ 59
Figure 3.5 Stacked plots of the 29Si portion of the experimental and simulated
three-pulse ESEEM spectra as a function of rotation angles. ..................... 61
Figure 3.6 Comparison of experimental and simulated ESEEM spectra at 25 K.
..................................................................................................................... 64
Figure 3.7 Stacked plots of the 1H portion of the experimental and simulated
three-pulse ESEEM spectra as a function of rotation angles. ..................... 66
Figure 3.8 Stacked plots of the 39K portion of the experimental and simulated
three-pulse ESEEM spectra as a function of rotation angles. ..................... 68
Figure 3.9 The positions of the hydroxyl oxygen atoms in the
hydroxylapophyllite structure illustrating five possible O--O- pairs: I, II, III
and IV.......................................................................................................... 70
Figure 4.1 Crystal structure of P2cm prehnite projected to the (010) plane ...... 85

xv
Figure 4.2 Representative 298 K single-crystal EPR spectra of γ-ray irradiated
prehnite........................................................................................................ 90
Figure 4.3 Line-position data versus rotation angles of the Al-O- center in
prehnite in three rotation planes. ................................................................. 93
Figure 4.4 Intensity of the Al-O- center as a function of isochronal annealing
temperature from 75 to 400 °C.................................................................... 95
Figure 4.5 Plots of (a) reciprocal intensities (1/N) versus annealing time (t), and
(b) decay constants (–lnλ) versus reciprocal temperature (1/T).................. 97
Figure 4.6 Stacked plots of the experimental and simulated 27Al Mims ENDOR
spectra as a function of rotation angles. ...................................................... 98
Figure 4.7 Stacked plots of the 1H portion of the experimental and simulated
Mims ENDOR spectra as a function of rotation angles. ........................... 100
Figure 5.1 (a) Crystal structure of hemimorphite projected to the (001) plane; (b)
linkage of the Si2O7 group and its neighboring Zn atoms......................... 122
Figure 5.2 Representative single-crystal EPR spectra of γ-ray irradiated
hemimorphite. ........................................................................................... 128
Figure 5.3 Intensities of the Fe3+ center and the [AsO4]4- and [AsO4]
2- radicals as
a function of gamma-ray radiation dose.................................................... 132
Figure 5.4 Line-position data points of the [AsO4]4- radical (the highest-field
hyperfine transition only) in hemimorphite as a function of rotation angles.
................................................................................................................... 133
Figure 5.5 Line-position data points of the [AsO4]2- radical in hemimorphite as a
function of rotation angles......................................................................... 134
Figure 5.6 Representative PXRD pattern of solid products from synthesis
experiments at 200 °C and ~9.5 MPa........................................................ 135
Figure 5.7 Representative back-scattered electron image. ............................... 136
Figure 5.8 As contents in synthetic hemimorphite........................................... 137
Figure 6.1 Crystal structure of hemimorphite projected to the (001) plane. .... 160
Figure 6.2 UV-Vis-NIR spectrum of hemimorphite from the M’Fouati Pb-Zn
mine........................................................................................................... 164

xvi
Figure 6.3 Representative single-crystal EPR spectra of as-is hemimorphite from
the M’Fouati Pb-Zn mine.......................................................................... 166
Figure 6.4. Line-position datapoints of the Cu2+ center in hemimorphite as a
function of rotation angles at 120 K.......................................................... 168
Figure 6.5 Experimental powder EPR spectrum of hemimorphite from the
M’Fouati Pb-Zn mine at 110 K. ................................................................ 171
Figure 6.6 Relationships between the principal g and A(63Cu) axes of the Cu2+
center and the ZnO4 pseudotetrahedron in the hemimorphite structure.... 172
Figure 7.1 a) Crystal structure of hemimorphite at room temperature projected
onto the (001) plane; and b) and c) comparison of the positions and
orientations of the water molecule and the hydroxyl groups at 110 and 20 K,
respectively................................................................................................ 191
Figure 7.2 Representative single-crystal EPR spectra of gamma-ray-irradiated
hemimorphite as a function of temperature............................................... 197
Figure 7.3 Comparison of experimental and simulated EPR spectra of Center I.
................................................................................................................... 204
Figure A.1 The scheme of the spin energy levels for EPR ..............................221
Figure A.2 Block diagram illustrating the basic components of an EPR
spectrometer ..............................................................................................226
Figure A.3 Energy level diagram for the case of S = 1/2, I = 1/2, and A/2 <
vn ................................................................................................................227
Figure A.4 The ENDOR pulse sequence ..........................................................230
Figure A.5 The ESEEM pulse sequence ..........................................................232
Figure B.1 The cryostat system of EPR experiments .......................................237
Figure B.2 The mineral sketches of selected minerals in this thesis ................239

- 1 -
Chapter 1
Introduction and objectives
1.1 Study overview
Defects are known to exert important controls on physical and chemical
properties of minerals, which are supported by the research focused on the colours of
gemstones and semiconductor crystals. Based on radiation sensitivity of many defects,
minerals with these defects have also been widely applied in archeology,
geochronology, gemstone enhancement, nuclear waste disposal and mineral
exploration (Nassau, 1983, 1984; Ikeya, 1993; Rossman, 1994; Marfunin, 1994; Rink,
1997; Pan et al., 2006).
1.1.1 Defects
In early mineral researches, the defects of minerals have been studied as
“color centers”, which are paramagnetic point defects in minerals, based on the
studies dating back to 1920s of various materials such as halides (see also Marfunin
1979). For example, the F-center, which is an electron trapped at an anion vacancy,
was first studied by Pohl (1925, 1937) and de Boer (1937). Since the F-center in some
transparent materials produces an absorption in the visible range of the
electromagnetic spectrum, it is called a “colour center”. Because the electron at the
vacancy is unpaired (i.e., without a counteracting spin), it can be analyzed by electron

- 2 -
paramagnetic resonance (EPR) spectroscopy. After the F-center was found, many
other colour centers have been detected by EPR. Although only some of the known
colour centers absorb wavelengths in the visible band of optical spectrum, the term
“colour center” has been retained and widely used in the literature (Marfunin, 1979).
The types of point defects include: (1) anion and cation vacancies, (2)
interstitial atoms and molecules, (3) impurity ions (isomorphous or interstitial), (4)
atoms in disordered solid solution, and (5) vacancy and impurity aggregates
(Marfunin, 1979).
Since the discovery of paramagnetic defects, they have received more and
more studies related to alteration of the physical properties of their host. For example,
many desirable colors in gemstone are actually produced by their crystal defects
(Nassau et al. 1976; Solntsev et al., 1981; Blak et al. 1982; Krambrock et al. 2002,
2007; Isotani et al. 2010). Within these minerals, the isomorphous impurity ions (i.e.,
foreign ions at regular lattice sites in a crystal), which do not have identical sizes
and/or valence states to the lattice ions, may control the colours in their host minerals,
because they commonly cause a local distortion and influence the local crystal field in
the crystal. Similarly, when anions or cations are not present in their “correct” lattice
sites, vacancies are produced and resulting the variation of their local crystal field
(Fowler 1968). Due to the crystal field changes, the energy levels will be different
from those of lattice atoms, so additional energy levels appear in the band gap, and
produce extra absorption peaks in electromagnetic spectra, thus affecting the colour of
the host mineral if the absorption energy is in the visible range (~400 – 700 nm).
- 3 -
One of the main methods to produce paramagnetic centers is irradiation by
γ-ray, X-ray, electron, and neutron sources. Such radiation excites electrons to excited
orbitals to form paramagnetic defects in minerals. The radiation dose required
depends on the radiation source and exposure time, but the radiation-induced defects
are usually small in absolute numbers (i.e., in a very low concentration).
Radiation-induced defects usually can be removed (“bleached”) at different annealing
temperatures. By using of this property of defects, various minerals can be applied as
natural dosimeters, geothermometers, and geochronometers (Ikeya 1993). Therefore,
it is necessary to establish the relations among the EPR signal intensity of the specific
center, radiation dose, and annealing temperature and time. By identifying the type of
defect centers and their formational mechanisms it is possible to use them as markers
for past geological events (Pan et al. 2006).
Consequently, the studies of defect centers straddle the boundaries of physical
chemistry, material sciences, archaeology, gemology, mineralogy and geology, and
have contributed the knowledgebase of all these areas (Marfunin 1979; Nassau 1983,
1984; Ikeya 1993; Rink 1997; Allard et al. 2003; Pan et al. 2006).
To investigate defect centers, X-ray electron spectroscopy, UV-Vis-NIR
absorption spectroscopy, Fourier-transform infrared spectroscopy (FTIR), Raman
spectroscopy, nuclear magnetic resonance (NMR), and EPR spectroscopy have been
employed by previous studies. However, the EPR spectroscopy have been proven to
be the most effective technique to study defect centers, because of the excellent
sensitivity of EPR spectroscopy (down to 0.0001%) (Weil & Bolton, 2007) and very

- 4 -
fine linewidth (some cases < 0.1 mT). These distinctive features make EPR suitable
for investigating the electronic structure and local symmetry of paramagnetic species.
As a limitation of EPR spectroscopy, it is only able to detect paramagnetic defects and
diamagnetic defects are not detectable by EPR. Nevertheless, this limitation can be
easily overcome because many defects are paramagnetic or can transfer to
paramagnetic after artificial irradiation. Therefore, EPR is the most powerful method
to investigate defects in minerals.
1.1.2 The selected silicates
Silicate minerals are the most abundant group of minerals and the most
important rock-forming minerals in Earth’s crust (Nesse 2012), so they actually
contain much information about the history of Earth. Some silicates, such as beryl and
garnets are used as gemstones. A few silicates, such as spodumene and zircon, are
actively mined for extracting Li and Zr respectively. Many silicates have been used as
industrial materials due to their physical and chemical properties (Klein 2002; Nesse
2012).
Clay minerals are an important group of phyllosilicates that are widely
distributed in sedimentary rocks and occur in igneous and metamorphic rocks as
alteration products. Clay minerals have many specific and unique properties, some of
which are useful in a number of industrial and technological applications, such as the
manufacture of ceramics, as filling materials, as catalysts, as geologically datable
material, and dosimeter. Therefore, studies on paramagnetic defects in clay minerals

- 5 -
have many important applications (Friedlander & Saldick, 1963; Pinnavaia, 1982;
Michael & McWhinnie, 1989; Balan et al., 1999; Götze et al., 2002).
Kaolinite-group minerals (e.g., kaolinite and dickite) are the most common
clay minerals. Since kaolinite-group minerals are widely distributed as secondary
mineral in sedimentary beds (Murray, 1988), and because they are very stable under
most environmental conditions, these minerals have been used as natural dosimeters
to trace past radionuclide migration in uranium exploration (Mosser et al., 1996;
Allard et al., 1998, 2003). The EPR signal of kaolinite mainly appears at the g ≈ 4 and
g ≈ 2 regions which have been produced by Fe3+ ion and some hole-like centers
respectively (Allard et al. 2003).
Apophyllites as a phyllosilicate is an analogue of clay mineral have been
developed as a nanocomposite (Aldushin et al. 2004; Chen et al. 2007). Moreover, a
several studies on defects have been done on apophyllites due to the fact that it occurs
as large crystals and is used as a semi-precious gemstone, and is thus amenable to
single-crystal EPR studies. Bershov and Marfunin (1965, 1970) investigated the Ti3+
and Mn2+ centers in apophyllites. Bershov and Marfunin (1966), Vassilikou-Dova
(1988) and Ramakrishnan (1991) studied two different VO2+ centers in apophyllites in
detail. Bershov and Marfunin (1966) also reported the oxygen-related hole-like center
in apophyllites to have g1 = 2.0041, g2 = 2.0106, g3 = 2.04511 without any other
detail.
Another phyllosilicate mineral, prehnite, is also used as a semi-precious
gemstone, because of its brilliant green color. EPR and other studies of prehnite have

- 6 -
focused on the origin of its color, as related to the Fe3+ ion (Nazarova et al. 1991;
Gangi Reddy et al. 2005). The Mn2+ center was found by Narasimha Reddy et al.
(2001) through the EPR spectroscopy. Nazarova et al. (1991) detected a VO2+ center
in prehnite, but concluded that it is not the cause of the green color. After γ-ray
irradiation, a center with g// = 2.0196 and g⊥ = 2.0050 was detected, and a brownish
color was produced; it was attributed to the O-−bridge associated to Fe3+ ion. The
brownish color vanished after heating, and the O- center faded at 100˚C (Nazarova et
al. 1991).
Hemimorphite, a framework silicate, is also investigated in this study. It is a
refractory mineral in surface environments and commonly presents in zinc mine
tailings. Hemimorphite has attracted many studies because of its catalytic applications
(Breuer et al., 1999; Yurieva et al., 2001; Catillon-Mucherie et al., 2007) and its
interesting features related to its zeolite-like crystal structure containing confined
water molecules in the channel (Libowitzky et al., 1997, 1998; Kolesov, 2006; Frost
et al., 2007; Geiger & Dachs, 2009; Dachs & Geiger, 2009). A Mn2+ center in
hemimorphite was studied by Vassilikou-Dova & Eftaxias (1992). Gallegos et al.
(2009) investigated powder EPR spectra of hemimorphite, disclosed Cu2+ and Fe3+,
and also proposed the existence of Al—O-, E1’, and Pb+—Pb3+ centers. However, the
detailed structure models for these centers are not clear owing to limited information
from the powder EPR spectra.

- 7 -
1.2 Research objectives and rationale
Kaolinite-group minerals and other clay minerals such as illite and
montmorillonite have been widely used as natural dosimeters (Mosser et al. 1996;
Allard et al. 1998, 2003; Morichon et al. 2008), because of the radioactivity-sensitive
centers at the g ≈ 2 region (Angel et al. 1974). However, the structural models for
these centers remain controversial. Because these minerals almost invariably occur in
sizes of micrometers or less, EPR studies of kaolinite-group minerals have all been
done with powder samples. Therefore, all the clay mineral studies and the
explanations of centers noted above have been based on powder EPR spectra. Clozel
et al. (1994), Sorieul et al. (2005), and Morichon et al. (2008) oriented kaolinite,
montmorillonite, and illite respectively by the preferential development of platy
particles through compression and sedimentation. Clozel et al. (1994) characterized
the order/disorder of the grain orientation of kaolinite samples by using of the X-ray
powder diffraction (XRD) and FTIR spectroscopy. However, the disorder indices of
XRD (0.85−1.18) show that the kaolinite did not accumulate perfectly aligning along
its c axis. Furthermore, Aparicio & Galán (1999) and Aparicio et al. (2006) indicate
that the XRD method to determine the disorder indices of kaolinite presents problems
due to peak overlapping effects from other minerals.
The main controversial points include: 1. the origins of the A and B centers; 2.
the existence of the A’ center (Clozel et al. 1994); 3. structural models for all centers
at the g ≈ 2 region.

- 8 -
The A center does not have any visible hyperfine structure. Therefore, its g
values are the only piece of information for identifying this center. However, the g
values of the O2- and those of the SiO4
3- centre are all close to the reported g values
for the A center in kaolinite (Kasai 1965; Symon 1971; and Marfunin 1979), thus
additional information is required to better establish the structural model and origin of
this center.
Although a hyperfine structure with A/geβe = ~0.76 mT is resolved for the B
center at liquid-nitrogen temperatures (Meads & Malden, 1975; Hall 1980; Clozel et
al. 1994; Götze et al. 2002; Köksal et al. 2004), and all studies agreed that the B
center is related to aluminum, the disputes focus on the position of the O- ion and the
number (one or two) of neighboring Al nuclei (Hall 1980; Clozel et al. 1994; Götze et
al. 2002; Köksal et al. 2004). The reliance on only powder EPR spectra makes it
difficult to resolve this dispute.
One possible solution to these problems is a single-crystal EPR study, which is
far more sensitive and informative than its powder counterpart. Accordingly, a
single-crystal EPR study was initiated to investigate radiation-induced defects in
apophyllites, prehnite, and hemimorphite, which usually occur as large crystals that
are amenable to single-crystal EPR studies. Therefore, detailed structural information
for radiation-induced defects in apophyllites obtainable from single-crystal EPR
studies can be used for better understanding of similar defects in other phyllosilicates.
Apophyllites and prehnite are layer silicates, structurally similar to clay
minerals. Hemimorphite is a sorosilicate with a framework structure built from zinc
- 9 -
and silicon tetrahedra, and aluminum is a common impurity in the structure. Therefore,
radiation-induced defects in apophyllites, prehnite, and hemimorphite are expected to
be close analogues for those in common clay minerals. If this assumption is correct,
quantitative information for radiation-induced defects in apophyllites, prehnite, and
hemimorphite determined by the single-crystal EPR technique can then be used to
provide insights into their counterparts (e.g., A, A’, and B centers) in clay minerals.
Hemimorphite has been studied as a sink for As and heavy metals (Cd, Cu
and Pb) in mine tailings and soils surrounding smelters (Walder & Chavez 1995; Day
& Bowell 2005; Espiari et al. 2006; Schaider et al. 2007; Cabala et al. 2009). But the
study based on powder EPR spectra can not provide unambiguous positions of these
heavy metals in hemimorphite (Gallegos et al., 2009). Therefore, one purpose of the
present study is to understand the local structure of these heavy metals in
hemimorphite.
In addition, Libowisky et al. (1997) reported a phase transition present in
hemimorphite at ~98(2) K, and studied the crystal structure of hemimorphite at 20 K
by neutron diffraction (Libowisky et al., 1998). Kolesov (2006) reported another
phase transition at ~20 – 30 K. However, the two reversible phase transitions (~98 K
and ~20 – 30 K) are not observed in dehydrated hemimorphite, suggesting that these
phase transitions are related to the H2O molecules (Libowisky & Rossman, 1997;
Libowisky et al., 1997, 1998; Kolesov, 2006). A question that arises is: What is the
space group of hemimorphite below the phase transition at 20 K? Therefore, another

- 10 -
purpose of the current study is to resolve this question, through studies on the center
that is sensitive to phase transitions of hemimorphite.
1.3 Thesis outline
Aiming to solve the problems proposed above, this research has focused on
paramagnetic defects in apophyllites, prehnite, and hemimorphite, by using
single-crystal EPR spectroscopy and other techniques. The main body of this thesis is
composed of six chapters. Chapters 2, 3, 4, 5 and 6 have already been published as
separate articles in peer reviewed journals, and Chapter 7 is a manuscript submitted to
a peer reviewed journal.
Chapter 2, derived from a paper published in European Journal of Mineralogy
(Mao & Pan, 2009), presents the investigation of the NH2 free radical in
fluorapophyllite. The study disclosed the presence of NH4+ group and NH2 free
radical in a natural fluorapophyllite through FTIR and EPR spectroscopy, and
determined the spin-Hamiltonian parameters of the NH2 free radical by single-crystal
EPR data. The results showed that the NH2 free radical resides in the crystal lattice.
The NH2 free radical can be produced by gamma-ray radiation on fluorapophyllite
and bleached at 340 °C.
Chapter 3, published in European Journal of Mineralogy (Mao, Nilges & Pan,
2010), investigates a σ-type O- center and its biradicals in natural hydroxylapophyllite
by use of single-crystal EPR at 290 and 90 K. This center is annealed out at 300°C
and can be restored easily by gamma-ray irradiation. To provide more detailed

- 11 -
structural information, data from three-pulse electron spin echo envelope modulation
(ESEEM) spectroscopy at 25 K has been acquired and analyzed by Dr. Mark J. Nilges
(Assistant Director and Lab Manager, Illinois EPR research center) who was included
as a co-author of a paper that stemmed from this chapter.
Chapter 4, published in European Journal of Mineralogy (Mao, Nilges & Pan,
2010), is aimed at comparing an Al-O- center in gamma-irradiated natural prehnite
with the B center in kaolinite. Single-crystal EPR measurements of
gamma-ray-irradiated natural prehnite, including those after isothermal and isochronal
annealing, have been made at 298 and 160 K. Data from pulsed electron nuclear
double resonance (ENDOR) spectroscopy had been analyzed by Dr. Mark J. Nilges
and further confirmed the structural model of the Al-O- center. Results from prehnite
clarified the structural model of the B center in kaolinite.
To study the site occupancies and local structures of heavy metals in natural
hemimorphite, two arsenic-related centers ([AsO4]4- and [AsO4]
2-) and a Cu2+ center
have been investigated by single-crystal EPR in Chapters 5 (Mao, Lin & Pan, 2010)
and 6 (Mao & Pan, 2012), respectively. Hydrothermal experiments that had been done
by Ms. Jinru Lin (Ph.D. student, University of Saskatchewan) were also included in
Chapter 5. Chapter 6 includes a series of cation-exchange experiments at 110 °C to
evaluate the behavior of As, Cd, Cu and Pb as well.
Chapter 7, stemming from a manuscript (Mao, Li, & Pan, submitted to Physics
and Chemistry of Minerals), reports on a single-crystal EPR study of an HO2 center in
gamma-ray-irradiated hemimorphite from 4 K to 275 K. EPR spectra, incuding proton
- 12 -
hyperfine and superhyperfine coupling constants determined at 110 K, 85 K, 40 K and
7 K, confirm two second-order, reversible phase transitions at ~98 K and ~21 K
(Libowitzky & Rossman 1997; Kolesov 2006), provide new insights into the origins
of these phase transitions (i.e., proton ordering), and allow us to propose a new
monoclinic structure for hemimorphite at <21 K. Dr. Zucheng Li (Postdoctoral Fellow,
University of Saskatchewan), who performed first-principles calculations to optimize
the monoclinic structures of hemimorphite deduced from EPR spectra at <21 K, is a
co-author of the manuscript stemming from this chapter.
1.4 References
ALDUSHIN, K., JORDAN, G., RAMMENSEE, W., SCHMAHL, W.W. & BECKER, H.-W.
(2004): Apophyllite (001) surface alteration in aqueous solutions studied by HAFM.
Geochim. Cosmochim. Acta 68, 217-226.
ALLARD, T., ILDEFONSE, P., PEREZ DEL VILLAR, L., SORIEUL, S., PELAYO, M., BOIZOT,
B., BALAN, E., & CALAS, G. (2003) Radiation-induced defects in dickites from the EL
Berrocal granitic system (Spain): relation with past occurrence of natural
radioelements. Eur. J. Mineral. 15, 629-640.
ALLARD, T., & MULLER J. (1998): Kaolinite as an in situ dosimeter for past
radionuclide migration at the Earth’s surface. Applied Geochemistry. 13, 751-765.
ANGEL, B. R., JONES, J. P. E., & HALL, P. L. (1974): Electron spin resonance studies of
doped synthetic kaolinite. I. Clay Minerals. 10, 247-255.

- 13 -
APARICIO, P, & GALÁN, E. (1999): Mineralogical interference on kaolinite crystallinity
index measurements. Clays and Clay Minerals, 47, 12-27.
APARICIO, P, GALÁN, E, FERRELL, R.E. (2006): A new kaolinite order index based on
XRD profile fitting. Clay Minerals, 41, 811-817.
BALAN, E., ALLARD, T., BOIZOT, B., MORIN, G., & MULLER, J. P. (1999): Structural
Fe3+ in natural kaolinites: new insights from electron paramagnetic resonance spectra
fitting at X and Q-band frequencies. Clays and Clay Minerals. 47, 605-616.
BERSHOV, L.V. (1970): Isomorphism of titanium in minerals. Izv. Akad. Nauk. 12,
47-54.
BERSHOV, L. V. & MARFUNIN, A. S. (1965): Vanadyl ion in minerals; features of
electron paramagnetic resonance of initial elements. International geology reviews. 9,
42-52.
BERSHOV, L. V. & MARFUNIN, A. S. (1966): Electron-spin resonance of electron-hole
centers in minerals. Doklady Akademii Nauk SSSR. 173, 91-93.
BLAK, A. R., ISOTANI, S., & WATANABE, S. (1982): Optical absorption and electron
paramagnetic resonance studies of colorless and pin beryl. Revista Brasileira de
Física. 12, 285-292.
BREUER, K., TELES, J.H., DEMUTH, D., HIBST, H., SCHÄFER, A., BRODE, S. &
DOMGÖRGEN, H. (1999): Zinc silicates: very efficient heterogeneous catalysts for the
addition of primary alcohols to alkynes and allenes. Angew. Chem. Int. Ed. 38,
1401–1405.

- 14 -
CABALA J., KRUPA P., & MISZ-KENNAN M. (2009) Heavy metals in mycorrhizal
rhizospheres contaminated by Zn-Pb mining and smelting around Olkusz in southern
Poland. Water Air Soil Pollution, 199, 139-149.
CATILLON-MUCHERIE, S., AMMARI, F., KRAFFT, J.-M., LAURON-PERNOT, H.,
TOUROUDE, R. & LOUIS, C. (2007): Preparation of coimpregnated Cu–Zn/SiO2
catalysts: Influence of the drying step on metallic particle size and on Cu0–ZnII
interactions. J. Phys. Chem. C 111, 11619–11626.
CHEN, C.G., YEBASSA, D. & RAGHAVAN, D. (2007): Synthesis, characterization, and
mechnical properties of evaluation of thermally stable apophyllite vinyl ester
nanocomposites. Polym. Advan. Technol. 18, 574-581.
CLOZEL, B., ALLARD, T., & MULLER, J. P. (1994): Nature and stability of
radiation-induced defects in natural Kaolinite: new results and a reappraisal of
published works. Clays and clay minerals. 42, 657-666.
CLOZEL, B., GAITE, J. M., & MULLER, J. P. (1995): Al-O--Al paramagnetic defects in
kaolinite. Physics and chemistry in minerals. 22, 351-356.
Dachs, E. & Geiger, C.A. (2009): Heat-capacity behaviour of hemimorphite,
Zn4Si2O7(OH)2•H2O, and its dehydrated analogue Zn4Si2O7(OH)2: a calorimetric and
thermodynamic investigation of their phase transitions. Eur. J. Mineral. 21, 971–988.
DAY S.J., & BOWELL R.J. (2005) Atypical and typical zinc geochemistry in a
carbonate setting, Sä Dena Hes Mine, Yukon Territory, Canada. Geochem. Explor.
Environ. Analysis, 5, 255-266.
DE BOER J. H. (1937) Über die Nature der Farbzentren in Alkalihalogenid-Kristallen.
Recueil des Travaux Chimiques des Pays-Bas, 56, 301-309.

- 15 -
ESPIARI S., RASHCHI F., & SADRNEZHAAD S.K. (2006) Hydrometallurgical treatment
of tailings with high zinc content. Hydrometallurgy. 82, 54-62.
FOWLER, W. B. (1968): Physics of color centers. New York, Academic Press.
FRIEDLANDER, H. Z. & SALDICK, J. (1963): Electron spin resonance spectra in various
clay minerals. Nature. 199, 61-62.
FROST, R.L., BOUZAID, J.M. & REDDY, B.J. (2007): Vibrational spectroscopy of the
sorosilicate mineral hemimorphite Zn4(OH)2Si2O7•H2O. Polyhedron, 26, 2405–2412.
GALLEGOS, E.A., CANO, N.F., WATANABA, S. & CHUBACI, J.D.F. (2009):
Thermoluminescence, infrared reflectivity and electron paramagnetic resonance
properties of hemimorphite. Rad. Measur. 44, 11-17.
GANGI REDDY, N. C., FAYAZYDDIN, S. MD., RAMA SUBBA REDDY, R., SIVA REDDY, G.,
LAKSHMI REDDY, S., SAMBASIVA RAO, P., & JAGANNATHA REDDY, B. (2005):
Charactersation of prehnite by EPMA, Mossbauer, optical absorption and EPR
spectroscopic methods. Spectrochimica Acta Part A. 62, 71-75.
GEIGER, C.A. & DACHS, E. (2009): Quasi-ice-like Cp behavior of molecular H2O in
hemimorphite Zn4Si2O7(OH)2•H2O: Cp and entropy confined H2O in microporous
silicates. American Mineralogists. 94, 634–637.
GÖTZE, J., PLÖTZE, M., GÖTTE, TH., NEUSER, R. D., & RICHTER, D. K. (2002):
Cathodoluminescence and electron paramagnetic resonance studies of clay minerals.
Mineralogy and petrology. 76, 195-212.

- 16 -
HALL, P. L. (1980): The application of electron spin resonance spectroscopy to studies
of clay minerals: I. isomorphous subsitutions and external surface properties. Clay
minerals. 15, 321-335.
IKEYA, M. (1993) New Application of Electron Spin Resonance-dating, Dosimetry
and Microscopy. World Scientific, Singapore.
ISOTANI, S., BLAK, A. R., & WATANABE, S. (2010): UV optical absorption spectra
analysis of beryl crystals from Brazil. Physica B: Condensed matter. 405, 1501-1508.
JONES, J. P. E., ANGEL, B. R., & HALL, P. L. (1974): Electron spin resonance studies of
doped synthetic kaolinite. II. Clay Minerals. 10, 257-270.
KASAI, P. H. (1965): Electron spin resonance studies of γ- and X-ray-irradiated
zeolites. The journal of chemical physics. 43, 3322-3327.
KLEIN, C. (2002): The 22nd edition of the manual of mineral science. Wiley.
KOLESOV, B. (2006) Raman investigation of H2O molecule and hydroxyl groups in
the channels of hemimorphite. American Mineralogist, 91, 1355-1362.
KÖKSAL, F., KOSEOGLU, R., SAKA, I., BASARAN, E., & SENER, F. (2004): Electron
paramagnetic resonance of natural and gamma-irradiated alunite and kaolin mineral
powders. Radiation effects & Defects in solids. 159, 393-398.
KRAMBROCK, K., PINHEIRO, M. V. B., GUEDES, K. J., MEDEIROS, S. M., SCHWEIZER, S.,
& SPAETH J.-M. (2004): Correlation of irradiation-induced yellow color with the O-
hole center in tourmaline. Physics and chemistry of minerals. 31, 168-175.
- 17 -
KRAMBROCK, K., RIBEIRO, L. G. M., PINHEIRO, M. V. B., LEAL, A. S., MENEZES, M. A.,
& SPAETH J.-M. (2007): Color centers in topaz: comparison between neutron and
gamma irradiation. Physics and chemistry of minerals. 34, 437-444.
LIBOWITZKY, E., KOHLER, T., ARMBRUSTER, T. & ROSSMAN, G.R. (1997): Proton
disorder in dehydrated hemimorphite. IR spectroscopy and x-ray structure refinement
at low and ambient temperatures. Eur. J. Mineral. 9, 803-810.
LIBOWITZKY, E. & ROSSMAN, G.R. (1997): IR spectroscopy of hemimorphite between
82 and 373 K and optical evidence for a low-temperature phase transition. Eur. J.
Mineral. 9, 793-802.
LIBOWITZKY, E., SCHULTZ, A.J. & YOUNG, D.M. (1998): The low-temperature
structure and phase transition of hemimorphite, Zn4Si2O7(OH)2•H2O. Zeit. Kristal.
213, 659-668.
MAO, M., LIN, J. & PAN, Y. (2010) Hemimorphite as a natural sink for arsenic in zinc
deposits and related mine tailings: Evidence from single-crystal EPR spectroscopy
and hydrothermal synthesis. Geochim. Cosmochim. Acta 74, 2943–2956.
MAO, M., NILGES, M.J. & PAN, Y. (2010) Radiation-induced defects in apophyllites.
II. An O- center and its related biradicals in hydroxylapophyllite. Eur. J. Mineral. 22,
89–102.
MAO, M., NILGES, M.J. & PAN, Y. (2010) Single-crystal EPR and ENDOR study of
an Al-O- center in prehnite: implications for aluminum-associated oxyradicals in layer
silicates. Eur. J. Mineral. 22, 381–392.
Mao, M. and Pan Y. (2009) Radiation-induced defects in apophyllites. I. The NH2
radical in fluorapophyllite. Eur. J. Mineral. 21, 317–324

- 18 -
MAO, M. & PAN, Y. (2010) (2012) Nature of heavy metals in hemimorphite: A
cation-exchange and single-crystal EPR study. Can. Mineral. 50, 31-43.
MAO, M. & PAN, Y. (ms) Phase transitions and proton ordering in hemimorphite:
New insights from single-crystal EPR experiments between 4 K and 275 K. Phys.
Chem. Minerals (submitted)
MARFUNIN, A. S. (1979) Spectroscopy, luminescence and radiation centers in
minerals. Springer-verlag berlin Heidelberg New York.
MARFUNIN, A. S. (1994) Composition, structure, and properties of mineral matter.
Springer-Verlag.
MEADS, R. E. & MALDEN P. J. (1975): Electron spin resonance in natural kaolinites
containing Fe3+ and other transition metal ions. Clay minerals. 10, 313-345.
MICHAEL, P. J. & MCWHINNIE, W. R. (1989): Mossbauer and ESR studies of the
thermochemistry of illite and montmorillonite. Polyhedron. 8, 2709-2718.
MORICHON, E., ALLARD, T., BEAUFORT, D., & PATRIER, P. (2008): Evidence of native
radiation-induced paramagnetic defects in natural illites from unconformity-type
uranium deposits. Physics and chemistry of minerals. 35, 339-346.
MOSSER, C., BOUDEULLE, M., WEBER, F., & PACQUET, A. (1996): Ferriferous and
vanadiferous kaolinites from the hydrothermal alteration halo of the cigar lake
uranium deposit (Canada). Clay Minerals. 31, 291-299.
MULLER, J. P. (1989): Tracing kaolinites through their defect centers: kaolinite
paragenesis in a laterite (Cameroon). Economic geology. 84, 694-707.

- 19 -
MURRAY, H. H. (1988): Kaolin minerals: their genesis and occurrences. Reviews in
mineralogy. 19, 67-89.
NARASIMHA REDDY, S., RAO, P. S., RAVIKUMAR, R. V. S. S. N., & REDDY, B. J. (2001):
EPMA, optical EPR and IR spectral studies of prehnite mineral. Indian Journal of
physics Part A. 75, 429-432.
NASSAU, K. (1984): Gemstone enhancement. Butterworths.
NASSAU, K. (1983): The physics and chemistry of color. Wiley Interscience.
NASSAU, K., PRESCOTT, B. E., & WOOD, D. L. (1976): The deep blue Maxixe-type
color center in beryl. American mineralogist. 61, 100-107.
NAZAROVA, G. S., OSTASHCHENKO, B. A., MITROFANOV, V. YA., SHILOVA, O. YU., &
ZARIPOVA, L. D. (1991): Nature of the color of prehnite. Zhurnal Prikladnoi
Spektroskopii. 53, No. 2, 305-310.
NESSE, W. D. (2012): Introduction to mineralogy. Second edition. Oxford University
Press.
PAN, Y., BOTIS, S. M., & NOKHRIN, S. (2006) Applications of Natural
Radiation-Induced Paramagnetic Defects in Quartz to Exploration in Sedimentary
Basins. Journal of China University of Geoscience, 17, 258-271.
PINNAVAIA, T. J. (1982): Electron spin resonance studies of clay minerals.
Developments in Sedimentology. 34, 139-161.
- 20 -
RAMAKRISHNAN, G., SWAMY, M. B. V. L. N., RAO S. P., & SUBRAMANIAN S. (1991):
EPR of vanadyl ion in a natural mineral, apophyllite. Proceedings of chemistry
sciences. 103, 613-619.
RINK, W. J. (1997): Electron spin resonance (ESR) dating and ESR applications in
quaternary science and archaeometry. Radiation measurements, 27, 975-1025.
ROSSMAN, G. R. (1994): Colored varieties of the silica minerals. Reviews in
Mineralogy and Geochemistry, 29, 433-467.
SCHAIDER L.A., SENN D.B., BRABANDER D.J., MCCARTHY K.D., & SHINE J.P. (2007):
Characterization of zinc, lead, and cadmium mine waste: Implications for transport,
exposure and bioavailability. Environ. Sci. Tech. 41, 4164-4171.
SOLNTSEV, V. P., KHARCHENKO, E. I., LEBEDEV, A. S., KLYAKHIN, V. A., & IL’IN, A. G.
(1981): Nature of color centers and EPR of a manganese-activated beryl. Journal of
applied spectroscopy. 34, 111-115.
SYMONS, M. C. R. (1971): Pramagnetic centers in or on various oxides. The Journal of
Physical Chemistry. 76, 3095-3098.
VASSILIKOU-DOVA, A.B. & EFTAXIAS, K. (1991): Electron spin resonance of Mn2+ in
hemimorphite. Crystal Res. Tech. 27, 117-120.
VASSILIKOU-DOVA, A. B., & LEHMANN, G. (1988): EPR of V4+ in apophyllite.
Physical Status Solidi B. 147, 691-697.
- 21 -
WALDER I.F., & CHAVEZ W.X. JR. (1995) Mineralogical and geochemical behavior of
mill tailing material produced from lead-zinc skarn mineralization, Hanover, Grant
County, New Mexico, USA. Environ. Geol. 26, 1-18.
WAUCHOPE, R. D. & HAQUE, R. (1971): ESR in clay minerals. Nature physical
science. 233, 141-142.
WEIL, J. A., & BOLTON, J. R. (2007): Electron paramagnetic resonance, elementary
theory and practical applications. Wiley Interscience.
YURIEVA, T.M., KUSTOVA, G.N., MINYUKOVA, T.P., POELS, E.K., BLIEK, A.,
DEMESHKINA, M.P., PLYASOVA, L.M., KRIEGER, T.K. & ZAIKOVSKII, V. I. (2001):
Non-hydrothermal synthesis of copper-, zinc- and copper–zinc hydrosilicates. Mater.
Res. Innov. 5, 3–11.

- 22 -
Chapter 2
Radiation-induced defects in apophyllites. I. The NH2 free radical in
fluorapophyllite
The NH2 free radical, which is one of the most studied triatomic molecules
and is widely used as spin labels in biophysical and biomedical research, has not been
reported in mineral lattices. Fourier-transform infrared (FTIR) spectrum supports
electron microprobe analyses that fluorapophyllite on the cavity walls in a phonolite
(North Bohemia, Czech Republic) contains ammonium NH4+. Powder and
single-crystal electron paramagnetic resonance (EPR) spectra of this fluorapophyllite,
with and without γ irradiation, disclose at least four paramagnetic defects, including
two previously reported VO2+ centers, the NH2 free radical and an oxygen-associated
center. The spin-Hamiltonian parameters of the NH2 free radical have been
determined from single-crystal EPR data and show that this molecule is oriented
parallel to (and rapidly rotated about) the crystallographic c axis. The NH2 free radical
in fluorapophyllite, most likely formed from radiolysis of the NH4+ ion, remains
stable after annealing at 300 °C, but is bleached at 340 °C.

23
2.1 Introduction
Radiation-induced defects in layer silicates (e.g., kaolinite, dickite, illite, and
montmorillonite) have received considerable interests, because they are sensitive
dosimeters for determining and monitoring the migration of radionuclides in the
Earth’s surface environments and have direct relevance to long-term nuclear waste
disposal (e.g., Clozel et al., 1994; Allard & Muller, 1998; Götze et al., 2002; Allard et
al., 2003, 2007; Sorieul et al., 2005; Morichon et al., 2008). For example, Clozel et al.
(1994), on the basis of a detailed powder electron paramagnetic resonance (EPR)
spectroscopic study, distinguished three radiation-induced defects in kaolinite:
Centers A and A’ are trapped holes on apical oxygen from Si–O bonds, and Center B
is a hole trapped on an oxygen shared by two Al octahedra. Clozel et al. (1994) used
EPR spectra measured on oriented films to demonstrate that Centers A and A’ have
orthogonal orientations. They also showed that the hyperfine structure of Center B
arises from interaction with two equivalent 27Al nuclei (I = 5/2 and natural isotope
abundance = 100 %). Confirmation of these structural models requires additional data:
e.g., (1) localization of the unpaired spin on a single oxygen atom, (2) characteristic
hyperfine structures arising from interaction with a 29Si nucleus (i.e., Centers A and
A’), and (3) defect orientations and their relationships to specific bond and other
symmetrical directions in the ideal structures. All of these data can be obtained by
analysis of single-crystal EPR spectra but are missing for radiation-induced defects in
layer silicates, because of the fact that these minerals invariably occur in ‘‘clay’’
sizes.

24
Apophyllites [(K,Na)Ca4Si8O20(F,OH)•8H2O, P4/mnc] consist of tetrahedral
SiO4 sheets alternating with layers of K, Ca, F and H2O (Colville et al., 1971; Rouse
et al., 1978; Pechar, 1987) and are analogues of layer silicates (Aldushin et al., 2004;
Chen et al., 2007). Apophyllites usually occur as large crystals that are amenable to
single-crystal EPR studies. Therefore, detailed structural information for
radiation-induced defects in apophyllites obtainable from single-crystal EPR studies
can be used for better understanding of similar defects in other layer silicates.
Accordingly, we initiated a single-crystal EPR study on a suite of natural apophyllites
with or without γ irradiation. Results reported herein show that a specimen of
ammonian fluorapophyllite contains at least four paramagnetic centers. These centers
correspond to two previously reported VO2+ centers (Bershov & Marfunin, 1965;
Vassilikou-Dova & Lehmann, 1988), a new NH2 free radical and a new
oxygen-associated center. This contribution focuses on the quantitative
characterization, formation, and thermal stability of the NH2 free radical, which has
never been reported to occur in mineral lattices. The oxygen-associated center, which
is particularly relevant to radiation-induced defects in layer silicates (Clozel et al.,
1994; Allard et al., 2003), is better resolved in a sample of hydroxylapophyllite and
will be dealt with in a subsequent contribution.
2.2 Sample and experimental techniques
A sample of short prismatic fluorapophyllite crystals of ~ 1–2 mm long on the
cavity walls in a phonolite (North Bohemia, Czech), from the University of

25
Saskatchewan reference mineral collection, was used in this study. Selected crystals
were polished for electron microprobe analysis (EMPA) and pulverized for
Fourier-transform infrared (FTIR) and powder electron paramagnetic resonance (EPR)
spectroscopic analyses. Samples for EPR analyses have been subject to γ irradiation
by use of a 60Co source (a dose of ~ 5.4 Mrad) at room temperature. A γ irradiated
powder sample has also been sequentially annealed in air from 100 to 460 °C, at an
interval of 40 °C for 30 min each. EMPA was performed on a JEOL JXA-8600
superprobe equipped with three wavelength-dispersive spectrometers, at the
Department of Geological Sciences, University of Saskatchewan. Analytical
conditions included an accelerating voltage of 15 kV, beam current of 10 nA, beam
diameter of ~ 5 µm and the following standards: quartz (Si), γ-Al garnet (Al), jadeite
(Na), magnetite (Fe), diopside (Ca), sanidine (K), fluorite (F), and tugtupite (Cl).
Fluorapophyllite was mixed with KBr for FTIR measurements on a BIO-RAD
FTS-40 spectrometer with a resolution of 4 cm-1, at the Saskatchewan Structure
Science Centre (SSSC), University of Saskatchewan. Powder and single-crystal EPR
spectra were measured on a Brucker EMX spectrometer with an ER4119 cavity at
SSSC. Experimental conditions for powder EPR measurements at room temperature
included microwave frequencies from ~ 9.38 to ~ 9.75 GHz, modulation frequency of
100 kHz, modulation amplitude of 0.06 mT and microwave powers from 2 to 20 mW.
Spectral resolutions were ~ 0.098 mT (i.e., 2048 field data points over 200 mT) or
0.117 mT (1024 points over 120 mT). Calibration of the magnetic field was made by
use of 2,2-diphenyl-1-picrylhydrazyl (DPPH).

26
Single-crystal EPR measurements at room temperature were made on a γ
irradiated crystal of ~ 1 mm x 1 mm x 2 mm in size. Crystal alignment was
accomplished by use of its prismatic form and the perfect {001} cleavage.
Single-crystal spectra were collected for two orthogonal rotation planes: one
perpendicular to the crystallographic axis c is denoted the xy plane, and the other
containing both a and c is designated the xz plane. Experimental conditions for
single-crystal EPR measurements included a microwave frequency of ~ 9.84 GHz,
modulation frequency of 100 kHz, modulation amplitude of 0.06 mT and a
microwave power of 20 mW. The spectral resolutions were ~ 0.012 mT (i.e., 1024
field data points over 13 mT), and the angle interval of each measurement was 5° for
both planes.
Data analyses of powder and single-crystal EPR spectra, including angle
correction, fitting of spin-Hamiltonian parameters and spectral simulations, were all
made by use of the EPR–NMR software package of Mombourquette et al. (1996).
2.3 Results
2.3.1 Chemical composition and FTIR spectrum
Table 2.1 lists six electron microprobe analyses of the sample investigated in
this study. Chemical formulas calculated on the basis of Σ(Si + Al) = 8 atoms show
that this sample approaches the endmember fluorapophyllite but has a significant
deficiency in the K site. We interpret this deficiency to arise from a substitution of
NH4+ for K+ (Marriner et al., 1990; Cave, 2002). This interpretation is supported by

27
the characteristic ~1460 cm-1 band in the FTIR spectrum (Figure 2.1; Marriner et al.,
1990), which is in fact a doublet consisting of two Gaussian bands at ~ 1460 cm-1 and
~ 1440 cm-1. The latter is close to the 1430–1435 cm-1 band that has been assigned to
the bending mode of NH4+ in other silicates (Solomon & Rossman, 1988; Vonckenet
al., 1993). However, the stretching vibration and combination bands between 3300
cm-1 and 2800 cm-1 (Voncken et al., 1993) are not resolved owing to pronounced O–H
bands (Figure 2.1; Matsueda et al., 1981). Also, quantitative analysis on the absolute
amount of NH4+ in fluorapophyllite was not attempted.
2.3.2 Single-crystal EPR spectra
Single-crystal EPR spectra of the γ irradiated fluorapophyllite (Figure 2.2)
disclose at least four paramagnetic defects: two V4+ centers (Bershov &Marfunin,
1965; Vassilikou-Dova & Lehmann, 1988); an oxygen-associated center and a NH2
free radical (see below). Additional weak absorption lines, which are detectable only
at a few orientations (Figure 2.2b) but do not correspond to the previously reported
Mn2+ or Ti3+ centers in apophyllites (Bershov et al., 1965; Bershov, 1970), are not
discussed further here.
The two previously reported V4+ centers (Bershov & Marfunin, 1965;
Vassilikou-Dova & Lehmann, 1988) are readily identified by their characteristic 51V
hyperfine structures (I = 7/2 and natural isotope abundance = 100 %). Spectral
simulations for selected orientations show that the spin-Hamiltonian parameters
reported by Vassilikou-Dova & Lehmann (1988) give excellent predictions for the

28
observed line positions of these two centers. These V4+ centers in apophyllites have
been interpreted by Vassilikou-Dova & Lehmann (1988) to be VO2+ radicals at the K
and Ca sites.
Table 2.1 Chemical composition of fluorapophyllite from North Bohemia, Czech Republic.
Analysis 1 2 3 4 5 6 Average Std
SiO2(wt.%) 54.1 54.7 55.2 54.9 54.9 54.1 54.6 0.45
Al2O3 0.18 0.23 0.20 0.19 0.19 0.11 0.18 0.04
FeO 0.00 0.03 0.00 0.01 0.01 0.00 0.01 0.01
CaO 24.60 24.78 24.56 24.51 24.56 24.60 24.60 0.09
Na2O 0.08 0.11 0.10 0.10 0.10 0.07 0.09 0.02
K2O 3.21 3.13 3.22 3.16 3.20 3.27 3.20 0.05
F 2.09 2.17 2.13 2.08 2.13 2.09 2.12 0.03
Cl 0.00 0.00 0.00 0.01 0.02 0.01 0.01 0.01
-O≡F,Cl 0.88 0.91 0.89 0.88 0.89 0.88 0.89
Total 83.3 84.2 84.5 84.0 84.2 83.4 83.9 0.49
Structural formula on the basis of ∑(Si + Al) = 8
Si 7.969 7.961 7.967 7.968 7.968 7.981 7.969
Al 0.031 0.039 0.033 0.032 0.032 0.019 0.031
Ca 3.883 3.868 3.799 3.815 3.819 3.891 3.845
Na 0.022 0.030 0.028 0.028 0.030 0.019 0.026
K 0.603 0.581 0.593 0.585 0.593 0.614 0.595
F 0.976 0.999 0.975 0.957 0.976 0.976 0.977
Cl 0.000 0.000 0.000 0.003 0.004 0.003 0.002
The single-crystal EPR spectra of a third center are characterized by a single
broad absorption line (with an average linewidth of ~ 0.4 mT) in both xy and xz
planes (Figure 2.2a), indicative of a center of a single unpaired electron (S = 1/2 and

29
axial symmetry. The fitted spin-Hamiltonian parameters for this center include g// =
2.00214(1) and g⊥ = 2.04438(1), with the former axis approximately along the
crystallographic axis c (Figure 2.2b). This center is closely comparable in the
principal g values to Centers A [g// = 2.049(2) and g⊥ = 2.007(1)] and A’ [g// =
2.039(2) and g⊥ = 2.008(1)] in kaolinite (Clozel et al., 1994) and is shown by
single-crystal EPR spectra of a hydroxylapophyllite to possess complex satellite peaks
arising from several defect pairs (i.e., biradicals; Part II).
Figure 2.1 FTIR spectrum of fluorapophyllite from North Bohemia, Czech Republic.
The 1460 cm-1 band and its shoulder at 1440 cm-1 are marked by arrows.
The single-crystal EPR spectra of the forth center consist of at most 18 and 24
absorption lines in the xy and xz planes, respectively, although the number of lines at

30
most orientations are usually less owing to peak overlapping (Figure 2.3). For
example, the spectrum with B//a contains 3 sets of 3 equally-spaced peaks with
intensity ratios of approximately 1:1:1:2:2:2:1:1:1 for a total of 12 equal-intensity
lines (Figure 2.2a). Similarly, the spectrum with B//c has 7 peaks with intensity ratios
of 1:2:2:2:2:2:1 for a total of 12 equal-intensity lines (Figure 2.2b). This type of
spectra is indicative of an S = 1/2 center that has an axial symmetry and a hyperfine
structure arising from interaction with one nucleus of I = 1 and two equivalent nuclei
of I = 1/2, and all three nuclei have natural isotope abundances of ~ 100 %. Together
with the presence of NH4+ as suggested by EMPA results and the FTIR spectrum, we
interpret this center to be the NH2 free radical.
Figure. 2.2 Representative single-crystal EPR spectra of γ irradiated
fluorapopphyllite: (a) magnetic field B approximately parallel to a and (b) B
approximately parallel to c, illustrating the two VO2+ centers at the Ca and K sites
(i.e., labelled as CaVO2+ and KVO2+, respectively; Vassilikou-Dova & Lehmann,
1988), the oxygen-associated center (g⊥ = ~ 2.044 and g// = ~ 2.002) and the NH2
free radical. Unidentified peaks are highlighted by question marks.

31
Figure 2.3 The angle dependence of line position data (i.e., roadmap) of the NH2
free radical in: (a) approximately the xz plane and (b) approximately the xy plane.
Rotation angle 0° in both planes corresponds approximately to an a axis. Solid
circles represent experimental data points, and solid lines predicted by the fitted
spin-Hamiltonian parameters (Table 2.2).
The single-crystal EPR spectra of the NH2 free radical can be described by a
spin-Hamiltonian of the form:
H =βeS•g•B + Σ (S•Ai•Ii + Ii•Pi•Ii - βnIi•gi•B) ……………...……………..(2.1)
where βe and βn are the electron and nuclear magneton, respectively, and i denotes the
14N and two equivalent 1H nuclei. The parameters to be optimized are matrices g,
A(14N) and P(14N) and A(1H). The total number of line-position points used for
optimization was 1982, of which 17 were assigned a weighing factor of 0.1 owing to
peak overlapping. The final value of the root-mean squares of weighted differences
(RMSD) between the calculated and observed line positions was 0.08 mT, which is
less than half of the average linewidth (~ 0.21 mT) for the NH2 free radical. The signs
of the hyperfine matrices A and P cannot be determined from EPR data alone.
Following theoretical studies (Michaut et al., 1975; Austen et al., 1994), we adopted a

32
negative sign and a positive sign for the isotropic parts of A for 1H and 14N,
respectively (Table 2.2). The quadrupole matrix P(14N) was fitted but not included in
Table 2.2, because it has a negligible effect (i.e., its inclusion in the optimization did
not result in any notable change in the RMSD value).
Table 2.2 Spin-Hamiltonian parameters of the NH2 free radical in γ irradiated fluorapophyllite. Principal direction
Matrix Y k Principal value (Yk)
θ (˚) φ (˚)
2.00786(2) 0.00112(1) 0.00081(2) 1 2.00923(2) 80.9(2) 46.3(4)
2.00798(2) 0.00077(1) 2 2.00679(2) 89.4(1) 316.2(1)
G
2.00215(1) 3 2.00197(2) 170.9(2) 42(2)
-0.416(5) -0.006(4) -0.031(8) 1 3.221(4) 0.6(1) 224(10)*
-0.412(5) -0.030(8) 2 -0.408(5) 90.6(1) 234(19)
A(14N)/geβe
(mT)
3.221(4) 3 -0.421(8) 89.8(2) 324(19)
-2.01(1) -0.01(1) 0.00(1) 1 -2.02(2) 90(1) 53(40)
-2.02(1) 0.00(1) 2 -2.01(2) 90(2) 323(40)
A(1H)/geβe
(mT)
-1.59(1) 3 -1.59(1) 0(1) 43(178)*
-2.01(1) -0.00(1) 0.01(1) 1 -2.02(1) 87(2) 241(58)
-2.01(1) 0.01(1) 2 -2.00(1) 89(3) 151(57)
A(1H)/geβe
(mT)
-1.59(1) 3 -1.59(1) 2(1) 43(53)*
*φ (tilting angle from the crystallographic axis a) is meaningless, when θ (tilting angle from c) is
close to the c axis.
2.3.3 Powder EPR spectra
Powder EPR spectra of fluorapophyllite without γ irradiation also disclose the
two VO2+ centers (Bershov & Marfunin, 1965; Vassilikou-Dova & Lehmann, 1988)
and the NH2 free radical established by the single-crystal EPR spectra. Powder EPR
spectra of this fluorapophyllite after γ irradiation show significant increases in
intensity of these three centers and disclose the oxygen-associated center as well
(Figure 2.4a). Isochronal annealing experiments show that fluorapophyllite exhibits

33
only a minor weight lost (< 1 wt.%) before 300 °C but a major dehydration (~ 10
wt.%) between 420 °C and 460 °C. The oxygen-associated hole-like center decreases
significantly in intensity at 220 °C and disappears completely at 300 °C (Figure 2.4b).
The NH2 free radical remains stable to at least 300 °C but is bleached completely at
340 °C (Figure 2.4b). The VO2+ radical at the K site shows a major decrease in
intensity between 300 °C and 340 °C and disappears completely at 420 °C (Figure
2.4b).
2.4 Discussion
2.4.1 Identification and spin-Hamiltonian parameters of the NH2 free
radical
The NH2 free radical with 7 valence electrons has a bent configuration of point
symmetry C2v and a HNH bond angle of ~ 104° (Austen et al., 1994). It is one of the
most studied triatomic molecules (e.g., Foner et al., 1958; Hills & Cook, 1982;
Funken et al., 1990; Austen et al., 1994; Tonooka et al., 1997; Airne & Brill, 2001)
and is widely used as spin labels in biophysical and biomedical research (Eaton et al.,
2005). However, significant differences in the reported spin-Hamiltonian parameters,
particularly the 14N hyperfine constants, were apparent among the early EPR studies
of this radical (Table 2.3; Foner et al., 1958; Morton & Smith, 1966; Rao & Symons,
1971; Michaut et al., 1975). These differences have since been shown by theoretical
studies (Michaut et al., 1975; Austen et al., 1994; Airne & Brill, 2001) to originate
from the motions of this molecule in various matrices. For example, Michaut et al.

34
(1975) noted that g, A(14N) and A(1H) in NH3 crystals are all axially symmetric about
the C2 axis (i.e., the bisector of the HNH angle) and interpreted them to arise from a
free rotation of the radical in the NH3 lattice during the time-scale of their EPR
experiments. Similarly, Foner et al. (1958) noted that the NH2 radical in the argon gas
rotates freely, even at 4.2 K, which gives rise to a total hyperfine splitting of ~ 6.8 mT.
Significantly wider hyperfine structures have been reported for the NH2 radical in
other matrices. For example, the NH2 radicals in KNH2SiO3 crystals and ammoniated
zeolites have the total hyperfine splittings of ~ 13 mT and ~ 12 mT, respectively
(Morton & Smith, 1966; Vantsand & Lunsford, 1972).
The fitted spin-Hamiltonian parameters of the NH2 free radical in
fluorapophyllite (Table 2.2) are broadly comparable to those of its counterparts in the
literature (Table 2.3). The negligible quadrupole matrix P(14N) is consistent with
those reported by Hills & Cook (1982) and Tonooka et al. (1997), who showed that
the 14N quadrupole parameters of the NH2 radical in the ground state 2B1 are two
orders of magnitude less than their corresponding hyperfine constants. The axial
symmetries of all matrices g, A(14N) and A(1H) (Table 2.2) indicate that the NH2
radical in fluorapophyllite also rotates rapidly (cf., Michaut et al., 1975). Moreover, g,
A(14N) and A(1H) all have their unique principal axes approximately along the
crystallographic c axis, suggesting a rotation of the NH2 radical about this axis. It is
unclear, however, why the isotropic part of the proton hyperfine (1.87 mT) for the
NH2 free radical in fluorapophyllite is notably smaller than the average value of ~ 2.4
mT in the literature (Table 2.3).

35
Figure 2.4 Comparison of powder EPR spectra of γ irradiated fluorapophyllite: (a)
without annealing illustrating the two VO2+ centers at the Ca and K sites [i.e.,
CaVO2+ and KVO2+, which are readily distinguished by their distinct gz and Az values
(marked) but share similar gx, gy, Ax and Ay values (hence marked together as Ca,
KVO2+(g⊥ and A⊥)] and the oxygen-associated center (g⊥ = ~ 2.044 and g// = ~
2.002); the NH2 free radical is visible but overshadowed by the VO2+ centers and the
oxygen-associated center; and (b) annealed between 300 °C and 460 °C. Note that
the NH2 radical is visible in the 300 °C spectrum between 330 mT and 340 mT
(outlined) but is bleached at 340 °C. Also note that the oxygen-associated center
with g⊥ = 2.044 (marked by the dashed line) is now bleached completely. Also the
VO2+ center at the K site (KVO2+) decreases significantly in intensity between 300
°C and 340 °C and disappears completely at 420 °C.
The only previously reported occurrence of the NH2 free radical in minerals is
that of Yang et al. (2007), who suggested the observed NH2 radical in green quartzite
originated from radiolysis of NH3 in fluid inclusions. Although the substitution of
NH4+ for K+ is not uncommon in feldspars [including the presence of buddingtonite
(NH4)AlSi3O8; Solomon & Rossman, 1988; Voncken et al., 1993] and other K-rich

36
minerals, the NH2 radical has not been found in naturally or artificially irradiated
feldspars (Petrov, 1994). Matyash et al. (1982) reported two N-associated
paramagnetic defects (NH3+ and N2-) inmicrocline from pegmatites, which have been
shown by Petrov (1994) to be the CH3 and NO2 free radicals, respectively. To the best
of our knowledge, the NH2 free radical in fluorapophyllite is the first occurrence of
this radical in mineral lattices.
Attempts to detect the NH2 free radical in fluorapophyllite at 90 K have been
made but were not successful. This result may be attributable to severe line
broadening related to a restricted rotation of this molecule in the fluorapophyllite
lattice at cryogenic temperatures.
2.4.2 Formation and thermal stability of the NH2 free radical in
fluorapophyllite
Extensive literature exists on the formation of the NH2 freeradical from the
dissociation of ammonia in (and on the surfaces of) various matrices via radiolysis or
photolysis (Vantsand & Lunsford, 1972; Kartel et al., 1978; Wolkow & Avouris,
1988)
NH3 + H+ + e � NH2 + H2 ................................................................... (2.2)
Also the reaction between NH4+ and NH3 is well known
NH4+ � NH3 + H+ ................................................................................ (2.3)
It is possibly, therefore, that the NH2 free radical formed from the NH4+ ion
via these two reactions, which can be combined as

37
NH4+ + e � NH2 + H2 ..............................................................................(2.4)
Reaction (3) for the formation of the NH2 radical in fluorapophyllite can be
rewritten as
≡Si–OH2–NH4+ + e � ≡Si–OH2–NH2 + H2 .............................................(2.5)
where ≡ represents three Si–O bonds and the NH4+ ion (and presumably the NH2
radical as well) occupies the K site coordinated to eight water molecules (Colville et
al., 1971; Rouse et al., 1978; Pechar, 1987). Reaction (2.5) is closely comparable to
the formation of the NH2 free radical on the surfaces of γ irradiated ammonia silica
(Kartel et al., 1978). Other reactions such as NH4+ � NH3
+ + H0 and NH3+ + e �
NH2 + H0 can be ruled out on the basis of the absence of the paramagnetic NH3+ and
H0 species in the EPR spectra. Reactions (2.4) and (2.5) also suggest that the NH2 free
radical may be common in K-feldspars and other ammonium-bearing minerals.
However, detection of the NH2 free radical in most minerals by conventional EPR
techniques may be difficult owing to the motional effects.
The dehydration process of fluorapophyllite observed in our isochronal
annealing experiments is similar to those reported by previous studies (Ståhl et al.,
1987; Marriner et al., 1990; Ståhl, 1993; Wlodyka, 2002). For example, Marriner et al.
(1990) observed two stages of dehydration for both fluorapophyllite (310–334 °C and
430–450 °C) and hydroxylapophyllite (300–310 °C and 400–422 °C). Marriner et al.
(1990) noted that ammonium apophyllites dehydrate at slightly lower temperatures
than their ammonium-free counterparts. Marriner et al. (1990) also reported that the
NH4+ band at 1460 cm-1 disappears in the IR spectrum of a partially dehydrated

38
fluorapophyllite, but did not give the temperature value. The present study shows that
the NH2 free radical remains stable after annealing at 300 °C but is bleached
completely at 340 °C (Figure 2.4b).
Table 2.3 Literature data of the NH2 free radical in selected matrices.
Matrix g A(14N)/geβe A(1H)/geβe Experiment Reference
Argon(gas) 2.0048 1.04 2.38 4.2 K 1
Ammonia(gas) 2.0046(3) 1.52 2.54 77 K 2
Water 2.003 4.1(//), 0(⊥) 2.4 77 K 3
3.82 3.14
0.14 2.55
KNH2SO3 (single crystal)
0.03 2.50
77 K 4
2.0047 1.67 -3.09
2.0047 1.67 -2.15
NH3 (single crystal)
2.0011 0 -2.10
77 K 5
g//=2.0022 +3.5 2.6
±0.3
Zeolite (synthetic)
±0.3
77 K 6
Reference 1, Foner et al. (1958); 2, Smith & Seddon (1970); 3, Rao & Symons (1971); 4, Morton
& Smith (1966); 5, Michaut et al. (1975); and 6, Vantsand & Lunsford (1972).
Ståhl (1993) showed that the dehydration process of fluorapophyllite is
diffusion controlled (i.e., a kinetic effect) and occurs as a two steps reaction: the first
step expels one of the eight water molecules in the K coordination sphere, and the
second step destabilizes the K and Ca coordinations to form an amorphous phase. The
observed thermal stabilities of the two VO2+ centers (Figure 2.4b) are in agreement
with this two steps reaction. For example, the marked decrease in intensity of the
VO2+ center at the K site between 300 °C and 340 °C (Figure 2.4b) is similar to the
disappearance of this center after annealing of an India apophyllite at ~220 °C
(Ramakrishnan et al., 1991), supporting the first step involving the K site (cf.,

39
Vassilikou-Dova & Lehmann, 1988). The convergence of the two VO2+ centers at 420
°C corresponds to the collapse of both K and Ca sites and the formation of the
amorphous phase (Ståhl, 1993; Wlodyka, 2002).
2.5 Conclusions
Single-crystal EPR spectra of γ-ray irradiated fluorapophyllite measured at
room temperature revealed a NH2 radical. The best-fit spin-Hamiltonian parameters
indicate that the NH2 radical occupies the K site and spins rapidly along the
molecular C2 axis that coincides with the crystallographic c axis. These data,
together with results frm FTIR and electron microprobe analyses, suggest that the
NH2 radical most likely formed from the radiolysis of the NH4+ ion. This is the first
report of the NH2 radical in a mineral lattice.
2.6 References
AIRNE, A.R. & BRILL, A.S. (2001): Nuclear spin-state mixing in the NH2 radical.
Phys. Rev. A 63, 052511-1-10.
ALDUSHIN, K., JORDAN, G., RAMMENSEE, W., SCHMAHL, W.W. & BECKER, H.-W.
(2004): Apophyllite (001) surface alteration in aqueous solutions studied by HAFM.
Geochim. Cosmochim. Acta 68, 217-226.
ALLARD, T. & MULLER, J.P. (1998): Kaolinite as an in situ dosimeter for past
radionuclide migration at the Earth's surface. Appl. Geochem. 13, 751–765.

40
ALLARD, T., ILDEFONSE, P., PEREZ DEL VILLARD, L., SORIEUL, S., PELAYO, M., BOIZOT,
B., BALAN, E. & CALAS, G. (2003): Radiation-induced defects in dickites from the El
Berrocal granitic system (Spain): relation with past occurrence of natural
radioelements. Eur. J. Mineral. 15, 629–640.
ALLARD, T., CALAS, G. & ILDEFONSE, P. (2007): Reconstruction of past U migration
in a sedimentary deposit (Coutras, France): Implications for a radwaste repository.
Chem. Geol. 239, 50-63.
AUSTEN, M.A., ERIKSSON, L.A. & BOYD, R.J. (1994): A density functional theory
study of the free radicals NH2, NF2, NCl2, PH2, PF2, and PCl2. Canad. J. Chem. 72,
698-704.
BERSHOV, L.V. (1970): Isomorphism of titanium in minerals. Izv.Akad. Nauk SSSR,
12, 47-54.
BERSHOV, L.V. & MARFUNIN, A.S. (1965): Vanadyl ion in minerals. Izv. Akad. Nauk
SSSR Ser. Geol., 9, 42-52.
BERSHOV, L.V., MARFUNIN, A.S., & MINEEVA, R.M. (1965): Vanadyl ion in
minerals. Izv. Akad. Nauk. Ser. Geol. 9, 42-52.
CAVE, L.C. (2002): Apophyllite weathering and the aqueous geochemistry of a
Karoo breccia pipe. PhD thesis, Dept. Geological Sciences, University of Cape
Town.
CHEN, C.G., YEBASSA, D. & RAGHAVAN, D. (2007): Synthesis, characterization, and
mechnical properties of evaluation of thermally stable apophyllite vinyl ester
nanocomposites. Polym. Advan. Technol. 18, 574-581.
41
CLOZEL, B., ALLARD, T. & MULLER, J.P. (1994): Nature and stability of
radiation-induced defects in natural kaolinites: new results and reappraisal of
published works. Clays Clay Minerals 42, 657–666.
COLVILLE, A.A., ANDERSON, C.P. & BLACK, P.M. (1971): Refinement of the crystal
structure of apophyllite: I. X-ray diffraction and physical properties. Amer. Mineral.
56, 1222-1233.
EATON, S.S., EATON, G.R. & BERLINER, L.J. (2005): Biomedical EPR – part B:
methodology, instrumentation and dynamics. Biol. Magn. Reson. 24, 472.
FONER, S.N., COCHRAN, E.L., BOWERS, V.A., Jen, C.K. (1958): Electron spin
resonance spectra of the NH2 and ND2 free radicals at 4.2. K. J. Phys. Lett., 1, 91-92.
FUNKEN, K., ENGELS, B., PEYERIMHOFF, S.D. & GREIN, F. (1990): Study of the
hyperfine coupling constants of the molecules NH2, NHD and ND2. Chem. Phys. Lett.
172, 180-186.
GÖTZE, J., PLÖTZE, M., GÖTTE, TH., NEUSER, R.D., & RICHTER, D.K. (2002):
Cathodoluminescence (CL) and electron paramagnetic resonance (EPR) studies of
clay minerals. Mineral. Petrol., 76, 195-212.
HILLS, H.W. & COOK, J.M. (1982): Fine and hyperfine parameters for NH2 in
X2B1(100). J. Mol. Spec. 94, 456-460.
KARTEL, N.T., TSYBA, N.N., KABAKCHI, A.M., & STRELKO, V.V. (1978): A study of
the products from the radiolysis of the gamma-irradiated ammonia–silica system. J.
Appl. Spectrosc., 28, 339-343.

42
MARRINER, G.F., TARNEY, J. & LANGFORD, J.I. (1990): Apophyllite group: effects of
chemical substitutions on dehydration behaviour, recrystallization products and cell
parameters. Mineral. Mag. 54, 567-577.
MATSUEDA, H., MIURA, Y., & RUCKLIDGE, J. (1981): Natroapophyllite, a new
orthorhombic sodium analog of apophyllite; I, Description, occurrence, and
nomenclature. Am. Mineral., 66, 410-415.
MATYASH, I.V., BAGMUT, N.N., LITOVCHENKO, A.S. & PROSHKO, V.YA (1982):
Electron paramagnetic resonance study of new paramagnetic centers in
microcline-perthites from pegmatites. Phys. Chem. Minerals 8, 149-152.
MICHAUT, J.P., RONCIN, J. & MARX, R. (1975): NH2 radicals trapped in NH3 single
crystals and various polycrystalline ammonia matrices. Chem. Phys. Lett. 36,
599-605.
MOMBOURQUETTE, M.J., WEIL, J.A. & MCGAVIN, D. (1996): EPR-NMR ussers’
manual. Department of Chemistry, University of Saskatchewan, Saskatoon,
Saskatchewan.
MORICHON, E., ALLARD, T., BEAUFORT, D. & PATRIER, P. (2008): Evidence of native
radiation-induced paramagnetic defects in natural illite from unconformity-type
uranium deposits. Phys. Chem. Minerals (on line).
MORTON, J.R. & SMITH, D.R. (1966): Electron spin resonance spectra of l5N-centered
radicals at low temperatures. II. The radiolysis of potassium sulfamate. Canad. J. Chem.
44, 1951-1955.
PECHAR, F. (1987): The X-ray diffraction refinement of the crystal structure of natural
apophyllite. Crystal. Res. Technol. 22, 1041-1046.
43
PETROV, I. (1994): Lattice-stabilized CH3, C2H5, NO2, and O1− radicals in feldspar
with different Al-Si order. Amer. Mineral. 79, 221-239.
RAMAKRISHNAN, G., SWAMY, M.B.V.L.N., RAO, P.S., & SUBRAMANIAN, S. (1991):
EPR of vanadyl ion in a natural mineral, apophyllite. J. Chem. Sci., 103, 613-619.
RAO, K.V.S. & SYMONS, M.C.R. (1971): Unstable intermediates. Part XCVI. The
effect of hydrogen-bonding on the e.s.r. parameters for NH2, NH3+, and H2CN. J.
Chem. Soc. A, 2163-2166.
ROUSE, R.C., PEACOR, D.R. & DUNN, P.J. (1978): Hydroxyapophyllite, a new mineral,
and a redefinition of the apophyllite group. II, Crystal structure. Amer. Mineral. 63,
199-202.
SMITH, D.R. & SEDDON, W.A. (1970): Electron spin resonance spectra of 15N labeled
amino radicals. Canad J. Chem. 48, 1938-1942.
SOLOMON, G.C. & ROSSMAN, G.R. (1988): NH4+ in pegmatitic feldspars from the
southern Black Hills, South Dakota. Amer. Mineral. 73, 818-21.
SORIEUL, S., ALLARD, T., MORIN, G., BOIZOT, B., & CALAS, G. (2005): Native and
artificial radiation-induced defects in montmorillonite. An EPR study. Phys. Chem.
Minerals, 32, 1-7.
STÅHL, K. (1993): A neutron powder diffraction study of partially dehydrated
fluorapophyllite, KCa4(Si8O20)F·8H2O. Eur. J. Mineral. 5, 845-849.

44
STÅHL, K. (1987): A neutron diffraction and thermogravimetric study of the hydrogen
and dehydration behaviour in fluorapophyllite, KCa4(Si8O20)F·8H2O, and its partially
dehydrated form. Acta Cryst. B43, 517-523.
TONOOKA, M., YAMAMOTO, S., KOBAYASHI, K., & SATO, S. (1997): The microwave
spectrum of the NH2 radical: the hyperfine structure of the 2B1 pround electronic state.
J. Chem. Phys., 106, 2563-2568.
VANTSAND, E.F. & LUNSFORD, J.H. (1972): Electron paramagnetic resonance spectra
of NH2 radicals formed by γ irradiation of ammoniazted zeolites. J. Phys. Chem. 76,
2716-2718.
VASSILIKOU-DOVA, A.B. & LEHMANN, G. (1988): EPR of V4+ in apophyllite. Phys.
Stat.Sol. 147, 691-697.
VONCKEN, J.H.L., VAN ROERMUND, H.L.M., VAN DER EERDEN, A.M.J., JANSEN, J.B.H.
& ERD, R.C. (1993): Holotype buddingtonite, an ammonium feldspar without zeolitic
H2O. Amer. Mineral. 78, 204-209.
WLODYKA, R. (2002): Raman spectroscopic study of the dehydration behavior in
fluorapophyllite. Polsk. Towarz. Mineral. 20, 228-230.
WOLKOW, R. & AVOURIS, P. (1988): Atomic-resolved surface chemistry using
scanning tunneling microscopy. Phys. Rev. Lett., 60, 1049-1052.
YANG, L., MASHKOVTSEV, R., BOTIS, S. & PAN, Y. (2007): Multi-spectroscopic study
of green quartzite (Guizhou Jade) from the Qinglong antimony deposit, Guizhou
Province, China. J. China Univ. Geosci. 18, 383-386.

45
Chapter 3
Radiation-induced defects in apophyllites. II. An O- centre and
related O--O- pairs in hydroxylapophyllite
A hole-like centre present in natural hydroxylapophyllite without any
artificial irradiation has been investigated by single-crystal and powder electron
paramagnetic resonance (EPR) spectroscopy at 290 K and 90 K, and by three-pulse
electron spin echo envelope modulation (ESEEM) spectroscopy at 25 K. Calculated
matrices g, A(29Si), A(1H), A(39K) and P(39K) suggest it to be an O- centre at the
hydroxyl oxygen site and the unpaired electron in the 2pz orbital. A series of weak
satellite peaks accompanying the main absorption line in single-crystal EPR spectra
have been shown to arise from four geometrically distinct pairs of neighbouring O-
centres (i.e., biradicals). The spin Hamiltonian parameters of these O--O- pairs
provide further support for the O- model and its location at the hydroxyl oxygen site.
The O- centre in hydroxylapophyllite most likely formed from natural radiation and
can be enhanced by gamma-ray irradiation. It is annealed out at 300°C but can be
restored readily by gammaray irradiation. The presence of these O--O- pairs in the
hydroxylapophyllite is probably attributable to a high abundance of the O- centre in
this sample.

46
3.1 Introduction
In Part I of this series (Mao & Pan, 2009), we investigated an NH2 free
radical in a gamma-ray-irradiated fluorapophyllite by electron paramagnetic
resonance (EPR) spectroscopy. The single-crystal EPR spectra of the
gamma-ray-irradiated fluorapophyllite also disclosed another simple spin (S = 1/2)
centre with g// = ~2.002 and g⊥ = ~2.044, which was not present before gamma-ray
irradiation. Therefore, this centre apparently formed in this sample by gamma-ray
irradiation as well (hence a radiation-induced defect) and is similar to the common
O- centre in various minerals and other materials (e.g., Marfunin, 1979; Che &
Tench, 1983; Murphy & Chiesa, 2004). This centre has also been observed in
single-crystal and powder EPR spectra of a natural hydroxylapophyllite without any
artificial irradiation, which have significantly higher signal-to-noise ratios than those
of the gamma-ray-irradiated fluorapophyllite and disclose a series of weak satellite
peaks accompanying the main absorption line. As part of our continuing efforts to
better characterise oxygen-associated radiation-induced defects in layer silicates, we
have analyzed this O- centre in the natural hydroxylapophyllite by using both
continuous-wave (CW) single-crystal EPR spectra and pulsed electron spin echo
envelope modulation (ESEEM) spectra. Results reported herein confirm the
O- centre to reside at the hydroxyl oxygen site. Moreover, the satellite peaks are
shown to arise from four geometrically distinct pairs of O- centres (i.e., biradicals;
Mashkovtsev et al., 2007; Weil & Bolton, 2007).

47
Apophyllites (KCa4Si8O20(F,OH)•8H2O) are layer silicates with ‘‘puckered’’
Si8O20 sheets alternating with layers of K+, Ca2+, F-, OH- and H2O (Figure 3.1;
Taylor & Náray-Szabó, 1931; Chao, 1971; Colville et al., 1971; Prince, 1971; Bartl
& Pfeifer, 1976; Rouse et al., 1978; Pechar, 1987). The ‘‘puckered’’ Si8O20 sheets
form from 4- and 8-membered rings of SiO4 tetrahedra. The interlayer K+ cation is
coordinated to eight water molecules in the form of a squat tetragonal prism,
whereas Ca2+ is coordinated to 2 water molecules, 4O2- ions and 1F- or OH- ion. In
fluorapophyllite, the F- ion at equipoint 2a (0,0,0) is surrounded by a planar group of
4Ca2+ ions. Prince (1971), on the basis of his neutron diffraction study of a
‘‘fluorapophyllite’’ crystal, suggested that the F- ion is coordinated to a hydrogen
H(3) to form an HF molecule. Bartl & Pfeifer (1976) showed that H(3) in
intermediate fluorapophyllite and hydroxylapophyllite is not bonded to fluorine but
to oxygen as an OH- group. Dunn et al. (1978) noted that crystals from the locality
investigated in Prince (1971) have intermediate compositions between
hydroxylapophyllite and fluorapophyllite. Dunn et al. (1978) also showed that
hydroxylapophyllite belongs to the space group P4/mnc, with a = 8.978(3) Å and c =
15.83(1) Å. Rouse et al. (1978) noted that X-ray data of hydroxylapophyllite do not
provide unequivocal evidence for the expected positional disorder of the hydroxyl
oxygen atom at equipoint 4e (i.e., half at 0,0,z and half at 0,0,‾z), which was then
kept at 0,0,0 (Figure 3.1).

48
3.2 Samples and experimental techniques
A suite of apophyllite specimens from the University of Saskatchewan
reference mineral collection has been investigated by reconnaissance single-crystal
EPR experiments. Prismatic to platy hydroxylapophyllite crystals (~2 to ~15 mm long
and ~4 to ~20 mm in diameter) from an unknown locality were then chosen for
detailed single-crystal EPR and ESEEM measurements. Selected crystals of this
specimen were also polished for electron microprobe analysis (EMPA) and pulverised
for Fourier-transform infrared (FTIR) analysis, powder EPR analysis, and inductively
coupled plasmamass spectrometry (ICP-MS) analysis. The sample used for powder
EPR measurements was also subject to first a series of step-wise, isochronal annealing
experiments from 100 °C to 300 °C, at an interval of 25 °C and a duration of 30
minutes each step, and then gamma-ray irradiation in a 60Co source at room
temperature for a dose of ~32 kGy. Another powder sample without annealing was
also irradiated in the 60Co source at room temperature for a dose of ~50 kGy.
Electron microprobe analysis was performed on a JEOL JXA-8600 superprobe
equipped with three wavelength-dispersive spectrometers, at the Department of
Geological Sciences, University of Saskatchewan. Analytical conditions included an
accelerating voltage of 15 kV, beam current of 10 nA, beam diameter of ~5 µm and
the following standards: quartz (Si), γ-Al garnet (Al), Jadeite (Na), magnetite (Fe),
diopside (Ca), sanidine (K), fluorite (F) and tugtupite (Cl). ICP-MS analysis was
made on a Perkin-Elmer Sciex Elan 5000 instrument, using the HF-HNO3
acid-dissolution method. Powder sample of hydroxylapophyllite was mixed with KBr
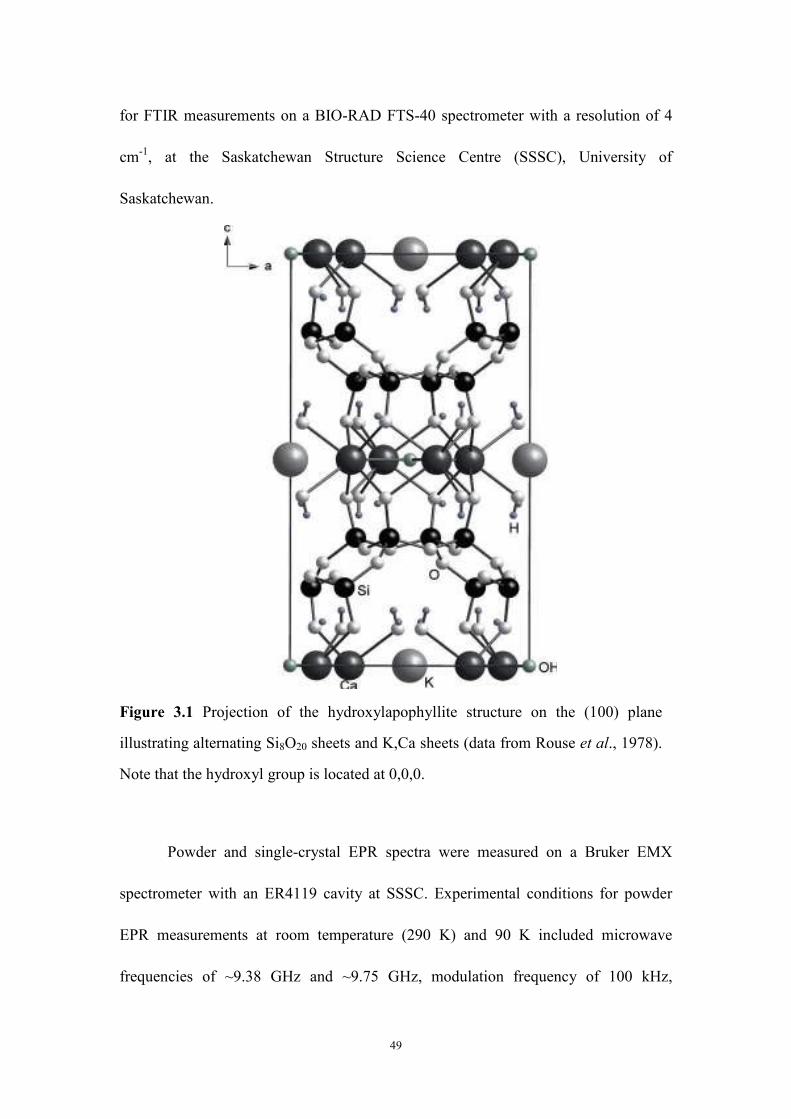
49
for FTIR measurements on a BIO-RAD FTS-40 spectrometer with a resolution of 4
cm-1, at the Saskatchewan Structure Science Centre (SSSC), University of
Saskatchewan.
Figure 3.1 Projection of the hydroxylapophyllite structure on the (100) plane
illustrating alternating Si8O20 sheets and K,Ca sheets (data from Rouse et al., 1978).
Note that the hydroxyl group is located at 0,0,0.
Powder and single-crystal EPR spectra were measured on a Bruker EMX
spectrometer with an ER4119 cavity at SSSC. Experimental conditions for powder
EPR measurements at room temperature (290 K) and 90 K included microwave
frequencies of ~9.38 GHz and ~9.75 GHz, modulation frequency of 100 kHz,

50
modulation amplitude of 0.05 mT and microwave powers of ~2 mW. Spectral
resolutions were ~0.015 mT (i.e., 1024 field data points over 15 mT) or 0.014 mT
(1024 points over 14 mT). Calibration of the magnetic field was made by use of the
free radical 2,2-diphenyl-1-picrylhydrazyl (DPPH; g = 2.0036).
Reconnaissance single-crystal EPR measurements at 290 K and 90 K were
made on several crystals. One crystal of ~1 mm x 1 mm x 2 mm in size was then
selected for detailed single-crystal EPR measurements at these two temperatures in
two orthogonal planes: with the magnetic field B parallel to (001) and (110) faces.
Experimental conditions for single-crystal EPR measurements included a microwave
frequency of ~9.38 GHz, modulation frequency of 100 kHz, modulation amplitude of
0.05 mT, and microwave power of 2 mW. The spectral resolutions were ~0.013 mT
(1024 field data points over 13 mT). The angle interval of each measurement was 5°
for both planes. The Bruker ER 218G1 goniometer used in this study has an angle
uncertainty of ~0.2°.
ESEEM spectra at 25 K were collected on a Bruker E580-10 Elexsys with a
liquid He Oxford CF935 cryostat. Spectra were obtained with a three-pulse scheme
(π/2–τ–π/2–T–π/2–echo) with four-step phase cycling (4096 points @ 8 ns steps).
Time domain ESEEM spectra were baseline corrected, zero-filled, apodized, and
Fourier transformed to give frequency domain spectra. Because three-pulsed ESEEM
gives rise to blindspots that arise from an oscillating τ dependence, ESEEM spectra
were also recorded as a function of τ and later summed (24 spectra @ 8 ns steps).
Because of a finite dead time the absolute value spectra of Fourier transformed spectra

51
is usually presented. However, this results in distortions in the ESEEM spectra,
especially at the lower frequencies, such those for 39K and 29Si. To minimize these
effects, the data were reprocessed using cross term averaging (Van Doorslaer et al.,
1999; 48 points @ 64 ns steps).
ESEEM spectra at a rotation angle of every 10° were collected on a crystal
mounted with the rotation axis in the (001) face. As the CW EPR spectra do not show
any site splitting, all eight symmetry related sites are excited simultaneously by the
microwave pulse. As such, angle corrections (accurate to ~0.5°) had to be calculated
directly from the fitting of the 29Si ESEEM spectra, which were well resolved. Angle
corrections indicated that the rotation axis was ~4.5° from the [110] direction.
ESEEM spectra were then simulated using SIMEND (Nilges et al., 2009), with the
addition of a routine to simulate dead-time effects using FFT (Keijzers et al., 1987)
and a routine to simulate the additional effects of cross-term averaging. Because the
observed modulations were very weak, the contributions from the various nuclei
could be considered independently.
3.3 Results
3.3.1 Chemical composition and FTIR spectrum
The average of 12 EPMA analyses for the sample investigated in this study is
given in Table 3.1. This sample approaches the hydroxylapophyllite end-member,
except for a minor substitution of Ca for K (Table 3.1). This substitution is also
evident in hydroxylapophyllite analyses listed in Dunn et al. (1978), where charge
balance is maintained partly by a concomitant substitution of Al3+ for Si4+. In

52
hydroxylapophyllite of this study, however, the amounts of Al3+ and Fe3+ are
negligible. Two other plausible substitutions for maintaining charge balance involve
O2- for OH- and vacancy at the K site (Table 3.1). The presence of impurity O2- ions at
the hydroxyl site can also explain the absence of X-ray diffraction evidence for the
positional disorder (Rouse et al., 1978). Unlike the ammonium-bearing
fluorapophyllite reported in Part I (Mao & Pan, 2009), the characteristic N–H bands at
~1460 and ~1440 cm-1 are absent in the FTIR spectrum of hydroxylapophyllite (not
shown). ICP-MS analysis of this sample yielded trace amounts of Rb (162 ppm), Fe
(192), Mn (2) and V (3).
Table 3.1 Composition of hydroxylapophyllite.
Analysis Average (n = 12) Standard deviation
SiO2 (wt%) 53.0 0.9
Al2O3 0.04 0.02
Fe2O3 0.01 0.01
CaO 25.5 0.3
Na2O 0.05 0.01
K2O 4.09 0.09
F 0.01 0.01
Cl 0.00 0.00
-O≡F, Cl 0.00 0.00
Total 82.8 1.1
∑(Si + Al + Fe) = 8
Si 7.992
Al 0.007
Fe 0.001
Ca 4.120
Na 0.017
K 0.788
F 0.005
Cl 0.000
wt% is weight percent

53
3.3.2 Single-crystal EPR spectra
The single-crystal EPR spectra of hydroxylapophyllite are distinct from those
of fluorapophyllite (Mao & Pan, 2009). For example, the two pronounced VO2+
centres and the radiation-induced NH2 free radical observed in fluorapophyllite (Mao
& Pan, 2009) are absent in hydroxylapophyllite, even after gamma-ray irradiation.
The single-crystal EPR spectra of hydroxylapophyllite measured at 290 K disclose a
single pronounced absorption line of ~0.4 mT wide at all orientations, which is
accompanied by a series of poorly resolved satellite peaks. The main absorption line
arises from the same centre that was observed in gamma-ray-irradiated
fluorapophyllite (and tentatively interpreted to be an O- centre in Mao & Pan, 2009).
However, this centre in hydroxylapophyllite is visible without any artificial irradiation.
Reconnaissance single-crystal EPR examinations also identified this centre (including
its satellite peaks) in two other apophyllite specimens (i.e., Gaspé, Quebec and
Wasson’s Bluff, Nova Scotia) without any artificial irradiation. However, the EPR
spectra of the hydroxylapophyllite specimen are almost an order of magnitude higher
in intensity than those of the Quebec and Nova Scotia samples.
This O- centre is better resolved in the single-crystal EPR spectra measured at
90 K, with the main absorption line narrowed down to ~0.17 mT. Again, only one
main absorption line is observed in both (001) and (110) planes, indicative of a single
unpaired electron S = 1/2 and an axial symmetry. Moreover, the weak satellite peaks
(~0.14 mT wide) accompanying the main absorption line are now clearly resolved at
most orientations (Figure 3.3). Spectral simulations show that all satellite peaks are
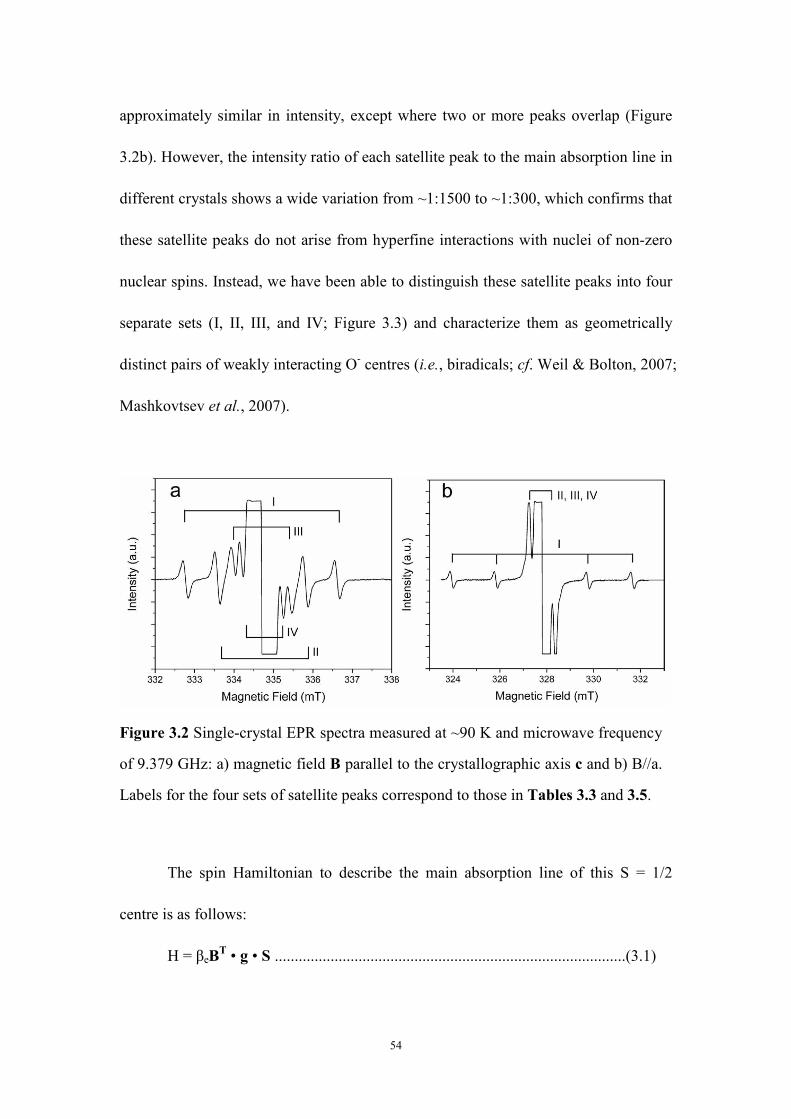
54
approximately similar in intensity, except where two or more peaks overlap (Figure
3.2b). However, the intensity ratio of each satellite peak to the main absorption line in
different crystals shows a wide variation from ~1:1500 to ~1:300, which confirms that
these satellite peaks do not arise from hyperfine interactions with nuclei of non-zero
nuclear spins. Instead, we have been able to distinguish these satellite peaks into four
separate sets (I, II, III, and IV; Figure 3.3) and characterize them as geometrically
distinct pairs of weakly interacting O- centres (i.e., biradicals; cf. Weil & Bolton, 2007;
Mashkovtsev et al., 2007).
Figure 3.2 Single-crystal EPR spectra measured at ~90 K and microwave frequency
of 9.379 GHz: a) magnetic field B parallel to the crystallographic axis c and b) B//a.
Labels for the four sets of satellite peaks correspond to those in Tables 3.3 and 3.5.
The spin Hamiltonian to describe the main absorption line of this S = 1/2
centre is as follows:
H = βeBT • g • S ........................................................................................(3.1)

55
where βe is the electronic (Bohr) magneton. Matrix g has been fitted by use of the
software EPR-NMR (Mombourquette et al., 1996) for line-position data from the
spectra measured at both 90 K and 290 K (Table 3.2). The total line-position data used
for both temperatures are 296, and a uniform weighing factor of 1 was assigned to all
lines. The final values of the root-mean-squares of weighted differences (RMSD)
between calculated and measured line-position data at 90 K and 290 K are 0.01 and
0.02 mT, respectively, both of which are considerably less than half of their respective
average linewidths. The most salient features of matrix g are: (1) axial symmetry and
(2) the unique principal axis g// along the crystallographic c-axis (Table 3.2). The
principal g values in Table 3.2 are similar to those obtained from the
gamma-ray-irradiated fluorapophyllite (Mao & Pan, 2009).
The four sets of well-resolved satellite peaks (I, II, III and IV; Figure 3.3) can
be interpreted in terms of a pair of interacting spins (Weil & Bolton, 2007;
Mashkovtsev et al., 2007):
H = βeBT • (g1 • S1 + g2 • S2
T) + [(S1T • J • S2 + S2
T • J • S1)/2] ...............(3.2)
Here matrix J = JE + IID, where J is the scalar exchange energy and E is a 3 x
3 unit matrix (Mashkovtsev et al., 2007). Since the observed satellite peaks involve
pairs of similar centres, the principal values of g1 are expected to be equal to those of
g2. Depending upon the choice of possible centre pairs, the orientations of the two
g-axis sets are expected to be either exactly the same or very similar. If S1 = S2 = 1/2
and g1 = g2, the EPR transitions become independent of the exchange coupling, J, and
the singlet-triplet mixing is zero. As such, the presence of the singlet state can be

56
Figure 3.3 Angle-dependence of line-position data (i.e., road maps) of four sets of
satellite peaks I (a, b), II (c, d), III (e, f) and IV (g, h) in the (001) and (110) planes,
microwave frequency = 9.379 GHz. Solid circles represent experimental data, and
solid lines denote predictions from spin Hamiltonian parameters in Table 3.3. Note
that the ranges of magnetic field are kept the same for each plane to facilitate
comparison.

57
Table 3.2 Spin Hamiltonian parameters of the O- centre in hydroxylapophyllite
Principal directions
Matrix Y k Principal value Yk
θ (º) φ (º)
RMSD
Electronic Zeeman parameter from CW-EPR at 90 K and 290 K
2.04442(1) 0.00000(1) 0.00000(1) 1 2.04442(1) 90.00(1) 309*
2.04442(1) 0.00000(1) 2 2.04442(1) 90.00(1) 39*
g
(90 K) 2.00219(1) 3 2.00219(1) 0.00(1) 0*
0.01
2.04419(1) 0.00000(1) 0.00000(1) 1 2.04419(1) 90.01(2) 307*
2.04419(1) 0.00000(1) 2 2.04419(1) 90.00(2) 37*
g
(290 K) 2.00309(1) 3 2.00309(1) 0 0*
0.02
29Si, 1H and 39K hyperfine parameters from ESEEM at 25 K Distance(Å)
0.342 −0.130 −0.419 1 0.691 90.0 290.4
0.643 −0.156 2 0.654 51.1 200.4
Si1 A/h
(MHz) 0.098 3 −0.262 38.8 20.4
3.71
0.028 −0.024 −0.032 1 0.04 61.9 189.2
−0.003 −0.058 2 0.04 62.9 295.1
Si2 A/h
(MHz) −0.035 3 −0.09 40.9 61.3
7.10
1.242 0.962 0.627 1 1.790 75.9 21.5
−0.822 0.245 2 −1.051 14.2 204.2
H1a
A/h
−0.881 3 −1.201 90.6 291.6
4.35
1.211 0.923 0.553 1 1.707 77.2 21.3
−0.790 0.213 2 −1.030 12.9 207.4
H1b
A/h
−0.895 3 −1.151 91.3 291.6
4.41
−0.405 0.646 0.357 1 1.409 63.3 65.0
0.683 0.767 2 −0.697 26.7 247.0
H2a
A/h
−0.271 3 −0.706 90.8 335.4
4.84
−0.375 0.639 0.361 1 1.308 62.8 63.3
0.573 0.717 2 −0.667 27.2 243.7
H2b
A/h
−0.254 3 −0.697 90.2 333.4
4.94
0.783 −0.420 0.359 1 1.02 75.2 342.0
−0.373 −0.117 2 −0.51 14.8 162.0
H3 A/h
(MHz) −0.410 3 −0.51 90 253
5.41
−0.224 −0.299 0.089 1 0.66 74.3 290.1
0.484 −0.244 2 −0.33 15.7 110.1
H4 A/h
(MHz) −0.260 3 −0.33 90 200.1
6.22
−0.179 0.044 0.391 1 0.71 24.7 14.1
−0.343 0.098 2 −0.35 65.3 194.1
H5 A/h
(MHz) 0.521 3 −0.35 90 284.1
6.08
0.0052 0.0222 −0.0005 1 0.028 89.0 225.7
0.0062 −0.0005 2 −0.017 23.8 133.4
K1 A/h
(MHz) −0.0165 3 −0.017 66.2 316.1
6.32
−0.063 −0.002 0.002 1 0.150 0.5 354.5
−0.087 −0.000 2 −0.063 90.5 354.6
K1 A/h
(MHz) 0.150 3 −0.087 89.9 84.6
NA

58
Matrices g, A and P are for one of eight symmetrically related sites via the rotation group D4;
matrices g fitted from the main absorption line in single-crystal EPR spectra; Hyperfine matrices
A(29Si), A(1H), A(39K) and P(39K) from ESEEM spectra; * tilting angles relative to axis a (φ) are
meaningless when one tilting angle relative to axis c (θ) is close to zero. The sets of (θ, φ) and
(180° - θ, 180° + φ) are equivalent. RMSD is the root-mean-squares of weighted difference
between calculated and experimental line-position data. Distance calculated from the point-dipole
model. NA, not applicable.
Table 3.3 Spin Hamiltonian parameters of the four O--O- pairs in hydroxylapophyllite at 90 K.
Principal direction
Matrix Y k Principal value Yk θ (˚) φ (˚)
RMSD(mT)
I 2.04441(1) 0.00000(1) 0.00000(1) 1 2.04441(1) 90.0(2) 329(37) 2.04440(1) 0.00000(1) 2 2.04439(1) 90.0(2) 59(37)
g
2.00215(1) 3 2.00215(1) 0.0(2) 12* 1.350(1) 0.008(1) 0.000(1) 1 1.350(1) 90(2) 180.1(2) −2.639(1) 0.000(1) 2 1.288(1) 0(2) 0*
ID/geβe
(mT) 1.288(1) 3 −2.639(1) 90.0(2) 90.1(2)
0.02
II 2.04443(3) 0.00004(2) 0.00010(2) 1 2.04447(3) 90.0(1) 313(14) 2.04442(3) 0.00006(2) 2 2.04438(1) 89.8(1) 43(14)
g
2.00215(2) 3 2.00215(2) 0.2(2) 59(15) 0.369(2) −0.569(1) −0.976(3) 1 0.949(2) 105(1) 333(2) 0.372(2) −0.928(3) 2 0.895(3) 54.6(8) 254(3)
ID/geβe
(mT) −0.742(2) 3 −1.845(2) 39.3(1) 44.1(1)
0.03
III 2.04443(7) 0.00004(8) 0.00000(1) 1 2.04447(14) 90.0(1) 319(18) 2.04442(7) 0.00000(1) 2 2.04438(2) 90.1(1) 49(18)
g
2.00211(4) 3 2.00214(2) 0.0(2) 39* −0.238(3) 0.700(2) 0.00(1) 1 0.481(2) 90(30) 315.0(1) −0.242(3) 0.00(1) 2 0.459(3) 0(30) 45*
ID/geβe
(mT) 0.481(2) 3 −0.941(2) 90.0(1) 45.0(1)
0.03
IV 2.04438(6) 0.00000(4) 0.0000(2) 1 2.04438(5) 90.0(3) 324.4* 2.04438(6) 0.0000(2) 2 2.04438(5) 90.0(3) 44*
g
2.00214(8) 3 2.00214(4) 0.1(4) 16.6* 0.272(3) 0.00 (2) 0.0 (1) 1 0.272(3) 90(36) 63* 0.272(3) 0.0 (1) 2 0.272(3) 90(21) 333*
ID/geβe
(mT) −0.544(3) 3 −0.544(3) 0(2) 217*
0.09
Matrices g and ID are for one of eight symmetrically related sites by the rotation group D4. Note
that IID is exactly twice that of ID (Mashkovtsev et al., 2007). * tilting angles relative to an a axis
(φ) are meaningless when one tilting angle relative to the c axis (θ) is close to zero. The sets of (θ,
φ) and (180° -θ, 180° + φ) are equivalent. RMSD is the root-mean-squares of weighted difference
between calculated and experimental line-position data.

59
Figure 3.4 Room-temperature powder EPR spectra (microwave frequency = 9.38
GHz) of hydroxylapophyllite before and after isochronal annealing show that the O-
centre starts to decrease in intensity at 225 °C and is bleached at 300 °C. The
spectrum of the thermally bleached sample after a ~32 kGy gamma-ray irradiation
shows ~80 % restoration of the O- centre.
neglected, and the spin system can be described by an effective triplet-state
Hamiltonian with S = 1.
H = βeBT • g • S + ST • ID • S ..................................................................(3.3)
Indeed, fitting using equation 2 but forcing g1 = g2 gave exactly the same
results as those of fitting with equation 3, except that the values of the triplet-state ID
tensor are one-half those of IID (Mashkovtsev et al., 2007). Fitting using equation 2
but allowing independent g1 and g2 yielded generally equivalent g1 and g2 in each case,
except that the g-maximum and g-minimum axes are always interchanged (see also

60
Mashkovtsev et al., 2007). We will show below that IID is determined almost entirely
by the distant dipole–dipole coupling. Therefore, it is highly unlikely that such a large
rotation of axes occurs. Moreover, in the case of biradical IV, where the internuclear
axis is parallel to the symmetry axis, no rotation should be expected. These
considerations led us to report only spin Hamiltonian parameters g and ID from the
simpler equation 3 (Table 3.3).
The total line-position data used for fitting of I, II, III and IV are 448, 324, 204
and 404 (and corresponding sum of weighing factors = 448, 322, 200 and 404),
respectively. The final RMSD values for I, II and III are between 0.02 and 0.03 mT
(Table 3.3), smaller than half of their average linewidths. The larger RMSD value of
0.09 mT for IV (Table 3.3) is attributable to peak overlapping in the (001) plane. The
principal g values from these four biradicals are within analytical uncertainties to one
another and are indistinguishable from those obtained from the main absorption line at
90 K (Table 3.2). Matrices ID for all four biradicals are approximately axial in
symmetry (Table 3.3). The sign of ID can not be determined from fitting of the EPR
data, but the unique principal value of ID is taken to be negative based upon the
point-dipole model (Abraham et al., 1987).
3.3.3 Powder EPR spectra and thermal stability
The powder EPR spectra of the as-is hydroxylapophyllite show the O- centre
(Figure 3.4) and biradicals I and II at 90 K as well. A ~50 kGy γ-ray irradiation of this
sample results in a ~60 % increase in the intensity of the O- centre. The powder EPR

61
spectra of isochronally annealed hydroxylapophyllite show that the O- centre remains
essentially unchanged to 200 °C but starts to decrease in intensity at 225 °C and is
bleached at 300 °C (Figure 3.4). A ~32 kGy gamma-ray irradiation of the thermally
bleached sample restores the O- centre to ~80 % of its original intensity (Figure 3.4).
Figure 3.5 Stacked plots of the 29Si portion of the experimental and simulated
three-pulse ESEEM spectra as a function of rotation angles. Intensity in the vertical
axis unlabelled (arbitrary unit).
3.3.4 ESEEM spectra
While the CW spectra for the hydroxylapophyllite sample are strong, spin
echo spectra were not readily observed unless temperature was lowered significantly
below 77 K. The short relaxation times appear to be the result of concentration
induced dipolar coupling. Davies ENDOR of the crystal at 25 K yielded no
discernible spectral features, while Mims ENDOR showed the presence of a single
proton matrix peak at ~14.6 MHz. ESEEM spectra did show very weak modulation at

62
frequencies very close to those of 29Si and 1H at 2.9 MHz and 14.6 MHz. respectively
(Figure 3.5–3.7). Also observed are a number of other frequencies below 1 MHz
(Figure 3.8).
The 29Si ‘‘matrix’’ peak is actually split into three to eight pairs depending on
orientation (Figure 3.5). Spectral fittings show that these spectra can be readily
accounted for by one 29Si with a hyperfine splitting on the order of 0.5 MHz (Table
3.2). The anisotropic component of the 29Si hyperfine is equal to –0.62 MHz, which
corresponds to a distance (r) of 3.71 Å on the basis of the point-dipole model:
Tz = (2µ0/4π)(gβegnβn/r3) ........................................................................(3.4)
where Tz is the traceless part of hyperfine interaction (Tx = Ty = –Tz/2) and gn is equal
to –1.1097 for 29Si. This value is the same as that between the hydroxyl oxygen atom
and the nearest neighbor Si, while the orientation of the unique hyperfine axis is only
3.4° from this O–Si direction (Table 3.4). Simulations could be improved somewhat if
the next nearest Si is also included. The hyperfine constants obtained for this second
Si (Table 3.2) are close to those predicted for the next nearest neighbor Si (Table 3.4).
This second Si, however, gives rise to much weaker (the ESEEM intensity decreases
roughly as r-3) spectra with narrower width, hence larger uncertainty in the fitted
values.
Unlike the case for 29Si, proton ESEEM gives rise to complex and asymmetric
patterns (Figure 3.6 and 3.7). This can be attributed to a number of things. First, there
are two nonequivalent protons associated with each nearest neighbor water molecule.
Second, simulation shows that there are two slightly different subpopulations for each

63
of the two water protons (Figure 3.6). Finally, the expected distances for the nearest
neighbor protons are much larger than that seen for the nearest neighbor Si’s and as
such contributions from the protons in the next, next-next, and next-next-next nearest
shells are much more pronounced. To minimize the problems of the latter, we fixed
the hyperfine matrices for H6, H7, and H8 to the values calculated from the
point-dipole model and the ideal hydroxylapophyllite structure. The hyperfine
matrices were varied for H3, H4, and H5 but restricted to being axial and traceless.
This approach allowed good fits for the nearest sets of protons, H1 and H2. Distances
calculated using the pointdipole model are 4.35 Å and 4.41 Å for H1a and H1b,
respectively, which are slightly smaller (~0.2 Å ) than those from X-ray and neutron
diffraction experiments (Table 3.4). The values of 4.84 Å and 4.94 Å for H2a and H2b
are within experimental uncertainty of those from X-ray and neutron diffraction
(Table 3.4). It should be noted that the unit-cell parameters and atom positions at 25 K
(ESEEM experiments) may be slightly different from those determined from
room-temperature X-ray and neutron diffraction (Prince, 1971; Rouse et al., 1978).
The orientations of the unique hyperfine axes for H1 and H2 (Table 3.2) are also very
close to those reported for X-ray and neutron diffraction but, as one would expect, are
in the better agreement with those from the latter technique (Table 3.4). The distances
obtained by fitting H3, H4, and H5 are also close to those determined from X-ray and
neutron diffraction, despite the larger uncertainty in fitting the hyperfine matrices for
these protons as well as a number of assumptions made. In general, while the fits of
the proton part of the ESEEM spectra are inferior to those for 29Si, agreement is still

64
quite good, especially on the outer edges where only the nearest neighbor protons
contribute (Figure 3.7). In the central region the fit is typically the poorest, but this is
where overlaps from many more distant protons are expected to occur (Figure 3.6 and
3.7). Also, the spectra have a definite asymmetry, which at many orientations is well
fitted by spectral simulations. This asymmetry arises from angularly dependent
second-order hyperfine terms that will be differently phased for protons that have
different orientations of principal hyperfine axes.
Figure 3.6 Comparison of experimental and simulated ESEEM spectra at 25 K at a
rotation angle of 76° (θ = 76.1° and φ = 45.4°). The top simulation assumes a single
set of two inequivalent H2O protons while the lower simulation includes two sets for
each of the two inequivalent H2O protons.

65
A number of peaks centred between 0.4 and 1.0 MHz show maximum
intensity 45° off axis. This is consistent with these peaks arising from a quadrupolar
nucleus having its quadrupolar principal axes lying along or near a crystal axis. The
most likely candidate is 39K, which has a nuclear frequency of 0.69 MHz. Simulations
confirm this and show the positions of the ESEEM peaks are determined almost
entirely by the quadrupole tensor. For a nuclear spin of 3/2 and a quadrupole coupling
much larger than the hyperfine coupling, three peaks with a separation of
~3Pzz(3cos2θ - 1)/2 are expected to be centred around the 39K nuclear frequency. Also
seen are weak ∆mI = ±2 transitions centred around 1.2 MHz. The hyperfine coupling
is expected to split each of the three peaks into two but because it is so small, it only
affects the linewidth and intensity of the peaks. Another consequence of the small
hyperfine coupling is that contributions from more distant 39K nuclei will all add
together on top of the spectra from the nearest neighbor, although the amount that
they contribute decreases with increasing distance. As such, we include contributions
from K2, K3, and K4 at 7.92, 11.97, and 14.20 Å, respectively (X-ray data; Table 3.4)
but restrict the hyperfine matrices to those calculated using the point-dipole model [gn
is equal to 0.2606 for 39K]. Using these restricted values for K2, K3, and K4, we fit
the 39K quadrupole tensor (and assuming the same quadrupole tensor for all K atoms)
and the K1 hyperfine matrix (Table 3.2; Figure 3.8). The unique axis of the
quadrupole tensor is nearly coincident with the c-axis and shows a small rhombic
splitting. However, restricting the quadrupole tensor to be axial and having its axis
exactly along the c-axis had only a small increase in RMSD. The predicted O–K1
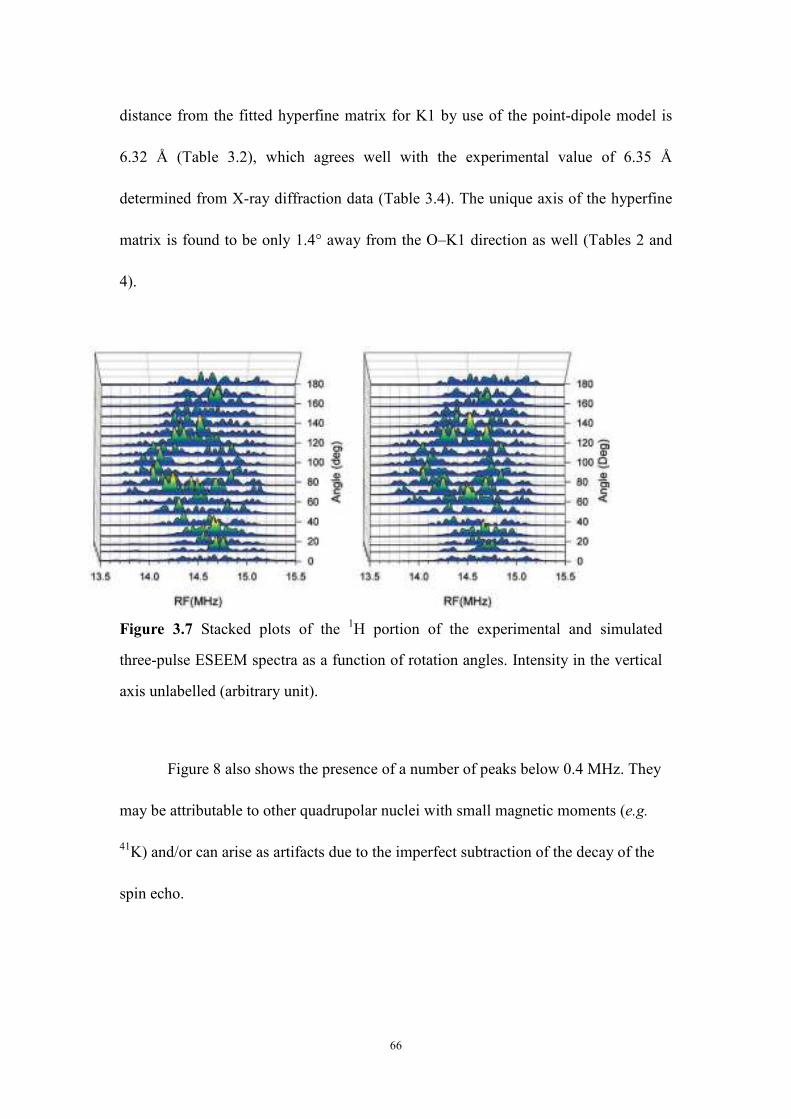
66
distance from the fitted hyperfine matrix for K1 by use of the point-dipole model is
6.32 Å (Table 3.2), which agrees well with the experimental value of 6.35 Å
determined from X-ray diffraction data (Table 3.4). The unique axis of the hyperfine
matrix is found to be only 1.4° away from the O–K1 direction as well (Tables 2 and
4).
Figure 3.7 Stacked plots of the 1H portion of the experimental and simulated
three-pulse ESEEM spectra as a function of rotation angles. Intensity in the vertical
axis unlabelled (arbitrary unit).
Figure 8 also shows the presence of a number of peaks below 0.4 MHz. They
may be attributable to other quadrupolar nuclei with small magnetic moments (e.g.
41K) and/or can arise as artifacts due to the imperfect subtraction of the decay of the
spin echo.
67
3.4 Discussion
Marfunin (1979) classified O- centres into two groups on the basis of the
location of the unpaired electron: 1) in the σ orbital, yielding g// ≤ ge and g⊥ > ge and
2) in the π nonbonding orbitals, resulting in g// and g⊥ switching places (relative to
those of the first group), and g// usually close to a bond direction. Marfunin (1979)
noted that the former group includes those formed from an impurity oxygen ion
substituting for a halogen ion and one oxygen ion nearest to a cation vacancy in
oxides of the MgO type. The second group includes a bridging oxygen trapping a hole
to compensate for the positive charge deficiency arising from one of the cations being
replaced by a lower-charged cation (e.g., the [AlO4]0 centre in quartz; Nuttall& Weil,
1981; Walsby et al., 2003) and free radicals XOmn- , such as CO3
-, SO4-, PO4
2-, SiO43-,
WO4-, VO4
2- and AsO42-. We caution that inclusion of free radicals XOm
n- as O-
centres is debatable owing to the fact that the unpaired electron in some of them (e.g.,
CO3- ) is not localised on a single oxygen ion.
3.4.1 O- centres in apophyllites
Bershov & Marfunin (1967) reported an unknown holelike centre (g1 = 2.0041,
g2 = 2.0106, g3 = 2.0451) in apophyllites, without any other details such as
experimental techniques or principal axis directions. Their g1 and g3 values are closely
comparable to g⊥ and g// of this study. It is unclear whether this hole-like centre in
Bershov & Marfunin (1967) is the O- centre of this study or not.

68
Figure 3.8 Stacked plots of the 39K portion of the experimental and simulated
three-pulse ESEEM spectra as a function of rotation angles. Note that intensity in
the vertical axis (unlabelled, arbitrary units) has been reduced five times (relative to
those in Figure 3.5 and 3.7) to show the strong 39K spectra.
Table 3.4 Orientations and distances from the OH group to selected Si, H and K atoms in hydroxylapophyllite.
X-ray diffraction Neutron diffraction
Orientation Distance Orientation Distance
Atoms θ (°) φ (°) r (Å) θ (°) φ (°) r (Å)
Si1 35.9 20.9 3.71 36.1 20.9 3.70
Si2 42.2 33.5 6.63 42.2 33.5 6.61
H1 68.4 16.6 4.56 72.0 21.1 4.54
H2 63.9 63.7 4.82 61.6 62.2 4.90
H3 71.7 346.1 5.33 74.9 342.6 5.36
H4 68.7 290.6 5.85 67.1 291.3 6.00
H5 24.5 13.4 6.37 24.8 15.1 6.11
H6 27.9 82.7 7.06 24.6 81.1 7.13
H7 42.5 85.8 8.46 49.6 84.1 8.57
H8 48.0 95.4 8.66 43.0 94.3 8.87
K1 90 45 6.35 90 45 6.34
K2 0 0 7.92 0 0 7.88
K3 48.6 0 11.97 48.7 0 11.94
K4 90 18.4 14.20 90 18.4 14.17
X-ray diffraction data from Rouse et al. (1978); Neutron diffraction data from Prince (1971).

69
The g// and g⊥ values suggest the O- centres in apophyllites to belong to
Marfunin’s (1979) first group. In particular, they are closely comparable to the well
established O- centres in apatites (Piper et al., 1965; Mengeot et al., 1975; Nokhrin et
al., 2005). For example, the O- centre in fluorapatite [g⊥ = 2.0522(2) and g// =
2.0018(2)] has been proposed to arise from trapping of a hole by an O2- ion
substituting for an F- ion, which is coordinated to 3Ca2+ ions in the same plane and 2
F-ions at 3.44 Å in the c-axis column. The presence of the two equivalent F- ions in
the F--O--F- configuration has been confirmed by the observed 19F hyperfine structure
with an intensity ratio of 1:2:1 (Piper et al., 1965). Similarly, Mengeot et al. (1975)
reported an OH--O--OH- centre in hydroxylapatite [g⊥ = 2.0683(2) and g// = 2.0018(2)]
and confirmed this configuration by the observed hyperfine structure [A// = 0.56(2)
mT and A⊥ = 0.59(8) mT] arising from the nearest proton at ~2.48 Å. The O- centre
in apophyllites, similar to its counterpart in fluorapatite, is surrounded by four Ca2+
ions in the same plane (Figure 3.1). However, the eight nearest F- ions to the O- centre
in fluorapophyllite are 10.15 Å away and the two F- ions along the c-axis are at 15.83
Å, which can account for the absence of any detectable 19F hyperfine structures.
Similarly, the nearest protons to the O- centre in hydroxylapophyllite are at ~4.56 Å,
which is expected by the point-dipole model to yield a hyperfine splitting of 0.1 mT
(i.e., narrower than the main absorption line, hence not detectable in CW-EPR spectra
either; Figure 3.2). By analogy with its counterpart in hydroxylapatite (Mengeot et al.,
1975), the unpaired electron of the O- centre in hydroxylapophyllite is expected to be
localized primarily on the 2pz orbital parallel to the c-axis.

70
Internuclear distances and directions calculated from 29Si, 1H and 39K
hyperfine matrices are consistent with the centre lying at or very near the 0,0,0
position (Tables 3.2 and 3.4), confirming its formation from the OH- group. This
location is best revealed by the nearest neighbour 29Si hyperfine data. For example,
the unique A(29Si) axis at θ = 38.8 and φ = 20.4 is nearly along the OH–Si direction
(35.9, 20.9) (Tables 3.2 and 3.4). The calculated distance of 3.71 Å from the 29Si
hyperfine splitting is in excellent agreement with the OH-Si distance of 3.71 Å from
X-ray diffraction (Rouse et al., 1978).
Figure 3.9 The positions of the hydroxyl oxygen atoms in the hydroxylapophyllite
structure (cf. Rouse et al., 1978) illustrating five possible O--O- pairs: I, II, III and IV
correspond to those in Tables 3.3 and 3.5 V is predicted to have a smaller splitting
(Table 3.5), which is not detectable in EPR spectra.

71
While the anisotropic part of the 29Si hyperfine coupling for Si1 can be
predicted quite well using the point-dipole model, one must evoke spin polarisation
and the resultant negative spin density to account for the isotropic part of the 29Si
hyperfine coupling (+0.36 MHz). Si2 is much farther away and as expected the
isotropic 29Si hyperfine is close to zero and can be neglected. For H1a/H1b a small
isotropic hyperfine is also observed (–0.15 MHz), which corresponds to a spin density
of –1.0 x 10⁻⁴ (i.e., slightly larger than that for Si1 at –0.8 x 10⁻⁴). For H2a/H2b the
isotropic hyperfine is essentially zero and can be neglected. While the H2 proton is
slightly farther away than H1, the difference in isotropic hyperfine could also be
attributable to the fact that the O(4)-H1 bond is slightly longer than the O(4)-H2 bond
(Chao, 1971; Prince, 1971; Rouse et al., 1978) and as such more polarisable.
The reason for two sets of slightly different proton splittings (H1a and H1b,
and H2a and H2b; Table 3.2) remains uncertain. The primary difference between the
two pairs of protons is a very slightly smaller anisotropic hyperfine implying a very
slightly longer distance (0.06 Å and 0.10 Å for H1 and H2, respectively). No such
extra splitting is observed in the 29Si spectra, but the smaller magnetic moment of 29Si
may preclude this. One possible mechanism may be symmetry reduction related to
positional disorder of the OH group (Rouse et al., 1978). D4 symmetry was used in
the analysis of the proton ESEEM spectra, while simulations using lower symmetries
(C4, D2 and C2) yielded poor fittings. Because the EPR spin Hamiltonian is invariant
to inversion, a symmetry reduction from D4h (P4/mnc) to D4 is possible and could
explain nonequivalent protons. Another possibility is that lower symmetry (C4 or D2h)

72
domains exist but on average the site symmetry is D4 or D4h. For example, partial
dehydration of fluorapophyllite is known to result in the loss of one of the water
molecules and loss of D4h symmetry at the K site, yet because the choice of which of
the eight waters is lost is random, the overall P4/mnc symmetry is retained (Ståhl,
1993).
The O- centre in fluorapophyllite obviously formed during gamma-ray
irradiation (Mao & Pan, 2009). It is plausible that this centre in hydroxylapophyllite
without any artificial irradiation formed from natural radiation. Unfortunately, the
source of natural radiation for this sample from an unknown locality can not be
deduced. Nevertheless, a radiation-induced origin is supported by the fact that this
centre can be enhanced by gamma-ray irradiation and can be restored by gamma-ray
irradiation after a complete thermal bleaching at 300 °C (Figure 3.4). Following
Mengeot et al. (1975), irradiation resulting in ionization of some OH groups and
removal of their hydrogen atoms is a potential mechanism for the formation of the O-
centre in hydroxylapophyllite. We note that paramagnetic atomic H0 expected from
this process has not been detected in our EPR spectra, although protons disassociated
by irradiation might have aggregated to form H2 or other diamagnetic species.
3.4.2 O--O- pairs in hydroxylapophyllite
The four sets of well-resolved satellite peaks (I, II, III and IV) have been
successfully fitted as pairs of O- centres (Table 3.3). The unique axis direction of ID
for I (90, 90) is along the b-axis [and its symmetrically related directions at (90, 0),

73
(90, 180) and (90, 270)]. The D3-axis of II at (39, 45) corresponds to a diagonal vector
from the origin through the centre of the unit cell (Figure 3.9). The D3-axis of III at
(90, 45) is along the [110] direction, and that of IV is along the c-axis (Figure 3.9).
These directions obviously correspond very well to those of the four pairs of
neighboring OH- ions in hydroxylapophyllite (Figure 3.9), or more accurately the four
pairs of O- centres derived from these OH- ions (cf. Mengeot et al., 1975). Moreover,
the fitted ID values from the four sets of satellite peaks in EPR spectra agree very well
with those predicted from the distances of these four OH--OH- pairs by assuming an
entirely dipolar interaction between two positively charged holes (Table 3.5; cf.
Abraham et al., 1987):
D = -(µ0/4π)(2g//2 + g⊥
2)βe2/(2r3) ...........................................................(3.5)
Such agreements between the fitted and predicted D value for all four sets of
satellite peaks confirm that they arise from the four geometrically distinct pairs of
well separated, weakly interacting O- centres (Figure 3.9). These results also provide
further support for the identification of the O- centre and its location at the hydroxyl
oxygen site. It should also be noted that because g is anisotropic, ID is expected to
have a small rhombic component except in the case of biradical IV for which the
internuclear axis is parallel to the symmetry axis (Table 3.3).
Figure 3.9 includes a fifth O--O- pair (V) with a separation of 18.2 Å ,
corresponding to a D value of 0.476 mT (Table 3.5). This pair with an orientation of
(29.6, 0) is expected to have the largest splitting of 0.6 mT in spectra with B//c, where
is not resolved owing to overlapping with the main absorption line (Figure 3.2a).
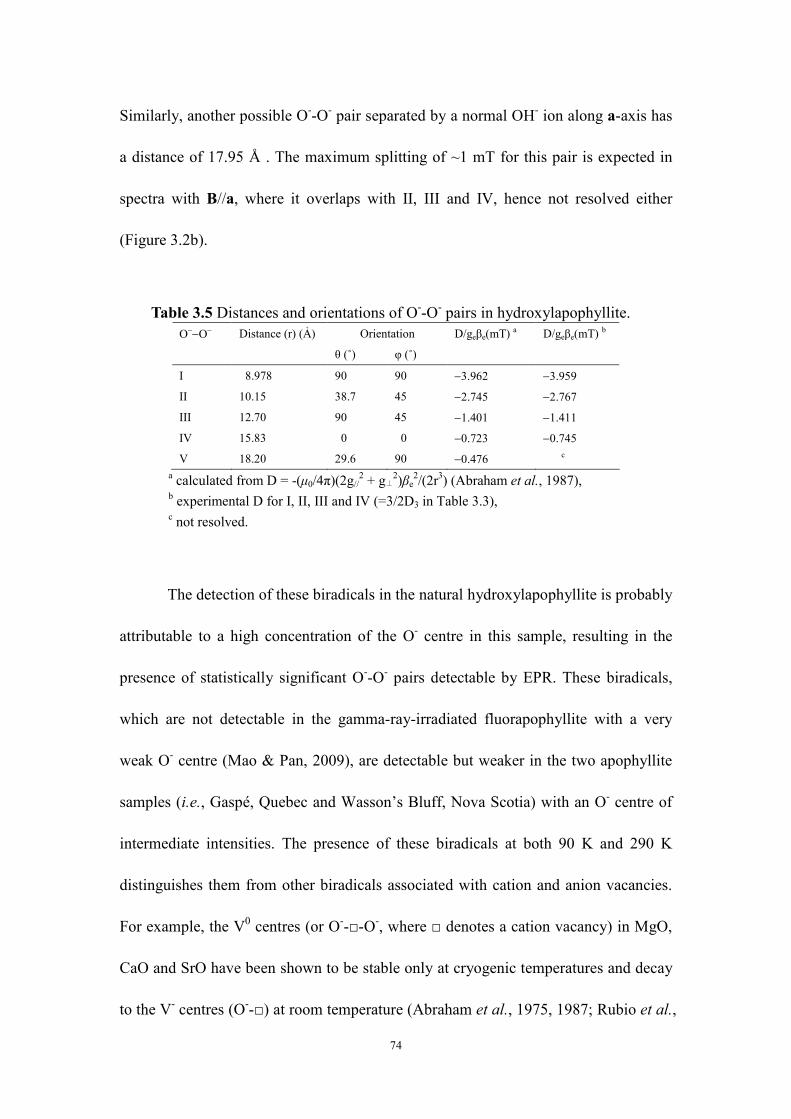
74
Similarly, another possible O--O- pair separated by a normal OH- ion along a-axis has
a distance of 17.95 Å . The maximum splitting of ~1 mT for this pair is expected in
spectra with B//a, where it overlaps with II, III and IV, hence not resolved either
(Figure 3.2b).
Table 3.5 Distances and orientations of O--O- pairs in hydroxylapophyllite. Orientation O−−O− Distance (r) (Ả)
θ (˚) φ (˚)
D/geβe(mT) a D/geβe(mT) b
I 8.978 90 90 −3.962 −3.959
II 10.15 38.7 45 −2.745 −2.767
III 12.70 90 45 −1.401 −1.411
IV 15.83 0 0 −0.723 −0.745
V 18.20 29.6 90 −0.476 c
a calculated from D = -(µ0/4π)(2g//2 + g⊥
2)βe2/(2r3) (Abraham et al., 1987),
b experimental D for I, II, III and IV (=3/2D3 in Table 3.3), c not resolved.
The detection of these biradicals in the natural hydroxylapophyllite is probably
attributable to a high concentration of the O- centre in this sample, resulting in the
presence of statistically significant O--O- pairs detectable by EPR. These biradicals,
which are not detectable in the gamma-ray-irradiated fluorapophyllite with a very
weak O- centre (Mao & Pan, 2009), are detectable but weaker in the two apophyllite
samples (i.e., Gaspé, Quebec and Wasson’s Bluff, Nova Scotia) with an O- centre of
intermediate intensities. The presence of these biradicals at both 90 K and 290 K
distinguishes them from other biradicals associated with cation and anion vacancies.
For example, the V0 centres (or O--□-O-, where □ denotes a cation vacancy) in MgO,
CaO and SrO have been shown to be stable only at cryogenic temperatures and decay
to the V- centres (O--□) at room temperature (Abraham et al., 1975, 1987; Rubio et al.,

75
1976). Similarly, Mashkovtsev et al. (2007) noted that their E1 centre [with one
unpaired electron each on two silicon cations on the opposite sides of an oxygen (O0)
vacancy] in quartz is unstable at room temperature.
3.4.3 Comparison with O- centres in other layer silicates
The original purpose of our single-crystal EPR studies of apophyllites was to
provide structural models for oxygen-associated radiation-induced defects in layer
silicates (e.g., kaolinite, dickite, illite, and montmorillonite; Clozel et al., 1994;
Sorieul et al., 2005; Morichon et al., 2008). Oxygen-associated radiation-induced
defects in layer silicates have attracted considerable interests, because they are
sensitive dosimeters for determining and monitoring the migration of radionuclides in
Earth’s surface environments and have direct relevance to long-term nuclear waste
disposal (e.g., Clozel et al., 1994; Allard & Muller, 1998; Allard et al., 2003, 2007;
Sorieul et al., 2005; Morichon et al., 2008). However, the structural models of all
radiation-induced defects in layer silicates are generally not well understood owing to
the fact that these minerals almost invariably occur in ‘‘clay’’ sizes and do not permit
quantitative single-crystal EPR studies. For example, powder EPR studies suggested
three O- centres in kaolinite: A and A’ interpreted to represent trapped holes on apical
oxygen from Si–O bonds, and B as a hole trapped on an oxygen linked to one or two
27Al nuclei (Clozel et al., 1994; Köksal et al., 2004). Confirmation of these structural
models requires additional data such as: 1) localisation of the unpaired spin on a
single oxygen atom, 2) detection and quantitative analysis of the hyperfine structures

76
arising from interaction with a 29Si nucleus (i.e., A and A’) and one or two 27Al nuclei
(B), and 3) defect orientations and their relationships to specific bonds and other
symmetrical directions in the ideal structures.
All proposed O- centres in kaolinite, dickite, illite and montmorillonite (Clozel
et al., 1994; Sorieul et al., 2005; Morichon et al., 2008) have principal g values
consistent with Marfunin’s (1979) second group. Therefore, the O- centres in
apophyllites can not be considered as direct analogues. Their difference arises from
the fact that the O2- and OH- ions for the formation of the O- centres in common layer
silicates are coordinated to cations in tetrahedral and/or octahedral sheets, unlike its
counterpart surrounded by interlayer Ca2+ ions in apophyllites. The characteristic
feature of the first-group O- centres in apophyllites and other minerals is their
relatively weak crystal field effects (Marfunin, 1979). The O- centres originated from
O2- and OH- ions in common layer silicates, on the other hand, form stronger bonds
with the octahedral or tetrahedral cations, resulting in the unpaired electron in the π
nonbonding orbitals (Marfunin, 1979). This explains the general absence of the first
group O- centres in common layer silicates. One notable exception is a proposed O-
centre in irradiated, synthetic fluorphlogopite, which is characterized by g values [g//
= 2.004(1) and g⊥ = 2.045(5)] of Marfunin’s (1979) first group and has been
interpreted to represent an O- ion replacing an F- ion linked to an octahedrally
coordinated Mg2+ cation (Novozhilov et al., 1969).

77
3.5 Conclusions
Single-crystal EPR spectra reveal an O- center and its biradical pairs in
hydroxylapophyllite, and single-crystal ESEEM spectra allow the identification and
location of multiple neighboring nuclei of the O- center. The best-fit
spin-Hamiltonian parameters suggest that the O- center forms from the hydroxyl
oxygen ion after the removal of its proton. This defect model is further confirmed by
excellent agreements between the best-fit directions and calculated distances of the
O--O- biradical pairs with those of the corresponding OH--OH- pairs. The O- center
is bleached out at 300 °C but can be readily restored by γ-ray irradiation.
3.6 References
ABRAHAM, M.M., BOLDU, O. & CHEN, Y. (1987): EPR and ENDOR of trapped-hole
centers in alkaline-earth oxides. In: Electronic Magnetic Resonance of the Solid State
(Weil, J.A., ed.). Canadian Society for Chemistry, 427-448.
ABRAHAM, M.M., CHEN, Y., BOATNER, L.A. & REYNOLDS, R.W. (1975): V- and V0
centers in CaO single crystals. Solid State Commun. 16, 1209-1213.
ALLARD, T. & MULLER, J.P. (1998): Kaolinite as an in situ dosimeter for past
radionuclide migration at the Earth's surface. Appl. Geochem. 13, 751–765.
ALLARD, T., ILDEFONSE, P., PEREZ DEL VILLARD, L., SORIEUL, S., PELAYO, M., BOIZOT,
B., BALAN, E. & CALAS, G. (2003): Radiation-induced defects in dickites from the El
Berrocal granitic system (Spain): relation with past occurrence of natural
radioelements. Eur. J. Mineral. 15, 629–640.

78
ALLARD, T., CALAS, G. & ILDEFONSE, P. (2007): Reconstruction of past U migration
in a sedimentary deposit (Coutras, France): Implications for a radwaste repository.
Chem. Geol. 239, 50-63.
BARTL, H. & PFEIFER G. (1976): Neutronenbeugungsanalyse des apophyllit
KCa4(Si4O10)2(F/OH).8H2O. Neues Jahrb. Mineral Monatsh, 58-65.
BERSHOV, L.V. & MARFUNIN, (1967): Electron-spin resonance of electron-hole
centres in minerals. Dokl. Akad. Nauk SSSR, 173, 410–412.
CHAO, G.Y. (1971): The refinement of the crystal structure of apophyllite. II.
Determination of the hydrogen positions by X-ray diffraction. Amer. Mineral. 56,
1234-1242.
CHE, M., TENCH, A.J. (1983): Characterization and reactivity of molecular oxygen
species on oxide surfaces. Advan. Catalysis 32, 1-148.
CLOZEL, B., ALLARD, T. & MULLER, J.P. (1994): Nature and stability of
radiation-induced defects in natural kaolinites: new results and reappraisal of
published works. Clays Clay Minerals 42, 657-666.
COLVILLE, A.A., ANDERSON, C.P. & BLACK, P.M. (1971): Refinement of the crystal
structure of apophyllite: I. X-ray diffraction and physical properties. Amer. Mineral.
56, 1222-1233.
DUNN, P.J., ROUSE, R.C. & NORBERG, J.A. (1978): Hydroxyapophyllite, a new
mineral, and a redefinition of the apophyllites group. Part I. Description, occurrence,
and nomenclature. Amer. Mineral. 63, 196-199.

79
KEIJZERS, C. P., REIJERSE, E. J., STAM, P., DUMONT, M. F. & GRIBNAU, M. C. M.
(1987) “MAGRES: A General Program for Electron Spin Resonance, ENDOR and
ESEEM,” J. Chem. Soc., Faraday Trans. I, 83, 3493-3503.
KÖKSAL, F., KÖSEOĞLU, R., ŞAKA, I., BAŞARAN, E. & ŞENER, F. (2004): Electron
paramagnetic resonance of natural and γ –irradiated alunite and kaolin mineral
powders. Radiation Effects Defects Solids, 159, 393-398.
MAO, M. & PAN, Y. (2009): Radiation-induced defects in apophyllites. I. The NH2
free radical in fluorapophyllite. Eur. J. Mineral., 21,317-324.
MARFUNIN, A.S. (1979): Spectroscopy, luminescence and radiation centers in
minerals. Springer-verlag berlin Heidelberg New York.
MASHKOVTSEV, R.I., HOWARTH, D.F. & WEIL, J.A. (2007): Biradical states of
oxygen-vacancy defects in α-quartz. Phys. Rev. B 76, 214114-1-11.
MENGEOT, M., BARTRAM, R.H. & GILLIAM, O.R. (1975): Paramagnetic hole-like
defect in irradiated calcium hydroxyapatite single crystals. Phys. Rev. B 11,
4110-4124.
MOMBOURQUETTE, M.J., WEIL, J.A. & MCGAVIN, D.G. (1996): EPR-NMR (Users’
Manual). Department of Chemistry, University of Saskatchewan, Saskatoon, SK.,
Canada.
MORICHON, E., ALLARD, T., BEAUFORT, D. & PATRIER, P. (2008): Evidence of native
radiation-induced paramagnetic defects in natural illite from unconformity-type
uranium deposits. Phys. Chem. Minerals 35, 339-346.
80
MURPHY, D.M. & CHIESA, M. (2004): EPR of paramagnetic centres on solid surfaces.
Electron. Paramag. Reson. 19, 279-317.
NILGES, M.J., PAN, Y. & MASHKOVTSEV, R.I. (2009): Radiation-induced defects in
quartz. III. W-band EPR, ENDOR and ESEEM study of a peroxy radical. Phys.
Chem. Minerals 36, 61-73.
NOKHRIN, S.M., PAN, Y., WEIL, J.A. & NILGES, M.J. (2005): Multifrequency EPR
study of radiation-induced defects in chlorapatite. Canad. Mineral. 43, 1581-588.
NOVOZHILOV, A.I., SAMOILOVICH, M.I., SERGEEV-BOBR, A.A., & ANIKIN, I.N.
(1969): EPR in irradiated fluorophlogopite. Zhur. Struk. Knim., 10, 45–453.
NUTTALL, R.H.D. & WEIL, J.A. (1981) The magnetic properties of the oxygen-hole
aluminum centers in crystalline SiO2. I. [AlO4]0. Canad. J. Phys. 59, 1696-1708.
PECHAR, F. (1987): The X-ray diffraction refinement of the crystal structure of natural
apophyllite. Crystal. Res. Technol. 22, 1041-1046.
PIPER, W. W., KRAVITZ, L. C. & SWANK, R. K. (1965): Axially symmetric
paramagnetic color centers in fluorapatite. Phys. Rev. A 138, 1802-1814.
PRINCE, E. (1971): Refinement of the crystal structure of apophyllite. III.
Determination of the hydrogen positions by neutron diffraction. Amer. Mineral. 56,
124l-1251.
ROUSE, R.C., PEACOR R.D. & DUNN, P.J. (1978): Hydroxyapophyllite, a new mineral,
and a redefinition of the apophyllites group II. Crystal structure. Amer. Mineral. 63,
199-202.
81
RUBIO, J. O., TOHVER, H. T., CHEN, Y. & ABRAHAM M. M. (1976): Trapped-hole
defects in SrO. Phys. Rev. B 14, 5466-5472.
SORIEUL, S., ALLARD, T., MORIN, G., BOIZOT, B. & CALAS, G. (2005): Native and
artificial radiation-induced defects in montmorillonite. An EPR study. Phys Chem
Minerals 32, 1-7.
STÄHL, K. (1993): A neutron powder diffraction study of partially dehydrated
fluorapophyllite, KCa4(Si8O20)F·8H2O. Eur. J. Mineral. 5, 845-849.
TAYLOR, W.H. & NÁRAY-SZABÓ, I. (1931): The structure of apophyllite. Z.
Kristallogr. 77, 146-158.
VAN DOORSLAER, S.,. SIERRA, G. A. & SCHWEIGER, A. (1999): Dead
Time-Dependent Line Distortions in Absolute-Value Electron Spin Echo Envelope
Modulation Spectra. J. Magnet. Res. 136, 152–158.
WALSBY, C.J., LEES, N.S., CLARIDGE, R.F.C. &WEIL, J.A. (2003): The magnetic
properties of oxygen-hole aluminum centres in crystalline SiO2. VI: A stable
AlO4/Li centre. Canad. J. Phys. 81, 583-598.
WEIL, J.A. & BOLTON J.R. (2007): Electron paramagnetic resonance, elementary
theory and practical applications. Wiley-Interscience, John Wiley & Sons Inc.

82
Chapter 4
Single-crystal EPR and ENDOR study of an Al-O- center in prehnite:
implications for aluminum-associated oxyradicals in layer silicates
Single-crystal electron paramagnetic resonance (EPR) spectra of
gamma-ray-irradiated prehnite (Jeffrey mine, Quebec, Canada) measured at 298 and
160 K reveal an aluminum-associated oxygen hole center (Al-O-). Spin Hamiltonian
parameters g and A(27Al) fitted from the 298 K spectra suggest that this Al-O- center
represents hole trapping on an apical hydroxyl oxygen atom (after removal of the
proton) coordinated to an octahedral Al3+ ion (i.e., an [•OAlO4(OH)] center from the
[(OH)AlO4(OH)] precursor, where • denotes the unpaired spin). Pulsed electron
nuclear double resonance (ENDOR) spectra measured at 25 K allow the identification
and quantitative analysis of two sets of 27Al hyperfine structures and five proton
hyperfine structures, which are all consistent with the proposed structural model.
Isothermal and isochronal annealing experiments show that this center is bleached out
completely at 375 °C, but can be readily restored by gamma-ray irradiation, and
exhibits second-order decay kinetics. These results from the Al-O- center in prehnite
provide support for and new insights into Clozel et al. (1995)’s VIAl-O--VIAl model
for B-centers in kaolinite.

83
4.1 Introduction
Aluminum-associated oxyradicals are common radiation-induced defects
(RIDs) in clay minerals (Novozhilov et al., 1969; Angel et al., 1974; Jones et al.,
1974; Meads & Malden, 1975; Hall, 1980; Clozel et al., 1994, 1995; Götze et al.,
2002; Köksal et al., 2004). RIDs in clay minerals have recently attracted extensive
studies, because they are natural dosimeters with wide applications from tracing and
monitoring the migration of radionuclides in Earth’s surface environments to age
determination and mineral exploration, and have direct relevance to nuclear waste
disposal (Ikeya, 1993; Mosser et al., 1996; Allard & Muller, 1998; Allard et al., 2003;
Plötze et al., 2003; Morichon et al., 2008; Allard & Calas, 2009). RIDs, including
aluminum-associated oxyradicals, in clay minerals, however, are generally not well
understood with respect to their structures owing to the fact that they are usually
characterized only by powder electron paramagnetic resonance (EPR) spectroscopy.
Although powder EPR spectra measured with the oriented film technique have
provided extremely valuable information about the orientations of RIDs in the host
clay minerals (e.g., Clozel et al., 1995; Morichon et al., 2008), such information is
usually not as unambiguous as those from the single-crystal EPR technique. Also,
powder EPR spectra are generally lower in resolution and sensitivity than their
single-crystal counterparts. Therefore, paramagnetic centers in clay minerals as
investigated by powder EPR spectra only are usually difficult to interpret with respect
to their structures. For example, all previous investigators (Angel et al., 1974; Jones et
al., 1974; Meads & Malden, 1975; Hall, 1980; Clozel et al., 1994, 1995; Götze et al.,

84
2002; Köksal et al., 2004) agreed that ‘‘B-centers’’ in kaolinite represent
aluminum-associated oxyradicals but disputed the structural models whether they
involve hole trapping on an O2- ion shared by two Al atoms or by one Al atom and
one Si atom. This dispute stems from the facts that the 27Al hyperfine structure
observed in powder EPR spectra was not always clearly resolved and that the
orientation between the hole trapping oxygen atom and its associated Al atom(s) was
not known.
As part of our continuing effort to better understand RIDs in layer silicates and
their analogues by single-crystal continuous-wave (CW)EPR, pulsed electron nuclear
double resonance (ENDOR), and pulsed electron spin echo envelope modulation
(ESEEM) spectroscopy (Mao & Pan, 2009; Mao et al., 2010), we have investigated
prehnite (Ca2Al [AlSi3O10](OH)2) before and after gamma-ray irradiation (Pan et al.,
2009). Prehnite consisting of [AlSi3O10] tetrahedral and [AlO4(OH)2] octahedral
sheets (Figure 4.1) has three polymorphs (Pncm, P2cm and P2/n) owing to different
Al-Si ordering schemes in the tetrahedral sites (Peng et al., 1959; Papike & Zoltai,
1967; Preisinger, 1965; Balic-Žunić et al., 1990; Baur et al., 1990; Zhao et al., 2003;
Detrie et al., 2008). The two hydroxyl groups on the opposite apices of the Al
octahedron have equivalent orientations but different Al-O bond distances in the
P2cm polymorph (Detrie et al., 2008; Figure 4.1). Single-crystal EPR spectra of
prehnite reported in Pan et al. (2009) allowed quantitative analyses of a Fe3+ center
and a VO2+ radical, and suggested the presence of an aluminum-associated oxygen
hole center (Al-O-). The present contribution reports on results of a detailed

85
characterization of the Al-O- center in prehnite by single-crystal CW-EPR and pulsed
ENDOR spectroscopy, together with a series of isochronal and isothermal annealing
experiments. These results are used to determine the structure and thermal stability of
the Al-O- center in prehnite and to provide new insights into aluminum-associated
oxyradicals in layer silicates in general.
Figure 4.1 Crystal structure of P2cm prehnite projected to the (010) plane
illustrating alternating tetrahedral and octahedral sheets (Detrie et al., 2008). The
apical hydroxyl oxygen atoms (OHa and OHb; associated protons Ha and Hb) of Al
octahedra (VIAl) are marked. The tetrahedral site occupied by Al (T2A) is marked,
but other tetrahedral sites occupied by Si are not labeled.
86
4.2 Samples and experimental techniques
4.2.1 Prehnite crystals and sample preparation
Prehnite crystals selected for this study came from the same sample (Jeffrey
mine, Asbestos, Quebec, Canada) investigated in Pan et al. (2009). The Jeffrey mine
is one of the few localities in the world where prehnite occurs as millimeter-sized
crystals amenable to single-crystal EPR studies. Electron-microprobe analyses
showed that prehnite in this sample contains only ~0.05(3) wt% Fe2O3 and trace
amounts of Mn and other transition metals (Pan et al., 2009), also ideal for EPR
studies. Single-crystal X-ray diffraction data showed that prehnite crystals in this
sample are dominantly of the space group P2cm (Pan et al., 2009; cf. Papike & Zoltai,
1967; Detrie et al., 2008).
Selected crystals of prehnite are approximately 2 x 2 x 1 mm in size, have a
light brownish orange color, and possess well developed {110}, {¯110}, {111} and {¯
111} forms and a good {001} cleavage. They were irradiated at room temperature in a
60Co cell for a dose of ~44 kGy (i.e., ~460 Gy/h for 96 h). One irradiated crystal was
subjected to a series of step-wise, isochronal annealing experiments in the temperature
range from 75 to 400 °C at a constant interval of 25 °C and a duration of 30 min. each
step. This crystal after isochronal annealing to 400 °C was re-irradiated at room
temperature for a dose of ~44 kGy. Four other irradiated crystals were used for
isothermal annealing experiments at 250, 275, 300 and 350 °C for up to 10.6 h.

87
4.2.2 Single-crystal CW-EPR experiments
Single-crystal CW-EPR spectra were measured on a Bruker EMX
spectrometer equipped with an ER4119 cavity, an ER218G1 goniometer with a
precision of ~0.2°, and an Oxford liquid He cryostat, at the Saskatchewan Structural
Science Centre, University of Saskatchewan. Conditions of single-crystal EPR
measurements including the selection of rotation planes and crystal alignments are
generally similar to those described in Pan et al. (2009). Three notable differences are:
(1) experimental axes x, y and z are parallel to crystallographic axes a, b, and c,
respectively; (2) measurements have been made at selected orientations for a third
rotation plane parallel to the (110) face, and (3) spectra at 298 K were collected in the
field of only 20 mT wide (Figure 4.2). Pan et al. (2009) switched the experimental
axes x and y, measured only two rotation planes (i.e., parallel to the {001} cleavage
and the (1‾10) face), and used wide-scan spectra to investigate the Fe3+ center (940
mT) and the VO2+ radical (140 mT). In the present study, the 298 K spectra have a
resolution of ~0.019 mT (i.e., 1024 data points over 20 mT). Magnetic field was
calibrated by use of α,γ-bis-diphenylene-β-phenyl allyl (BDPA; g = 2.0027) in
benzene as an external reference material.
Single-crystal EPR measurements of prehnite after each step of isochronal and
isothermal annealing were made at 298 K with the magnetic field B//b. Crystal
alignment of this type was made first by use of the {001} cleavage and then adjusted
on the basis of coalesce of magnetically nonequivalent sites in this orientation. Three
crystals used for isothermal annealing experiments at 250, 275 and 350 °C were

88
measured with the cryostat installed, whereas spectral collections for the remaining
crystal annealed at 300 °C were made after the cryostat was removed.
4.2.3 Pulsed ENDOR experiments
Pulsed ENDOR (Gemperle & Schweiger, 1991) spectra at 25 K were collected
on a Bruker E580-10 Elexsys spectrometer at the Illinois EPR Research Center
(IERC), University of Illinois at Urbana-Champaign. Samples were maintained at 25
K using a liquid He Oxford CF935 cryostat. ENDOR experiments were made using a
Mims three-pulse scheme (π/2 – τ – π/2 – T – π/2 – τ – echo, with the RF pulse
applied during time T and the frequency of which is varied in time and with π/2 set at
16 ns). An ENIA-300 RF amplifier was used. Because Mims ENDOR gives rise to
blind-spots that originate from an oscillating τ dependence, ENDOR spectra were also
recorded as a function of τ and subsequently summed together.
Sets of CW-EPR and pulsed ENDOR (and ESEEM) spectra were obtained for
one plane whose normal is ~30° from the a-axis (normal vector: θ = 94.5° and φ =
32.6°). Spectra were collected at 15-degree intervals. For such a plane there are two
well-resolved sextets. The excited field was set at the lowest field hyperfine line of the
lower field sextet and on the highest field hyperfine line of the higher field sextet. The
only exception was that only one spectrum was collected on the central hyperfine line
for the orientation near the c-axis, where the two sextets coalesce. Angle corrections
were calculated from the fitting of the CW spectra of the two sextets using the g and
27Al hyperfine matrices obtained from the three-plane CW-EPR analysis of this center
89
(see below). ENDOR spectra were then simulated using SIMEND, which is a version
of SIMPIP that calculates a frequency swept ENDOR spectrum (Nilges et al., 2009).
However, the ENDOR intensity was calculated explicitly using the nuclear spin
turning angle, instead of using the transition moment multiplied by a frequency factor.
The ENDOR factor (Gemperle & Schweiger, 1991) is given by:
FENDOR = [1 – cos (ωRtrf)]/4 ..........................................................................(4.1)
where trf is the RF pulse time and ωR is the effective nutation frequency (given by
2πB2(TM)1/2 and TM is the transition moment calculated in SIMEND). The frequency
dependence of B2 is approximated by measuring the voltage on the voltage-divided
RF termination of the ENDOR probe and B2@υH is measured by a Rabi oscillation
experiment. Note that as the turning angle goes to zero, the ENDOR factor reduces to
just the transition moment times B22.
4.3 Results
4.3.1 Single-crystal CW-EPR spectra
Pan et al. (2009) noted that single-crystal EPR spectra of prehnite measured
from 298 to 13 K disclose the presence of six paramagnetic defects: three Fe3+ centers,
a Mn2+ center, a VO2+ radical and an Al-O- center. Of these, the three Fe3+ centers and
the VO2+ radical have been described in detail in Pan et al. (2009). The Mn2+ center,
which is indicated by the characteristic 55Mn hyperfine sextet (I = 5/2 and a hyperfine
constant A/h of ~250 MHz), is invariably lowing signal-to-noise ratios and is
commonly obscured by the VO2+ radical and the Al-O- center, therefore cannot be

90
analyzed quantitatively. Herein, the single-crystal EPR spectra of the Al-O- center are
described in detail.
Figure 4.2 Representative 298 K single-crystal EPR spectra of γ-ray irradiated
prehnite illustrating the Al-O- center: (a) measured at v = 9.835 GHz and B//b
showing a well resolved sextet; and (b) measured at v = 9.840 GHz and B^b = 50°
showing splitting into two sets of sextet (marked). Also marked are lines from the
VO2+ radical (Pan et al., 2009).
The Al-O- center, which is visible but low in signal-to-noise ratio in the
spectra of as-is prehnite, is enhanced by ~44 kGy γ-ray irradiation. The 298 K spectra
of γ-irradiated prehnite, measured with B parallel to symmetry axes, show that the
Al-O- center is characterized by a sextet (i.e., six lines of approximately same
intensities and equal distances; Figure 4.2a), indicative of the 100% naturally
abundant 27Al nucleus with I = 5/2. When B is rotated away from crystal axes, the
sextet is split into at most two sets (Figure 4.2b).At a few orientations, the two sets of
sextets are notably different in both linewidth and lineshape. This difference suggests
that these two sets of sextets may represent either two magnetically non-equivalent

91
sites or two magnetically equivalent but unequally populated sites (see discussion
below). The average linewidth of individual hyperfine lines are ~0.30 mT at 298 K.
We note that the 160 K single-crystal EPR spectra of this center (Pan et al., 2009) are
similar to those observed at 298 K, except for a slight reduction in average linewidth
to ~0.28 mT. However, the 160K spectra were measured at a lower spectral resolution
of ~0.137 mT (i.e., 1024 data points over 140 mT; Pan et al., 2009), hence not used in
the analysis of this Al-O- center.
4.3.2 Optimization of spin Hamiltonian parameters
The spin Hamiltonian parameters for this S = 1/2 center with a 27Al hyperfine
structure can be written as:
H = βeBT • g • S + IT
• A • S - βnBT • gn • I + IT
• P • I ................................(4.2)
where βe and βn are electronic and nuclear magnetons, respectively, and gn(27Al) is
taken to have an isotropic value of 1.456601 (Weil & Bolton, 2007). The electronic
Zeeman matrix g, the nuclear hyperfine matrix A, and the nuclear quadrupole tensor P
are fitted from the experimental data (Figure 4.3). All data analyses, including angle
corrections, optimization of spin Hamiltonian parameters and spectral simulations, are
made by use of the software package EPR-NMR (Mombourquette et al., 1996).
Specifically, the ideal normal directions of the {001} cleavage plane and the (1¯10)
and (110) faces at (θ = 0°, φ = 90°), (90°, 325.2°), and (90°, 34.8°), respectively, were
used for the initial optimization of spin Hamiltonian parameters. Subsequently, angle
corrections were made by use of the optimized spin Hamiltonian parameters in

92
iterations. The actual normal directions of the three experimental planes are (4.4°,
98.2°), (83.0°, 319.8°), and (88.3°, 42.4°), respectively, indicating a small crystal
misalignment for each plane. It should be noted that the final spin Hamiltonian
parameters were obtained by use of the corrected orientations and, therefore, are
unlikely affected significantly by crystal misalignments in data collections. Also,
fitting of EPR spectra alone cannot determine the sign of the hyperfine parameter.
However, the isotropic hyperfine on Al arises from spin polarization effects (Weil &
Bolton, 2007) and is expected to be negative in sign (Nuttall & Weil, 1981; Adrian et
al., 1985). Herein we adopt a negative sign for the isotropic component of the 27Al
hyperfine constant (Table 4.1; cf. Nilges et al., 2009; Botis & Pan, 2010).
The appearance of two nonequivalent sets of sextets, together with the
possibility of a monoclinic crystal symmetry for prehnite (Papike & Zoltai, 1965;
Baur et al., 1990), led us to fit them separately. However, the fitted spin Hamiltonian
parameters from the two sets of sextets agree within analytical uncertainties and are
indistinguishable from those obtained by grouping them together as magnetically
nonequivalent sites in the rotation group D2 (Pan et al., 2009). Therefore, only results
from the latter approach using the orthorhombic crystal symmetry (Table 4.1) are
presented below. For the P2cm polymorph one expects two chemically unique sites,
because the two hydroxyl groups on the opposite apices of the Al octahedron are
nonequivalent. For the Pncm polymorph the two hydroxyl groups are equivalent and
the corresponding centers will be equivalent. In both cases the rotation group is D2
and there are four symmetry-related magnetically nonequivalent sites for each of the

93
two chemically unique sites. Fitting of the CW-EPR spectra could not differentiate
between the two cases, and the two chemical sites were assumed equivalent.
Figure 4.3 Line-position data versus rotation angles (roadmaps) of the Al-O- center
in prehnite in three rotation planes: (a) the {001} cleavage, (b) the (110) crystal face,
and (c) the 1‾10 crystal face. Solid circles represent experimental data points; and
solid lines are predicted from spin Hamiltonian parameters in Table 4.1. Locations
of crystallographic axes a, b and c are marked only approximately, because minor
crystal misalignments are present for all three rotation planes (see text for
explanation).
A total of 1920 line-position data points from the 298 K spectra were used for
data fitting. However, lower weighing factors of 0.5 or 0.1 were assigned to lines that
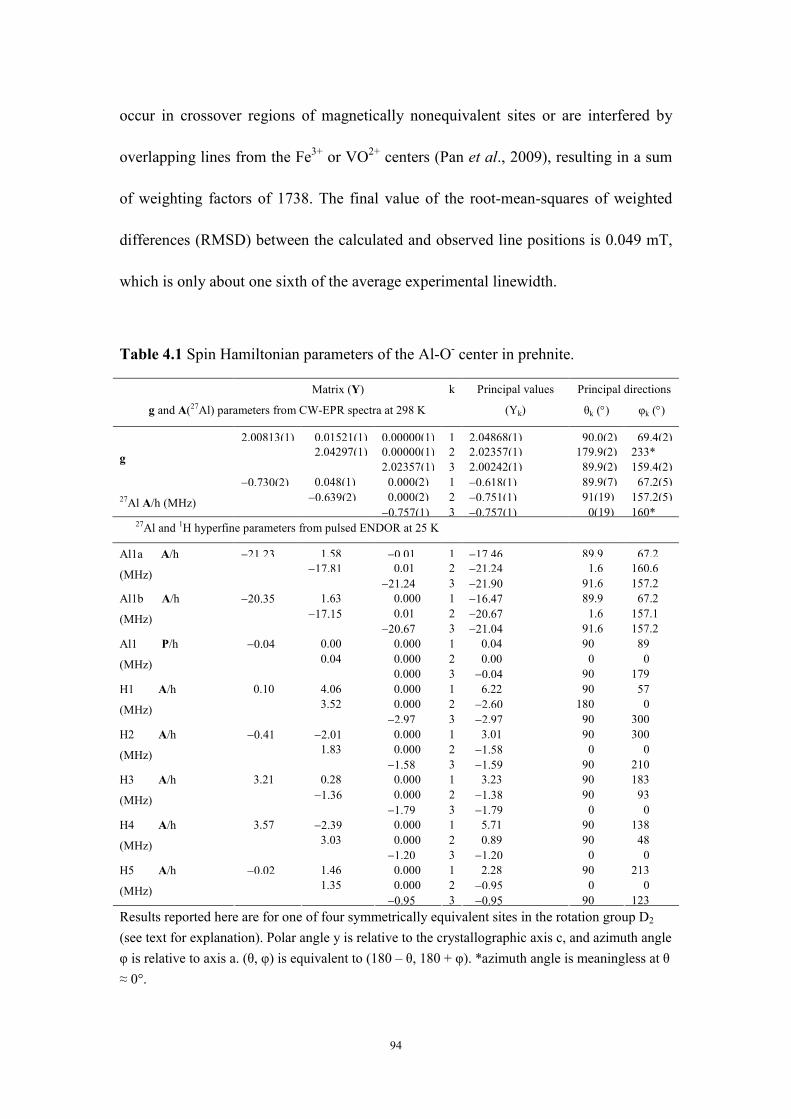
94
occur in crossover regions of magnetically nonequivalent sites or are interfered by
overlapping lines from the Fe3+ or VO2+ centers (Pan et al., 2009), resulting in a sum
of weighting factors of 1738. The final value of the root-mean-squares of weighted
differences (RMSD) between the calculated and observed line positions is 0.049 mT,
which is only about one sixth of the average experimental linewidth.
Table 4.1 Spin Hamiltonian parameters of the Al-O- center in prehnite.
Results reported here are for one of four symmetrically equivalent sites in the rotation group D2
(see text for explanation). Polar angle y is relative to the crystallographic axis c, and azimuth angle
φ is relative to axis a. (θ, φ) is equivalent to (180 – θ, 180 + φ). *azimuth angle is meaningless at θ
≈ 0°.
Matrix (Y) k Principal directions
g and A(27Al) parameters from CW-EPR spectra at 298 K
Principal values
(Yk) θk (°) φk (°)
2.00813(1) 0.01521(1) 0.00000(1) 1 2.04868(1) 90.0(2) 69.4(2) 2.04297(1) 0.00000(1) 2 2.02357(1) 179.9(2) 233*
g 2.02357(1) 3 2.00242(1) 89.9(2) 159.4(2) −0.730(2) 0.048(1) 0.000(2) 1 −0.618(1) 89.9(7) 67.2(5) −0.639(2) 0.000(2) 2 −0.751(1) 91(19) 157.2(5)
27Al A/h (MHz) −0.757(1) 3 −0.757(1) 0(19) 160*
27Al and 1H hyperfine parameters from pulsed ENDOR at 25 K
−21.23 1.58 −0.01 1 −17.46 89.9 67.2 −17.81 0.01 2 −21.24 1.6 160.6
Al1a A/h
(MHz) −21.24 3 −21.90 91.6 157.2 −20.35 1.63 0.000 1 −16.47 89.9 67.2 −17.15 0.01 2 −20.67 1.6 157.1
Al1b A/h
(MHz) −20.67 3 −21.04 91.6 157.2 −0.04 0.00 0.000 1 0.04 90 89 0.04 0.000 2 0.00 0 0
Al1 P/h
(MHz) 0.000 3 −0.04 90 179 0.10 4.06 0.000 1 6.22 90 57 3.52 0.000 2 −2.60 180 0
H1 A/h
(MHz) −2.97 3 −2.97 90 300 −0.41 −2.01 0.000 1 3.01 90 300
1.83 0.000 2 −1.58 0 0 H2 A/h
(MHz) −1.58 3 −1.59 90 210 3.21 0.28 0.000 1 3.23 90 183 −1.36 0.000 2 −1.38 90 93
H3 A/h
(MHz) −1.79 3 −1.79 0 0 3.57 −2.39 0.000 1 5.71 90 138 3.03 0.000 2 0.89 90 48
H4 A/h
(MHz) −1.20 3 −1.20 0 0 −0.02 1.46 0.000 1 2.28 90 213 1.35 0.000 2 −0.95 0 0
H5 A/h
(MHz) −0.95 3 −0.95 90 123

95
The fitted matrices g and A (Table 4.1) are rhombic and axial in symmetry,
respectively. The principal axes gmax and A// are almost coaxial and are approximately
along the VIAl-OH bond direction (θ = 90°, φ = 62°) in the ideal prehnite structure
(Detrie et al., 2008). The nuclear quadrupole tensor P is small and cannot be
determined precisely with this dataset, hence not included in Table 4.1.
Figure 4.4 Intensity of the Al-O- center (i.e., peak-to-peak height of the lowest-field
hyperfine line from 298 K single-crystal EPR spectra measured at B//b) as a
function of isochronal annealing temperature from 75 to 400 °C.
4.3.3 Single-crystal CW-EPR spectra of annealed prehnite
Figure 4.4 shows that the Al-O- center remains unchanged after heating to at
least 150 °C and then starts to decrease in intensity at 175 °C, accompanied by a fade
of the brownish orange color, and is completely bleached out at 375 °C. The ~44 kGy
γ-ray irradiation of the bleached crystal restores the Al-O- center to ~50 % of its
original intensity, with a re-appearance of the brownish orange color. The impurity

96
centers such as Fe3+ and Mn2+ in prehnite are not affected by annealing in this
temperature range, hence no apparent correlation with the Al-O- center.
The four crystals selected for isothermal annealing experiments are similar in
crystal size and were irradiated for the same dose. Spectra of the three crystals
annealed at 250, 275, and 350 °C confirm that the Al-O- center is broadly similar in
initial concentration (Figure 4.5a). The apparently different intensity of this center in
the crystal annealed at 300 °C (Figure 4.5a) is readily attributable to a different
resonance condition after the cryostat was removed. These isothermal annealing
experiments show that the reciprocal intensity (1/N) of the Al-O- center versus the
annealing time can be fitted to a second-order reaction law (Ikeya, 1993):
1/N = λt + 1/N0 .............................................................................................(4.3)
where N0 is the initial intensity and λ is the specific decay constant (Figure 4.5a). Also,
a plot of the fitted decay constant versus reciprocal temperature for data from crystals
annealed at 250, 275, and 350 °C (Figure 4.5b) follows the Arrhenius relation:
λ = Ae-Ea/kT ...................................................................................................(4.4)
where A is the pre-exponential factor, Ea is the activation energy, and k is the
Boltzmann constant (8.617 x 10⁻⁵ eV/K). The fitted activation energy is 1.2(1) eV.
The pre-exponential factor in this case is meaningless, because the absolute
concentration of the Al-O- center has not been determined by use of well-calibrated
standards.

97
4.3.4 Pulsed ENDOR spectra
Mims ENDOR (Gemperle & Schweiger, 1991) spectra of prehnite showed
three distinct sets of peaks (Figure 4.6 and 4.7). One set of two peaks at ~6 and ~14
MHz (Figure 4.6) correspond to the 27Al hyperfine structure that has been observed
and analyzed already from the CW-EPR spectra. Davies ENDOR (Gemperle &
Schweiger, 1991) spectra taken at a few selected orientations show only these two
peaks at 6 and 14 MHz, confirming that they arise from a strongly coupled 27Al
nucleus. It should also be noted that the high-frequency branch of the strongly
coupled 27Al nucleus overlaps with the distant proton peaks in the Mims ENDOR
spectra and as such is not readily seen (Figure 4.6).
Figure 4.5 Plots of (a) reciprocal intensities (1/N) versus annealing time (t)
illustrating the second-order decay kinetics of the Al-O- center in prehnite at 250,
275, 300, and 350 °C, and (b) decay constants (–lnλ) versus reciprocal temperature
(1/T); note that the data point from annealing at 300 °C (open square) was not
included in the regression analysis.

98
Closer examination of the strong 27Al spectra shows that the peak at ~6 MHz
is split into two at a number of orientations (Figure 4.6). These spectra are simulated
best by assuming two populations with slightly different 27Al hyperfine matrices. Our
simulations, which assumed the two 27Al hyperfine matrices to have the same
orientations for their principal axes (taken from the CW-EPR spectra), show that the
principal values of A differ only by two to six percent (Table 4.1), hence not observed
in the CW-EPR spectra.
Figure 4.6 Stacked plots of the experimental and simulated 27Al Mims ENDOR

99
spectra as a function of rotation angles: (a) the excitation field was set on the low
field line of the low field sextet; and (b) the excitation field was set on the high field
line of the high field sextet. Note that the peaks at ~3.8 MHz are not simulated. Also,
the intensity scale has been inverted for easier viewing.
The second set of peaks at ~3.8 MHz, which give rise to a doublet splitting
near the c-axis (Figure 4.6), is attributable to more distant 27Al nuclei. Table 4.2
shows that hydroxyl oxygen atoms of octahedral Al in prehnite has four next
nearest-neighbor Al atoms: two at octahedral sites at distances of 3.9 and 4.0 Å and
two at the T2A sites at the same distance of 4.6 Å. The observed doublet at
orientations near the c-axis is consistent with a 27Al hyperfine matrix with Azz = 0.59
MHz and a quadrupole tensor with Qzz ≈ 0. Calculations based upon the point dipole
model (Weil & Bolton, 2007, p. 254) predict Azz = –0.33 and –0.31 MHz for the two
Al nuclei at the octahedral sites and Azz = +0.42 MHz for the two Al nuclei at the T2A
sites. Although the Al nuclei at the T2A sites have predicted Azz values closer to the
observed splitting of 0.59 MHz, the lack of resolved structures off-axis makes any
definitive assignment and/or spectral fitting difficult.
The third set of peaks centered around the Lamour frequency of ~14.5 MHz
(Figure 4.7) are attributable to multiple protons. For the hydroxyl oxygen atoms
coordinated to an octahedral Al in P2cm prehnite (Detrie et al., 2008), there are five
next-nearest-neighbor protons at distances in the range of 3–4 Å (Table 4.2). Spectral
simulations using trial hyperfine matrices that were calculated on the basis of the
point-dipole model show that four of these five protons (H1, H2, H3 and H5) are well
accounted for, and the refined hyperfine matrices are close to those predicted by the

100
point-dipole model (Tables 1 and 2), although H2 shows a somewhat smaller coupling
than predicted. The principal values of the hyperfine matrix for H4, however, have to
be varied significantly to give a good fit. In particular, Amax is found to be 5.71 MHz,
in comparison with the predicted value of ~3.1 MHz. Also, the fitted hyperfine matrix
for H4 has a noticeable rhombic component and a significantly positive isotropic
Fermi contact term of 1.8 MHz (Table 4.1).
Figure 4.7 Stacked plots of the 1H portion of the experimental and simulated Mims
ENDOR spectra as a function of rotation angles: (a) the excitation field was set on
the low field line of the low field sextet, and (b) the excitation field was set on the
101
high field line of the high field sextet. The intensity scale has been inverted for
easier viewing.
In addition, spectral simulations for H1 show that the linewidths at
orientations near Amax are broader than other orientations. Therefore, an increase in
linewidth of 0.3 MHz, corresponding to a 5 % variance in Amax, was added in
simulated spectra for H1 along this orientation. An isotropic linewidth of 0.14 MHz
(FWHM) was used for other protons and the other two orientations of A for H1. A
Gaussian lineshape, which is characteristic of an inhomogeneous system, was used in
simulating the spectra.
Spectral simulations also show that the inclusion of five protons accounts for
all of the resolved proton peaks (Figure 4.7). There is still an unresolved or partially
resolved ‘‘matrix’’ peak at υH (Figure 4.7), which is attributable to more distant
protons. However, addition of the sixth-nearest proton (cf. Detrie et al., 2008) yielded
no appreciable improvement in the fitted spectra.
4.4 Discussion
4.4.1. Structural model and origin of the Al-O- center in prehnite
The orientations of the gmax and A// axes at (90°, 69°) and (90°, 67°),
respectively, from the CW-EPR spectra are approximately along the VIAl-OH bond
direction (90°, 60°). Also, the orientations of the gint axis and one A⊥ axis are close to
the c-axis, which in turn is approximately along the bisector of an O-VIAl-O angle.
Similarly, the gmin axis and another A⊥ axis approximately coincide with the bisector
102
of another O-VIAl-Oangle. These relationships are similar to those observed for the
VO2+ radical in prehnite, which has been interpreted to represent hole trapping by a
substitutional V atom and a hydroxyl O atom (after removal of the proton) to form
V=O at an octahedral site (Pan et al., 2009). Similarly, the Al-O- center most likely
represents hole trapping on a hydroxyl oxygen atom linked to an octahedral Al site
(i.e., from the [(OH)AlO4(OH)] precursor to the [•OAlO4(OH)] center, where •
represents the unpaired spin).
The hydroxyl oxygen with the trapped hole can be approximated as an O-
radical center in the crystal field of the nearby AlO4(OH) ion cluster. For the O-
radical the unpaired spin is expected to be in a 2p orbital perpendicular to the Al-O
bond. The values of the g matrix are then expected to be approximately (Lunsford,
1973):
gx’x’ = ge
gy’y’ = ge + 2δ/∆E1
gz’z’ = ge + 2δ/∆E2
where z’ is defined along the Al-O direction, δ is the oxygen spin-orbit coupling
(~150 cm-1), and ∆E1 and ∆E2 are the electron excitation energies between the ground
state and those formed by moving the hole from the px’ orbital to the pz’ and py’ orbital,
respectively. The value of gmin is close to that of the free electron and its axis is
approximately perpendicular to the Al-O bond. Thus, this axis should correspond
approximately to the direction of the ground state px’ orbital. ∆E2 is expected to be
103
smaller than ∆E1, because the pz’ orbital is expected to have a significant sigma
character. Thus, gmax is oriented, as expected, close to the Al-O bond direction.
The isotropic component of the strong 27Al hyperfine structure as determined
by CW-EPR is –19.8 MHz (comparable to –19.4 and –20.2 MHz from pulsed
ENDOR, the average of which is also –19.8 MHz), indicating ~0.5% of the unpaired
spin on the Al nucleus. The value of the isotropic coupling varies exponentially with
the Al-O distance (Adrian et al., 1985), but also depends highly on the energies to
excite the oxygen 2s and 2p electrons. This makes accurate theoretical calculations of
the hyperfine coupling problematic. However, the approximate theory of Adrian et al.
(1985) can still be used to estimate the difference in the two Al-O bond lengths
needed to explain the difference in couplings observed in ENDOR. We calculate a
difference of only 0.012 Å between the two Al-O bond lengths, which compares well
with those obtained from X-ray structure studies of Detrie et al. (2008) for P2cm
prehnite (0.011 and 0.006 Å depending on sample).
According to the point-dipole model, the axial component, of the strong 27Al
hyperfine structure would predict a distance of ~2.5 Å , which is considerably longer
than the ideal Al-O bond distance of 1.92 Å (Detrie et al., 2008). However, at this
close distance the negative contributions from spin polarization effects tend to cancel
with the dipolar contributions (Adrian et al., 1985) and the anisotropic part of the
hyperfine coupling becomes only weakly dependent on the Al-O distance. Our value
of Tz’z’ (the component along the internuclear axis for the traceless, anisotropic

104
hyperfine coupling matrix, T) of 2.57 MHz is well within the predicted range of 1.5–3
MHz (Adrian et al., 1985).
This structural model can be evaluated further by the 27Al and 1H hyperfine
data from pulsed ENDOR (Table 4.1). The presence of two chemically nonequivalent
populations for the strong 27Al hyperfine structure as revealed by pulsed ENDOR is
consistent with the P2cm symmetry (i.e., symmetrically distinct OHa and OHb; Detrie
et al., 2008). Similarly, we predict that four next-nearest-neighbor 27Al nuclei are
collectively responsible for the observed peaks at ~3.8 MHz (Figure 4.6; Table 4.2).
Because only a single doublet is resolved for orientations at or near the c-axis (Figure
4.6), the hyperfine matrices for these four Al’s could not be explicitly determined, but
the peaks at ~3.8 MHz are not inconsistent with that expected to arise from these four
Al nuclei.
Table 4.2 Next-nearest Al and H to an apical oxygen of an Al octahedron in prehnite.
Ideal structure Experimental
Atom θ (°) φ (°) r (Å) Tz’z’(MHz) θ (°) φ (°) r (Å) Tz’z’(MHz)
VIAl 90 103.9 3.95 0.67
VIAl 90 335.8 4.04 0.63
IVAl 3.6 257.7 4.64 0.42
IVAl 176.4 257.7 4.64 0.42
H1 90 53.5 3.06 5.57 90 56.5 2.99 6.00
H2 90 300.9 3.53 3.61 90 300.5 3.81 3.06
H3 90 184.4 3.72 3.08 90 183 3.67 3.21
H4 90 138.9 3.74 3.05 90 138 3.44 3.91
H5 90 227.1 4.13 2.25 90 213 4.19 2.15
Data for the ideal structure of prehnite from Detrie et al. (2008). Note that the observed peaks at
~3.8 MHz are consistent with these nextnearest Al nuclei but are not sufficiently resolved to allow
quantitative analysis (see text for explanation). Tz’z’ is the component of the anisotropic hyperfine
matrix along the O-H internuclear axis.

105
Each of the five protons H1–H5 in the P2cm structure (Detrie et al., 2008)
should exist as a pair of chemically nonequivalent protons. However, the calculated
differences in proton couplings for all pairs are predicted to be only a few percent,
hence only a minor line broadening is observed. Therefore, the fact that four of the
five protons are well predicted by the point-dipole model provides further support for
the assignment of this center to hole trapping on a hydroxyl oxygen atom coordinated
to an octahedral Al atom. Although the principal values of H4 are significantly
different from those predicted by the point-dipole model, the orientation of the Amax
axis is within 1° of that predicted by the point-dipole model. For distant protons the
isotropic component of the hyperfine is expected to be small. If little or no overlap of
orbitals on the hydrogen and the oxygen it is usually negative, because spin
polarization effects dominate. While the isotropic parts of the hyperfine for H1, H2,
H3, and H5 are small (<0.2 MHz), for H4 it is both significantly larger and positive
(1.8 MHz). This implies a direct orbital overlap and suggests that this proton is
‘‘hydrogen-bonded’’ to the O atom of the Al-O- center. From the anisotropic part of
the hyperfine for H4, the O. . . .H-O distance is predicted to be 3.5 Å and from the
crystal structure the O-H-O angle is predicted to be 101°, which are not unreasonable
values for a ‘‘hydrogen bond’’. It is noteworthy that the O-H-O angles for the other
four protons are nowhere near the optimal angle of 120°.

106
4.4.2. Thermal stability and coloration
Aluminum-associated oxygen hole centers, which are known to involve Al at
both tetrahedral and octahedral sites, are mostly detectable only at cryogenetic
temperatures, because of severe line broadening related to hole hopping among
equivalent oxygen atoms at elevated temperatures (Nuttall & Weil, 1981; Petrov et al.,
1989; Claridge et al., 1994; Da Silva et al., 2005; Botis & Pan, 2010). Two notable
exceptions are the proposed [AlO6]0 center in KTP (KTiOPO4) and the O- center in
euclase, both of which are detectable at room temperature (Yu et al., 1995; Dias et al.,
2009). This center in KTP also has similar principal g and A values (2.0464, 2.0157,
2.0027 and 17.66, 20.74, 21.02 MHz) to the Al-O- center in prehnite. Yu et al. (1995)
suggested this center to represent hole trapping on an oxygen atom linking a
substitutional Al and a lattice Ti in the octahedral sites. Yu et al. (1995) also proposed
two possible mechanisms for its formation: (1) substitution of Al3+ for Ti4+ resulting
in a charge imbalance, and hole trapping by an O2- ion to form the O- radical during
gamma-ray irradiation; and (2) OH- impurity, which is common in KTP (Theis et al.,
1985; Ahmed et al., 1986) and may occur to accompany a substitutional Al atom, may
be stripped of the proton and results in hole trapping by the remaining oxygen atom
during γ-ray irradiation. The latter mechanism is identical to this proposed for the
[•OAlO4(OH)] center in our study, except that both OH- and Al3+ are lattice ions in
prehnite. Similarly, the O- center in euclase has been proposed to form from a
hydroxyl group coordinated to Al in octahedral sites (Dias et al., 2009).

107
In prehnite the hydroxyl oxygen atom, after removal of its proton, is expected
to remain different from the other five oxygen atoms (i.e., four equatorial oxygen
atoms and the other apical hydroxyl oxygen with its proton intact) coordinated to the
Al octahedron. This difference may represent an energy barrier sufficient to limit hole
hopping to other oxygen atoms, hence detection of the Al-O- center in prehnite at
room temperature. Other thermal properties (e.g., complete bleaching at 375 °C,
second-order decay kinetics, and activation energy of 1.2 eV) of the Al-O- center in
prehnite are similar to those of its counterparts in otherminerals (Ikeya, 1993; Pan &
Hu, 2009).
Interestingly, the brownish orange color of prehnite and the Al-O- center share
similar thermal properties and irradiation behavior. However, linkage between this
color and the Al-O- center remains unclear. Krambrock et al. (2004), on the basis of
optically detected magnetic resonance (ODMR) spectroscopy, showed that a yellow
coloration of elbaite is related to an aluminum-associated O- center (Al-O--Al).
4.4.3 Implications for aluminum-associated oxyradicals in layer silicates
The most common aluminum-associated oxyradicals in layer silicates are the
so-called ‘‘B-centers’’ in kaolinite. Angel et al. (1974) first observed a ‘‘B-center’’ in
X-ray irradiated kaolinite by room-temperature EPR and suggested it to be related to
Al3+ occupying a Si4+ position. Meads and Malden (1975) determined its 27Al
hyperfine constant to be 21.3 MHz by EPR spectra at 140 K. Hall (1980) suggested
that ‘‘B-centers’’ formed by an Al3+ ion replacing Si4+ with two distinct

108
configurations: one as IVAl-O--Si with g// = 2.028, g⊥ = 1.988 and the other being
IVAl-O--VIAl with g// = 2.047 and an uncertain g⊥ value. Clozel et al. (1994, 1995) and
Götze et al. (2002) argued for a model involving two neighboring Al nuclei, whereas
Köksal et al. (2004) favored the former model but reported somewhat different
principal g and A values for ‘‘B-centers’’. ‘‘B-centers’’ are known to be stable up to
~300 °C (Angel et al., 1974; Jones et al., 1974; Meads & Malden, 1975). Clozel et al.
(1994) also noted the stability of ‘‘B-centers’’ depends on the initial concentration
and temperatures of EPR measurements.
It is noteworthy that the initial proposals of ‘‘B-centers’’ with substitutional Al
at a tetrahedral site (Angel et al., 1974; Meads & Malden 1975; Hall, 1980) were
based exclusively on similar centers in quartz and silicate glasses. Our results show
that oxyradicals associated with Al at octahedral sites have similar in principal g and
A values to those with Al at tetrahedral sites (see also Yu et al., 1995; Dias et al.,
2009). Therefore, principal g and A values from powder EPR spectra cannot be used
to discriminate aluminum-associated oxyradicals at tetrahedral or octahedral sites.
Clozel et al. (1995), in their comprehensive study of ‘‘B centers’’ in kaolinite,
reported X- and Q-band powder spectra measured at 77 and 150 K, including those
from the oriented film technique. These spectra show that the B center consists of
three groups of 11 lines with intensity ratios of 1:2:3:4:5:6:5:4:3:2:1 and has one of its
principal axes perpendicular to the ab plane of the kaolinite layers. Clozel et al. (1995)
interpreted the 11-line features to represent a hyperfine structure arising from
interaction with two equivalent 27Al nuclei and dismissed the previously reported
109
IVAl-O--Si and IVAl-O--VIAl models. Clozel et al. (1995) proposed a VIAl-O--VIAl
model but was uncertain whether it forms from irradiation resulting in charge
imbalance by the occurrence of a vacancy or impurities in the octahedral or
tetrahedral layers. Also, Clozel et al. (1995) was unable to determine whether the hole
trapping oxygen is one of the two oxygen atoms or one of the four hydroxyl oxygen
atoms, all of which are coordinated to an octahedral Al atom. On the basis of the
present study, we suggest that ‘‘B-centers’’ in kaolinite form from hole trapping on
hydroxyl oxygen atoms after the removal of proton. Particularly, proton removal
associated with ionization of hydroxyl groups makes the remaining oxygen atom an
ideal candidate for hole trapping (see also Dias et al., 2009; Mao et al., 2010).
Moreover, this hole-trapping oxygen atom in kaolinite is now sufficiently different
from the two oxygen atoms and the three hydroxyl oxygen atoms of the Al octahedron,
which is required for limited hole hopping and detection of this center at room
temperature. It is noteworthy that the Al-O- center in prehnite shares similarities in
thermal behavior, including the second-order decay kinetics, with the ‘‘B-centers’’ in
kaolinite (e.g., dependence of decay on the initial concentration; Clozel et al., 1995).
It remains unclear, however, whether one or all four of the hydroxyl oxygen atoms
participate in the formation of the ‘‘B-centers’’ in kaolinite.
To the best of our knowledge, the only previous single-crystal EPR study on
aluminum-associated oxyradicals in layer silicates is Novozhilov et al. (1969), who
reported two O- centers in irradiated, synthetic fluorphlogopite with a minor
substitution of Al3+ for Mg2+ at the octahedral site. One of their proposed O- centers is

110
characterized by a gmin value of 2.008(3) and a 10-line hyperfine structure along the
crystallographic c axis. Novozhilov et al. (1969) interpreted the 10-line hyperfine
structure to arise from interaction with an 27Al and an 19F nuclei and suggested this
center to represent an O- ion replacing an F- ion linked to Al3+ atethe octahedral site.
However, Novozhilov et al. (1969) were unable to quantitatively determine the g
matrix or the 27Al and 19F hyperfine constants of this proposed Al-O- center. It is
plausible that the precursor in synthetic fluorphlogopite also involved a substitution of
OH- for F- linked to Al3+ at the octahedral site and that the Al-O- center formed from
hole trapping on the hydroxyl oxygen after removal of the proton during irradiation.
4.5 Conclusions
Combined CW-EPR and pulsed ENDOR studies, together with isochronal and
isothermal annealing experiments, allow a detailed characterization of a new Al-O-
center in γ-ray irradiated prehnite. This radiation-induced center has been shown to
form from hole trapping on a hydroxyl oxygen atom coordinated to Al in the
octahedral sites. Results from this center in prehnite provide support for Clozel et al.
(1995)’s VIAl-O--VIAl model for radiation-induced B-centers in kaolinite and suggest
them to most likely form from hole trapping on the hydroxyl oxygen atoms as well.

111
4.6 References
ADRIAN, F.J., JEITE, A.N., SPAETH, J.M. (1985): Theory of indirect hyperfine
interactions of oxygen-aluminum defects in ionic crystals. Phys. Rev. B, 31,
3923–3931.
AHMED, F., BELT, R. F., AND GASHUROV, G. (1986): Infrared study of KTiOPO4
single crystals hydrothermally grown in H2O and D2O solutions. Journal of Applied
Physics. 60, 839-841.
ALLARD, T. & CALAS, G. (2009): Radiation effects on clay mineral properties. Appl.
Clay Sci., 43, 143–149.
ALLARD, T., ILDEFONSE, P., PEREZ DEL VILLAR, L., SORIEUL, S., PELAYO, M.,
BOIZOT, B., BALAN, E., & CALAS, G. (2003) Radiation-induced defects in dickites
from the EL Berrocal granitic system (Spain): relation with past occurrence of
natural radioelements. European Journal of Mineralogy. 15, 629-640.
ALLARD, T., & MULLER J. (1998): Kaolinite as an in situ dosimeter for past
radionuclide migration at the Earth’s surface. Applied Geochemistry. 13, 751-765.
ANGEL, B. R., JONES, J. P. E., & HALL, P. L. (1974): Electron spin resonance studies
of doped synthetic kaolinite. I. Clay Minerals. 10, 247-255.
BALCIC-ŽUNIĆ, T., ŠĆAVNIĆAR, S. & MOLIN, G. (1990): Crystal structure of prehnite
from Komiža. European Journal of Mineralogy. Vol. 2, 731-734.
BAUR, W.H., JOSWIG, W., KASSNER, D. & HOFMEISTER, W. (1990): Prehnite:
structural similarity of the monoclinic and orthorhombic polymorphs and their Si/Al
ordering. Journal of Solid State Chemistry. 86, 330-333.
112
BOTIS, S. M. & PAN, Y. (2009): Theoretical modeling of the Al paramagnetic center
and its precursors in stishovite. Phys. Chem. Minerals (in press; available online)
CLARIDGE, R. F. C., MACKLE, K. M., SUTTON, G. L. A., & TENNANT, W. C. (1994):
10 K EPR of an oxygen-hole aluminum center, [AlO4]0, in x-irradiated zircon,
ZrSiO4. Journal of Physics: Condense Matter. 6, 10415-10422.
CLOZEL, B., ALLARD, T., & MULLER, J. P. (1994): Nature and stability of
radiation-induced defects in natural Kaolinite: new results and a reappraisal of
published works. Clays and clay minerals. 42, 657-666.
CLOZEL, B., GAITE, J. M., & MULLER, J. P. (1995): Al-O--Al paramagnetic defects in
kaolinite. Physics and chemistry in minerals. 22, 351-356.
DA SILVA, D. N., GUEDES, K. J., PINHEIRO, M. V. B., SPAETH, J. M., & KRAMBROCK,
K. (2005): The microscopic structure of the oxygen-aluminum hole center in natural
and neutron irradiated blue topaz. Physics and chemistry of minerals. 32, 436-441.
DETRIE, T.A., ROSS, N.L., ANGEL, R.J., & WELCH, M.D. (2008): Crystal chemistry
and location of hydrogen atoms in prehnite. Mineral. Mag., 72, 1163–1179.
DIAS, L.N., PINHEIRO, M.V.B., & KRAMBROCK, K. (2009): Radiationinduced defects
in euclase: formation of O- hole and Ti3+ electron centers. Phys. Chem. Minerals, 36,
519–525.
GEMPERLE, C. & SCHWEIGER, A. (1991): Pulsed electron-nuclear double resonance
methodology. Chem. Rev., 91, 1481–1505.

113
GÖTZE, J., PLÖTZE, M., GÖTTE, TH., NEUSER, R. D., & RICHTER, D. K. (2002)
Cathodoluminescence and electron paramagnetic resonance studies of clay minerals.
Mineralogy and petrology. 76, 195-212.
HALL, P. L. (1980): The application of electron spin resonance spectroscopy to
studies of clay minerals: I. isomorphous subsitutions and external surface properties.
Clay minerals. 15, 321-335.
IKEYA, M. (1993): New applications of electron paramagnetic resonance: ESR
dating, dosimetry, and spectroscopy. World Scientific, Singapore.
JONES, J. P. E., ANGEL, B. R., & HALL, P. L. (1974): Electron spin resonance studies
of doped synthetic kaolinite. II. Clay Minerals. 10, 257-270.
KÖKSAL, F., KOSEOGLU, R., SAKA, I., BASARAN, E., & SENER, F. (2004): Electron
paramagnetic resonance of natural and gamma-irradiated alunite and kaolin mineral
powders. Radiation effects & Defects in solids. 159, 393-398.
KRAMBROCK, K., PINHEIRO, M .V. B., GUEDES, K. J., MEDEIROS, S. M., SCHWEIZER,
S. & SPAETH, J. -M. (2004): Correlation of irradiation-induced yellow color with the
O− hole center in tourmaline. Physics and Chemistry of Minerals, 31: 168-175.
LUNSFORD, J.H. (1973): ESR of adsorbed oxygen species. Catal. Rev., 8, 135–157.
MAO, M. & PAN, Y. (2009): Radiation-induced defects in apophyllites. I. The NH2
free radical in fluorapophyllite. Eur J Mineral. 21, 317-324.
MAO, M., NILGES, M.J. & PAN, Y. (2010): Radiation-induced defects in apophyllites.
II. An O− centre and O−−O− pairs in hydroxylapophyllite. Eur. J. Mineral., 22,
89-102.
114
MEADS, R. E. & MALDEN P. J. (1975): Electron spin resonance in natural kaolinites
containing Fe3+ and other transition metal ions. Clay minerals. 10, 313-345.
MOMBOURQUETTE, M.J., WEIL, J.A., & MCGAVIN, D. (1996): EPR–NMR users’
manual, Department of Chemistry, University of Saskatchewan, Saskatoon,
Saskatchewan.
MORICHON, E., ALLARD, T., BEAUFORT, D., & PATRIER, P. (2008): Evidence of
native radiation-induced paramagnetic defects in natural illites from
unconformity-type uranium deposits. Physics and chemistry of minerals. 35,
339-346.
MOSSER, C., BOUDEULLE, M., WEBER, F., & PACQUET, A. (1996): Ferriferous and
vanadiferous kaolinites from the hydrothermal alteration halo of the cigar lake
uranium deposit (Canada). Clay Minerals. 31, 291-299.
NOVOZHILOV, A.I., SAMOILOVICH, M.I., SERGEEV-BOBR, A.A. & ANIKIN, I.N. (1969):
EPR in irradiated fluorphlogopite. Zhur. Struk. Knim. 10, 45-453.
NUTTALL, R.H.D. & WEIL, J.A. (1981): The magnetic properties of the oxygen-hole
aluminum centers in crystalline SiO2. I. [AlO4]0. Can. J. Phys., 59, 1696–1708.
PAN, Y. & HU, B. (2009): Radiation-induced defects in quartz. IV. Thermal
properties and implications. Phys. Chem. Minerals, 36, 421-430.
PAN, Y., MAO, M. & LIN, J. (2009): Single-crystal EPR study of Fe3+ and VO2+ in
prehnite from the Jeffrey mine, asbestos, Quebec. Can. Mineral., 47, 1013-1025.

115
PAPIKE, J.J. & ZOLTAI, T. (1965): Ordering of tetrahedral aluminum in prehnite
Ca2(Al,Fe+3)[Si3AlO10](OH)2. Am. Mineral. 52, 974-984.
PENG, S.-T., CHOU, K.-D. & TANG, Y.-C. (1959): The structure of prehnite. Acta
Chim. Sinica 25, 56-63.
PETROV, I, AGEL, A, & HAFNER, S. S. (1989): Distinct defect centers at oxygen
positions in albite. Am. Mineral. 74, 1130-1141.
PLÖTZE, M., KAHR, G., & HERMANNS STENGELE, R. (2003): Alteration of clay
minerals – gamma-irradiation effects on physicochemical properties. Appl. Clay Sci.,
23, 195–202.
PREISINGER, A. (1965): Prehnit – ein neuer Schichtsilikattyp. Tschermaks Mineral.
Petrogr. Mitt., 10, 491–504.
THEIS, W. M., NORRIS, G. B., & PORTER, M. D. (1985): High resolution infrared
measurements of the OH- bands in KTiOPO4. Applied Physics Letters. 46,
1033-1035.
WEIL, J.A. & BOLTON J.R. (2007): Electron paramagnetic resonance: elementary
theory and practical applications. Wiley-Interscience, John Wiley & Sons Inc., New
York, 664 p.
YU, J., LEE, C., LIU, K., LIU, C., HUANG, Y., PAYNE, D. A., & LII, K. (1995): Electron
paramagnetic resonance study of an Al-associated oxygen hole center in KTiOPO4:
Al crystals. Journal of Physics and Chemistry in Solids. 56, 233-240.

116
ZHAO, W.-Y., LIU, X.-W., WANG, Q.-Y. & ZHANG, Q.-J. (2003): Space symmetry of
prehnite, Ca2Al[6][Si3AlO10](OH)2, from the Tieshan iron mineral deposit, Central
China. Mineral. Mag., 67, 73–77.
117
Chapter 5
Hemimorphite as a natural sink for arsenic in zinc deposits and
related mine tailings: Evidence from single-crystal EPR
spectroscopy and hydrothermal synthesis
Hemimorphite is a refractory mineral in surface environments and occurs
commonly in supergene non-sulfide Zn deposits and Zn mine tailings. Single-crystal
electron paramagnetic resonance (EPR) spectra of gamma-ray-irradiated
hemimorphite from Mapimi (Durango, Mexico) reveal two arsenic-associated
oxyradicals: [AsO4]4- and [AsO4]
2-. Inductively coupled plasma mass spectrometry
analyses confirm this sample to contain 270 ppm As and that hemimorphite from
other Zn deposits has appreciable amounts of arsenic as well. Spin Hamiltonian
parameters, including matrices g, A(75As) and P(75As), show that the [AsO4]4- radical
formed from electron trapping by a locally uncompensated [AsO4]3- ion substituting
for [SiO4]4-. Matrices g, A(75As) and P(75As) of the [AsO4]
2- radical show it to have
the unpaired spin on the bridging oxygen of an [AsO4]3- ion at a Si site and linked to a
monovalent impurity ion. This structural model for the [AsO4]2- radical is further
supported by observed 29Si and 1H superhyperfine structures arising from interactions
with a single Si atom and two equivalent H atoms, respectively. Hydrothermal
118
experiments at 200 °C and ~9.5 MPa show that hemimorphite contains up to ~2.5
wt% As2O5 and suggest that both the arsenate concentration and the pH value in the
solution affect the As content in hemimorphite. These results demonstrate that
hemimorphite is capable of sequestering arsenate in its crystal lattice, hence is a
natural sink for attenuating As in supergene non-sulfide Zn deposits and Zn mine
tailings. Moreover, results from hemimorphite potentially have more far-reaching
implications for major silicates such as zeolites in the immobilization and removal of
arsenic in surface environments.

119
5.1 Introduction
Arsenic has long been the subject of intense research, because it is one of the
most common and highly toxic contaminants in surface environments, including those
associated with mining activities and metallurgical processes (Nriagu, 1994; Foster et
al., 1998; Courtin-Nomade et al., 2009; Walker et al., 2009). Numerous studies have
demonstrated that the mobility and bioavailability of As are usually closely related to
its host phases (i.e., minerals in many cases; Foster et al., 1998; Courtin-Nomade et
al., 2009; Walker et al., 2009). Therefore, significant efforts have been devoted to the
identification and development of minerals (or their synthetic equivalents) that are
capable of fixing or minimizing the mobility and bioavailability of As in the
environment (e.g., Bothe and Brown, 1999; Di Benedetto et al., 2006; Blanchard et al.,
2007; Fernández- Martínez et al., 2008; Lee et al., 2009; Drahota & Filipi, 2009).
As part of our ongoing study on radiation-induced defects in silicates (Mao
& Pan, 2009; Pan et al., 2009; Mao et al., 2010), we have investigated gamma-ray
irradiated hemimorphite by electron paramagnetic resonance (EPR) spectroscopy.
EPR spectroscopy is a powerful and well-established technique for structural
characterization of dilute paramagnetic species (i.e., those with at least one unpaired
electron; Calas, 1988; Pan et al., 2002; Weil & Bolton, 2007). Hemimorphite,
Zn4(Si2O7)(OH)2•H2O, is a common mineral (and often important ore) in the
oxidized parts of zinc deposits (i.e., non-sulfide Zn deposits; Takahashi, 1960; Boni
& Large, 2003; Hitzman et al., 2003; Coppola et al., 2008) and has been reported to
occur in Zn mine tailings as well (Walder & Chavez, 1995; Day & Bowell, 2005;

120
Espiari et al., 2006; Schaider et al., 2007; Cabala et al., 2009). EPR spectra
presented herein show for the first time that natural hemimorphite contains
lattice-bound arsenate. This result is supported by compositional data of natural and
synthetic hemimorphite from inductively coupled plasma mass spectrometry
(ICPMS) and electron-microprobe analyses, respectively. These new structural,
chemical and experimental results collectively demonstrate hemimorphite as a
natural sink for As in Zn deposits and related mine tailings, and potentially have
far-reaching implications for other silicates in the immobilization and removal of
arsenic in surface environments.
Hemimorphite has attracted a large number of recent studies stemming from
not only interesting features associated with its zeolite-like crystal structure
containing a confined water molecule in the channel (Figure 5.1a; Libowitzky and
Rossman, 1997; Libowitzky et al., 1997, 1998; Kolesov, 2006; Frost et al., 2007;
Geiger & Dachs, 2009; Dachs & Geiger, 2009) but also its catalytic applications
(Breuer et al., 1999; Yurieva et al., 2001; Catillon-Mucherie et al., 2007). The
structure of hemimorphite (space group Imm2) consists of corner-sharing Zn(OH)O3
and SiO4 tetrahedra that have all of their apices aligned approximately along the
crystallographic axis c, giving rise to its characteristic polar structure (Barclay &
Cox, 1960; McDonald & Cruickshank, 1967; Hill et al., 1977; Takeuchi et al., 1978;
Cooper et al., 1981; Libowitzky et al., 1998). Two zinc and one silicon tetrahedra
are first linked to form rings, which in turn are linked in infinite sheets parallel to the
(010) plane (McDonald & Cruickshank, 1967). Two neighboring SiO4 tetrahedra are
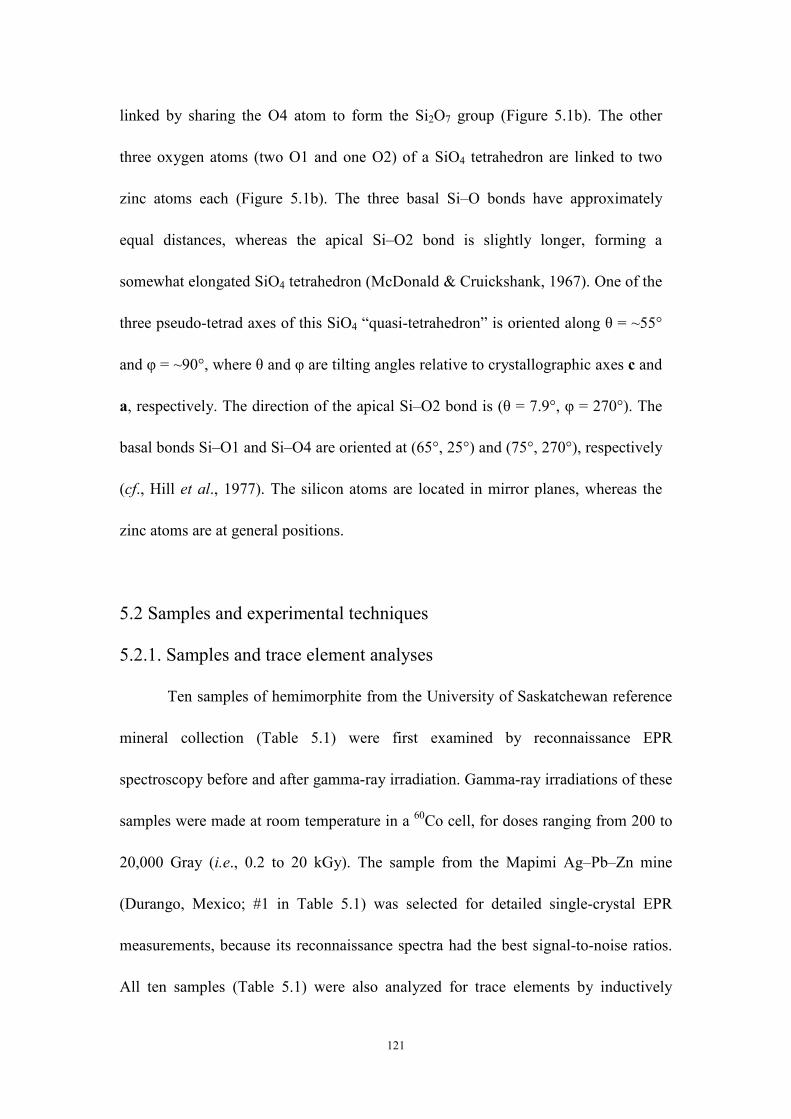
121
linked by sharing the O4 atom to form the Si2O7 group (Figure 5.1b). The other
three oxygen atoms (two O1 and one O2) of a SiO4 tetrahedron are linked to two
zinc atoms each (Figure 5.1b). The three basal Si–O bonds have approximately
equal distances, whereas the apical Si–O2 bond is slightly longer, forming a
somewhat elongated SiO4 tetrahedron (McDonald & Cruickshank, 1967). One of the
three pseudo-tetrad axes of this SiO4 “quasi-tetrahedron” is oriented along θ = ~55°
and φ = ~90°, where θ and φ are tilting angles relative to crystallographic axes c and
a, respectively. The direction of the apical Si–O2 bond is (θ = 7.9°, φ = 270°). The
basal bonds Si–O1 and Si–O4 are oriented at (65°, 25°) and (75°, 270°), respectively
(cf., Hill et al., 1977). The silicon atoms are located in mirror planes, whereas the
zinc atoms are at general positions.
5.2 Samples and experimental techniques
5.2.1. Samples and trace element analyses
Ten samples of hemimorphite from the University of Saskatchewan reference
mineral collection (Table 5.1) were first examined by reconnaissance EPR
spectroscopy before and after gamma-ray irradiation. Gamma-ray irradiations of these
samples were made at room temperature in a 60Co cell, for doses ranging from 200 to
20,000 Gray (i.e., 0.2 to 20 kGy). The sample from the Mapimi Ag–Pb–Zn mine
(Durango, Mexico; #1 in Table 5.1) was selected for detailed single-crystal EPR
measurements, because its reconnaissance spectra had the best signal-to-noise ratios.
All ten samples (Table 5.1) were also analyzed for trace elements by inductively

122
coupled plasma mass spectrometry (ICPMS), using the HF–HNO3 dissolution method,
at the Department of Geological Sciences, University of Saskatchewan.
Figure 5.1 (a) Crystal structure of hemimorphite projected to the (001) plane; (b)
linkage of the Si2O7 group and its neighboring Zn atoms; also included is the
molecular H2O in the channel. Labels of the oxygen atoms after Hill et al. (1977).
5.2.2 EPR measurements
All EPR spectra were measured on a Bruker EMX spectrometer at the
Saskatchewan Structure Sciences Centre, which is equipped with an automatic
frequency controller, a high-sensitivity ER4119 cavity, and a home-made goniometer.
The coordinate system selected for single-crystal EPR spectral measurements and

123
analyses has the experimental axes x, y and z parallel to the crystallographic axes a, b
and c, respectively. Reconnaissance single-crystal EPR spectra were made for each
crystal before and after gamma-ray irradiation, with the magnetic field B parallel to c
(Figure 5.2a). Two crystals irradiated at ~1 and ~20 kGy were then chosen for
detailed single-crystal EPR measurements in three orthogonal rotation planes [i.e.,
plane xz approximately parallel to the {010} cleavage, and yz and xy parallel to the
(100) and (001) crystal faces; see results of angle corrections below]. This crystal
irradiated to a total dose of ~1 kGy was taken out of the 60Co cell for measurements at
intermediate doses of ~0.2, 0.4 and 0.6 kGy. Also, this crystal was re-measured after
storage at room temperature for 18 days.
Experimental conditions for single-crystal EPR measurements at room
temperature (~290 K; Table 5.2) included a microwave frequency of ~9.36 GHz and
~9.61 GHz and a microwave power of ~20 mW and 63 mW for wide and narrow
scans (see below), respectively, a modulation frequency of 100 kHz, and a modulation
amplitude of 0.06 mT. Both crystals irradiated at ~1 and 20 kGy were measured in a
wide magnetic field range from 80 to 520 mT and a resolution of ~0.107 mT (i.e.,
4096 data points over 440 mT), while the crystal having a dose of ~1 kGy was also
measured in a narrow range from 334 to 348 mT and a resolution of ~0.014 mT (1024
points over 14 mT). Calibration of the magnetic field was made by use of
α,γ-bis-diphenylene-β-phenyl allyl (BDPA) in benzene (g = 2.0027) as a standard.

124
5.2.3 Hydrothermal synthesis
Natural hemimorphite in laterites generally occurs as extremely fine-grained
aggregates (e.g., McPhail et al., 2004; Coppola et al., 2008), whereas its epigenetic
counterpart is known to form millimeter-sized or larger crystals. Accordingly, we
conducted our synthesis experiments of hemimorphite at 200 °C and ~9.5 MPa to
produce suitable crystals for electron-microprobe analysis to investigate factors
controlling the incorporation of As in this mineral.
Three series of hydrothermal syntheses were made using Zn powder from
Alfar Aesar, natural quartz and NaH2AsO4 •7H2O (Alfar Aesar) as starting materials
(Table 5.3). These materials were used without further purification. Series I had a
constant initial pH value of 12 but variable Zn:Si:As atomic ratios from 2:1:1 to
64:32:1. Series II used a constant Zn:Si:As atomic ratio of 2:1:1 but variable initial
pH values from 0 to 14. Series III had the same range of initial pH values from 0 to
14 but a uniform Zn:Si:As atomic ratio of 16:8:1. These mixtures in ~10 mL
deionized water, after their initial pH values were adjusted by use of KOH and
HNO3, were loaded into 23 mL acid digestion bombs (Parr Instrument Company).
These bombs were heated to 200 °C and held there for 48 h. The water volume of 10
mL in these 23 mL bombs at 200 °C corresponds to a pressure of ~9.5 MPa. In
addition, reconnaissance experiments using the same starting materials, Zn:Si
atomic ratios from 16:1 to 1:1 and initial pH values from 2 to 12 have been
attempted at room temperature and atmospheric pressure for durations up to one
month, but were not successful in producing hemimorphite.

125
Solid products from each experiment were recovered by washing in deionized
water and air dried. They were first examined on a petrographic microscope and then
measured for powder X-ray diffraction (PXRD) patterns by using a Rigaku R200
diffractometer with CuKα1 radiation (k = 1.54056 Å ) at 40 kV and 30 mA.
Subsequently, the solid products were embedded in epoxy and polished for
back-scattered electron imaging and quantitative wavelength-dispersive-spectrometry
analysis on a JEOL JXA-8600 superprobe at the Department of Geological Sciences,
University of Saskatchewan. Analytical conditions included 15 kV accelerating
voltage, 10 nA beam current, 1–2 µm beam size, counting times of 30 s (Zn and Si)
and 90 s (As), and Zn metal (Zn), GaAs (As) and quartz (Si) as standards.
5.3 Results
5.3.1 Crystals and compositions of natural hemimorphite
Selected crystals of hemimorphite from Mapimi are approximately 3 x 3 x 1
mm in dimension and are characterized by a perfect {010} cleavage and
well-developed (100) and (001) faces. They are colorless both before and after
gamma-ray irradiation. Duplicate ICPMS analyses yielded closely comparable
abundances for all elements analyzed for, including Al (728 and 756 ppm), As (269
and 271), Ca (7250 and 7020), Cd (26 and 26), Cu (357 and 351), Fe (67 and 63), Ga
(82 and 81), Mg (27 and 30), Pb (1.9 and 2.0), Sb (9.1 and 9.2), Ti (36 and 32) and W
(4.1 and 3.9). Other trace elements analyzed for (Li, Rb, Cs, Ba, Sr, Mn, Cr, Co, Ni,

126
Sc, V, Be, Bi, Ge, Sn, P,Y, Zr, Hf, Nb, Ta, Tl, Mo, Th, U and rare-earth elements) are
below 1 ppm.
Other samples of hemimorphite investigated in this study also contain
millimeter-sized crystals, except that sample #8 is composed of fine-grained
aggregates as encrustation (Table 5.1). These samples were chosen not only to
represent hemimorphite from diverse Zn deposits but also allow easy mineral
separation for ICPMS analyses. Crystals in samples #2 and #3 are similar in
appearance to those in sample #1 but have notably lower contents of As (Table 5.1).
Two samples from the El Potosi Ag–Pb–Zn mine (Chihuahua, Mexico) also have
different As contents. Samples of hemimorphite from other Zn and Zn–Pb–Cu
deposits (Franklin and Sterling Hill, New Jersey; Evelyn Mine, Pine Creek, Australia;
M’Fouati, Reneville, Congo) all contain appreciable amounts of arsenic as well (Table
5.1). Other notable trace elements in these samples are Cu, Pb and Cd (up to 1295,
1280 and 51 ppm, respectively; Table 5.1).
Table 5.1 Summary of hemimorphite samples investigated in this study. No. Location As (ppm) Cu (ppm) Pb (ppm) Cd (ppm)
1 Mapimi, Durango, Mexico 269 (271) 357 (351) 1.9 (2.0) 26 (26)
2 Durango, Mexico 6 765 1280 51
3 Durango, Mexico 127 936 36 <0.11
4 El Potosi, Chihuahua, Mexico 36 1200 390 4.39
5 El Potosi, Chihuahua, Mexico 18 1030 89 0.49
6 Evelyn Mine, Pine Creek, Australia 39 1000 70 11
7 Franklin, New Jersey, USA 200 760 3.7 1.59
8 Sterling Hill, New Jersey, USA 275 570 31 4.68
9 79 Mine, Gila Co., Arizona, USA 79 1295 163 39
10 M’Fouati, Reneville, Congo 338 669 436 2.59

127
5.3.2 Single-crystal EPR spectra of natural hemimorphite
Two previous EPR studies of natural hemimorphite reported the following
paramagnetic centers: Cu2+, Mn2+, Fe3+ and E’ (Vassilikou-Dova and Eftaxias, 1991;
Gallegos et al., 2009). These centers, except for E’, have been observed in samples of
hemimorphite examined by our reconnaissance EPR measurements. Single-crystal
EPR spectra of the as-is hemimorphite from Mapimi (not shown), however, contain
only a broad Fe3+ peak at the effective g value of ~4.28.
Single-crystal EPR spectra of gamma-ray irradiated hemimorphite from
Mapimi, measured at B//c and 290 K, reveal the presence of two quartets (i.e., each
with four peaks of approximately equal intensities), in addition to the broad Fe3+
peak at the effective g value of ~4.28 (Figure 5.2a). One quartet is characterized by
large and unequal separations from ~80 to 200 mT (Figure 5.2a), whereas the other
has small separations of ~2 mT (Figure 5.2a and b). Measurements of one crystal
immediately after each step of gamma-ray irradiation show that these quartets are
well resolved with a dose of as little as 0.2 kGy and grow in intensity almost linearly
with increasing dose to 1 kGy, whereas the Fe3+ center is unaffected by irradiation
(Figure 5.3). Re-measurements of this crystal after storage at room temperature for
18 days show that both quartets exhibit significant degrees of decay, but the Fe3+
center remains the same (Figure 5.3). Step-wise irradiation of another crystal yielded
similar trends up to ~2 kGy, where the narrow quartet reaches saturation and starts
to decrease with further irradiation. Assuming a steady-state rate of decay, the half
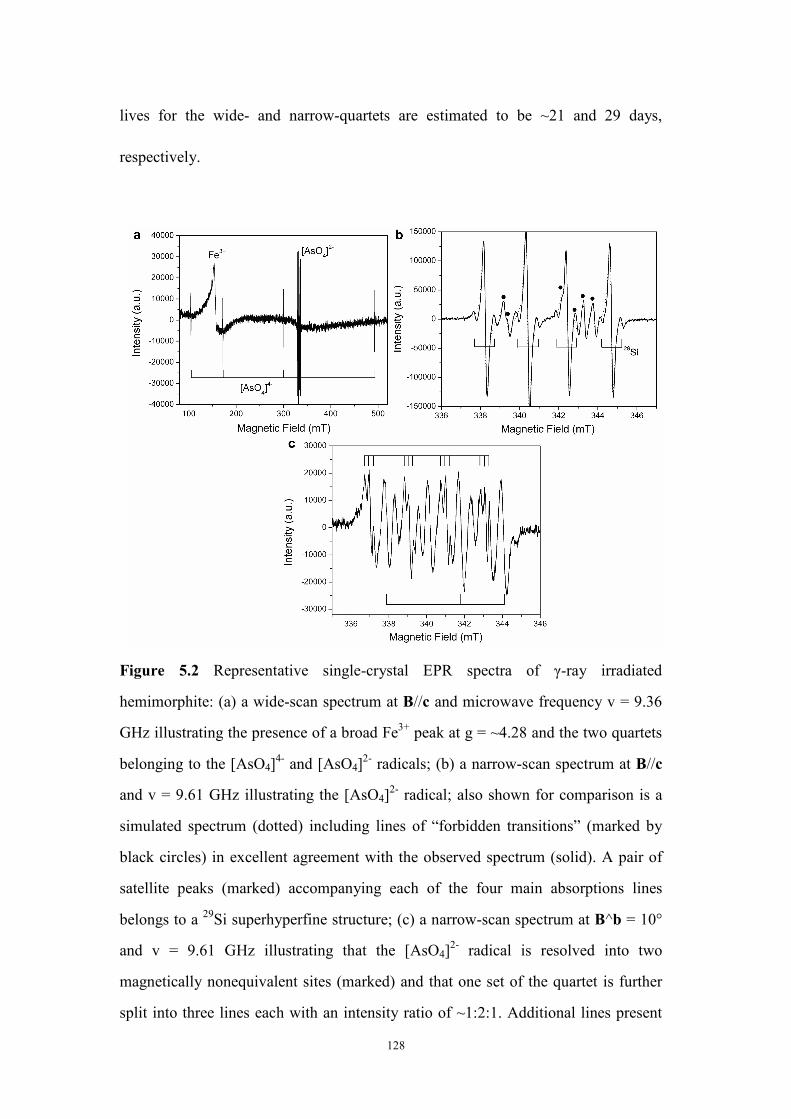
128
lives for the wide- and narrow-quartets are estimated to be ~21 and 29 days,
respectively.
Figure 5.2 Representative single-crystal EPR spectra of γ-ray irradiated
hemimorphite: (a) a wide-scan spectrum at B//c and microwave frequency v = 9.36
GHz illustrating the presence of a broad Fe3+ peak at g = ~4.28 and the two quartets
belonging to the [AsO4]4- and [AsO4]
2- radicals; (b) a narrow-scan spectrum at B//c
and v = 9.61 GHz illustrating the [AsO4]2- radical; also shown for comparison is a
simulated spectrum (dotted) including lines of “forbidden transitions” (marked by
black circles) in excellent agreement with the observed spectrum (solid). A pair of
satellite peaks (marked) accompanying each of the four main absorptions lines
belongs to a 29Si superhyperfine structure; (c) a narrow-scan spectrum at B^b = 10°
and v = 9.61 GHz illustrating that the [AsO4]2- radical is resolved into two
magnetically nonequivalent sites (marked) and that one set of the quartet is further
split into three lines each with an intensity ratio of ~1:2:1. Additional lines present

129
are attributable to “forbidden transitions”.
The quartet with large and unequal separations is attributable to a center with
an electron spin S = 1/2 interacting with a nucleus of I = 3/2 and a natural isotope
abundance of ~100%, and a large hyperfine constant. This quartet is resolved into
four sets in both (001) and (010) planes but only two sets in the (100) plane (Figure
5.4), indicative of four magnetically nonequivalent sites (i.e., a triclinic site
symmetry in the orthorhombic hemimorphite; Rae, 1969). The average linewidth of
this quartet is ~0.3 mT. The presence of As from ICPMS analyses, together with the
fitted spin Hamiltonian parameters (see below), allows us to identify this quartet to
represent the [AsO4]4- radical (cf., Dalal et al., 1972, 1977).
The narrow quartet is also attributable to a simple spin S = 1/2 interacting with
an ~100% naturally abundant nucleus of I = 3/2. This quartet, which has an average
linewidth of ~0.3 mT as well, is resolved in to a maximum of only two sets in the
(010) plane (Figure 5.5), indicating a monoclinic site symmetry (Rae, 1969). We
interpret this quartet to represent the [AsO4]2- radical (i.e., an arsenic-associated hole
center; Edwards et al., 1968; Subramanian et al., 1977). Interestingly, this [AsO4]2-
radical in hemimorphite is characterized by the common presence of extra weak lines.
For example, a pair of weak satellite peaks with a separation of ~1 mT accompanying
each of the main absorption lines are clearly resolved at B//c (Figure 5.2b). Spectral
simulations confirm that these satellite peaks have almost uniform intensities of
~2.5% of their respective main lines and, hence, are best explained by a 29Si
superhyperfine structure (i.e., interaction with a single 29Si nucleus with I = 1/2 and
130
natural isotope abundance of 4.7%). Roadmaps (Figure 5.5) show that separations of
the main lines vary significantly, indicative of a considerable nuclear quadrupole
effect. Some weak lines (e.g., Figure 5.2b) are attributable to this nuclear quadrupole
effect (see below). In addition, each of four main lines for two magnetically
equivalent sites of this radical at B^b ≈ 10° in the xz plane is resolved into three lines
with an intensity ratio of ~1:2:1 (Figure 5.2c), which are interpreted to represent a 1H
superhyperfine arising from interaction with two equivalent (or nearly equivalent)
hydrogen atoms (see below).
5.3.3 Spin Hamiltonian parameters of the [AsO4]4- and [AsO4]
2- radicals
The numbers of line-position data for the 29Si and 1H superhyperfine
structures of the [AsO4]2- radical (Figure 5.2b and c), unfortunately, are inadequate
for quantitative analyses. Therefore, the spin Hamiltonian for both [AsO4]4- and
[AsO4]2- radicals, which involve a single unpaired electron (S = 1/2) and a 75As
hyperfine structure (I = 3/2), can be written as:
H = βeBT • g • S + IT
• A • S - βnBT • gn • I + IT
• P • I ..................................(5.1)
where βe and βn are the electronic (Bohr) and nuclear magneton, respectively; and an
isotropic gn value of 0.959647 is adopted for 75As (Weil and Bolton, 2007). The
parameters to be optimized are matrices g, A and P. Iterative fittings for both
radicals, using the software package EPR–NMR (Mombourquette et al., 1996), were
made first by inclusion of only matrices g and A, and were accompanied by steps of

131
angle corrections. Matrix P was added in the final stage and was fitted together with
g and A.
Table 5.2 Spin Hamiltonian parameters of [AsO4]4- and [AsO4]
2- in hemimorphite at 290 K. Principal direction RMSD
Matrix Y k Principal value (Yk)
Yk θ (˚) φ (˚) (mT)
[AsO4]4−
2.00489(4) −0.00021(6) 0.00007(4) 1 2.00490(4) 90.2(5) 357.5(8)
1.99959(4) 0.00259(4) 2 2.00130(4) 56.3(3) 88(1)
g
1.99740(3) 3 1.99568(4) 33.6(3) 267.9(6)
121.89(1) 0.20(1) 0.22(1) 1 131.43(1) 51.2(2) 87.7(2)
126.92(1) 5.57(1) 2 121.88(1) 89.9(2) 357.6(2)
A/geβe
(mT) 124.44(1) 3 119.97(1) 141.2(2) 87.4(4)
0.13(1) −0.01(2) 0.02(1) 1 0.35(1) 135.0(9) 100(7)
−0.07(1) −0.42(1) 2 0.13(1) 85(4) 185(3)
P/geβe
(mT) −0.06(1) 3 −0.48(1) 45.4(6) 90(2)
0.074
[AsO4]2−
2.00982(1) 0.00000(1) 0.00000(1) 1 2.02407(1) 52.6(2) 270.0(2)
2.01641(1) −0.01003(1) 2 2.00982(1) 89.9(2) 180.0(2)
g
2.01092(1) 3 2.00326(1) 142.6(2) 270.0(2)
1.678(1) 0.000(1) 0.000(1) 1 2.158(1) 42.0(2) 270.0(3)
1.994(1) −0.147(1) 2 1.861(1) 132.1(2) 270(1)
A/geβe
(mT) 2.025(1) 3 1.678(1) 89.9(5) 0.0(5)
0.142(1) 0.000(1) 0.000(2) 1 0.142(1) 90(4) 360(1)
−0.229(1) 0.110(1) 2 0.121(1) 17.8(2) 90(16)
P/geβe
(mT) 0.086(1) 3 −0.263(1) 72.1(2) 270.0(3)
0.026
Results reported here are for one of four symmetrically equivalent sites in the rotation group D2.
Polar angle θ is relative to the crystallographic axis c, and azimuth angle φ is relative to axis a.
(θ, φ) is equivalent to (180-θ, 180+φ).
A total of 1361 line-position data points from the widescan spectra were used
for fitting the [AsO4]4- radical. Of these, a few points from peaks that occur in the
crossover regions of magnetically nonequivalent sites or overlap with those of other
centers were assigned a weighing factor of 0.5, resulting in a sum of weighted
factors of 1351. The final value of the root-mean-squares of weighted differences
(RMSD) between the calculated and observed line positions is 0.074 mT, which is

132
only one third of the average linewidth of this radical. The calculated normals of the
experimental yz and xy planes at (90.01°, 0.02°) and (0.8°, 168.5°), respectively, are
close to the ideal normal directions of the (100) and (001) faces at (90°, 0°) and (0°,
180°), suggesting excellent crystal alignments for these two planes. The calculated
normal of the xz plane at (86.5°, 88.1°), on the other hand, is ~4° away from the
normal of the {010} cleavage at (90°, 90°). This misalignment makes the
experimental “xz” plane essentially a general plane, where all four magnetically
nonequivalent sites are resolved (Figure 5.4c). We emphasize that crystal
misalignment has been corrected for during data analysis and, therefore, is not
expected to contribute significant errors to the fitted spin Hamiltonian parameters
(Table 5.2).
Figure 5.3 Intensities of the Fe3+ center and the [AsO4]4- and [AsO4]
2- radicals as a
function of gamma-ray radiation dose. Also shown are the intensities of these
centers after 1 kGy irradiation and then storage at room temperature for 18 days.

133
The most salient feature of the fitted matrix g for the [AsO4]4- radical is that
it deviates only slightly from an axial symmetry (Table 5.2). Matrix A is axial in
symmetry as well, with the unique Amax axis at (51.3°, 87.7°) approximately coaxial
with the gint axis (Table 5.2). The nuclear quadrupole tensor P is two orders of
magnitude smaller than the hyperfine constants and, therefore, is difficult to
determine precisely. Nevertheless, one principal P axis oriented at (45.4°, 90°) is
approximately coaxial with the gint and Amax axes (Table 5.2).
Figure 5.4 Line-position data points of the [AsO4]4- radical (the highest-field
hyperfine transition only) in hemimorphite as a function of rotation angles (i.e.,
roadmaps; at a microwave frequency of 9.36 GHz): (a) experimental xy plane:
B//(001), (b) yz plane: B//(100) and (c) xz plane: B//{010}; note that this plane has a
crystal misalignment of ~4°.

134
A total of 1776 line-position data points from the main absorption lines in the
narrow-scan spectra were used for fitting the [AsO4]2- radical. Again, data points for
lines that occur in the crossover regions of magnetically nonequivalent sites or
overlap with those of other centers were assigned a weighing factor of 0.5, yielding a
sum of weighted factors of 1759. Angle corrections yielded the normals of the
experimental yz, xz and xy planes at (89.99°, 0.02°), (89.99°, 90.00°) and (0.00°,
17.58°), respectively, all close to perfect crystal alignments. The final RMSD value
between calculated and measured line-position data is 0.026 mT (Table 5.2).
Figure 5.5 Line-position data points of the [AsO4]2- radical (the main absorption
lines only) in hemimorphite as a function of rotation angles (i.e., roadmaps; at a
microwave frequency of 9.61 GHz): (a) experimental xy plane: B//(001), (b) xz plane:
B//{010} and (c) yz plane: B//(100).

135
Matrices g and A of the [AsO4]2- radical are characterized by approximately
coaxial gmax and Amax axes (Table 5.2). The fitted principle P values of this radical
(Table 5.1) are ~10% of the hyperfine constants (Table 5.2). The unique Pmin axis is
also in the same plane with the gmax and Amax axes (Table 5.2) and is only 3° away
from the Si–O4 bond direction in the hemimorphite structure. Spectral simulations
confirm that these spin Hamiltonian parameters (including the nuclear quadrupole
tensor), fitted from the main absorption lines, make excellent predictions for the
“forbidden transitions” (mI ≠ 1) in the observed spectra (e.g., Figure 5.2b).
Figure 5.6 Representative PXRD pattern of solid products from synthesis
experiments at 200 °C and ~9.5 MPa (run #14; Table 5.3).
5.3.4 Synthetic hemimorphite
Powder X-ray diffraction (PXRD) patterns (Figure 5.6) confirm optical
examinations that the solid products from Series I experiments all contain

136
hemimorphite and zincite (plus unreacted quartz in low-As runs; Table 5.3). Series
II experiments produced hemimorphite and zincite at initial pH values ≥ 8, a mixture
of adamite [Zn2AsO4(OH)], hemimorphite and zincite at the initial pH value of 6,
but only adamite and zincite at initial pH values ≤ 4 (Table 5.3). Similarly,
hemimorphite appears only in Series III at initial pH values ≥ 4 (Table 5.3). It is
noteworthy that the final pH values of all experiments are higher than their
respective initial values (Table 5.3).
Figure 5.7 Representative back-scattered electron image illustrating euhedral
hemimorphite crystals with zincite (light grey) and unreacted Zn (white) from run #4
(Table 5.3).
Hemimorphite occurs as euhedral platy crystals that sometimes contain
zincite as inclusions (occasionally unreacted Zn as well; Figure 5.7). Individual
crystals of hemimorphite from the As-rich runs are only ~10–30 µm in the
maximum dimension, but up to 120 µm in the As-poor runs. Notable exceptions are

137
runs #10 of Series II and #17 and #18 of Series III (Table 5.3), in which
hemimorphite crystals are invariably smaller than 1 µm in width, making them
difficult for quantitative electron-microprobe analysis.
Figure 5.8 As contents in synthetic hemimorphite: (a) as a function of the Si/As
atomic ratio in the starting materials from Series I experiments and (b) as a function
of the initial pH values from Series I, II and III experiments. Error bars represent
standard deviations.
Electron-microprobe analyses show that the As contents in hemimorphite from
Series I experiments vary considerably in a given run (i.e., standard deviation as large
as 70% of the average value; Table 5.3). This variation is unlikely to be an analytical
artifact, because analyses using a defocused beam (~10 µm) to minimize dehydration
related to beam damage yielded similar ranges of As values. It is noteworthy that the
measured As content in hemimorphite of Series I correlates positively with the As/Si
value in the starting materials (Figure 5.8a). Similarly, the measured As contents in
hemimorphite from Series II and III experiments show large variations as well, which
are at least partly attributable to analytical difficulties related to small crystal sizes in

138
runs #10, #17 and #18. For example, one analysis of hemimorphite from run #10
yielded an anomalous value of 5.11 wt% As2O5, whereas other analyses from this
same run gave 1–2 wt% As2O5. Generally, the measured As contents in hemimorphite
from Series II show a negative correlation with the initial pH values (Figure 5.8b). A
similar trend is also apparent for hemimorphite from Series III, except for that from
run #18 (Figure 5.8b).
Table 5.3 Hydrothermal synthesis of hemimorphite at 200 °C and ~9.5 MPa. Starting materials (g) pH Run#
Zn SiO2 NaH2AsO4•7H2O Before After
Solid product Composition*
Series I (Zn:Si:As atomic ratio from 2:1:1 to 64:32:1 and initial pH = 12)
1 0.1307 0.0608 0.312 12 13 Hem+Zct 0.516 ± 0.148
2 0.1307 0.0604 0.156 12 13 Hem+Zct 0.312 ± 0.144
3 0.1307 0.0613 0.078 12 13 Hem+Zct+Qtz 0.227 ± 0.102
4 0.1307 0.0611 0.039 12 13 Hem+Zct+Qtz+Zn 0.157 ± 0.115
5 0.1307 0.0610 0.0195 12 13 Hem+Zct+Qtz 0.069 ± 0.034
6 0.1307 0.0610 0.0098 12 13 Hem+Zct+Qtz 0.157 ± 0.034
Series II (Zn:Si:As atomic ratio = 2:1:1 and initial pH from 14 to 0)
7 0.1307 0.0600 0.312 14 ≥14 Hem+Zct 0.175 ± 0.055
8 0.1307 0.0611 0.312 10 11 Hem+Zct+Qtz 0.807 ± 0.414
9 0.1307 0.0609 0.312 8 11 Hem+Zct+Qtz 1.39 ± 0.62
10 0.1307 0.0604 0.312 6 9 Adm+Hem+Zct+Qtz 2.44 ± 1.83
11 0.1307 0.0607 0.312 4 6.8 Adm+Zct+Qtz
12 0.1307 0.0598 0.312 2 5.5 Adm+Zct+Qtz
13 0.1307 0.0604 0.312 0 3 Adm+Qtz
Series III (Zn:Si:As atomic ratio = 16:8:1 and initial pH from 14 to 0)
14 0.1307 0.0606 0.0390 14 ≥14 Hem+Zct 0.056 ± 0.036
15 0.1307 0.0610 0.0390 10 13 Hem+Zct+Qtz 0.415 ± 0.211
16 0.1307 0.0610 0.0390 8 12 Hem+Zct+Qtz 0.65 ± 0.34
17 0.1307 0.0605 0.0390 6 12 Hem+Zct+Qtz 1.65 ± 0.80
18 0.1307 0.0600 0.0390 4 12 Hem+Zct+Qtz 0.95 ± 0.51
19 0.1307 0.0611 0.0390 2 5 Adm+Zct+Qtz
20 0.1307 0.0609 0.0390 0 2 Qtz
* The As content in hemimorphite (average ± standard deviation) on the basis of 3–10 spot
analyses in each run. Abbreviations: Hem, hemimorphite; Adm, adamite; Zct, zincite; Qtz,
residual quartz and Zn, residual Zn.
139
5.4 Discussion
5.4.1 Structures and formation of the [AsO4]4- and [AsO4]
2- radicals in
hemimorphite
The [AsO4]4- radical in hemimorphite is similar in principal g and A values
to its well-established counterparts in other crystalline hosts (e.g., Dalal et al., 1972,
1977; Murty et al., 1977). This radical has been shown to have the un-paired spin
localized largely on the central As atom, resulting in its large 75As hyperfine
constants (Table 5.2). The reported matrices g and A of the [AsO4]4- radicals are also
known to have approximately axial symmetry, with their unique g and A axes being
coaxial along a pseudo-symmetry axis of the [AsO4]4- polyhedron. The gint, Amax and
Pmin axes of the [AsO4]4- radical at (60°, 90°), (50°, 90°) and (45°, 90°), respectively,
are all close to one pseudo-tetrad axis of the SiO4 tetrahedron in hemimorphite at
(55°, 90°), supporting a location of this radical at a Si site. Indeed, a locally
uncompensated [AsO4]3- ion substituting for a [SiO4]
4- group results in one positive
net charge, hence is an excellent trap for an electron during gamma-ray irradiation.
The observed triclinic symmetry of this radical in hemimorphite suggests that the As
atom, unlike the original Si site, is not in a mirror plane. This distortion is probably
attributable to differences between the [AsO4]3- and [SiO4]
4- groups, with or without
the effect of a charge-compensating ion. Alternatively, this observed symmetry
reduction may be related to trapping of the unpaired electron, which is known to
cause local structural distortion relative to the diamagnetic precursors (Botis & Pan,
2009).

140
Similarly, the fitted principal g and A values for the arsenic-associated hole
center are closely comparable to those of the [AsO4]2- radical in CaWO4, which has
been interpreted to have the unpaired electron largely on an oxygen atom (Edwards
et al., 1968; Subramanian et al., 1977). The [AsO4]2- radical in hemimorphite is
most likely associated with [AsO4]3- ions at the Si site as well, because they are
unlikely to substitute for the [ZnO3(OH)]5- groups owing to differences in both
valence states and ionic radii between As5+ and Zn2+. In addition, the fitted gmax and
Amax axes (Table 5.2) are all in the same plane with the Si, O2 and O4 atoms and are
approximately along the Si–O4 bond direction, suggesting that the unpaired electron
is localized on the O4 atom (Figure 5.2). Moreover, the observed monoclinic
symmetry of this radical suggests that distortion must have occurred largely on the
O4 and the As atoms and can account for the angles between the gmax and Amax axes
(Table 5.2) and the Si–O4 bond. Similarly, the [AsO4]2- radical in (NH4)2HPO4,
which has more orthorhombic 75As hyperfine constants, has been reported to involve
a significant distortion and hence no correlation between principal g axes and the
P–O bond directions in the host lattice (Subramanian et al., 1977).
The large nuclear quadrupole effect exhibited by the [AsO4]2- radical in
hemimorphite (Table 5.2) has not been reported for this radical in the literature. The
nuclear quadrupole coupling tensor P, which is a sensitive measure of the electric
field gradients about the 75As nucleus, provides further evidence that the [AsO4]2-
radical in hemimorphite involves a localization of the unpaired spin on the O4 atom
and the location of the As atom in a symmetry plane.
141
This structural model for the [AsO4]2- radical in hemimorphite is further
supported by the observed 29Si and 1H superhyperfine structures (Figure 5.2b and c).
For example, the observed magnitude of 29Si superhyperfine splitting at ~1 mT
(Figure 5.2b) is similar to that reported for the well-established [AlO4]0 center in
quartz (Nuttall & Weil, 1981) and supports the presence of a nearest-neighbor Si
atom (Figure 5.1). Also, the O4 atom has two equivalent hydrogen atoms at ~3.5 Å
(Figure 5.1). On the basis of the dipole–dipole model (Mao et al., 2010), this
distance is consistent with the observed 1H superhyperfine splitting of ~0.3 mT
(Figure 5.2c).
The formation of the [AsO4]2- radical in CaWO4 has been attributed to hole
trapping by an [AsO4]3- ion substituting for the [WO4]
2- group (Edwards et al., 1968).
Our experiments show clearly that the [AsO4]2- radical in hemimorphite is induced
by irradiation as well. As mentioned above, however, a locally uncompensated
[AsO4]3- ion substituting for [SiO4]
4- is an electron trap and, therefore, is unlikely to
form the [AsO4]2- radical by itself. Also, the [AsO4]
2- radical in hemimorphite is
unlikely to be a Vk type center (i.e., hole trapping on an oxygen atom of an [AsO4]3-
ion next to a cation vacancy) for the following three reasons. First, the [AsO4]2-
radical has a nearestneighbor Si atom as indicated by the observed 29Si
superhy-perfine structure (Figure 5.2b). Second, a Zn vacancy results in the O1(x2),
O2 and O3 atoms with a dangling bond each and, therefore, can not explain the
apparent hole trap on the O4 atom. Third, Subramanian et al. (1977) and Murty et al.
(1977) reported Vk type centers [AsO4. . .PO4]5- in irradiated arsenate-doped

142
phosphates Na2HPO4•7H2O and KH2PO4, which have the unpaired spin shared by
the AsO4 and PO4 groups and are characterized by significantly different 75As
hyperfine constants.
A more plausible explanation for the formation of the [AsO4]2- radical in
hemimorphite involves an [AsO4]3- ion next to a monovalent cation substituting for
Zn2+. For example, ICPMS data suggest a coupled substitution of the type:
Cu+ + As5+ = Zn2+ + Si4+ ..........................................................................(5.2)
This substitution yields a neutral entity [CuO3(OH)][AsO4][SiO4], which may then
lead to hole trapping on the O4 atom during gamma-ray irradiation. In this type of
configurations, 63Cu (I = 3/2 and 69.2%) and 65Cu (I = 3/2 and 30.8%)
superhyperfine structures are expected to be small and thus unresolved in the
experimental EPR spectra. Alternatively, other unknown monovalent cations may be
responsible for the above substitution.
5.4.2 Factors affecting the incorporation of As in hemimorphite
Field observations (e.g., Takahashi, 1960; McPhail et al., 2004; Coppola et
al., 2008) have documented the formation of hemimorphite from the weathering of
Zn-bearing minerals. Thermodynamic calculations by McPhail et al. (2006), using
data determined from dissolution experiments at 50 and 80 °C, also predicted the
stability of hemimorphite at 25 °C in slightly acidic to alkaline solutions at quartz
saturation and dissolved Zn concentrations of 10-5 m (see also Takahashi, 1960).
Therefore, the failure of our synthesis experiments at ambient conditions is probably
143
due to the low solubility of quartz at room temperature (Rimstidt, 1997) or other
unknown kinetic factors. On the other hand, experiments at 200 °C and ~9.5 MPa
show that hemimorphite readily forms in a wide range of initial Zn:Si:As atomic
ratios and various initial pH values (Table 5.3).
Electron-microprobe results show that the As content in synthetic
hemimorphite correlates positively with the As/Si value in the starting materials
(Figure 5.8a). Results of Series II experiments show that the As content in
hemimorphite increases with the final pH value decreasing from 14 to 9 (Figure 5.8b;
Table 5.3). The results from Series III experiments are also consistent with this trend
but are not as obvious owing to the small range of final pH values from 12 to 14
(Figure 5.8b; Table 5.3). These results suggest that both As concentrations and pH
values exert significant controls on the incorporation of this element in
hemimorphite. However, caution must be exercised in the interpretation of these
data, because equilibrium is difficult to assess in these synthesis experiments.
5.4.3 Hemimorphite as a natural sink for As in Zn deposits and related
mine tailings
Mineral-based techniques for the immobilization and removal of arsenic in
surface environments, including mine tailings, can be divided into two types: (1)
sorption of As-species on the surfaces of minerals and (2) sequestration of As-species
in the crystal lattices of minerals. The latter includes both formation of relatively
insoluble arsenates (e.g., johnbaumite, Ca5(AsO4)3(OH), Bothe & Brown, 1999; Zhu

144
et al., 2006; scorodite, Fe(AsO4)•2H2O, Harvey et al., 2006; Bluteau & Demopoulos,
2007; beudantite, PbFe(AsO4)(SO4)(OH)6, Drahota & Filipi, 2009) and isomorphous
substitutions in common minerals (e.g., fluorapatite and hydroxylaptite,
Ca5(PO4)3(F,OH), Lee et al., 2009; calcite, CaCO3, Di Benedetto et al., 2006; pyrite,
FeS2, Blanchard et al., 2007; Lowers et al., 2007; gypsum, CaSiO4•2H2O,
Fernández-Martínez et al., 2008; jarosite, KFe(SO4)2(OH)6, Savage et al., 2005).
Our ICPMS results show that natural hemimorphite contains significant
amounts of As (Table 5.1). Moreover, our single-crystal EPR analyses show
accommodation of arsenate in the hemimorphite crystal lattice. These results are
supported further by data from hydrothermal syntheses. Therefore, hemimorphite
adds to the growing list of minerals as natural sinks for As. Moreover, the fact that
hemimorphite is a refractory mineral with limited solubility at low temperatures
(Takahashi, 1960; McPhail et al., 2006) makes it potentially important for
attenuating As in surface environments.
Particularly, hemimorphite is often a major ore mineral (up to 40 modal%) in
non-sulfide Zn deposits (Takahashi, 1960; Boni & Large, 2003; Hitzman et al., 2003;
Balassone et al., 2008; Coppola et al., 2008). Therefore, the shear volume of this
mineral makes it an important sink for As in these non-sulfide Zn deposits.
Moreover, many non-sulfide Zn deposits are known to have formed from primary
sulfide deposits via supergene processes (Hitzman et al., 2003; Balassone et al.,
2008; Coppola et al., 2008). It is well-known that various toxic elements including
As and Pb can be remobilized during weathering of sulfide orebodies (Takahashi,

145
1960; Courtin-Nomade et al., 2009 and references therein). Our results, together
with available thermodynamic data (Takahashi, 1960; McPhail et al., 2006), suggest
that hemimorphite plays an important role in sequestering As (and Pb; Table 5.1)
during supergene alteration of Zn sulfide orebodies, particularly under slightly
acidic to alkaline conditions.
In this context, the role of hemimorphite for sequestering As during the
formation of supergene non-sulfide Zn ores at Silvermines (Irish Midlands;
Balassone et al., 2008) can be evaluated as an example. The Zn–Pb–Ag deposits at
Silvermines contain both primary sulfide and supergene non-sulfide ores (Balassone
et al., 2008). Geochemical analyses by Balassone et al. (2008) showed that the As
content in two drill holes is nearly constant at ~200 ppm from primary sulfide to
non-sulfide ores. Therefore, As was probably not significantly remobilized during
the weathering of sulfides at Silvermines. Balassone et al. (2008) showed that
hemimorphite and smithsonite at Silvermines are the two dominant Zn-bearing
minerals and are approximately equal in abundance, with the former being more
abundant than the latter in the lower part of the non-sulfide orebody. If we take an
average grade of 10 wt% Zn (Balassone et al., 2008), the non-sulfide ores at
Silvermines then contain ~10 wt% hemimorphite and smithsonite each. On the basis
of the observed As contents in synthetic hemimorphite (i.e., ignoring possible effects
of temperature), it is apparent that hemimorphite can readily account for all As
contents in the non-sulfide ores and, therefore, most likely played an important role

146
in attenuating As during the weathering processes of the primary sulfide ores at
Silvermines.
Similarly, hemimorphite has been reported to occur in Zn mine tailings
(Walder & Chavez, 1995; Day & Bowell, 2005; Espiari et al., 2006; Schaider et al.,
2007; Cabala et al., 2009). Hemimorphite in Zn mine tailings may be classified into
two types on the basis of its origin: (1) “residual” from the flotation extraction of
sulfide ores and (2) neocrystallization in the tailings. In either case, incorporation of
As in the hemimorphite lattice attenuates its mobility and bioavailability. Similarly,
hemimorphite may play important roles in the transport and bioavailability of heavy
metals (Pb, Cu and Cd) in Zn mine tailings (Table 5.1; Schaider et al., 2007; Cabala et
al., 2009; Chen et al., 2009; Gallegos et al., 2009).
Moreover, the present recognition of arsenate in the hemimorphite lattice
potentially has more far-reaching implications for the applications of major silicates
(e.g., clay minerals and zeolites) for immobilization and removal of arsenic in
surface environments. The advantages of silicates over carbonates, phosphates or
sulfates, which themselves may pose adverse environmental impacts, include
availability of raw materials, large stability, and low solubility in aqueous solutions.
However, previous studies of clay minerals and zeolites for the immobilization and
removal of arsenic focused on surface sorption (e.g., Manning & Goldberg, 1996,
1997; Li et al., 2007; Ruggieri et al., 2008; Šiljeg et al., 2009). Obviously, lattice
incorporation in stable silicates is preferred over surface sorption for permanent
immobilization and removal of arsenic. Our confirmation of arsenate in the

147
zeolite-like hemimorphite lattice, together with stereochemical similarities between
the [AsO4]3- and [SiO4]
4- groups, suggests that zeolites are potential hosts of arsenate
in their crystal lattices. Interestingly, wide varieties of synthetic zincoarsenate and
other arsenate analogues of zeolites are known in the literature (e.g., Gier & Stucky,
1991; Bu et al., 1998; Jensen et al., 1998; Feng et al., 2001; Johnson et al., 2002).
Therefore, further research should be conducted to evaluate and develop silicate
zeolites for immobilization and removal of arsenate (and other arsenic species) in
their crystal lattices.
5.5 Conclusions
Single-crystal EPR spectra of gamma-ray-irradiated hemimorphite reveal the
presence of the [AsO4]4- and [AsO4]
2- radicals, formed from [AsO4]3- ions substituting
for [SiO4]4- during irradiation. These single-crystal EPR data, together with
compositions of natural and synthetic samples, demonstrate that hemimorphite is
capable of sequestering significant amounts of arsenate in its crystal lattice,
representing an important natural sink for As (and heavy metals) in supergene
non-sulfide Zn deposits and Zn mine tailings. Our results also raise the interesting
question whether other silicates are capable of sequestering arsenate (and other
arsenic species) in their lattices for effective immobilization and removal of arsenic in
surface environments.

148
5.6 References
BARCLAY G.A., & COX E.G. (1960) The structure of hemimorphite. Zeit. Kristal.
113, 23-29.
BALASSONE G., ROSSI M., BONI M., STANLEY G., & MCDERMOTT P. (2008)
Mineralogical and geochemical characterization of nonsulfide Zn–Pb mineralization
at Silvermines and Galmoy (Irish Midlands). Ore Geol. Rev. 33, 168-186.
BLANCHARD M., ALFREDSSON M., BRODHOLT J., WRIGHT K., & CATLOW C.R.A.
(2007) Arsenic incorporation into FeS2 pyrite and its influence on dissolution: A
DFT study. Geochim. Cosmochim. Acta 71, 624-630.
BLUTEAU M.-C., & DEMOPOULOS G.P. (2007) The incongruent dissolution of
scorodite − Solubility, kinetics and mechanism. Hydrometallurgy 87, 163-177.
BONI, M., & LARGE, D. (2003) Nonsulfide zinc mineralization in Europe: An
overview. Econ. Geol. 98, 715-729.
BOTHE J.V., & BROWN P.W. (1999) Arsenic immobilization by calcium arsenate
formation. Environ. Sci. Tech. 33, 3806-3811.
BOTIS S. M. & PAN Y. (2009) First-principles calculations on the [AlO4/M+]0 (M = H,
Li, Na, K) defects in quartz and crystal-chemical controls on the uptake of Al.
Mineral. Mag. 73, 537–550.
BREUER K., TELES J.H., DEMUTH D., HIBST H., SCHÄFER A., BRODE S., &
DOMGÖRGEN H. (1999) Zinc silicates: Very efficient heterogeneous catalysts for the
addition of primary alcohols to alkynes and allenes. Angew. Chem. Intern. Ed. 38,
1401-1405.
149
BU X., FENG P., GIER T.E., & STUCKY G.D. (1998) Two ethylenediamine-templated
zeolite-type structures in zinc arsenate and cobalt phosphate systems. J. Solid State
Chem. 136, 210-215.
CABALA J., KRUPA P., & MISZ-KENNAN M. (2009) Heavy metals in mycorrhizal
rhizospheres contaminated by Zn-Pb mining and smelting around Olkusz in southern
Poland. Water Air Soil Pollution 199, 139-149.
CATILLON-MUCHERIE S., AMMARI F., KRAFFT J-M., LAURON-PERNOT H., TOUROUDE
R., & LOUIS C. (2007) Preparation of coimpregnated Cu−Zn/SiO2 catalysts:
Influence of the drying step on metallic particle size and on Cu0−ZnII interactions. J.
Phys. Chem. C 111, 11619–11626.
CHEN A., ZHAO Z., JIA X., LONG S., HUO G., & CHEN X. (2009): Alkaline leaching
Zn and its concomitant metals from refractory hemimorphite zinc oxide ore.
Hydrometallurgy 97, 228-232.
COOPER B.J., GIBBS G.V., & ROSS F.K. (1981) The effects of heating and
dehydration on the crystal structure of hemimorphite up to 600 °C. Zeit. Kristal. 156,
305–321.
COPPOLA V., BONI M., GILG H.A., BALASSONE G., & DEJONGHE L. (2008) The
“calamine” nonsulfide Zn-Pb deposits of Belgium: Petrographical, mineralogical
and geochemical characterization. Ore Geol. Rev. 33, 187-210.
COURTIN-NOMADE A., GROSBOIS C., MARCUS M.A., FAKRA S.C., BENY J.-M., &
FOSTER A.L. (2009) The weathering of a sulfide orebody: Speciation and fate of
some potential contaminants. Canad. Mineral. 47, 493-508.

150
DACHS E. & GEIGER C. A. (2009) Heat-capacity behaviour of hemimorphite,
Zn4Si2O7(OH)2•H2O, and its dehydrated analogue Zn4Si2O7(OH)2: a calorimetric
and thermodynamic investigation of their phase transitions. Eur. J. Mineral. 21,
971–988.
DALAL N.S., DICKSON J.R., & MCDOWELL C.A. (1972) Electron paramagnetic
resonance studies of X-irradiated KH2AsO4, KD2AsO4, Rb H2AsO4, Rb D2AsO4, Cs
H2AsO4, NH4H2AsO4, and ND4D2AsO4 (ferroelectrics and antiferroelectrics). J.
Chem. Phys. 57, 4254-4265.
DALAL N.S., HEBDEN J.A., KENNEDY D.E., & MCDOWELL C.A. (1977) An EPR and
ENDOR study of the low frequency fluctuations and cluster formation in the
hydrogen bonded ferroelectrics KH2PO4 and KD2PO4and the antiferroelectrics
NH4H2PO4, and ND4D2PO4. J. Chem. Phys. 66, 4425-4432.
DAY S.J., & BOWELL R.J. (2005) Atypical and typical zinc geochemistry in a
carbonate setting, Sä Dena Hes Mine, Yukon Territory, Canada. Geochem. Explor.
Environ. Analysis 5, 255-266.
DI BENEDETTO F., COSTAGLIOLA P., BENVENUTI M., LATTANZI P., ROMANELLI M., &
TANELLI G. (2006) Arsenic incorporation in natural calcite lattice: Evidence from
electron spin echo spectroscopy. Earth Planet. Sci. Lett. 246, 458–465.
DRAHOTA P. & FILIPI M. (2009) Secondary arsenic minerals in the environment: a
review. Environ. Int. 35, 1243–1255.
EDWARDS P.R., SUBRAMANIAN S., & SYMONS M.C.R. (1968) Electron spin
resonance studies of vanadate, niobate, phosphate, and arsenate in γ-irradiated
calcium molybedate and calcium tungstate. Chem. Commun. 799.

151
ESPIARI S., RASHCHI F., & SADRNEZHAAD S.K. (2006) Hydrometallurgical treatment
of tailings with high zinc content. Hydrometallurgy 82, 54-62.
FENG P., ZHANG T., & BU X. (2001) Arsenate zeolite analogues with 11 topological
types. J. Amer. Chem. Soc. 123, 8608-8609.
FERNÁNDEZ-MARTÍNEZ A., CHARLET L., CUELLO G.J., JOHNSON M.R., ROMAN-ROSS
G., BARDELLI F., & TURRILLAS X. (2008) Arsenate incorporation in gypsum probed
by neutron, X-ray scattering and DFT modeling. J. Phys. Chem. A112, 5159-5166.
FOSTER A.L., BROWN G.E., TINGLE T.N., & PARKS G.A. (1998) Quantitative arsenic
speciation in mine tailings using X-ray absorption spectroscopy. Amer. Mineral. 83,
553-568.
FROST R.L., BOUZAID J.M., & REDDY B.J. (2007) Vibrational spectroscopy of the
sorosilicate mineral hemimorphite Zn4(OH)2Si2O7.H2O. Polyhedron 26, 2405-2412.
GALLEGOS E.A., CANO N.F., WATANABA S., & CHUBACI J.D.F. (2009)
Thermoluminescence, infrared reflectivity and electron paramagnetic resonance
properties of hemimorphite. Rad. Measur. 44, 11-17.
GEIGER C.A., & DACHS E. (2009) Quasi-ice-like Cp behavior of molecular H2O in
hemimorphite Zn4Si2O7(OH)2. H2O: Cp and entropy confined H2O in microporous
silicates. Amer. Mineral. 94, 634-637.
GIER T.E., & STUCKY G.D. (1991) Low-temperature synthesis of hydrated
zinco(beryllo)-phospahte and arsenate molecular sieves. Nature 349, 508-510.

152
HARVEY M.C., SCHREIBER M.E., RIMSTIDT J.D., & GRIFFITH M.M. (2006) Scorodite
dissolution kinetics: Implications for arsenic release. Environ. Sci. Tech. 40,
6709-6714.
HILL R.J., GIBBS G.V., CRAIG J.R., ROSS F.K., & WILLIAMS J.M. (1977) A neutron
diffraction study of hemimorphite. Zeit. Kristal. 146, 241–259.
HITZMAN M.W., REYNOLDS N.A., SANGSTER D.F., ALLEN C.R., & CARMAN C.E.
(2003) Classification, Genesis, and Exploration Guides for Nonsulfide Zinc
Deposits. Econ. Geol. 98, 685-714.
JENSEN T.R., NORBY P., NØRLUND CHRISTENSEN A., & HANSON J.C. (1998)
Hydrothermal synthesis, crystal structure refinement and thermal transformation of
LiZnAsO4·H2O. Micropor. Mesopor. Materials 26, 77-87.
JOHNSON C.D., MACPHEE D.E., & FELDMANN J. (2002) New low temperature
synthetic route to an ammonium zinc arsenate zeolite analogue with an ABW-type
structure. Inorg. Chem. 41, 3588-3589.
KOLESOV B. (2006) Raman investigation of H2O molecule and hydroxyl groups in
the channels of hemimorphite. Amer. Mineral. 91, 1355–1362.
LEE Y.J., STEPHENS P.W., TANG Y., LI W., PHILLIPS B.L., PARISE J.B. & REEDER R.J.
(2009) Arsenate substitution in hydroxylapatite: Structural characterization of the
Ca5(PxAs1–xO4)3OH solid solution. Amer. Mineral. 94, 666-675.
LI Z., BEACHNER R., MCMANAMA Z., & HONG H. (2007) Sorption of arsenic by
surfactant-modified zeolite and kaolinite. Micropor. Mesopor. Materials 105,
291-297.

153
LIBOWITZKY E., KOHLER T., ARMBRUSTER, T., & ROSSMAN G.R. (1997) Proton
disorder in dehydrated hemimorphite. IR spectroscopy and x-ray structure
refinement at low and ambient temperatures. Eur. J. Mineral. 9, 803-810.
LIBOWITZKY E., & ROSSMAN G.R. (1997) IR spectroscopy of hemimorphite between
82 and 373 K and optical evidence for a low-temperature phase transition. Eur. J.
Mineral. 9, 793-802.
LIBOWITZKY E., SCHULTZ A.J., & YOUNG D.M. (1998) The low-temperature
structure and phase transition of hemimorphite, Zn4Si2O7(OH)2•H2O. Zeit. Kristal.
213, 659-668.
LOWERS H.A., BREIT G.N., FOSTER A.L., WHITNEY J.W., YOUNT J.C., UDDIN M. N.,
& MUNEEM A.A. (2007) Arsenic incorporation into authigenic pyrite, Bengal Basin
sediment, Bangaldesh. Geochim. Cosmochim. Acta 71, 2699-2717.
MAO M., & PAN, Y. (2009) Radiation-induced defects in apophyllites. I. The NH2
free radical in fluorapophyllite. Eur. J. Mineral. 21, 317-324.
MAO M., NILGES M.J., & PAN Y. (2010) Radiation-induced defects in apophyllites.
II An O− center and related O−−O− pairs in hydroxylapophyllite. Eur. J. Mineral. 22,
89-102.
MANNING B.A., & GOLDBERG S. (1996) Modeling arsenate competitive sorption on
kaolinite, montmorillonite and illite. Clays Clay Minerals 44, 609-623.
MANNING B.A., & GOLDBERG S. (1997) Adsorption and stability of arsenic(III) at
the clay mineral-water interface. Environ. Sci. Tech. 31, 2005-2011.
154
MCDONALD W.S., & CRUICKSHANK D.W.J. (1967) Refinement of the structure of
hemimorphite. Zeit. Kristal.124, 180-191.
MCPHAIL D.C., SUMMERHAYES E., JAYARATNE V., & CHRISTY A. (2006)
Hemimorphite solubility and stability of low-T zinc minerals. Geochim. Cosmochim.
Acta 70, A414.
MCPHAIL D. C., SUMMERHAYES E., WELCH S. & BRUGGER J. (2004) The
geochemistry and mobility of zinc in the regolith. In Advances in Regolith. CRC
LEME, Canberra, pp. 287–291.
MOMBOURQUETTE M. J., WEIL J. A. & MCGAVIN D. G. (1996) EPR–NMR User’s
Manual. Department of Chemistry, University of Saskatchewan, Saskatoon,
Saskatchewan, Canada.
MURTY P.N., MURTY C.R.K., & SUBRAMANIAN S. (1977) Electron paramagnetic
resonance study of X-irradiated arsenate-doped phosphate: KH2AsO4/KH2PO4. Phys.
Stat. Sol. A39, 675-682.
NRIAGU J. O. (1994) Arsenic in the Environment. Part I: Cycling and
Characterization; Wiley Series in Advances in Environmental Science and
Technology, 26.
NUTTALL R. H. D. & WEIL J. A. (1981) The magnetic properties of the oxygen-hole
aluminum centers in crystalline SiO2, I. [AlO4]0. Canad. J. Phys. 59, 1696–1708.
PAN Y., MAO M., & LIN J. (2009) Single-crystal EPR study of Fe3+ and VO2+ in
prehnite from the Jeffrey mine, Asbestos, Quebec. Canad. Mineral. 47, 933-945.

155
RAE A. D. (1969) Relationship between the experimental Hamiltonian and the point
symmetry of a paramagnetic species in a crystal. J. Chem. Phys. 50, 2672–2685.
RIMSTIDT J. D. (1997) Quartz solubility at low temperatures. Geochim. Cosmochim.
Acta, 61, 2553–2558.
RUGGIERI F., MARÍN V., GIMENO D., FERNANDEZ-TURIEL J.L., GARCÍA-VALLES M.,
& GUTIERREZ L. (2008) Application of zeolitic volcanic rocks for arsenic removal
from water. Engineering Geol. 101, 245-250.
SAVAGE K. S., BIRD D. K. & O’DAY P. A. (2005) Arsenic speciation in synthetic
jarosite. Chem. Geol. 215, 473–498.
SCHAIDER L.A., SENN D.B., BRABANDER D.J., MCCARTHY K.D., & SHINE J.P. (2007)
Characterization of zinc, lead, and cadmium mine waste: Implications for transport,
exposure and bioavailability. Environ. Sci. Tech. 41, 4164-4171.
ŠILJEG M., CERJAN STEFANOVIĆ Š., MAZAJ M., NOVAK TUŠAR N., ARČON I., KOVAČ
J., MARGETA K., KAUČIČ V., & ZABUKOVEC LOGAR N. (2009) Structure
investigation of As(III)- and As(V)-species bound to Fe-modified clinoptilolite tuffs.
Micropor. Mesopor. Materials 118, 408-415.
SUBRAMANIAN S., MURTY P.N., & MURTY C.R.K. (1977) Epr studies of some
arsenic and phosphorus oxyradicals. J. Phys. Chem. Solids 38, 825-829.
TAKAHASHI T. (1960) Supergene alteration of zinc and lead deposits in limestone.
Econ. Geol. 55, 1083-1115.

156
TAKEUCHI, Y., SASAKI, S., JISWIG, W. & FUESS, H. (1978): X-ray and neutron
diffraction study of hemimorphite. Proceedings of Japan Acad. 54(Series B),
577-582.
VASSILIKOU-DOVA A.B., & EFTAXIAS K. (1991) Electron spin resonance of Mn2+ in
hemimorphite. Crystal Res. Tech. 27, 117-120.
WALDER I.F., & CHAVEZ W.X. JR. (1995) Mineralogical and geochemical behavior
of mill tailing material produced from lead-zinc skarn mineralization, Hanover,
Grant County, New Mexico, USA. Environ. Geol. 26, 1-18.
WALKER S.R., PARSONS M.B., JAMIESON H.E., & LANZIROTTI A. (2009) Arsenic
mineralogy of near-surface tailings and soils: influences on arsenic mobility and
bioaccessibility in the Nova Scotia gold mining districts. Canad. Mineral. 47,
533-556.
WEIL J. A. & BOLTON J. R. (2007) Electron Paramagnetic Resonance: Elementary
Theory and Practical Applications. John Wiley & Sons, New York.
YURIEVA T.M., KUSTOVA G.N., MINYUKOVA T.P., POELS E.K., BLIEK A.,
DEMESHKINA M.P., PLYASOVA L.M., KRIEGER T.K., & ZAIKOVSKII V.I. (2001)
Non-hydrothermal synthesis of copper-, zinc- and copper-zinc hydrosilicates.
Material Res. Innov. 5, 3-11.
ZHU Y.N., ZHANG X.H., XIE Q.L., WANG D.Q., & CHENG G W. (2006) Solubility
and stability of calcium arsenates at 25°C. Water, Air and Soil Pollution 169,
221-238.

157
Chapter 6
Nature of heavy metals in hemimorphite: A cation-exchange and
single-crystal EPR study
Hemimorphite, a zeolite-like mineral commonly present in supergene
non-sulfide Zn deposits and Zn mine tailings, is known to contain elevated contents
of As, Cd, Cu and Pb. Cation-exchange experiments of a natural hemimorphite
(Mapimi, Durango, Mexico) with 0.1 M CaCl2 solution at 110 °C show that As and
Cu are retained, whereas Cd and Pb are readily exchanged. The retention of As is
consistent with previous single-crystal electron paramagnetic resonance (EPR)
results that showed its occurrence as the substitutional As5+ ion at the Si site.
Single-crystal EPR spectra of hemimorphite from the M’Fouati Pb-Zn mine
(Reneville, Congo), measured at 120 K and 295 K, show a Cu2+ center. The best-fit
spin Hamiltonian parameters g, A(63Cu), P (63Cu) and A(1H) of this center at 120 K
demonstrate that Cu2+ resides at the tetrahedral Zn site, not in the channels as
suggested by a previous powder EPR study. Cadmium and Pb in hemimorphite are
probably present in the channels; this would account for their contrasting behavior
from As and Cu during the cation-exchange experiments. However, single-crystal
EPR spectra of ten samples of hemimorphite, including those after gamma-ray

158
irradiation for doses up to 55 kGy, from various Pb-Zn deposits did not detect any
paramagnetic Cd or Pb centers.

159
6.1 Introduction
Hemimorphite, ideally Zn4Si2O7(OH)2•H2O, is a stable mineral in surface
environments and occurs commonly in supergene non-sulfide Zn deposits and Zn
mine tailings (Takahashi 1960, Boni & Large 2003; Coppola et al. 2008).
Hemimorphite has attracted a large number of studies for its catalytic applications
(Breuer et al. 1999; Yurieva et al. 2001; Catillon-Mucherie et al. 2007) and other
interesting properties associated with its zeolite-like structure containing confined
H2O molecules in the channels (Libowitzky & Rossman, 1997; Libowitzky et al. 1997,
1998; Kolesov 2006; Frost et al. 2007; Geiger & Dachs 2009; Dachs & Geiger 2009;
Cano et al. 2009; Bissengaliyeva et al. 2010; Seryotkin & Bakakin 2011). Another
source of interest stems from the recognition of hemimorphite as a sink for As and
heavy metals (Cd, Cu and Pb) in mine tailings and soils surrounding smelters (Walder
& Chavez 1995; Day & Bowell 2005; Espiari et al. 2006; Schaider et al. 2007; Cabala
et al. 2009; Mao et al. 2010).
Mao et al. (2010) reported that a suite of 10 samples of hemimorphite from
Zn-Pb-Cu deposits contains 6 to 338 ppm As, <0.11 to 39 ppm Cd, 357 to 1200 ppm
Cu and 1.9 to 1280 ppm Pb, whereas synthetic hemimorphite can contain up to 2.5
wt% As2O5. Single-crystal electron paramagnetic resonance (EPR) spectra of
gamma-ray-irradiated hemimorphite revealed the presence of two arsenic-associated
oxygen radicals [AsO4]4− and [AsO4]
2−, derived from substitutional [AsO4]3− groups at
the Si site, and provided unambiguous evidence for the sequestration of arsenate in its
structure. Similarly, using powder EPR data, Gallegos et al. (2009) reported

160
paramagnetic Cu2+ and Pb3+ ions in natural and gamma-ray-irradiated hemimorphite,
respectively, and interpreted them to reside at interstitial sites in the crystal structure
on the basis of their ionic radii.
Figure 6.1 Crystal structure of hemimorphite projected to the (001) plane (data from
Hill et al. 1977).
In the present study, we follow upon our previous EPR study of As (Mao et al.
2010) and investigate Cu, Cd and Pb in hemimorphite by use of combined
cation-exchange and single-crystal EPR experiments. Specifically, cation-exchange
experiments were intended to test whether Cu, Cd and Pb reside at the channel sites,
as proposed by Gallegos et al. (2009). Single-crystal EPR measurements were made
for identification and quantitative analysis of paramagnetic Cu, Cd and Pb centers
(Gallegos et al. 2009). These data are then compared to provide new insights into the
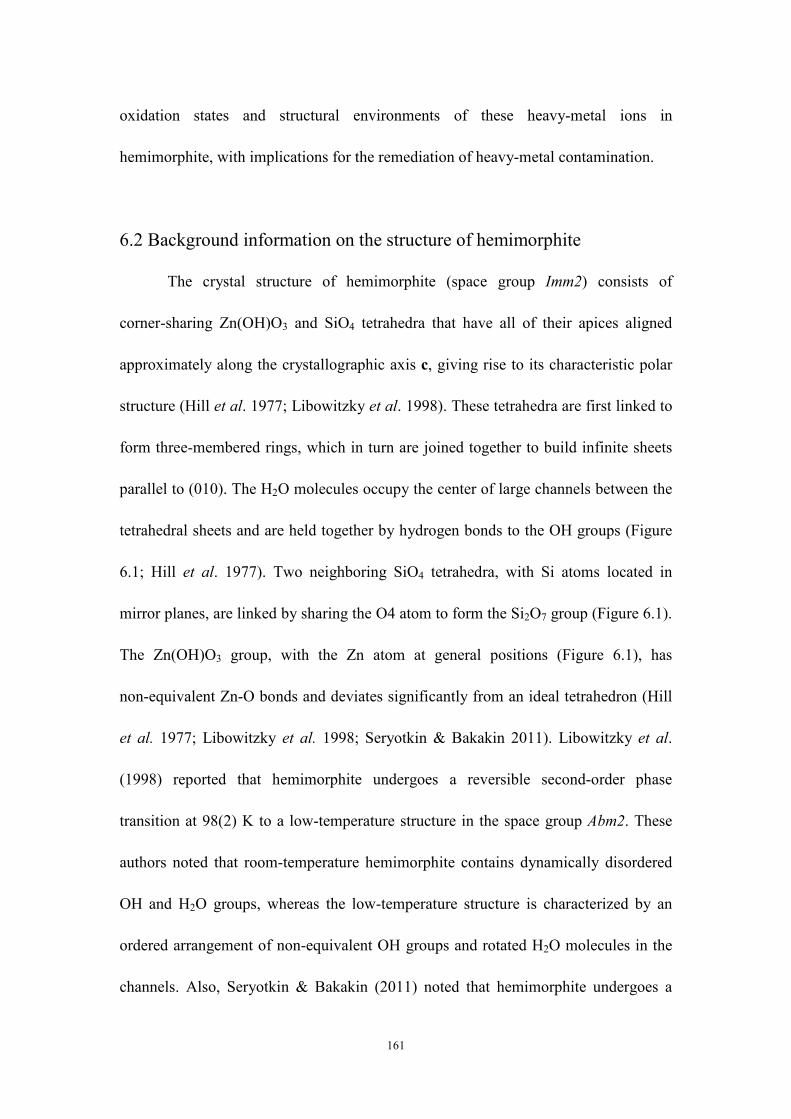
161
oxidation states and structural environments of these heavy-metal ions in
hemimorphite, with implications for the remediation of heavy-metal contamination.
6.2 Background information on the structure of hemimorphite
The crystal structure of hemimorphite (space group Imm2) consists of
corner-sharing Zn(OH)O3 and SiO4 tetrahedra that have all of their apices aligned
approximately along the crystallographic axis c, giving rise to its characteristic polar
structure (Hill et al. 1977; Libowitzky et al. 1998). These tetrahedra are first linked to
form three-membered rings, which in turn are joined together to build infinite sheets
parallel to (010). The H2O molecules occupy the center of large channels between the
tetrahedral sheets and are held together by hydrogen bonds to the OH groups (Figure
6.1; Hill et al. 1977). Two neighboring SiO4 tetrahedra, with Si atoms located in
mirror planes, are linked by sharing the O4 atom to form the Si2O7 group (Figure 6.1).
The Zn(OH)O3 group, with the Zn atom at general positions (Figure 6.1), has
non-equivalent Zn-O bonds and deviates significantly from an ideal tetrahedron (Hill
et al. 1977; Libowitzky et al. 1998; Seryotkin & Bakakin 2011). Libowitzky et al.
(1998) reported that hemimorphite undergoes a reversible second-order phase
transition at 98(2) K to a low-temperature structure in the space group Abm2. These
authors noted that room-temperature hemimorphite contains dynamically disordered
OH and H2O groups, whereas the low-temperature structure is characterized by an
ordered arrangement of non-equivalent OH groups and rotated H2O molecules in the
channels. Also, Seryotkin & Bakakin (2011) noted that hemimorphite undergoes a
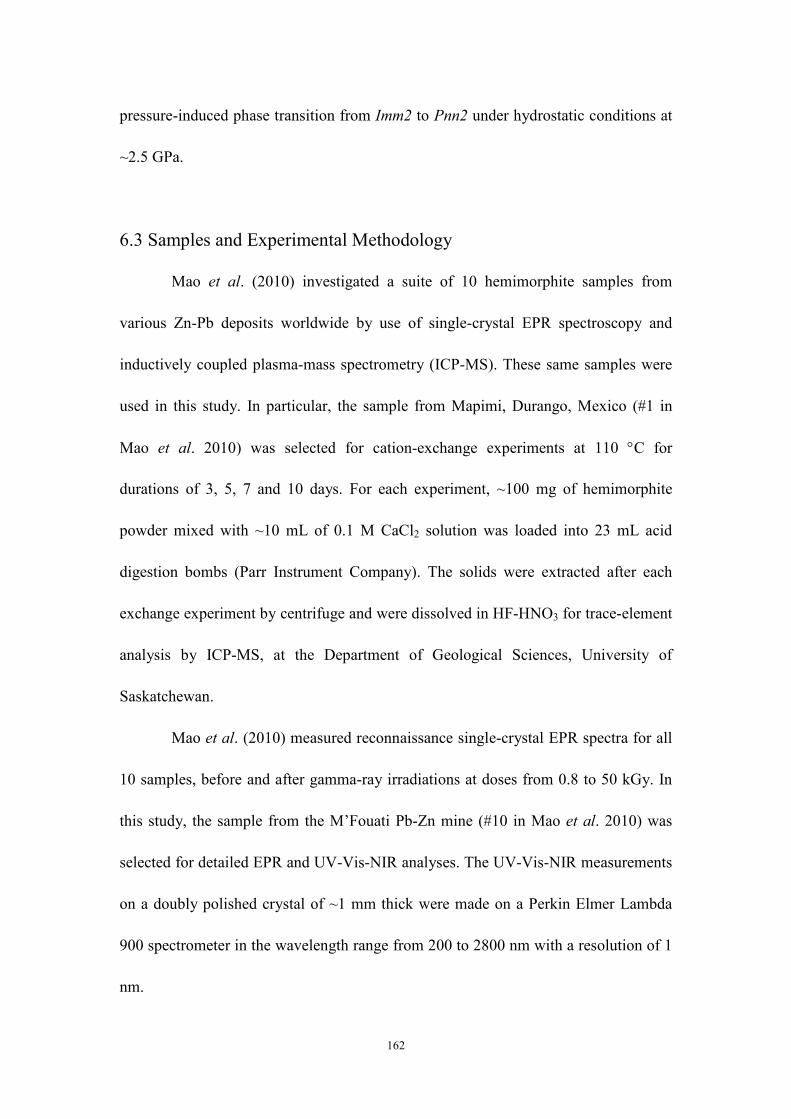
162
pressure-induced phase transition from Imm2 to Pnn2 under hydrostatic conditions at
~2.5 GPa.
6.3 Samples and Experimental Methodology
Mao et al. (2010) investigated a suite of 10 hemimorphite samples from
various Zn-Pb deposits worldwide by use of single-crystal EPR spectroscopy and
inductively coupled plasma-mass spectrometry (ICP-MS). These same samples were
used in this study. In particular, the sample from Mapimi, Durango, Mexico (#1 in
Mao et al. 2010) was selected for cation-exchange experiments at 110 °C for
durations of 3, 5, 7 and 10 days. For each experiment, ~100 mg of hemimorphite
powder mixed with ~10 mL of 0.1 M CaCl2 solution was loaded into 23 mL acid
digestion bombs (Parr Instrument Company). The solids were extracted after each
exchange experiment by centrifuge and were dissolved in HF-HNO3 for trace-element
analysis by ICP-MS, at the Department of Geological Sciences, University of
Saskatchewan.
Mao et al. (2010) measured reconnaissance single-crystal EPR spectra for all
10 samples, before and after gamma-ray irradiations at doses from 0.8 to 50 kGy. In
this study, the sample from the M’Fouati Pb-Zn mine (#10 in Mao et al. 2010) was
selected for detailed EPR and UV-Vis-NIR analyses. The UV-Vis-NIR measurements
on a doubly polished crystal of ~1 mm thick were made on a Perkin Elmer Lambda
900 spectrometer in the wavelength range from 200 to 2800 nm with a resolution of 1
nm.

163
All EPR spectra were collected on a Bruker EMX spectrometer at the
Saskatchewan Structure Sciences Centre, which is equipped with an automatic
microwave bridge controller, a high-sensitivity ER-4119 cavity, and an ER-218G1
goniometer with a precision of 0.2º. Detailed spectral measurements at 295 K of an
as-is crystal from M’Fouati were made in three rotational planes parallel to the (010),
(100) and (001) faces at an interval of every 5°. Spectral measurements of this crystal
at 120 K and microwave frequencies of ~9.389 GHz were made in the same three
rotational planes, except that the interval in the plane parallel to the (001) face was
increased to 10° or 15°. Other experimental parameters included a modulation
frequency of 100 kHz, a modulation amplitude of 0.09 mT, a microwave power of 20
mW, and spectral resolutions from 0.0244 mT (i.e., 2,048 data points over 50 mT) to
~0.039 mT (2,048 data points over 80 mT ). Magnetic field calibration was made by
using α,γ-bis-diphenylene-β-phenyl allyl (BDPA) in benzene as a standard (g =
2.0027).
6.4 Results
6.4.1 Cation-exchange experiments and UV-Vis-NIR spectrum
The salient feature of the cation-exchange experiments is that the contents of
As and Cu in the exchanged hemimorphite are not reduced relative to those in the
original sample, where the progressive increase in Cu with time may represent an
uptake of this element from the impurity of CaCl2 solution (Table 6.1). However, Cd
is completely exchanged after three days (Table 6.1). The increased Pb contents in

164
experiments 1-3 and 5 may represent either a heterogeneous distribution of Pb or an
analytical problem with this element. The Pb contents in experiments 1-7 and 10 are
notably lower than that in the original sample (Table 6.1).
Figure 6.2 UV-Vis-NIR spectrum of hemimorphite from the M’Fouati Pb-Zn mine.
Table 6.1 Heavy metals in hemimorphite after exchange experiments Runs As (ppm) Cu (ppm) Cd (ppm) Pb (ppm)
#1* 269(271) 357(351) 26(26) 1.9(2.0)
#1−3 276 380 nd 4.20
#1−5 268 413 0.18 8.63
#1−7 265 426 0.05 1.40
#1−10 270 445 nd 0.58
Solution 0.09 0.04 nd nd
* duplicate analyses of Sample #1 in Mao et al. (2010);
Runs #1−3, 5, 7 and 10 are for 3, 5, 7 and 10 days, respectively;
Solution is the 0.1 M CaCl2 solution; nd, not detectable.
The UV-Vis-NIR spectrum of hemimorphite from the M’Fouati Pb-Zn mine
shows two strong absorptions around 1400 nm and 1900 nm and two weak

165
absorptions at 940 nm and 1126 nm, which have been assigned to various
combinations of bending and stretching vibration (v2+v3), (v1+v3) and (v1+v2+v3),
(v1+2v2+v3) of the H2O molecule (Libowitzky & Rossman, 1997; Gallegos et al.
2009). Two additional weak peaks at 796 nm and 850 nm (Figure 6.2) are probably
attributable to Cu2+ (see below).
6.4.2 Single-crystal EPR spectra
Previous EPR studies (Vassilikou-Dova & Eftaxias 1991; Gallegos et al. 2009;
Mao et al. 2010) reported the presence of Cu2+, Fe3+, E', Mn2+, [AsO4]4-, [AsO4]
2-, and
Pb3+ centers in hemimorphite. Our reconnaissance EPR measurements of both as-is
and gamma-ray-irradiated hemimorphite from the 10 samples confirmed the common
presence of the Fe3+, Mn2+, Cu2+, [AsO4]4-, [AsO4]
2- and several unknown centers (see
also Gallegos et al. 2009). However, paramagnetic Cd and Pb centers were not found
in samples examined in this study. Interestingly, our EPR spectra of a sample labeled
as “hemimorphite from Bleiberg, Austria” contain well-resolved Cd+, Pb3+ and Zn+
centers (Popescu & Grecu 1973, 1975; Nistor et al. 1994, 1995). However, powder
X-ray diffraction analysis shows this sample to be “botryoidal” calcite. The
well-resolved Cu2+ EPR spectra measured on the sample from M’Fouati (Figure 6.3)
are described herein.
The 295 K spectra of the S=1/2 Cu2+ center in the as-is hemimorphite crystal
from M’Fouati, measured with the magnetic field B parallel to a crystallographic axis
(Figure 6.3a), consist of a quartet (i.e. four lines of approximately equal intensity and

166
equal distance), corresponding to the characteristic 63Cu hyperfine structure (I = 3/2,
natural isotope abundance of 69.15% and gn = 1.4849). The Cu2+ spectra, as B is
rotated away from crystallographic axes, are resolved into four magnetically
nonequivalent sites, indicative of its location at a general position in hemimorphite. At
some crystal orientations, the hyperfine structure arising from the less abundant 65Cu
isotope (I = 3/2, natural isotope abundance of 30.85% and gn = 1.5877) is resolved
from the 63Cu hyperfine structure in two of the four sites. Also, additional quartets of
lower intensities are present and are attributable to the same Cu2+ center (see below).
The average linewidths of the Cu2+ center in the 295 K spectra is ~0.59 mT.
Gamma-ray irradiations with doses up to 50 kGy do not affect the intensity or the line
position of the Cu2+ center.
Figure 6.3 Representative single-crystal EPR spectra of as-is hemimorphite from the
M’Fouati Pb-Zn mine: a) B//c and 295 K; and b) B^a = 37.5° and 120 K illustrating
four magnetically non-equivalent sites of the Cu2+ center, where the short and long
ticks mark the 63Cu and 65Cu hyperfine lines, respectively. Note that the 63Cu
hyperfine lines at sites 1 and 3 are further split into two of approximately intensities.
Also, solid circles mark additional lines belonging to the Cu2+ center in a small

167
fragment or domains.
The 120 K EPR spectra of the Cu2+ center have the average linewidth reduced
to ~0.31 mT, resulting in better resolution of the 63Cu and 65Cu hyperfine structures
(Figure 6.3b). In particular, individual lines of the 63Cu and 65Cu hyperfine structures
at some orientations are further resolved into doublets with separations up to ~0.4 mT
(Figure 6.3b), suggesting a superhyperfine interaction with a next-nearest-neighbor
hydrogen nucleus (see below). Also, the weak set of quartets is now better resolved
than its counterpart in the 295 K spectra. Spectral simulations confirm that the weak
set of quartets represents the same Cu2+ center and arises from a small fragment (or
domains) related to the host by a rotation of ~3° about the axis c. Attempts to
physically remove the small fragment or domains were not successful. In any case,
these weak lines are readily distinguishable in most spectra and, therefore, do not
adversely affect our analysis of the Cu2+ center.
6.4.3 Spin Hamiltonian parameters of Cu2+
The general spin Hamiltonian of the S=1/2 Cu2+ center, with the 63Cu and
65Cu hyperfine structures and the 1H hyperfine structure (Figure 6.3), can be written
as:
H = βeBTgS + ∑(IT
AiS + ITPiI – βnB
TgniI) .........................................(6.1)
where βe and βn are the electronic (Bohr) and nuclear magneton, respectively. Iterative
fittings for matrices g, A and P, using the software package EPR–NMR (Brown et al.
2003), were made for data from both the 295 K and 120 K spectra, in a coordination

168
system with its axes X, Y and Z along the crystallographic axes a, b and c,
respectively. Fittings for data from the 295 K spectra included g and A(63Cu) only,
because the 65Cu hyperfine structure and the 1H superhyperfine structure are generally
not resolved at this temperature (Figure 6.3a). The total number of line-position
datapoints from three rotation planes was 1367, which is reduced to 1301 after those
points from the crossover regions were assigned a weighing factor of 0.5. The final
value of the root-mean-squares of weighted differences (RMSD) between the
calculated and observed line-positions is 0.572 mT (Table 6.2), which is
approximately equal to the average linewidth. The calculated normals of the three
rotation planes in the (001) face, the (100) face and the {010} cleavage are (1.7º, 0.6º),
(83.5º, 358.1º), and (92.0º, 89.4º), respectively, indicating small misalignments from
the ideal directions of (0º, 0º), (90º, 0º), and (90º, 90º).
Figure 6.4. Line-position datapoints of the Cu2+ center in hemimorphite as a function
of rotation angles (i.e., roadmaps) at 120 K: (a) the (010) face and ν = 9.399 GHz and
(b) the (100) face and ν = 9.392 GHz. Solid circles represent experimental data points,
and solid lines are calculated from the best-fit spin Hamiltonian parameters in Table
6.2.
169
Initial fittings for data from the 120 K spectra included matrices g, A(63Cu)
and P(63Cu). Matrices A(65Cu) and P(65Cu) were assumed to be proportional to
A(63Cu) and P(63Cu) according to the gn values. This assumption has been confirmed
to be valid, because spectral simulations using the assumed A(65Cu) and P(65Cu)
reproduce the observed 65Cu hyperfine structure well (Figure 6.3b). The total number
of line-position datapoints for the 63Cu hyperfine structure was 1391, which is reduced
to 1281 after those from crossover regions were assigned a weighing factor of 0.5
each. The final RMSD value is 0.124 mT (Table 6.2), which is smaller than half of the
average linewidth. The calculated normals of the three rotation planes are (5.5º,
359.9º), (78.8º, 358.2º), and (95.5º, 93.6º), again showing notable misalignments in
the crystal. Figure 6.4 demonstrates that the calculated and observed roadmaps at 120
K are in excellent agreement. Further support for the best-fitted spin Hamiltonian
parameters comes from agreement between experimental and simulated powder EPR
spectra (Figure 6.5).
The best-fit matrices g and A(63Cu) from the 295 K and 120 K spectra are
similar (Table 6.2). Therefore, only those from the 120 K spectra will be considered
here. g is approximately axial in symmetry and has its principal values similar to other
Cu2+ centers (Sharnoff 1965; Kuska et al. 1967; Parker 1971; Cozar & Ardelean 1987;
Cozar et al. 1999; Biyik et al. 2007). However, A(63Cu) and P(63Cu) are highly
rhombic in symmetry (Table 6.2). The most salient feature is that the orientations of
gmax, Amax and Pmax at (θ=128.0º, φ=243.1º), (130.8º, 248.3º) and (133º, 248º),
respectively, are almost co-axial and are approximately along the direction of the

170
O1a−Zn−O1b bisector (123°, 236°) in the ZnO4 pseudotetrahedron (Figure 6.6).
Similarly, the orientations of gint, Amin and Pint at (65.8º, 173.8º), (67.4º, 179.4º) and
(69º, 180º) are close to the directions of the O1a−Zn−O3 and the O1b−Zn−O2
bisectors (Figure 6.6). Likewise, the orientations of gmin, Aint and Pmin at (47.8º,
287.9º), (49.3º, 290.3º) and (50º, 288º) match approximately the directions of the
O1a−Zn−O2 and O1b−Zn−O3 bisectors (Figure 6.6).
Table 6.2 Spin Hamiltonian parameters of the Cu2+ center in hemimorphite Principal direction RMSD
Matrix Y k Principal value (Yk)
θk (˚) φk (˚) (mT)
295 K
2.01210(3) 0.0845(2) 0.0629(2) 1 2.4008(3) 52.5(2) 63.7(2)
2.2285(3) 0.1523(3) 2 2.0835(3) 65.6(3) 174.0(3)
g
2.1867(2) 3 2.0518(4) 47.4(2) 288.7(5)
1.5(1) 1.36(5) 2.16(9) 1 10.63(3) 49.4(2) 69.9(2)
7.02(4) 3.40(5) 2 0.7(2) 68(1) 180(1)
A(63Cu)/geβe
(mT)
6.04(5) 3 3.30(7) 48.7(8) 291(1)
0.572
120 K
2.1200(1) 0.0836(1) 0.0636(1) 1 2.3949(1) 52.0(2) 63.1(2)
2.2202(1) 0.1510(1) 2 2.0820(1) 65.8(2) 173.8(2)
g
2.1859(1) 3 2.0492(1) 47.8(2) 287.9(2)
1.59(3) 1.55(2) 2.37(2) 1 11.04(1) 49.2(2) 68.3(2)
7.12(1) 3.56(1) 2 0.59(4) 67.4(2) 179.4(3)
A(63Cu)/geβe
(mT)
6.20(1) 3 3.29(1) 49.3(2) 290.3(4)
−0.07(1) 0.10(2) 0.05(1) 1 0.30(1) 47(1) 68(2)
0.03(1) 0.24(1) 2 −0.09(1) 69(6) 180(6)
P(63Cu)/geβe
(mT)
0.04(1) 3 −0.21(1) 50(4) 288(9)
0.124
0.05(11) 0.03(8) −0.08(7) 1 0.42(2) 52(3) 96(9)
0.23(4) 0.25(6) 2 0.09(5) 73(21) 200(14)
A(1H)/geβe
(mT)
0.10(6) 3 −0.13(15) 43(13) 308(31)
0.137
Results reported here are for one of four symmetrically equivalent sites in the rotation group D2.
Polar angle θ is relative to the crystallographic axis c, and azimuth angle φ is relative to axis a. (θ,
φ) is equivalent to (180-θ, 180+φ).
The 1H superhyperfine structure is resolved only in one or two magnetically
nonequivalent sites at some crystal orientations in the 120 K spectra (Figure 6.3b).

171
Therefore, only a total of 571 datapoints (and the sum of weighing factors = 558) was
available for the optimization of the matrix A(1H). The final RMSD value of 0.137
mT is again smaller than half of the experimental linewidth. Matrix A(1H) has a
rhombic symmetry (Table 6.2) and can be decomposed into an isotropic component a
= 0.13 mT, an axial component b = 0.18 mT, and a rhombic component c = 0.08 mT.
The orientation of the A1 axis at (52º, 96º; Table 6.2) is close to the Zn—H direction
(66º, 120º).
Figure 6.5 Experimental powder EPR spectrum of hemimorphite from the M’Fouati
Pb-Zn mine, measured at a microwave frequency of 9.387 GHz and a temperature of
110 K, in comparison with a simulated spectrum that includes contributions from both
63Cu and 65Cu. Note that the experimental spectrum also contains two additional
centers (i.e., O−/H and HO2−; authors’ unpublished data).

172
6.5 Discussion
The orientations of the best-fit spin Hamiltonian parameters (Table 6.2)
suggest that the Cu2+ ion resides at the Zn site. This site assignment is further
supported by the observed 1H superhyperfine structure that arises from interaction
with the hydrogen nucleus of the hydroxyl group that links the two Zn2+ ions. The
anisotropic component of the 1H superhyperfine parameter is estimated by using the
point-dipole model:
Tz' = (2µ0/4π)(gβegnβn/r3) .................................................................(6.2),
where Tz' is the traceless part of hyperfine interaction (Tx' = Ty' = -Tz'/2). The
calculated Cu-H distance (r) = 2.37 Å is close to the Zn-H distance of 2.43 Å,
determined by the neutron-diffraction study of Hill et al. (1977).
Figure 6.6 Relationships between the principal g and A(63Cu) axes of the Cu2+ center
and the ZnO4 pseudotetrahedron in the hemimorphite structure (O1a and O1b are
equivalent).

173
A strong Jahn-Teller effect is expected for the CuO4 tetrahedron and is
evidenced by the large rhombic character of matrices g, A and P, which suggests a
reduction in the local symmetry of the Cu2+ tetrahedron from D2d to approximately D2
(Hoffmann & Goslar 1982; Reinen et al. 1982). Theoretical considerations on the
basis of a second-order perturbation approximation (Parker 1971; Hoffmann & Goslar
1982; Pilbrow 1990) suggest that Cu2+ in a strongly elongate tetrahedron has g⊥ > g//
and |A⊥| ≈ |A//|, because its ground state is the dz2 orbital. The Cu2+ ion in a weakly
elongate tetrahedron has its ground state in the dxz orbital, so that mixing involving the
dxz, dxy, px, and py orbitals results in g// = 0 and g⊥ in a range from -2 to 4. The Cu2+ ion
in a compressed tetrahedron has the ground state in the dxy orbital, resulting in the g//
along the direction of compression.
The contributions to principal g and A values of Cu2+ in a compressed
tetrahedron, therefore, mainly come from the ground state dxy orbital that is removed
into a non-degenerated orbital by the tetragonal crystal-field. Minor contributions are
known to arise from admixture of the 4s and 4p orbitals of the Cu2+ ion and from the
effects of the oxygen ligands (Sharnoff 1965; Kuska et al. 1967; Abraham & Bleaney
1970; Parker 1971; Pilbrow 1990; Cozar et al. 1999). Successive tetrahedral and
rhombic distortions reduce five energy levels into non-degenerate states. To a first
approximation, the molecule orbitals in order of decreasing energy are listed below
(Sharnoff, 1965; Kuska et al. 1967; Yokoi & Addison 1977; Cozar et al. 1999).
|xy> = αdxy + α1pz + α2Ψ(xy)σ ...................................................................................................(6.3)
|xz> = γdxz + γ1py + γ2Ψ(xz)σ ...................................................................................................(6.4)

174
|yz> = δdyz + δ1px +δ2Ψ(yz)σ .....................................................................................................(6.5)
|x2-y2> = βdx2 - y2 + (1 - β2)1/2Ψ(x2 - y2)π ..........................................................................(6.6)
|z2> = εdz2 + (1 - ε2)1/2Ψ(z2)π .................................................................................................... (6.7)
Functions (6.3), (6.4), and (6.5) belong to the t2 group, which has higher
energies in the Td symmetry, whereas Functions (6.6) and (6.7) belong to the e group
with lower energies. Here,“d” and “p” represent the 3d and 4p orbitals of the Cu2+ ion,
and Ψ denotes the oxygen ligand orbitals. Furthermore, α, β, γ, δ, and other Greek
letters are all molecular orbital (MO) coefficients. The EPR parameters can be then
related to those MO coefficients in different symmetries. For example, Bates et al.
(1962) and Sharnoff (1965) proposed relationships between EPR parameters (g and A)
and MO coefficients for CuO4 with D2d symmetry, and they showed a significant
contribution from a large admixture (up to 11.7%; Sharnoff 1965) of energy levels
from the 4p orbital of Cu2+ (see also Kokoszka et al. 1967; Parker 1971; Hoffmann &
Goslar 1982; Cozar et al. 1999; Biyik et al. 2007). Cozar et al. (1999) suggested that
an admixture of about 6% from the pz character to the 3dxy orbital leads to an increase
in g// and a decrease in A// for Cu2+ in phosphate glasses. However, theoretical Xα
calculations by Bencini & Gatteschi (1983) did not identify any mixing of d-p orbitals,
because their calculated p mixing coefficient of the Xα wave function is only 0.011.
These authors suggested that covalence effects, instead of the admixture of p orbitals,
play a major role. Similarly, Maki & McGarvey (1958) proposed that covalence
effects are the main factor affecting g and A values for Cu2+ with D4h or D2h

175
square-planar coordinations (see also Kivelson & Neiman 1961; Gersmann & Swalen
1962; Kuska et al. 1967).
Following previous studies of Cu2+ in pseudotetrahedral and square-planar
coordinations (Gersmann & Swalen 1962; Sharnoff 1965; Kuska et al. 1967; Yokoi &
Addison 1977; Mabbs & Collison 1992; Cozar et al. 1999), relations between the
EPR parameters and MO coefficients for Cu2+ in hemimorphite can be written as
follow:
gz = ge – 8λdαβkαβ/∆Ex2-y2 ........................................................................................................(6.8)
gy = ge – 2(αγλd – α1γ1λp)(kαγ – α1γ1)/∆Exz ......................................................................(6.9)
gx = ge – 2(αδλd – α1δ1λp)(kαδ – α1δ1)/∆Eyz ......................................................................(6.10)
Az = Pd • [–α2(k0 + 4/7) – 8λdα2β2/∆Ex2-y2 – 3/7 • (αγλd – α1γ1λp)αγ/∆Exz - 3/7 •
(αδλd – α1δ1λp)αδ/∆Eyz] + Pp • [4/5 • α12 – k0α1
2 – 3/5 • (αγλd – α1γ1λp) α1γ1/∆Exz -
3/5 • (αδλd – α1δ1λp)α1δ1/∆Eyz] ...................................................................................................(6.11)
Ay = Pd • [–α2(k0 – 2/7) – 2 • (αγλd – α1γ1λp)αγ/∆Exz + 3/14 • (αδλd – α1δ1λp)αδ/∆Eyz]
+ Pp • [–2/5 • α12 – k0α1
2 + 2 • (αγλd – α1γ1λp) α1γ1/∆Exz - 3/5 • (αδλd –
α1δ1λp)α1δ1/∆Eyz] ...................................................................................................................................(6.12)
Ax = Pd • [–α2(k0 – 2/7) – 2 • (αδλd – α1δ1λp)αδ/∆Eyz + 3/14 • (αγλd – α1γ1λp)αγ/∆Exz]
+ Pp • [–2/5 • α12 – k0α1
2 + 2 • (αδλd – α1δ1λp)α1δ1/∆Eyz - 3/5 • (αγλd – α1γ1λp)
α1γ1/∆Exz] ....................................................................................................................................................(6.13)
where gz = g1, gy = g2, gx = g3, Az = A1, Ay = A2 and Ax = A3 (Table 6.2), and
kαβ = αβ + βα2Sd + (1 - β2)1/2α2[T(n)]C/2
kαγ = αγ + γα2Sd + (1 - γ2)1/2α2[T(n)]C/21/2

176
kαδ = αδ + δα2Sd + (1 - δ2)1/2α2[T(n)]C/21/2
Pd,p = 2γnµ0µn<r-3>3d,4p
where µn and γn are the nuclear magneton and the gyromagnetic ratio, respectively,
and <r-3> is taken from the states of the Cu2+ ion, Pd = 0.0360 cm-1 and Pp = 0.0402
cm-1 (Sharnoff 1965; Cozar et al. 1999). Geometrical parameter C has a value
between 1 and (2/3)1/2 for planar and tetrahedral coordinations. Also, T(n) is an
integral over the ligand functions and is equal to 0.220 for oxygen atoms; Sd is the
overlap integral and is equal to 0.076 for oxygen atoms (Kivelson & Neiman 1961;
Kuska et al. 1967). The characteristic Fermi contact term k0 is 0.43 (Cozar et al.
1999), and λd = -829 and λp = -925 cm-1 are spin-orbital coupling constants for the
free Cu2+ ion.
Following Bencini & Gateschi (1983), the coefficients for the admixture
involving the 4p orbitals (α1, γ1, δ1) can be assumed to be zero. Also, Kuska et al.
(1967) proposed the following relationship between α2 and the principal g and A
values:
α2 = 1/(k0 +4/7) • [-A///Pd + (g// - ge) + 3/7 • (g⊥ - ge)] + 0.03 .............................(6.14).
Here, the term α2 is 0.735 if A// is negative. Sharnoff (1965) proposed the following
equation:
α2 + α12 + α2
2 + 2(αα2Sd + α1α2Sp) = 1 ........................................................................................(6.15).
Equation (6.15) yields α22 = 0.196 if α1 = 0.
In the pseudotetrahedral oxygen coordination in beryl (Solntsev et al. 1976;
Gaite et al. 2001) and phosphate glasses (Cozar et al. 1999), the d-d transitions related
177
to dx2-y2 → dxy, dxz → dxy, and dyz → dxy are in the range of 10500 – 14000 cm-1. The
UV-Vis-NIR spectrum of hemimorphite reveals only two weak absorptions at 845 nm
(11834 cm-1) and 796 nm (12562 cm-1) (Figure 6.2). If we assign ∆Ex2-y2 ≈ 12562
cm-1 and ∆Exz ≈ ∆Eyz ≈11834 cm-1, equations (6.7), (6.8), and (6.9) yield β2 = 0.966,
γ2 = 0.721, and δ2 = 0.411. Following Sharnoff (1965), the |dxy> state contains 76.4%
(α2 + αα2Sd = 76.4%) 3dxy character, and 22.2% ligand character. In comparison with
previous works (Yokoi & Addison 1977), our δ2 value is relatively small, and there is
a large difference between γ2 and δ2. The rhombic symmetry of the spin-Hamiltonian
parameters is apparently responsible for those differences in coefficients. In particular,
the compressed Cu-tetrahedron shows a further distortion along the x and y axes that
are close to two pseudo-diads. This distortion may cause different orbital characters at
|dxz> and |dyz> states, resulting in different g2 and g3 and non-equal A2 and A3 (Table
6.2).
Zwanenburg et al. (1990) noted that the g values of Cu2+ centers vary with
temperature and attributed this to a local structural distortion related to the Jahn-Teller
effect. Similarly, Hoffmann et al. (2010) reported a temperature effect on the principal
g values of Cu2+ in kainite and did not observe any change in the directions of the
principal g axes. However, the best-fit spin Hamiltonian parameters for the Cu2+
center in hemimorphite are essentially constant in the temperature range from 120 K
to 295 K, which is also true for the Cu2+ center in beryl (Solntsev et al. 1976).

178
6.5.1 Site occupancies of heavy metals in hemimorphite and implications
Our cation-exchange experiments show that As and Cu in hemimorphite are
retained after exchange experiments up to 10 days, whereas Cd and probably Pb are
readily exchanged. This observed retention of As is consistent with results from our
previous single-crystal EPR study, which demonstrated that this element occurs as the
substitutional As5+ ion at the Si site (Mao et al. 2010). Similarly, the retention of Cu
in hemimorphite is consistent with its accommodation at the Zn site in the tetrahedral
framework, as revealed by EPR. The readily exchangeable Cd and Pb are attributable
to their locations in the channel sites. Our single-crystal EPR measurements did not
detect any paramagnetic Cd or Pb centers, suggesting as the presence of diamagnetic
Cd2+ and Pb2+ ions and making their site assignments impossible.
Numerous studies, including those using the EPR techniques, have been made
to investigate the uptake and local structural environments of Cu in natural and
synthetic zeolites, with relevance to diverse applications from enhanced catalytic
properties to remediation of heavy-metal contamination (e.g., Chao & Lunsford 1973;
Zamadics & Kevan 1992; Kuroda et al. 1992; Yu et al. 1997; Godelitsas &
Armbruster 2003; Hui et al. 2005; Doula & Dimirkou 2008). The general consensus is
that Cu resides in the large cages in zeolites (Kuroda et al. 1992; Vassilikou-Dova &
Eftaxias 1992; Delabie et al. 2000; Carl et al. 2002; Iacomi 2002; Godelitsas &
Armbruster 2003; Hincapie et al. 2005). For example, single-crystal EPR studies
(Chao & Lunsford 1973; Iacomi 2002) revealed six distinct sites in the cages for Cu2+
in chabazite (see also Zamadics & Kevan 1992). Similarly, Krishna et al. (2000) and

179
Godelitsas & Armbruster (2003) have suggested that other heavy metals, such as Co2+,
Pb2+, and Cd2+, reside in the cages in zeolites as well.
In this context, the observed accommodation of Cu2+ in the tetrahedral
framework in hemimorphite is particularly interesting and has implications for the
application of zeolites and zeolite-like materials for the remediation of heavy-metal
contamination. For example, Mao et al. (2010) noted the accommodation of As5+ in
the Si tetrahedral site in hemimorphite, and discussed its advantages in controlling the
mobility of As during the weathering of Zn sulfide deposits. The advantage of heavy
metals in the tetrahedral framework over locations in the cages is obvious, because the
latter is susceptible to cation exchanges and, hence, represents a potential source for
secondary contamination. In addition, numerous zeolite-type materials containing
tetrahedrally coordinated Zn sites (Gier & Stucky 1991; Bu et al. 1998; Jensen et al.
1998; Johnson et al. 2002) are known and are potentially useful for the remediation of
Cu contamination.
6.6 Conclusions
Single-crystal EPR spectra measured at 295 K and 120 K reveal the presence
of a Cu2+ center in hemimorphite (Reneville, Congo). The best-fit spin-Hamiltonian
parameters show that Cu2+ resides at the tetrahedral Zn site without any notable
difference between 295 K and 120 K, refuting the model of Cu2+ in the channel
suggested by a previous powder EPR study (Gallegos et al. 2009). Cation-exchange
experiments that show Cu and As are not easily exchanged, further supporting their

180
locations in the tetrahedral sites. However, Cd and Pb in hemimorphite are readily
exchanged and probably reside in the structural channels. These results indicate that
hemimorphite is potentially useful for remediation of heavy metalloid contamination.
6.7 References
ABRAGAM, A. & BLEANEY, B. (1970): Electron paramagnetic resonance of transition
ions. Clarendon Press. Oxford.
BATES, C.A., MOORE, W.S., STANDLEY, K. J. & STEVENS, K.W.H. (1962):
Paramagnetic resonance of a Cu2+ ion in a tetrahedral crystal field. Proc. Phys. Soc.
79, 73-83.
BENCINI, A. & GATTESCHI, D. (1983): Xα calculations of the EPR parameters of
pseudotetrahedral copper(II) complexes. J. Am. Chem. Soc. 105, 5535-5541.
BISSENGALIYEVA, M.R., BEKTURGANOV, N.S. & GOGOL, D.B. (2010):
Thermodynamic characteristics of a natural zinc silicate hemimorphite. J. Therm.
Anal. Calorim. 101, 49-58.
BIYIK, R., TAPRAMAZ, R. & TEŞILEL, O. Z. (2007): EPR spectra of Cu2+ doped
[Zn(sac)2(dmen)] and [Zn(sac)2(paen)] single crystals. Spectrochim. Acta A, 68,
394-398.
BONI, M. & LARGE, D. (2003): Nonsulfide zinc mineralization in Europe: An
overview. Econ. Geol. 98, 715-729.
BREUER, K., TELES, J.H., DEMUTH, D., HIBST, H., SCHÄFER, A., BRODE, S. &
DOMGÖRGEN, H. (1999): Zinc silicates: very efficient heterogeneous catalysts for the

181
addition of primary alcohols to alkynes and allenes. Angew. Chem. Int. Ed. 38,
1401–1405.
BROWN, K., MOMBOURQUETTE, M.J. & WEIL, J.A. (2003): EPR-NMR (Users’
Manual). Department of Chemistry, University of Saskatchewan, Saskatoon, SK.,
Canada.
BU, X., FENG, P., GIER, T.E. & STUCKY, G.D. (1998): Two ethylenediamine-templated
zeolite-type structures in zinc arsenate and cobalt phosphate systems. J. Solid State
Chem. 136, 210-215.
CABALA, J., KRUPA, P. & MISZ-KENNAN, M. (2009): Heavy metals in mycorrhizal
rhizospheres contaminated by Zn-Pb mining and smelting around Olkusz in southern
Poland. Water Air Soil Pollution 199, 139-149.
CANO, N.F., GALLEGOS, E.A. & WATANABE, S. (2009): Phase change and
pyroelectricity in natural hemimorphite. Rad. Effects Defects Solids, 164, 748-754.
CARL, P.J., VAUGHAN, E.W. & GOLDFARB, D. (2002): Interactions of Cu(II) ions with
framework Al in high Si:Al zeolite Y as determined from X- and W-band pulsed
EPR/ENDOR spectroscopies. J. Phys. Chem. B 106, 5428-5437.
CATILLON-MUCHERIE, S., AMMARI, F., KRAFFT, J.-M., LAURON-PERNOT, H.,
TOUROUDE, R. & LOUIS, C. (2007): Preparation of coimpregnated Cu–Zn/SiO2
catalysts: Influence of the drying step on metallic particle size and on Cu0–ZnII
interactions. J. Phys. Chem. C 111, 11619–11626.
CHAO, C.-C. & LUNSFORD, J.H. (1973): EPR spectra of Cu2+ in single crystals of
chabazite. J. Chem. Phys. 59, 3920-3925.

182
COPPOLA, V., BONI, M., GILG, H.A., BALASSONE, G. & DEJONGHE, L. (2008): The
“calamine” nonsulfide Zn-Pb deposits of Belgium: Petrographical, mineralogical and
geochemical characterization. Ore Geol. Rev. 33, 187-210.
COZAR, O. & ARDELEAN, I. (1987): The local symmetry of Cu2+ ions in phosphate
glasses. J. Non-Crystal. Solids 92, 278-281.
COZAR, O., ARDELEAN, I., SIMON, V., DAVID, L., VEDEAN, N. & MIH, V. (1999): EPR
studies of Cu2+ and V4+ ions in phosphate glasses. Appl. Mag. Reson 16, 473-480.
DACHS, E. & GEIGER, C.A. (2009): Heat-capacity behaviour of hemimorphite,
Zn4Si2O7(OH)2•H2O, and its dehydrated analogue Zn4Si2O7(OH)2: a calorimetric and
thermodynamic investigation of their phase transitions. Eur. J. Mineral. 21, 971–988.
DAY, S.J. & BOWELL, R.J. (2005): Atypical and typical zinc geochemistry in a
carbonate setting, Sä Dena Hes Mine, Yukon Territory, Canada. Geochem. Explor.
Environ. Analysis 5, 255-266.
DELABIE, A., PIERLOOT, K., GROOTHAERT, M.H., WECKHUYSEN, B.M. &
SCHOONHEYDT, R.A. (2000): Study of the coordination of Cu2+ in zeolite Y:
Interaction with water and ammonia. Micropor. Mesopor. Materials 37, 209-222.
DOULA, M.K. & DIMIRKOU, A. (2008): An EPR study of Cu adsorption by
clinoptilolite from Cl-, NO3- and SO42- solutions. J. Porous Mater 15, 457-466.
ESPIARI, S., RASHCHI, F. & SADRNEZHAAD, S.K. (2006): Hydrometallurgical treatment
of tailings with high zinc content. Hydrometall. 82, 54–62.
FROST, R.L., BOUZAID, J.M. & REDDY, B.J. (2007): Vibrational spectroscopy of the
sorosilicate mineral hemimorphite Zn4(OH)2Si2O7•H2O. Polyhedron 26, 2405–2412.

183
GAITE, J.M., IZOTOV, V.V., NIKITIN, S.I. & PROSVIRNIN, S.Y. (2001): EPR and optical
spectroscopy of impurities in two synthetic beryls. Appl. Mag. Reson. 20, 307-315.
GALLEGOS, E.A., CANO, N.F., WATANABA, S. & CHUBACI, J.D.F. (2009):
Thermoluminescence, infrared reflectivity and electron paramagnetic resonance
properties of hemimorphite. Rad. Measur. 44, 11-17.
GEIGER, C.A. & DACHS, E. (2009): Quasi-ice-like Cp behavior of molecular H2O in
hemimorphite Zn4Si2O7(OH)2•H2O: Cp and entropy confined H2O in microporous
silicates. Am. Mineral. 94, 634–637.
GERSMANN, H.R. & SWALEN, J.D. (1962): Electron paramagnetic resonance spectra of
copper complexes. J. Chem. Phys. 36, 3221-3233.
GIER, T.E. & STUCKY, G.D. (1991): Low-temperature synthesis of hydrated
zinco(beryllo)-phospahte and arsenate molecular sieves. Nature 349, 508-510.
GODELITSAS, A. & ARMBRUSTER, T. (2003): HEU-type zeolites modified by transition
elements and lead. Micropor. Mesopor. Materials 61, 3-24.
HILL, R.J., GIBBS, G.V., CRAIG, J.R., ROSS, F.K. & WILLIAMS, J.M. (1977): A neutron
diffraction study of hemimorphite. Zeit. Kristal. 146, 241–259.
HINCAPIE, B.O., GARCES, L.J., GOMEZ, S., GHOSH, R. & SUIB, S.L. (2005): Direct
synthesis of copper faujasite. Catalysis Today 110, 323-329.
HOFFMANN, S.K. & GOSLAR, J. (1982): Crystal field theory and EPR parameters in
D2d and C2v distorted tetrahedral copper(II) complexes. J. Solid State Chem. 44,
343-353.

184
HOFFMANN, S.K., GOSLAR, J. & TADYSZAK, K. (2010): Electronic structure and
dynamics of low symmetry Cu2+ complexes in kainite-type crystal KZnClSO4•3H2O:
EPR and ESE studies. J. Mag. Reson. 205, 293-303.
HUI, K.S., CHAO, C.Y.H. & KOT, S.C. (2005): Removal of mixed heavy metal ions in
wastewater by zeolite 4A and residual products from recycled coal fly ash. J. Hazard.
Materials B127, 89-101.
IACOMI, F. (2002): EPR studies of Cu2+ ion in chabazite. Moldavian J. Phys. Sci. 1,
106-110.
JENSEN, T.R., NORBY, P., NØRLUND, C.A. & HANSON, J.C. (1998): Hydrothermal
synthesis, crystal structure refinement and thermal transformation of LiZnAsO4·H2O.
Micropor. Mesopor. Materials 26, 77-87.
JOHNSON, C.D., MACPHEE, D.E. & FELDMANN, J. (2002) New low temperature
synthetic route to an ammonium zinc arsenate zeolite analogue with an ABW-type
structure. Inorg. Chem. 41, 3588-3589.
KARABULUT, B., TAPRAMAZ, R. & KARADAG, A. (2008): EPR and optical absorption
studies of Cu2+ ions in [ZnPd(CN)4(C4H12N2O2)] single crystals. Appl. Mag. Reson.
35, 239-245.
KIVELSON, D. & NEIMAN, R. (1961): ESR studies on the bonding copper complexes. J.
Chem. Phys. 35, 149-155.
KOKOSZKA, G.F., REIMANN, C.W. & ALLEN, H.C.JR. (1967): The optical and magnetic
spectra of copper-doped dichloro (1,10-phenanthroline) zinc. J. Phys. Chem. 71,
121-126.

185
KOLESOV, B. (2006): Raman investigation of H2O molecule and hydroxyl groups in
the channels of hemimorphite. Amer. Mineral. 91, 1355–1362.
KRISHNA, R.M., CHANG, Z., CHOO, H., RANJIT, K.T. & KEVAN, L. (2000): Electron
paramagnetic resonance and diffuse reflectance spectroscopic studies of the
photoionization of N-alkylphenothiazines in synthetic microporous M-clinoptilolite
(M = Na+ + K+, H+, Li+, Na+, K+, Ni2+, Co. Phys. Chem. Chem. Phys. 2, 3335-3339.
KURODA, Y., KOTANI, A., MAEDA, H., MORIWAKI, H., MORIMATO, T. & NAGAO, M.
(1992): The state of excessively ion-exchanged copper in mordenite: formation of
tetragonal hydroxyl-bridged copper ion. J. Chem. Soc. Faraday Trans. 88, 1583-1590.
KUSKA, H.A., ROGERS, M.T. & DRULLINGER, R.E. (1967): Effect of substituents on
the anisotropic electron spin resonance parameters in copper acetylacetonates. J. Phys.
Chem. 71, 109-114.
LEE, J.S. & CHON, H.T. (2003): Exposure assessment of heavy metals on abandoned
metal mines by ingestion of soil, crop plant and groundwater. J. Phys. IV 107,
757-760.
LIBOWITZKY, E., KOHLER, T., ARMBRUSTER, T. & ROSSMAN, G.R. (1997): Proton
disorder in dehydrated hemimorphite. IR spectroscopy and x-ray structure refinement
at low and ambient temperatures. Eur. J. Mineral. 9, 803-810.
LIBOWITZKY, E. & ROSSMAN, G.R. (1997): IR spectroscopy of hemimorphite between
82 and 373 K and optical evidence for a low-temperature phase transition. Eur. J.
Mineral. 9, 793-802.

186
LIBOWITZKY, E., SCHULTZ, A.J. & YOUNG, D.M. (1998): The low-temperature
structure and phase transition of hemimorphite, Zn4Si2O7(OH)2•H2O. Zeit. Kristal.
213, 659-668.
MABBS, F.E. & COLLISON, D. (1992): Electron paramagnetic resonance of d transition
metal compounds. Studies in Inorganic Chemistry, 16. Elsevier.
MAKI, A.H. & MCGARVEY, B.R. (1958): Electron spin resonance in transition metal
chelates. I. Copper(II) bis-acetylacetonate. J. Chem. Phys. 29, 31-34.
MAO, M., LIN, J. & PAN, Y. (2010): Hemimorphite as a natural sink for arsenic in zinc
deposits and related mine tailings: Evidence from single-crystal EPR spectroscopy
and hydrothermal synthesis. Geochim. Cosmochim. Acta 74, 2943-2956.
NISTOR, S.V., BOUWEN, A. & SCHOEMAKER, D. (1995): Cd+ (5s1) centers in Rb2ZnCl4
single crystals. Phys. State Sol. B 189, 345-356.
NISTOR, S.V., SCHOEMAKER, D. & URSU, I. (1994): Spectroscopy of the ns1-centers in
ionic crystals. Phys. State Sol. B 185, 9-76.
PARKER, I.H. (1971): Cu2+ in ammonium fluoride—a tetrahedral site. J. Phys C: Solid
State Phys. 4, 2967-2978.
POPESCU, F.F. & GRECU, V.V. (1973): EPR study of Zn+ in calcite. Solid State Comm.
13, 749-751.
POPESCU, F.F. & GRECU, V. V. (1975): Temperature dependence of Pb3+ EPR
spectrum in irradiated calcite. Phys. State Solidi B 68, 595-601.

187
PILBROW, J. R. (1990): Transition ion electron paramagnetic resonance. Oxford
Science Publications.
REINEN, D., ATANASOV, M., NIKOLOV, G. & STEFFENS, F. (1988): Local and
cooperative Jahn-Teller distortions of Ni2+ and Cu2+ in tetrahedral. Inorg. Chem. 27,
1678-1686.
RODRIGUEZ, L., RUIZ, E., ALONSO-AZCARATE, J. & RINCON, J. (2009): Heavy metal
distribution and chemical speciation in tailings and soils around a Pb-Zn mine in
Spain. J. Environ. Manag. 90, 1106-1116.
SCHAIDER, L.A., SENN, D.B., BRABANDER, D.J., MCCARTHY, K.D. & SHINE, J. P.
(2007): Characterization of zinc, lead, and cadmium mine waste: implications for
transport, exposure and bioavailability. Environ. Sci. Technol. 41, 4164–4171.
SERYOTKIN, Y.V. & BAKAKIN, V.V. (2011): Structural evolution of hemimorphite at
high pressure up to 4.2 GPa. Phys. Chem. Minerals 38, 679-684.
SHARNOFF, M. (1965): Electron paramagnetic resonance and the primarily 3d wave
functions of the tetrachlorocuprate ion. J. Chem. Phys. 42, 3383-3395.
SOLNTSEV, V.P., LEBEDEV, A.S., PAVLYUCHENKO, V.S. & KLYAKHIN, V.A. (1976):
Copper centers in synthetic beryl. Soviet Phys. Solid State 18, 805-806.
TAKAHASHI,T. (1960): Supergene alteration of zinc and lead deposits in limestone.
Econ. Geol. 55, 1083-1115.
VASSILIKOU-DOVA, A.B. & EFTAXIAS, K. (1991): Electron spin resonance of Mn2+ in
hemimorphite. Crystal Res. Tech. 27, 117-120.

188
VASSILIKOU-DOVA, A.B. & EFTAXIAS, K. (1992): Electron paramagnetic resonance of
Cu2+ in descloizite mineral: an unusual electronic configuration. J. Phys. Cond.
Matter 4, 241-248.
WALDER, I.F. & CHAVEZ, W.X.JR. (1995): Mineralogical and geochemical behavior of
mill tailing material produced from lead-zinc skarn mineralization, Hanover, Grant
County, New Mexico, USA. Environ. Geol. 26, 1-18.
YOKOI, H. & ADDISON, A. W. (1977): Spectroscopic and redox properties of
pseudotetrahedral copper(II) complexes. Their relationship to copper proteins. Inorg.
Chem. 16, 1341-1349.
YU, J.S., RYOO, J.W., LEE, C.W., KIM, S.J., HONG, S.B. & KEVAN, L. (1997):
Copper(II) ionic species in CuII-exchanged K-offretite gallosilicate determined by
electron paramagnetic resonance and electron spin echo modulation spectroscopies. J.
Chem. Soc. Faraday Trans. 93, 1225-1231.
YURIEVA, T.M., KUSTOVA, G.N., MINYUKOVA, T.P., POELS, E.K., BLIEK, A.,
DEMESHKINA, M.P., PLYASOVA, L.M., KRIEGER, T.K. & ZAIKOVSKII, V. I. (2001):
Non-hydrothermal synthesis of copper-, zinc- and copper–zinc hydrosilicates. Mater.
Res. Innov. 5, 3–11.
ZAMADICS, M. & KEVAN, L. (1992): Electron spin resonance and electron spin echo
modulation studies of copper(II) ions in the aluminosilicate chabazite: acomparison of
copper(II) cation location and adsorbate interaction with isostructural
silicoaluminophosphate-34. J. Phys. Chem. 96, 8989-8993.
ZWANENBURG, G., MICHIELS, J.J.M. & DE BOER, E. (1990): EPR study of K2SeO4:
Cu2+ in the high temperature phase and in the in commensurate phase. Phys. Rev. B 42,
7783-7789.

189
Chapter 7
Phase transitions and proton ordering in hemimorphite: New insights
from single-crystal EPR experiments and DFT calculations
Single-crystal electron paramagnetic resonance (EPR) spectra of gamma-ray-
irradiated hemimorphite (Mapimi, Durango, Mexico) after storage at room
temperature for three months, measured from 4 K to 275 K reveal a hydroperoxy
radical HO2 derived from the water molecule in the channel. The EPR spectra of the
HO2 radical confirm that hemimorphite undergoes two reversible phase transitions at
~98 K and ~21 K, and allow determinations of its spin-Hamiltonian parameters,
including superhyperfine coupling constants of two more-distant protons from the
nearest hydroxyl groups, at 110 K, 85 K, 40 K and 7 K. These EPR results show that
the HO2 radical changes in site symmetry from monoclinic to triclinic related to the
ordering and rotation of its precursor water molecule in the channel at <98 K. The
monoclinic structure of hemimorphite with completely ordered O−H systems at low
temperature has been evaluated by both the EPR spectra of the HO2 radical at <21 K
and periodic density functional theory (DFT) calculations.
190
7.1 Introduction
Hemimorphite of the ideal formula Zn4Si2O7(OH)2•H2O, an important ore
mineral in non-sulfide Zn deposits and a common constituent in Zn mine tailings, has
attracted considerable attention, because of its complex phase transitions (Libowitzky
& Rossman, 1997; Libowitzky et al. 1998; Kolesov, 2006; Frost et al., 2007; Geiger
& Dachs, 2009; Dachs & Geiger, 2009; Cano et al., 2009; Bissengaliyeva et al., 2010;
Seryotkin & Bakakin, 2011) and interesting properties for catalytical (Breuer et al.
1999, Yurieva et al. 2001, Catillon-Mucherie et al. 2007) and environmental
applications (Walder & Chavez 1995, Day & Bowell 2005, Espiari et al. 2006,
Schaider et al. 2007, Cabala et al. 2009, Mao et al., 2010; Mao & Pan, 2012).
The zeolite-like structure of hemimorphite at room temperature (RT) and
atmospheric pressure belongs to the space group Imm2 and consists of SiO4 and
Zn(OH)O3 tetrahedra sharing corners to form a framework with confined H2O
molecules in channels along [001] (Barclay & Cox, 1960; McDonald & Cruickshank,
1967; Hill et al., 1977; Takéuchi et al., 1978; Cooper et al., 1981; Libowitzky et al.,
1998; Figure 7.1a). The H2O molecule in the center of the channels lies in the (010)
plane with the rotation axis along [001], and is held together by the OH groups via
four co-planar hydrogen bonds (i.e., “two-dimensional ice”, Figure 7.1b; Hill et al.,
1977; Takéuchi et al., 1978; Libowitzky et al., 1998; Kolesov, 2006).
Libowitzky & Rossman (1997), on the basis of Fourier-transform infrared
(FTIR) and optical measurements, reported that hemimorphite undergoes a reversible
second-order phase transition at 98(2) K. Subsequently, Kolesov (2006) observed

191
another phase transition at ~20-30 K in a polarized Raman spectroscopic study.
Seryotkin & Bakakin (2011) noted that hemimorphite undergoes a phase transition
from Imm2 to Pnn2 at a hydrostatic pressure of ~2.5 GPa.
Figure 7.1 a) Crystal structure of hemimorphite at room temperature projected to the
(001) plane (data from Takéuchi et al., 1978); and b) and c) comparison of the
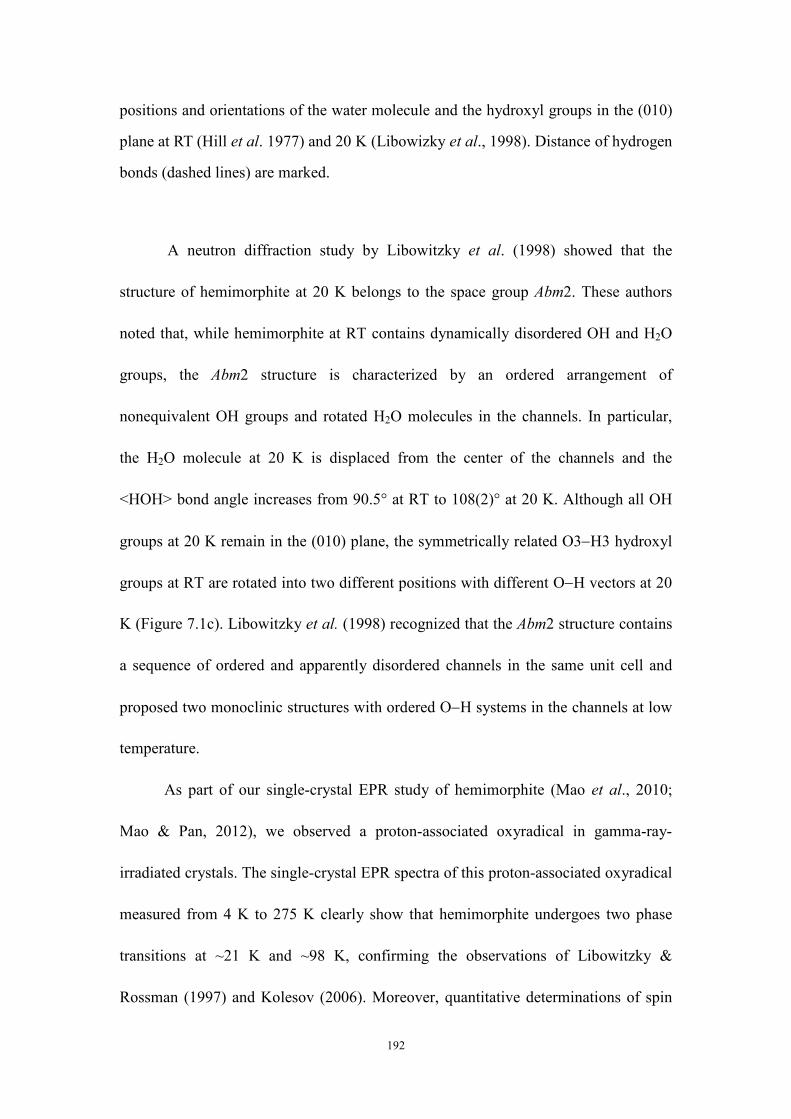
192
positions and orientations of the water molecule and the hydroxyl groups in the (010)
plane at RT (Hill et al. 1977) and 20 K (Libowizky et al., 1998). Distance of hydrogen
bonds (dashed lines) are marked.
A neutron diffraction study by Libowitzky et al. (1998) showed that the
structure of hemimorphite at 20 K belongs to the space group Abm2. These authors
noted that, while hemimorphite at RT contains dynamically disordered OH and H2O
groups, the Abm2 structure is characterized by an ordered arrangement of
nonequivalent OH groups and rotated H2O molecules in the channels. In particular,
the H2O molecule at 20 K is displaced from the center of the channels and the
<HOH> bond angle increases from 90.5° at RT to 108(2)° at 20 K. Although all OH
groups at 20 K remain in the (010) plane, the symmetrically related O3−H3 hydroxyl
groups at RT are rotated into two different positions with different O−H vectors at 20
K (Figure 7.1c). Libowitzky et al. (1998) recognized that the Abm2 structure contains
a sequence of ordered and apparently disordered channels in the same unit cell and
proposed two monoclinic structures with ordered O−H systems in the channels at low
temperature.
As part of our single-crystal EPR study of hemimorphite (Mao et al., 2010;
Mao & Pan, 2012), we observed a proton-associated oxyradical in gamma-ray-
irradiated crystals. The single-crystal EPR spectra of this proton-associated oxyradical
measured from 4 K to 275 K clearly show that hemimorphite undergoes two phase
transitions at ~21 K and ~98 K, confirming the observations of Libowitzky &
Rossman (1997) and Kolesov (2006). Moreover, quantitative determinations of spin
193
Hamiltonian parameters of this oxyradical, including proton hyperfine coupling
constants, at 110 K, 85 K, 40 K and 7 K, provide new insights into proton ordering
associated with the two phase transitions. In addition, the monoclinic structures
proposed by Libowitzky et al. (1998) have been evaluated by both periodic density
functional theory (DFT) calculations and the EPR results at <21 K.
7.2 Sample and experimental methodology
7.2.1 Single-crystal EPR measurements
The hemimorphite crystal (~1 mm x 2.5 mm x 3 mm) of Sample #1 (Mapimi,
Durango, Mexico) investigated in Mao et al. (2010) was used in this study. Mao et al.
(2010) did single-crystal EPR measurements immediately after this crystal was
irradiated at RT in a 60Co cell for a dose of ~50 kGy.
In this study, all EPR spectra of the gamma-ray-irradiated hemimorphite, after
storage at RT for three months, were collected on a Bruker EMX spectrometer at the
Saskatchewan Structural Sciences Centre, University of Saskatchewan. The
spectrometer is equipped with an automatic microwave controller, a high-sensitivity
ER-4119 cavity, an ER-218G1 goniometer with a precision of 0.2°, and an Oxford
Instrument liquid-helium cryostat.
Detailed spectral measurements in three rotation planes approximately parallel
to the (010), (100) and (001) crystal faces, at a constant interval of 5° in each plane,
were made at 110 K, 85 K, 40 K and 7 K. Experimental conditions included
microwave frequencies of ~9.387 GHz, a modulation frequency of 100 kHz, a

194
modulation amplitude of 0.05 mT, a microwave power of 20 mW or 2 mW, and
spectral resolutions from 0.0039 mT (i.e., 2,048 data points over 8 mT) to ~0.0078
mT (2,048 data points over 16 mT ). Calibration of the magnetic field was made by
using a Bruker strong pitch with g = 2.0028 as an external standard.
Additional single-crystal spectral measurements were made with B//a in the
temperature range from 4 K to 275 K and B//b from 4 K to 110 K, using variable
intervals from 1 K to 25 K (Figure 7.2a,b). At each temperature, the crystal in the
cavity was allowed to equilibrate for at least an hour before measurements.
Experimental conditions for these measurements were similar to those above, except
for spectral resolutions of 0.0049 mT (i.e., 2,048 data points over 10 mT) for those
with B//b.
7.2.2 DFT computation methodology
All periodical calculations were performed using the supercell approach
(Pisani, 1996) and the parameter free hybrid DFT method PBE0 (Adamo & Barone,
1999) as implemented in the package CRYSTAL06 (Dovesi et al., 2006). Here PBE
stands for both Perdew, Burke and Ernzerhof GGA exchange and correlation
functionals that contain no empirical parameters (Perdew et al., 1996). All-electron
basis sets used in this study are those known to be well suitable for periodic
calculations (Li & Pan, 2011), and include the 86-411d31G of Jaffe & Hess (1993) for
Zn, standard 6-31G* for O and H, and Pisani’s (1992) 8-41G**, [1s3sp2d] from
primitives (20s13p2d) for Si.

195
The thresholds for the overlap and penetration Coulomb integrals, the overlap
for Hartree-Fock (HF) exchange integrals, and the two pseudo-overlaps for HF series
were set to 10-8, 10-8, 10-8, 10-8, and 10-18 hartree, respectively, while a tight SCF
tolerance of 10-8 hartree was chosen. Also, the extra-large grid (XLGRID) that
employs the pruned (75,974) grid for each atom was used, which is much more
accurate than the default (55,434) grid in the description of the optimized charge
densities (Li & Pan, 2011). The Pack-Monkhorst shrink factor was set to 6 for the
unit-cell geometry optimizations. The same shrink factor was doubled for the Gilat net
to describe the Fermi surface of the system (Dovesi et al., 2006).
7.3 Results and discussion
7.3.1 Single-crystal EPR spectra
Single-crystal EPR measurements of the gamma-ray-irradiated hemimorphite
after storage at RT for three months show that the [AsO4]4- and [AsO4]
2- radicals
observed in Mao et al. (2010) have faded completely and that two new resonance
signals (denoted I and II in Figure 7.2) are now resolved at <275 K. It should be noted,
however, that Centers I and II are present in the crystal immediately after gamma-ray
irradiation but commonly overlap with the [AsO4]2- radical, making them difficult to
investigate before the latter is completely decayed. Figure 7.2 also shows an
electron-like center E’ of Cano et al. (2009) and Gallegos et al. (2009), which does
not have any detectable hyperfine structure and has not been investigated further in
this study.

196
The 110 K spectra of Center I consist of two strong lines and three weak
satellites at B//a (Figure 7.2a), and two sets of three lines with the intensity ratio of
~1:2:1 at B//b (Figure 7.2b). These spectra features suggest that Center I arises from
an unpaired electron (S = ½) interacting with one close proton (I = 1/2 and natural
isotope abundance of ~100%) and two more-distant and equivalent protons. The
spectrum of Center I at B//c contains one broad (~0.2 mT) multiplet (Figure 7.2c).
Away from crystallographic axes, the signals are resolved to at most two sets,
indicative of a monoclinic site symmetry (Rae 1969). The average linewidth of Center
I at 110 K is ~0.25 mT.
Below 98 K the EPR spectra of Center I at random orientations consist of four
magnetically nonequivalent sets (Figure 7.2d), indicative of a triclinic site symmetry
(Rae 1969). The average linewidths of Center I at 85 K and 40 K are 0.14 mT and
~0.12 mT, respectively, which are significantly narrower than that at 110 K and result
in better resolved superhyperfine splittings arising from the two more-distant protons
in the 40 K spectra (Figure 7.2).
The spectra of Center I at <21 K are closely comparable to these above 98 K
but differ markedly from those between 22 and 98 K (Figure 7.2a,b), providing clear
evidence for another phase transition at ~21 K. Repeated EPR measurements showed
that this phase transition at ~21 K, similar to that at ~98 K (Libowitzky & Rossman,
1997), is reversible. Moreover, the linewidth of Center I increases significantly close
to the phase transition at ~21 K (Figure 2a,b). Lang et al. (1977) reported a similar
increase in the EPR linewidth of the substitutional Fe3+ center [FeO4]0 in quartz and

197
the isostructural berlinite (AlPO4) near the α↔β phase transition and interpreted it to
originate from fluctuations at the phase transition.
Figure 7.2 Representative single-crystal EPR spectra of gamma-ray-irradiated
hemimorphite as a function of temperature: a) B//~a and microwave frequency ν =
198
9.395 GHz; b) B//~b and ν = 9.386 GHz; c) B//~c and ν = 9.385 GHz; and d) B^a =
~45° and ν = 9.395 GHz. Three centers (I, II and E') are marked. Question mark notes
an unknown center in d). Four magnetically nonequivalent sites of Center I in d) are
also labeled.
The 110 K EPR spectrum of Center II at B//a consists of two strong lines and
two weak satellites (Figure 7.2a), with an average linewidth of ~0.16 mT. The
satellites decrease in intensity when B is rotated away from a and are not resolved at
B//b or B//c. This center is resolved into at most two sets in all three rotation planes,
indicating a monoclinic site symmetry (Rae, 1969). These features suggest that Center
II arises from an unpaired electron (S = ½) interacting with one proton. The doublet
and the weak satellites represent the “allowed” and “forbidden” proton nuclear
transitions, respectively. The EPR spectra of Center II also show clear evidence for
the phase transition at ~98 K but become too weak to be detected below 21 K. Also,
Center II is invariably lower in intensity than Center I (Figure 2a,b) and is obscured
completely by the latter where they overlap with each other. Therefore, quantitative
determinations of the spin Hamiltonian parameters of Center II are not possible,
owing to insufficient data points.
7.3.2 Optimization of spin Hamiltonian parameters
The spin Hamiltonian used for the description of Center I having hyperfine
interactions with three protons (i = 1, 2, 3) takes the form:
H = βeBTgS + Σ(IT
AiS – βnBTgniI)............................................................(7.1),
199
where βe and βn are the electronic (Bohr) and nuclear magnetons, respectively; S and I
are the electron-spin and nuclear-spin operatoers, respectively; T denotes transpose;
and the scalar gn value of 5.5856912 is adopted for 1H. Iterative fittings for the
Zeeman electron matrix g and the nuclear hyperfine matrices A were made by using
of the software package EPR-NMR (Brown et al., 2003). The experimental axes x, y,
and z were set along the crystallographic axes a, b and c, respectively.
The total number of line-position data points for the fitting of Center I at 110
K is 5800, which is reduced to 5782 after assigning those at crossover regions to a
weighing factor of 0.5. The final value of the root-mean-squares of weighted
differences (RMSD) is 0.030 mT (Table 7.1), which is less than half of the average
linewidth. The calculated normals of the three rotation planes at (θ=5.9º, φ=124.7º),
(91.2º, 356.0º), and (87.7º, 87.7º), in comparison with the ideal orientations at (0º, 0º),
(90º, 0º), and (90º, 90º), respectively, indicate minor crystal misalignments. Here, θ
and φ denote the polar and azimuth angles from c and a, respectively. Spectral
simulations confirm that the best-fit spin-Hamiltonian parameters at 110 K (Table 7.1)
reproduce the experimental spectra very well (Figure 7.3a).
The total numbers of line-position data points for the fittings of Center I at 85
K and 40 K are 2270 and 4395, respectively, which are reduced to 2260 and 4338.5
after assigning a weighing factor of 0.5 to those at the crossover regions. The
relatively smaller number of data points at 85 K is due to the fact that some spectra
from (100) and (001) planes at this temperature were not included owing to low
signal-to-noise ratios. The final RMSD values for 85 K and 40 K are 0.069, and 0.062

200
mT, respectively (Table 7.1), again less than half of the average linewidths in the
corresponding spectra. The calculated normals of the three rotation planes are (4.0º,
90.7º), (89.3º, 353.9º), and (91.1º, 90.8º) at 85 K, and (1.3º, 175.9º), (91.3º, 359.1º),
and (90.0º, 90.0º) at 40 K. The small differences in the calculated normals of a given
rotation plane among the experiments at different temperatures are expected from the
fact that crystal alignment was adjusted after measurements at each temperature.
Spectral simulations confirm that the best-fit spin Hamiltonian parameters at 85 and
40 K (Table 7.1) also reproduce their respective experimental spectra very well
(Figure 7.3b).
The apparent similarity in the EPR spectra of Center I below 21 K to those
above 98 K led us to use the spin Hamiltonian parameters and crystal orientations
obtained from the 110 K spectra as the starting point. The final RMSD value of 0.059
mT (Table 7.1) is also smaller than half of the experimental linewidth. Spectral
simulations show that the EPR spectra measured at 7 K are well reproduced by the
best-fit spin Hamiltonian parameters of Center I at this temperature (Figure 7.3c).
Table 7.1 Spin Hamiltonian parameters of the HO2 radical at different temperatures Principal direction RMSD
Matrix Y k Principal value
(Yk) θ (˚) φ (˚) (mT)
110 K
2.0092(1) 0 0 1 2.0241(1) 90.0(1) 270.0(1)
2.0242(3) 0 2 2.0141(1) 180.0(1) 164*
g
2.0141(2) 3 2.0092(1) 90.0(1) 0.0(1)
−1.074(2) 0 0 1 0.038(1) 180.0(1) 250*
−1.670(1) 0 2 −1.074(2) 90.0(1) 0.0(1)
1Hc
A/geβe (mT)
0.038(1) 3 −1.670(1) 90.0(1) 270.0(1)
−0.056(1) 0 −0.263(1) 1 −0.207(1) 90(4) 269(8) 1Hd1
A/geβe (mT) −0.207(1) 0 2 −0.194(2) 62.4(1) 359(11)
0.030

201
0.309(1) 3 0.447(2) 152.4(1) 0(1)
−0.056(1) 0 0.263(1) 1 −0.207(1) 90(4) 90(8)
−0.207(1) 0 2 −0.194(2) 62.4(1) 180(11)
1Hd2
A/geβe (mT)
0.309(1) 3 0.447(2) 152.4(1) 180(1)
85 K
2.0091(1) 0.0033(1) 0.0055(1) 1 2.0272(1) 69.9(1) 73.2(1)
2.0248(1) 0.0036(1) 2 2.0148(1) 40.6(1) 317.8(2)
g
2.0134(1) 3 2.0053(1) 56.4(1) 177.2(2)
−1.06(1) −0.30(1) 0.52(1) 1 −0.08(1) 36.6(6) 330(1)
−1.58(1) −0.34(2) 2 −1.37(1) 54.4(6) 166(2)
1Hc
A/geβe (mT)
−0.55(1) 3 −1.74(1) 82(1) 70(1)
−0.09(1) 0.01 (1) −0.18(1) 1 −0.16(1) 90(14) 93(37)
−0.18(1) −0.01(1) 2 −0.16(1) 69(1) 3(42)
1Hd1
A/geβe (mT)
0.32(1) 3 0.39(1) 159.1(6) 4(4)
−0.04(1) −0.04(1) 0.30(1) 1 −0.24(1) 98(10) 66(17)
−0.23(1) −0.04(1) 2 −0.21(1) 60(3) 151(23)
1Hd2
A/geβe (mT)
0.29(1) 3 0.48(1) 149(5) 171(2)
0.069
40 K
2.0077(1) 0.0080(1) 0.0066(1) 1 2.0359(1) 61.1(1) 67.1(1)
2.0262(1) 0.0011(1) 2 2.0083(1) 42.5(1) 300.0(1)
g
2.0136(1) 3 2.0034(1) 61.8(1) 174.2(1)
−1.11(1) −0.07(1) 0.54(1) 1 −0.03(1) 27.5(2) 348.8(1)
−1.72(1) −0.13(1) 2 −1.38(1) 62.9(6) 179.4(2)
1Hc
A/geβe (mT)
−0.32(1) 3 −1.74(1) 85.7(1) 87.2(1)
−0.17(1) 0.02(1) −0.23(1) 1 −0.28(1) 64.5(3) 23(1)
−0.20(1) −0.11(1) 2 −0.21(1) 89.4(5) 113(1)
1Hd1
A/geβe (mT)
0.26(1) 3 0.38(1) 154.5(3) 24.5(4)
−0.12(1) 0.02(1) 0.33(1) 1 −0.34(1) 63.1(1) 143.7(9)
−0.22(1) −0.10(1) 2 −0.19(1) 80.3(4) 238.6(7)
1Hd2
A/geβe (mT)
0.30(1) 3 0.49(1) 151.2(2) 166.6(2)
0.062
7 K
2.0095(1) 0 0 1 2.0237(1) 90.0(1) 270.0(1)
2.0237(1) 0 2 2.0137(1) 180.0(1) 180*
g
2.0137(1) 3 2.0095(1) 90.0(1) 0.0(1)
−1.102(7) 0 0 1 0.015(9) 180.0(4) 34*
−1.690(8) 0 2 −1.102(7) 90.0(4) 0 (1)
1Hc
A/geβe (mT)
0.015(9) 3 −1.690(8) 90.0(3) 270(1)
−0.051(5) 0 −0.254(6) 1 −0.199(10) 87(20) 275(39)
−0.199(9) 0 2 −0.188(6) 62 (2) 7(49)
1Hd1
A/geβe (mT)
0.281(8) 3 0.418(8) 151.6(5) 0.1(9)
−0.051(5) 0 0.254(6) 1 −0.199(10) 87(20) 95 (39)
−0.199(9) 0 2 −0.188(6) 62 (2) 187(49)
1Hd2
A/geβe (mT)
0.281(8) 3 0.418(8) 151.6(1) 180.1(9)
0.059
1Hc, 1Hd1 and 1Hd2 denote the close proton and two more-distant protons. *Tilting angles relate to
axis a (φ) are meaningless when the tilting angle relative to axis c (θ) is close to zero. The sets of
(θ, φ) and (180° – θ, 180° + φ) are equivalent.

202
Table 7.2 Spin Hamiltonian parameters of the HO2 radical in selected hosts Host g1 g2 g3 A1/geβe
(mT)
A2/geβe
(mT)
A3/geβe
(mT)
Ref.
Argon 2.0393 2.0044 2.0044 1.35 0.86 0.86 1
BaCl2•H2O 2.02 2.007 2.007 1.6 0.8 0.8 2
Glassy hydrogen peroxide 2.0356 2.0082 2.0043 −20.1 8.7 −5.3 3
SrCl2•6H2O 2.0355 2.008 2.003 −1.72 −0.6 −1.27 4
Hydrogen peroxide 2.0353 2.0086 2.0042 1.38 0.35 1.55 5
Ice Ih 2.0376 2.0117 2.0025 −0.8 −1.6 −1.3 6
Ice Ih 2.0443 2.0081 2.0022 −0.5 −1.5 −1.1 6
Ice Ih 2.0455 2.0105 2.0023 −0.3 −1.4 −1.0 6
Reference 1 is Adrian et al., 1967; 2, Radhakrishna et al., 1976; 3, Chumakova et al., 2008; 4,
Catton & Symons, 1969; 5, Wyard et al., 1968; and 6, Bednarek & Plonka, 1987.
The best-fit matrices g and A(1H for the close proton) of Center I at 110 K
(Table 7.1) are both close to axial in symmetry and are similar to those of the
hydroperoxy radical HO2 in various hosts (Table 2; Adrian et al., 1967; Wyard et al.,
1968; Catton & Symons, 1969; Radhakrishna et al., 1976; Bednarek & Plonka, 1987;
Chumakova et al., 2008). Following Chumakova et al. (2008), the unique g1 and A1
axes of the HO2 radical are along the O=O and O−H bond directions, respectively,
whereas the g3 and A2 axes are usually coaxial and normal to the radical plane.
Therefore, the orientations of the g3 and A2 axes (Table 7.1) suggest that the HO2
radical in hemimorphite at 110 K lies in the (100) mirror plane, hence explaining its
monoclinic site symmetry, and those of the unique g1 and A1 axes indicate the O=O
and O−H bonds along b and c, respectively. Also, the best-fit matrices A for the two
more-distant protons are axial in symmetry as well and have their unique axes
opposite in direction at (152.4, 180) and (152.4, 0), consistent with those from the
oxygen atom of the water molecule to the protons of the two nearest hydroxyl groups
(Figure 7.1b). Therefore, the most plausible model for Center I in hemimorphite at

203
110 K involves hole trapping on an O=O−H group formed from the water molecule
and interacting with two equivalent protons of two nearest hydroxyl groups (Figure
7.1b). The anisotropic components of A for these two more-distant protons (Table
7.1), using the point-dipole model
Tz = (2µ0/4π)(gβegnβn/r3)............................................................................(7.2),
where Tz is the traceless part (Tx = Ty = −Tz/2), predict a hole-nucleus distance of 2.33
Å, which is in reasonable agreement with the O−H1a and O−H1b distances of 1.99 Å
at 110 K (Figure 7.1b). This agreement is even better, if one considers the fact that the
isotropic component of the hyperfine coupling constant a = −0.9 mT (Table 7.1)
indicates a small portion of the unpaired spin on the proton, and therefore provides
further support for the formation of the HO2 radical from the water molecule in the
channel.
The orientations of the g3 axis (56.4, 177.2) and the close-proton A2 axis (54.4,
166) of Center I at 85 K suggest that the HO2 radical is now inclined to the (100)
plane. Also, the unique g1 and A1 axes are not along b or c, explaining the triclinic site
symmetry at this temperature. Moreover, the two protons from the nearest hydroxyl
groups (Figure 7.1c) are not equivalent either (Table 7.1). The best-fit spin
Hamiltonian parameters of Center I at 40 K also suggest an inclined HO2 radical
relative to the (010) plane but differ significantly in both principal values and
principal axis directions from those of its counterpart at 85 K (Table 1), indicating a
marked thermal effect in this temperature range.

204
Figure 7.3 Comparison of experimental and simulated EPR spectra of Center I: a)
B^b = ~42° in the (100) plane and v = 9.387 GHz at 110 K; b) B^b = ~50° in the (001)
plane and v = 9.386 GHz at 40 K, and c) B^a = ~35° in the (010) plane and v = 9.386
GHz at 7 K.
The best-fit spin-Hamiltonian parameters of HO2 radical at 7 K are closely
comparable to those at 110 K, except that the superhyperfine coupling constants of the
the two more-distant protons at 7 K are notably smaller than those at 110 K (Table 1).
Attempts to determine hyperfine structures of the HO2 radical from additional
protons expected in the hemirmorphite structure (Figure 7.1) have been made by use
of pulsed electron nuclear double resonance (ENDOR) and electron spin echo

205
envelope modulation (ESEEM) measurements at temperatures from 4 K to 40 K but
were not successful, presumably owing to a short spin-relaxation time of this center.
7.3.3 Monoclinic structures optimized by DFT calculations
The two monoclinic structures of space groups Cc and Ic with completed
ordered O-H systems suggested by Libowitzky et al. (1998) differ only in the choice
of the origin. Our DFT calculations for these two monoclinic space groups started
with their unit-cell parameters and atomic fractional coordinates transformed from
those of the Abm2 structure by using the relationships described in Libowitzky et al.
(1998). Our calculations show that both monoclinic structures converged readily and
are, as expected, almost identical in the calculated energies. These structures are
characterized by an angle of 29° between the water molecule and the (010) plane, and
have two non-equivalent hydroxyl groups to the water molecule (r = 1.67 Å vs 2.48
Å).
Another monoclinic structure with completely ordered O-H systems evaluated
by DFT calculations was derived from the orthorhombic one of space group Imm2
(Hill et al. 1977) by the matrix (1, 0, 0 / 0, 1, 0.5 / 0, 0, 0.5). The resulting structure of
space group Im converged readily as well but is energetically slightly less favorable
than its Cc and Ic counterparts (i.e., ∆E = 2.8 kcal/mol). The most salient feature of
the Im structure are that its water molecule is parallel to the (010) plane and has two
equivalent protons from the nearest hydroxyl groups (r = 2.06 Å).

206
7.3.4 Phase transitions and proton ordering in hemimorphite
Our single-crystal EPR spectra of the HO2 radical, measured in the
temperature range from 4 K to 275 K (Figure 7.2), provide unambiguous evidence
that hemimorphite undergoes two reversible phase transitions at ~98 K and ~21 K
(Libowitzky & Rossman, 1997; Libowitzky et al., 1998; Kolesov, 2006). Moreover,
quantitatively determined proton hyperfine and superhyperfine coupling constants of
this radical at 110 K, 85 K, 40 K and 7 K provide detailed information about the
locations and orientations of the water molecule and hydroxyl groups in hemimorphite
at these temperatures.
Specifically, the observed EPR spectra and the best-fit spin Hamiltonian
parameters of the HO2 radical at 110 K are consistent with the location of the water
molecule at the center of the channel and the presence of two equivalent protons from
the nearest hydroxyl groups (Figure 7.1b). The reduction in the observed site
symmetry of the HO2 radical below ~98 K supports the suggestion of Libowitzky et al.
(1998) that the precursor water molecule is displaced (and rotated) away from the
center of the channel. In particular, the angles of the inclined HO2 radical relative to
the c axis at ~34° and 29° from EPR data at 85 K and 40 K, respectively, are closely
comparable to the magnitude of rotation for the water molecule in the Abm2 structure
from the neutron diffraction experiment of Libowitzky et al. (1998). In addition, the
distinct superhyperfine coupling constants for the two distant protons confirm that the
two nearest hydroxyl groups are symmetrically nonequivalent below the ~98 K phase
transition (Figure 7.1c; Libowitzky et al., 1998). Moreover, the notable differences in

207
both the experimental spectra (Figure 7.2) and the best-fit spin Hamiltonian
parameters at 85 K and 40 K (Table 7.1) suggest a significant thermal effect on the
ordering and rotation of the water molecule in the channel in this temperature range.
Table 7.3 Unit-cell parameters and fractional coordinates of atoms in monoclinic hemimorphite optimized by DFT calculations.
Im Ic
a = 8.448 Å, b = 11.899 Å,
c =10.132 Å, α =115.2°
a = 8.154 Å, b = 12.004 Å,
c = 10.262 Å, α = 115.3°
x/a y/b z/c x/a y/b z/c
Zn1 0.29558 −0.33931 0.09284 0.29162 −0.3375 0.09524
Zn2 0.20481 −0.16003 −0.06742 −0.28996 −0.3477 0.09517
Zn3 0.29506 0.33990 −0.06718 0.21325 −0.15566 −0.06358
Zn4 0.20495 0.16016 0.09260 −0.20987 −0.15814 −0.05854
Si1 0 −0.14528 −0.30633 0.00026 −0.14470 0.20020
Si2 0 0.14531 −0.16100 0.00548 0.14129 0.34207
Si3 0 0.14542 0.33871 − − −
Si4 0 −0.14541 0.19367 − − −
O1 0.16031 −0.20514 −0.27413 0.16274 −0.20818 −0.27021
O2 0.16039 0.20512 −0.06902 0.15027 0.21237 −0.05863
O3 0 −0.16095 −0.47322 0.16571 −0.20139 0.23665
O4 0 0.16131 0.18760 −0.17930 0.19033 −0.07350
O5 0 0.00002 −0.18457 0.00527 −0.15897 0.03556
O6 0.16032 −0.20511 0.22607 0.00257 0.15298 0.19048
O7 0 0.00007 0.31473 0.00875 −0.00135 −0.17811
O8 0 0.16090 −0.31226 0.32293 −0.00327 −0.45083
O9 0 −0.16173 0.02645 0.32301 0.00424 0.01062
O10 0.16043 0.20514 0.43070 0.48306 −0.01262 −0.23138
O11 0.30969 0.00031 −0.47327 − − −
O12 −0.50000 0.00212 −0.22159 − − −
O13 0.31052 0.00002 0.02667 − − −
O14 −0.50000 −0.00554 0.27671 − − −
H1 0.38375 0.00161 −0.39978 0.36951 −0.00253 −0.36139
H2 0.41136 0.00093 −0.16132 0.06619 −0.49789 0.04438
H3 0.38230 −0.00030 0.10110 0.41653 −0.00412 −0.14801
H4 0.41138 −0.00142 0.33949 0.41765 0.03281 0.30771
Note that all atoms, including symmetrically equivalent ones, are included for comparison.

208
The EPR spectra of the HO2 radical below the ~21 K phase transition and the
best-fit spin-Hamiltonian parameters at 7 K (Table 7.1) confirm the suggestion of
Libowitzky et al. (1998) that the hemimorphite structure with completed ordered O−H
system at low temperature is monoclinic. However, our EPR data do not support the
Cc or Ic structures proposed by Libowitzky et al. (1998). Specifically, the HO2 radical
in the Cc and Ic structures is expected to be located at a general position, which gives
rise to four-fold splittings from both the monoclinic crystal symmetry and the (010)
crystal twinning (cf. Libowitzky et al. 1998). Also, the two protons from the nearest
hydroxyl groups for a HO2 radical in these structures are magnetically nonequivalent.
Therefore, the Cc and Ic structures are incompatible with the observed EPR spectra of
the HO2 radical at <21 K (Figure 7.2). The Im structure (Table 7.3), on the other hand,
predicts that the HO2 radical in the (100) mirror plane has no magnetic site splitting
but can account for the observed splittings in the EPR spectra at <21 K (Figure 7.2)
by the (010) crystal twinning. Also, the two protons from the nearest hydroxyl groups
are equivalent to the HO2 radical in the (100) mirror plane. Moreover, the increased
distance from the water molecule to the protons of the nearest hydroxyl groups in the
optimized Im structure can explain the smaller proton superhyperfine coupling
constants at 7 K relative to those at 110 K (Table 7.1).
7.4 Conclusions
Single-crystal EPR spectra of gamma-ray-irradiated hemimorphite, measured
from 275 K to 4 K, disclose a HO2 radical. The spectral variations of this HO2 radical

209
show that hemimorphite undergoes two reversible phase transitions at ~98 K and ~21
K. The best-fit spin-Hamiltonian parameters, including 1H superhyperfine coupling
constants, at 110 K show that the HO2 radical takes the position of the H2O molecule
in the structural channel and interacts with two equivalent protons of the closest
hydroxyl groups. Data-fitting results of spectra at 85 K and 40 K confirm the
structural model of Libowitzky et al. (1998), which suggests that the water molecule
is displaced (and rotated) from the center of the channel, while the two hydroxyal
groups are not equivalent to the H2O molecule. Spin-Hamiltonian parameters fitted
from spectra collected at 7 K confirm that hemimorphite has a monoclinic structure
with completely ordered O-H systems below the phase transition at ~21 K.
7.5 References
ADAMO, C., & BARONE, V. (1999): Toward reliable density functional methods
without adjustable parameters: the PBE0 model. J. Chem. Phys., 110, 6158–6170
ADRIAN F. J., COCHRAN E. L., & BOWERS, V. A. (1967): ESR spectrum of HO2 in
argon at 4.2 K. J. Chem. Phys., 47, 5441-5442.
BARCLAY, G. A. & COX, E. G. (1960): The structure of hemimorphite. Z. Kristallogr.,
113, 23-29.
BEDNAREK, J. & PLONKA, A. (1987): Single-crystal electron spin resonance studies on
radiation-produced species in ice Ih. Part 2 – The HO2 radical. J. Chem. Soc., Faraday
Trans.1, 83(12), 3737-3747.

210
BISSENGALIYEVA, M.R., BEKTURGANOV, N.S. & GOGOL, D.B. (2010):
Thermodynamic characteristics of a natural zinc silicate hemimorphite. J. Therm.
Anal. Calorim. 101, 49-58.
BREUER, K., TELES, J.H., DEMUTH, D., HIBST, H., SCHÄFER, A., BRODE, S. &
DOMGÖRGEN, H. (1999): Zinc silicates: very efficient heterogeneous catalysts for the
addition of primary alcohols to alkynes and allenes. Angew. Chem. Int. Ed. 38,
1401–1405.
BROWN, K., MOMBOURQUETTE, M.J. & WEIL, J.A. (2003): EPR-NMR (Users’
Manual). Department of Chemistry, University of Saskatchewan, Saskatoon, SK.,
Canada.
CABALA, J., KRUPA, P. & MISZ-KENNAN, M. (2009): Heavy metals in mycorrhizal
rhizospheres contaminated by Zn-Pb mining and smelting around Olkusz in southern
Poland. Water Air Soil Pollution 199, 139-149.
CANO, N.F., GALLEGOS, E.A. & WATANABE, S. (2009): Phase change and
pyroelectricity in natural hemimorphite. Rad. Effects Defects Solids, 164, 748-754.
CATILLON-MUCHERIE, S., AMMARI, F., KRAFFT, J.-M., LAURON-PERNOT, H.,
TOUROUDE, R. & LOUIS, C. (2007): Preparation of coimpregnated Cu–Zn/SiO2
catalysts: Influence of the drying step on metallic particle size and on Cu0–ZnII
interactions. J. Phys. Chem. C 111, 11619–11626.
CATTON, R. C. & SYMONS, M. C. R. (1969): Unstable intermediates. Part LX. HO2
radical in γ-irradiated strontium chloride hexahydrate. J. Chem. Soc. A, 1393-1395.

211
CHUMAKOVA, N. A., & YANKOVA, T. S., & VOROBIEV, A. Kh. (2008): EPR study of
the orientation distribution function of HO2 radicals ordered by light irradiation. Appl.
Magn. Reson., 33, 117-126.
COOPER, B. J. & GIBBS, G. V. (1981): The effects of heating and dehydration on the
crystal structure of hemimorphite up to 600°C. Z. Kristallogr., 156, 305-321.
DACHS, E. & GEIGER, C.A. (2009): Heat-capacity behaviour of hemimorphite,
Zn4Si2O7(OH)2•H2O, and its dehydrated analogue Zn4Si2O7(OH)2: a calorimetric and
thermodynamic investigation of their phase transitions. Eur. J. Mineral. 21, 971–988.
DAY, S.J. & BOWELL, R.J. (2005): Atypical and typical zinc geochemistry in a
carbonate setting, Sä Dena Hes Mine, Yukon Territory, Canada. Geochem. Explor.
Environ. Analysis 5, 255-266.
DOVESI, R., SAUNDERS, V.R., ROETTI, C., ORLANDO, R., ZICOVICH-WILSON, C.M.,
PASCALE, F., CIVALLERI, B., DOLL, K., HARRISON, N.M., BUSH, I.J., D’ARCO, P.,
LLUNNELL, M. (2006): CRYSTAL 2006, User’s manual. University of Torino, Torino.
http://www.crystal.unito.it
ESPIARI, S., RASHCHI, F. & SADRNEZHAAD, S.K. (2006): Hydrometallurgical
treatment of tailings with high zinc content. Hydrometall. 82, 54–62.
FROST, R.L., BOUZAID, J.M. & REDDY, B.J. (2007): Vibrational spectroscopy of the
sorosilicate mineral hemimorphite Zn4(OH)2Si2O7•H2O. Polyhedron 26, 2405–2412.
GALLEGOS E.A., CANO N.F., WATANABA S., & CHUBACI J.D.F. (2009):
Thermoluminescence, infrared reflectivity and electron paramagnetic resonance
properties of hemimorphite. Rad. Measur. 44, 11-17.

212
GEIGER, C.A. & DACHS, E. (2009): Quasi-ice-like Cp behavior of molecular H2O in
hemimorphite Zn4Si2O7(OH)2•H2O: Cp and entropy confined H2O in microporous
silicates. Am. Mineral. 94, 634–637.
HILL, R.J., GIBBS, G.V., CRAIG, J.R., ROSS, F.K. & WILLIAMS, J.M. (1977): A
neutron diffraction study of hemimorphite. Zeit. Kristal. 146, 241–259.
JAFFE, J.E., & HESS, A.C. (1993): Hartree-Fock study of phase changes in ZnO at high
pressure. Phys. Rev. B 48, 7903-7909.
KOLESOV, B. (2006): Raman investigation of H2O molecule and hydroxyl groups in
the channels of hemimorphite. Amer. Mineral. 91, 1355–1362.
Lang R, Calvo C, Datars WR (1977) Phase transformation in AlPO4 and quartz
studied by electron paramagnetic resonance of Fe3+. Can. J. Phys. 55:1613-1620.
Li, Z. & Pan, Y. (2012) First-principles calculations of the E'1 center in quratz:
Structural models, 29Si hyperfine parameters and association with Al impurity. In J.
Goetze and R. Mockel, eds., Quartz: Deposits, Mineralogy and Analytics,
Springer-Verlag, Berlin, 161-175.
LIBOWITZKY, E. & ROSSMAN, G.R. (1997): IR spectroscopy of hemimorphite between
82 and 373 K and optical evidence for a low-temperature phase transition. Eur. J.
Mineral. 9, 793-802.
MAO, M., LIN, J. & PAN, Y. (2010): Hemimorphite as a natural sink for arsenic in
zinc deposits and related mine tailings: Evidence from single-crystal EPR
spectroscopy and hydrothermal synthesis. Geochim. Cosmochim. Acta 74, 2943-2956.

213
MAO, M. & PAN, Y. (2012): Nature of heavy metals in hemimorphite: A
cation-exchange and single-crystal EPR study. Can. Mineral. 49, 31-43.
MCDONALD, W. S. & CRUICKSHANK D. W. J. (1967): Refinement of the structure of
hemimorphite. Z. Kristallogr., 124, 180-191.
PERDEW, J. P., BURKE, K., & WANG, Y. (1996): Generalized gradient approximation
for the exchange-correlation hole of a many electron system. Phys. Rev. B 54,
16533-16539.
Pisani, C. (1996): Quantum-mechanical ab-initio calculation of the properties of
crystalline materials. Springer.
Pisani, C., Dovesi, R., Orlando, R. (1992): Near-Hartree-Fock wave functions for
solids: the case of crystalline silicon. Int. J. Quant. Chem. 42, 5–33.
RAE, A. D. (1969): Relationship between the experimental Hamiltonian and the point
symmetry of a paramagnetic species in a crystal. J.Chem.Phys., 50, 2672-2685.
RADHAKRISHNA, S., CHOWDARI, B. V. R., & KASIVISWANATH, A. (1976): EPR
studies of the hydroperoxy radical in X-irradiated single crystals of BaCl2•H2O. Chem.
Phys. Lett., 40, 134-138.
SCHAIDER, L.A., SENN, D.B., BRABANDER, D.J., MCCARTHY, K.D. & SHINE, J. P.
(2007): Characterization of zinc, lead, and cadmium mine waste: implications for
transport, exposure and bioavailability. Environ. Sci. Technol. 41, 4164–4171.
SERYOTKIN, Y.V. & BAKAKIN, V.V. (2011): Structural evolution of hemimorphite at
high pressure up to 4.2 GPa. Phys. Chem. Minerals 38, 679-684.

214
TAKÉUCHI, Y., SASAKI, S., & JOSWIG, W. (1978): X-ray and neutron diffraction study
of hemimorphite. Proc. Japan Acad., 54B, 577-582.
WALDER, I.F. & CHAVEZ, W.X.Jr. (1995): Mineralogical and geochemical behavior of
mill tailing material produced from lead-zinc skarn mineralization, Hanover, Grant
County, New Mexico, USA. Environ. Geol. 26, 1-18.
WYARD, S. J., SMITH, R. C., & ADRIAN F. J. (1968): ESR spectrum of HO2 in
solutions of hydrogen peroxide in water at 77 K. J. Chem.. Phys., 49, 2780-2783.
YURIEVA, T.M., KUSTOVA, G.N., MINYUKOVA, T.P., POELS, E.K., BLIEK, A.,
DEMESHKINA, M.P., PLYASOVA, L.M., KRIEGER, T.K. & ZAIKOVSKII, V. I. (2001):
Non-hydrothermal synthesis of copper-, zinc- and copper–zinc hydrosilicates. Mater.
Res. Innov. 5, 3–11.

215
CHAPTER 8
Conclusions
This single-crystal EPR spectroscopic study, supplemented by data from other
analytical techniques (FTIR, EMPA, and ICPMS), hydrothermal experiments, and
first-principles theoretical calculations, provides detailed structural models for several
important radiation-induced defects in apophyllites, prehnite, and hemimorphite, with
direct relevance and potential applications to remediation of heavy metalloid
contamination and nuclear waste disposal. Major findings of this study can be
summarized as follow:
1) EPR spectra reveal a NH2 radical in γ-ray irradiated fluorapophyllite. The
best-fit spin-Hamiltonian parameters show that the NH2 radical in
fluorapophyllite at room temperature resides at the K site and spins rapidly
along the molecule C2 axis, which coincides with the crystallographic c axis.
These results, together with data from FTIR and electron-microprobe
analyses, suggest that the NH2 radical is most likely formed from the
radiolysis of NH4+ ion. This is the first-ever report of the NH2 radical in the
mineral lattice.
2) Single-crystal EPR and ESEEM spectra reveal a radiation-induced O- center

216
and its biradical pairs in hydroxylapophyllite. The best-fit spin-Hamiltonian
parameters suggest that the O- center represents electron trapping on the
hydroxyl oxygen atom after removal of its proton. This model is further
supported by excellent agreements between the best-fit directions and
calculated distances of the O--O- biradical pairs with those of the
corresponding OH--OH- pairs. This O- center is bleached out at 300°C but
can be restored by γ-ray irradiation.
3) Single-crystal CW-EPR and pulsed ENDOR spectroscopic measurements,
along with isothermal and isochronal annealing experiments, allow a
detailed study of an Al-O- center in gamma-ray-irradiated prehnite. The
best-fit spin-Hamiltonian parameters show that this center corresponds to
hole trapping on the apical hydroxyl oxygen atom coordinated to Al at an
octahedral site. These results support the VIAl-O--VIAl model of Clozel et al.
(1995) for the radiation-induced B center in kaolinite.
4) Single-crystal EPR spectra of gamma-ray-irradiated hemimorphite (Mapimi,
Durango, Mexico) reveal the presence of [AsO4]4- and [AsO4]
2- centers.
These EPR results along with data from hydrothermal experiments show that
hemimorphite is capable of sequestering significant amounts of arsenate in
its crystal lattice, representing an important natural sink for As (and other
heavy metalloids) in supergene non-sulfide Zn deposits and Zn mine
tailings.
5) Spin-Hamiltonian parameters from single-crystal EPR spectra of
217
hemimorphite (Reneville, Congo) at 295 K and 120 K show that Cu2+
resides at the tetrahedral Zn site, not in the channels as previously suggested
by the powder EPR study of Gallegos et al. (2009). This result is consistent
with cation-exchange experiments that show Cu and As are not readily
exchanged. Cd and Pb in hemimorphite, on the other hand, are readily
exchanged and probably reside in the structural channels. These results
suggest that hemimorphite is potentially useful for remediation of heavy
metalloid contamination.
6) Single-crystal EPR spectra of gamma-ray-irradiated hemimorphite,
measured from 275 K to 4 K, reveal a hydroperoxy radical HO2. The EPR
spectra of this radical show that hemimorphite undergoes two reversible
phase transitions at ~98 K and ~21 K. The best-fit spin-Hamiltonian
parameters show that the HO2 radical occupies the position of the H2O
molecule and interacts with two protons from the closest hydroxyl groups.
Spin-Hamiltonian parameters obtained from spectra measured at 85 K and
40 K confirm the suggestion of Libowitzky et al. (1998) that the water
molecule is displaced (and rotated) from the center of the channel.
Spin-Hamiltonian parameters fitted from spectra measured at 7 K confirm
that hemimorphite has a monoclinic structure with completely ordered O-H
systems below the phase transition at ~21 K.
218
Appendix A
A review of EPR, ENDOR, and ESEEM techniques
A.1 Electron Paramagnetic Resonance Spectroscopy
Electron Paramagnetic Resonance (EPR) Spectroscopy, which is also called
Electron Spin Resonance (ESR) Spectroscopy, is a method to record the microwave
absorption of a sample in a magnetic field. EPR spectroscopy is widely used in
biochemistry, chemistry, geology, and physics.
The most remarkable feature of EPR is its capability to detect and distinguish
paramagnetic centers in very low concentration (0.1%-0.0001%; Marfunin 1979).
Therefore, EPR has been used for studying systems such as:
a) Free radicals in solid, liquid or aqueous phases;
b) Transition metal ions;
c) Various point defects in crystals
d) Systems with more than one unpaired electron (biradicals or triplet-state systems);
and
e) Systems with conducting electrons (metals and semiconductors; Weil & Bolton,
2007).

219
A.1.1 Fundamental Principles
Atoms and molecules both have electrons that surround their nuclei with
specific orbitals; these electrons also spin. Commonly, according to the Pauli
Exclusion Principle, if two electrons occupy the same sub-orbital, the energy of their
spins would counteract each other. So, when there is only one electron occupying the
electron sub-orbital, the spin is ½, producing a magnetic moment that can be oriented
in an external magnetic field. Here, the interaction between the magnetic moment
from an unpaired electron and the external magnetic field is called the Zeeman effect.
The orientation of the magnetic moment will be either similar or opposite to
the direction of the external magnetic field. Thus, two energy levels occur, designated
as ms= 1/2 and ms= -1/2.
When there is no external magnetic field, the two spin energy levels are
degenerated. Once the magnetic field is applied, the two energy levels start splitting,
and with the magnetic field rising, the splitting becomes larger and larger. If a
microwave of specific energy enters the system, it will be absorbed when the gap
between two energy levels is equal to the energy of the microwave emitted (Fig. A.1).
Here, the microwave energy ∆E = hν = E1/2-E-1/2, “ν” is the microwave
frequency. Since the Es = gµ0B0Ms, ∆E = hv = E1/2-E-1/2 = 1/2gµ0B0-(-1/2)gµ0B0 =
gβB0.
hv = gβB0 .............................................................................................................(A.1)
Where “g” is the Zeeman splitting factor and it is a dimensionless parameter; “β” is
the Bohr magneton and B0 is the external magnetic field.

220
Figure A.1 The scheme of the spin energy levels for EPR.
Usually, the unpaired electrons in some orbitals of paramagnetic defects will
be quenched by the orbital angular momentum and/or the crystal field (if in a solid).
Therefore, different “g” values reflect the orbital that the unpaired electron occupies,
or the symmetry of the crystal. If the unpaired electron stays on the ground state as a
free electron, the “g” value for that is called “ge”, which is equal to 2.0023.
Due to the influence of the orbital angular momentum and the crystal field, the
“g” values are useful for providing information about the nature, location and local

221
symmetry of paramagnetic defects. Because of the 3-dimensional structure of
paramagnetic defects, a “g” matrix is required to describe the Zeeman energy.
A.1.2 The spin Hamiltonian and g tensor
Besides the Zeeman Effect, there are several other factors that influence EPR
spectra, including the nuclear spin parameter “A”, electron quadrupole interaction
parameter “D”, and the nuclear quadrupole interaction parameter “P”; spin
Hamiltonian is used to describe the EPR spectra. In the spin-Hamiltonian, each
parameter has its own term, and all the factors in one center are summed together. For
example, for the atomic hydrogen (H0) system, there is only one unpaired electron and
a single nucleus with a nuclear spin number I =1/2, so the spin-Hamiltonian is: H =
geβeB0S+SAI- gnβnB0I.
The “A” parameter arises from interaction between the unpaired electron(s)
and a nucleus with non-zero nuclear spin. The nuclear spin splits the energy level(s)
from the unpaired electron into (2I+1) levels with the external magnetic field. That
makes the fine structure absorption line(s) also split into 2I+1 lines. This splitting is
also called the hyperfine splitting, and the lines are called the hyperfine structures.
When a center contains more than one unpaired electron (S>1/2), the
interaction between unpaired electrons will occur. This electronic quadrupole
interaction leads the energy levels to split without any external magnetic field, called
the initial splitting or zero-field splitting. Here, we use the “D” parameter to describe
the perturbation on the energy levels.

222
When nuclei have nuclear spin I>1/2, another parameter “P”, describing the
nuclear quadrupole interaction, is used in the spin-Hamiltonian. Just like the “D”
parameter, the “P” parameter also produces an initial splitting before an external
magnetic field is applied.
Besides the parameters mentioned above, other parameters such as the
fourth-degree parameters S4 and I4, and higher-order parameters may occur, but are
very small or not relevant to this work, and will not be discussed here.
For a single crystal, the paramagnetic centers could be isotropic or anisotropic
in local symmetry, so a tensor is involved in some parameters to describe the spin
Hamiltonian.
When an EPR measurement is taken to determine the local structural
information of paramagnetic defects in a single crystal, an experimental coordinate
system must be chosen. Commonly the X, Y, and Z axes are used in the orthogonal
coordinate system and these axes are not necessarily coincident with the
crystallographic axes. So, the external magnetic field B is Bcosθx, Bcosθy, Bcosθz,
corresponding to the experimental X, Y, Z axes. If one uses the “g” term as an
example and there is only the Zeeman term in a spin Hamiltonian, it will become:
H=βe[Bcosθx, Bcosθy, Bcosθz]ĝ
z
y
x
S
S
S
.....................................................................(A.2)
Here,

223
ĝ=
zzyzzx
yzyyyx
xzxyxx
ggg
ggg
ggg
Equation 1.2 also can be written as:
H= H=βeBTĝS ........................................................................................................(A.3)
Now, an effective magnetic field vector Beff is involved.
Beff=[ Bcosθx, Bcosθy, Bcosθz]ĝ ............................................................................(A.4)
and
H= βeSBeff ...........................................................................................................(A.5)
The “Beff” factor includes the relationship between the orientation of the
external magnetic field B, and that of the experimental coordinate system and the “g”
tensor. From the “Beff”, the orientation of the external magnetic field to the
experimental coordinate system for single crystals can be calculated. The “g” matrix
also can be calculated. After diagonalization of the “g” matrix, the principal values
and principal axis orientations corresponding to the experimental coordinate system
can be established for the center, and local structural information can then be obtained
(Weil & Bolton, 2007).
A.1.3 EPR Spectrometers
A basic magnetic-field-sweep EPR spectrometer requires a microwave bridge,
a variable magnetic field, a resonant cavity, a solid-state diode detector, and a
computer for data acquisition (Fig. 2). Usually, commercial EPR spectrometers

224
produced are operated in the X band (ν = ~9.3 GHz), K band (ν = ~24 GHz), Q band
(ν = ~36 GHz), and W band (ν = ~95 GHz) frequencies.
Following Figure A.2, a microwave of a specific frequency is produced from
the klystron, and enters through the isolator that makes the microwaves all vibrate in
the same orientation. The energy of microwave would be adjusted after it goes
through the attenuator. When the microwave reaches the directional coupler, it will be
divided into two parts: one is sent to the monitoring detector to record as a standard
for comparison, and another is sent to the resonant cavity. Once the microwave
reaches the detector, the detector can record the signal, and compare with the signal
from the monitoring detector to analysis the quantity of absorption. Finally, the signal
is amplified by the amplifier and recorded by the computer. During this process, the
intensity of the magnetic field is rising linearly in a specific range, and resonances
will happen in some magnetic field intensities depending on the sample in the cavity.
Therefore, in the final spectrum, the x-coordinate would be the intensity of magnetic
field in a range and the y-coordinate would be the intensity of absorption for the
invariable microwave. The EPR spectrum usually is differentiated once to make it
analysis convenient.
225
Figure A.2 Block diagram illustrating the basic components of an EPR spectrometer.
A.2 Electron-Nuclear double resonance spectroscopy
The electron-nuclear double resonance (ENDOR) spectroscopy is an advanced
EPR technique, and has been widely applied in chemistry, biochemistry, and
crystallography. Basically, the principle of ENDOR includes two steps: (1) an EPR
transition is saturated by an intense microwave (mw) field and (2) a radio frequency
(rf) induces nuclear spin transitions altering the populations of some of energy levels.
Because ENDOR can provide detailed information of nuclei that have small hyperfine
splitting, it is useful for studying molecular and electronic structures of paramagnetic
species (Gemperle & Schweiger, 1991; Kispert & Piekara-Sady, 2006; Kulik &
Lubitz, 2009; Nilges et al., 2009).

226
A.2.1 Fundamental Principles of CW ENDOR
In the beginning, the ENDOR experiments were run with continuous wave
(Keven & Kispert, 1976). In an S = 1/2 and I = 1/2 system, the energy levels of the
unpaired electron and nucleus are split by an external magnetic field, and a few
absorptions of an invariable microwave will be generated according to the magnetic
field (Figure A.3). If the magnetic field is fixed on a hyperfine line, the mw will
saturate this EPR transition. So, if a radio frequency is swept to this system, when the
rf matches to a NMR transition, the saturation of this EPR transition will be relieved.
Therefore, the ENDOR signal is actually the increase of the EPR signal due to the
relief of saturation (Eaton & Eaton, 2004; Kispert & Piekara-Sady, 2006).
Figure A.3 Energy level diagram for the case of S = 1/2, I = 1/2, and A/2 < vn.

227
To analyze ENDOR spectra, the energy levels have to be obtained from an
appropriate spin Hamiltonian. For a system with S = 1/2 and I ≥ 1/2, the spin
Hamiltonian would be expressed:
H = βBgS – gnβnBI +SAI + IPI ........................................................................(A.6)
the four terms from left to right are electronic Zeeman term, nuclear Zeeman term,
hyperfine interaction term, and nuclear quadrupole term, respectively. Here, the
nuclear quadrupole term is only present when I > 1/2. According to the EPR selecting
rules ∆mS = ±1 and ∆mI = 0, and NMR selecting rules ∆mS = 0 and ∆mI = ±1, if we
consider I = 1/2 and A is isotropic,
vENDOR± = |vn ± A/2| ........................................................................................(A.7)
here, the vn is the nuclear Larmor frequency which will decide the presence of
ENDOR lines. If |A|/2 > vn, the two ENDOR transitions are in the position of vn ±
|A|/2, and if |A|/2 < vn the two ENDOR transitions will present at |A|/2 ±vn. When I >
1/2, the ENDOR transitions are also affected by the nuclear quadrupole term.
A disadvantage of CW ENDOR is that the intensity of the ENDOR transition
lines is only a few percent of their corresponding EPR transitions (Gemperle &
Schweiger, 1991; Kispert & Piekara-Sady, 2006), and CW ENDOR relies on a
delicate balance of relaxation times, which can be difficult to achieve for some
samples (Eaton & Eaton, 2004; Kispert & Piekara-Sady, 2006). However, pulsed
ENDOR methods have been developed rapidly since 1960s (Mims, 1965; Gemperle
& Schweiger, 1991). Unlike CW ENDOR, the entire sequence of pulsed ENDOR can
be made short enough to exclude unwanted relaxation effects, and the pulsed ENDOR
228
efficiency can be up to 100%. Moreover, pulsed ENDOR also has more ways to
manipulate the electron-nuclear spin system to simplify some complicated spectra
(Gemperle & Schweiger, 1991; Chasteen & Snetsinger, 2000).
A.2.2 Fundamental Principles of pulsed ENDOR
There are two mainly used ENDOR pulse sequences, which are called “Davies
ENDOR” and “Mims ENDOR”. Each of them is based on the impact of rf pulses on
the intensity of a spin echo that is produced by three pulses of mw frequency
(Gemperle & Schweiger, 1991; Eaton & Eaton, 2004). Due to the produced electron
spin echo, pulsed ENDOR can also be called ESE-ENDOR. In Davies ENDOR, an
mw pulse sequence of “π − T − π/2 − τ − π − τ − echo” is applied, whereas the rf is
used between the first and second pulses. On the other hand, in Mims ENDOR, an
mw pulse sequence of “π/2 − τ − π/2 − T − π/2 − τ − echo” is applied, whereas the rf
is used between the second and third pulses (Figure A.4). The Mims ENDOR is
particularly effective for weakly coupled nuclei, but has some “blind” points, while
the Davies ENDOR is useful for systems with large hyperfine interaction. Therefore,
both pulse sequence methods have usually been used together for collecting more
comprehensive data (Gemperle & Schweiger, 1991; Kispert & Piekara-Sady, 2006;
Eaton & Eaton, 2004; Kulik & Lubitz, 2009).
Similarly to EPR spectroscopy, ENDOR also can be operated at X-band,
Q-band, K-band, W-band, and so on. Because Larmor frequency increases
proportionally to the external magnetic field but hyperfine splitting of specific nucleus

229
is independent of magnetic fields, the superimposed ENDOR signals of different
nuclei can be resolved by running in different magnetic fields (Eaton & Eaton, 2004;
Weil & Bolton, 2007; Kulik & Lubitz, 2009).
Figure A.4 The ENDOR pulse sequence: (a). Davies pulse sequence; (b). Mims pulse
sequence.
A.3 Electron spin echo envelope modulation spectroscopy
Electron spin echo envelope modulation spectroscopy (ESEEM) is a pulsed
EPR technique based on electron spin echo. Because the decay of primary electron
spin echoes are modulated with frequencies that correspond to nuclear frequencies
and their combinations, ESEEM is able to provide detailed nuclear structural
information of the neighboring unpaired electron, so it becomes very useful in

230
investigating hyperfine and nuclear quadrupole coupling in solids (Chasteen &
Snetsinger, 2000; Schweiger & Jeschke, 2001).
Fundamentally, an electron spin echo spectroscopy is formed from an echo as
a function of the pulse-interval time. The simplest electron spin echo requires two mw
pulses, and it is also known as a Hahn echo (Eaton & Eaton, 2004; Chasteen &
Snetsinger, 2000). In Hahn echo, the pulse sequence is “π/2 − T − π − T − echo”
(Figure A.5). Before the first pulse starts, the selected external magnetic field arranges
unpaired electrons precessing about the direction of the external magnetic field (z
axis). Here, these electrons can be seen as vectors. Then, a short microwave pulse will
be applied along the direction perpendicular to the external magnetic field. This
microwave will cause these vectors to rotate 90° (x axis). Because different spins have
slightly different Larmor frequencies, these spins are all precessing at different
frequencies and diverge from average. After a specific time t, another microwave
pulse will flip these vectors (i.e., spins) into 180°, so the faster and slower processing
spins will be interchanged, and through the same time t, the vectors will reconverge
and form echo which usually contains much electron and nuclear structural
information. At last, the echo intensity will be recorded as a function of t. After
Fourier transformation, the modulated echo decay curve becomes the spectrum of the
nuclear modulation frequencies (Eaton & Eaton, 2004; Chasteen & Snetsinger, 2000;
Schweiger & Jeschke, 2001).
For the two-pulse ESEEM, the linewidth of spectra is related to the phase
memory time Tm of the electron spins which is usually larger than that of the

231
homogeneous EPR. Furthermore, the phase memory time Tm(n) of nuclear spins is
commonly much longer than Tm. Therefore, the linewidth of two-pulse ESEEM
spectrum is commonly larger than that of EPR, and the resolution in two-pulse
ESEEM spectra may be inferior compared to ENDOR spectra. However, this
disadvantage could be overcome by the three-pulse ESEEM spectroscopy (Eaton &
Eaton, 2004; Schweiger & Jeschke, 2001).
Figure A.5 The ESEEM pulse sequence: (a). Hahn pulse sequence; (b). Mims pulse
sequence.
The sequence of three-pulse ESEEM is “π/2 − τ − π/2 − T − π/2 − τ − echo”.
Similarly with two-pulse ESEEM, the first pulse of three-pulse ESEEM has same
effect as that of two-pulse ESEEM. During the free evolution of the first time τ, the
electron coherence has evolved on a given electron transition, and then the second
pulse of π/2 is applied, which creates nuclear coherence and causes a coherence
branching. After another time interval of τ, a spin echo forms. Through an evolution

232
time T, the third π/2 pulse leads the nuclear coherence back to electron coherence
which may evolve on any electron transition during the third time interval τ. And,
finally, a stimulated echo forms, which is recorded as a function of τ (Eaton & Eaton,
2004; Chasteen & Snetsinger, 2000; Schweiger & Jeschke, 2001).
A main advantage of three-pulse ESEEM over two-pulse ESEEM is that the
decay of the spin echo is no longer governed by the phase memory time Tm (≈T2e),
and is actually related to the spin-lattice or longitudinal relaxation time of the electron
spin (T1e). Due to T1e ≥ T2e, the envelope decays more slowly in three-pulse ESEEM
than in two-pulse ESEEM, so spectra of three-pulse ESEEM give a better resolution
in general. However, the time τ between the first and second pulses has to be added as
“dead time” of the instrument. Therefore, some rapidly decaying modulation can be
missed. To investigate these kinds of modulations, two-pulse sequence is used
(Chasteen & Snetsinger, 2000).
A.4 References.
CHASTEEN, N. D. & SNETSINGER, P. A. (2000) ESEEM and ENDOR spectroscopy.
Physical Methods in Bioinorganic Chemistry Spectroscopy and Magnetism, 187-231.
EATON, G. R. & EATON, S. S. (2004) Electron-nuclear double resonance spectroscopy
and electron spin echo envelope modulation spectroscopy. Comprehensive
coordination chemistry II, 2, 49-55.
GEMPELE, C. & SCHWEIGER, A. (1991) Pulsed electron-nuclear double resonance
methodology. Chem. Rev., 91, 1481-1505.

233
KISPERT, L. D. & PIEKARA-SADY, L. (2006) ENDOR spectroscopy. Handbook of
Applied Solid State Spectroscopy, 151-199.
KULIK, L. & LUBITZ, W. (2009) Electron-nuclear double resonance. Photosynth. Res.,
102, 391-401.
MARFUNIN, A. S. (1979) Spectroscopy, luminescence and radiation centers in minerals.
Springer-verlag berlin Heidelberg New York.
MIMS, W. B. (1965) Pulsed ENDOR experiments. Proc. R. Soc. Lond. A, 283,
452–457
NILGES, M. J., PAN, Y., AND MASHKOVTSEV, R. I. (2009) Radiation-induced defects in
quartz III. Single-crystal EPR, ENDOR, and ESEEM study of a peroxy radical. Phy.
Chem. Minerals, 36, 61-73.
SCHWEIGER, A. & JESCHKE, G. (2001) Principles of pulse electron paramagnetic
resonance. Oxford Univerisity Press.
WEIL, J. A., & BOLTON, J. R. (2007): Electron paramagnetic resonance, elementary
theory and practical applications. Wiley Interscience.

234
Appendix B
Summary of EPR sample preparation, experimental methods, EPR
spectra, data-fitting input, and output files.
This appendix summarizes data about the sample preparations for EPR
analyses, experimental methods, and a list of all EPR spectra, as well as a list of input
and output files for fitting spin-Hamiltonian parameters in this thesis. My purpose is
to provide detailed experimental procedures as a reference for further single-crystal
EPR experiments.
B.1 Sample preparation.
For single-crystal EPR experiments in this thesis, all mineral samples were
measured in NMR or EPR tubes, which have been shown to contain no paramagnetic
signals at RT. Therefore, samples have been cut to fit into NMR tubes (5 mm in
diameter) or EPR tubes (3 mm in diameter). Because of the sealing issues at cryostat
temperatures, NMR tubes were used only for room temperature experiments, whereas
EPR tubes were used for both room- and cryostat-temperature experiments.
To select the best crystal for EPR experiments, a few crystals with appropriate
sizes (usually less than 5 mm or 3 mm in diameter) were first manually removed from
a hand specimen. These crystals were then been examined carefully under a petrologic

235
microscope to avoid twinning, cracking, and visible inclusions, which could all
influence the EPR signal. The selected crystals were then fit in a NMR or EPR tube in
different orientations. Sand paper may be used to grind down some large crystals.
Mineral powders were obtained by grinding in a ceramic mortar for about 15
minutes and weighed for ~0.15 gram for collecting EPR spectra. The selected crystals
for produce powder samples were also usually examined for purity under a binocular
microscopy.
B.2 EPR experiments
To obtain sufficient data for fitting spin-Hamiltonian parameters, the
single-crystal EPR spectra usually have to be collected on more than one experimental
plane, and three experimental planes would be the most desirable.
In a single-crystal EPR experiment, the selected crystal is glued by vacuum
grease on the top of a plastic rod that is inserted into a NMR/EPR tube. Between the
rod and the tube, suitable adhesive tape is glued on the rod to avoid movement of the
rod and the tube. The top part of the tube is attached to a goniometer (a home-made
goniometer for NMR tubes and the Bruker ER218G1 goniometer for EPR tubes), and
the bottom part (i.e. where the crystal lies) is located at the center of the resonance
cavity for achieving the strongest signal. For experiments at room temperature, the
crystal is glued on different faces/cleavage planes for collecting spectra. For most
planes, an angle interval of 5° is used for a rotation of 180°, except for a case where
236
angle intervals from 1° to 20° are required due to analytical requirements or
experimental issues (e.g., sample frozen, cavity unbalanced, etc.).
At cryogenic temperatures, the data collection of single-crystal EPR
experiments is the same with that at room temperature, but the experimental system is
much more complicated and requires a cryostat inside the resonant cavity. The tube,
which is sealed by parafilm, is inserted into the cryostat, while an O ring seals the
connection between the tube and the goniometer. Below the bottom of the tube, there
is a thermometer connected to a wire heater. The nitrogen/helium gas flows from the
bottom of the cryostat. Through manipulating the flowing volume of liquid
nitrogen/helium and the power of the wire heater, the temperature inside the resonant
cavity can be controlled. The nitrogen/helium gas is sucked through a pipe on the
other side of the cryostat. Depending on the flowing volume of liquid nitrogen/helium,
the internal pressure of the cryostat is about 200 to 500 mbar (Figure B.1). Commonly,
it takes approximately one hour for the crystal to cool down to (and equilibrate) the
desired temperature, and then spectral collection can start.
237
Figure B.1 The cryostat system of EPR experiments.

238
B.3 Radiation and Annealing procedures
To produce or enhance the paramagnetic centers in minerals, artificial
radiation experiments at room temperature were made in a 60Co source (γ-ray) that has
a dose rate of ~7.49 Gy/min. Mineral samples for γ-ray irradiation are loaded in a
glass vial. For specific radiation doses, the radiation time varies from 1 hour to 5 days
or longer. After γ-ray irradiation, samples were immediately transferred to the EPR
cavity for analysis (and a few cases kept in dark), because some centers decay quickly
when they are exposed to light.
All annealing experiments were made in a Muffle furnace (Thermolyne model
47900). Samples in ceramic or platinum crucibles were put into the Muffle furnace
after the set temperature stabilized. Depending on different research purposes, the
annealing time varies from 1 minute to a few hours at different temperatures.
B.4 List of EPR spectra and data-fitting files
In this thesis, single-crystal EPR spectra of apophyllites have been collected in
two orthogonal planes (Figure B.2a), and single-crystal EPR spectra of prehnite and
hemimorphite have been collected in three orthogonal planes (Figure B.2b,c). The
EPR spectra and their corresponding data-fitting files have been listed in Table B.1,
and saved in a supplementary file.
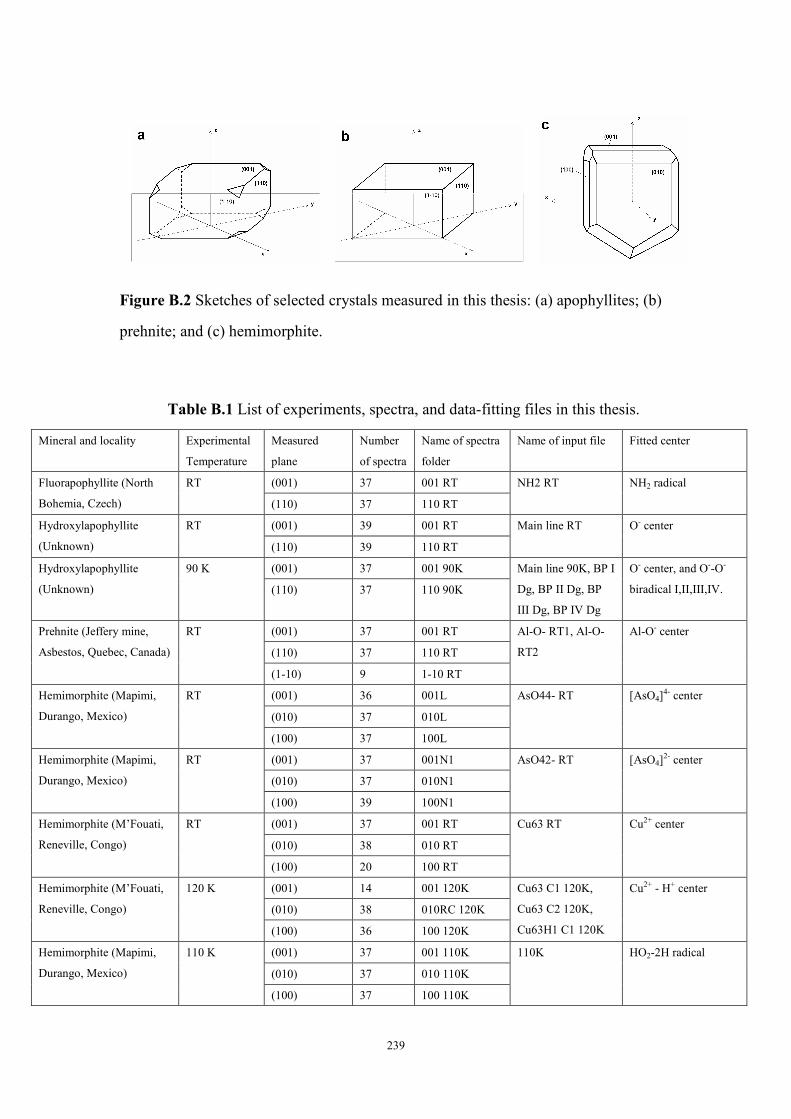
239
Figure B.2 Sketches of selected crystals measured in this thesis: (a) apophyllites; (b)
prehnite; and (c) hemimorphite.
Table B.1 List of experiments, spectra, and data-fitting files in this thesis.
Mineral and locality Experimental
Temperature
Measured
plane
Number
of spectra
Name of spectra
folder
Name of input file Fitted center
(001) 37 001 RT Fluorapophyllite (North
Bohemia, Czech)
RT
(110) 37 110 RT
NH2 RT NH2 radical
(001) 39 001 RT Hydroxylapophyllite
(Unknown)
RT
(110) 39 110 RT
Main line RT O- center
(001) 37 001 90K Hydroxylapophyllite
(Unknown)
90 K
(110) 37 110 90K
Main line 90K, BP I
Dg, BP II Dg, BP
III Dg, BP IV Dg
O- center, and O--O-
biradical I,II,III,IV.
(001) 37 001 RT
(110) 37 110 RT
Prehnite (Jeffery mine,
Asbestos, Quebec, Canada)
RT
(1-10) 9 1-10 RT
Al-O- RT1, Al-O-
RT2
Al-O- center
(001) 36 001L
(010) 37 010L
Hemimorphite (Mapimi,
Durango, Mexico)
RT
(100) 37 100L
AsO44- RT [AsO4]4- center
(001) 37 001N1
(010) 37 010N1
Hemimorphite (Mapimi,
Durango, Mexico)
RT
(100) 39 100N1
AsO42- RT [AsO4]2- center
(001) 37 001 RT
(010) 38 010 RT
Hemimorphite (M’Fouati,
Reneville, Congo)
RT
(100) 20 100 RT
Cu63 RT Cu2+ center
(001) 14 001 120K
(010) 38 010RC 120K
Hemimorphite (M’Fouati,
Reneville, Congo)
120 K
(100) 36 100 120K
Cu63 C1 120K,
Cu63 C2 120K,
Cu63H1 C1 120K
Cu2+ - H+ center
(001) 37 001 110K
(010) 37 010 110K
Hemimorphite (Mapimi,
Durango, Mexico)
110 K
(100) 37 100 110K
110K HO2-2H radical

240
(001) 37 001 85K
(010) 43 010 85K
Hemimorphite (Mapimi,
Durango, Mexico)
85 K
(100) 37 100 85K
85K HO2-2H radical
(001) 36 001 40K
(010) 37 010 40K
Hemimorphite (Mapimi,
Durango, Mexico)
40 K
(100) 38 100 40K
40K HO2-2H radical
4 K (001) 10 001 4K
6 K (010) 6 010 6K
8 K (010) 8 010 8K
9 K (010) 6 010 9K
3 K (100) 16 100 3K
Hemimorphite (Mapimi,
Durango, Mexico)
11 K (100) 4 100 11K
7K HO2-2H radical

241
Appendix C
Summary of EMPA and ICPMS data
Electron microprobe analysis (EMPA) and inductively coupled plasma mass
spectrometry (ICPMS) were used to determine the major, minor and trace elements of
selected minerals. As a supplement of compositiobal data in this thesis, this appendix
also includes detection limits and uncertainties for EMPA and ICP-MS data.
C. 1 EMPA data
Electron microprobe analyses were preformed on a JEOL JXA-8600
Superprobe electron microprobe analyzer in the Department of Geological Science,
University of Saskatchewan, which is equipped with three wavelength dispersive
spectrometers (WDS). Analytical conditions included an accelerating voltage of 15
kV, beam current of 10 nA, beam diameter of ~ 5 µm and the following standards:
quartz (Si), jadeite (Na), magnetite (Fe), diopside (Ca), sanidine (K), fluorite (F), γ-Al
garnet (Al), and tugtapite (Cl).
Tables C.1 and C.2 include the raw data of EMPA analyses of fluorapophyllite,
hydroxylapophyllite, and prehnite. Table C.3 reports the detection limit of each
element analyzed, which is the minimal peak to background ratio that is measurable,
and depends on x-ray counting times (usually longer is better), the standard sample
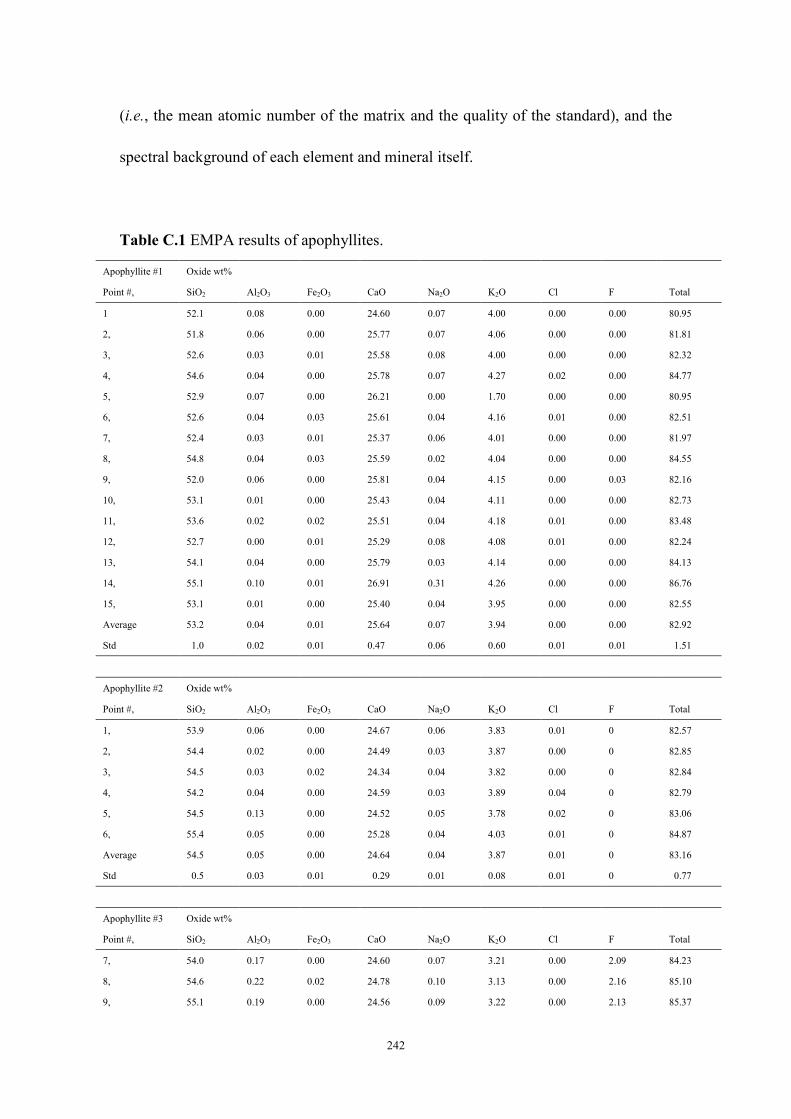
242
(i.e., the mean atomic number of the matrix and the quality of the standard), and the
spectral background of each element and mineral itself.
Table C.1 EMPA results of apophyllites.
Apophyllite #1 Oxide wt%
Point #, SiO2 Al2O3 Fe2O3 CaO Na2O K2O Cl F Total
1 52.1 0.08 0.00 24.60 0.07 4.00 0.00 0.00 80.95
2, 51.8 0.06 0.00 25.77 0.07 4.06 0.00 0.00 81.81
3, 52.6 0.03 0.01 25.58 0.08 4.00 0.00 0.00 82.32
4, 54.6 0.04 0.00 25.78 0.07 4.27 0.02 0.00 84.77
5, 52.9 0.07 0.00 26.21 0.00 1.70 0.00 0.00 80.95
6, 52.6 0.04 0.03 25.61 0.04 4.16 0.01 0.00 82.51
7, 52.4 0.03 0.01 25.37 0.06 4.01 0.00 0.00 81.97
8, 54.8 0.04 0.03 25.59 0.02 4.04 0.00 0.00 84.55
9, 52.0 0.06 0.00 25.81 0.04 4.15 0.00 0.03 82.16
10, 53.1 0.01 0.00 25.43 0.04 4.11 0.00 0.00 82.73
11, 53.6 0.02 0.02 25.51 0.04 4.18 0.01 0.00 83.48
12, 52.7 0.00 0.01 25.29 0.08 4.08 0.01 0.00 82.24
13, 54.1 0.04 0.00 25.79 0.03 4.14 0.00 0.00 84.13
14, 55.1 0.10 0.01 26.91 0.31 4.26 0.00 0.00 86.76
15, 53.1 0.01 0.00 25.40 0.04 3.95 0.00 0.00 82.55
Average 53.2 0.04 0.01 25.64 0.07 3.94 0.00 0.00 82.92
Std 1.0 0.02 0.01 0.47 0.06 0.60 0.01 0.01 1.51
Apophyllite #2 Oxide wt%
Point #, SiO2 Al2O3 Fe2O3 CaO Na2O K2O Cl F Total
1, 53.9 0.06 0.00 24.67 0.06 3.83 0.01 0 82.57
2, 54.4 0.02 0.00 24.49 0.03 3.87 0.00 0 82.85
3, 54.5 0.03 0.02 24.34 0.04 3.82 0.00 0 82.84
4, 54.2 0.04 0.00 24.59 0.03 3.89 0.04 0 82.79
5, 54.5 0.13 0.00 24.52 0.05 3.78 0.02 0 83.06
6, 55.4 0.05 0.00 25.28 0.04 4.03 0.01 0 84.87
Average 54.5 0.05 0.00 24.64 0.04 3.87 0.01 0 83.16
Std 0.5 0.03 0.01 0.29 0.01 0.08 0.01 0 0.77
Apophyllite #3 Oxide wt%
Point #, SiO2 Al2O3 Fe2O3 CaO Na2O K2O Cl F Total
7, 54.0 0.17 0.00 24.60 0.07 3.21 0.00 2.09 84.23
8, 54.6 0.22 0.02 24.78 0.10 3.13 0.00 2.16 85.10
9, 55.1 0.19 0.00 24.56 0.09 3.22 0.00 2.13 85.37

243
10, 54.8 0.19 0.00 24.51 0.09 3.16 0.01 2.08 84.93
11, 54.9 0.19 0.01 24.56 0.10 3.20 0.01 2.12 85.12
12, 54.0 0.10 0.00 24.60 0.06 3.27 0.01 2.09 84.21
Average 54.6 0.18 0.01 24.60 0.09 3.19 0.00 2.11 84.82
Std 0.4 0.04 0.01 0.08 0.01 0.04 0.01 0.03 0.44
Table C.2 EMPA results of prehnite.
Prehnite #1 Oxide wt%
Point #, SiO2 Al2O3 Fe2O3 CaO Na2O K2O Cl F Total
1, 41.7 23.17 0.07 26.98 0.00 0.00 0.03 0.00 91.97
2, 43.1 24.51 0.06 26.28 0.09 0.04 0.01 0.00 94.10
3, 44.3 24.26 0.04 27.38 0.08 0.01 0.02 0.01 96.17
4, 44.1 24.19 0.07 26.17 0.03 0.01 0.01 0.00 94.68
5, 43.8 24.30 0.01 27.10 0.05 0.01 0.01 0.00 95.37
6, 42.9 24.57 0.03 25.78 0.05 0.03 0.00 0.00 93.40
7, 43.3 24.24 0.00 27.25 0.00 0.20 0.00 0.15 95.18
8, 43.7 24.75 0.08 26.58 0.05 0.00 0.02 0.00 95.19
9, 42.7 25.02 0.05 26.35 0.05 0.00 0.02 0.00 94.24
10, 43.5 24.87 0.11 26.68 0.06 0.00 0.00 0.00 95.27
Average 43.3 24.38 0.05 26.65 0.05 0.03 0.01 0.01 94.55
Std 0.7 0.49 0.03 0.56 0.03 0.06 0.01 0.04 1.19
Table C.3 Detection limits of EMPA analyses.
Element Standard MDL(wt%) MDL(ppm)
Si quartz 0.0093 93
F fluorite 0.0652 652
Cl tugtapite 0.0124 124
K sanidine 0.0104 104
Na jadeite 0.0113 113
Al γ-Al garnet 0.0094 94
Fe magnetite 0.0315 315
Ca diopside 0.0113 113
C. 2 ICP-MS data
All ICP-MS analyses were made by using a Perkin-Elmer Sciex Elan 5000
instrument in the Department of Geological Science, University of Saskatchewan. The

244
crystals used for ICP-MS analyses were first examined with a binocular microscope to
minimize impurities, and then grinded into powder in a ceramic mortar. The
HF-HNO3 method was used to dissolve samples for ICP-MS analyses.
Trace elements of hydroxylapophyllite, hemimorphite, and solution and
minerals from cation-exchange experiments are given in this appendix. BCR-2 (Basalt,
Columbia River) was used as a standard during ICPMS analyses. The detection limit
of each element from ICPMS is calculated from the following equation:
Det.Lmt. = 3 • STD(BK) • C(std A,B)/I(std A,B) • DilF....................................(C.1)
where the STD(BK) is the relative standard deviation of blank, C(std A,B) is the
concentration of calibration standard, I(std A,B) is the intensity of calibration standard,
and DilF is the dilution factor.
Table C.4 ICP-MS data of hydroxylapophyllite (analyzed on 12th Oct. 2007).
Element
Hydroxla-
pophyllite BCR-2 BCR-2
BCR-2,
reference
value BCR-2/rec BCR-2/rec DilF
Det. lmt.
(ppm)
Li 0.28 7.9 11 9 88% 123% Li 7 0.002
Be ud ud ud - - - B 11 0.83
Sc 16.4 42 35 33 128% 107% Sc 45 0.002
V 3.3 523 453 416 126% 109% V 51 0.001
Rb 164 48.8 47 48 102% 98% Rb 85 0.0002
Sr 8.6 361 342 346 105% 99% Sr 88 0.006
Y 0.38 36 33 37 99% 91% Y 89 0.0001
Zr 1.7 200 189 188 107% 101% Zr 90 0.0001
Nb 0.41 14.3 13 14 102% 94% Nb 93 0.0001
Mo 0.41 286 273 248 115% 110% Mo 95 0.0006
Cs 0.93 1.09 1.08 1.1 99% 98% Cs 133 0.0001
Ba 2.2 692 672 683 101% 98% Ba 137 0.0008
La 2.4 25.9 24.8 25 104% 99% La 139 0.0001
Ce 2.1 57.4 54.3 53 108% 102% Ce 140 0.0001
Pr 0.17 7.0 7.0 6.8 104% 104% Pr 141 0.0001

245
Nd 0.61 29.5 27.7 28 106% 99% Nd 145 0.0003
Sm 0.10 6.8 6.2 6.7 102% 93% Sm 147 0.0002
Eu 0.13 2.08 1.92 2 104% 96% Eu 151 0.0001
Gd 0.17 7.5 6.9 6.8 111% 102% Gd 157 0.0004
Tb 0.02 1.14 1.09 1.07 107% 102% Tb 159 0.0001
Dy 0.11 6.5 6.4 6.3 104% 102% Dy 163 0.0001
Ho 0.01 1.29 1.31 1.33 97% 98% Ho 165 0.0001
Er 0.01 3.95 3.76 3.8 104% 99% Er 167 0.0001
Tm 0.00 0.53 0.51 0.54 98% 95% Tm 169 0.0001
Yb 0.01 3.46 3.28 3.5 99% 94% Yb 173 0.0001
Lu 0.01 0.52 0.48 0.51 101% 95% Lu 175 0.0001
Hf 0.50 4.7 5.0 4.8 99% 106% Hf 178 0.0001
Ta 0.03 0.78 0.78 0.81 96% 96% Ta 181 0.0001
Tl 0.02 0.26 0.26 - - - Tl 205 0.0002
Pb 2.68 9.7 10.2 11 89% 93% Pb 208 0.004
Bi 0.02 0.05 0.05 0.047 97% 98% Bi 209 0.0001
Th 0.12 6.19 6.5 6.2 100% 106% Th 232 0.0001
U 0.16 1.60 1.73 1.69 95% 102% U 238 0.0001
Mg 27 28723 21706 21600 133% 100% Mg 26 0.01
P 26 1808 1588 1527.4 118% 104% P 31 0.10
Ti 28 16603 13789 13548.7 123% 102% Ti 47 0.007
Cr 12 19.25 17.25 18 107% 96% Cr 52 0.001
Mn 2.11 1713 1521 1520 113% 100% Mn 55 0.002
Fe 209 105154 93676 96521 109% 97% Fe 54 0.10
Co 0.93 38.3 36.4 37 104% 98% Co 59 0.0004
Ni 7.8 17.2 15.4 13 133% 118% Ni 60 0.13
Cu 1.8 20.7 18.1 19 109% 96% Cu 65 0.003
Zn 17.6 134 131 127 106% 103% Zn 66 0.001
Ga 0.33 25.3 19.3 23 110% 84% Ga 69 0.0003
Ge ud ud ud - - - Ge 74 0.006
As 1.0 1.8 1.5 0.65 280% 240% As 75 0.006
Se ud ud 0.49 0.088 556% Se 77 0.02
Ag 0.38 ud ud - - - Ag 107 0.0001
Cd 0.14 0.20 0.13 - - - Cd 111 0.0006
Sn 0.68 5.2 5.8 2.7 195% 216% Sn 118 0.002
Sb 0.04 0.39 0.48 0.62 62% 78% Sb 121 0.0005
W 0.10 0.48 0.44 0.44 109% 101% W 182 0.0003
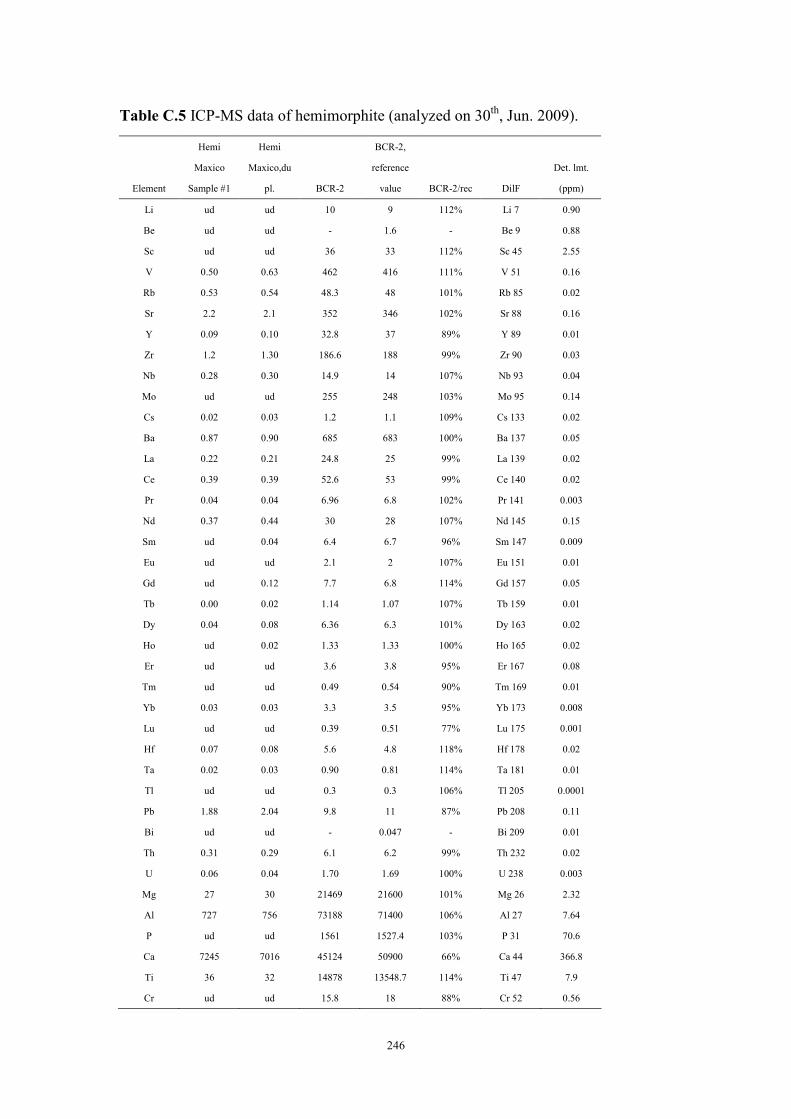
246
Table C.5 ICP-MS data of hemimorphite (analyzed on 30th, Jun. 2009).
Element
Hemi
Maxico
Sample #1
Hemi
Maxico,du
pl. BCR-2
BCR-2,
reference
value BCR-2/rec DilF
Det. lmt.
(ppm)
Li ud ud 10 9 112% Li 7 0.90
Be ud ud - 1.6 - Be 9 0.88
Sc ud ud 36 33 112% Sc 45 2.55
V 0.50 0.63 462 416 111% V 51 0.16
Rb 0.53 0.54 48.3 48 101% Rb 85 0.02
Sr 2.2 2.1 352 346 102% Sr 88 0.16
Y 0.09 0.10 32.8 37 89% Y 89 0.01
Zr 1.2 1.30 186.6 188 99% Zr 90 0.03
Nb 0.28 0.30 14.9 14 107% Nb 93 0.04
Mo ud ud 255 248 103% Mo 95 0.14
Cs 0.02 0.03 1.2 1.1 109% Cs 133 0.02
Ba 0.87 0.90 685 683 100% Ba 137 0.05
La 0.22 0.21 24.8 25 99% La 139 0.02
Ce 0.39 0.39 52.6 53 99% Ce 140 0.02
Pr 0.04 0.04 6.96 6.8 102% Pr 141 0.003
Nd 0.37 0.44 30 28 107% Nd 145 0.15
Sm ud 0.04 6.4 6.7 96% Sm 147 0.009
Eu ud ud 2.1 2 107% Eu 151 0.01
Gd ud 0.12 7.7 6.8 114% Gd 157 0.05
Tb 0.00 0.02 1.14 1.07 107% Tb 159 0.01
Dy 0.04 0.08 6.36 6.3 101% Dy 163 0.02
Ho ud 0.02 1.33 1.33 100% Ho 165 0.02
Er ud ud 3.6 3.8 95% Er 167 0.08
Tm ud ud 0.49 0.54 90% Tm 169 0.01
Yb 0.03 0.03 3.3 3.5 95% Yb 173 0.008
Lu ud ud 0.39 0.51 77% Lu 175 0.001
Hf 0.07 0.08 5.6 4.8 118% Hf 178 0.02
Ta 0.02 0.03 0.90 0.81 114% Ta 181 0.01
Tl ud ud 0.3 0.3 106% Tl 205 0.0001
Pb 1.88 2.04 9.8 11 87% Pb 208 0.11
Bi ud ud - 0.047 - Bi 209 0.01
Th 0.31 0.29 6.1 6.2 99% Th 232 0.02
U 0.06 0.04 1.70 1.69 100% U 238 0.003
Mg 27 30 21469 21600 101% Mg 26 2.32
Al 727 756 73188 71400 106% Al 27 7.64
P ud ud 1561 1527.4 103% P 31 70.6
Ca 7245 7016 45124 50900 66% Ca 44 366.8
Ti 36 32 14878 13548.7 114% Ti 47 7.9
Cr ud ud 15.8 18 88% Cr 52 0.56

247
Mn 0.98 0.98 1454 1520 110% Mn 55 0.06
Fe 67 62 93226 96521 97% Fe 54 6.41
Co 0.18 0.18 41 37 113% Co 59 0.07
Ni ud ud 12.6 13 98% Ni 60 0.48
Cu 357 350 23 19 128% Cu 65 0.64
Ga 81.91 80.96 23.6 23 103% Ga 69 0.27
Ge 0.28 0.26 - 1.5 - Ge 74 0.03
As 271 269 1.6 0.65 257% As 75 0.05
Ag 0.41 0.42 - 0.027 - Ag 107 0.01
Cd 26 26 - 0.13 - Cd 111 0.14
Sn 0.07 0.05 2.3 2.7 83% Sn 118 0.04
Sb 9.1 9.1 0.41 0.62 60% Sb 121 0.05
W 4.1 3.9 3.7 0.44 854% W 182 0.0001

24
8
Tab
le C
.6 I
CP
-MS
dat
a of
hem
imor
phit
e (a
naly
zed
on 2
6th, A
ug. 2
009)
.
Ele
men
t
Hem
i-
Chi
wan
a
Sam
ple
#4
Hem
i-
Dur
ango
2
Sam
ple
#2
Hem
i-
Dur
ango
3
Sam
ple
#3
Hem
i-
Elp
otos
i
Sam
ple
#5
Hem
i-
Pin
e C
reek
Sam
ple
#6
Hem
i-
Unk
now
n
B
CR
-2
BC
R-2
B
CR
-2
BC
R-2
,
refe
renc
e
valu
e B
CR
-2/r
ec
BC
R-2
/rec
B
CR
-2/r
ec
Det
. lm
t.
(ppm
)
Li
ud
2.8
ud
3.1
ud
ud
10.8
5.
9 ud
9
121%
66
%
- L
i 7
2.22
Be
ud
ud
ud
2.1
ud
ud
ud
ud
ud
2 -
- -
Be
9 0.
57
Sc
4.8
0.61
ud
ud
5.
5 8.
9 36
.4
36.6
36
.9
33
111%
11
1%
112%
S
c 45
0.
66
V
2.7
0.36
0.
53
0.29
0.
42
0.51
45
4 47
3 45
7 41
6 10
9%
114%
11
0%
V 5
1 0.
12
Rb
0.35
0.
25
0.23
0.
09
0.61
0.
49
45.8
46
.6
47.5
48
95
%
97%
99
%
Rb
85
0.02
Sr
0.30
6.
7 ud
ud
0.
43
0.65
33
5 33
4 34
0 34
6 97
%
97%
98
%
Sr
88
0.21
Y
0.14
0.
26
0.07
0.
06
0.13
0.
14
34.4
34
.1
34.5
37
93
%
92%
93
%
Y 8
9 0.
01
Zr
0.27
0.
11
0.08
0.
06
0.05
0.
37
188
190
189
188
100%
10
2%
101%
Z
r 90
0.
05
Nb
0.07
0.
02
0.01
0.
02
0.05
0.
04
14.7
14
.2
13.4
14
10
5%
102%
96
%
Nb
93
0.03
Mo
ud
0.22
ud
0.
24
ud
0.12
26
5 26
5 25
6 24
8 10
7%
107%
10
3%
Mo
95
0.11
Cs
0.11
0.
09
ud
ud
0.04
0.
02
1.04
1.
15
0.99
1.
1 94
%
104%
90
%
Cs
133
0.02
Ba
0.98
10
.8
0.62
0.
94
0.80
18
.2
665
678
668
683
97%
99
%
98%
B
a 13
7 0.
32
La
0.17
0.
20
0.07
0.
06
0.15
0.
16
25.3
26
.3
25.7
25
10
1%
105%
10
3%
La
139
0.02
Ce
0.26
0.
16
0.13
0.
10
0.26
0.
25
53.8
57
.5
54.3
53
10
2%
109%
10
3%
Ce
140
0.01
Pr
0.03
0.
05
0.02
0.
01
0.03
0.
04
6.9
7.5
7.1
6.8
102%
11
0%
104%
P
r 14
1 0.
01
Nd
0.08
0.
19
0.05
0.
05
0.09
0.
11
29.5
28
.5
30.9
28
10
6%
102%
11
0%
Nd
145
0.10
Sm
0.
57
0.14
ud
0.
29
0.25
0.
14
7.7
6.8
7.1
6.7
116%
10
2%
106%
S
m 1
47
0.10
Eu
ud
0.05
ud
ud
ud
ud
1.
86
2.13
1.
87
2 93
%
106%
94
%
Eu
151
0.02
Gd
0.25
0.
04
ud
ud
0.03
ud
6.
9 8.
1 8.
0 6.
8 10
3%
120%
11
8%
Gd
157
0.20
Tb
0.01
0.
00
ud
ud
ud
ud
1.11
1.
16
1.22
1.
07
104%
10
9%
114%
T
b 15
9 0.
02
Dy
ud
ud
ud
ud
ud
ud
6.6
6.2
6.9
6.3
106%
99
%
110%
D
y 16
3 0.
04
248

24
9
Ho
0.01
0.
00
ud
ud
0.00
0.
01
1.19
1.
5 1.
33
1.33
90
%
112%
10
0%
Ho
165
0.01
Er
0.02
0.
02
0.00
0.
01
0.00
0.
00
3.9
3.3
4.0
3.8
104%
87
%
106%
E
r 16
7 0.
10
Tm
0.
02
ud
ud
ud
ud
ud
0.52
0.
54
0.52
0.
54
97%
10
1%
97%
T
m 1
69
0.02
Yb
0.33
0.
15
0.29
0.
07
0.22
0.
07
3.3
3.2
3.7
3.5
94%
93
%
108%
Y
b 17
3 0.
04
Lu
ud
ud
ud
ud
ud
ud
0.53
0.
57
0.61
0.
51
105%
11
3%
119%
L
u 17
5 0.
04
Hf
ud
0.06
0.
01
ud
ud
0.01
5.
06
4.88
4.
77
4.8
105%
10
2%
99%
H
f 17
8 0.
04
Ta
0.05
0.
02
ud
0.02
ud
ud
0.
84
0.85
0.
75
0.81
10
3%
105%
93
%
Ta
181
0.01
Tl
ud
9.4
ud
0.06
ud
ud
0.
1 0.
31
0.26
0.
3 33
%
104%
86
%
Tl 2
05
0.03
Pb
389
1283
35
89
69
56
10
.2
9.5
9.8
11
93%
86
%
90%
P
b 20
8 0.
19
Bi
0.03
0.
01
ud
ud
ud
ud
ud
ud
ud
0.04
7 -
- -
Bi 2
09
0.01
Th
0.04
0.
03
0.03
0.
02
0.07
0.
07
6.0
5.8
5.8
6.2
97%
93
%
94%
T
h 23
2 0.
02
U
1.0
1.1
0.26
0.
26
0.20
0.
11
1.70
1.
55
1.68
1.
69
100%
92
%
99%
U
238
0.
03
Mg
29
14
32
ud
ud
26
2508
7 24
392
2212
2 21
600
116%
11
3%
102%
M
g 26
29
.1
Al
663
328
373
242
654
473
7962
7 78
290
7055
9 71
400
112%
11
0%
99%
A
l 27
4.8
P
47
ud
ud
ud
120
123
1544
15
11
1495
15
27.4
10
1%
99%
98
%
P 3
1 37
.1
Ca
644
3868
7 ud
26
9 ud
41
8.71
43
579
4832
0 53
318
5090
0 86
%
95%
10
5%
Ca
44
186.
3
Ti
50
23
23
13
39
32.3
5 14
264
1475
8 14
483
1354
8.7
105%
10
9%
107%
T
i 47
1.33
Cr
1.5
0.59
0.
49
0.44
0.
52
1.70
17
.3
17.2
13
.9
18
96%
96
%
77%
C
r 52
0.
31
Mn
3.2
6.2
7 38
5.
3 1.
2 16
88
1678
16
07
1520
11
1%
110%
10
6%
Mn
55
0.27
Fe
62
333
ud
ud
ud
ud
9937
5 98
417
9532
9 96
521
103%
10
2%
99%
Fe
54
46.7
Co
ud
0.27
ud
0.
23
0.11
ud
38
.8
39.3
38
.6
37
105%
10
6%
104%
C
o 59
0.
08
Ni
ud
1.8
1.3
ud
1.2
ud
12.3
9.
7 10
.8
13
95%
75
%
83%
N
i 60
1.17
Cu
1199
76
4 93
6 10
31
1001
80
5 19
.9
19.8
17
.6
19
105%
10
4%
93%
C
u 65
0.
56
Ga
110
114
124
125
23
27
23.0
24
.1
22.7
23
10
0%
105%
99
%
Ga
69
0.03
Ge
ud
1.1
ud
ud
0.14
3.
7 ud
ud
ud
1.
5 -
- -
Ge
74
0.13
As
36
6.0
127
18
38
3.3
0.86
0.
46
0.57
0.
65
132%
71
%
88%
A
s 75
0.
32
249

25
0
Se
ud
ud
ud
ud
ud
ud
ud
ud
ud
0.08
8 -
- -
Se
77
8.4
Ag
7.2
0.25
0.
49
0.41
0.
23
0.43
ud
ud
0.
18
0.02
7 -
- 68
2%
Ag
107
0.05
Cd
4.4
50.6
ud
0.
49
11
5.3
ud
ud
ud
0.13
-
- -
Cd
111
0.11
Sb
4.3
0.83
10
0.
99
6.8
0.31
0.
4 0.
69
0.3
0.62
68
%
111%
43
%
Sb
121
0.03
250

- 251 -
Table C.7 ICP-MS data of hemimorphite (analyzed on 22nd, Dec. 2009).
Element
Hemi, 79
Arizona
Sample #9
Hemi,
Bleiberg
Hemi,
Franklin
Sample #7
Hemi,
Reneville
Sample#10
Hemi,
Sterling
Sample #8 BCR-2
BCR-2,
reference
value BCR-2/rec DilF
Det. lmt.
(ppm)
Li 0.24 ud ud 0.44 1.2 11 9 122% Li 7 0.20
Be ud ud ud ud 1.3 1 2 48% Be 9 0.39
Sc ud ud 0.35 ud 1.8 35.2 33 107% Sc 45 0.29
V 11 0.05 2.3 0.38 5.3 478 416 115% V 51 0.02
Rb 0.26 0.10 0.13 0.25 2.6 48.5 48 101% Rb 85 0.08
Sr 23 20 17 21 28 330 346 97% Sr 88 0.02
Y 6.1 8.6 0.34 0.26 3.3 32.6 37 91% Y 89 0.02
Zr 0.75 0.20 0.12 0.18 1.9 175 188 95% Zr 90 0.01
Nb 0.23 0.09 0.19 0.24 0.45 12.2 14 89% Nb 93 0.01
Mo ud ud ud ud ud 253 248 102% Mo 95 0.42
Cs 0.06 ud ud ud 0.06 1.3 1.1 121% Cs 133 0.05
Ba 3.5 7.6 3.8 12 37 670 683 97% Ba 137 0.03
La 0.67 1.3 0.17 0.43 10 24.4 25 98% La 139 0.006
Ce 0.86 0.13 0.14 0.29 7.6 52.8 53 100% Ce 140 0.0005
Pr 0.18 0.25 0.03 0.05 1.5 6.9 6.8 106% Pr 141 0.002
Nd 0.87 1.1 0.14 0.19 5.9 31.3 28 109% Nd 145 0.001
Sm 0.23 0.16 0.01 ud 0.89 7.0 6.7 100% Sm 147 0.01
Eu 0.05 ud ud ud 0.18 2.1 2 106% Eu 151 0.05
Gd 0.56 0.33 0.04 0.03 0.79 7.0 6.8 107% Gd 157 0.02
Tb 0.08 0.06 ud ud 0.09 1.03 1.07 98% Tb 159 0.007
Dy 0.56 0.43 0.05 0.02 0.59 6.7 6.3 113% Dy 163 0.007
Ho 0.12 0.11 0.00 0.00 0.10 1.32 1.33 101% Ho 165 0.0001
Er 0.35 0.38 0.01 0.01 0.30 3.9 3.8 122% Er 167 0.006
Tm 0.03 0.05 ud ud 0.05 0.59 0.54 108% Tm 169 0.006
Yb 0.17 0.24 ud ud 0.26 3.9 3.5 109% Yb 173 0.02
Lu ud 0.02 ud ud ud 0.53 0.51 105% Lu 175 0.02
Hf 0.04 ud ud ud 0.03 5.0 4.8 109% Hf 178 0.02
Ta 0.01 ud ud 0.01 0.01 0.77 0.81 98% Ta 181 0.004
Tl 0.05 0.10 ud 0.11 0.07 ud 0.3 - Tl 205 0.03
Pb 163 347 3.7 435 31 11.3 11 103% Pb 208 0.01
Bi 0.39 ud 0.08 0.05 0.10 0.05 0.047 111% Bi 209 0.03
Th 0.12 0.04 0.02 0.04 0.29 5.8 6.2 93% Th 232 0.01
U 1.2 0.17 0.12 0.11 0.78 1.79 1.69 106% U 238 0.02
Mg 107 163 ud 49 199 23461 21600 109% Mg 26 19.4
Al 589 88 351 402 1777 77118 71400 108% Al 27 1.15
P 289 47 776 547 315 1348 1527.4 88% P 31 45.6
Ti 33 9.6 8.5 14 85 14845 13548.7 110% Ti 47 0.79
Cr 1.4 ud ud 0.35 2.1 15.2 18 84% Cr 52 0.34
Mn 57 20 5.8 15 314 1676 1520 110% Mn 55 0.15

- 252 -
Fe 466 ud 48 83 1236 96351 96521 100% Fe 54 35.2
Co 3.1 1.0 ud 0.03 0.27 38.8 37 105% Co 59 0.01
Ni 11 4.6 ud ud 2.8 16.2 13 125% Ni 60 0.95
Cu 1293 152 761 668 570 22 19 116% Cu 65 1.03
Zn 547958 26217 534541 546036 518035 134 127 106% Zn 66 6.43
Ga 116 8.8 139 113 110 21.7 23 94% Ga 69 0.08
Ge 0.34 ud 2.4 11 1.4 ud 1.5 - Ge 74 0.11
As 78 ud 200 338 275 ud 0.65 - As 75 2.24
Ag 2.1 0.07 0.17 0.31 0.36 ud 0.088 - Ag 107 0.02
Cd 38 336 1.6 4.6 2.6 ud 0.027 - Cd 111 0.16
Sn 0.26 0.20 0.23 0.21 0.38 3.56 2.69 132% Sn 118 0.13
Sb 0.28 0.09 0.50 0.26 7.4 0.18 0.62 29% Sb 121 0.03
W 0.12 ud ud ud 0.17 0.55 0.44 126% W 182 0.12
Table C.8 ICP-MS data of cation-exchange experiments (analyzed on 15th, Jun.
2011).
Element
0.1M/L
CaCl2
solution BCR-2
BCR-2,
reference
value BCR-2/rec DilF
Det. lmt.
(ppm)
Li 1.5 10 9 113% Li 7 0.002
Mg 0.74 22709 21600 105% Mg 26 0.00001
Al 0.01 73227 71400 103% Al 27 0.002
P ud 1501 1527.4 98% P 31 0.05
Ca 3000 45210 50900 89% Ca 44 0.005
Sc 0.01 39.5 33 120% Sc 45 0.0003
Ti 0.08 14510 13548.7 107% Ti 47 0.0007
V 0.02 459 416 110% V 51 0.001
Cr 0.02 11 18 64% Cr 52 0.002
Mn 0.01 1631 1520 107% Mn 55 0.0003
Fe 0.19 104729 96521 109% Fe 54 0.04
Co 0.01 37.5 37 101% Co 59 0.0003
Ni 0.05 10.6 13 82% Ni 60 0.0006
Cu 0.04 20.7 19 109% Cu 65 0.001
Zn 0.00 137 127 108% Zn 66 0.002
Ga 0.00 22.1 23 96% Ga 69 0.0002
Ge 0.00 ud 1.5 - Ge 74 0.0004
As 0.09 5. 0.65 781% As 75 0.0013
Rb 0.20 50 48 104% Rb 85 0.00002
Sr 55 363 346 105% Sr 88 0.0005
Y 0.18 37.6 37 102% Y 89 0.00004
Zr 0.00 193 188 103% Zr 90 0.0002

- 253 -
Nb ud 12.6 14 90% Nb 93 0.00001
Mo ud 251 248 101% Mo 95 0.0002
Ag ud ud 0.027 - Ag 107 0.00005
Cd 0.00 2.5 0.13 1987% Cd 111 0.0005
Sn 0.00 ud 2.7 - Sn 118 0.0002
Sb 0.00 0.34 0.62 55% Sb 121 0.0001
Cs 0.01 1 1.1 92% Cs 133 0.00002
Ba 0.02 717 683 105% Ba 137 0.00005
La 0.00 26.3 25 105% La 139 0.00004
Ce ud 53.8 53 102% Ce 140 0.00004
Pr ud 7.2 6.8 106% Pr 141 0.00004
Nd 0.00 30.4 28 109% Nd 145 0.00007
Sm 0.00 7 6.7 104% Sm 147 0.00007
Eu ud 1.9 2 95% Eu 151 0.00004
Gd 0.00 7.2 6.8 107% Gd 157 0.00004
Dy ud 6.22 6.3 99% Dy 163 0.0002
Ho 0.00 1.42 1.33 107% Ho 165 0.00001
Er ud 3.5 3.8 92% Er 167 0.00009
Tm ud 0.47 0.54 87% Tm 169 0.00001
Yb ud 4 3.5 116% Yb 173 0.0002
Lu ud 0.43 0.51 85% Lu 175 0.00005
Hf ud 5.3 4.8 110% Hf 178 0.00003
Ta 0.00 0.78 0.81 96% Ta 181 0.00003
W 0.00 ud 0.44 - W 182 0.00009
Tl 0.00 ud 0.3 - Tl 205 0.00001
Pb 0.00 11.3 11 103% Pb 208 0.0002
Th ud 7.3 6.2 117% Th 232 0.00005
U 0.00 1.82 1.69 108% U 238 0.00006
Table C.9 ICP-MS data of cation-exchange experiments (analyzed on 28th, Jun.
2011).
Element S1-3 S1-5 S1-7 S1-10 BCR-2
BCR-2,
reference
value BCR-2/rec DilF
Det. lmt.
(ppm)
Li 0.08 ud 0.50 ud 13 9 148% Li 7 0.002
Mg 11.6 7.6 1.8 6.1 20023 21600 93% Mg 26 0.005
Al 557 396 65 61 69137 71400 97% Al 27 0.001
P 3.0 11 2.6 8.1 1364 1527.4 89% P 31 0.05
Ca 3863 124 ud ud 58225 50900 114% Ca 44 9.3
Sc 0.00 ud ud ud 35 33 107% Sc 45 0.0007
Ti 25 16 2.1 4.8 13153 13548.7 97% Ti 47 0.005

- 254 -
V 0.13 0.04 0.03 ud 481 416 116% V 51 0.0003
Cr 1.3 2.3 0.32 5.7 18.2 18 101% Cr 52 0.003
Mn 8.7 8.2 1.3 1.5 1678 1520 110% Mn 55 0.0002
Fe 29 29 7.9 24 107984 96521 112% Fe 54 0.04
Co 0.04 0.04 0.06 0.10 45 37 122% Co 59 0.0002
Ni 1.8 4.4 0.71 3.9 20 13 157% Ni 60 0.0004
Cu 380 413 426 445 34 19 179% Cu 65 0.0006
Zn - - - - 160 127 126% Zn 66 0.59
Ga 92 85 90 102 21.7 23 95% Ga 69 0.0004
Ge 0.26 0.37 0.20 0.18 ud 1.5 - Ge 74 0.0004
As 275 267 264 269 ud 0.65 - As 75 0.001
Rb 0.19 0.07 0.02 0.02 48 48 100% Rb 85 0.0002
Sr 0.70 1.1 ud 0.31 364 346 105% Sr 88 0.0003
Y 0.11 0.06 0.04 0.04 34 37 94% Y 89 0.00003
Zr 77 63 13 15 207 188 111% Zr 90 0.00004
Nb 0.23 0.20 0.08 0.07 14.6 14 104% Nb 93 0.00005
Mo 0.28 0.09 ud 0.09 266 248 107% Mo 95 0.0004
Ag 0.46 0.36 0.26 0.19 ud 0.027 916% Ag 107 0.00015
Cd ud 0.18 0.05 ud 0.35 0.13 270% Cd 111 0.0004
Sn 0.10 1.0 2.8 0.02 4.3 2.7 160% Sn 118 0.0002
Sb 4.6 4.7 4.1 4.6 2 0.62 320% Sb 121 0.0001
Cs 0.03 0.01 0.00 ud 0.96 1.1 87% Cs 133 0.00006
Ba 0.64 0.28 0.03 ud 701 683 103% Ba 137 0.00009
La 0.12 0.06 0.03 0.01 25.8 25 103% La 139 0.00001
Ce 0.28 0.17 0.03 0.03 55 53 104% Ce 140 0.00008
Pr 0.01 0.03 ud ud 6.9 6.8 103% Pr 141 0.00003
Nd 0.07 0.04 ud ud 30.3 28 108% Nd 145 0.0003
Sm ud 0.02 ud ud 5 6.7 74% Sm 147 0.00008
Eu ud ud ud ud 2.07 2 103% Eu 151 0.00007
Gd ud 0.00 ud ud 6.6 6.8 97% Gd 157 0.0001
Dy ud 0.03 0.01 0.00 6.2 6.3 98% Dy 163 0.00004
Ho ud 0.00 ud ud 1.39 1.33 105% Ho 165 0.00003
Er ud 0.01 0.02 ud 4.6 3.8 122% Er 167 0.00004
Tm ud ud ud 0.00 0.57 0.54 105% Tm 169 0.00003
Yb ud 0.01 ud ud 3 3.5 86% Yb 173 0.0002
Lu ud ud 0.00 ud 0.53 0.51 103% Lu 175 0.00002
Hf 1.9 1.3 0.34 0.41 4.6 4.8 96% Hf 178 0.00001
Ta 0.02 0.01 0.00 ud 0.75 0.81 93% Ta 181 0.00002
W 0.11 ud ud ud 0.72 0.44 164% W 182 0.00005
Tl 0.01 0.01 0.01 ud 0.24 0.3 81% Tl 205 0.00004
Pb 4.2 8.6 1.4 0.58 11.7 11 107% Pb 208 0.0002
Th 0.12 0.06 ud ud 6.6 6.2 107% Th 232 0.00003
U 0.06 0.06 0.02 0.00 2.5 1.69 147% U 238 0.00002