Embed Size (px)
Citation preview
1
Abstract—One of the principal cues believed to be used by
listeners to estimate the distance to a sound source is the ratio of energies along the direct and indirect paths to the receiver. In essence, this “direct-to-reverberant” energy ratio reveals the absolute distance component of the direct energy by normalising by what is assumed to be distance-independent reverberant energy. Earlier approaches to direct-to-reverberant energy ratio calculation made use of the estimated room impulse response, but these techniques are computationally expensive and inaccurate in practice. This paper proposes and evaluates an alternative approach which uses binaural signals to segregate energy arriving from the estimated direction of the direct source from that arriving from other directions, employing a novel binaural equalization-cancellation technique. The system is integrated with a probabilistic inference framework, particle filtering, to handle the nonstationarity of energy-based measurements. The algorithm is capable of using reverberation to estimate source distance in large rooms with errors of less than 1 m for static sources and 1.5-3.5 m for sources with varying degrees of motion complexity. Model performance can be accounted for largely in terms of a competition between auditory horizon and source energy fluctuation effects.
Index Terms—Acoustic distance measurement, direct-to- reverberant energy ratio, particle filtering, binaural sound source localization.
I. INTRODUCTION UDGEMENT of ego-centric distance to nearby objects is an important human sensory capability and is at times wholly -
and critically - dependent on auditory input. A cyclist uses engine noise from motor vehicles to estimate distance in order to pick up speed in time and prepare for evasive action. A runner listens to the footsteps and breathing of his or her opponents to evaluate whether their lead in the race is adequate enough. The approach of a mosquito person at night can be detected through the sound made by its vibrating wings.
A preliminary report of this work appeared at the International Workshop on
Acoustic Echo and Noise Control (Seattle, July 2008). This work was funded in part by EU Cognitive Systems STREP Project POP (Perception On Purpose), FP6-IST-2004-027268.
Yan-Chen Lu is with the Department of Computer Science, University of Sheffield, Regent Court, 211 Portobello Street, Sheffield, S1 4DP, U.K. (e-mail: [email protected])
Martin Cooke is with the Language and Speech Laboratory, University of the Basque Country, Spain and IKERBASQUE (Basque Foundation for Science) (e-mail: [email protected]).
Absolute sound energy at the receiver is a function of intrinsic source energy and source distance, both of which may be time-varying, precluding the use of energy alone as a cue to source-listener distance. However, the combination of energy received along the direct source-listener path with energy arriving following reflections has potential as a means of estimating source distance. The “direct-to-reverberant” energy ratio (DRR) has been suggested as part of the mechanism for source distance judgements in listeners [3-6]. Distance judgments are more accurate in a reverberant space than in an anechoic space, with small inter-test variation in judgements in the same environment [3]. Listeners may use reverberation as an absolute distance cue given that accurate distance judgments were obtained at first stimulus presentation [4]. Zahorik [7] suggested that the principal role of the DRR cue was to provide absolute distance information rather than support fine distance discriminations and was poor as a relative cue. Zahorik also suggested that DRR was perceptually more salient than an intensity cue, especially in a situation where prior knowledge of natural speech level could not be used due to other more variable and complex acoustic information in the surrounding environment [8].
Attempts have been made to exploit the DRR cue both monaurally and binaurally. Bronkhorst and Houtgast [9] proposed a computational model to predict human distance judgement in a controlled condition where the DRR cue is dominant. Their model demonstrated accurate prediction of subjects’ distance responses based on prior knowledge of certain acoustical properties of the environment (room volume, reverberation time and source directivity) using monaural data. Relying on blind identification of the room impulse response from the monaural signal, Larsen and colleagues [10] developed a technique to compute DRR based on certain assumed room acoustics parameters, such as the duration of direct sound. They found that source distance could also be determined as an intermediate output and arrived at underestimated judgments for sources at moderate and large distances (further away than 2 m), similar to the pattern found with human listeners. Other models based on binaural signals utilised either prior knowledge of the environment (e.g. room impulse responses [11]) or extensive spectral training data [12] to formulate source distance inference using the DRR concept. While these studies attempted to demonstrate that distance inference can be further improved with binaural input, neither study, surprisingly, emphasised the role of directional information.
Binaural Estimation of Sound Source Distance via the Direct-to-Reverberant Energy Ratio for
Static and Moving Sources Yan-Chen Lu and Martin Cooke
J
dicocow4 sorore
visehisupesodestrlisso
disowsigchetmstuinstrdusigthtode
Leofcrcoesus
Figloc
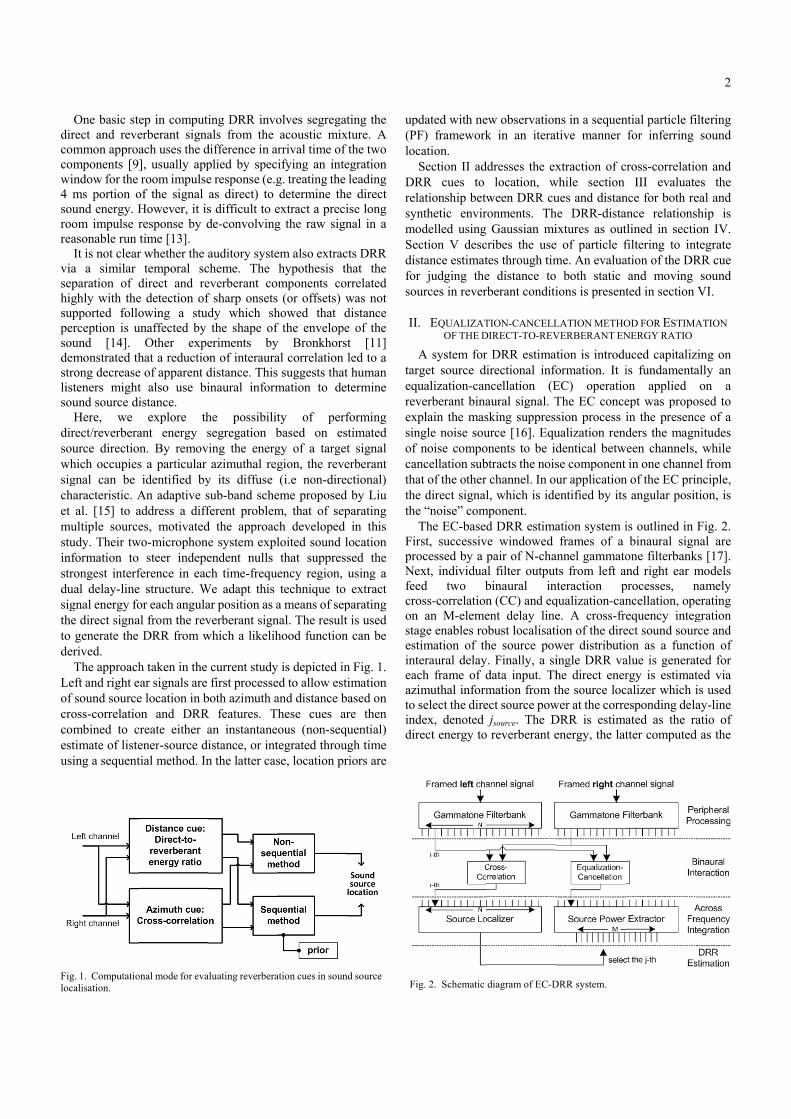
One basic steirect and reveommon approaomponents [9
window for the ms portion o
ound energy. Hoom impulse reasonable run
It is not clearia a similar eparation of dighly with theupported folloerception is uound [14]. emonstrated throng decreasesteners mightound source di
Here, we irect/reverberaource directio
which occupiesgnal can be haracteristic. At al. [15] to a
multiple sourceudy. Their tw
nformation to rongest interfual delay-linegnal energy fo
he direct signao generate the erived.
The approacheft and right ef sound sourceross-correlatioombined to cstimate of listesing a sequent
g. 1. Computatiocalisation.
ep in computierberant signaach uses the d], usually approom impulse
of the signal However, it isresponse by dtime [13]. r whether the a
temporal scdirect and ree detection of owing a stud
unaffected by Other expe
hat a reductioe of apparent dt also use biistance.
explore thant energy sn. By removs a particular identified by
An adaptive saddress a diffes, motivated
wo-microphonesteer indepe
ference in eace structure. Wor each angulaal from the rev
DRR from w
h taken in the ear signals are e location in bon and DRRcreate either aener-source ditial method. In
onal mode for eva
ing DRR invoals from the
difference in arplied by specie response (e.gas direct) to s difficult to ede-convolving
auditory systecheme. The everberant comf sharp onsets dy which shthe shape of
eriments byon of interauradistance. This inaural inform
he possibilitsegregation bing the energazimuthal reg
y its diffuse sub-band scheferent problemd the approace system explendent nulls ch time-freque
We adapt this ar position as averberant signwhich a likelih
current studyfirst processe
both azimuth aR features. Than instantaneoistance, or intn the latter cas
aluating reverbera
olves segregatacoustic mixrrival time of ifying an integ. treating the determine the
extract a precig the raw sign
em also extrachypothesis thmponents cor(or offsets) w
howed that df the envelopey Bronkhorstal correlation l
suggests thatmation to det
ty of perfbased on esgy of a targetgion, the reve(i.e non-direc
eme proposed m, that of sepch developedloited sound lthat suppressency region, technique to
a means of sepnal. The result hood function
is depicted ined to allow estiand distance bhese cues arous (non-sequtegrated througse, location pr
ation cues in soun
ting the xture. A
the two egration leading e direct ise long nal in a
cts DRR hat the rrelated was not distance e of the t [11] led to a t human termine
forming timated t signal erberant ctional) by Liu
parating in this
location sed the using a extract
parating is used
n can be
n Fig. 1. imation ased on re then uential) gh time riors are
up(PFloc
DRrelsynmoSedisforsou
II
tareqrevexpsinof canthathethe
FirproNefeecroonstaestinteacazito inddir
d sourceFi
pdated with neF) frameworkcation. Section II ad
RR cues tolationship betwnthetic envirodelled using ection V descstance estimatr judging theurces in rever
. EQUALIZATOF THE D
A system forrget source di
qualization-canverberant binaplain the mas
ngle noise souf noise componcellation subat of the other e direct signale “noise” comThe EC-basedrst, successivocessed by a pext, individuaed two boss-correlation
n an M-elemeage enables rotimation of thteraural delaych frame of dimuthal informselect the diredex, denoted rect energy to
ig. 2. Schematic
ew observationk in an iterat
ddresses the exlocation, w
ween DRR curonments. Th
Gaussian micribes the usetes through time distance to rberant conditi
TION-CANCELLDIRECT-TO-REV
r DRR estimatirectional infoncellation (Eaural signal. Tsking suppresurce [16]. Equonents to be idbtracts the nois
channel. In oul, which is ide
mponent. d DRR estima
ve windowed pair of N-cha
al filter outputbinaural inn (CC) and eqent delay lineobust localisatihe source pow
y. Finally, a sidata input. Thmation from tect source pow
jsource. The Do reverberant e
diagram of EC-D
ns in a sequentive manner
xtraction of cwhile section ues and distanhe DRR-distaixtures as oute of particle fme. An evalua
both static ions is present
LATION METHOVERBERANT EN
tion is introduormation. It iEC) operatioThe EC concesion process iualization rendentical betwse component ur applicationentified by its
ation system iframes of a
annel gammatots from left a
nteraction pqualization-cane. A cross-frion of the direwer distributiingle DRR vahe direct enerthe source loc
wer at the correDRR is estimaenergy, the lat
DRR system.
ntial particle fifor inferring
cross-correlatioIII evaluate
nce for both reance relationstlined in sectifiltering to ination of the DRand moving ted in section
OD FOR ESTIMANERGY RATIO
uced capitalizis fundamentaon applied ept was propoin the presencders the magn
ween channels,in one channe
n of the EC pris angular posit
is outlined in binaural sign
one filterbankand right ear mprocesses, nncellation, opequency integect sound souron as a funct
alue is generargy is estimat
calizer which iesponding delated as the rtter computed
2
iltering sound
on and es the eal and ship is ion IV. ntegrate RR cue
sound VI.
ATION
zing on ally an on a
osed to ce of a nitudes , while el from inciple, tion, is
Fig. 2. nal are ks [17]. models namely erating gration rce and tion of
ated for ted via is used ay-line atio of
d as the
reen
A.
crauN=spanpe
su
anshfigcodereshon
di
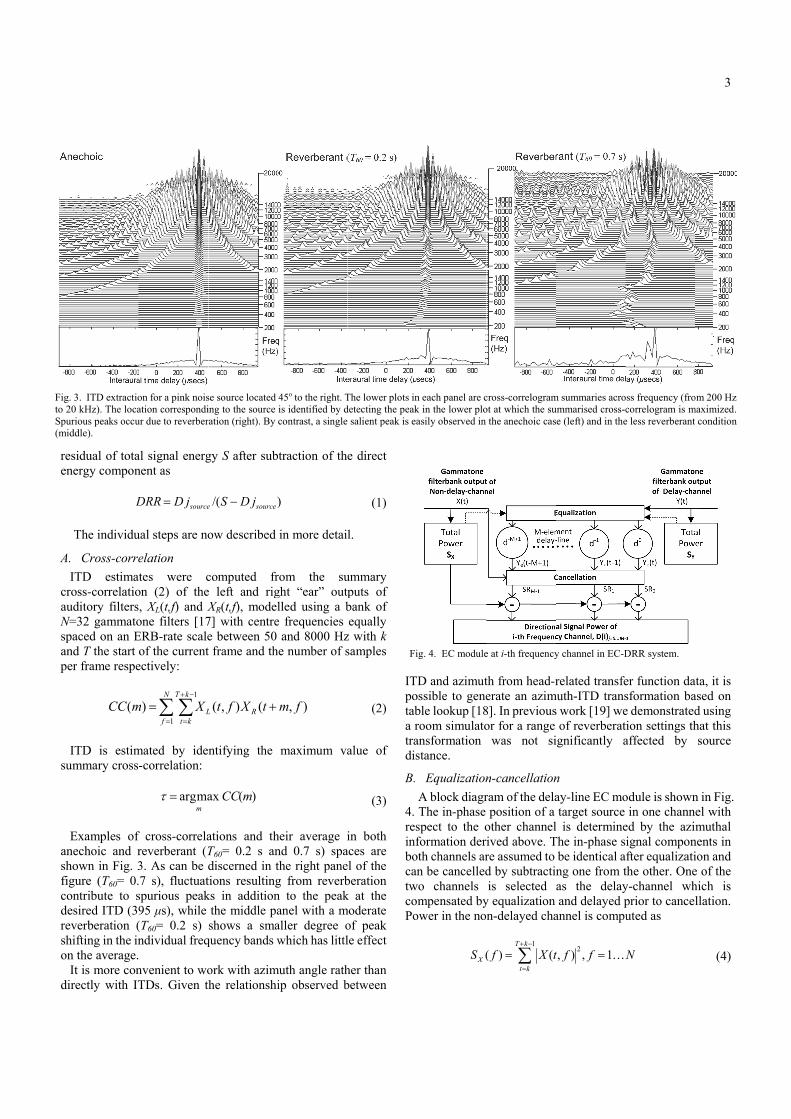
Fig.to 2Spu(mi
esidual of totanergy compon
D
The individu
. Cross-correITD estimat
ross-correlatiouditory filters
N=32 gammatopaced on an End T the start oer frame respe
mCC(
ITD is estimummary cross-
Examples of
nechoic and rhown in Fig. 3gure (T60= 0.ontribute to sesired ITD (39everberation (hifting in the inn the average.It is more conirectly with IT
. 3. ITD extractio20 kHz). The locaurious peaks occuddle).
al signal energnent as
sourcejDDRR =
ual steps are no
elation tes were c
on (2) of the, XL(t,f) and Xone filters [17ERB-rate scaleof the current
ectively:
∑ ∑=
−+
=
=N
f
kT
ktLXm
1
1
)
mated by iden-correlation:
maargm
=τ
f cross-correlareverberant (T3. As can be d7 s), fluctuat
spurious peak95 μs), while (T60= 0.2 s) ndividual freq
nvenient to woTDs. Given th
on for a pink noisation correspondiur due to reverber
gy S after sub
)/( sourcee jDS −
ow described
computed fre left and rigXR(t,f), model7] with centree between 50 t frame and th
+RL tXft (),(
ntifying the
)(ax mCC
ations and thT60= 0.2 s andiscerned in ttions resultingks in addition
the middle pashows a sma
quency bands w
ork with azimhe relationshi
se source located ing to the source ation (right). By
traction of the
)
in more detail
rom the sught “ear” outplled using a be frequencies
and 8000 Hze number of s
fm ),
maximum va
heir average ind 0.7 s) spathe right paneg from reverbn to the peakanel with a maller degree owhich has littl
muth angle rathip observed b
45o to the right. Tis identified by dcontrast, a single
e direct
(1)
l.
ummary puts of bank of equally
z with k samples
(2)
alue of
(3)
in both aces are el of the beration k at the
moderate of peak le effect
her than between
ITpotaba rtradis
B.
4. resinfbocantwcoPo
The lower plots indetecting the peak
salient peak is ea
Fi
D and azimutossible to geneble lookup [18room simulatoansformation stance.
EqualizationA block diagrThe in-phase spect to the oformation deri
oth channels arn be cancelled
wo channels mpensated by
ower in the non
SX (
n each panel are ck in the lower ploasily observed in
ig. 4. EC module
th from head-rerate an azim8]. In previousor for a range
was not si
n-cancellationram of the delaposition of a
other channelived above. Tre assumed to d by subtractinis selected a
y equalization n-delayed cha
tXfkT
kt
()(1
= ∑−+
=
cross-correlogramot at which the su
the anechoic cas
e at i-th frequency
related transfemuth-ITD transs work [19] we
of reverberatignificantly a
n ay-line EC motarget source is determine
The in-phase sbe identical ang one from tas the delayand delayed p
annel is compu
Nfft K1,), 2 =
m summaries acroummarised cross-ce (left) and in the
y channel in EC-D
er function dasformation bae demonstratedion settings thaffected by
odule is shownin one chann
ed by the azimignal componfter equalizatithe other. Oney-channel whprior to canceluted as
N
ss frequency (frocorrelogram is me less reverberant
DRR system.
3
ata, it is ased on d using hat this source
n in Fig. el with muthal
nents in ion and e of the hich is llation.
(4)
om 200 Hzmaximized.
condition
blde
chththan
S
cafr
diofwwsea di[2T6tosigD
Figco
The compenlock is updateelay-channel s
The delayed hannel to comhrough the twohe compensatend accumulate
)(−
=jT
TfSRj
The estimatancelled comequency chan
=jD
III. RELAT
Ideally, DRRistance and is f the proposed
well DRR reflewith constant equences in an
room simulaistance betwee20]) and the no60= 0.2 s, wher
o drop by 60 dgnals were prRR estimates
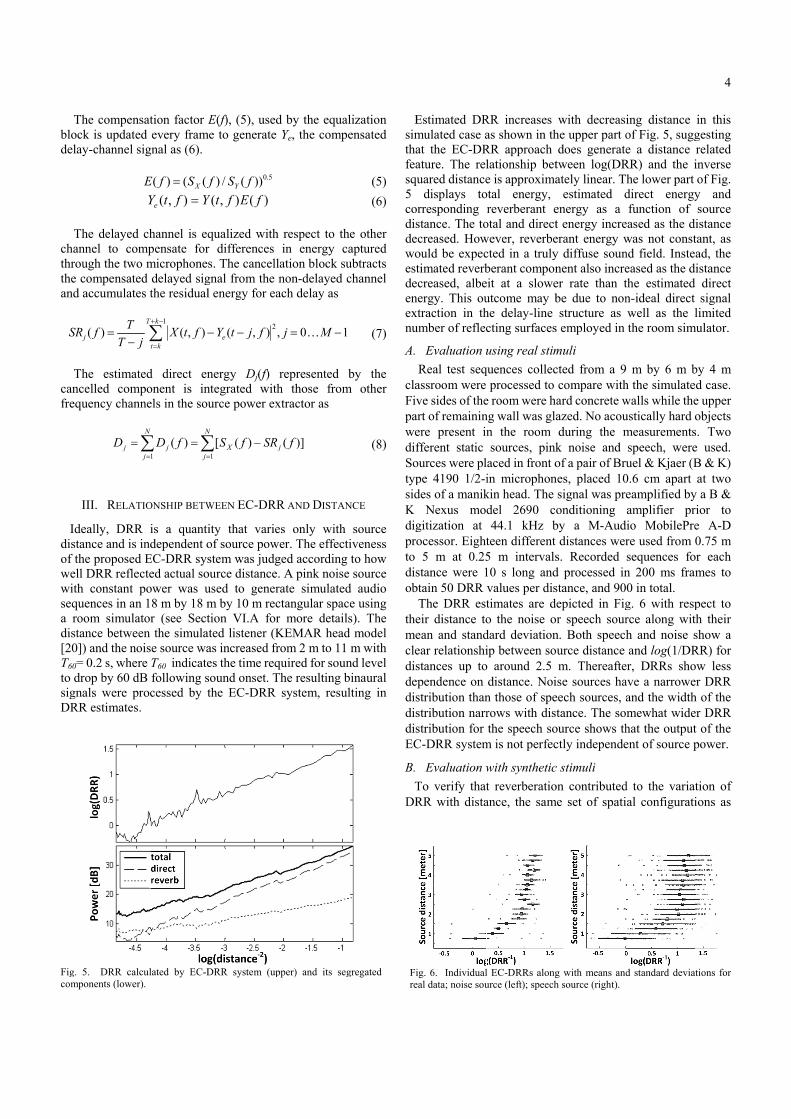
g. 5. DRR calomponents (lower
sation factor Eed every framsignal as (6).
(()( fSfE X=),( YftYe =
channel is eqmpensate foro microphonesed delayed siges the residual
),(1
−∑−+
=
ftXj
kT
kt
ted direct enmponent is innnels in the sou
∑∑==
=N
j
N
jj fD
1
)(
TIONSHIP BETW
R is a quantiindependent o
d EC-DRR syscted actual sopower was u
n 18 m by 18 mator (see Secten the simulatoise source ware T60 indicate
dB following srocessed by t.
culated by EC-Dr).
E(f), (5), usedme to generate
5.0))(/) fSf Y )(),( fEftY
qualized withr differences s. The cancell
gnal from the l energy for ea
,),( 2−− fjtYe
nergy Dj(f) ntegrated withurce power ex
∑=
−N
jX SRfS1
)([
WEEN EC-DRR
ity that varieof source powstem was judg
ource distanceused to generm by 10 m rection VI.A forted listener (Kas increased fres the time reqsound onset. Tthe EC-DRR
DRR system (up
d by the equaYe, the comp
h respect to thin energy c
lation block sunon-delayed cach delay as
10, −= Mj K
represented h those fromxtractor as
j f )](
R AND DISTAN
es only with wer. The effectged according . A pink noiserate simulatedctangular spacr more detailKEMAR headrom 2 m to 11 quired for sounThe resulting b
system, resul
pper) and its seg
lization ensated
(5)(6)
he other aptured ubtracts channel
(7)
by the m other
(8)
NCE
source tiveness to how
e source d audio ce using s). The
d model m with
nd level binaural lting in
Esimthafeasqu5codisdewoestdeenexnu
A.
claFivpawedifSotypsidK digproto disob
themecledisdepdisdisdisEC
B.T
DR
gregated Fi
re
Estimated DRmulated case aat the EC-DRature. The reluared distance
displays torresponding stance. The tocreased. Howould be expectimated reverbcreased, albe
nergy. This outraction in th
umber of reflec
Evaluation uReal test seq
assroom were ve sides of the
art of remaininere present infferent static ources were plpe 4190 1/2-ides of a manik
Nexus modgitization at ocessor. Eight5 m at 0.25
stance were 1btain 50 DRR
The DRR esteir distance toean and standear relationshistances up topendence on stribution thanstribution narrstribution for C-DRR system
Evaluation wTo verify thatRR with dista
ig. 6. Individualeal data; noise sou
RR increases as shown in thRR approachlationship bete is approxima
otal energy, reverberant e
otal and directwever, reverbected in a trulyberant componeit at a sloweutcome may bhe delay-line cting surfaces
using real stimquences collec
processed to e room were hang wall was glan the roomsources, pink
aced in front oin microphonkin head. The del 2690 co44.1 kHz b
teen different 5 m intervals10 s long andvalues per distimates are do the noise odard deviationip between so
o around 2.5 distance. Noi
n those of sperows with distthe speech so
m is not perfec
with synthetict reverberatioance, the sam
l EC-DRRs alongurce (left); speech
with decreashe upper part odoes generate
tween log(DRately linear. T
estimated denergy as a t energy increerant energy wy diffuse sounnent also increer rate than tbe due to nonstructure as
s employed in
muli cted from a 9compare withard concrete wazed. No acouduring the mk noise and of a pair of Bru
nes, placed 10signal was pronditioning
by a M-Auddistances wer
s. Recorded d processed instance, and 90epicted in Figr speech sour
n. Both speechurce distance m. Thereafte
ise sources haeech sources, atance. The so
ource shows thctly independe
c stimuli on contributed
me set of spati
g with means andh source (right).
ing distance of Fig. 5, sugge a distance
RR) and the iThe lower part direct energyfunction of
eased as the dwas not constnd field. Insteeased as the dthe estimated n-ideal direct well as the lthe room sim
9 m by 6 m bh the simulatewalls while theustically hard omeasurementsspeech, wereuel & Kjaer (B
0.6 cm aparteamplified byamplifier pr
dio MobilePrere used from 0sequences fon 200 ms fram
00 in total. g. 6 with resprce along with and noise sand log(1/DR
er, DRRs shoave a narroweand the width
omewhat widehat the outputent of source p
d to the variatial configurati
d standard deviat
4
in this gesting related inverse of Fig. y and source istance tant, as ad, the istance direct signal
limited mulator.
by 4 m d case. e upper objects s. Two e used. B & K) at two
y a B & rior to e A-D 0.75 m
or each mes to
pect to th their show a RR) for ow less er DRR h of the er DRR t of the power.
tion of ions as
tions for
ussimVanwKdiAapsimpaannodereobcaupexinw
mreMviwcafusmin
Dw
Figan
sed in the reamulator based
VI.A) to evaluanechoic condit
were used, withKEMAR head
istances ranginAlthough a pproximated mulating a veattern was found bottom rowoise source waemonstrates theverberant spbservation of ases suggests tpon the effecxceeding 2.5 ncrease of dist
with distance. Bronkhorst an
m upper boundecognized it a
Mershon and cia a direct ene
window after salculated direunction of distmall comparedncluded in the
IVDue to the ab
RR and distanwas adopted. G
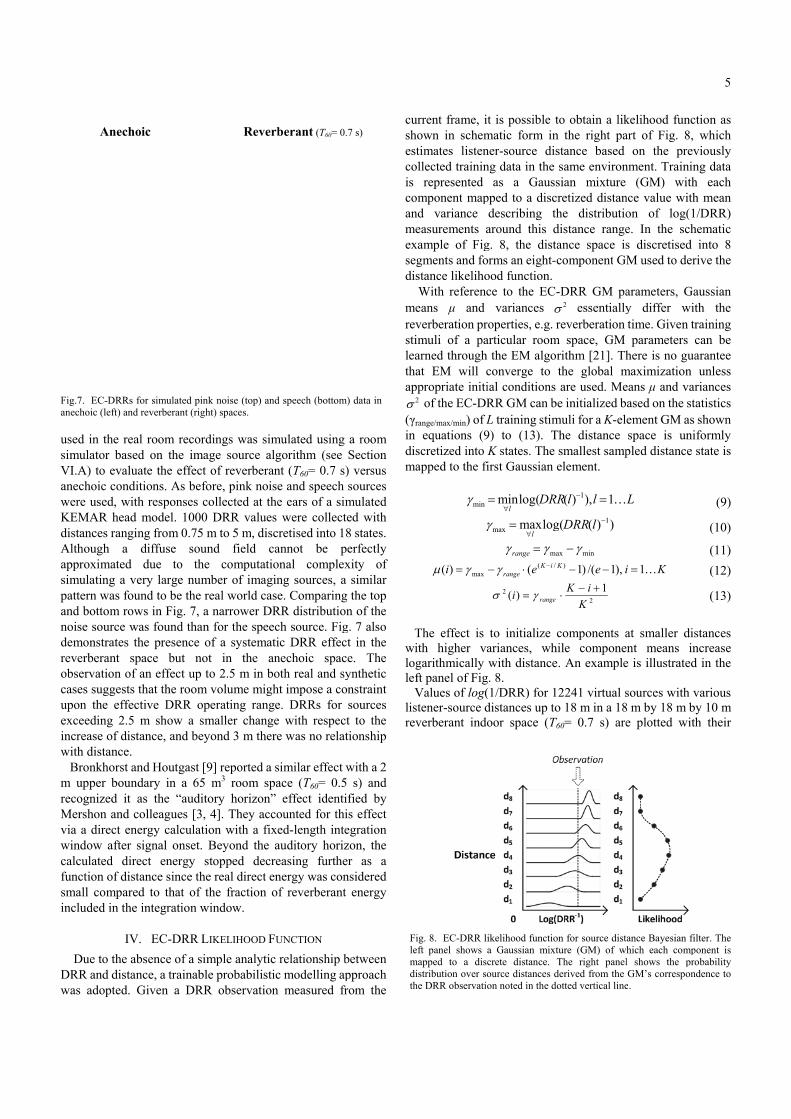
Anecho
g.7. EC-DRRs fnechoic (left) and
l room recordd on the imaate the effect tions. As befoh responses comodel. 1000
ng from 0.75 mdiffuse soundue to the
ery large numund to be the rws in Fig. 7, aas found thanhe presence opace but notan effect up tthat the room
ctive DRR opm show a sm
tance, and bey
nd Houtgast [9dary in a 65 as the “auditoolleagues [3, ergy calculatiosignal onset. Bect energy stance since thed to that of tintegration w
. EC-DRR Lbsence of a simnce, a trainableGiven a DRR
oic
for simulated pinkreverberant (righ
dings was simage source alg
of reverberanore, pink noiseollected at theDRR values
m to 5 m, discnd field cae computatiomber of imaginreal world casea narrower DRn for the speecof a systematit in the anto 2.5 m in bovolume migh
perating rangemaller changeyond 3 m there
9] reported a sm3 room spa
ory horizon” 4]. They accoon with a fixeBeyond the a
stopped decree real direct enthe fraction o
window.
IKELIHOOD FU
mple analytic e probabilistic
R observation
Reverb
k noise (top) andht) spaces.
mulated using gorithm (see nt (T60= 0.7 s)e and speech e ears of a simwere collecte
retised into 18annot be peonal complexng sources, a e. Comparing
RR distributionch source. Figic DRR effectnechoic spaceoth real and syht impose a cone. DRRs for e with respecte was no relat
similar effect wace (T60= 0.5
effect identiounted for thied-length inteauditory horizeasing furthenergy was conf reverberant
UNCTION relationship b
c modelling apn measured fr
berant (T60= 0.
d speech (bottom)
a room Section ) versus sources mulated ed with 8 states. erfectly xity of similar the top
n of the g. 7 also t in the e. The ynthetic nstraint sources t to the tionship
with a 2 s) and
fied by is effect egration zon, the r as a
nsidered energy
between pproach rom the
cushoestcois coanmeexsegdis
merevstileathaapp
2σ(γrindisma
T
wiloglef
Vlisrev
7 s)
) data in
Filemdith
urrent frame, iown in schemtimates listenllected traininrepresented
mponent mapnd variance easurements aample of Figgments and fostance likelihoWith referenceans μ and verberation prmuli of a paarned throughat EM will cpropriate initi
2 of the EC-DRrange/max/min) of L
equations (9scretized into apped to the fi
minγ
γ
i)( max= γμ
The effect is ith higher vgarithmically ft panel of FigValues of log(tener-source dverberant ind
ig. 8. EC-DRR lft panel shows
mapped to a disistribution over she DRR observati
it is possible tmatic form inner-source disng data in the
as a Gausspped to a discdescribing tharound this dg. 8, the distorms an eight-ood function.ce to the EC-
variances σroperties, e.g. rarticular roomh the EM algoconverge to ial conditions RR GM can bL training stim9) to (13). TK states. The
first Gaussian
DRl
log(min=∀
logmaxmax ∀=
lγ
maγγ =range
e iKrange ( /(⋅− −γ
2 )(i range= γσ
to initialize ariances, whwith distance
g. 8. (1/DRR) for 1distances up tooor space (T6
ikelihood functioa Gaussian mixtcrete distance. ource distances don noted in the d
to obtain a likn the right pastance based same environsian mixture
cretized distanhe distributiodistance rangeance space iscomponent G
-DRR GM pa2σ essentially
reverberation m space, GM
rithm [21]. Ththe global mare used. Me
be initialized bmuli for a K-elThe distance
smallest sampelement.
llRR K1),)( 1 =−
))(g( 1−lDRR
minax γ−
ieK ),1/()1) −−
2
1K
iK +−⋅
components ahile componee. An example
12241 virtual so 18 m in a 18
T60= 0.7 s) are
on for source distture (GM) of wThe right panel
derived from the dotted vertical line
kelihood funcart of Fig. 8,
on the prevnment. Trainin (GM) with
nce value withon of log(1e. In the schs discretised M used to der
arameters, Gay differ wittime. Given trparameters c
here is no guamaximization eans μ and varbased on the stement GM as space is unipled distance
L
Ki K1=
at smaller disent means ine is illustrated
sources with v8 m by 18 m be plotted with
tance Bayesian fiwhich each comp
l shows the proGM’s correspon
e.
5
ction as which
viously ng data h each h mean /DRR)
hematic into 8
rive the
aussian th the raining can be arantee unless
riances atistics shown
iformly state is
(9)
(10)
(11)(12)
(13)
stances ncrease d in the
various y 10 m h their
lter. Theponent isobability
ndence to
mwserare(nenradi(bThbolocodeto
dibeaza ovovmsotrathazthdineapITsa
V
bi
Fig10DR
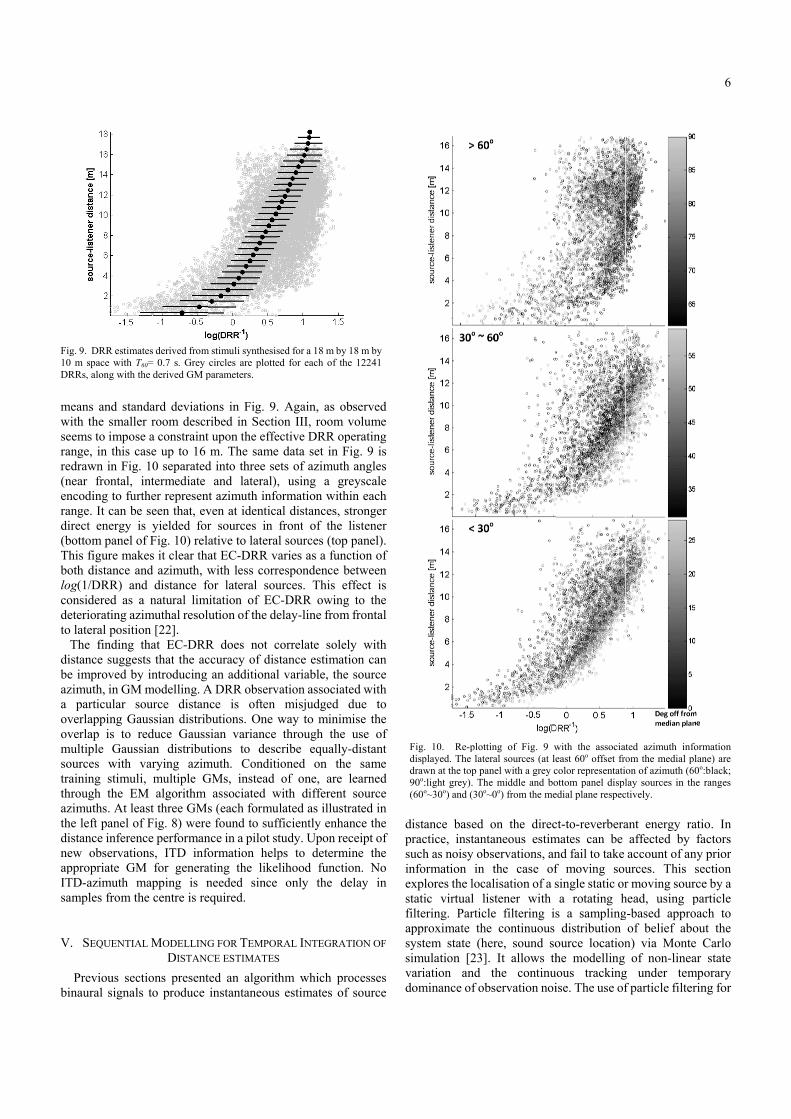
means and stanwith the smalleeems to imposange, in this cedrawn in Fignear frontal, ncoding to furange. It can beirect energy ibottom panel ohis figure makoth distance aog(1/DRR) anonsidered as aeteriorating azo lateral positioThe finding istance suggese improved byzimuth, in GM
particular sverlapping Gaverlap is to r
multiple Gaussources with aining stimul
hrough the EMzimuths. At lehe left panel oistance inferenew observatioppropriate GMTD-azimuth mamples from th
V. SEQUENTIA
Previous secinaural signal
g. 9. DRR estima0 m space with TRRs, along with t
ndard deviatioer room descrse a constraint case up to 16 . 10 separatedintermediate
rther represente seen that, evis yielded forof Fig. 10) relakes it clear thaand azimuth, wnd distance foa natural lim
zimuthal resoluon [22]. that EC-DRRsts that the acy introducing
M modelling. Asource distanaussian distribreduce Gausssian distributvarying azim
li, multiple GM algorithm
east three GMsf Fig. 8) were
nce performanons, ITD infoM for generamapping is nhe centre is re
AL MODELLINGDISTANC
ctions presents to produce
ates derived fromT60= 0.7 s. Grey the derived GM p
ons in Fig. 9.ribed in Sectiot upon the effem. The same
d into three seand lateral),
t azimuth infoven at identicar sources in ative to lateraat EC-DRR vawith less corr
for lateral soumitation of EC
ution of the de
R does not cccuracy of dis
an additionalA DRR observnce is often butions. One wsian variance tions to desc
muth. ConditiGMs, instead
associated ws (each formue found to sufnce in a pilot stformation helpating the likeneeded since equired.
G FOR TEMPORCE ESTIMATES
ted an algorithinstantaneous
m stimuli synthesiscircles are plotte
parameters.
. Again, as obon III, room
ective DRR ope data set in Fets of azimuth, using a grormation withal distances, sfront of the l sources (top aries as a func
respondence burces. This e
C-DRR owingelay-line from
correlate solelstance estimatl variable, the
vation associatmisjudged
way to minimthrough the
cribe equallyioned on theof one, are
with different ulated as illustrfficiently enhatudy. Upon reps to determlihood functi
only the de
RAL INTEGRATS hm which prs estimates of
sed for a 18 m by ed for each of th
bserved volume
perating Fig. 9 is h angles reyscale hin each stronger listener panel).
ction of between ffect is
g to the m frontal
ly with tion can e source ted with due to
mise the use of
-distant e same learned source
rated in ance the ceipt of
mine the on. No elay in
TION OF
rocesses f source
disprasucinfexpstafiltappsyssimvado
18 m bye 12241
Fididr90(6
stance based actice, instantch as noisy obformation in plores the loca
atic virtual litering. Particproximate thestem state (hmulation [23]ariation and ominance of ob
ig. 10. Re-plottisplayed. The laterawn at the top pa0o:light grey). Th60o~30o) and (30o~
on the directaneous estim
bservations, anthe case of
alisation of a sistener with le filtering ise continuous
here, sound so. It allows ththe continu
bservation noi
ting of Fig. 9 weral sources (at leanel with a grey che middle and bo~0o) from the me
ct-to-reverberamates can be nd fail to take f moving sousingle static ora rotating h
s a samplingdistribution
ource locationhe modelling ous trackingise. The use of
with the associateast 60o offset frocolor representatiottom panel displedial plane respec
ant energy raaffected by account of anurces. This sr moving sour
head, using pg-based appro
of belief abon) via Monte
of non-lineag under temf particle filter
ted azimuth infoom the medial plon of azimuth (60lay sources in th
ctively.
6
atio. In factors
ny prior section
rce by a particle oach to out the e Carlo ar state
mporary ring for
ormationlane) are 0o:black; e ranges
7
sound localisation is described in [24, 25]. Details of the PF architecture used in the current study can be found in [19].
In essence, PF operates by iterating 3 steps: prediction, update and estimation. Each iteration alters the particles (i.e. independent hypotheses over the system state) and associated particle likelihood weights based on a predictive model of the sound source dynamics with the likelihood transformed by updated observations. Estimated source location is then calculated as the weighted mean across all particles. The implementation of these steps in the current study is described next.
A. PF prediction stage If available, a model of source dynamics can be used to
modify particle hypotheses at the PF prediction stage. Since no prior knowledge of source dynamics is assumed here, source motion is approximated by a zero-mean Gaussian noise term which is characterized by an adaptive standard deviation, itself a function of the corresponding particle likelihood weight. The observed dynamics in the current study is due to motion of the target source. Noise terms are applied to relocate source location hypotheses of all particles in both azimuth and distance in the PF prediction stage. Specifically, the state variable (i.e. hypothesised source location in distance n
trx ,and azimuth n
tx ,φ)
corresponding to particle n at time t is determined by
],[ ,,n
tn
trnt xxx φ= (14)
where the evolution of source azimuth location n
tx is formulated as an increment to the previous location n
tx 1− with
noise term ntμ As defined in (15), n
tμ is a zero mean Gaussian variable with a time-variant standard deviation n
tσ , which is a function of the particle likelihood weight n
t 1−ω and the constant maxσ .
max1
2 )12(],)(,0[ σωσσμ ⋅−⋅== −nt
nt
nt
nt N (15)
Since n
t 1−ω ranges between 0 and 1, maxσ specifies the maximum value of the standard deviation. The effect is that a weaker particle is more likely to possess a larger noise term, encouraging a wider range of exploration of the state space. The altered location hypotheses are subsequently evaluated with the observation model introduced next to update particle weights.
A fixed maximum standard deviation, empirically determined as 15o ( φσ max, ) and 2 m ( rmax,σ ) in azimuth and distance coordinates respectively, was applied across all particles. Note that the source azimuth is measured relative to the medial plane, as a function of head orientation. Particle hypotheses for source azimuth therefore need to be adjusted in accordance with head rotation.
B. PF update stage At the PF update stage, cues were fused by multiplying the
likelihood functions associated with the two different localisation cues, namely ITD and EC-DRR, for updating each particle’s likelihood weight. The derivation of the EC-DRR likelihood function according to the current observation and the pre-collected training data was demonstrated in Section IV. The
cross-correlation function, (2), computed from the input binaural signal can be directly used as the ITD likelihood function for source azimuth as in the pseudo-likelihood approach of Ward et al. [25]. The length of the delay line is M = 65 samples corresponding to 0.75 ms at the sampling frequency of 44.1 kHz used here. As illustrated in the lower plots of Fig. 3, the cross-correlation function acts as a weight for each time delays, which are further mapped into source azimuths through the transfer function described in Section II.A.
In parallel to PF, the peaks of the likelihood function produce instantaneous estimates of source azimuth and distance. Instantaneous azimuth information is also used to calculate EC-DRR and select the correct GM for generating the EC-DRR likelihood function for a given azimuth range, as outlined in Section IV.
C. PF estimation stage The mean of the 20% of particles with the highest likelihood
weight was used to generate source location estimates. This approach minimises the negative effect of weak particles and results in a degree of resistance to noisy observations. Since the instantaneous azimuth estimate is made without exploiting the head rotation cue, substantial localisation degradation is expected resulting from front-back reversals. This estimation error, which may be up to π , is principally on account of the use of the ITD cue rather than the detrimental effects of noisy environments. Therefore, the judgements suffering from front-back reversals occurring in the instantaneous estimation approach were rectified to the hemispheres used to generate the input stimuli. In this way, the advantage of sequential integration provided by PF can be properly assessed.
VI. EVALUATION
A. Stimuli
The “Roomsim” room simulator [26] was used to generate binaural stimuli for various listener-source configurations and reverberation conditions. Non-individual HRTFs recorded with a KEMAR dummy head [20] with inter-ear distance of 0.152 m were used to generate binaural room impulse responses based on the image method [27]. Stimuli were generated at a sampling rate of 44.1 kHz. Temperature and relative humidity were set at 20o C and 40% respectively during the simulations. The virtual room was an 18 m by 18 m by 10 m gym space. This was generated in two reverberant conditions with T60= 0.2 s and 0.7 s.
Training and test stimuli were generated by convolving a speech or pink noise source with the binaural room impulse responses. The simulated listener was static and placed in the south-west corner of the room in order to permit the use of quite large listener-source distances, all of which greater than 2 m, at no near-field distance cues are available [2], allowing a focus on the range where DRR cues are expected to dominate distance perception.
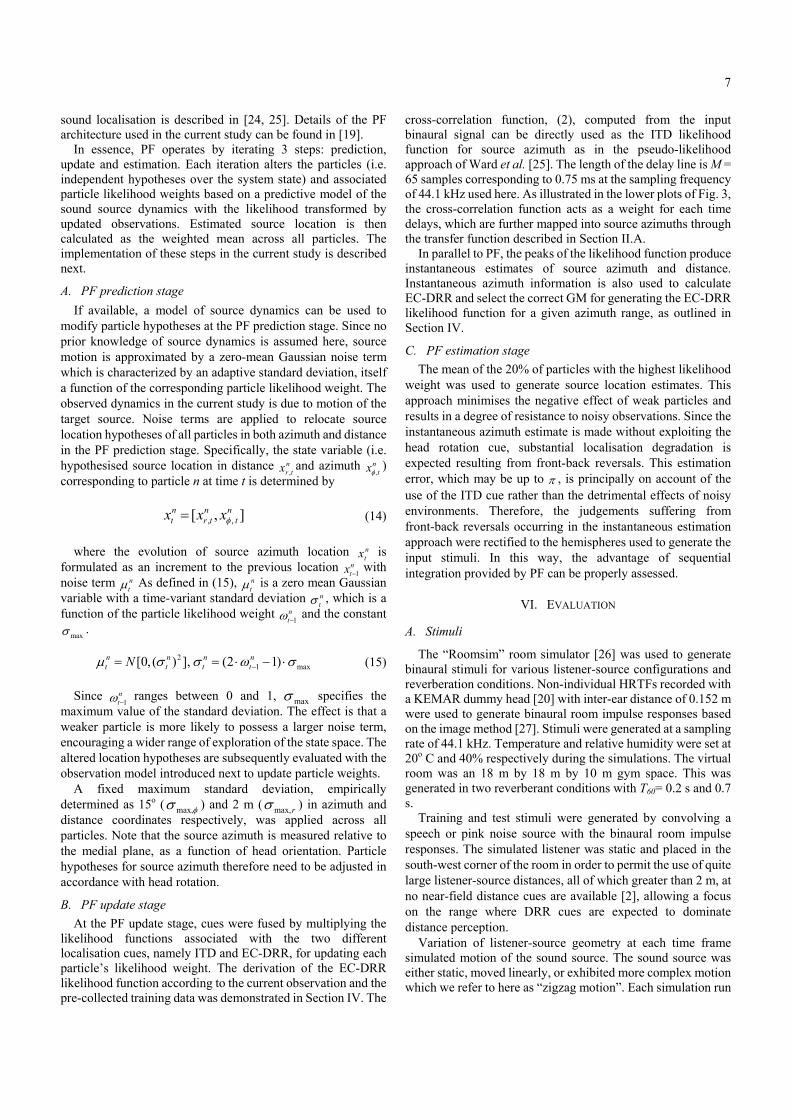
Variation of listener-source geometry at each time frame simulated motion of the sound source. The sound source was either static, moved linearly, or exhibited more complex motion which we refer to here as “zigzag motion”. Each simulation run
comofdi11
B.
EusoaneresinpethandeinfilByco
socoFithtoalesindire1)
Figgethezig onsisted of 60
moved towardsf 0.14 ms-1. irection but va1 shows the so
. Localisatio
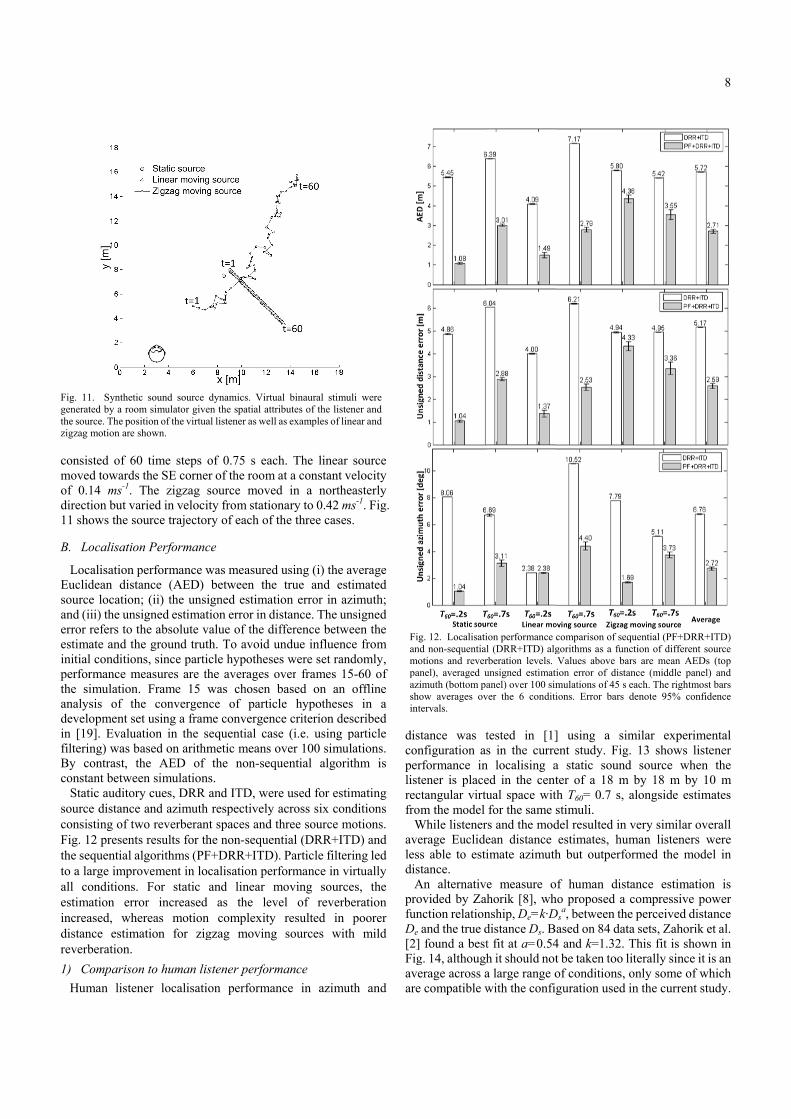
Localisation puclidean distaource locationnd (iii) the unsrror refers to tstimate and thnitial conditionerformance mhe simulation.nalysis of thevelopment sen [19]. Evalualtering) was by contrast, tonstant betweeStatic auditor
ource distanceonsisting of twig. 12 presents
he sequential ao a large improll conditions. stimation erroncreased, wheistance estimeverberation. ) ComparisonHuman listen
g. 11. Syntheticenerated by a roome source. The posgzag motion are s
0 time steps os the SE cornerThe zigzag s
aried in velocitource trajector
n Performanc
performance wance (AED)
n; (ii) the unsisigned estimatthe absolute vhe ground trutns, since partic
measures are th. Frame 15 w
he convergenet using a framation in the sbased on arithmthe AED of en simulationsry cues, DRR e and azimuth wo reverberans results for th
algorithms (PFovement in loc
For static or increased ereas motionation for zig
n to human lisner localisatio
c sound source m simulator give
sition of the virtuashown.
of 0.75 s eacr of the room source movedty from stationry of each of t
ce
was measured between the
igned estimatition error in dialue of the di
th. To avoid ucle hypothesehe averages owas chosen bce of particl
me convergencequential casmetic means othe non-sequ
s. and ITD, werrespectively
nt spaces and the non-sequenF+DRR+ITD)calisation perfand linear m
as the levn complexity gzag moving
stener performon performan
dynamics. Virtuaen the spatial attral listener as well
h. The linear at a constant vd in a northenary to 0.42 mthe three cases
using (i) the atrue and es
ion error in azistance. The unfference betw
undue influences were set ranover frames 1based on an le hypothesece criterion dee (i.e. using p
over 100 simuuential algori
e used for estiacross six conthree source mntial (DRR+IT. Particle filterformance in v
moving sourcvel of reverb
resulted in sources wit
mance nce in azimu
al binaural stimuibutes of the listeas examples of lin
r source velocity easterly
ms-1. Fig. s.
average timated zimuth; nsigned
ween the ce from ndomly, 5-60 of offline
es in a escribed particle
ulations. ithm is
imating nditions motions. TD) and ring led
virtually ces, the beration
poorer th mild
uth and
discopelisrecfro
Wavlesdis
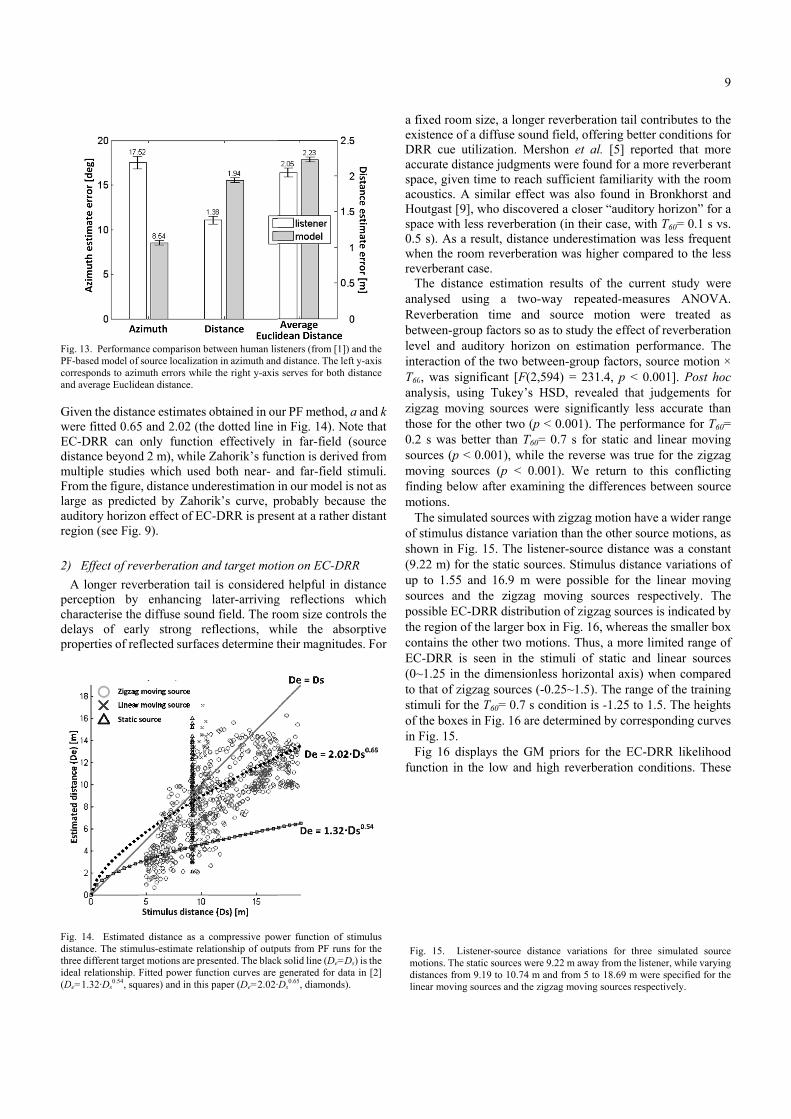
AprofunDe[2]Figavare
uli wereener andnear and
Fianmpaazshin
stance was tnfiguration asrformance intener is placectangular virtuom the model While listenererage Euclidess able to estistance. An alternativovided by Zahnction relatione and the true d] found a bestg. 14, althougherage across ae compatible w
ig. 12. Localisatind non-sequential
motions and reveranel), averaged uzimuth (bottom pahow averages ovntervals.
tested in [1]s in the curre
n localising aed in the centual space witfor the same s
rs and the modean distance imate azimuth
e measure ohorik [8], whnship, De=k·Ddistance Ds. Bt fit at a=0.54h it should nota large range owith the config
ion performance cl (DRR+ITD) algrberation levels. unsigned estimatianel) over 100 sim
ver the 6 conditi
] using a sient study. Figa static soundter of a 18 mh T60= 0.7 s, stimuli. del resulted inestimates, hu
h but outperfo
f human disho proposed a Ds
a, between thased on 84 dat
4 and k=1.32. t be taken too of conditions, guration used
comparison of segorithms as a funValues above baion error of distmulations of 45 sions. Error bars
imilar experig. 13 shows ld source wh
m by 18 m byalongside est
n very similar uman listenersformed the mo
tance estimatcompressive
he perceived dta sets, ZahoriThis fit is sholiterally since only some ofin the current
equential (PF+DRnction of differenars are mean AEance (middle pa
s each. The rightmdenote 95% co
8
imental listener
hen the y 10 m timates
overall s were odel in
tion is power
istance ik et al. own in it is an
f which t study.
RR+ITD)nt sourceEDs (topanel) andmost barsnfidence
GwECdimFrlaaure 2)
pechdepr
Figdisthride(D
FigPFcoan Given the distanwere fitted 0.65
C-DRR can istance beyond
multiple studierom the figure
arge as predicuditory horizoegion (see Fig.
) Effect of revA longer reveerception by haracterise theelays of earroperties of re
g. 14. Estimatestance. The stimuree different targeeal relationship. F
De=1.32·Ds0.54, squ
g. 13. PerformanF-based model of orresponds to azimnd average Euclid
nce estimates 5 and 2.02 (thonly functiond 2 m), while
es which usede, distance undcted by Zahoron effect of EC. 9).
verberation anerberation tail
enhancing e diffuse sounrly strong reflected surfac
d distance as a ulus-estimate relaet motions are preFitted power funuares) and in this
nce comparison bf source localizatiomuth errors whiledean distance.
obtained in ouhe dotted line in effectively Zahorik’s fun
d both near- aderestimation irik’s curve, p
C-DRR is pres
nd target motl is considerelater-arriving
d field. The roeflections, wes determine t
compressive powationship of outpesented. The blacknction curves are paper (De=2.02·D
etween human lison in azimuth ande the right y-axis
ur PF method, in Fig. 14). Nin far-field
nction is deriveand far-field in our model i
probably becasent at a rather
ion on EC-DRd helpful in d
g reflectionsoom size conthile the abstheir magnitud
wer function of sputs from PF runsk solid line (De=Dgenerated for daDs
0.65, diamonds)
steners (from [1])d distance. The les serves for both
a and k ote that (source ed from stimuli. is not as ause the r distant
RR distance
which trols the sorptive des. For
a fexDRaccspaacoHospa0.5whrev
TanRebelevintT60anzigtho0.2soumofinmo
Tof sho(9.upsoupothecoEC(0~to stiof in
Ffun
stimuluss for theDs) is theta in [2]
).
Fimdilin
) and theft y-axisdistance
fixed room sizistence of a diRR cue utilizcurate distancace, given timoustics. A simoutgast [9], whace with less 5 s). As a resuhen the room verberant caseThe distance
nalysed usingeverberation tween-group fvel and auditteraction of th0, was signifi
nalysis, using gzag moving ose for the oth2 s was betterurces (p < 0.0oving sourcesnding below aotions. The simulatedf stimulus distaown in Fig. 1.22 m) for the
p to 1.55 and urces and th
ossible EC-DRe region of thentains the oth
C-DRR is see~1.25 in the dthat of zigzagmuli for the T
f the boxes in FFig. 15.
Fig 16 displaynction in the
ig. 15. Listenemotions. The static
istances from 9.1near moving sour
ze, a longer reiffuse sound fzation. Mershce judgments wme to reach sumilar effect who discoveredreverberation ult, distance ureverberation
e. estimation re
g a two-waytime and sofactors so as ttory horizon he two betweeicant [F(2,594
Tukey’s HSDsources were
her two (p < 0r than T60= 0001), while ths (p < 0.001after examinin
d sources with ance variation15. The listenee static source
16.9 m werehe zigzag moRR distributione larger box inher two motionen in the stimdimensionlessg sources (-0.2T60= 0.7 s conFig. 16 are det
ys the GM prlow and high
r-source distancc sources were 9.29 to 10.74 m andrces and the zigza
everberation tafield, offering on et al. [5] were found foufficient familwas also foundd a closer “aud
(in their caseunderestimation was higher c
esults of the y repeated-mource motiono study the efon estimation
en-group facto4) = 231.4, p D, revealed te significantly0.001). The p
0.7 s for statiche reverse was). We return
ng the differen
zigzag motionn than the otheer-source distes. Stimulus de possible foroving sourcesn of zigzag soun Fig. 16, whens. Thus, a mmuli of statics horizontal ax25~1.5). The r
ndition is -1.25termined by c
riors for the h reverberatio
e variations for 22 m away from td from 5 to 18.69ag moving source
ail contributesbetter conditioreported that
r a more reveriarity with thed in Bronkhorditory horizone, with T60= 0.on was less frcompared to t
current studymeasures ANn were treatffect of reverbn performancors, source mo
< 0.001]. Pothat judgemeny less accuraterformance fo
c and linear ms true for the
n to this confnces between
n have a widerer source motiance was a coistance variatir the linear ms respectivelyurces is indica
ereas the smallmore limited ra
and linear sxis) when comrange of the tr5 to 1.5. The horresponding
EC-DRR likeon conditions.
three simulatedthe listener, while m were specifie
es respectively.
9
s to the ons for t more rberant e room rst and
n” for a .1 s vs. requent the less
y were NOVA. ted as eration e. The otion × ost hoc nts for te than or T60= moving zigzag
flicting source
r range ions, as onstant ions of moving y. The ated by ler box ange of sources mpared raining heights curves
elihood These
d sourcee varyingd for the
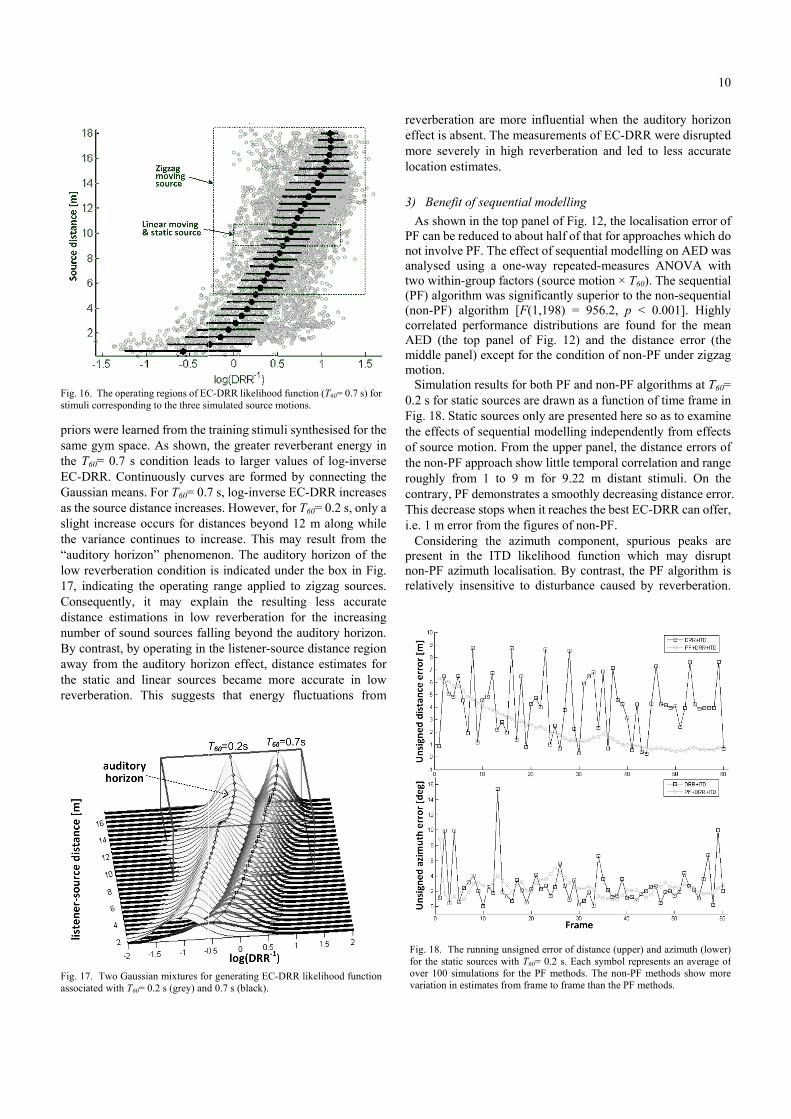
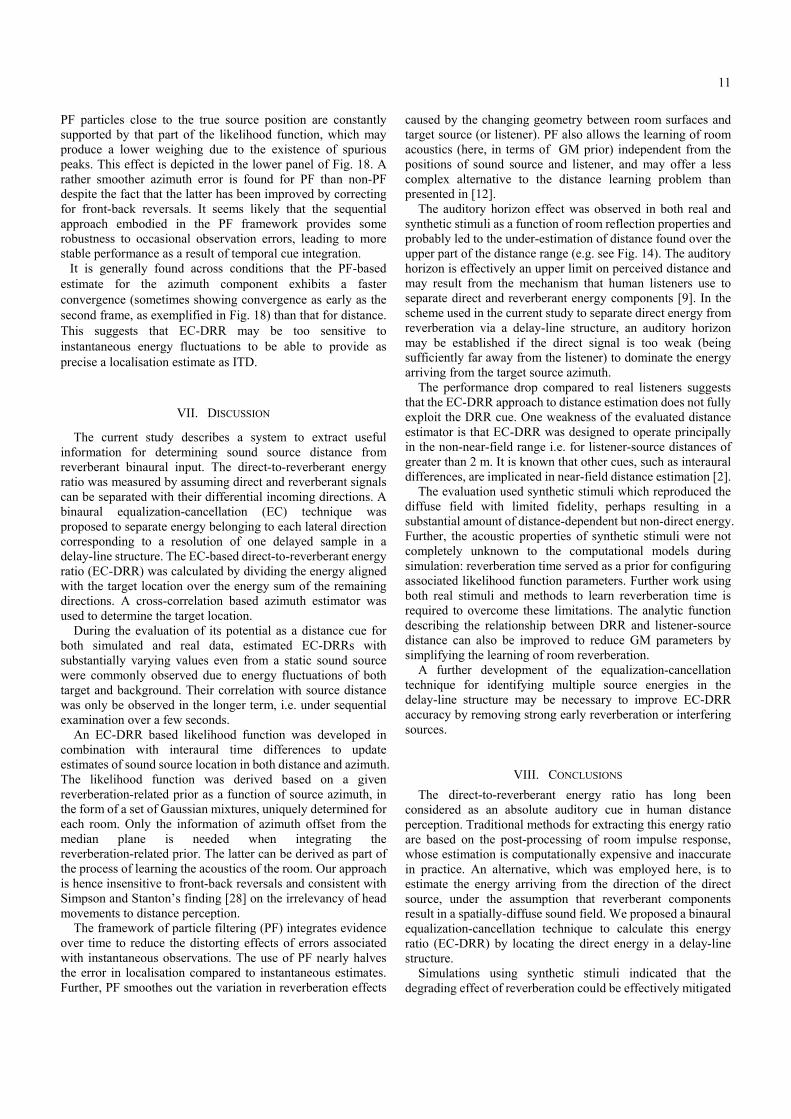
prsathECGasslith“alo17CdinuByawthre
Figas
Figsti
riors were learame gym spache T60= 0.7 s C-DRR. Cont
Gaussian means the source diight increase
he variance coauditory horizow reverberati7, indicating tonsequently, istance estimaumber of souny contrast, byway from the he static and everberation.
g. 17. Two Gaussociated with T60=
g. 16. The operatimuli correspondi
rned from the ce. As shown,condition leatinuously curvs. For T60= 0.7stance increasoccurs for di
ontinues to inzon” phenomeion condition the operating it may exp
ations in lownd sources fal
y operating in auditory horilinear sourceThis suggest
ssian mixtures fo= 0.2 s (grey) and
ting regions of ECing to the three si
training stimu, the greater rds to larger vves are forme7 s, log-inversses. However,stances beyon
ncrease. This enon. The audis indicated urange applie
lain the resuw reverberation
lling beyond tthe listener-soizon effect, des became mts that energ
r generating EC-d 0.7 s (black).
C-DRR likelihoodimulated source m
uli synthesisedreverberant envalues of log-ed by connectse EC-DRR in for T60= 0.2 snd 12 m alongmay result fr
ditory horizonunder the box ed to zigzag sulting less an for the incthe auditory hource distance
distance estimamore accurate
y fluctuation
DRR likelihood
d function (T60= 0motions.
d for the nergy in -inverse ting the ncreases s, only a g while rom the n of the
in Fig. sources. accurate creasing horizon. e region ates for in low
ns from
reveffmoloc 3)
APFnoantw(PF(nocoAEmimo
S0.2Figtheof theroucoThi.e
Cprenorel
function
Fifoovva
0.7 s) for
verberation arfect is absent. ore severely ication estimat
Benefit of seAs shown in thF can be reducot involve PF. nalysed using wo within-grou
F) algorithm won-PF) algorirrelated perfoED (the top piddle panel) exotion. Simulation res2 s for static sg. 18. Static soe effects of se
f source motioe non-PF apprughly from 1ntrary, PF dem
his decrease ste. 1 m error froConsidering tesent in the
on-PF azimuthlatively insen
ig. 18. The runnior the static sourcver 100 simulatioariation in estima
re more influThe measurem
in high reverbtes.
equential modhe top panel oed to about haThe effect of sa one-way r
up factors (souwas significanithm [F(1,198ormance distrpanel of Fig.xcept for the c
sults for both Pources are draources only arequential modon. From the uroach show lit1 to 9 m for monstrates a stops when it reom the figuresthe azimuth ITD likeliho
h localisation.sitive to distu
ing unsigned erroces with T60= 0.2ons for the PF mtes from frame to
ential when tments of EC-Dberation and
delling of Fig. 12, the alf of that for asequential morepeated-measurce motion × ntly superior t8) = 956.2, pributions are f 12) and thecondition of n
PF and non-Pawn as a functre presented h
delling indepenupper panel, thttle temporal c
9.22 m distmoothly decre
eaches the bests of non-PF. component,
ood function By contrast, urbance cause
or of distance (up2 s. Each symbol methods. The nono frame than the P
the auditory hDRR were disled to less ac
localisation eapproaches whodelling on AEsures ANOVAT60). The seq
to the non-seqp < 0.001]. Hfound for the distance erro
non-PF under
PF algorithms tion of time fr
here so as to exndently from he distance ercorrelation andant stimuli. Oeasing distanct EC-DRR can
spurious peawhich may the PF algori
ed by reverbe
pper) and azimuthrepresents an av
n-PF methods shoPF methods.
10
horizon srupted ccurate
error of hich do ED was A with quential quential Highly
e mean or (the zigzag
at T60= rame in xamine effects
rrors of d range On the ce error. n offer,
aks are disrupt ithm is eration.
h (lower)verage ofow more
11
PF particles close to the true source position are constantly supported by that part of the likelihood function, which may produce a lower weighing due to the existence of spurious peaks. This effect is depicted in the lower panel of Fig. 18. A rather smoother azimuth error is found for PF than non-PF despite the fact that the latter has been improved by correcting for front-back reversals. It seems likely that the sequential approach embodied in the PF framework provides some robustness to occasional observation errors, leading to more stable performance as a result of temporal cue integration.
It is generally found across conditions that the PF-based estimate for the azimuth component exhibits a faster convergence (sometimes showing convergence as early as the second frame, as exemplified in Fig. 18) than that for distance. This suggests that EC-DRR may be too sensitive to instantaneous energy fluctuations to be able to provide as precise a localisation estimate as ITD.
VII. DISCUSSION
The current study describes a system to extract useful information for determining sound source distance from reverberant binaural input. The direct-to-reverberant energy ratio was measured by assuming direct and reverberant signals can be separated with their differential incoming directions. A binaural equalization-cancellation (EC) technique was proposed to separate energy belonging to each lateral direction corresponding to a resolution of one delayed sample in a delay-line structure. The EC-based direct-to-reverberant energy ratio (EC-DRR) was calculated by dividing the energy aligned with the target location over the energy sum of the remaining directions. A cross-correlation based azimuth estimator was used to determine the target location.
During the evaluation of its potential as a distance cue for both simulated and real data, estimated EC-DRRs with substantially varying values even from a static sound source were commonly observed due to energy fluctuations of both target and background. Their correlation with source distance was only be observed in the longer term, i.e. under sequential examination over a few seconds.
An EC-DRR based likelihood function was developed in combination with interaural time differences to update estimates of sound source location in both distance and azimuth. The likelihood function was derived based on a given reverberation-related prior as a function of source azimuth, in the form of a set of Gaussian mixtures, uniquely determined for each room. Only the information of azimuth offset from the median plane is needed when integrating the reverberation-related prior. The latter can be derived as part of the process of learning the acoustics of the room. Our approach is hence insensitive to front-back reversals and consistent with Simpson and Stanton’s finding [28] on the irrelevancy of head movements to distance perception.
The framework of particle filtering (PF) integrates evidence over time to reduce the distorting effects of errors associated with instantaneous observations. The use of PF nearly halves the error in localisation compared to instantaneous estimates. Further, PF smoothes out the variation in reverberation effects
caused by the changing geometry between room surfaces and target source (or listener). PF also allows the learning of room acoustics (here, in terms of GM prior) independent from the positions of sound source and listener, and may offer a less complex alternative to the distance learning problem than presented in [12].
The auditory horizon effect was observed in both real and synthetic stimuli as a function of room reflection properties and probably led to the under-estimation of distance found over the upper part of the distance range (e.g. see Fig. 14). The auditory horizon is effectively an upper limit on perceived distance and may result from the mechanism that human listeners use to separate direct and reverberant energy components [9]. In the scheme used in the current study to separate direct energy from reverberation via a delay-line structure, an auditory horizon may be established if the direct signal is too weak (being sufficiently far away from the listener) to dominate the energy arriving from the target source azimuth.
The performance drop compared to real listeners suggests that the EC-DRR approach to distance estimation does not fully exploit the DRR cue. One weakness of the evaluated distance estimator is that EC-DRR was designed to operate principally in the non-near-field range i.e. for listener-source distances of greater than 2 m. It is known that other cues, such as interaural differences, are implicated in near-field distance estimation [2].
The evaluation used synthetic stimuli which reproduced the diffuse field with limited fidelity, perhaps resulting in a substantial amount of distance-dependent but non-direct energy. Further, the acoustic properties of synthetic stimuli were not completely unknown to the computational models during simulation: reverberation time served as a prior for configuring associated likelihood function parameters. Further work using both real stimuli and methods to learn reverberation time is required to overcome these limitations. The analytic function describing the relationship between DRR and listener-source distance can also be improved to reduce GM parameters by simplifying the learning of room reverberation.
A further development of the equalization-cancellation technique for identifying multiple source energies in the delay-line structure may be necessary to improve EC-DRR accuracy by removing strong early reverberation or interfering sources.
VIII. CONCLUSIONS The direct-to-reverberant energy ratio has long been
considered as an absolute auditory cue in human distance perception. Traditional methods for extracting this energy ratio are based on the post-processing of room impulse response, whose estimation is computationally expensive and inaccurate in practice. An alternative, which was employed here, is to estimate the energy arriving from the direction of the direct source, under the assumption that reverberant components result in a spatially-diffuse sound field. We proposed a binaural equalization-cancellation technique to calculate this energy ratio (EC-DRR) by locating the direct energy in a delay-line structure.
Simulations using synthetic stimuli indicated that the degrading effect of reverberation could be effectively mitigated
12
by sequential cue integration for both distance and azimuth estimations. The localisation error of the PF approach is in this way reduced to 47% of that for instantaneous estimation. The advantage of particle filtering was found to be mainly attributable to better localisation in distance, suggesting the importance of sequential integration for auditory cues based on energy measurements.
The performance of source distance estimation using DRR can be accounted for largely in terms of a competition between auditory horizon and energy fluctuation effects. As found for the sources with non-linear motions, better distance localisation performance for PF was obtained in the more reverberant space with a farther auditory horizon. Although energy fluctuations increased with the level of reverberation, their detrimental effect was smoothed by PF cue integration over time.
REFERENCES [1] Y.-C. Lu, “Active hearing strategies for binaural sound localisation in
azimuth and distance by mobile listeners,” Ph.D. thesis, Computer Science department, Sheffield University, Sheffield, UK, 2009.
[2] P. Zahorik, D. S. Brungart, and A. W. Bronkhorst, “Auditory distance perception in humans: a summary of past and present research,” Acta Acustica united with Acustica, vol. 91, no. 3, pp. 409-420, May/Jun., 2005.
[3] D. H. Mershon, and E. King, “Intensity and reverberation as factors in the auditory perception of egocentric distance,” Percept. Psychophys., vol. 18, pp. 409-415, 1975.
[4] D. H. Mershon, and J. N. Bowers, “Absolute and relative cues for the auditory perception of egocentric distance,” Perception, vol. 8, no. 3, pp. 311-22, 1979.
[5] D. H. Mershon, W. L. Ballenger, A. D. Little et al., “Effects of room reflectance and background noise on perceived auditory distance,” Perception, vol. 18, no. 3, pp. 403-16, 1989.
[6] C. W. Sheeline, “An investigation of the effects of direct and reverberant signal interaction on auditory distance perception,” Ph.D. thesis, Hearing & Speech Sciences department, Stanford University, 1984.
[7] P. Zahorik, “Direct-to-reverberant energy ratio sensitivity,” J Acoust Soc Am, vol. 112, no. 5, pp. 2110-2117, Nov., 2002.
[8] P. Zahorik, “Assessing auditory distance perception using virtual acoustics,” J Acoust Soc Am, vol. 111, no. 4, pp. 1832-46, Apr, 2002.
[9] A. W. Bronkhorst, and T. Houtgast, “Auditory distance perception in rooms,” Nature, vol. 397, no. 6719, pp. 517-520, Feb., 1999.
[10] E. Larsen, C. D. Schmitz, C. R. Lansing et al., “Acoustic scene analysis using estimated impulse responses,” in Proc. the Thirty-Seventh Asilomar Conference on Signals, Systems and Computers, 2003, pp. 725-729.
[11] A. W. Bronkhorst, “Modeling auditory distance perception in rooms,” in Proc. EAA Forum Acusticum Sevilla, Sevilla, Spain, 2002.
[12] S. Vesa, “Binaural sound source distance learning in rooms,” IEEE Trans Audio Speech Language Process, vol. 17, no. 8, pp. 1498-1507, Nov., 2009.
[13] K. Furuya, and Y. Kaneda, “Two-channel blind deconvolution for non-minimum phase impulse responses,” in Proc. ICASSP, 1997, pp. 1315-1318.
[14] A. W. Bronkhorst, “Effect of stimulus properties on auditory distance perception in rooms," in Proc. 12th International Symposium on Hearing (ISH): Physiological and Psychological Bases of Auditory Function, Shaker, Mastricht, Holland, 2001, pp. 184-191.
[15] C. Liu, B. C. Wheeler, W. D. O'Brien, Jr. et al., “A two-microphone dual delay-line approach for extraction of a speech sound in the presence of multiple interferers,” J Acoust Soc Am, vol. 110, no. 6, pp. 3218-31, Dec., 2001.
[16] N. I. Durlach, “Note on the equalization and cancellation theory of binaural masking level differences,” J Acoust Soc Am, vol. 32, pp. 1075-1076, 1960.
[17] R. D. Patterson, I. Nimmo-Smith, J. Holdsworth et al., An efficient auditory filterbank based on the gammatone function, TR 2341, Applied Psychology Unit Cambridge, UK, 1988.
[18] H. Viste, and G. Evangelista, “Binaural source localization,” in Proc. 7th International Conference on Digital Audio Effects (DAFx), Naples, Italy, 2004, pp. 145-150.
[19] Y.-C. Lu, and M. Cooke, “Motion strategies for binaural localisation of speech of speech sources in azimuth and distance by artificial listeners,” Speech Commun., 2009 (submitted).
[20] W. G. Gardner, and K. D. Martin, "HRTF measurements of a KEMAR dummy-head microphone," Standards in Computer Generated Music, G. Haus and I. Pighi, eds.: IEEE CS Tech. Com. on Computer Generated Music, 1996.
[21] A. P. Dempster, N. M. Laird, and D. B. Rubin, “Maximum likelihood estimation from incomplete data via the EM algorithm,” Journal of the Royal Statistical Society, vol. B, no. 39, pp. 1-38, 1977.
[22] A. W. Mills, “On the minimum audible angle,” J Acoust Soc Am, vol. 30, pp. 237-246, 1958.
[23] A. Doucet, S. Godsill, and C. Andrieu, “On sequential Monte Carlo sampling methods for Bayesian filtering,” Statistics and Computing, vol. 10, pp. 197-208, 2000.
[24] H. Asoh, F. Asano, T. Yoshimura et al., “An Application of a Particle Filter to Bayesian Multiple Sound Source Tracking with Audio and Video Information Fusion,” in Proc. Fusion, 2004.
[25] D. B. Ward, E. A. Lehmann, and R. C. Williamson, “Particle filtering algorithms for tracking an acoustic source in a reverberant environment,” IEEE Trans. Speech Audio Process, vol. 11, no. 6, pp. 826-836, Nov, 2003.
[26] D. R. Campbell, K. J. Palomäki, and G. Brown, “A Matlab simulation of "shoebox" room acoustics for use in research and teaching,” Computing and Information Systems J., vol. 9, no. 3, pp. 48-51, 2005.
[27] J. B. Allen, and D. A. Berkley, “Image method for efficiently simulating small-room acoustics,” J Acoust Soc Am, vol. 65, no. 4, pp. 943-50, 1979.
[28] W. E. Simpson, and L. D. Stanton, “Head movement does not facilitate perception of the distance of a source of sound,” The American Journal of Psychology, vol. 86, no. 1, pp. 151-159, March, 1973.
Yan-Chen Lu received the B.Sc. and M.Sc. degrees in electronics engineering from National Chiao-Tung University, Hsinchu, Taiwan, in 1997 and 1999. He is currently pursuing the Ph.D. degree in the computer science department, University of Sheffield, UK. His research interests lie in spatial audio perception and computational audition. Martin Cooke received a B.Sc. in Computer Science and Mathematics from the University of Manchester in 1982 and a Ph.D. in Computer Science from the University of Sheffield in 1991. He has worked at the UK National Physical Laboratory, the University of Sheffield and is currently Ikerbasque Professor at the University of the Basque Country, Spain. His research interests include robust automatic speech recognition, speech perception, computational auditory scene analysis, active hearing, the effect of noise on speech production and second language acquisition of speech.