Embed Size (px)
Citation preview
Estimation of Evolutionary Distance between Nucleotide Sequences’
Fumio Tajima and Masatoshi Nei University of Texas at Houston
A mathematical formula for estimating the average number of nucleotide sub- stitutions per site (6) between two homologous DNA sequences is developed by taking into account unequal rates of substitution among different nucleotide pairs. Although this formula is obtained for the equal-input model of nucleotide substitution, computer simulations have shown that it gives a reasonably good estimate for a wide range of nucleotide substitution patterns as long as 6 is equal to or smaller than 1. Furthermore, the frequency of cases to which the formula is inapplicable is much lower than that for other similar methods recently proposed. This point is illustrated using insulin genes. A statistical method for estimating the number of nucleotide changes due to deletion and insertion is also developed. Application of this method to globin gene data indicates that the number of nucleotide changes per site increases with evo- lutionary time but the pattern of the increase is quite irregular.
Introduction
The evolutionary change of DNA sequences occurs by nucleotide substitu- tion, deletion, and insertion. The change due to nucleotide substitution is measured in terms of the number of nucleotide substitutions per site between two homol- ogous DNA sequences. Several statistical methods for estimating this number have been developed. Unfortunately, however, all of them have some deficiencies. Jukes and Cantor’s (1969) method is the simplest one but gives underestimates when the rate of nucleotide substitution is not the same for all nucleotide pairs. Recently, Kimura (1980, 1981), Takahata and Kimura (1981), and Gojobori et al. (1982~1) developed new methods for estimating the number of nucleotide substi- tutions, taking into account unequal rates of substitutions among different nu- cleotide pairs. However, these methods are all dependent on specific schemes of nucleotide substitutions, and if actual nucleotide substitution does not follow these schemes, the methods are expected to give biased estimates. Furthermore, they
1. Key words: nucleotide substitution, insertion, globin genes, insulin genes.
evolutionary distance, unequal substitution rates, deletion,
Address for correspondence and reprints: Dr. Masatoshi Nei, Center for Demographic ulation Genetics, University of Texas at Houston, P.O. Box 20334, Houston, Texas 77225.
and Pop-
Mol. Bid. Evol. 1(3):269-285. 1984. 0 1984 by The University of Chicago. All rights reserved. 0737-4038/84/0103-0003$02.00
269
270 Tajima and Nei
are often inapplicable to actual data because of a negative argument in the log- arithm of the formula used. In this paper we propose a new method that alleviates some of these deficiencies. We shall also consider the evolutionary changes of DNA arising from deletions and insertions and present a method for measuring the amount of these changes.
Number of Nucleotide Substitutions Theory
Consider two homologous nucleotide sequences that diverged from a common ancestral sequence t years ago. We first consider the case where the rate of nucleotide substitution is the same for all pairs of nucleotides and equal to A per site per year. The expected number of nucleotide substitutions per site between the two sequences for this case is given by
S = 2ht. (1)
If we know the proportion (n) of different nucleotides per site, 6 can be estimated by
6 = - v4 log,( 1 - 47-r/3), (2)
where 0 d 7~ d 3/4 (Jukes and Cantor 1969; Kimura and Ohta 1972), At this point, we note that (2) can be written as
6 = - b,log,( 1 - n/b,), (3)
where b, = 1 - Qt. Here qi is the equilibrium frequency of the ith nucleotide (i = 1, 2, 3, 4 corresponding to the nucleotides A, T, G, C). When the rate of nucleotide substitution is the same for a!1 nucleotide pairs, qi = l/4, so that b, = 3/4. We also note that 6, = 3/4 is the maximum value of n, which is attained at t = m*
Kimura (1980, 1981), Takahata and Kimura (1981), and Gojobori et al. (1982a) have shown that when the rate of nucleotide substitution varies with nucleotide pair, (2) gives an underestimate of 6. Part of the reason is that in this case the equilibrium value of 7 is generally smaller than 3/4. Note that in any scheme of nucleotide substitution the value of n at t = 0~ is given by b, = 1 - QT. The value of 4i can be uniquely determined for any substitution scheme (Tajima and Nei 1982). This suggests that (3) may be used as an estimator of 6 even for the case of unequal substitution rates. The estimate of 6 obtained by (3) is always equal to or greater than that obtained by (2).
Equation (3) holds exactly for Tajima and Nei’s (1982) equal-input model of nucleotide substitution with unequal rates. Let h,i be the rate of substitution of the jth nucleotide for the ith nucleotide per unit evolutionary time. This unit evolutionary time can be, for example, year, generation, or 1,000 years, depending on the purpose. In the equal-input model, A, = a, for all i’s except for &. In other words, the rate of substitution of the jth nucleotide for the ith nucleotide is the same, irrespective of the ith nucleotide. Therefore, the substitution rate matrix is given by (Al) in the Appendix, where Aj = 1 - C,+iai. Using this substitution rate matrix, one can prove (3), as shown in the Appendix.
In practice, of course, the pattern of nucleotide substitution does not nec- essarily follow this scheme (see Gojobori et al. 1982b). When the substitution
Divergence of DNA Sequences 271
scheme is different from the equal-input model, (3) is no longer valid, as is clear from the works of Kimura (1980,198 l), Takahata and Kimura (198 l), and Gojobori et al. (1982~). In this case, however, a slight modification of (3) gives a quite reliable estimate, as will be shown later by computer simulation. This modification is based on the following observations. (i) In the equal-input model, cij = x,l(2qjq,) is constant for all i and j (i < j), where xij is the proportion of pairs of nucleotide i and j between the two homologous DNA sequences (see Appendix). (ii) Our computer simulations discussed in the next section have shown that when cij is not constant, (3) tends to give an underestimate. (iii) In the case of the equal- input model, S can also be estimated by using information on the frequencies of nonidentical nucleotide pairs. Namely,
s = - 2i: f: q;qlog,( 1 - cv) ;=I j=;+l
= - b,log,( 1 - T/b,),
where b, = n2/h and
h = i: f: x,2/(24;qj) i=l j=i+l
(see Appendix). When cij is not constant, however, (4) tends to give an timate of S (results from our computer simulations). These observations that an approximate estimate of S is obtained by
6 = - b log,( 1 - n/b),
where b is the average of b, and b, and given by
)/ 2.
(4)
(5)
overes- suggest
(6)
(7)
It is desirable to know the accuracy of this formula for various patterns of nucleotide substitution. However, analytical evaluation of the accuracy is not easy, because the mathematical property of the most general substitution scheme requiring 12 parameters has not been studied. We have therefore conducted a computer simulation to examine this accuracy. As will be shown in the next section, this simulation indicates that (6) gives a quite reliable estimate as long as S is smaller than 1. Needless to say, equation (6) holds exactly for the case of equal substitution rates or the equal-input model.
So far we have considered the deterministic change of DNA divergence. In practice, the numbers of nucleotide substitutions are studied by examining a finite number of nucleotides, and thus the estimate (S) of S is subject to sampling error. The sampling variance of S obtained from (6) is given by
V(8)= (f$V(rr)+ @if(b)
+2 g 2 cov(r,b).
(8)
It can be shown that the second and third terms of (8) are very small compared
272 Tajima and Nei
with the first term unless n (number of nucleotide pairs examined) is unusually small, say, n < 40. Therefore, we have (approximately)
A
V(S) = b2TT( 1 - n)/[ (b - 7T)+2]. (9)
Computer Simulation
In this section we shall examine two different aspects of the accuracies of the estimates of 6 obtained by (3) and (6). One is the effect of deviation of nucleotide substitution from the equal-input model, and the other is the effect of sampling error when a relatively small number of nucleotides are examined. In the study of the former effect we assume that the DNA sequence under investi- gation is infinitely long.
Effect of Deviation from the Equal-Input Model of Substitution
Gojobori et al. (19826) studied the relative rates of nucleotide substitution among the four nucleotides (A, T, G, C) for three functional genes (a and l3 globin genes and ACTH gene) and six pseudogenes (four globin pseudogenes, one Ig V, pseudogene, and one Ul snRNA pseudogene). These relative rates were quite different from the rates expected from any of the mathematical models studied so far. Therefore, it is interesting to know which statistical method gives the best estimate of S when nucleotide substitution occurs according to these observed patterns. We therefore used the nine substitution schemes observed to simulate the evolutionary change of nucleotide sequences. In this simulation we followed Gojobori et al.‘s (1982a) method and computed the S values for the nine substi- tution schemes. That is, the matrix of relative substitution rates (P,j; i # j) was first converted into the matrix of substitution rates (A,) corresponding to k = C,q&+,&. = 0.0078125, where k is the average number of nucleotide substitutions per unit evolutionary time. The values of x0’s for S = 0.25, 0.5, 1.0, and 2.0 were then obtained by squaring the matrix of substitution rates repeatedly (see Gojobori et al. [1982a] for details). Note that S = 0.25, 0.5, etc. are obtained by squaring the matrix five times, six times, etc. From the values of x,‘s, S was estimated by using seven different estimation methods, that is, (a) the Jukes-Cantor (JC) method, (b) Kimura’s (1980) two-parameter (2P) method, (c) Kimura’s (1981) three-sub- stitution-type (3ST) method, (d) Takahata and Kimura’s (1981) (TK) method, (e) Gojobori et al.‘s (1982a) (GIN) method, (f) equation (3), and (g) equation (6). The deviation of the estimate from the true value of S was measured by the following bias index:
I?= [~(8j-?j)2/r]“2, (10)
where Si is the estimate of S for the ith substitution scheme and r is the number of substitution schemes used. In the present case r = 9.
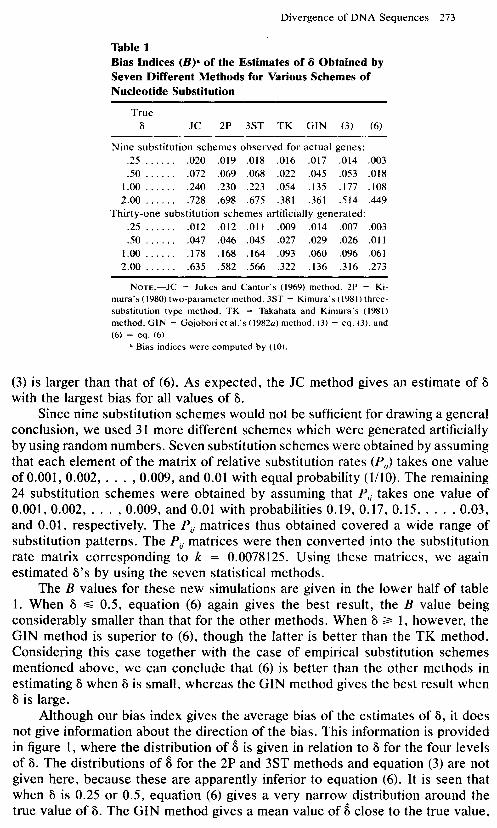
The B values obtained are presented in table 1. It is clear that when S is small, that is, S d 0.5, equation (6) gives an estimate of S with the smallest amount of bias, whereas when S 3 1.0, the TK and GIN methods tend to give a better estimate than equation (6). Equation (3) gives a smaller value of B than the JC, 2P, and 3ST methods for all values of 6, but the bias of the estimate obtained by
Divergence of DNA Sequences 273
Table 1 Bias Indices (B)a of the Estimates of 6 Obtained by Seven Different Methods for Various Schemes of Nucleotide Substitution
True S JC 2P 3ST TK GIN (31 (6)
Nine substitution schemes observed for actual genes: .25 ...... .020 .019 .018 .016 .017 .014 .003 .50 ...... .072 .069 .068 .022 .045 .053 .018
1 .oo ...... .240 .230 .223 .054 .135 .177 .108 2.00 ...... .728 .698 .675 .381 .361 .514 .449
Thirty-one substitution schemes artificially generated: .25 ...... .012 .012 .Oll .009 .014 .007 .003 .50 ...... .047 .046 .045 .027 .029 .026 .Oll
1.00 ...... .178 .168 .164 .093 .060 .096 .061 2.00 ...... .635 .582 .566 .322 .136 .316 .273
NOTE.-JC = Jukes and Cantor’s (1969) method, 2P = Ki- mura’s (1980) two-parameter method, 3ST = Kimura’s ( 198 I) three- substitution type method, TK = Takahata and Kimura’s (1981) method, GIN = Gojobori et al.‘s (1982~) method, (3) = eq. (3). and (6) = eq. (6).
d Bias indices were computed by (IO).
(3) is larger than that of (6). As expected, the JC method gives an estimate of 6 with the largest bias for all values of 6.
Since nine substitution schemes would not be sufficient for drawing a general conclusion, we used 31 more different schemes which were generated artificially by using random numbers. Seven substitution schemes were obtained by assuming that each element of the matrix of relative substitution rates (P,) takes one value of 0.001, 0.002, . . . , 0.009, and 0.01 with equal probability (l/10). The remaining 24 substitution schemes were obtained by assuming that P, takes one value of 0.001, 0.002, . . . , 0.009, and 0.01 with probabilities 0.19, 0.17, 0.15, . . . , 0.03, and 0.01, respectively. The P, matrices thus obtained covered a wide range of substitution patterns. The P, matrices were then converted into the substitution rate matrix corresponding to k = 0.0078125. Using these matrices, we again estimated 6’s by using the seven statistical methods.
The B values for these new simulations are given in the lower half of table 1. When 6 d 0.5, equation (6) again gives the best result, the B value being considerably smaller than that for the other methods. When 6 3 1, however, the GIN method is superior to (6), though the latter is better than the TK method. Considering this case together with the case of empirical substitution schemes mentioned above, we can conclude that (6) is better than the other methods in estimating 6 when 6 is small, whereas the GIN method gives the best result when 6 is large.
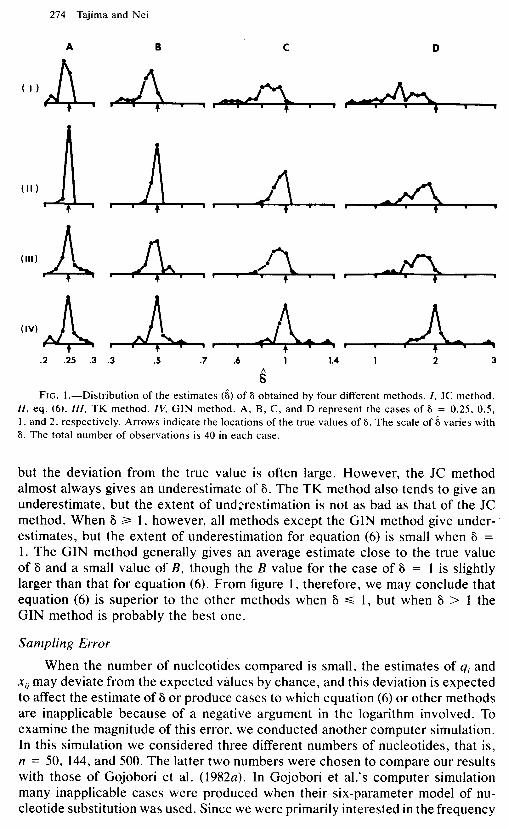
Although our bias index gives the average bias of the estimates of 6, it does not give information about the direction of the bias. This information is provided in figure 1, where the distribution of 8 is given in relation to 6 for the four levels of 6. The distributions of 8 for the 2P and 3ST methods and equation (3) are not given here, because these are apparently inferior to equation (6). It is seen that when 6 is 0.25 or 0.5, equation (6) gives a very narrow distribution around the true value of 6. The GIN method gives a mean value of 8 close to the true value,
274 Tajima and Nei
.2 .25 .3 .3 .5 .7 .6 1 1.4 1 2 3
6
FIG. I.-Distribution of the estimates (6) of 6 obtained by four different methods. I, JC method. ZZ, eq. (6). III, TK method. IV, GIN method. A, B, C, and D represent the cases of 6 = 0.25, 0.5, 1, and 2, respectively. Arrows indicate the locations of the true values of 6. The scale of 6 varies with 6. The total number of observations is 40 in each case.
but the deviation from the true value is often large. However, the JC method almost always gives an underestimate of 6. The TK method also tends to give an underestimate, but the extent of underestimation is not as bad as that of the JC method. When 6 2 1, however, all methods except the GIN method give under- estimates, but the extent of underestimation for equation (6) is small when 6 = 1. The GIN method generally gives an average estimate close to the true value of 6 and a small value of B, though the B value for the case of 6 = 1 is slightly larger than that for equation (6). From figure 1, therefore, we may conclude that equation (6) is superior to the other methods when 6 d 1, but when 6 > 1 the GIN method is probably the best one.
Sampling Error
When the number of nucleotides compared is small, the estimates of 4, and xij may deviate from the expected values by chance, and this deviation is expected to affect the estimate of 6 or produce cases to which equation (6) or other methods are inapplicable because of a negative argument in the logarithm involved. To examine the magnitude of this error, we conducted another computer simulation. In this simulation we considered three different numbers of nucleotides, that is, n = 50, 144, and 500. The latter two numbers were chosen to compare our results with those of Gojobori et al. (1982a). In Gojobori et al.‘s computer simulation many inapplicable cases were produced when their six-parameter model of nu- cleotide substitution was used. Since we were primarily interested in the frequency
Divergence of DNA Sequences 275
of inapplicable cases, we used the same substitution model. The substitution rates used were (x = 0.00125, (x, = 0.008, CX, = 0.118, l3 = 0.005, l3, = 0.004, and p2 = 0.0059 with k = 0.01, where the parameters (x, OL,, etc. are identical to those given in Gojobori et al.‘s (1982~~) table 2. Ancestral sequences of 50, 144, and 500 nucleotides were generated by using pseudorandom numbers. From each of these ancestral sequences, 50 pairs of descendant nucleotide sequences were randomly produced for each of 6 = 1.0 and 2.0 by using the method described by Gojobori et al. (1982~~). For each pair of descendant sequences, x0’s were computed, and qi = xii + c. ,+,x,/2 was obtained. Using these 4,‘s and x,‘s, we estimated 6 by the JC method and equations (3) and (6). In the case of 6 = 2.0, the S values for n = 50 were not computed, since in this case an estimate of 6 is obviously unreliable because of a large sampling error.
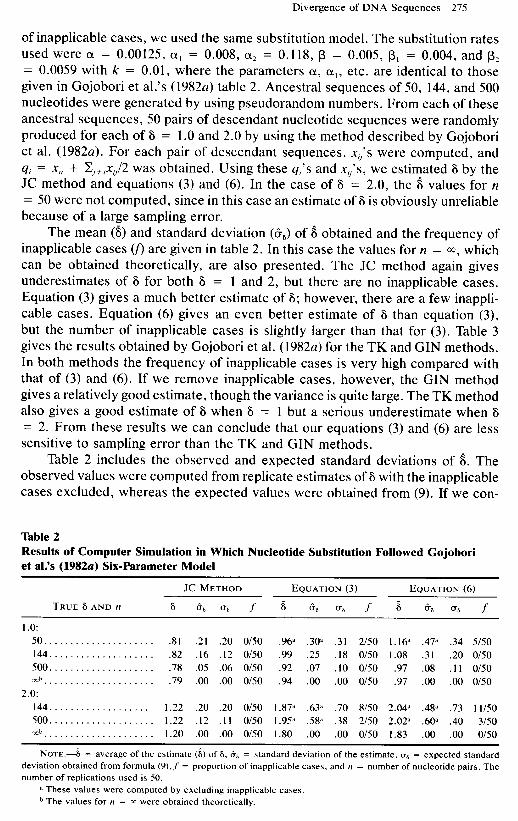
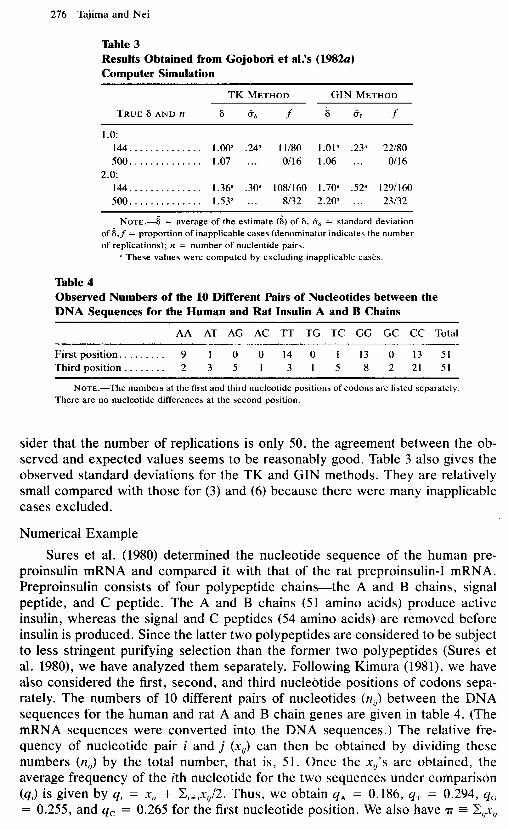
The mean (6) and standard deviation (G-,) of S obtained and the frequency of inapplicable cases (f) are given in table 2. In this case the values for n = a, which can be obtained theoretically, are also presented. The JC method again gives underestimates of 6 for both S = 1 and 2, but there are no inapplicable cases. Equation (3) gives a much better estimate of 6; however, there are a few inappli- cable cases. Equation (6) gives an even better estimate of 6 than equation (3), but the number of inapplicable cases is slightly larger than that for (3). Table 3 gives the results obtained by Gojobori et al. (1982a) for the TK and GIN methods. In both methods the frequency of inapplicable cases is very high compared with that of (3) and (6). If we remove inapplicable cases, however, the GIN method gives a relatively good estimate, though the variance is quite large. The TK method also gives a good estimate of 6 when 6 = 1 but a serious underestimate when 6 = 2. From these results we can conclude that our equations (3) and (6) are less sensitive to sampling error than the TK and GIN methods.
Table 2 includes the observed and expected standard deviations of S. The observed values were computed from replicate estimates of 6 with the inapplicable cases excluded, whereas the expected values were obtained from (9). If we con-
Table 2 Results of Computer Simulation in Which Nucleotide Substitution Followed Gojobori et al.% (1982~) Six-Parameter Model
JC METHOD EQUATION (3) EQUATION (6)
TRUE~AND~ s 66 ug f s 68 erg f s &s ug f
1 .o: 50 ..................... .81 .21 .20 o/50 .96” .30d .31 2150 1.16“ .47” .34 5150 144 .................... .82 .16 .12 O/50 .99 .25 .18 O/50 1.08 .31 .20 O/50 500 .................... .78 .05 .06 O/50 .92 .07 .lO o/50 .97 .08 .ll o/50 =h ..................... .79 .oo .oo o/50 .94 .oo .oo o/50 .97 .oo .oo o/50
2.0: 144 .................... 1.22 .20 .20 O/50 1.87” .63d .70 8150 2.04” .48” .73 11/50 500 .................... 1.22 .12 .ll O/50 l.958 .58” .38 2/50 2.02” .60” .40 3150 =h ..................... 1.20 .OO .OO O/50 1.80 .oo .OO O/50 1.83 .oo .oo o/50
NOTE.-6 = average of the estimate (6) of 6. +, = standard deviation of the estimate, ug = expected standard deviation obtained from formula (9j.f = proportion of inapplicable cases, and n = number of nucleotide pairs. The number of replications used is 50.
d These values were computed by excluding inapplicable cases. h The values for n = 3~ were obtained theoretically.
276 Tajima and Nei
Table 3 Results Obtained from Gojobori et al.% (1982a) Computer Simulation
TK METHOD GIN METHOD
TRUE 6 AND n s &‘s f 6 68 f
1.0: 144.. . . . . . . . . . . . . 1.00” .24” 1 l/80 1.01” .23” 22180 500. * . . . . . . . . . . . . 1.07 . . . O/16 1.06 . . . O/16
2.0: 144.. . . . . . . . . . . . . 1.36” .30” 108/160 1.70” .52” 129/160 500. . . . . . . . . . . . . . 1.53” . . . 8132 2.20” . . . 23132
NoTE.-~ = average of the estimate (6) of 6, & = standard deviation of d,f = proportion of inapplicable cases (denominator indicates the number of replications); n = number of nucleotide pairs.
a These values were computed by excluding inapplicable cases.
Table 4 Observed Numbers of the 10 Different Pairs of Nucleotides between the DNA Sequences for the Human and Rat Insulin A and B Chains
AA AT AG AC TT TG TC GG GC CC Total
First position ......... 9 1 0 0 14 0 1 13 0 13 51 Third position ........ 2 3 5 1 3 1 5 8 2 21 5 1
No-rE.-The numbers at the first and third nucleotide positions There are no nucleotide differences at the second position.
of codons are listed separately.
sider that the number of replications is only 50, the agreement between the ob- served and expected values seems to be reasonably good. Table 3 also gives the observed standard deviations for the TK and GIN methods. They are relatively small compared with those for (3) and (6) because there were many inapplicable cases excluded.
Numerical Example
Sures et al. (1980) determined the nucleotide sequence of the human pre- proinsulin mRNA and compared it with that of the rat preproinsulin-I mRNA. Preproinsulin consists of four polypeptide chains-the A and B chains, signal peptide, and C peptide. The A and B chains (51 amino acids) produce active insulin, whereas the signal and C peptides (54 amino acids) are removed before insulin is produced. Since the latter two polypeptides are considered to be subject to less stringent purifying selection than the former two polypeptides (Sures et al. 1980), we have analyzed them separately. Following Kimura (1981), we have also considered the first, second, and third nucleotide positions of codons sepa- rately. The numbers of 10 different pairs of nucleotides (n,) between the DNA sequences for the human and rat A and B chain genes are given in table 4. (The mRNA sequences were converted into the DNA sequences.) The relative fre- quency of nucleotide pair i and j (x,) can then be obtained by dividing these numbers (n,) by the total number, that is, 51. Once the x0’s are obtained, the average frequency of the ith nucleotide for the two sequences under comparison (4;) is given by 4; = xii + Cj,,x,/2. Thus, we obtain q, = 0.186, qT = 0.294, qG = 0.255, and qc = 0.265 for the first nucleotide position. We also have n = C,,x,
Divergence of DNA Sequences 277
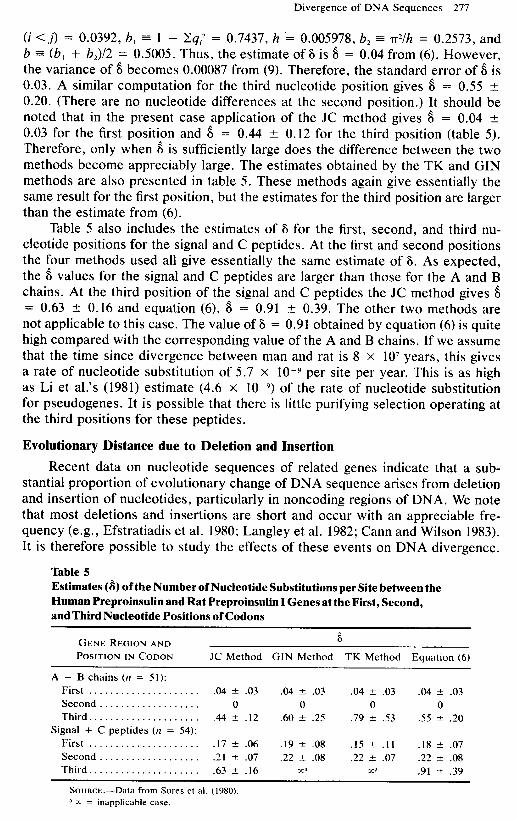
(i < j) = O.O392,b, = 1 - Cq? = 0.7437,h = 0.005978,6, = n*/h = 0.2573, and 6 = (b, + b,)/2 = 0.5005. Thus, the estimate of 6 is 8 = 0.04 from (6). However, the variance of 6 becomes 0.00087 from (9). Therefore, the standard error of 8 is 0.03. A similar computation for the third nucleotide position gives 8 = 0.55 + 0.20. (There are no nucleotide differences at the second position.) It should be noted that in the present case application of the JC method gives 8 = 0.04 2 0.03 for the first position and 6 = 0.44 k 0.12 for the third position (table 5). Therefore, only when 6 is sufficiently large does the difference between the two methods become appreciably large. The estimates obtained by the TK and GIN methods are also presented in table 5. These methods again give essentially the same result for the first position, but the estimates for the third position are larger than the estimate from (6).
Table 5 also includes the estimates of 6 for the first, second, and third nu- cleotide positions for the signal and C peptides. At the first and second positions the four methods used all give essentially the same estimate of 6. As expected, the 6 values for the signal and C peptides are larger than those for the A and B chains. At the third position of the signal and C peptides the JC method gives 6 = 0.63 + 0.16 and equation (6), 8 = 0.91 + 0.39. The other two methods are not applicable to this case. The value of 6 = 0.91 obtained by equation (6) is quite high compared with the corresponding value of the A and B chains. If we assume that the time since divergence between man and rat is 8 x 10’ years, this gives a rate of nucleotide substitution of 5.7 x 1O-9 per site per year. This is as high as Li et al.‘s (1981) estimate (4.6 x 10⁻⁹) of the rate of nucleotide substitution for pseudogenes. It is possible that there is little purifying selection operating at the third positions for these peptides.
Evolutionary Distance due to Deletion and Insertion
Recent data on nucleotide sequences of related genes indicate that a sub- stantial proportion of evolutionary change of DNA sequence arises from deletion and insertion of nucleotides, particularly in noncoding regions of DNA. We note that most deletions and insertions are short and occur with an appreciable fre- quency (e.g., Efstratiadis et al. 1980; Langley et al. 1982; Cann and Wilson 1983). It is therefore possible to study the effects of these events on DNA divergence.
Table 5 Estimates (8) of the Number of Nucleotide Substitutions per Site between the Human Preproinsulin and Rat Preproinsulin I Genes at the First, Second, and Third Nucleotide Positions of Codons
GENE REGION AND POSITION IN CODON
6
JC Method GIN Method TK Method Equation (6)
A + B chains (n = 51): First ..................... .04 k .03 .04 * .03 .04 5 .03 .04 + .03 Second.. ................. 0 0 0 0 Third. .................... .44 + .12 .60 k .25 .79 -t- .53 .55 ” .20
Signal + C peptides (n = 54): First ..................... .17 +- .06 .19 t .08 .15 + .I1 .18 + .07 Second.. ................. .21 Y!Y .07 .22 rfr .08 .22 + .07 .22 ” .08 Third. .................... .63 k .16 ma co* .91 -+ .39
SOURCE.-Data from Sures et al. (1980). a 5 = inapplicable case.
278 Tajima and Nei
Nei et al. (1984) proposed a simple method of measuring the evolutionary distance between two homologous DNA sequences due to deletion and insertion: they compute the number of gap nucleotides per nucleotide site between a pair of DNA sequences compared. This quantity seems to be appropriate when a short period of evolutionary time is considered. When the evolutionary time considered is long, however, the following method seems to be better than that of Nei et al. (1984).
We again consider two homologous nucleotide sequences (X and Y) that diverged from a common ancestral sequence t evolutionary time units (e.g., years) ago. We assume that the length of a deletion or insertion is short compared with the total length of the DNA sequence (n) and that deletion and insertion occur independently. Let 01 be the proportion of DNA that is deleted during unit evo- lutionary time, i.e., cx = m,ln, where m, is the number of nucleotides deleted and n is the total number of nucleotides before deletion. Note also that cx is the number of nucleotide deletions per nucleotide site and usually a very small quan- tity. Similarly, we denote by l3 the proportion of DNA that is inserted during unit evolutionary time, that is, l3 = m,ln, where m, is the number of nucleotides inserted. We assume that rz remains more or less the same because of the com- pensating effects of deletion and insertion. In practice, cx and l3 may vary with evolutionary time, and we denote the values of (x and l3 for the ith evolutionary time unit by (Y~ and pi, respectively. If we assume that deletion and insertion occur independently in sequences X and Y the total number of nucleotide deletions and insertions per nucleotide site over the entire t is given by
I- I
Yz2CCaI+ pi) i=O (11)
= 2(& + p>t,
where & and p are the averages of tii and pi over evolutionary time, respectively. In this connection it should be noted that y measures only the DNA divergence due to deletion and insertion, and no consideration is given to the DNA changes due to nucleotide substitution.
The value of y can be estimated in the following way. We first consider the evolutionary change of the number of nucleotides (n) in the lineage of X. Let nx(t) be the total number of nucleotides at time t in this lineage. We then have
n,&) = n& - l)(l -a,- ,)(l + P,- J
r-1
=n.r(0)n(l -%X1 + pi) i=O
(12)
where n,(O) is the initial number of nucleotides. A similar expression can be obtained for n for Y that is, ny(t). However, the total number of homologous nucleotides shared by X and Y is given by
nxy(t) = nxJt - l)( 1 - (x,_ ,)* (13)
-n,(O)e-*%,
Divergence of DNA Sequences 279
because insertions do not create any homologous DNA segments. Therefore, we have
(14)
where n,, n,, and n,, are the observed values of n*(t), ny(t), and nxy(t). Thus, y in (11) can be estimated by
y= -2 1ogp.
It is noted that P can also be defined as
P=2n,J(n,+n,). W-5)
This definition is simpler than (14), but when the rates (CX and l3) of deletion and insertion are not the same for sequences X and I: (14) is more reasonable. In practice, however, (14) and (16) usually give very similar values.
Comparison with Nei et al.‘s Formula
Nei et al. (1984) proposed to measure the DNA divergence due to deletion and insertion by
Yn, =dmn (17)
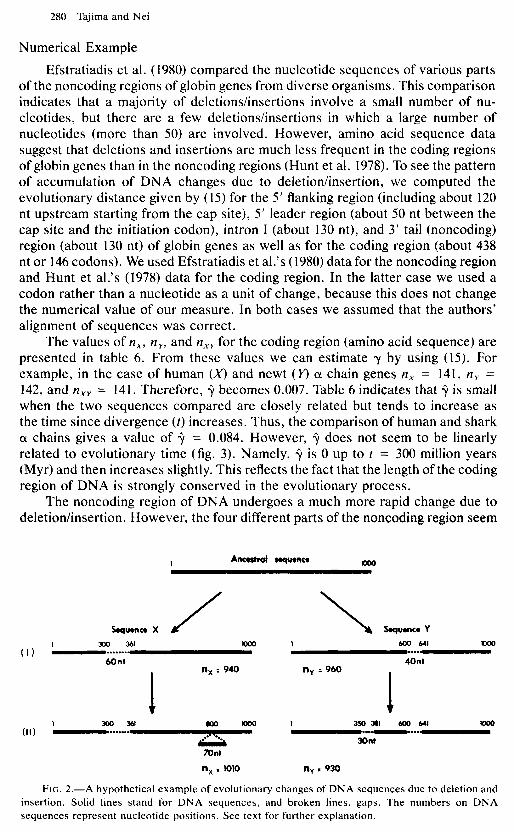
where g is the number of nucleotides in the gaps between two DNA sequences and m,is the total number of nucleotides compared. This gives a minimum estimate of DNA divergence due to deletion and insertion. This can be seen from figure 2, in which an artificial example of evolutionary change of DNA due to deletion and insertion is presented. In this example sequence X at time I has a deletion of 60 nucleotides (nt) starting from nucleotide position 301, whereas sequence Y has a deletion of 40 nt starting from position 601. Therefore, the divergence between X and Y is properly measured by Y,,~, which becomes lOO/l,OOO = 0.1. In practice, however, we do not know the ancestral sequence of X and Y so it is difficult to determine whether the two gaps between X and Y are due to deletion or insertion. If they are caused by insertion, the ancestral sequence should have had 900 nt instead of 1,000. In this case the DNA divergence should be 100/900 = 0.111. This indicates that Y,,, gives an underestimate of DNA changes if both deletion and insertion occur. Our formula (15) takes care of both deletion and insertion, though it depends on the model used. In the present case the estimate (9) obtained by equation (15) is 0.108, which is intermediate between the two estimates obtained above.
Another advantage of y over 9,,1 is that it takes care of multiple events of deletion and insertion at least to some extent. In figure 2 sequence X experienced an insertion during the evolutionary period between time I and time II, whereas sequence Y experienced another deletion involving positions from 35 1 to 380. The latter deletion is overlapped with the deletion in X, so that Y,,~ gives an underes- timate of DNA changes. It becomes 180/1,060 = 0.170. In (15) deletions and insertions are assumed to occur independently, and multiple deletions and inser- tions are taken into account. Indeed, + becomes - 2 log,(880/~1 ,010 x 930) = 0.193, which is larger than Y,,,.
280 Tajima and Nei
Numerical Example
Efstratiadis et al. (1980) compared the nucleotide sequences of various parts of the noncoding regions of globin genes from diverse organisms. This comparison indicates that a majority of deletions/insertions involve a small number of nu- cleotides, but there are a few deletions/insertions in which a large number of nucleotides (more than 50) are involved. However, amino acid sequence data suggest that deletions and insertions are much less frequent in the coding regions of globin genes than in the noncoding regions (Hunt et al. 1978). To see the pattern of accumulation of DNA changes due to deletion/insertion, we computed the evolutionary distance given by (15) for the 5’ flanking region (including about 120 nt upstream starting from the cap site), 5’ leader region (about 50 nt between the cap site and the initiation codon), intron I (about 130 nt), and 3’ tail (noncoding) region (about 130 nt) of globin genes as well as for the coding region (about 438 nt or 146 codons). We used Efstratiadis et al.‘s (1980) data for the noncoding region and Hunt et al.‘s (1978) data for the coding region. In the latter case we used a codon rather than a nucleotide as a unit of change, because this does not change the numerical value of our measure. In both cases we assumed that the authors’ alignment of sequences was correct.
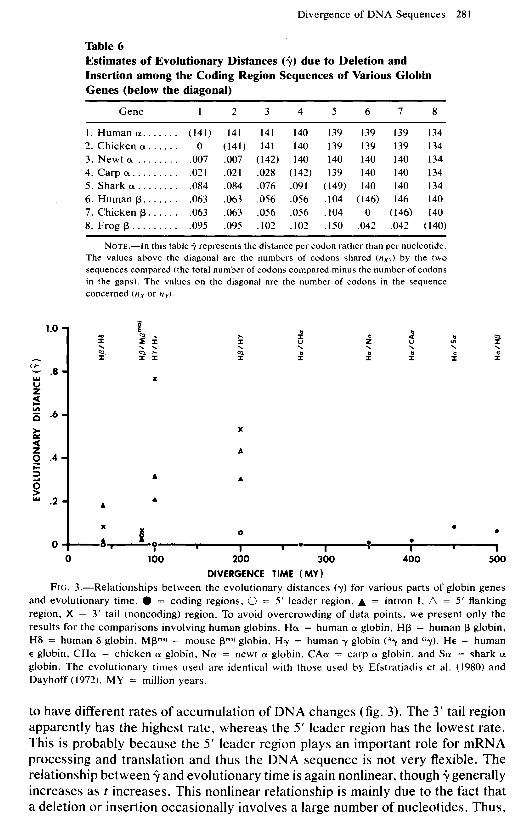
The values of n,, n,, and nxv for the coding region (amino acid sequence) are presented in table 6. From these values we can estimate y by using (15). For example, in the case of human (X) and newt (Y) CY chain genes n, = 141, n, = 142, and n,, = 141. Therefore, 9 becomes 0.007. Table 6 indicates that 9 is small when the two sequences compared are closely related but tends to increase as the time since divergence (t) increases. Thus, the comparison of human and shark 01 chains gives a value of 9 = 0.084. However, + does not seem to be linearly related to evolutionary time (fig. 3). Namely, + is 0 up to t = 300 million years (Myr) and then increases slightly. This reflects the fact that the length of the coding region of DNA is strongly conserved in the evolutionary process.
The noncoding region of DNA undergoes a much more rapid change due to deletion/insertion. However, the four different parts of the noncoding region seem
Smqumcr Y
600 Ml moo loo0 1 (I) NV,. . . . . . . . . ..I
60nl 40nl
I n, = 940 ny = 960
I mow
(II) ‘w . . . . . . . so0 loo0 1 350 al 600 641 loo0 . ..*-t . . . .
.c 3Ont 7Onl nx = 1010 ny = 930
FIG. 2.-A hypothetical example of evolutionary changes of DNA sequences due to deletion and insertion. Solid lines stand for DNA sequences, and broken lines, gaps. The numbers on DNA sequences represent nucleotide positions. See text for further explanation.
Divergence of DNA Sequences 281
Table 6 Estimates of Evolutionary Distances (9) due to Deletion and Insertion among the Coding Region Sequences of Various Globin Genes (below the diagonal)
Gene 1 2 3 4 5 6 7 8
1. Human cx ....... (141) 141 2. Chicken 0~. ..... 0 (141) 3. Newt (Y ........ .007 .007 4. Carp cx ......... ,021 .021 5. Shark (Y ........ .084 .084 6. Human p. ...... .063 .063 7. Chicken p ...... .063 .063 8. Frog p ......... .095 .095
141 140 139 139 139 134 141 140 139 139 139 134
(142) 140 140 140 140 134 .028 (142) 139 140 140 134 .076 .091 (149) 140 140 134 .056 .056 .104 (146) 146 140 .056 .056 .104 0 (146) 140 .102 .102 .150 .042 .042 (140)
NOTE.-In this table Jo represents the distance per codon rather than per nucleotide. The values above the diagonal are the numbers of codons shared (nxr) by the two sequences compared (the total number of codons compared minus the number of codons in the gaps). The values on the diagonal are the number of codons in the sequence concerned (nx or ny).
X l 0 l It a-p . l l I I I I 1 1
0 100 200 300 400 500 DIVERGENCE TIME ( MY)
FIG. 3.-Relationships between the evolutionary distances (y) for various parts of globin genes and evolutionary time. 0 = coding regions, 0 = 5’ leader region, A = intron I, n = 5’ flanking region, X = 3’ tail (noncoding) region. To avoid overcrowding of data points, we present only the results for the comparisons involving human globins. Ha = human (Y globin, HP = human p globin, H6 = human S globin, Mpmd~ = mouse pm,’ globin, Hy = human y globin (Ay and or). HE = human
E globin, CHa = chicken (Y globin, Na = newt (Y globin, CAcx = carp (Y globin, and SY. = shark OL globin. The evolutionary times used are identical with those used by Efstratiadis et al. (1980) and Dayhoff (1972). MY = million years.
to have different rates of accumulation of DNA changes (fig. 3). The 3’ tail region apparently has the highest rate, whereas the 5’ leader region has the lowest rate. This is probably because the 5’ leader region plays an important role for mRNA processing and translation and thus the DNA sequence is not very flexible. The relationship between 9 and evolutionary time is again nonlinear, though + generally increases as t increases. This nonlinear relationship is mainly due to the fact that a deletion or insertion occasionally involves a large number of nucieotides. Thus,
282 Tajima and Nei
the large value of 9 for the comparison of the 3’ tail regions of the human E and y chains is caused by the fact that the y chain has a long stretch of deletion (44 nt) compared with the E chain.
Discussion
We have seen that our new formulas, particularly equation (6), give a good estimate of nucleotide substitutions as long as the true value of 6 is less than 1. For 6 > 1, the GIN method seems to be better than equation (6), if we exclude the cases where the formulas are inapplicable. However, when 6 > 1, the GIN method is very often inapplicable because of a negative argument in the logarithm involved. Therefore, if we take into account this property as well as the simplicity of equation (6) compared with the GIN formula, (6) seems to be generally pref- erable to the GIN method. It should also be noted that in most studies of molecular evolution 8 is smaller than 1, so that equation (6) can be applied to a wide variety of cases.
It should be noted, however, that equation (6) depends on the assumption that all nucleotide sites examined are subject to the same pattern of nucleotide substitution irrespective of the location of the nucleotide. In practice, this as- sumption does not seem to hold in many cases. It is well known that functionally important parts of genes are subject to nucleotide substitution less often than unimportant parts. Amino acid-altering nucleotide substitutions are also known to occur less frequently than synonymous substitutions. When the number of nucleotide substitutions per site (8) is small, this causes no problem, since there will be few backward and parallel substitutions in this case. As 8 increases, however, backward and parallel substitutions may accumulate at functionally less important sites, whereas functionally more important sites may remain substi- tution free. In this case the method proposed here is expected to give underes- timates of 6. At the present time, it is not easy to take into account this factor properly, though some approximate treatment of the problem has been proposed (Nei and Li 1979). To make a general formulation of this problem, a more detailed knowledge of nucleotide substitution in various genes is required.
Our formulation of y in (15) was presented to quantify the effect of deletion and insertion on the evolutionary change of DNA sequences. As we have seen from data on globin genes, the evolutionary change of DNA arising from these factors occurs in a less regular fashion than that arising from nucleotide substi- tution. This is because there is a small proportion of large deletions and insertions that involves a large number of nucleotides. These deletions and insertions ap- parently occur haphazardly but affect the DNA sequences substantially once they occur. Because of this, y generally does not increase linearly with evolutionary time and thus cannot be used as a molecular clock. Nevertheless, y gives a quantitative measure of DNA change due to deletion and insertion and would be useful for evolutionary studies of DNA sequences.
Acknowledgments
We thank Dr. Clay Stephens for his comments on the manuscript. This work was supported by research grants from the National Institutes of Health and the National Science Foundation.
Divergence of DNA Sequences 283
APPENDIX
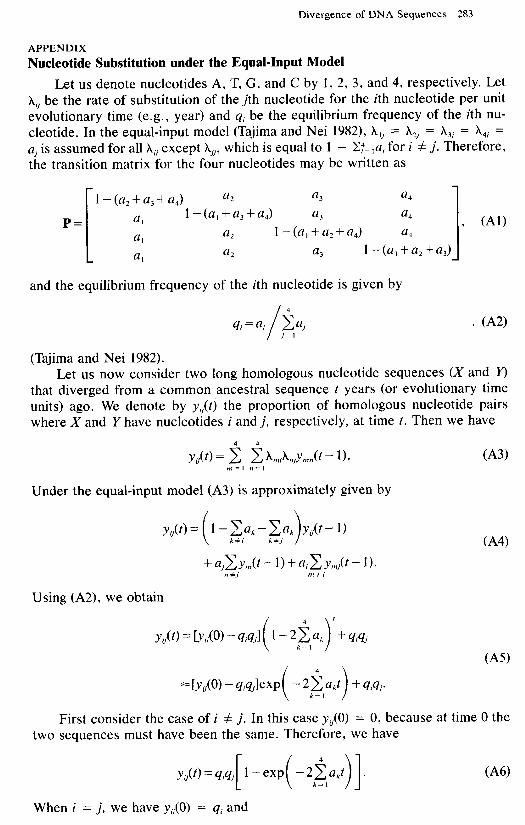
Nucleotide Substitution under the Equal-Input Model
Let us denote nucleotides A, T, G, and C by 1, 2, 3, and 4, respectively. Let A, be the rate of substitution of the jth nucleotide for the ith nucleotide per unit evolutionary time (e.g., year) and 4; be the equilibrium frequency of the ith nu- cleotide. In the equal-input model (Tajima and Nei 1982), h,j = A, = hji = A, = a, is assumed for all A,, except Xi,, which is equal to 1 - IQ= ,a; for i # j. Therefore, the transition matrix for the four nucleotides may be written as
i
1 -(a*+a3+&J a2 a3 a4
P= a, 1 -(a,+a,+a,) a3 a4
a, a2 1 - (a, + a2 + a,) a4
a, a2 a3 1 -(a, +a,+a,)
and the equilibrium frequency of the ith nucleotide is given by
(Tajima and Nei 1982).
I , 0-W
. (A21
Let us now consider two long homologous nucleotide sequences (X and Y) that diverged from a common ancestral sequence t years (or evolutionary time units) ago. We denote by y&t) the proportion of homologous nucleotide pairs where X and Y have nucleotides i and j, respectively, at time t. Then we have
YJt) = f: f: A,iAnjYmn(t - 1). (A3) m=I n=l
Under the equal-input model (A3) is approximately given by
yJt)= l-Cak-- k*i (A4)
+ajCYi~(t-l)+aiCY,j(t- 1). n+j mfi
Using (A2), we obtain f + 4iqj
+ qiqi*
First consider the case of i # j. In this case y,(O) = 0, because at time 0 the two sequences must have been the same. Therefore, we have
y,(t) = qiqj [ (-2&t)]* 1 - exp
When i = j, we have y,,(O) = qi and
646)
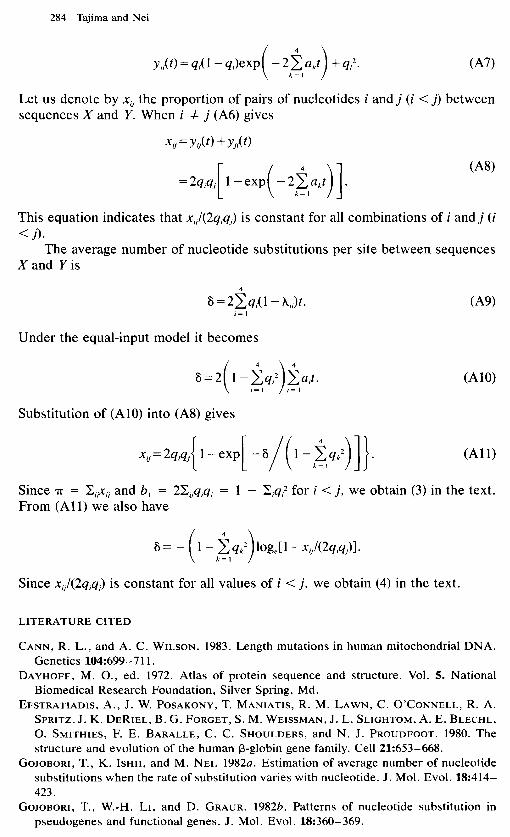
284 Tajima and Nei
YiiCt) = qi( 1 - qi)eXp ( > - 2 2 Llkt + 4:. /%=I
(A7)
Let us denote by xij the proportion of pairs of nucleotides i and j (i < j) between sequences X and Y. When i # j (A6) gives
xlj = Y ijCt) + Yjitt>
= 2qiqj 1 - exp [ (-2&t)]. (A@
This equation indicates that X,l(2qi4,) is constant for all combinations of i and j (i <j).
The average number of nucleotide substitutions per site between sequences X and Y is
6=2~qi(l -Xii)t. (A9) i= 1
Under the equal-input model it becomes
6=2 ( )
l-&i’ &lit. i= 1 i= 1
(AlO)
Substitution of (AlO) into (AS) gives
xij = 2q,q, { [ -~/(l-!%~z)]}.
1 - exp (Al 1)
Since 7~ = IZigg and b, = 2C,qiqj = 1 - I&q? for i < j, we obtain (3) in the text. From (All) we also have
6 = - log,[ 1 - x,l(2C&q,)].
Since X,/(2qiqj) is constant for all values of i < j, we obtain (4) in the text.
LITERATURE CITED
CANN, R. L., and A. C. WILSON. 1983. Length mutations in human mitochondrial DNA. Genetics 104:699-711.
DAYHOFF, M. O., ed. 1972. Atlas of protein sequence and structure. Vol. 5. National Biomedical Research Foundation, Silver Spring, Md.
EFSTRATIADIS, A., J. W. POSAKONY, T. MANIATIS, R. M. LAWN, C. O’CONNELL, R. A. SPRITZ, J. K. DERIEL, B. G. FORGET, S. M. WEISSMAN, J. L. SLIGHTOM, A. E. BLECHL, 0. SMITHIES, F. E. BARALLE, C. C. SHOULDERS, and N. J. PROUDFOOT. 1980. The structure and evolution of the human B-globin gene family. Cell 21:653-668.
GOJOBORI, T., K. ISHII, and M. NEI. 1982~. Estimation of average number of nucleotide substitutions when the rate of substitution varies with nucleotide. J. Mol. Evol. 18:414- 423.
GOJOBORI, T., W.-H. LI, and D. GRAUR. 1982b. Patterns of nucleotide substitution in pseudogenes and functional genes. J. Mol. Evol. l&360-369.
Divergence of DNA Sequences 285
HUNT, L. T., S. HURST-CALDERONE, and M. 0. DAYHOFF. 1978. Globins. Pp. 229-249 in M. 0. DAYHOFF, ed. Atlas of protein sequence and structure. Vol. 5, suppl. 3. National Biomedical Research Foundation, Silver Spring, Md.
JUKES, T. H., and C. R. CANTOR. 1969. Evolution of protein molecules. Pp. 21- 123 in H. N. MUNRO, ed. Mammalian protein metabolism. Academic Press, New York.
KIMURA, M. 1980. A simple method for estimating evolutionary rate of base substitutions through comparative studies of nucleotide sequences. J. Mol. Evol. 16: Ill- 120.
-. 1981. Estimation of evolutionary distances between homologous nucleotide se- quences. Proc. Natl. Acad. Sci. 78:454-458.
KIMURA, M., and T. OHTA. 1972. On the stochastic model for estimation of mutational distance between homologous proteins. J. Mol. Evol. 2:87-90.
LANGLEY, C. H., E. A. MONTGOMERY, and W. F. QUATTLEBAUM. 1982. Restriction map variation in the Adh region of Drosophila. Proc. Natl. Acad. Sci. 79:5631-5635.
LI, W.-H., T. GOJOBORI, and M. NEI. 1981. Pseudogenes as a paradigm of neutral evolution. Nature 292:237-239.
NEI, M., and W.-H. LI. 1979. Mathematical model for studying genetic variation in terms of restriction endonucleases. Proc. Natl. Acad. Sci. 76:5269-5273.
NEI, M., F. TAJIMA, and T. GOJOBORI. 1984. Classification and measurement of DNA polymorphism. In A. CHAKRAVARTI, ed. Methods in human population genetics. Hutch- inson Ross, Stroudsburg, Pa.
SURES, I., D. V. GOEDDEL, A. GRAY, and A. ULLRICH. 1980. Nucleotide sequence of human preproinsulin complementary DNA. Science 208:57-59.
TAJIMA, F., and M. NEI. 1982. Biases of the estimates of DNA divergence obtained by the restriction enzyme technique. J. Mol. Evol. l&115-120.
TAKAHATA, N., and M. KIMURA. 1981. A model of evolutionary base substitutions and its application with special reference to rapid change of pseudogenes. Genetics 98:641- 657.
WALTER M. FITCH, reviewing editor
Received August 29, 1983; revision received October 17, 1983.