Embed Size (px)
Citation preview
Bilan Carbone® 2017Calculating the ECA’s carbon footprint using the Bilan Carbone® method
October 2018
Agenda
Context of the study
Overview of the Bilan Carbone® method
Overall results
Results per scope
Recommendations
1
2
3
4
5
Context of the study
• In 2013, the ECA launched the eco-management and audit scheme, or EMAS project, andadopted its environmental policy with a view to continuously improving its environmentalperformance and introducing measures to prevent pollution and reduce carbon dioxide emissions.
• In order to design measures to reduce its greenhouse gas (GHG) emissions, the Court firstexamined its GHG emissions in 2014, 2015 and 2016 using the Bilan Carbone® methodology.
• This initial carbon footprint helped the ECA identify its main emission sources and appropriatereduction measures.
• The ECA is committed to monitoring and reporting these emissions each year to track its progress inreducing GHG emissions.
Overview of the Bilan Carbone® method
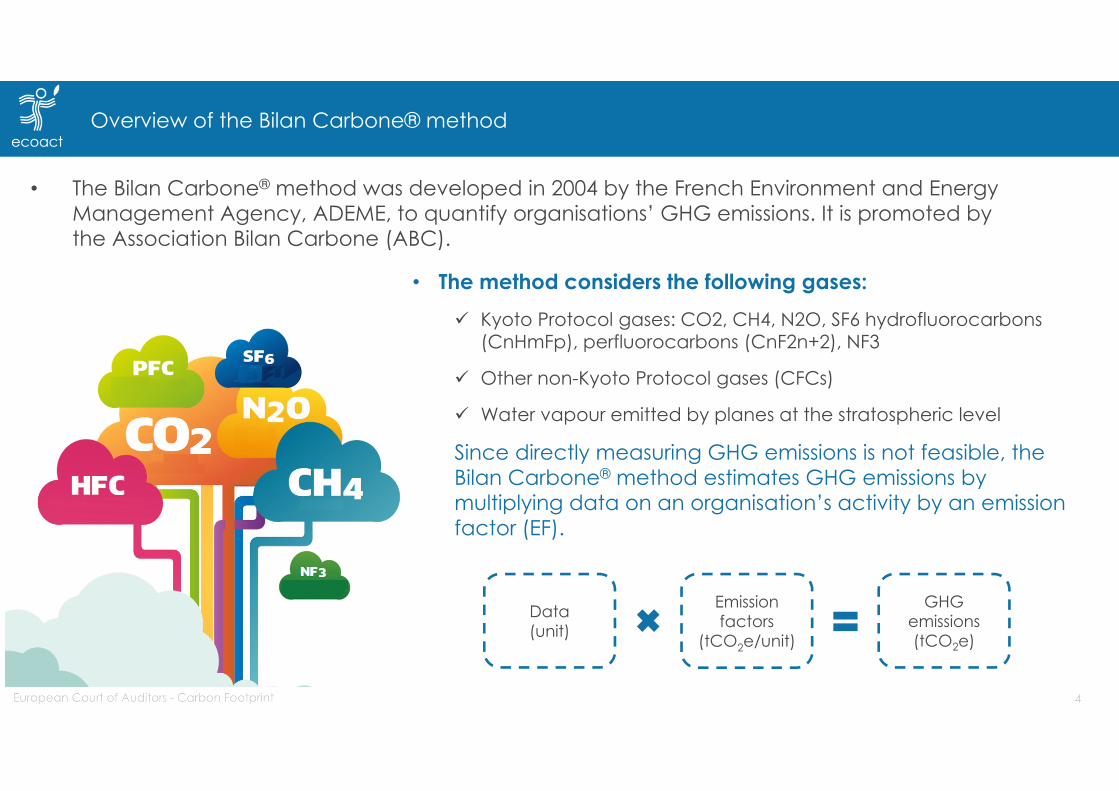
• The Bilan Carbone® method was developed in 2004 by the French Environment and Energy Management Agency, ADEME, to quantify organisations’ GHG emissions. It is promoted by the Association Bilan Carbone (ABC).
• The method considers the following gases: Kyoto Protocol gases: CO2, CH4, N2O, SF6 hydrofluorocarbons
(CnHmFp), perfluorocarbons (CnF2n+2), NF3
Other non-Kyoto Protocol gases (CFCs)
Water vapour emitted by planes at the stratospheric level
Since directly measuring GHG emissions is not feasible, the Bilan Carbone® method estimates GHG emissions by multiplying data on an organisation’s activity by an emission factor (EF).
Data(unit)
Emission factors
(tCO2e/unit)
GHG emissions(tCO2e)
Bilan Carbone® : a decision-making tool
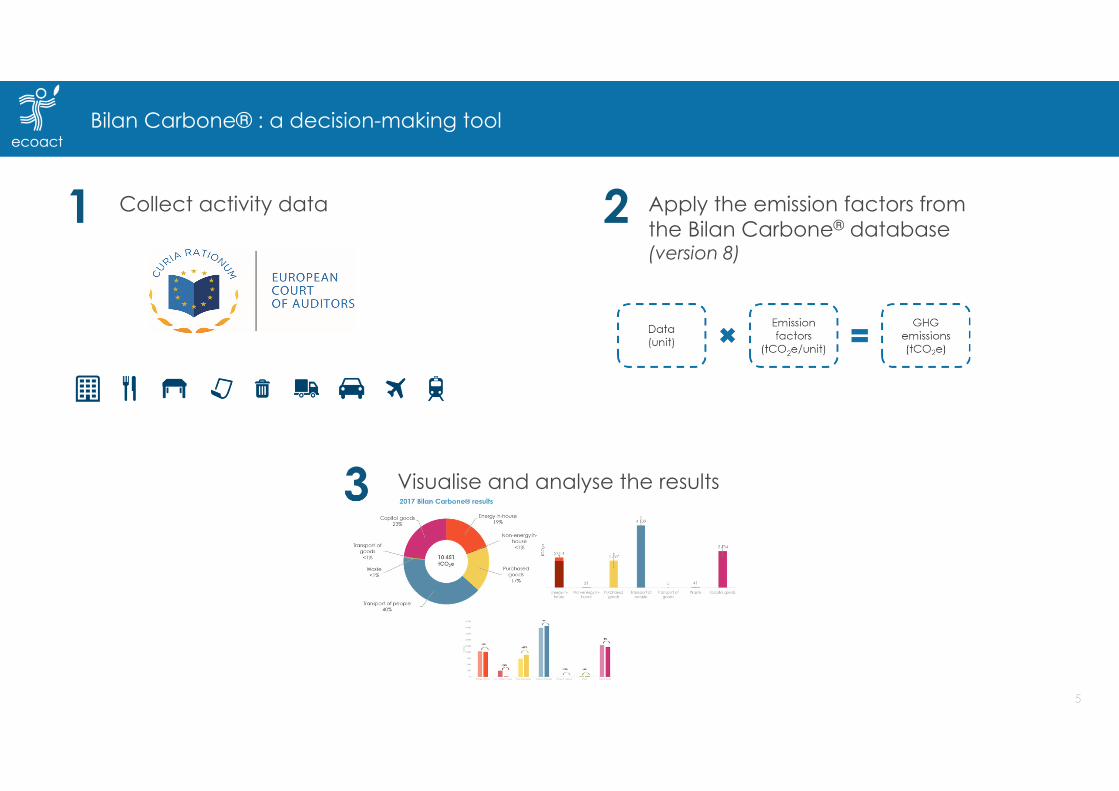
Collect activity data Apply the emission factors from the Bilan Carbone® database (version 8)
Visualise and analyse the results
European Court of Auditors - Carbon Footprint
1 2
3
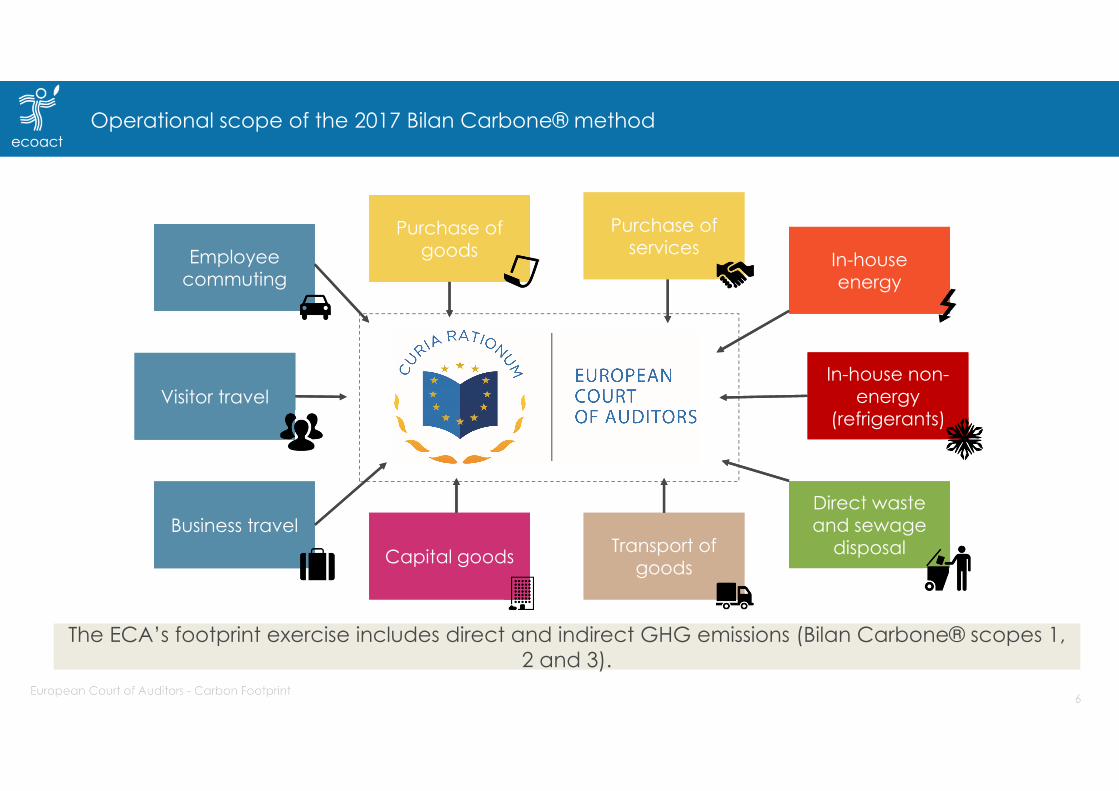
Operational scope of the 2017 Bilan Carbone® method
Capital goodsCapital goods
Purchase of goods
Purchase of goods
Purchase of services
Purchase of services In-house
energyIn-house energy
In-house non-energy
(refrigerants)
In-house non-energy
(refrigerants)
Direct waste and sewage
disposal
Direct waste and sewage
disposalTransport of goods
Transport of goods
Employee commutingEmployee
commuting
Visitor travelVisitor travel
Business travelBusiness travel
The ECA’s footprint exercise includes direct and indirect GHG emissions (Bilan Carbone® scopes 1, 2 and 3).
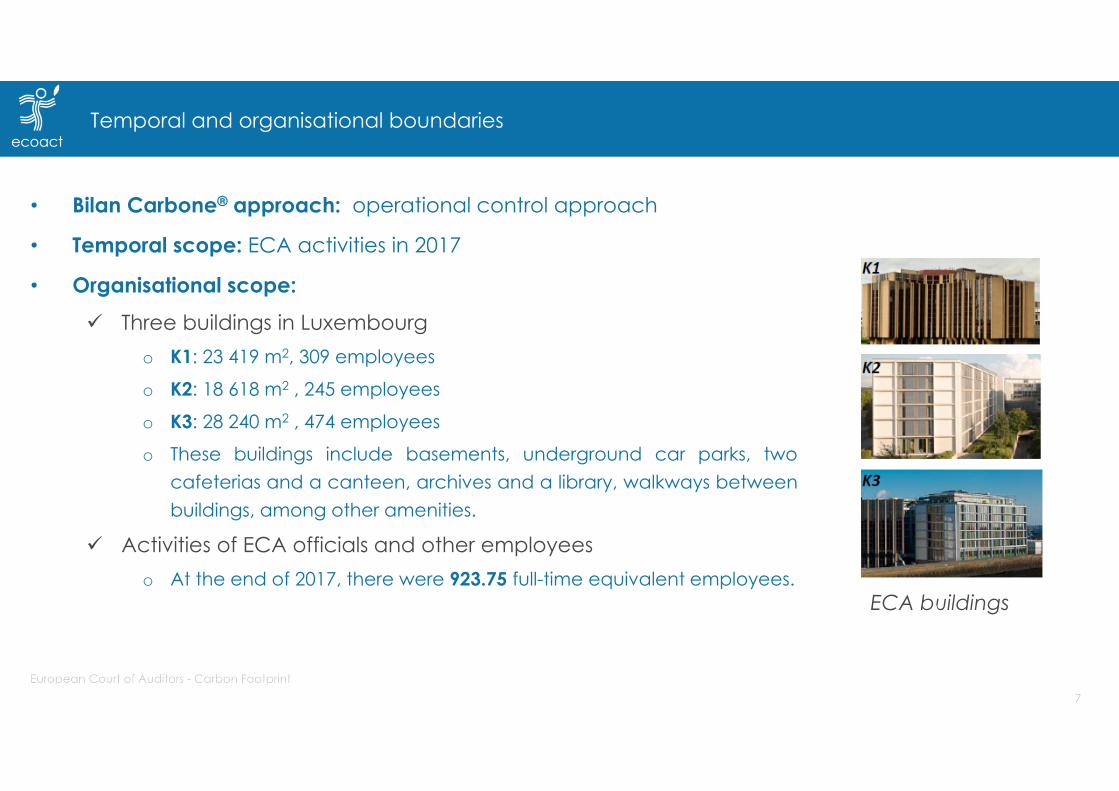
Temporal and organisational boundaries
• Bilan Carbone® approach: operational control approach
• Temporal scope: ECA activities in 2017
• Organisational scope: Three buildings in Luxembourg
o K1: 23 419 m2, 309 employees
o K2: 18 618 m2 , 245 employees
o K3: 28 240 m2 , 474 employees
o These buildings include basements, underground car parks, twocafeterias and a canteen, archives and a library, walkways betweenbuildings, among other amenities.
Activities of ECA officials and other employeeso At the end of 2017, there were 923.75 full-time equivalent employees.
ECA buildings
Energy in-house19%
Non-energy in-house<1%
Purchased goods
17%
Transport of people40%
Transport of goods
<1%
Waste<1%
Capital goods23%
2017 Bilan Carbone® results
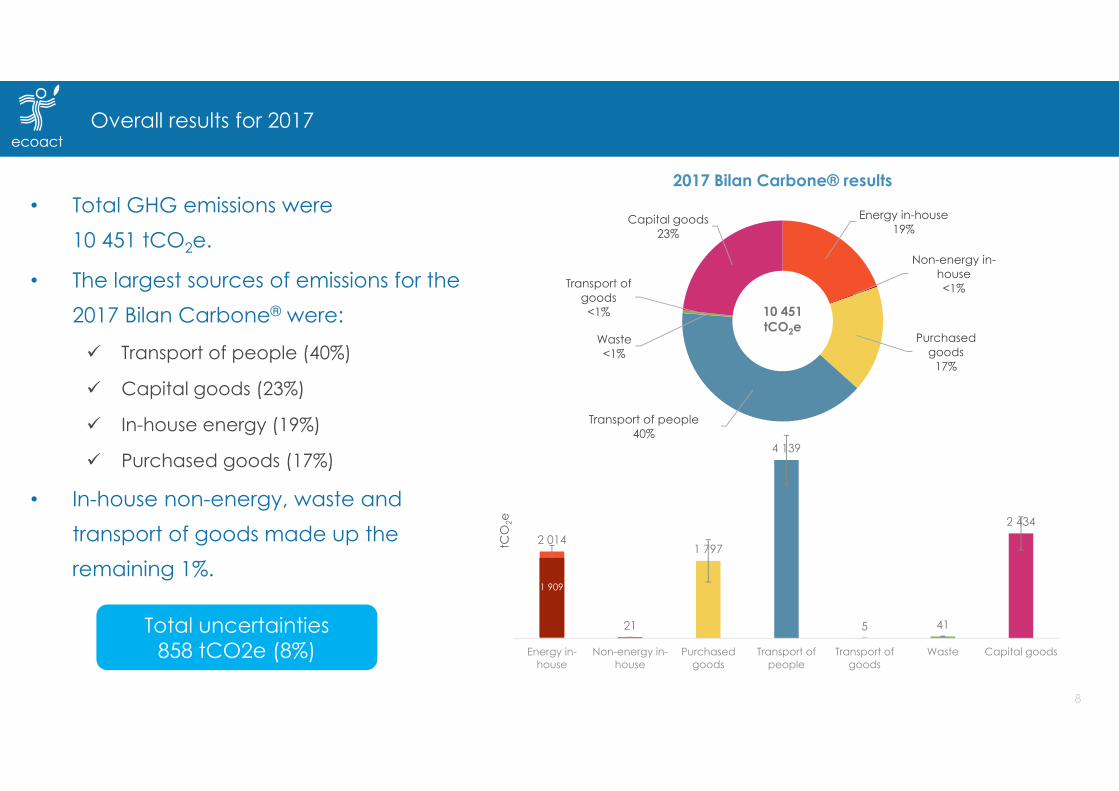
Overall results for 2017
• Total GHG emissions were 10 451 tCO2e.
• The largest sources of emissions for the 2017 Bilan Carbone® were:
Transport of people (40%)
Capital goods (23%)
In-house energy (19%)
Purchased goods (17%)
• In-house non-energy, waste and transport of goods made up the remaining 1%.
Total uncertainties858 tCO2e (8%)
10 451 tCO2e
2 014
21
1 797
4 139
5 41
2 434
Energy in-house
Non-energy in-house
Purchasedgoods
Transport ofpeople
Transport ofgoods
Waste Capital goods
tCO
2e
1 909
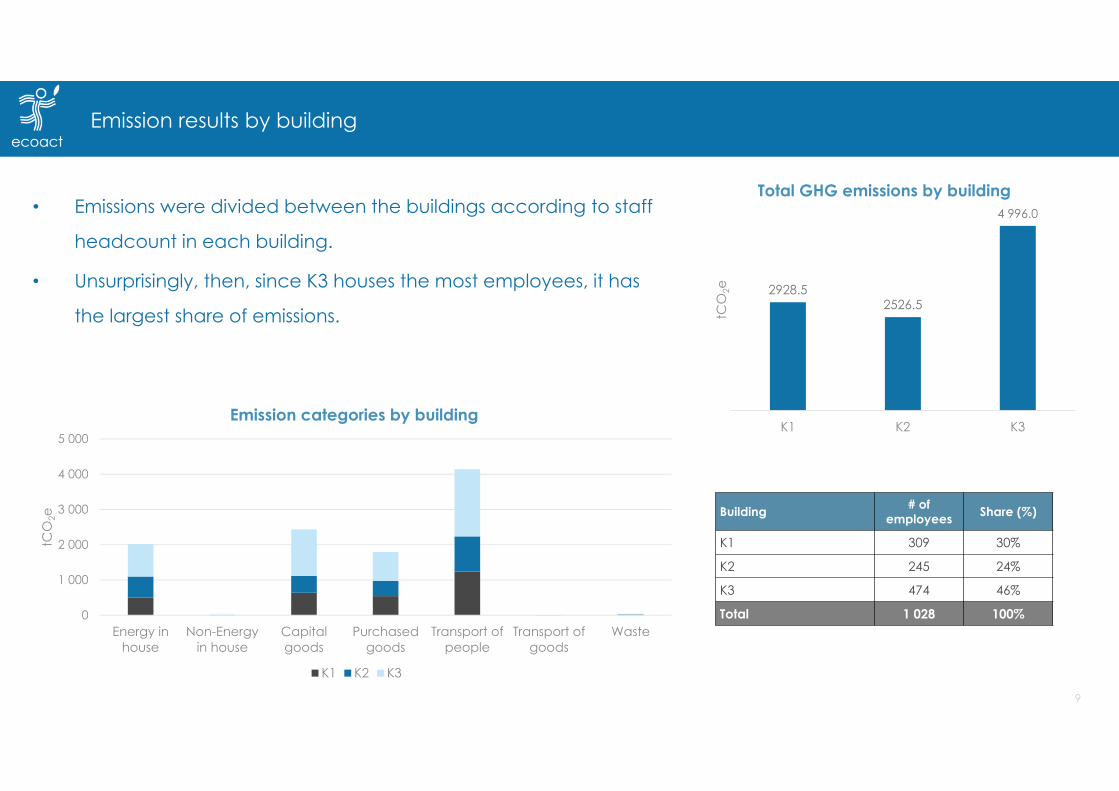
Emission results by building
• Emissions were divided between the buildings according to staff
headcount in each building.
• Unsurprisingly, then, since K3 houses the most employees, it has
the largest share of emissions.
0
1 000
2 000
3 000
4 000
5 000
Energy inhouse
Non-Energyin house
Capitalgoods
Purchasedgoods
Transport ofpeople
Transport ofgoods
Waste
tCO
2e
Emission categories by building
K1 K2 K3
2928.52526.5
4 996.0
K1 K2 K3
tCO
2e
Total GHG emissions by building
Building # of employees Share (%)
K1 309 30%
K2 245 24%
K3 474 46%
Total 1 028 100%
Bilan Carbone® comparison between 2016 and 2017
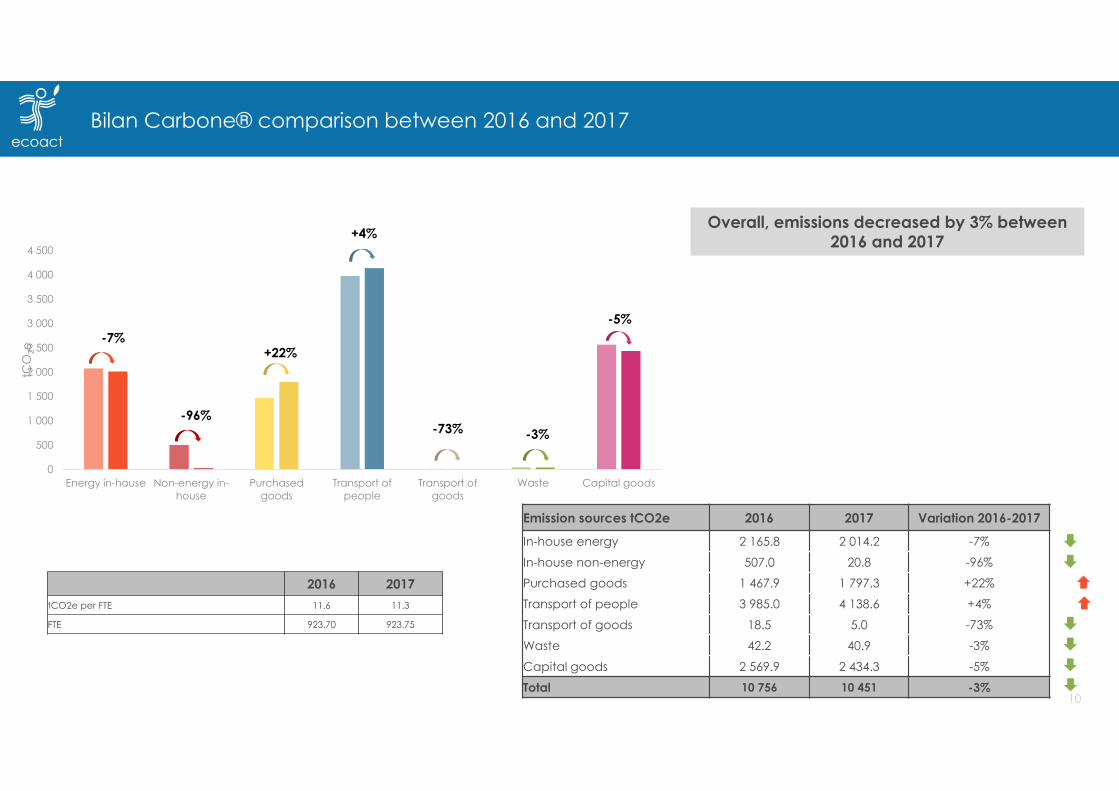
Overall, emissions decreased by 3% between 2016 and 2017
0
500
1 000
1 500
2 000
2 500
3 000
3 500
4 000
4 500
Energy in-house Non-energy in-house
Purchasedgoods
Transport ofpeople
Transport ofgoods
Waste Capital goods
tCO
2e
-7%+22%
+4%
-73% -3%-96%
-5%
2016 2017tCO2e per FTE 11.6 11.3
FTE 923.70 923.75
Emission sources tCO2e 2016 2017 Variation 2016-2017
In-house energy 2 165.8 2 014.2 -7%
In-house non-energy 507.0 20.8 -96%
Purchased goods 1 467.9 1 797.3 +22%
Transport of people 3 985.0 4 138.6 +4%
Transport of goods 18.5 5.0 -73%
Waste 42.2 40.9 -3%
Capital goods 2 569.9 2 434.3 -5%
Total 10 756 10 451 -3%
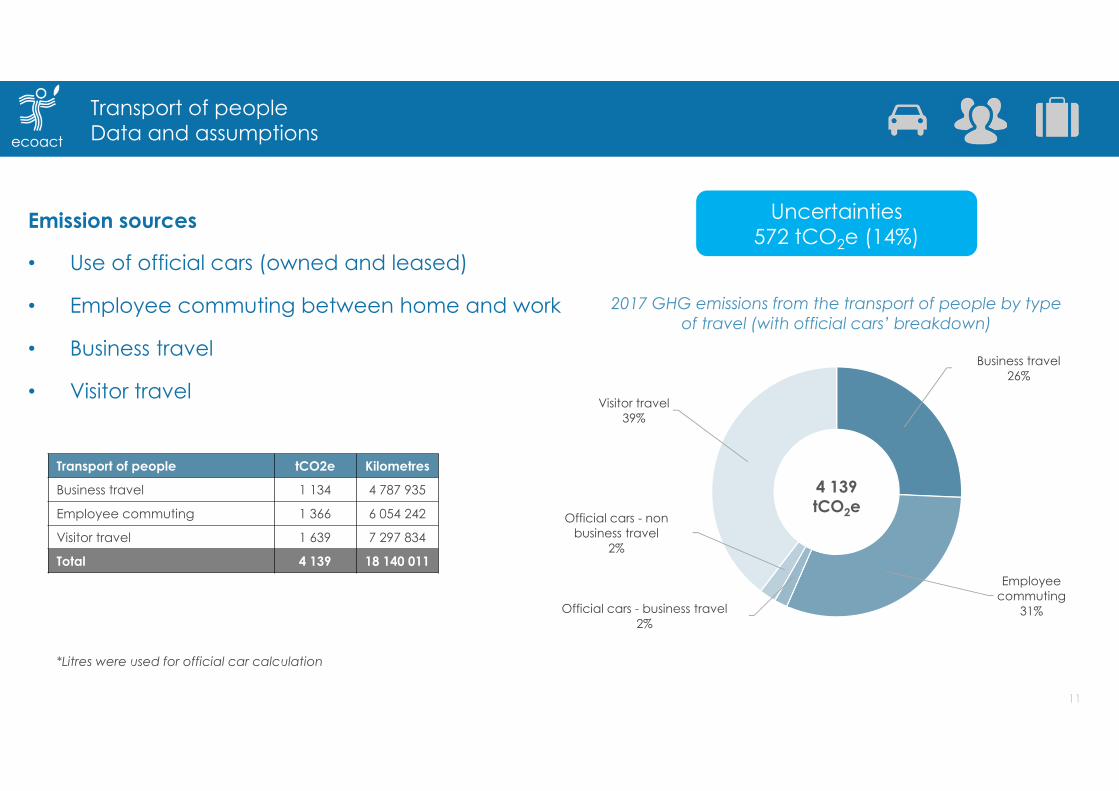
Transport of peopleData and assumptions
Emission sources
• Use of official cars (owned and leased)
• Employee commuting between home and work
• Business travel
• Visitor travelBusiness travel
26%
Employee commuting
31%Official cars - business travel2%
Official cars - non business travel
2%
Visitor travel39%
2017 GHG emissions from the transport of people by type of travel (with official cars’ breakdown)
4 139 tCO2e
Transport of people tCO2e Kilometres
Business travel 1 134 4 787 935
Employee commuting 1 366 6 054 242
Visitor travel 1 639 7 297 834
Total 4 139 18 140 011
Uncertainties572 tCO2e (14%)
*Litres were used for official car calculation
Air76%
Car (ECA and personal)
13%
Train10%
Rented car1%
Bus<1%
Boat<1%
4 787 935kilometres
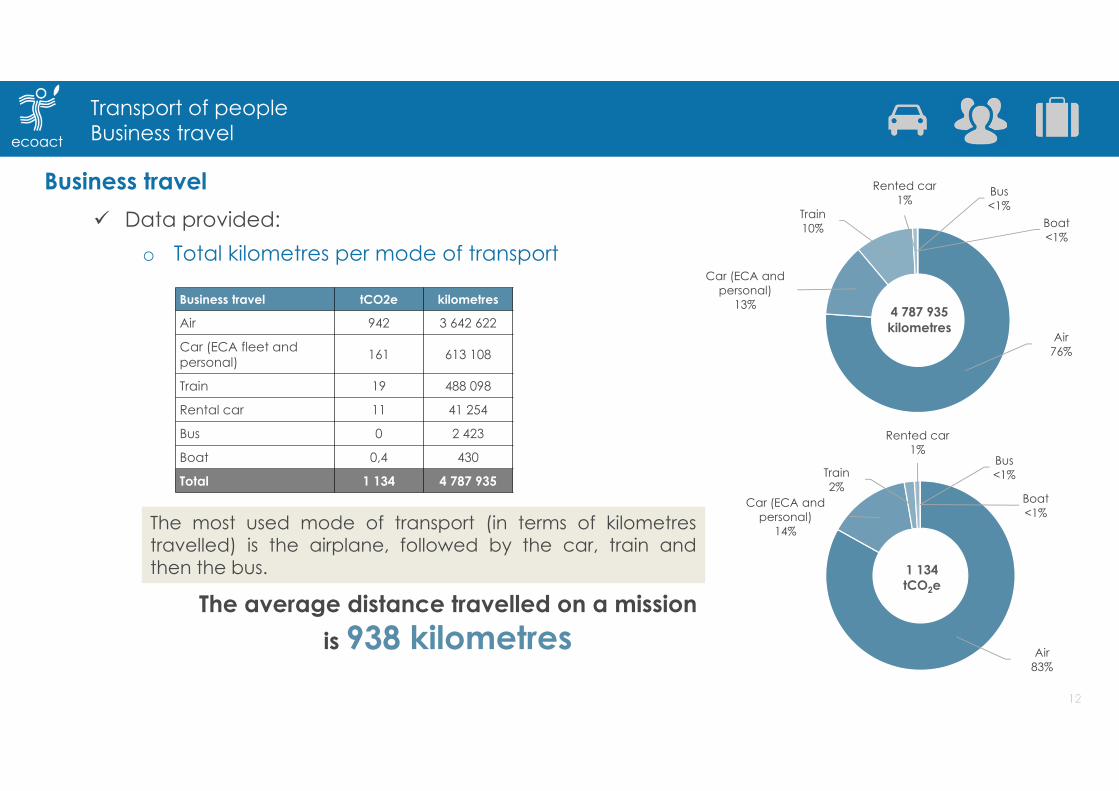
Transport of peopleBusiness travel
Business travel Data provided:
o Total kilometres per mode of transport
Air83%
Car (ECA and personal)
14%
Train2%
Rented car1%
Bus<1%
Boat<1%
1 134 tCO2e
Business travel tCO2e kilometres
Air 942 3 642 622
Car (ECA fleet and personal) 161 613 108
Train 19 488 098
Rental car 11 41 254
Bus 0 2 423
Boat 0,4 430
Total 1 134 4 787 935
The most used mode of transport (in terms of kilometrestravelled) is the airplane, followed by the car, train andthen the bus.
The average distance travelled on a mission is 938 kilometres
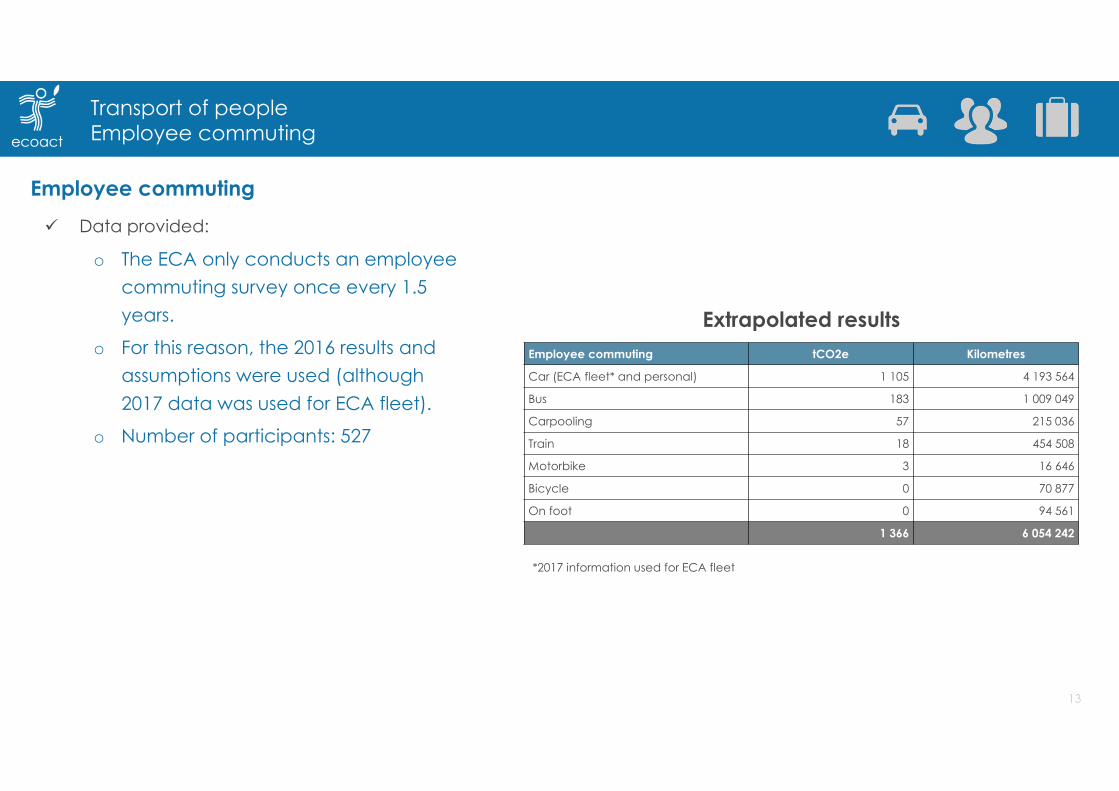
Transport of peopleEmployee commuting
Employee commuting Data provided:
o The ECA only conducts an employee commuting survey once every 1.5 years.
o For this reason, the 2016 results and assumptions were used (although 2017 data was used for ECA fleet).
o Number of participants: 527
Extrapolated resultsEmployee commuting tCO2e Kilometres
Car (ECA fleet* and personal) 1 105 4 193 564
Bus 183 1 009 049
Carpooling 57 215 036
Train 18 454 508
Motorbike 3 16 646
Bicycle 0 70 877
On foot 0 94 561
1 366 6 054 242
*2017 information used for ECA fleet
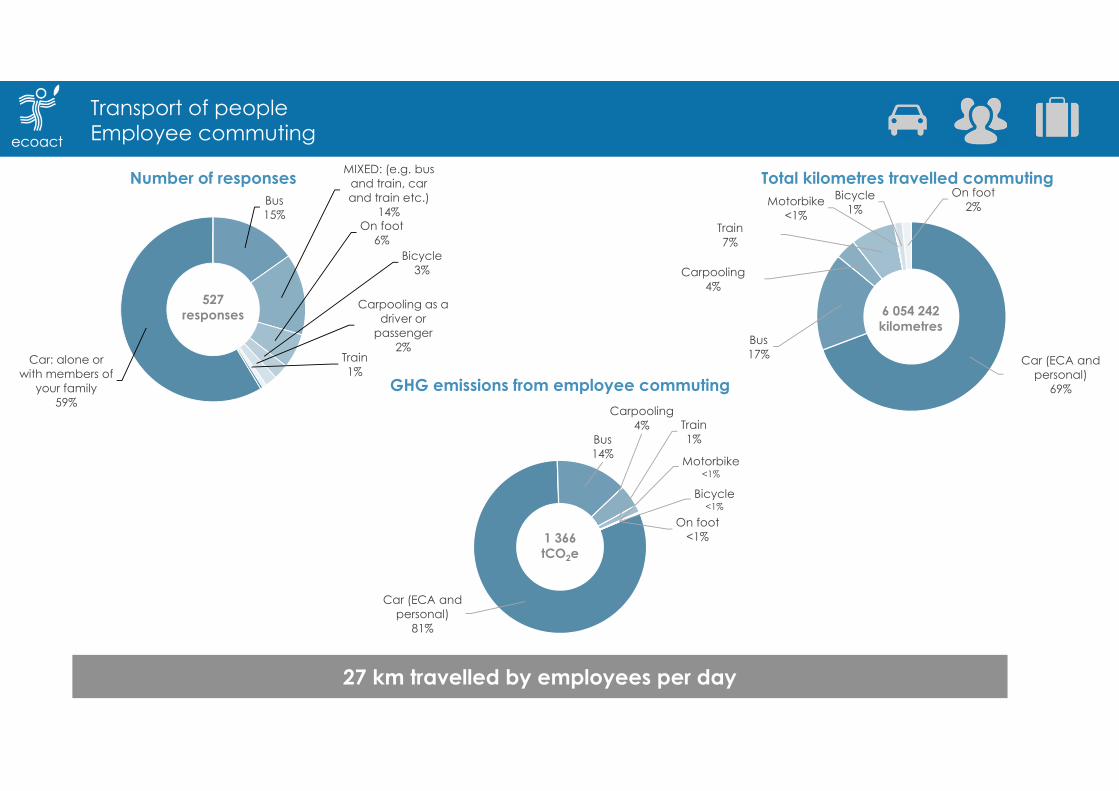
Car (ECA and personal)
69%
Bus17%
Carpooling4%
Train7%
Motorbike<1%
Bicycle1%
On foot2%
Total kilometres travelled commuting
Car (ECA and personal)
81%
Bus14%
Carpooling4% Train
1%
Motorbike<1%
Bicycle<1%
On foot<1%
GHG emissions from employee commuting
6 054 242kilometres
Transport of peopleEmployee commuting
27 km travelled by employees per day
Car: alone or with members of
your family59%
Bus15%
MIXED: (e.g. bus and train, car and train etc.)
14%On foot
6%Bicycle
3%
Carpooling as a driver or
passenger2%
Train1%
Number of responses
527responses
1 366tCO2e
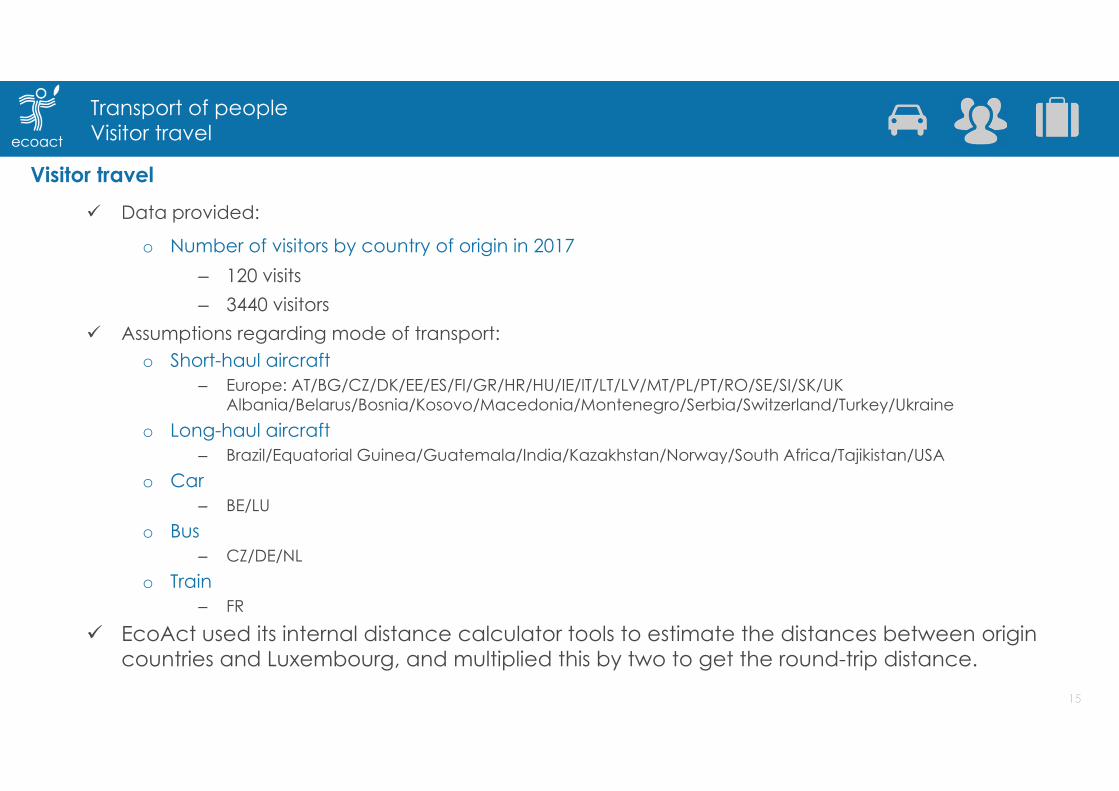
Transport of peopleVisitor travel
Visitor travel Data provided:
o Number of visitors by country of origin in 2017– 120 visits – 3440 visitors
Assumptions regarding mode of transport: o Short-haul aircraft
– Europe: AT/BG/CZ/DK/EE/ES/FI/GR/HR/HU/IE/IT/LT/LV/MT/PL/PT/RO/SE/SI/SK/UK Albania/Belarus/Bosnia/Kosovo/Macedonia/Montenegro/Serbia/Switzerland/Turkey/Ukraine
o Long-haul aircraft– Brazil/Equatorial Guinea/Guatemala/India/Kazakhstan/Norway/South Africa/Tajikistan/USA
o Car– BE/LU
o Bus– CZ/DE/NL
o Train– FR
EcoAct used its internal distance calculator tools to estimate the distances between origin countries and Luxembourg, and multiplied this by two to get the round-trip distance.
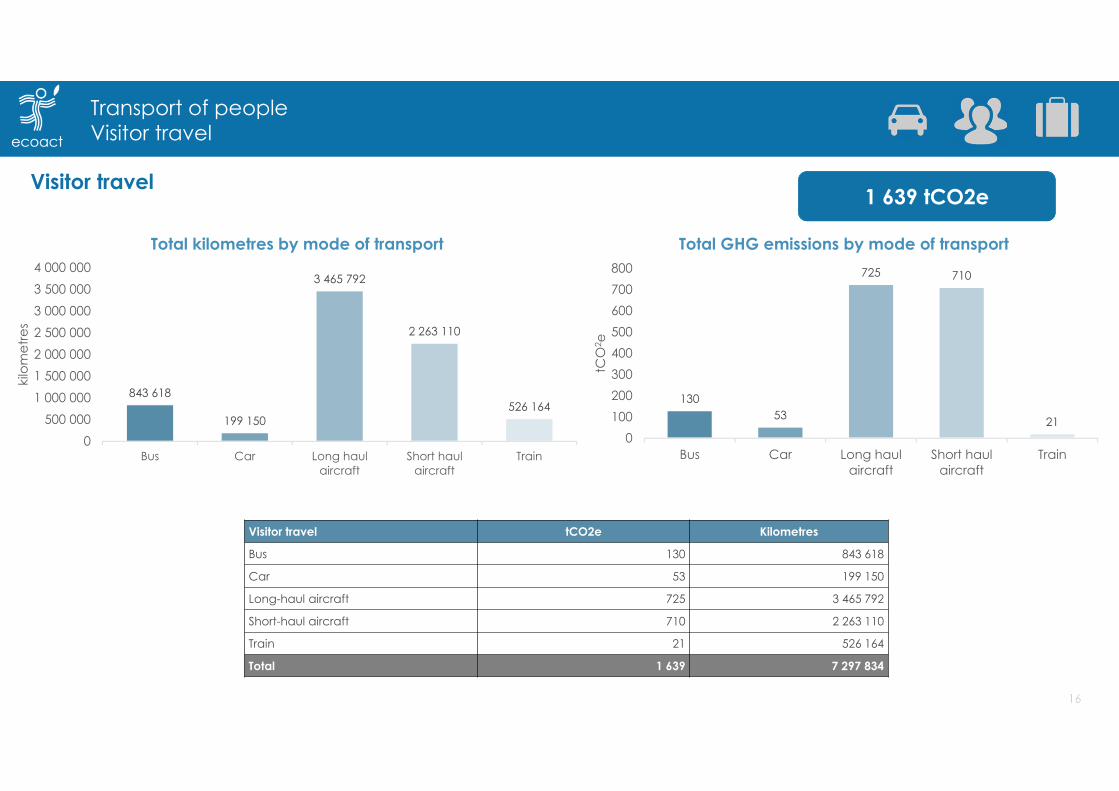
Transport of peopleVisitor travel
Visitor travel1 639 tCO2e
13053
725 710
210
100200300400500600700800
Bus Car Long haulaircraft
Short haulaircraft
Train
tCO
2 e
Total GHG emissions by mode of transport
843 618
199 150
3 465 792
2 263 110
526 164
0500 000
1 000 0001 500 0002 000 0002 500 0003 000 0003 500 0004 000 000
Bus Car Long haulaircraft
Short haulaircraft
Train
kilo
met
res
Total kilometres by mode of transport
Visitor travel tCO2e Kilometres
Bus 130 843 618
Car 53 199 150
Long-haul aircraft 725 3 465 792
Short-haul aircraft 710 2 263 110
Train 21 526 164
Total 1 639 7 297 834
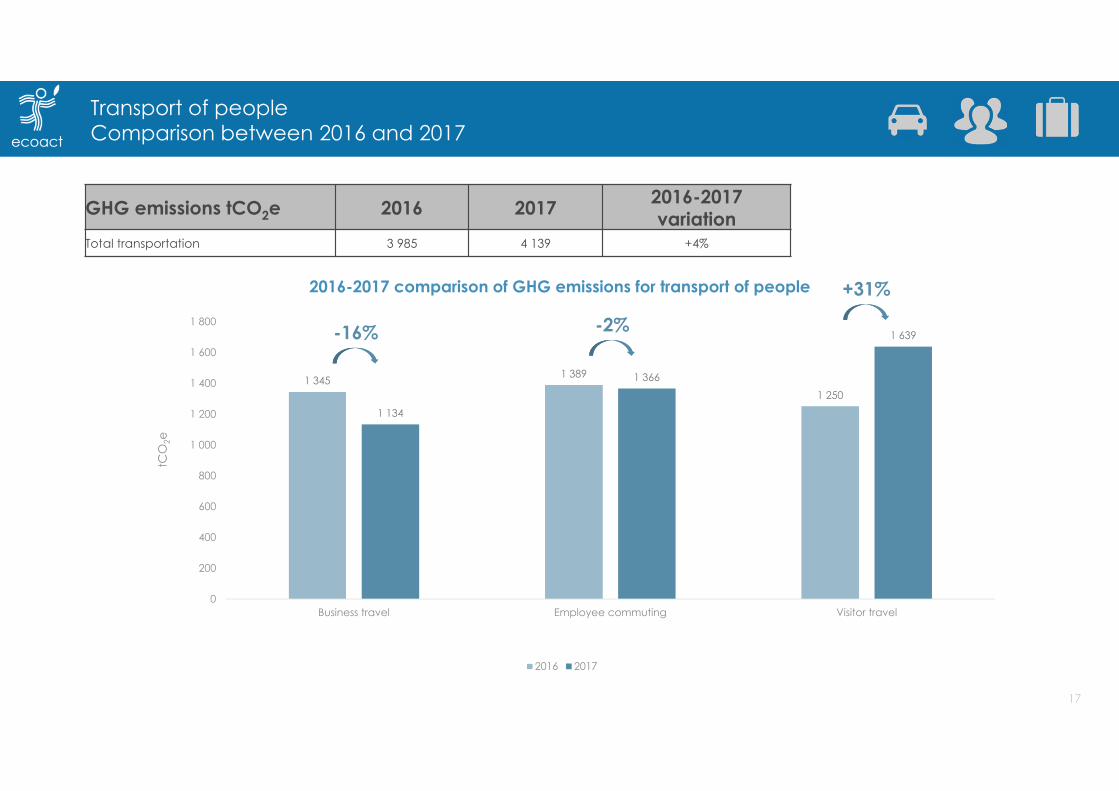
1 345 1 389
1 2501 134
1 366
1 639
0
200
400
600
800
1 000
1 200
1 400
1 600
1 800
Business travel Employee commuting Visitor travel
tCO
2e
2016-2017 comparison of GHG emissions for transport of people
2016 2017
Transport of peopleComparison between 2016 and 2017
GHG emissions tCO2e 2016 2017 2016-2017variation
Total transportation 3 985 4 139 +4%
-2%-16%
+31%
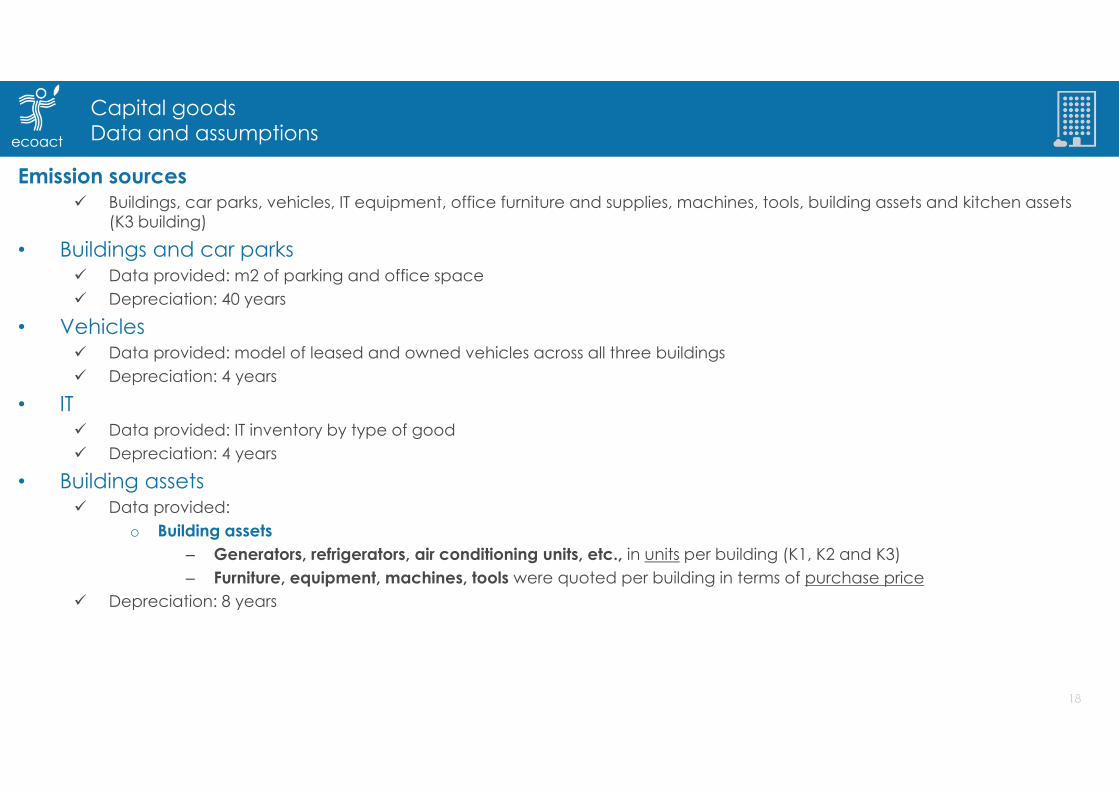
Capital goodsData and assumptions
Emission sources Buildings, car parks, vehicles, IT equipment, office furniture and supplies, machines, tools, building assets and kitchen assets
(K3 building)
• Buildings and car parks Data provided: m2 of parking and office space Depreciation: 40 years
• Vehicles Data provided: model of leased and owned vehicles across all three buildings Depreciation: 4 years
• IT Data provided: IT inventory by type of good Depreciation: 4 years
• Building assets Data provided:
o Building assets – Generators, refrigerators, air conditioning units, etc., in units per building (K1, K2 and K3)– Furniture, equipment, machines, tools were quoted per building in terms of purchase price
Depreciation: 8 years
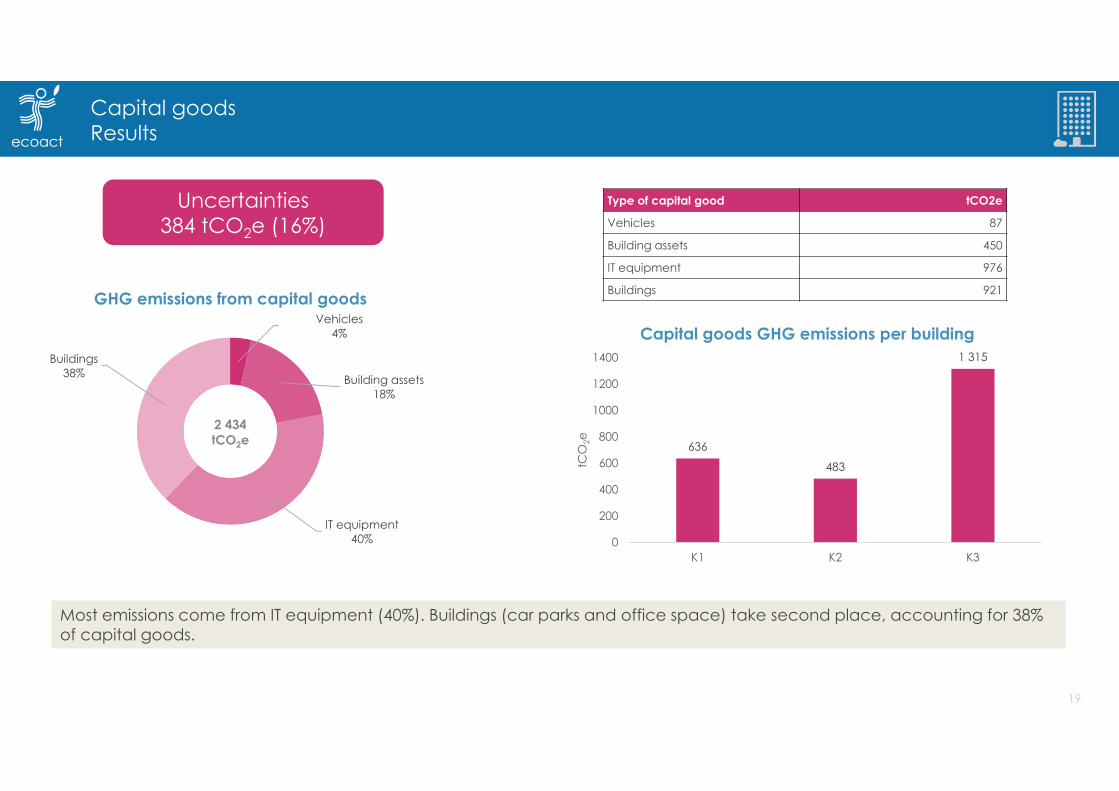
Capital goodsResults
Most emissions come from IT equipment (40%). Buildings (car parks and office space) take second place, accounting for 38% of capital goods.
Vehicles4%
Building assets18%
IT equipment40%
Buildings38%
GHG emissions from capital goods
2 434 tCO2e
Type of capital good tCO2e
Vehicles 87
Building assets 450
IT equipment 976
Buildings 921
636
483
1 315
0
200
400
600
800
1000
1200
1400
K1 K2 K3
tCO
2e
Capital goods GHG emissions per building
Uncertainties384 tCO2e (16%)
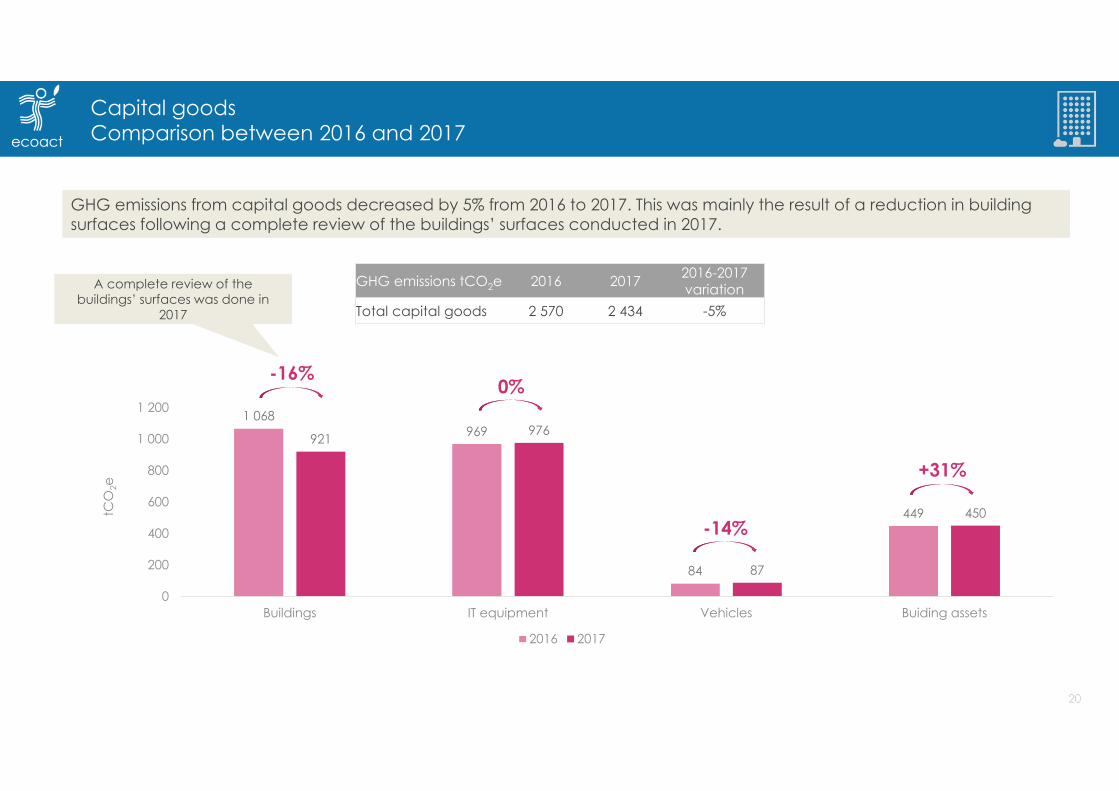
Capital goodsComparison between 2016 and 2017
GHG emissions tCO2e 2016 2017 2016-2017variation
Total capital goods 2 570 2 434 -5%
1 068969
84
449
921 976
87
450
0
200
400
600
800
1 000
1 200
Buildings IT equipment Vehicles Buiding assets
tCO
2e
2016 2017
0%-16%
-14%
+31%
GHG emissions from capital goods decreased by 5% from 2016 to 2017. This was mainly the result of a reduction in building surfaces following a complete review of the buildings’ surfaces conducted in 2017.
A complete review of the buildings’ surfaces was done in
2017
A complete review of the buildings’ surfaces was done in
2017
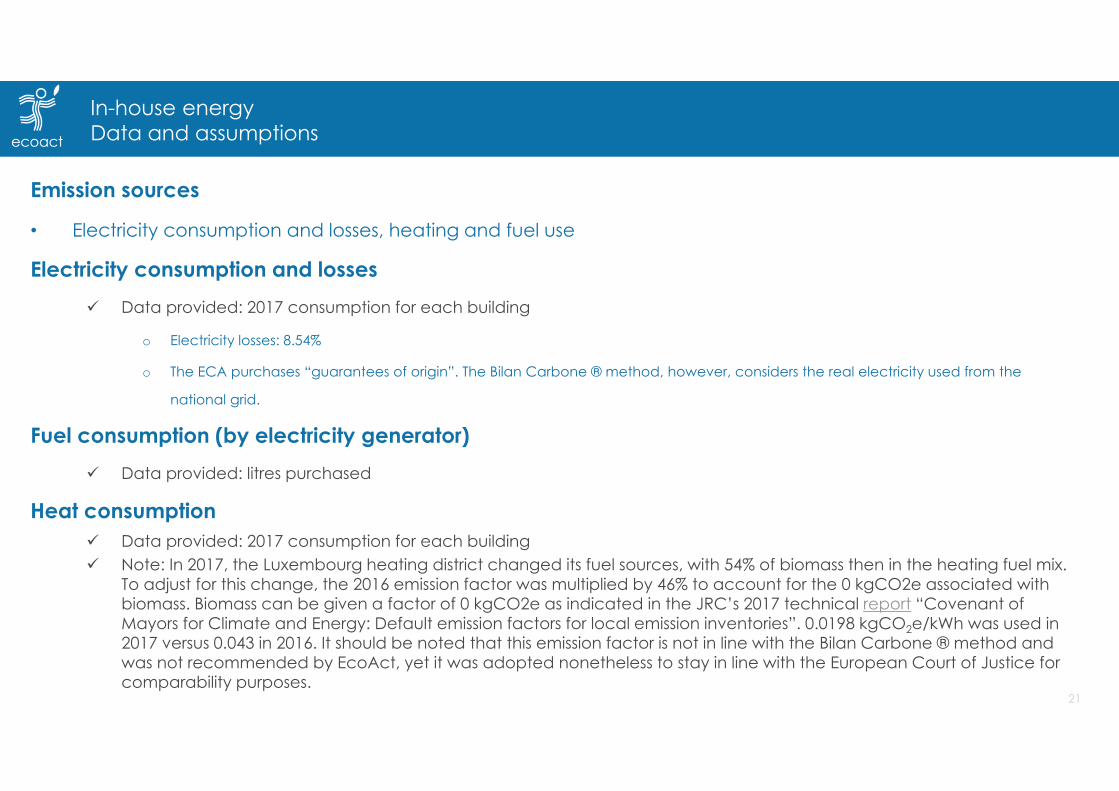
In-house energyData and assumptions
Emission sources
• Electricity consumption and losses, heating and fuel use
Electricity consumption and losses Data provided: 2017 consumption for each building
o Electricity losses: 8.54%
o The ECA purchases “guarantees of origin”. The Bilan Carbone ® method, however, considers the real electricity used from the
national grid.
Fuel consumption (by electricity generator) Data provided: litres purchased
Heat consumption Data provided: 2017 consumption for each building Note: In 2017, the Luxembourg heating district changed its fuel sources, with 54% of biomass then in the heating fuel mix.
To adjust for this change, the 2016 emission factor was multiplied by 46% to account for the 0 kgCO2e associated with biomass. Biomass can be given a factor of 0 kgCO2e as indicated in the JRC’s 2017 technical report “Covenant of Mayors for Climate and Energy: Default emission factors for local emission inventories”. 0.0198 kgCO2e/kWh was used in 2017 versus 0.043 in 2016. It should be noted that this emission factor is not in line with the Bilan Carbone ® method and was not recommended by EcoAct, yet it was adopted nonetheless to stay in line with the European Court of Justice for comparability purposes.
In-house energyResults
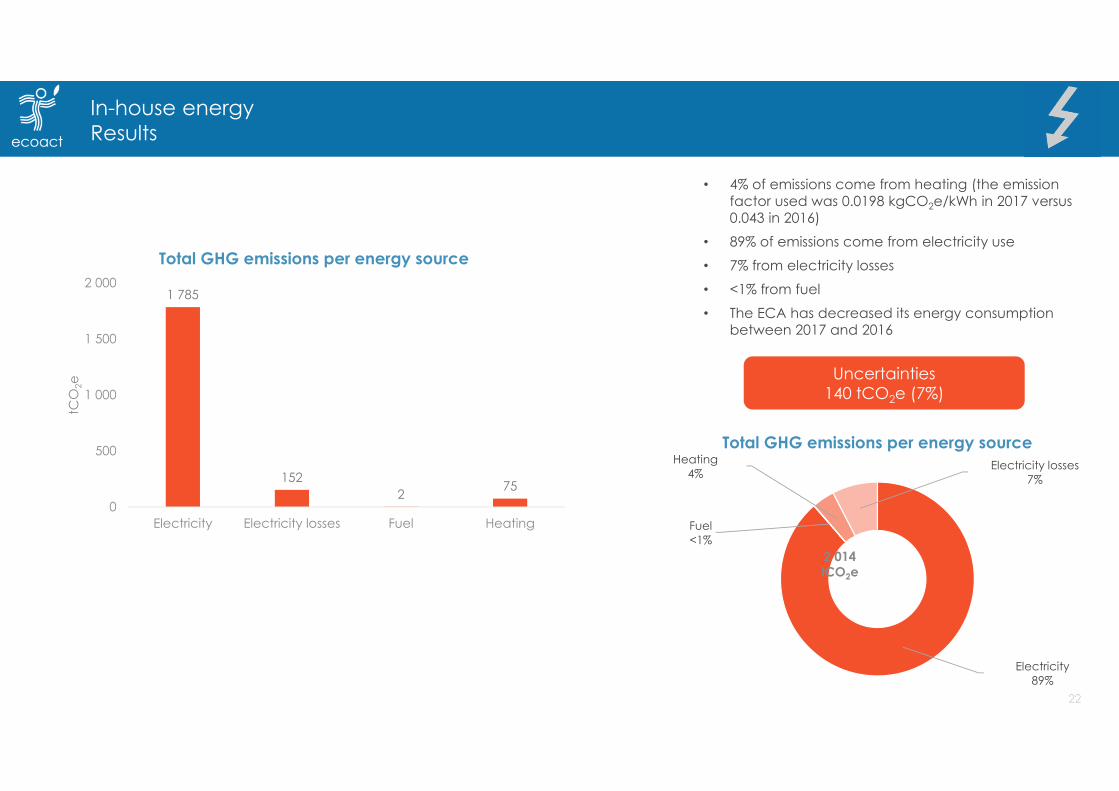
• 4% of emissions come from heating (the emission factor used was 0.0198 kgCO2e/kWh in 2017 versus 0.043 in 2016)
• 89% of emissions come from electricity use• 7% from electricity losses• <1% from fuel• The ECA has decreased its energy consumption
between 2017 and 2016
1 785
1522 75
0
500
1 000
1 500
2 000
Electricity Electricity losses Fuel Heating
tCO
2e
Total GHG emissions per energy source
Electricity89%
Fuel<1%
Heating4%
Electricity losses7%
Total GHG emissions per energy source
2 014 tCO2e
Uncertainties140 tCO2e (7%)
In-house energyResults
0%10%20%
30%40%
50%60%70%
80%90%
100%
Electricity Fuel Heating Electricity losses
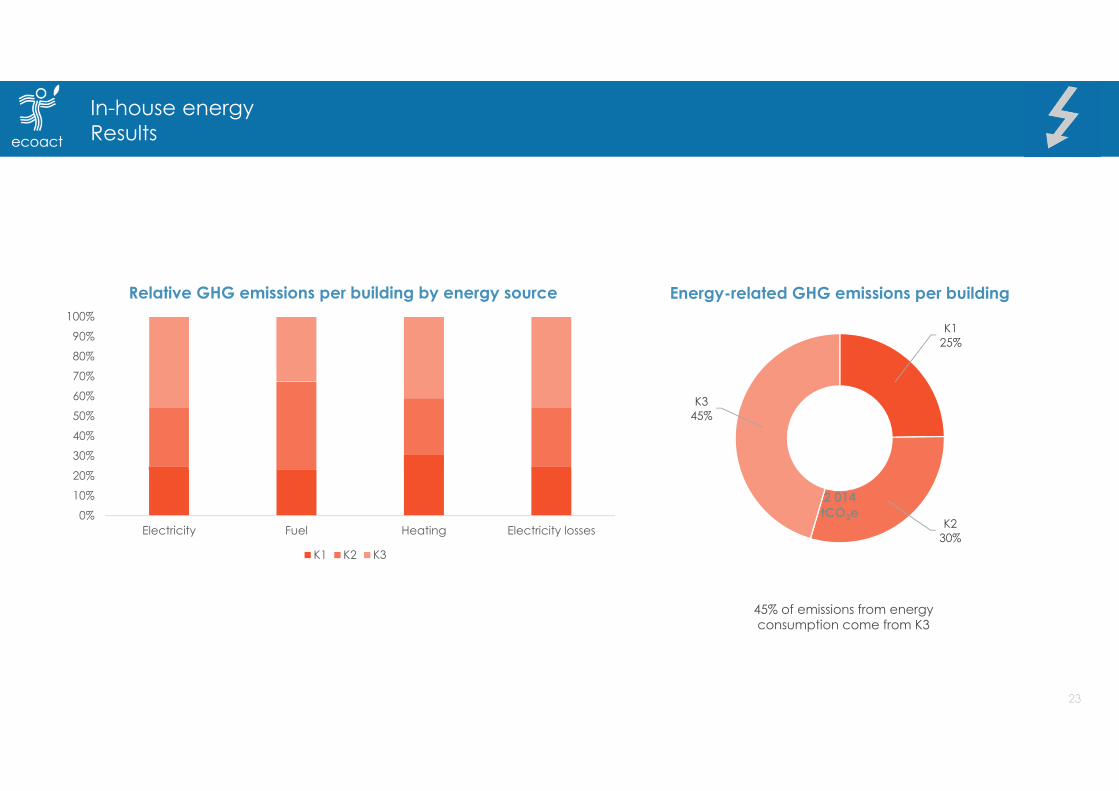
Relative GHG emissions per building by energy source
K1 K2 K3
K125%
K230%
K345%
Energy-related GHG emissions per building
2 014 tCO2e
45% of emissions from energy consumption come from K3
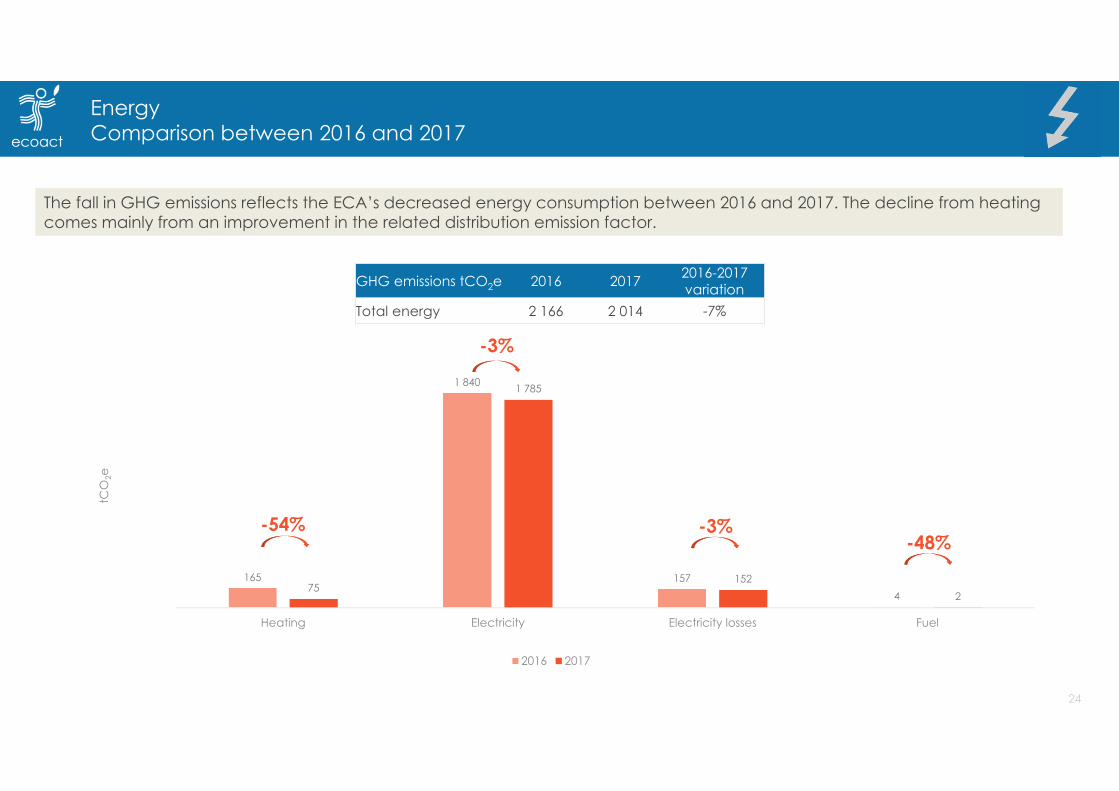
165
1 840
1574
75
1 785
1522
Heating Electricity Electricity losses Fuel
tCO
2e
2016 2017
GHG emissions tCO2e 2016 2017 2016-2017 variation
Total energy 2 166 2 014 -7%
EnergyComparison between 2016 and 2017
-3%
-54% -3%-48%
The fall in GHG emissions reflects the ECA’s decreased energy consumption between 2016 and 2017. The decline from heating comes mainly from an improvement in the related distribution emission factor.
In-house non-energyData, assumptions and results
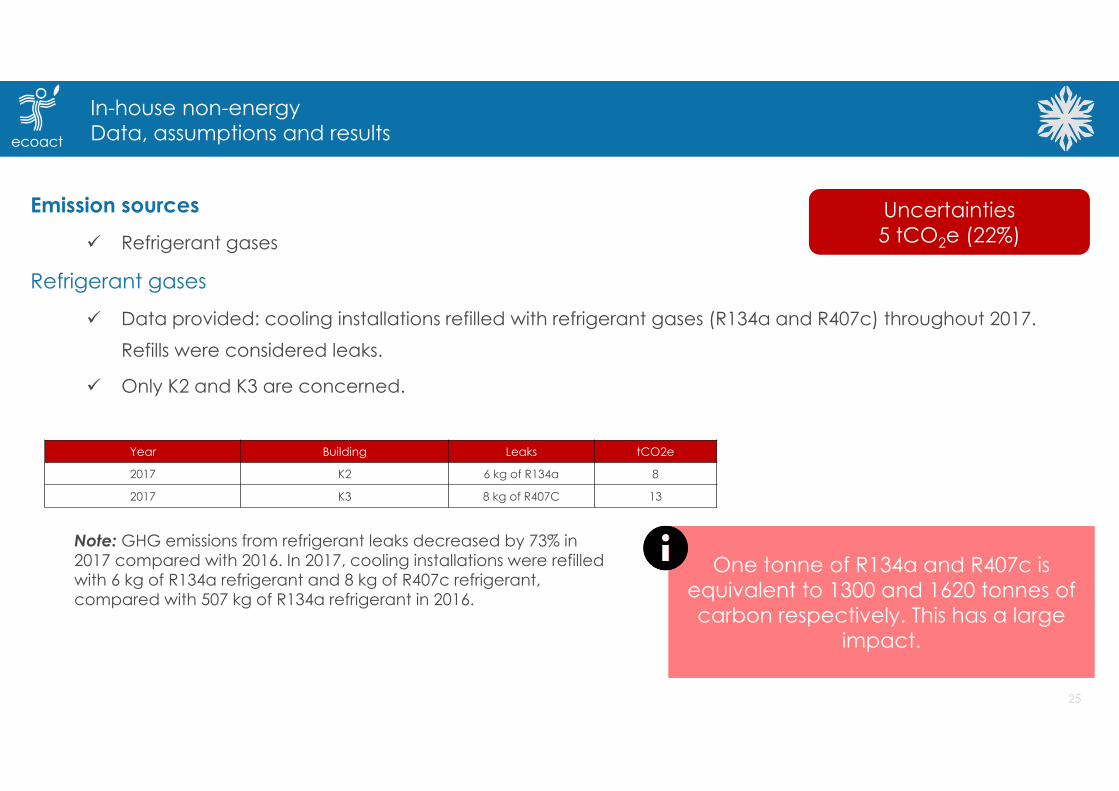
Emission sources Refrigerant gases
Refrigerant gases
Data provided: cooling installations refilled with refrigerant gases (R134a and R407c) throughout 2017. Refills were considered leaks.
Only K2 and K3 are concerned.
One tonne of R134a and R407c is equivalent to 1300 and 1620 tonnes of carbon respectively. This has a large
impact.
One tonne of R134a and R407c is equivalent to 1300 and 1620 tonnes of carbon respectively. This has a large
impact.
Note: GHG emissions from refrigerant leaks decreased by 73% in 2017 compared with 2016. In 2017, cooling installations were refilled with 6 kg of R134a refrigerant and 8 kg of R407c refrigerant, compared with 507 kg of R134a refrigerant in 2016.
Year Building Leaks tCO2e
2017 K2 6 kg of R134a 8
2017 K3 8 kg of R407C 13
Uncertainties5 tCO2e (22%)
Purchased goods and servicesData and assumptions
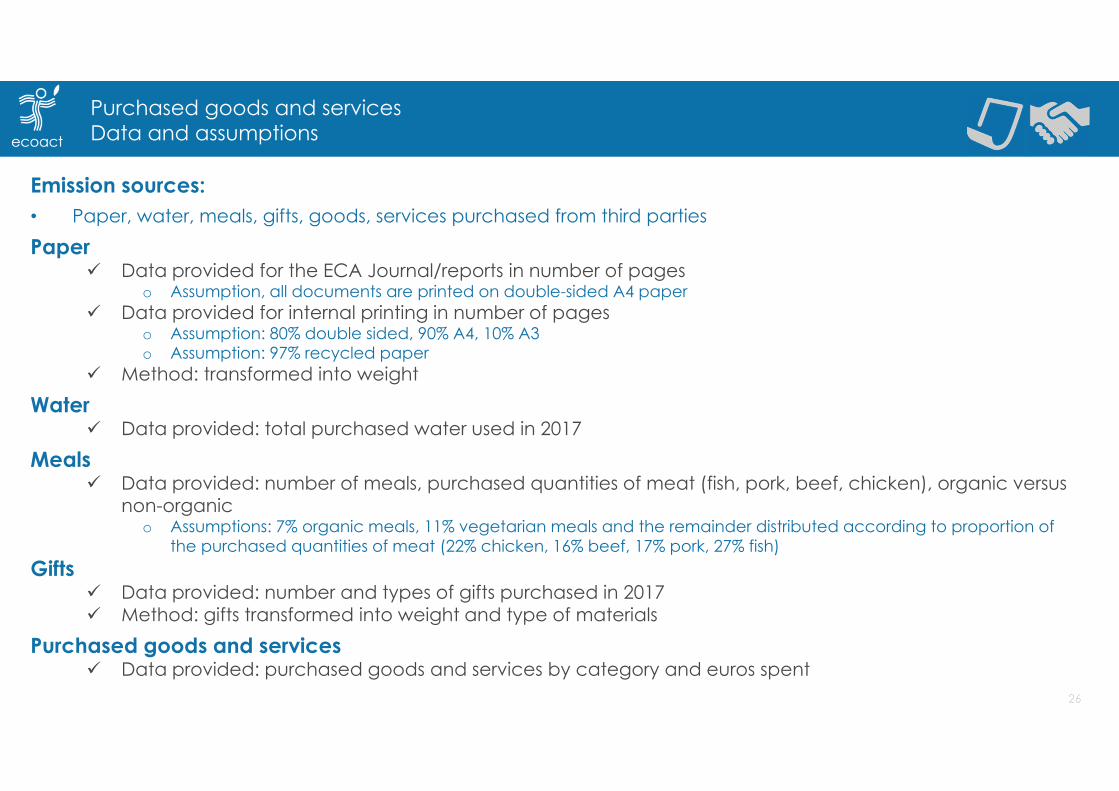
Emission sources:• Paper, water, meals, gifts, goods, services purchased from third partiesPaper
Data provided for the ECA Journal/reports in number of pageso Assumption, all documents are printed on double-sided A4 paper
Data provided for internal printing in number of pageso Assumption: 80% double sided, 90% A4, 10% A3o Assumption: 97% recycled paper
Method: transformed into weightWater
Data provided: total purchased water used in 2017Meals
Data provided: number of meals, purchased quantities of meat (fish, pork, beef, chicken), organic versus non-organic
o Assumptions: 7% organic meals, 11% vegetarian meals and the remainder distributed according to proportion of the purchased quantities of meat (22% chicken, 16% beef, 17% pork, 27% fish)
Gifts Data provided: number and types of gifts purchased in 2017 Method: gifts transformed into weight and type of materials
Purchased goods and services Data provided: purchased goods and services by category and euros spent
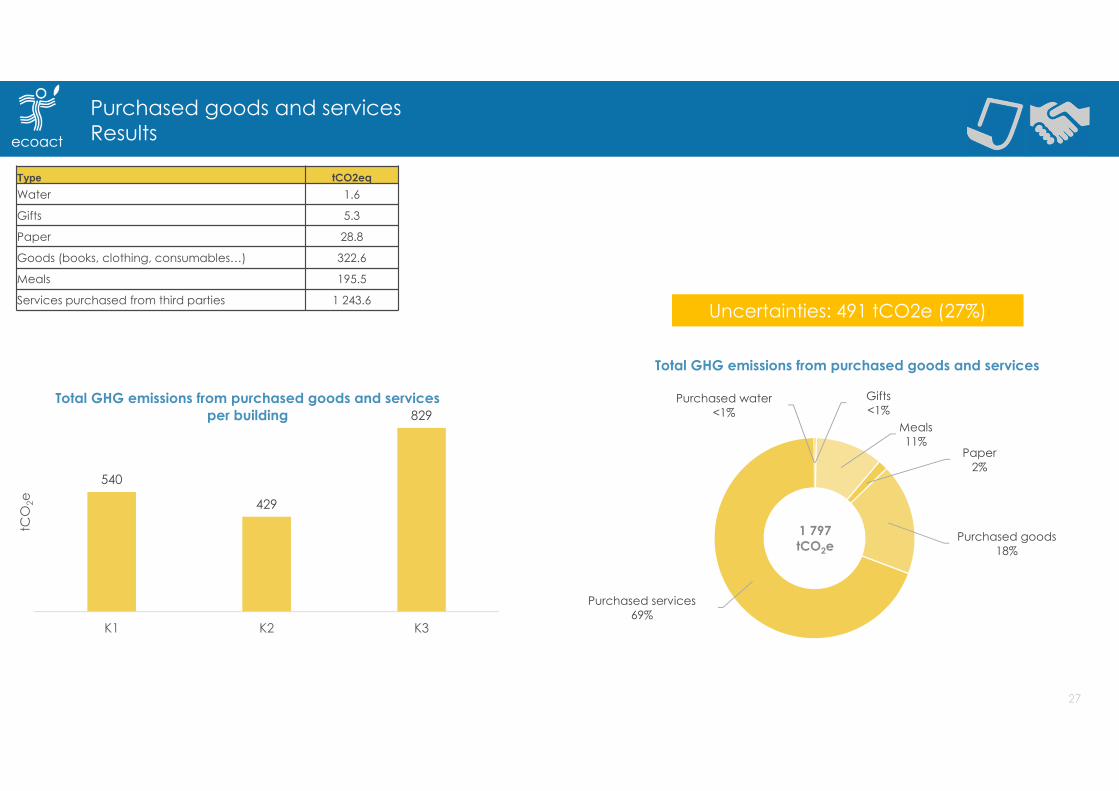
Purchased goods and servicesResults
Type tCO2eqWater 1.6
Gifts 5.3
Paper 28.8
Goods (books, clothing, consumables…) 322.6
Meals 195.5
Services purchased from third parties 1 243.6Uncertainties: 491 tCO2e (27%) Uncertainties: 491 tCO2e (27%)
Gifts<1%
Meals11%
Paper2%
Purchased goods18%
Purchased services69%
Purchased water<1%
Total GHG emissions from purchased goods and services
1 797tCO2e
540
429
829
K1 K2 K3
tCO
2e
Total GHG emissions from purchased goods and services per building
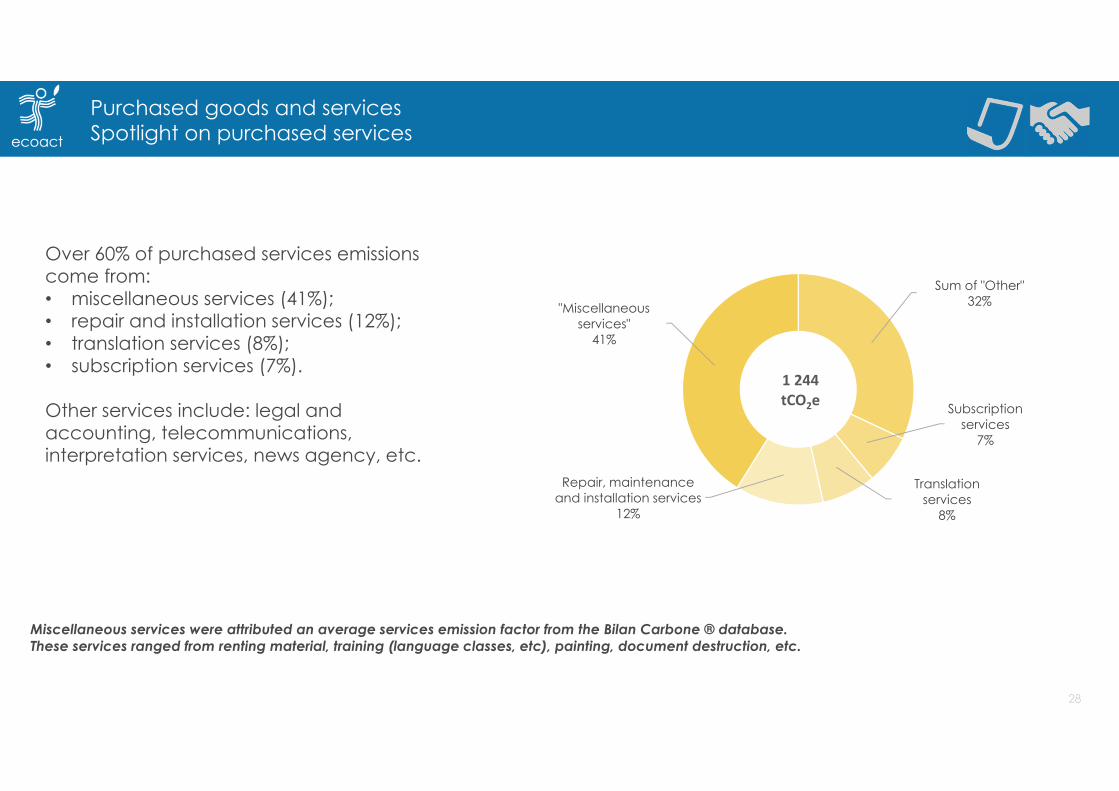
Purchased goods and servicesSpotlight on purchased services
Over 60% of purchased services emissions come from: • miscellaneous services (41%);• repair and installation services (12%);• translation services (8%);• subscription services (7%).
Other services include: legal and accounting, telecommunications, interpretation services, news agency, etc.
Miscellaneous services were attributed an average services emission factor from the Bilan Carbone ® database. These services ranged from renting material, training (language classes, etc), painting, document destruction, etc.
Sum of "Other"32%
Subscription services
7%
Translation services
8%
Repair, maintenance and installation services
12%
"Miscellaneous services"
41%
1 244tCO2e

Purchased goods and servicesSpotlight on meals
• 51% of the meals served at the ECA contain
beef.
Replacing beef with chicken would reduce a dish’s
carbon impact by 76%.
Replacing a pork dish with a vegetarian dish would half
the meal’s carbon impact.
• Organic meals were given the emission factor
of an “average meal”, as the determinants of
a dish’s emissions are its ingredients (meat,
vegetarian) and whether the ingredients were
produced locally or not. There is no conclusive
evidence that the average organic meal is less
emissive, since each dish can only be
considered on a plate-by-plate basis.
Type of meal kgCO2e/unitVegetarian 0.45Fish 0.80Pork-based 1.01Chicken-based 1.32Organic 2.25Beef-based 5.66
Fish meals12%
Organic meals9%
Typical meals (with beef)51%
Typical meals (with chicken)
16%
Typical meals (with pork)
9%
Vegetarian meals3%
GHG emissions from meals
195tCO2e
2 7 33
200 196
1 030
2 5 29
323
195
1 244
Purchased water Gifts Paper Purchased goods Meals Purchased services
tCO
2e
2016 2017
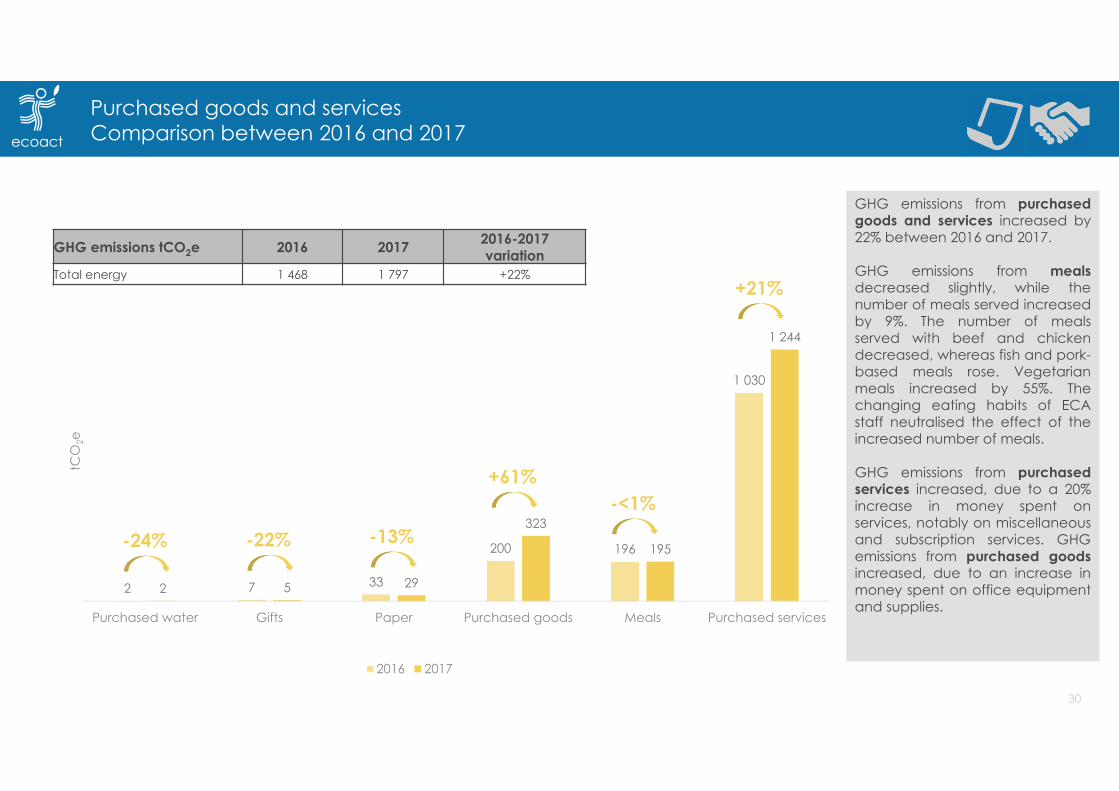
Purchased goods and servicesComparison between 2016 and 2017
GHG emissions tCO2e 2016 2017 2016-2017variation
Total energy 1 468 1 797 +22%
-24% -22% -13%
+61%-<1%
+21%
GHG emissions from purchasedgoods and services increased by22% between 2016 and 2017.
GHG emissions from mealsdecreased slightly, while thenumber of meals served increasedby 9%. The number of mealsserved with beef and chickendecreased, whereas fish and pork-based meals rose. Vegetarianmeals increased by 55%. Thechanging eating habits of ECAstaff neutralised the effect of theincreased number of meals.
GHG emissions from purchasedservices increased, due to a 20%increase in money spent onservices, notably on miscellaneousand subscription services. GHGemissions from purchased goodsincreased, due to an increase inmoney spent on office equipmentand supplies.

WasteData and assumptions
Emission sources Waste and water use (sewage)
• Waste
Data: waste by type (non-hazardous, hazardous) and tonnage
Non-hazardous: food waste, household waste, plastics, paper and cardboard, glass packaging
Hazardous: mud and sewage water, light and fluorescent tubes,
packaging paste with harmful products, scrap metal, batteries and accumulators, electronic waste
Assumptions: waste treatment largely based on 2016 treatment with slight modifications
• Water use (sewage)
Data: based on water consumption, allocated to buildingson the basis of building occupancy
Hazardous waste51%
Non-hazardous waste41%
Water8%
GHG emissions from waste by type
41 tCO2e
Uncertainties12 tCO2e (29%)
200 kg of waste per FTE in 2017 versus 209 kg in 2016
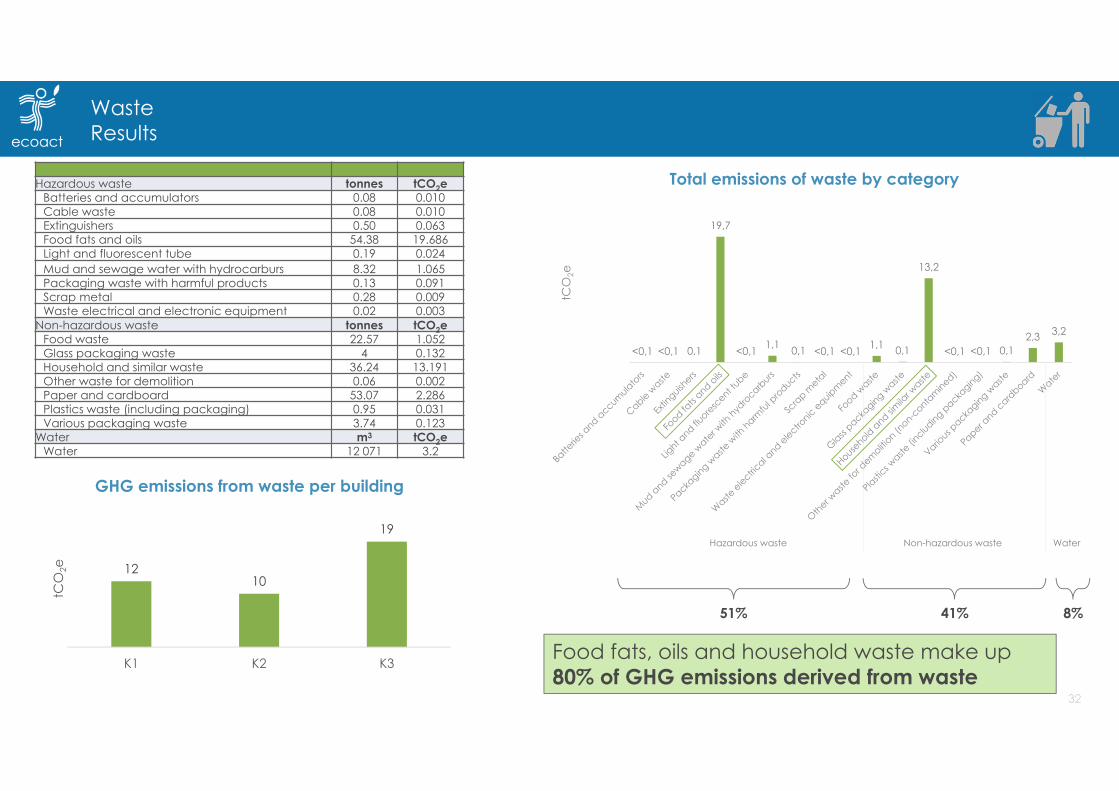
WasteResults
Hazardous waste tonnes tCO2eBatteries and accumulators 0.08 0.010Cable waste 0.08 0.010Extinguishers 0.50 0.063Food fats and oils 54.38 19.686Light and fluorescent tube 0.19 0.024Mud and sewage water with hydrocarburs 8.32 1.065Packaging waste with harmful products 0.13 0.091Scrap metal 0.28 0.009Waste electrical and electronic equipment 0.02 0.003
Non-hazardous waste tonnes tCO2eFood waste 22.57 1.052Glass packaging waste 4 0.132Household and similar waste 36.24 13.191Other waste for demolition 0.06 0.002Paper and cardboard 53.07 2.286Plastics waste (including packaging) 0.95 0.031Various packaging waste 3.74 0.123
Water m3 tCO2eWater 12 071 3.2
51% 41% 8%
Food fats, oils and household waste make up 80% of GHG emissions derived from waste
1210
19
K1 K2 K3
tCO
2e
GHG emissions from waste per building
<0,1 <0,1 0,1
19,7
<0,1 1,1 0,1 <0,1 <0,1 1,1 0,1
13,2
<0,1 <0,1 0,12,3 3,2
tCO
2e
Total emissions of waste by category
Hazardous waste Non-hazardous waste Water
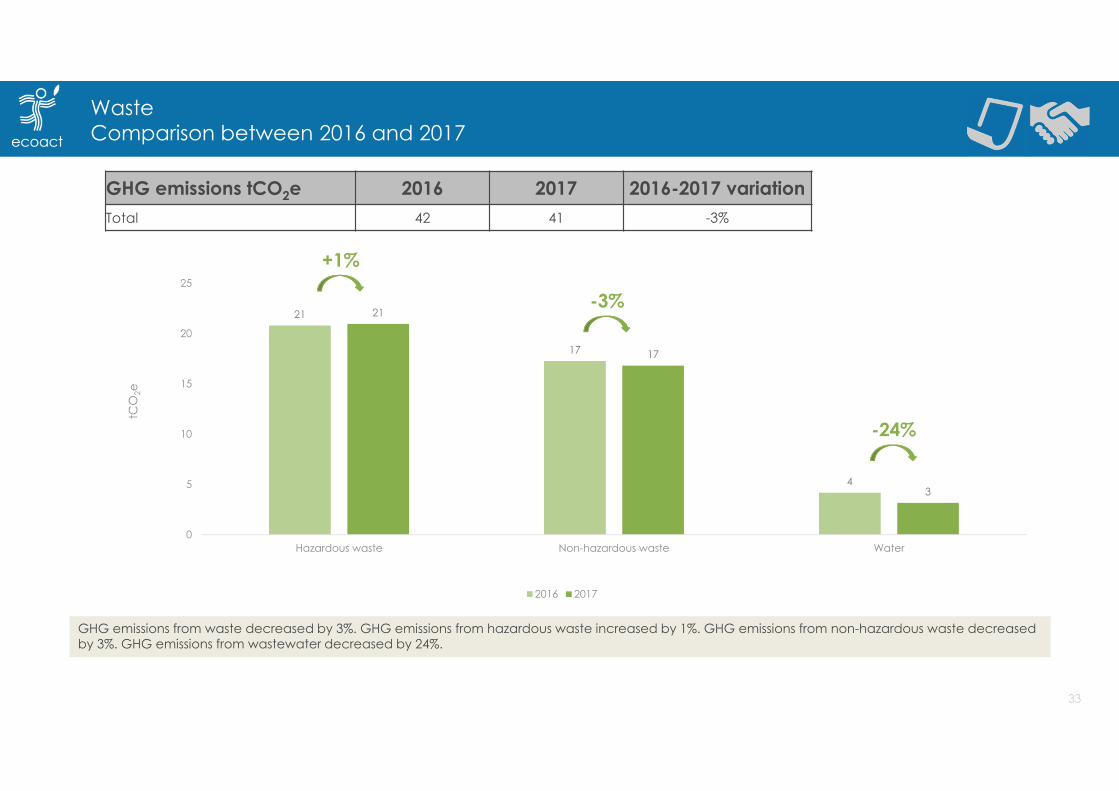
21
17
4
21
17
3
0
5
10
15
20
25
Hazardous waste Non-hazardous waste Water
tCO
2e
2016 2017
WasteComparison between 2016 and 2017
GHG emissions tCO2e 2016 2017 2016-2017 variationTotal 42 41 -3%
+1%
-3%
-24%
GHG emissions from waste decreased by 3%. GHG emissions from hazardous waste increased by 1%. GHG emissions from non-hazardous waste decreased by 3%. GHG emissions from wastewater decreased by 24%.
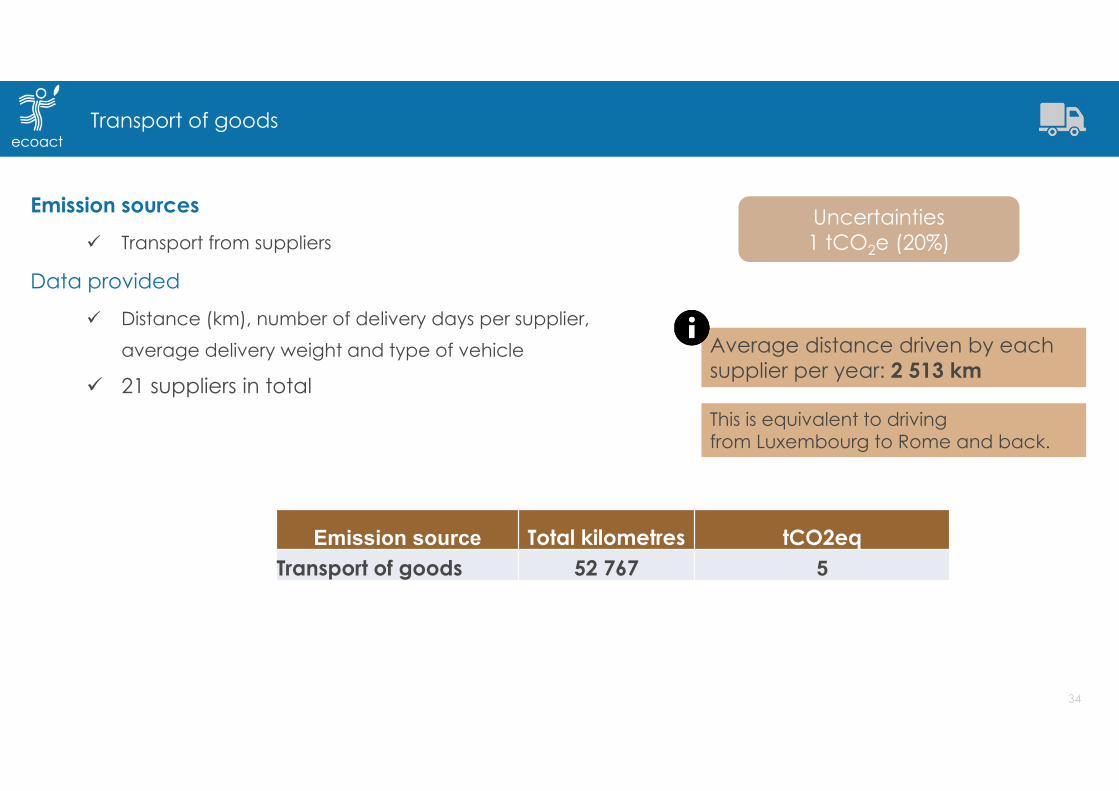
Transport of goods
Emission sources Transport from suppliers
Data provided
Distance (km), number of delivery days per supplier, average delivery weight and type of vehicle
21 suppliers in total
Emission source Total kilometres tCO2eqTransport of goods 52 767 5
Average distance driven by eachsupplier per year: 2 513 km
This is equivalent to drivingfrom Luxembourg to Rome and back.
Uncertainties1 tCO2e (20%)
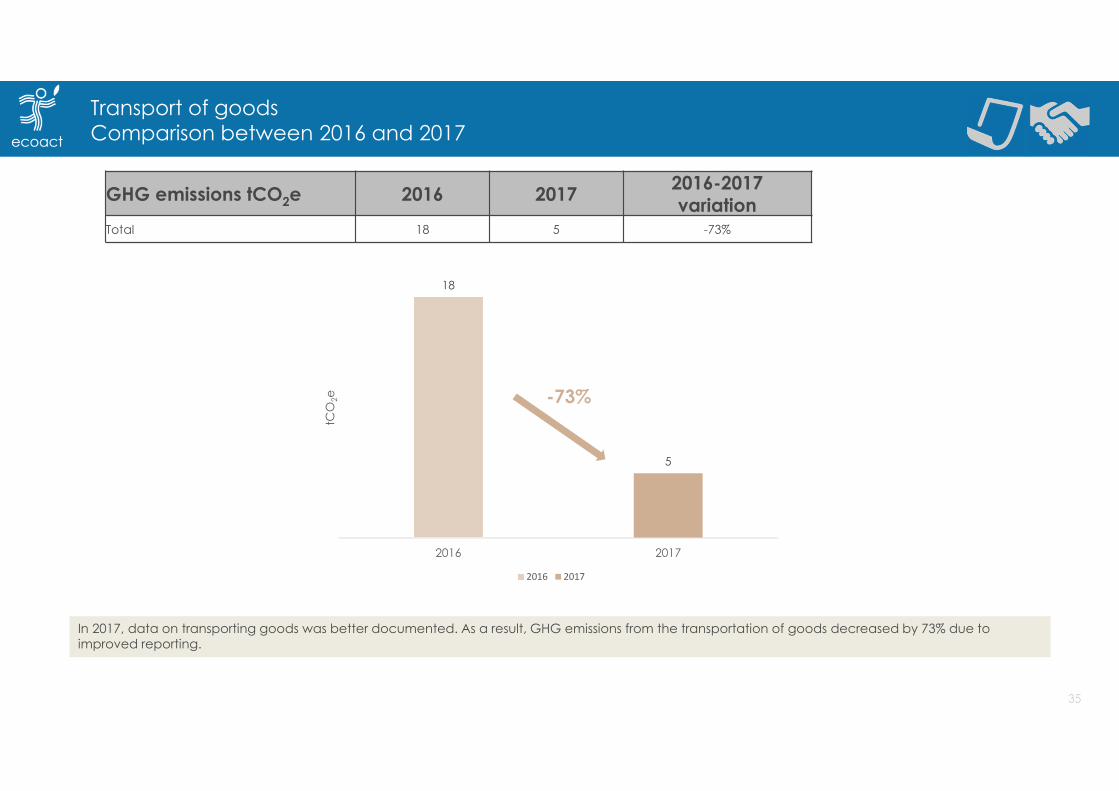
18
5
2016 2017
tCO
2e
2016 2017
Transport of goodsComparison between 2016 and 2017
GHG emissions tCO2e 2016 2017 2016-2017variation
Total 18 5 -73%
-73%
In 2017, data on transporting goods was better documented. As a result, GHG emissions from the transportation of goods decreased by 73% due to improved reporting.

Carbon neutrality
• Today there is an urgent need to act! If we are to stay
well below the 2º threshold, emissions must peak by 2020,
and the world economy needs to be carbon neutral by
2050, as stated in the landmark Paris Agreement in 2015.
• Carbon neutrality is a term used to refer to organisations’
efforts to offset the residual emissions that they are unable
to reduce or are in the process of reducing. Carbon
offsets is a mechanism whereby an organisation
purchases carbon “credits” from projects proven to
mitigate or sequester carbon.
Recommendations -Carbon neutrality
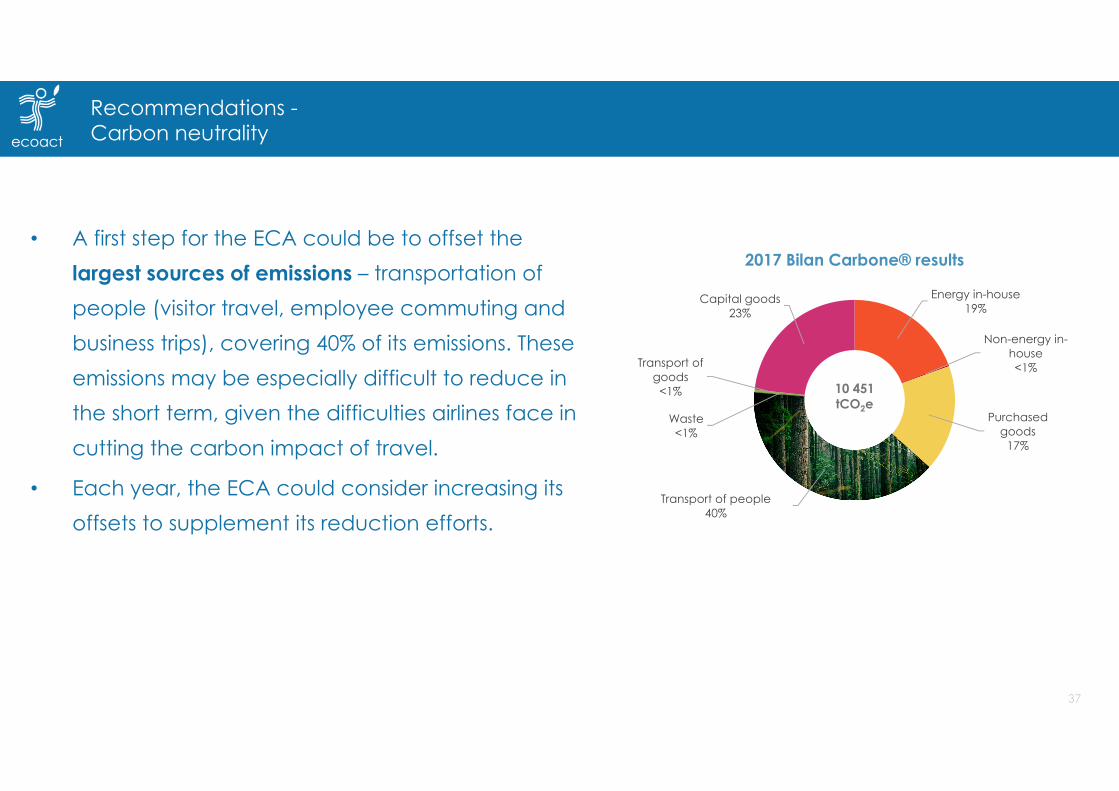
• A first step for the ECA could be to offset the largest sources of emissions – transportation of people (visitor travel, employee commuting and business trips), covering 40% of its emissions. These emissions may be especially difficult to reduce in the short term, given the difficulties airlines face in cutting the carbon impact of travel.
• Each year, the ECA could consider increasing its offsets to supplement its reduction efforts.
Energy in-house19%
Non-energy in-house<1%
Purchased goods
17%
Transport of people40%
Transport of goods
<1%
Waste<1%
Capital goods23%
2017 Bilan Carbone® results
10 451 tCO2e
Got a question?
Contact us !
EcoAct France
35 rue de Miromesnil75008 Paris
(+33) 1 83 64 08 [email protected]
www.eco-act.com
Luca LO [email protected]+ 33 (0)1 84 19 51 24
Valerie MORGANSenior [email protected]+ 33 (0)1 83 64 12 56
38