Embed Size (px)
Citation preview
��� TH E SOCIA L R E PO RT 2006 TH E SOCIA L R E PO RT 2006 ���
ACNielsen(2005)Television Facts2004.
AdolescentHealthResearchGroup(2003a)New Zealand Youth: A Profile of their Health and WellbeingUniversityofAuckland:Auckland.
AdolescentHealthResearchGroup(2003b)New Zealand Youth: A Profile of their Health and Wellbeing: Regional ReportsUniversityofAuckland:Auckland.
AucklandCityCouncil,ChristchurchCityCouncil,DunedinCityCouncil,HamiltonCityCouncil,HuttCityCouncil,ManukauCityCouncil,NorthShoreCityCouncil,PoriruaCityCouncil,RodneyDistrictCouncil,TaurangaCityCouncil,WaitakereCityCouncilandWellingtonCityCouncil(2005)Quality of Life in New Zealand’s Largest Cities 2004QualityofLifeProjectandtheMinistryofSocialDevelopment:NewZealand.
AucklandCityCouncil,ChristchurchCityCouncil,DunedinCityCouncil,HamiltonCityCouncil,ManukauCityCouncil,NorthShoreCityCouncil,WaitakereCityCouncilandWellingtonCityCouncil(2003)Quality of Life in New Zealand’s Eight Largest Cities 2003QualityofLifeProject:NewZealand.
AucklandCityCouncil,ChristchurchCityCouncil,ManukauCityCouncil,NorthShoreCityCouncil,WaitakereCityCouncilandWellingtonCityCouncil(2001)Quality of Life in New Zealand’s Six Largest CitiesQualityofLifeProject:NewZealand.
Australia:AustralianBureauofStatistics2001 Census of Population and HousingCat.6203,unpublisheddataABS:Canberra.
Baker,M.,McNicholas,A.,Garrett,N.,Jones,N.,Stewart,J.,Koberstein,V.andLennon,D.(2000)“HouseholdCrowding:AMajorRiskFactorforEpidemicMeningococcalDiseaseinAucklandChildren”Paediatric Infectious Disease Journal19(10),pp983–990.
Beautrais,A.(2000)Restricting Access to Means of Suicide in New Zealand: A Report Prepared for the Ministry of Health on Methods of Suicide in New ZealandMinistryofHealth:Wellington.
Boocock,S.(1995)“EarlyChildhoodProgramsinOtherNations:GoalsandOutcomes”The Future of ChildrenVolume5No(3).
Cole,T.J.,Bellizzi,M.C.,Flegal,K.M.andDietz,W.H.(2000)“Establishingastandarddefinitionfor
childoverweightandobesityworldwide:internationalsurvey”British Medical JournalVolume320Issue7244,pp1240–1243.
Crothers,C.(2000)“MonitoringtheChangingSocialConditionsofNewZealanders”Social Policy Journal of New ZealandIssue15,pp102–120.
Davey,J.(1998)Tracking Social Change in New Zealand: From Birth to Death IVInstituteofPolicyStudies:Wellington.
Davey,J.(1993)Tracking Social Change in New Zealand: From Birth to Death IIIInstituteofPolicyStudies:Wellington.
DepartmentofInternalAffairs(2006)Local Authority Election Statistics 2004DepartmentofInternalAffairs:Wellington.
DepartmentofLabour(1999)Human Capability: A Framework for AnalysisDepartmentofLabour:Wellington.
DepartmentofSocialWelfare/MinistryofSocialPolicy(various,1993–1999)Statistical InformationReports DepartmentofSocialWelfare/MinistryofSocialPolicy:Wellington.
Donovan,N.andHalpern,D.(2002)Life Satisfaction: The state of knowledge and implications for governmentStrategyUnit,UKCabinetOffice:UnitedKingdom.
Durie,M.(2001)“AFrameworkforConsideringMäoriEducationalAdvancement”OpeningAddresstotheHuiTaumataMataurangaTurangi/Taupo24February2001.
Durie,M.(1999)“MentalHealthandMäoriDevelopment”Australian Journal of PsychiatryVolume33No(1),pp5–12.
Durie,M.,Fitzgerald,E.,Kingi,T.,McKinley,S.andStevenson,B.(2002)Mäori Specific Outcomes and Indicators: A Report Prepared for Te Puni KökiriTePuniKökiri:Wellington.
ElectoralCommission(2006)Electoral Compendium 2005ElectoralCommission:Wellington.http://www.elections.org.nz/electoral-compendium-2005.html
ElectoralCommission(2005)2005 General Election – Official Resultshttp://www.electionresults.govt.nz
Bibliography
�40 TH E SOCIA L R E PO RT 2006 TH E SOCIA L R E PO RT 2006 �4�
ElectoralCommission(2002)The New Zealand Electoral Compendium3rdedition,ElectoralCommission:Wellington.
EuropeanCommission(2005)Social Values, Science and Technology: Special Eurobarometer 225 EuropeanCommission:Brussels.
Forster,M.andd’Ercole,M.M.(2005)Income Distribution and Poverty in OECD Countries in the Second Half of the 1990sOECDSocial,EmploymentandMigrationWorkingPapersNo22,OECD:Paris.
Forster,M.andPearson,M.(2002)“IncomeDistributionandPovertyintheOECDArea:TrendsandDrivingForces”OECD Economic StudiesNo(34),OECD:Paris.
Gold,H.andWebster,A.(1990)New Zealand Values TodayAlphaPublications:PalmerstonNorth.
Howden-Chapman,P.andTobias,M.(eds)(2000)Social Inequalities in Health: New Zealand 1999MinistryofHealth:Wellington.
HumanRightsCommission(2006)Omnibus Survey ResultsFebruary2006.
InternationalInstituteforDemocracyandElectoralAssistance(2004).
InternationalRoadTrafficandAccidentDatabase(OECD)(2005).http://www.bast.de/htdocs/fachthemen/irtad/english/we2.html
Inter-ParliamentaryUnion(2006a)PARLINEDatabasedatafromthemostrecentelectionasof28February2006.http://www.ipu.org/parline-e/parlinesearch.asp
Inter-ParliamentaryUnion(2006b)Women in National ParliamentsSituationasof28February2006.http://www.ipu.org/wmn-e/arc/classif280206.htm
Jensen,J.,Krishnan,V.,Hodgson,R.,Sathiyandra,S.andTempleton,R.(2006)New Zealand Living Standards 2004Nga Ahuatanga Noho o Aotearoa,MinistryofSocialDevelopment:Wellington.
Jensen,J.,Spittal,M.,Crichton,S.,Sathiyandra,S.andKrishnan,V.(2002)Direct Measurement of Living Standards: The New Zealand ELSI ScaleMinistryofSocialDevelopment:Wellington.
Knack,S.andKeefer,P.(1997)“DoesSocialCapitalHaveanEconomicPayoff?ACross-CountryInvestigation”Quarterly Journal of Economics November1997.
Krishnan,V.,Jensen,J.andBallantyne,S.(2002)New Zealand Living Standards 2000CentreforSocialResearchandEvaluation,MinistryofSocialDevelopment:Wellington.
LandTransportSafetyAuthority(2000)Travel Survey Report: Increasing our Understanding of New Zealanders’ Travel Behaviour 1997/1998LandTransportSafetyAuthority:Wellington.
Marsh,A.andSahin-Dikmen,M.(2003)Discrimination in Europe Eurobarometer 57.0TheEuropeanCommission:Brussels.
Marsh,A.andSahin-Dikmen,M.(2002)Discrimination in EuropeTheEuropeanCommission:Brussels.
Mayer,S.(2002)The Explanatory Power of Parental Income on Children’s OutcomesReporttotheMinistryofSocialDevelopment,MinistryofSocialDevelopment:Wellington.
MinistryofEducation(variousyears)Early Childhood Education StatisticsMinistryofEducation:Wellington.
MinistryofEducation(variousyears)Education Statistics of New ZealandMinistryofEducation:Wellington.
MinistryofEducation(variousyears)Education Statistics of New Zealand: School Leaver StatisticsMinistryofEducation:Wellington.
MinistryofEducation(2002a)Participation in Tertiary EducationMinistryofEducation:Wellington.
MinistryofEducation(2002b)PISA 2000: Overview of Selected New Zealand Findings.
MinistryofEducation(2001a)Education Statistics NewsSheetVolume10No(1)MinistryofEducation:Wellington.
MinistryofEducation(2001b)More than Words: The New Zealand Adult Literacy StrategyMinistryofEducation:Wellington.
MinistryfortheEnvironmentandMinistryofHealth(2002)Ambient Air Quality Guidelines – 2002 updateMinistryfortheEnvironment:Wellington.
MinistryofForeignAffairsandTrade(1998)The New Zealand Handbook on International Human RightsMinistryofForeignAffairsandTrade:Wellington.
MinistryofHealth(variousyears)Mortality and Demographic DataNewZealandHealthInformationService,MinistryofHealth:Wellington.
MinistryofHealth(2006)Suicide Facts: Provisional 2003 All-ages StatisticsMinistryofHealth:Wellington.
MinistryofHealth(2005)Tobacco Facts 2005MinistryofHealth:Wellington.
MinistryofHealth(2004a)A Portrait of Health: Key results of the 2002/2003 New Zealand Health SurveyMinistryofHealth:Wellington.
�40 TH E SOCIA L R E PO RT 2006 TH E SOCIA L R E PO RT 2006 �4�
MinistryofHealth(2004b)Tracking the Obesity Epidemic: New Zealand 1977–2003MinistryofHealth:Wellington.
MinistryofHealth(2004c)Living with Disability in New Zealand. A Descriptive AnalysisMinistryofHealth:Wellington.
MinistryofHealth(2003a)Suicide Facts: Provisional 2002 Statistics (all ages)MinistryofHealth:Wellington.
MinistryofHealth(2003b)Tobacco Facts 2003MinistryofHealth:Wellington.
MinistryofHealth(2003c)NZ Food, NZ Children: Key results of the 2002 National Children’s Nutrition SurveyMinistryofHealth:Wellington.
MinistryofHealth(2003d)Decades of Disparity: Ethnic Mortality Trends in New Zealand 1980–1999 MinistryofHealth:Wellington.
MinistryofHealth(2002)An Indication of New Zealanders’ HealthMinistryofHealth:Wellington.
MinistryofHealth(2000)Drinking Water Standards for New Zealand 2000MinistryofHealth:Wellington.
MinistryofHealth(1999a)Our Health, Our Future: Hauora Pakari, Koiora Roa. The Health of New Zealanders 1999MinistryofHealth:Wellington.
MinistryofHealth(1999b)NZ Food, NZ People: Key Results of the 1997 National Nutrition SurveyMinistryofHealth:Wellington.
MinistryofHealth(1997)National Nutrition SurveyMinistryofHealth:Wellington.
MinistryofSocialDevelopment(2006)New Zealand Living Standards 2004MinistryofSocialDevelopment:Wellington.
MinistryofSocialDevelopment(2004)Social Wellbeing Survey.
MinistryofSocialDevelopment(2003a)The Social Report 2003MinistryofSocialDevelopment:Wellington.
MinistryofSocialDevelopment(2003b)New Zealand Living Standards 2000MinistryofSocialDevelopment:Wellington.
MinistryofSocialDevelopment(2001a)The Social Report 2001MinistryofSocialDevelopment:Wellington.
MinistryofSocialPolicy(2001)Definitions of Crowding and the Effects of Crowding on Health: A Literature ReviewMinistryofSocialPolicy:Wellington.
MinistryofTransport(2006)Unpublishedroadcasualtydatafor2005.
MinistryofTransport(2005)Motor Vehicle Crashes in New Zealand 2004MinistryofTransport:Wellington.
Morris,A.,Reilly,J.,Berry,S.andRansom,R.(2003)New Zealand National Survey of Crime Victims 2001MinistryofJustice:Wellington.
NationalInstituteofWaterandAtmosphericResearch,KevinRolfeandAssociatesLimited,UniversityofAucklandandWellingtonMedicalSchool(2002)Health Effects Due to Motor Vehicle Air Pollution in New ZealandMinistryofTransport:Wellington.
NationalResearchCouncil(1993)Understanding Child Abuse and Neglect – Panel on Research on Child Abuse and NeglectDepartmentofHealthandHumanServices:WashingtonDC.
NationalRoadSafetyCommittee(2000)Road Safety Strategy 2010: A Consultation DocumentNationalRoadSafetyCommittee:Wellington.
Noll,H.(1996)Social Indicators Reporting: The International ExperiencePresentationtoSymposiumonMeasuringWellbeingandSocialIndicators,CanadianCouncilonSocialDevelopment.
Noll,H.andBerger-Schmitt,R.(2000)Conceptual Framework and Structure of a European System of Social IndicatorsEUReportingWorkingPaperNo9,CentreforSurveyResearchandMethodology(ZUMA),SocialIndicatorsDepartment:MannheimGermany.
NZOnAir(2006)Local Content, New Zealand Television, 2005.
NZOnAir(1999)Local Content and Diversity: Television in Ten CountriesNZOnAir:Wellington.
OECD(2006a)Annual National Accounts, Main Aggregates, Volume 1 1993–2004OECD:Paris.
OECD(2006b)Main Economic Indicators 2005OECD:Paris.
OECD(2006c)OECD FactbookOECD:Paris.
OECD(2005a)Education at a Glance 2005September2005,OECD:Paris.
OECD(2005b)OECD Employment Outlook 2005OECD:Paris.
OECD(2005c)OECD Health Data 2005October2005,OECD:Paris.
OECD(2001)OECD Communications OutlookOECD:Paris.
�42 TH E SOCIA L R E PO RT 2006 TH E SOCIA L R E PO RT 2006 �4�
OECD(2000)Literacy in the Information AgeOECD:Paris.
OECD(1995)Environmental Data Compendium 1995OECD:Paris.
Perry,P.andWebster,A.(1999)New Zealand Politics at the Turn of the Millennium: Attitudes and Values About Politics and GovernmentAlphaPublications:Auckland.
RoyalCommissiononSocialPolicy(1988)The April ReportRoyalCommissiononSocialPolicy:Wellington.
RoyalCommissiononSocialSecurityinNewZealand(1972)Social Security in New ZealandRoyalCommissiononSocialSecurityinNewZealand:Wellington.
Salmond,C.andCrampton,P.(2002)NZDep 2001 Index of Deprivation User’s ManualDepartmentofPublicHealth,WellingtonSchoolofMedicineandHealthSciences:Wellington.
SocialMonitoringGroup(1989)From Birth to Death: The Second Overview ReportNewZealandPlanningCouncil:Wellington.
SocialMonitoringGroup(1985)From Birth to Death: The First Report of the Social Monitoring GroupNewZealandPlanningCouncil:Wellington.
Spellerberg,A.(2001)Framework for the Measurement of Social Capital in New ZealandResearchandAnalyticalReport2001No14,StatisticsNewZealand:Wellington.
SportandRecreationNewZealand(2006)Overcoming Obstacles to Action: Report commissioned by Sport and Recreation NZ giving results of Continuous Monitoring SurveySportandRecreationNewZealand:Wellington.
StatisticsCanada(2004)2003 General Social Survey on Social Engagement, Cycle 17 and Overview of the FindingsStatisticsCanada:Ottawa.
StatisticsCanada(2001)Families with Children Under 18, 2001 CensusCat.No95F0316XCB01004.
StatisticsNewZealand(2006a)BirthsStatisticsNewZealand:Wellington.
StatisticsNewZealand(2006b)DeathsInformation ReleaseStatisticsNewZealand:Wellington.
StatisticsNewZealand(2006c)Demographic Trends 2005StatisticsNewZealand:Wellington.
StatisticsNewZealand(2006d)Household Labour Force Survey 1985–2005StatisticsNewZealand:Wellington.
StatisticsNewZealand(2006e)National Population Estimates Information Release, December 2005 QuarterStatisticsNewZealand:Wellington.
StatisticsNewZealand(2006f)New Zealand Abridged Life Tables: 2003–2005 StatisticsNewZealand:Wellington.
StatisticsNewZealand(2006g)New Zealand Income Survey (1997–2005)StatisticsNewZealand:Wellington.
StatisticsNewZealand(2005a)Injury Statistics – Work-related claims 2004 Information Release StatisticsNewZealand:Wellington.
StatisticsNewZealand(2005b)National Ethnic Population Projections 2001(base) – 2021 update Information ReleaseStatisticsNewZealand:Wellington.
StatisticsNewZealand(2005c)Household Economic Survey 1988–2004StatisticsNewZealand:Wellington.
StatisticsNewZealand(2004a)Concerning LanguageStatisticsNewZealand:Wellington.
StatisticsNewZealand(2004b)Injury Statistics 2003 – Claims for Work-Related Injuries (2003) – ReportStatisticsNewZealand:Wellington.
StatisticsNewZealand(2004c)New Zealand Life Tables: 2000–2002StatisticsNewZealand:Wellington.
StatisticsNewZealand(2003a)Injury Statistics 2001/2002: Work-related injuriesStatisticsNewZealand:Wellington.
StatisticsNewZealand(2003b)What is the effect of crowding in New Zealand? An analysis of crowding in NZ households 1986–2001StatisticsNewZealand:Wellington.
StatisticsNewZealand(2002a)Cultural Experiences SurveyStatisticsNewZealand:Wellington.
StatisticsNewZealand(2002b)New Zealand 2001 Census of Population and DwellingsStatisticsNewZealand:Wellington.
StatisticsNewZealand(2001a)Disability CountsStatisticsNewZealand:Wellington.
StatisticsNewZealand(2001b)Around the Clock: Findings from the New Zealand Time Use Survey 1998/1999StatisticsNewZealand:Wellington.
StatisticsNewZealand(2001c)Measuring Unpaid Work in New Zealand 1999StatisticsNewZealand:Wellington.
StatisticsNewZealand(1999)New Zealand Now – IncomesStatisticsNewZealand:Wellington.
StatisticsNewZealand(1998)New Zealand Now: HousingStatisticsNewZealand:Wellington.
StatisticsNewZealand(1997)New Zealand 1996 Census of Population and DwellingsStatisticsNewZealand:Wellington.
�42 TH E SOCIA L R E PO RT 2006 TH E SOCIA L R E PO RT 2006 �4�
StatisticsNewZealand(1993)Measuring Up: New Zealanders and the EnvironmentStatisticsNewZealand:Wellington.
Stephens,R.,Frater,P.andWaldegrave,C.(1995)“MeasuringPovertyinNewZealand”Social Policy Journal of New ZealandIssue5.
TePuniKökiri(2001)Provisional results of the 2001 Survey of the Health of the Mäori LanguageTePuniKökiri:Wellington.
TePuniKökiri(1998)The National Mäori Language Survey: Te Mahi Rangahau Reo MäoriTePuniKökiri:Wellington.
Tobias,M.andCheung,J.(2003)“MonitoringHealthInequalities:LifeExpectancyandSmallAreaDeprivationinNewZealand”Population Health MetricsVolume1No(2).
TransparencyInternational(2005)Corruption Perceptions Index 2005.http://www.transparency.org/cpi/2005/2005.10.18.cpi.en.html#cpi
UNICEF(2003)“ALeagueTableofChildMaltreatmentDeathsinRichNations”Innocenti Report CardUNICEF:Geneva.
UnitedKingdomOfficeforNationalStatistics(2006)Social Trends 36: 2006 editionONS:London.
UnitedKingdomOfficeforNationalStatistics(2002)Social Trends 32: 2002 editionONS:London.
UnitedKingdomPerformanceandInnovationUnit(2002)Social Capital: A Discussion PaperPrimeMinister’sStrategyUnit:UnitedKingdom.
UnitedStatesCensusBureau(2001)America’s Families and Living Arrangements 2001.
UnitedStatesDepartmentofHealthandHumanServices,CentersforDiseaseControlandPrevention(2005)National Vital StatisticsReports,Volume58No8,December29.
UnitedStatesStateDepartmentBureauofDemocracy,HumanRightsandLabor(2003)New Zealand: Country Reports on Human Rights PracticesUnitedStatesStateDepartment:WashingtonDC.
Veenhoven,R.(2004)World Database of Happiness, Distributional Findings in Nations 2004.
Vowles,J.andAimer,P.(1993)Voters’ Vengeance: The 1990 Election in New Zealand and the Fate of the Fourth Labour GovernmentAucklandUniversityPress:Auckland.
Wilson,N.(1999)“OccupationandHealth”inTobias,M.andHowden-Chapman,P.(eds)Social Inequalities in Health: New Zealand 1999MinistryofHealth:Wellington.
Winkelmann,L.andWinkelmann,R.(1998)“ImmigrantsintheNewZealandLabourMarket:ACohortAnalysisUsing1986,1991and1996CensusData”Labour Market Bulletin 1998,Volumes1and2,pp34–70.
WorldHealthOrganisation(2004)Suicide Prevention: Country Reports and ChartsWorldHealthOrganisation:Geneva.
WorldHealthOrganisation(2000)Obesity: Preventing and Managing the Global EpidemicWorldHealthOrganisation:Geneva.
Wylie,C.(1999)Eight Years Old and Competent, The Third Stage of the Competent Children Project: A Summary of the Main FindingsNewZealandCouncilforEducationalResearch:Wellington.
Young,W.,Morris,A.,Cameron,N.,andHaslett,S.(1997)New Zealand National Survey of Crime Victims 1996VictoriaUniversity:Wellington.
Zubrick,S.,Williams,S.andVimpani,G.(2000)Indicators of Social and Family Functioning DepartmentofFamilyandCommunityServices:Canberra.
�44 TH E SOCIA L R E PO RT 2006 TH E SOCIA L R E PO RT 2006 �4�
aPPendix 1
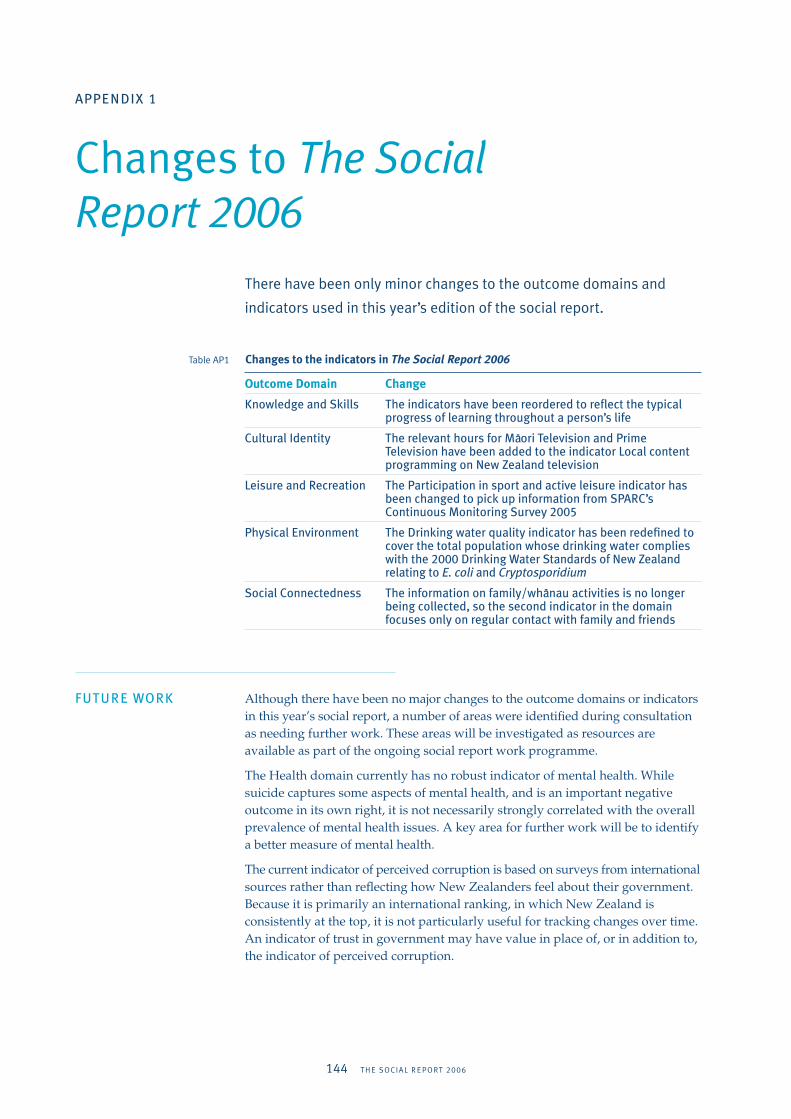
Changes to The Social Report 2006
There have been only minor changes to the outcome domains and
indicators used in this year’s edition of the social report.
Table AP� Changes to the indicators in The Social Report 2006
Outcome Domain Change
Knowledge and skills the indicators have been reordered to reflect the typical progress of learning throughout a person’s life
Cultural identity the relevant hours for Ma-ori television and Prime television have been added to the indicator local content programming on new Zealand television
leisure and recreation the Participation in sport and active leisure indicator has been changed to pick up information from sParC’s Continuous Monitoring survey 2005
Physical environment the drinking water quality indicator has been redefined to cover the total population whose drinking water complies with the 2000 drinking water standards of new Zealand relating to E. coli and Cryptosporidium
social Connectedness the information on family/wha-nau activities is no longer being collected, so the second indicator in the domain focuses only on regular contact with family and friends
Future worK Althoughtherehavebeennomajorchangestotheoutcomedomainsorindicatorsinthisyear’ssocialreport,anumberofareaswereidentifiedduringconsultationasneedingfurtherwork.Theseareaswillbeinvestigatedasresourcesareavailableaspartoftheongoingsocialreportworkprogramme.
TheHealthdomaincurrentlyhasnorobustindicatorofmentalhealth.Whilesuicidecapturessomeaspectsofmentalhealth,andisanimportantnegativeoutcomeinitsownright,itisnotnecessarilystronglycorrelatedwiththeoverallprevalenceofmentalhealthissues.Akeyareaforfurtherworkwillbetoidentifyabettermeasureofmentalhealth.
Thecurrentindicatorofperceivedcorruptionisbasedonsurveysfrominternational sourcesratherthanreflectinghowNewZealandersfeelabouttheirgovernment.Becauseitisprimarilyaninternationalranking,inwhichNewZealandisconsistentlyatthetop,itisnotparticularlyusefulfortrackingchangesovertime.Anindicatoroftrustingovernmentmayhavevalueinplaceof,orinadditionto,theindicatorofperceivedcorruption.
�44 TH E SOCIA L R E PO RT 2006 TH E SOCIA L R E PO RT 2006 �4�
TheCulturalIdentitydomaincurrentlycapturesverylittleinformationaboutculturalgroupsotherthanthosedefinedprimarilybyethnicity.Forexample,thedistinctlinguisticandculturalgroupofpeoplewhoaredeafandwhouseNewZealandSignLanguageastheirfirstorpreferredlanguageisnotcapturedbythesocialreport’sexistingculturalidentityindicators.Apriorityforworkinthisdomainistoinvestigateoptionsforamorerobustandinclusiveindicatoroftheculturalvitalityofdifferentpopulationgroups.
TheLeisureandRecreationoutcomedomainwasintroducedaspartofThe Social Report 2004.Thereisonlyalimitedrangeofinformationavailabletoprovide indicatorsforthisdomain,andthescopeofthedomainhasnotbeenreviewedsinceitwasintroduced.Furtherworkcouldusefullyreviewthescopeofthedomainandinvestigatenewindicatorsinthisarea.
�46 TH E SOCIA L R E PO RT 2006 TH E SOCIA L R E PO RT 2006 �4�
aPPendix 2
Technical details
People
Limitations of data:Thefamilydatapresentedinthisreportrelatestofamilieswithinhouseholds.Inofficialstatistics,afamilyisdefinedastwoormorepeoplelivinginthesamehouseholdwhocompriseeitheracouple,withorwithoutchildren,oroneparentandtheirchildren.Thechildrendonothavepartnersorchildrenoftheirownlivinginthesamehousehold.Peoplewhoweretemporarilyawayfromhomeoncensusnightareincludedaspartofthefamily.Thereisnodataavailableonparentsandchildrenwholiveindifferenthouseholds.
Data sources: Population size and growth: Statistics New Zealand, National Population Estimates Information Release; Census of Population and Dwellings; National Population Projections, 2004(base), mid-range Series 5, assuming medium fertility, medium mortality, long-term annual net migration gain of 10,000, Series 6 (low fertility), Series 6 (high migration); External Migration Information Release, INFOS series VTBA.SJT (natural increase) and EMIQ.S3E (net migration).
Fertility: Statistics New Zealand (2006a): Births, Additional Tables (Age-specific Fertility Rates by Single Year of Age for Ma-ori, Non-Ma-ori, Total, Ethnic groups); international comparison from Demographic Trends 2005, Table 2.12, latest years available; teenage fertility rates: UK, Office for National Statistics, Social Trends 36: 2006 edition, Table 2.16; US, National Vital Statistics Reports, Vol 54 No 8, December 29, 2005, Table 1.
Geographic and ethnic distribution of the population: Statistics New Zealand, 2001 Census of Population and Dwellings; Ethnic Population Projections, 2004(base).
Age and sex structure of the population: Statistics New Zealand, National Population Estimates by single year of age, mean for the year ended December, National Population Estimates Information Release.
Household structure: Statistics New Zealand, 1996 Census: Families and Households, Table 1; 2001 Census: National Summary, Table 36.
Families with dependent children: Table P3: Families with dependent children, by family type, 1976 to 2001; Statistics New Zealand, 1976, 1981, 1986, unpublished census data; 1991 Census: New Zealanders at Home, Tables 16, 17; 1996 Census: Families and Households, Tables 16, 21, 26; 2001 Census: Families and Households, Tables 13, 24; international comparison data: UK: Office for National Statistics (2002) Social Trends 32: 2002 edition, Table 2.17, Families with dependent children headed by lone parents; US: Census Bureau (2001) America’s Families and Living Arrangements, Table FG7, Family groups with own children under 18; Australia: Australian Bureau of Statistics, 2001 Census, Cat. 6203, Families with dependent children under 18; Canada: Statistics Canada, 2001 Census, Cat. No 95F0316XCB01004, Families with children under 18.
People with disability: Statistics New Zealand (2001a) Disability Counts, Tables 1.01a, 1.02a; Ministry of Health (2004c) Living with Disability in New Zealand, Tables 4.29, 5.25.
Same-sex couples: Statistics New Zealand 2001 Census: Families and Households, Tables 7, 11.
Health
H1 health exPeCtanCY
Definition/formulae:Thetotalnumberofyearsanewborncanexpecttolivewithoutanyself-reportedfunctionallimitationrequiringtheassistanceofanotherpersonoracomplexassistivedevice.
Notes:
1 2001estimateshavebeenrevisedfollowingtheofficialreleaseof2000–2002completelifetablesinMarch2004.
2 Independentlifeexpectancyestimatesfor1996havebeenrevisedslightly,reflectingchangestothesmoothingmethodrequiredforthe2001dataandthereleaseof2000–2002completelifetables.
3 Mäoriandnon-Mäoriratesarebasedonestimatesforages0–85yearsbecauseofthesmallnumberofMäoriagedover85years,andarereferredtohereas“partial”independentlifeexpectancies.
Limitations of data:Theabilitytomonitorhealthexpectancyonaregularbasisdependsontheavailabilityofinformationaboutdisabilityandlevelsofdisability.
Thismeasureofhealthexpectancy(titledindependentlifeexpectancyinThe Social Report 2003)hasinherentlimitationsasapopulationhealthindicator.Anindicatorthatincludedalllevelsofdisability–notjustasingledependencythreshold–wouldprovideamoreprecisemeasureofhealth(ieahealth-adjustedlifeexpectancy).Thesocialpreferences(disabilityweights)neededtoconstructsuchanindicatorarestillunderdevelopmentinNewZealand.
Data source: Ministry of Health, revised data.
�46 TH E SOCIA L R E PO RT 2006 TH E SOCIA L R E PO RT 2006 �4�
H2 liFe exPeCtanCY
Definition/formulae:Theexpectednumberofyearsapersonwouldliveiftheyweresubjectthroughouttheirlivestothecurrentage-specificmortalityrates.
Note:Ethnic-specificestimatesfortheperiod1980–1982to1995–1997havebeenadjustedforundercountingintheethnicmortalitystatisticsusingcensusethnicdefinitionsandwererevisedaftertheofficialreleaseofthe2000–2002completelifetablesinMarch2004.ThefiguresdifferfromthosepublishedbyStatisticsNewZealandforthesameperiodandarenotcomparablewithearlierestimates.
TheanalysisassociatinglifeexpectancywithlevelsofdeprivationisbasedonNZDep96,asmall-areaindexofdeprivationbasedonaprincipal-componentanalysisofninesocio-economicvariablesfromthe1996Census.Theindexhasbeenconvertedtoascalerangingfrom1to10,where1representstheleastdeprived10percentofsmallareas,and10representsthemostdeprived10percent.Thesmallareasareaboutthesizeofacensusmeshblockandhavepopulationsofatleast100people.
Limitations of data:Availableannuallyfromabridgedlifetablesforthetotalpopulationonly.OfficialMäori/non-Mäoridataisonlyavailablefive-yearlyfromcompletelifetablesbasedonathree-yearperiodaroundcensusyears.
Data sources: Statistics New Zealand (2006f) New Zealand Abridged Life Table: 2003–2005 abridged life tables: http://www.stats.govt.nz/tables/abridged-life-tables.htm; Statistics New Zealand (2004c) New Zealand Life Tables: 2000–2002, Table 1; Statistics New Zealand (2006b) Information Release, Deaths December 2005 (www.stats.nz). Ministry of Health (ethnic-specific data for 1985–1987, 1990–1992); Ministry of Health (1999a) Our Health, Our Future: Hauora Pakari, Koiora Roa, The Health of New Zealanders 1999, Chapter 2. Tobias and Cheung (2003) Monitoring Health Inequalities: Life Expectancy and Small Area Deprivation in New Zealand, Table 3. OECD (2005c) OECD Health Data 2004, Table 1.
H3 suiCide
Definition/formulae:Theage-standardisedrateofsuicidedeathsper100,000population.
Age-standardisedtoSegi’sworldpopulation.
Note:Thefiguresfor2003areprovisionalandsubjecttorevision.
Limitations of data:Becausesuicideisarelativelyrareeventinstatisticalterms,ratesofsuicidecanvarymarkedlyfromyeartoyear.Anyinterpretationoftrendsrequiresanexaminationofratesoverseveralyears.Deathsbysuicidearesubjecttoacoroner’sinquiryandcanonlybeofficiallydeemedsuicideonceaninquestiscomplete.Thismeanstherecanbeaconsiderabledelayinthepublicationofthefinalstatistics.
Dataontheratesofsuicideforgeographicalregionsandcitiesmaybeoflittlevalueforreportingcomparisonsbecauseofthelownumbers,andhencehighlyvariablesuiciderates.Forexample,wherepopulationsaresmall,therateofsuicidecanbegreatlyinflatedbyoneortwodeaths.
Dataonattemptedsuicideisonlyavailableforthoseadmittedtohospitalasinpatientsordaypatientsforself-inflictedinjury.Thosecaredforinhospitalbutnotadmittedandthosecaredforbyprimaryorcommunitycareservicesarenotreported.Therefore,theactualrateofattemptedsuicideislikelytobemuchhigherthanthatreportedinofficialstatistics.
Comparabilityovertimeisaffectedbyachangeinthepopulationconceptin1991(fromdefactotoresident),andthechangeintheethnicityclassificationin1995.Ethnic-specificmortalitydataisalsosubjecttosomeuncertaintyduetothedifferencesincollectionacrossdifferentproviders.
Acomparisonofinternationaltrendsinsuicideisproblematicduetothedifferencesinthemethodsusedtoclassifysuicide.TheNewZealandage-standardisedrateintheinternationalcomparisondatahasbeencalculatedinamannerconsistentwith
�4� TH E SOCIA L R E PO RT 2006 TH E SOCIA L R E PO RT 2006 �4�
theinternationalfiguresavailable,andmaydifferslightlyfromtheratespresentedelsewhere(MinistryofHealth,2006,p13).
Data sources: Ministry of Health, New Zealand Health Information Service (unpublished tables); Ministry of Health (2006) Suicide Facts: Provisional 2003 Statistics (all ages). Beautrais (2000) Restricting Access to Means of Suicide in New Zealand: A Report Prepared for the Ministry of Health on Methods of Suicide in New Zealand. World Health Organisation (2004).
H4 Cigarette sMoKing
Definition/formulae:Theproportionofthepopulationaged15yearsandoverwhoeversmokeanyready-madecigarettesorroll-your-owntobaccocigarettes.InformationonsmokingprevalencewascollectedfromquarterlysurveysconductedbyACNielsenLtdandreportedbytheMinistryofHealth.
Ethnicratesareage-standardisedusingtheWHOworldpopulation.
Limitations of data:Theinternationalcomparisonisaffectedbydifferencesinthecollectionandclassificationofthedata.Theclassificationofethnicityinformationchangedfrom1997onwards.Therefore,ethnic-specificdatabeforeandafter1997maynotbecomparable.
The2004datawascollectedfrompeopleaged18yearsandover.
Data sources: Ministry of Health (2005) Tobacco Facts 2005. OECD (2005c) OECD Health Data 2005, Frequently requested data: Tobacco consumption: % of daily smokers among adult population.
H5 oBesitY
Definition/formulae:Obesityisdefinedastheaccumulationofexcessbodyfattotheextentthathealthisadverselyaffected(WHO2000).ItismeasuredusingaBodyMassIndex(BMI)whichiscalculatedbydividingweight(inkilograms)byheight(inmetres)squared.AdultswithaBMIgreaterthan30kg/m2areclassifiedasobese.Inthe1997NationalNutritionSurveyandthe2002/2003NewZealandHealthSurvey,thecut-offforMäoriandPacificpeopleswassetslightlyhigher,at32kg/m2.Forchildren,themeasureistheproportionof5–14yearoldswhoseBMI(weight/height2)meetstheinternationaldefinitionofobesityestablishedbyColeetal(2000).Thedefinitionadaptsthewidelyusedcut-offpointforadults(30kg/m2)toproduceage-andsex-specificcut-offsforchildrenandyouthaged2–18years.
Informationonobesityisbasedonthe2002/2003NewZealandHealthSurvey,the1997NationalNutritionsurvey,the2002NationalChildren’sNutritionSurvey,the1989/1990LifeinNewZealand(LINZ)Study,andthe1977NationalDietSurvey.Althoughtherewassomevariationinsurveydesignandresponserates,aswellasinheightandweightmeasurementmethods,thesesurveysareconsideredtobereasonablycomparable.
Limitations of data:Thecut-offlevelisarbitraryanddoesnotnecessarilycorrespondtolevelsofhealthrisk.Thereissomedebateaboutwhetheraseparatecut-offforMäoriandPacificpeoplesiswarranted.The1989/1990dataforMäorishouldbeviewedwithcautionasthenumberofMäoriinthesurveywassmall.
Data sources: Ministry of Health (2004a) A Portrait of Health: Key Results of the 2002/2003 New Zealand Health Survey; Ministry of Health (2004b) Tracking the Obesity Epidemic: New Zealand 1977–2003; Ministry of Health (2002) An Indication of New Zealanders’ Health; Ministry of Health (1999b) NZ Food: NZ People; Ministry of Health (2003c) NZ Food, NZ Children: Key results of the 2002 National Children’s Nutrition Survey. OECD (2005c) OECD Health Data 2005, Frequently requested data: Obesity.
�4� TH E SOCIA L R E PO RT 2006 TH E SOCIA L R E PO RT 2006 �4�
Knowledge and Skills
K1 PartiCiPation in earlY Childhood eduCation
Definition/formulae:Thenumberofchildrenaged3and4yearsenrolledinearlychildhoodeducation(ECE)programmesasaproportionoftheestimatedpopulationaged3and4years.ECEprogrammesinclude:licensedECEservices(kindergartens,playcentres,educationandcareservices,home-basedservices,casualeducationandcare(noregularroll),correspondenceschoolandteköhangareo);licence-exemptECEservices(earlychildhooddevelopmentfundedplaygroups,Pacificpeoplesearlychildhoodgroups,andplaycentres);andlicence-exemptköhangareo.
Limitations of data:Ratesofparticipationareonly“apparent”becausechildrenmaybeenrolledinmorethanoneECEcentre.Theratesmaythereforebeinflated.Themeasuredoesnotprovideinformationonthelengthofparticipationoronthequalityoftheprogrammes,bothofwhicharerelevanttopositiveeducationaloutcomes.
Data sources: Ministry of Education, Early Childhood Education Statistics, Participation in early childhood education, http://educationcounts.edcentre.govt.nz/datacube/engagement/dsau11.html; Prior participation in early childhood education: new entrants, http://educationcounts.edcentre.govt.nz/indicators/engagement/dsau16.html; Ministry of Education (various years) Education Statistics of New Zealand, Education Statistics News Sheet, v 10, no 1, March 2001; unpublished tables.
K2 sChool leavers with higher QualiFiCations
Definition/formulae:ThenumberofstudentsleavingschoolwithqualificationshigherthanNationalCertificateofEducationalAttainment(NCEA)Level1,asaproportionofthetotalnumberofschoolleaversduringtheyear.Before2004,thesequalificationsincludedSixthFormCertificate,HigherSchoolCertificate,EntranceQualificationandUniversityBursary.From2004,theequivalentqualificationsare:30ormorecreditsatNCEALevel2,NCEALevel2,30ormorecreditsatNCEALevel3,andNCEALevel3orhigher.
Note: Thedefinitionofthisindicatorwaschangedinthe2005editionofthisreporttoreflecttheintroductionoftheNationalCertificateofEducationalAttainmentin2002.In2003,SixthFormCertificatewasbeingphasedoutandwasofferedforthelasttimein2004.
Limitations of data:Policychangesrelatingtoqualificationsaffectcomparabilityovertime.Afulldescriptionofchangestoqualificationsovertheperiod1970–2001isavailableatthiswebpage:http://www.nzqa.govt.nz/qualifications/ssq/changes.html
From2002,theschoolleaverdatacollectionwaschangedasaresultoftheintroductionofNCEAin2002.Schoolleaverdataisnowbasedontheconceptofachievement,wherestudentsarerequiredbothtoparticipateandtoachievecreditsinordertobecountedashavingaqualification.Before2002,schoolleaverdatawasbasedontheconceptofparticipation.Forexample,ifastudentsatSchoolCertificate,theyweredeemedtohaveSchoolCertificateregardlessoftheirgrade.Thischangemeansthereisdiscontinuitywiththedataforearlieryears.
Theavailabledataonschoolleavers’highestqualificationsdoesnotallowabreakdownbythenumberofsubjectspassedorthegradesachieved.
Data source: Ministry of Education (various years) Education Statistics of New Zealand; Ministry of Education website, http://www.minedu.govt.nz: School Leaver Statistics; 2004 data from http://educationcounts.edcentre.govt.nz/statistics/schooling/hp-school-leavers.html
��0 TH E SOCIA L R E PO RT 2006 TH E SOCIA L R E PO RT 2006 ���
K3 PartiCiPation in tertiarY eduCation
Definition/formulae:Participationintertiaryeducationiscalculatedby:thenumberofstudentsaged15yearsandoverenrolledwithatertiaryeducationprovider(seebelow)at31Julyinformalqualifications(orprogrammesofstudy)ofgreaterthan0.03EquivalentFull-timeTertiaryStudy(EFTS).Thedataexcludesallnon-formallearning,on-jobindustrytrainingandprivatetrainingestablishmentswhichneitherreceivedtuitionsubsidiesnorwereapprovedforstudentloansandallowances.
ModernApprenticeshipstudentswhoarestudyingcoursesthatfitintotheabovedefinitionareincludedinthestatistics(typically,doingblockcoursesatapolytechnic).Iftheirlearningistotallyonthejobtheywillnotbeincluded.
Communityeducationcoursesareexcludedfromthestatistics.
Publictertiaryeducationinstitutionsinclude:universities,polytechnics,collegesofeducation,andwänanga.Privatetertiaryeducationconsistsof:privateprovidersreceivingatuitionsubsidy,privateproviderswithqualificationsapprovedforloansandallowances,privateprovidersreceivingaMinistryofEducationgrant,andotherprivateprovidersregisteredwiththeNewZealandQualificationsAuthority.
TheMäoriandnon-Mäoritotaltertiaryparticipationratesinthissectionhavebeenage-standardisedtotheestimatedtotalresidentpopulationaged15yearsandover,asat30June2005.
Limitations of data:Changesinthenumberofinstitutions,thestatusofinstitutions,andthetypesofcoursesofferedaffectcomparisonsovertime.
Data sources: Ministry of Education website, http://www.minedu.govt.nz: Tertiary Statistics; Ministry of Education (2002a) Participation in Tertiary Education, August 2002; Education Statistics of New Zealand for 2001; 2005 data supplied by Ministry of Education. OECD (2005a) Education at a Glance 2005, Table C1.2.
K4 eduCational attainMent oF the adult PoPulation
Definition/formulae:Theproportionofadultsaged25–64yearswitheducationalattainmentofatleastuppersecondaryschoollevel,definedintheInternationalStandardClassificationofEducation(ISCED97)asLevel3andabove.
ISCED 3 includes:localpolytechniccertificateordiploma,tradecertificateoradvancedtradecertificate,UniversityBursary,Scholarship,HigherSchoolCertificate,SixthFormCertificate,UniversityEntranceinoneormoresubjects,SchoolCertificateinoneormoresubjects,otherschoolqualification.
ISCED 4 includes:technician’scertificate,NewZealandcertificateordiploma.
ISCED 5B includes:universitycertificateordiploma,teacher’scertificateordiploma,nursingcertificateordiploma,othertertiaryqualification.
ISCED 5A/6 includes:post-graduatedegree,certificateordiploma,bachelor’sdegree.
Limitations of data:TherearesubstantialdifferencesinthetypicaldurationofISCED3programmesbetweencountries,rangingfromtwotofiveyearsofsecondaryschooling.
Statisticalweightsusedtoratesampledatauptopopulationestimatesareupdatedeveryfiveyearsfollowingeachpopulationcensus,requiringarevisionofhistoricaldata.Inmid-2004,theHouseholdLabourForceSurveywasrevisedbacktothestartofthesurvey(March1986).Asaresult,somefigurespublishedinthisreportmaynotmatchfigurespublishedinearliereditionsofthesocialreport.
Data sources: Statistics New Zealand, Household Labour Force Survey. OECD (2005a) Education at a Glance 2005, Tables A1.2a, A1.3a, http://dx.doi.org/10.1787/684518581842
��0 TH E SOCIA L R E PO RT 2006 TH E SOCIA L R E PO RT 2006 ���
K5 adult literaCY sKills in english
Definition/formulae:RespondentsintheInternationalAdultLiteracySurveywereaskedtocarryoutvariouseverydaytasks.“Proseliteracy”referstotheknowledgeandskillsrequiredtouseinformationfromtexts,suchaseditorials,newsstories,poemsandfiction;“documentliteracy”referstotheknowledgeandskillsrequiredtolocateanduseinformationcontainedinvariousformatssuchasjobapplications,payrollforms,transportationtimetables,maps,tablesandgraphics;and“quantitativeliteracy”referstotheknowledgeandskillsrequiredtoapplyarithmeticoperationssuchasbalancingachequebook,completinganorderformordeterminingtheamountofinterestonaloan.Theachievementattainedoneachoftheliteracydomainsisgroupedintooneoffive“skilllevels”.Level1representsthelowestabilityrangeandlevel5thehighest.Level3isconsideredasuitableminimumforcopingwiththedemandsofeverydaylifeandworkinacomplex,advancedsociety.Itdenotesroughlytheskilllevelrequiredforsuccessfulsecondaryschoolcompletionanduniversityentry.Likehigherlevels,itrequirestheabilitytointegrateseveralsourcesofinformationandsolvemorecomplexproblems.
Limitations of data:Thefirstinternationaladultliteracysurveywasconductedin1994/1995;theNewZealandsurveytookplacein1996.
Data sources: Ministry of Education (2001b) More than Words: The New Zealand Adult Literacy Strategy. OECD (2000) Literacy in the Information Age: Final Report of the Adult Literacy Survey, p 137.
Paid Work
PW1 uneMPloYMent
Definition/formulae:Theproportionofthelabourforce(aged15yearsandover)thatisunemployed.Thelabourforceisthesumofthosedefinedasemployedandthosedefinedasunemployed.Hencetheunemploymentrateisdefinedasunemployed/(employedandunemployed).TheunemployedaredefinedintheHouseholdLabourForceSurveyasthosewhoarewithoutapaidjob(orunpaidworkinarelative’sbusiness)andwhohaveactivelysoughtworkinthefourweeksbeforethesurveyandwhoareavailabletotakework.“Activelyseeking”includesanyactionssuchascontactinganemployer,askingfriendsandrelativesandcontactinganemploymentagencyorWorkandIncomebutexcludesthosewhohaveonlycheckednewspaperadvertisements.
Standardisedunemploymentratesusedforinternationalcomparisonareseasonally-adjustedrates.
Limitations of data:Dataisbasedonasamplesurveyandisthereforesubjecttosamplingerror.Thedefinitionoftheunemployedexcludessomepeoplewhoregardthemselvesasunemployed,includingthe“discouragedunemployed”–thosenotmeetingthe“activelyseekingwork”criterion.Thisgroupisclassifiedinthe“notinthelabourforce”category.Theunemploymentratealsoexcludesthosewhohavepart-timeemploymentbutwhoareseekingtoworkmorehours.
Data sources: Statistics New Zealand (2006d), Household Labour Force Survey. The Household Labour Force Survey figures were rebased using the latest census information in the June 2004 quarter. The data for all quarters was revised and therefore there may be some differences between the numbers in this report and those published in earlier editions. OECD (2005b) OECD Employment Outlook, 2005, Statistical Annex, Table A p 237, Table G p 258; OECD (2006b) Main Economic Indicators, May 2006, p 17: Standardised Unemployment Rates.
��2 TH E SOCIA L R E PO RT 2006 TH E SOCIA L R E PO RT 2006 ���
PW2 eMPloYMent
Definition/formulae:Theproportionofthepopulationaged15–64yearsemployedforatleastonehourperweek.Theemployedarethosewhoworkedforpayorprofitforonehourormoreintheweekbeforethesurveyorwhoworkedunpaidinarelative’sbusinessorwhohaveajobbutdidnotworkthatweekbecauseofleave,sicknessorindustrialdisputes.Thedefinitionusedhererelatestothepopulationaged15–64years,ratherthantothoseaged15yearsandover;otherwiseresultsareskewedbydifferencesintheproportionsofthesub-populationsover65years,particularlywhencomparingmaleswithfemalesandcomparingdifferentethnicgroups.
Limitations of data:Asabove,dataissubjecttosamplingerror.Thedefinitionofemploymentincludesthoseworkingonehourormoreperweek,sothiswillincludesomepeoplewhoarelikelytoregardtheirstatusasclosertounemploymentthantoemployment.Forexample,peopleontheunemploymentbenefitandsearchingforworkbutworkingafewhoursaweekwillbecountedasemployed.
Data sources: Statistics New Zealand (2006d), Household Labour Force Survey. The Household Labour Force Survey figures were rebased using the latest census information in the June 2004 quarter. The data for all quarters was revised and therefore there may be some differences between the numbers in this report and those published in earlier editions. OECD (2005b) OECD Employment Outlook, 2005, Statistical Annex, Table B pp 238–240.
PW3 Median hourlY earnings
Definition/formulae:MedianhourlyearningsforemployeesearningincomefromwageandsalaryjobsasmeasuredbytheNewZealandIncomeSurvey,anannualsupplementtotheHouseholdLabourForceSurvey.
Limitations of data:Thefinaldatasetconsistsofapproximately28,000validpersonrecordsincluding4,000imputedpersonrecords.Hourlyearningsrelatetothenumberofhoursusuallyworkedandtheusualincomeratherthanthenumberofhoursactuallyworkedandtheactualincome.Proxyinterviewingmaybeusedtocollectdataonincomeundercertaincircumstances.Estimatesfromsamplesurveysaresubjecttoerror.
Data sources: Statistics New Zealand (2006g), New Zealand Income Survey, Hot Off the Press, June 1997 to June 2004 (revised), June 2004, June 2005, Table 10, and unpublished data derived by the Ministry of Social Development.
PW4 worKPlaCe inJurY ClaiMs
Definition/formulae:Thenumberofwork-relatedaccidentclaimsreportedtotheACCper1,000full-timeequivalentemployees(onepart-timeemployee=0.5full-timeemployee).
Full-timeequivalentemployeedataisasestimatedbyStatisticsNewZealand’sHouseholdLabourForceSurvey.
Limitations of data:ThedatadoesnotincludeworkplaceaccidentswherenoclaimwasmadetoACC.Insomecases,therearealsodelaysbetweenwhentheaccidenthappenedandtheclaimbeingreportedtotheACC.Forexample,therewere240,500injuriesreportedforthe2003calendaryearbyMarch2004,and246,600byMarch2005,anincreaseof3percent.
Informationonworkplaceinjuriesfor2004isbasedonanewsetofindicatorsdevelopedbyStatisticsNewZealand.Comparablefiguresareavailablefor2001–2003butinformationfromtheseyearsisnotdirectlycomparablewithpreviousfiguresonworkplaceinjuries.Thedatafor2003wasrevisedbyStatisticsNewZealandin2005.
Data sources: Statistics New Zealand (2005a) Injury Statistics – Work-related claims, 2004, Information Release.
PW5 satisFaCtion with worK-liFe BalanCe
Definition/formulae:Theproportionofemployedpeoplewhoare“satisfied”or“verysatisfied”withtheirwork-lifebalanceaccordingtotheQuality of Life in New Zealand’s Largest Cities Survey 2004.
Limitations of data:Subjectivemeasuresofwellbeingreflectpeople’sperceptionsoftheirownsituation,whichmaydifferfromtheirobjectivestatus.Thesurveyhadalowresponserate(22percent)whichmeanscareshouldbetakenininterpretingthedata.
Note:EthnicityisbasedonmultipleresponsesandissourcedfromunpublishedtablesproducedbytheMinistryofSocialDevelopment.
Data source: Auckland City Council et al (2005) Quality of Life in New Zealand’s Largest Cities. The survey was commissioned by 12 of New Zealand’s cities and districts, in partnership with the Ministry of Social Development, to monitor trends in wellbeing. The total (national) sample size in the 2004 survey was 7,800, which has a maximum margin of error of +/- 1.1 percent at the 95 percent confidence interval. Interviews were conducted to meet gender, ethnicity, age and ward/region quotas to ensure the sample was representative of the New Zealand population as a whole.
��2 TH E SOCIA L R E PO RT 2006 TH E SOCIA L R E PO RT 2006 ���
Economic Standard of Living
EC1 MarKet inCoMe Per Person
Definition/formulae:RealGrossNationalDisposableIncome(RGNDI)measurestherealpurchasingpowerofthenetincomeofNewZealandresidentsfrombothdomesticandoverseassourcesaftertakingaccountofincomeresultingfrominternationaltransfers.GNDIisGrossNationalIncome(GNI),previouslycalledGrossNationalProduct(GNP),plusnetinternationaltransfers.RealGrossDomesticProduct(GDP)perperson(asusedintheOECDcomparisons)isrealincomeproducedinsidetheNewZealandnationalboundary,excludingtheinternationaltransfersincludedinGNDI.
Derivation of RGNDI:Inthepublishedtables,RGNDIiscalculatedasfollows:constantpricegrossdomesticproduct(production-basedmeasure)plusconstantpricetradinggain/lossplusconstantpricetotalnetincomeandtransfers.Constantpricetradinggain/lossisdefinedascurrentpriceexportsdividedbytheimportsimplicitpriceindexlessconstantpriceexports.Constantpricetotalnetincomeandtransfersequalsinvestmentincomecreditslessinvestmentincomedebitsplustransferscreditslesstransfersdebits,alldividedbytheimportsimplicitpriceindex.
Limitations of data:MajorlimitationstotheuseofRGNDIasanindicatorofwellbeingincludeitsfailuretoincludenon-marketed(and,therefore,non-priced)activities(barringtheexceptionofimputedrentalsonowner-occupieddwellings).RGNDIprovidesnoinformationonincomedistribution.Finally,evidencesuggestsmonetarymeasureshaveaveryweakcross-sectionalandlimitedtimeseriescorrelationwithself-assessedmeasuresofwellbeing.
Note: TheuseofrealGDPforOECDcomparisonsmayover-stateNewZealand’srelativepositionbecauseofNewZealand’sgrowingandhighpercapitanetexternaldebt.
Data sources: Statistics New Zealand, Real GNDI per capita, INFOS series SNCA.S6RB06NZ; Statistics New Zealand (2001c) Measuring Unpaid Work in New Zealand 1999 Table 1 p 15, Table 4 p 17. OECD (2006a) Annual National Accounts, Main Aggregates, Volume 1, 1993–2004, Comparative Tables B based on PPPs.
EC2 inCoMe ineQualitY
Definition/formulae:Theratioofthe80thpercentileofequivaliseddisposablehouseholdincometothe20thpercentileofequivaliseddisposablehouseholdincome.Thisindicatortakesintoaccounthouseholdsizeandcomposition.Forinternationalcomparisons,wehavecomparedGINIco-efficients.
Adjustmentforfamilysizewasmadebymeansofapercapitaequivalisationprocessbasedonthe1988RevisedJensenEquivalenceScale.
Limitations of data:Internationalcomparisonshavebeenmadewithdatafromyearsaround2000.
Data sources: Household Economic Survey. Access to the data used in this study was provided by Statistics New Zealand under conditions designed to give effect to the confidentiality provisions of the Statistics Act 1975. The results presented in this study are the work of the Ministry of Social Policy/Ministry of Social Development. Forster M and d’Ercole M M (2005) Income Distribution and Poverty in OECD Countries in the Second Half of the 1990s, OECD Social, Employment and Migration Working Papers No 22.
��4 TH E SOCIA L R E PO RT 2006 TH E SOCIA L R E PO RT 2006 ���
EC3 PoPulation with low inCoMes
Definition/formulae: Themeasureshavebeenconstructedusingeconomicfamilyunitsasthebaseunitofanalysis.Aneconomicfamilyisoperationallydefinedas:
• financiallyindependentsingleadult(notmarriednorlivingasmarried,notcaringfordependentchildren)
• sole-parentfamily–iefinanciallyindependentsingleadult(notmarriednorlivingasmarried)caringforoneormoredependentchildren
• couple(marriedorlivingasmarried,notcaringfordependentchildren)
• two-parentfamily–iecouple(marriedorlivingasmarried)caringforoneormoredependentchildren.
Allyoungadultsareconsideredfinanciallyindependentat18yearsofage;16and17yearoldsarealsoconsideredfinanciallyindependentiftheyarereceivingabenefitintheirownrightoriftheyareemployedfor30hoursormoreperweek.
Conceptually,aneconomicfamilyisagroupofco-residentpeoplewhosefinancialaffairsarecommonorhavebeenmergedtotheextentthepeoplearesubstantiallyinterdependent(withanindividualnotpartofsuchagroupbeingconsideredtoconstituteaneconomicfamilyinitsminimalform).
Housingcostshavebeenapportionedtoeconomicfamilyunits.Accountwastakenofthehousingcostsoftheeconomicfamilyunitbysubtractingitshousingcostfromitsafter-taxincome.Theresultingamountswereinflation-adjustedusingtheConsumersPriceIndex(CPI)forallgroups,excludinghousing.
Theadjustmentforfamilysizewasmadebymeansofapercapitaequivalisationprocessbasedonthe1988RevisedJensenEquivalenceScale.Theresultingamount–Housing-adjustedEquivalisedDisposableIncome(HEDY)–canberegardedasanincome-basedproxymeasureofstandardofliving.TheHEDYisthemetriconwhichthelowthresholdsarespecified.
Changesfrom1988to2004havebeentrackedintermsoftheproportionofeconomicfamilieswithHEDYvaluesbelow40percent,50percentand60percentofthemedianHEDYin1998.Thisdefinitionmeansthemeasuresarebasedonconstant-valuebenchmarks.Thethreemeasuresarereferredtoasthe40percentline,the50percentline
andthe60percentline.Forthepurposeofthisanalysis,theself-employedhavebeenincluded.
Note:Whiletechnicalanalysisdonetodateindicatesthemeasurementapproachiswell-groundedandrobust,futureworkmaypointtotheuseofotherthresholdsasmoreinformativeforsocialmonitoring.
ThemethodologyusedtocalculatethefiguresusedintheinternationalcomparisonsectionfollowsthatusedbytheOECD:theincomeconceptisequivalisedhouseholddisposableincome;theequivalencescaleisthesquarerootscale(ieequivalencescaleelasticity=0.5);equivalenthouseholdincomeisattributedtoallindividualsinthehousehold;individualsarerankedbytheirattributedequivalentdisposableincometogetthemedianforthatyear;thethresholdsaresetat60percentofthis(contemporary)median.
Limitations of data:TheHEDYmetricisanimperfectindicatoroflivingstandards,whichareinfluencedbyfactorsotherthanincomeandhousingcost.Peoplewiththesameincomelevelcanhavegreatlydifferentstandardsoflivingasaresultoftheirlifecyclestage(youth,middleage,olderpeople),theirownershipofassets,theextenttowhichtheyreceiveassistancefromothers,andtheextenttowhichtheyhaveatypicalexpenditurecommitments(egunusuallyhighmedicalcosts,debtrepayments,transportcostsandelectricitycosts).Peoplewhoexperiencealengthyperiodofsubstantialrestrictionarelikelytohavedifferentlifeoutcomestothosewhoexperienceonlyatransientepisode.
Familyethnicityisdefinedinthisindicatorbythepresenceofanadultofaparticularethnicgroup.Thefiguresforfamiliesdefinedinthiswayarenotmutuallyexclusive.
Housingcostsisthesumofannualisedaccommodationexpenditurecodes(includesmortgagepayments(principalandinterest),paymentstolocalauthorities,propertyrent,rentofaprivatedwelling,boardinghouse,studentaccommodationnotpaidwithformalfees).InthisindicatortheAccommodationSupplementiscountedasincome.
Note:TheweightingsusedfortheHouseholdEconomicSurveywererevisedforallyearsin2001.Somefiguresinthe2003and2004editionsofthisreportmaythereforedifferfromthosepresentedinThe Social Report 2001.
��4 TH E SOCIA L R E PO RT 2006 TH E SOCIA L R E PO RT 2006 ���
In2005,itwasdiscoveredthemethodusedpreviouslytoconverthouseholdaccommodationcoststoeconomicfamilyhousingcostsattributedhighercoststodependentchildrenaged15–17yearsthanshouldhavebeenthecase.Theeffectofthiswastoartificiallydepresstheafter-housing-costincomeforsomefamilyunitswithdependentchildreninthisagerange.Thishadtheflow-oneffectofslightlyraisingthenumberofeconomicfamilyunitsthatappearedtohaveafter-housing-costincomesbelowtheHEDYlow-incomethreshold.Therevisionthathasbeenappliedremovesthisdistortionandslightlyreducesthenumbersofeconomicfamilyunitsfallingbelowthethresholdasaresult.
Data sources: Derived from the Household Economic Survey by the Ministry of Social Policy/Ministry of Social Development. Forster M and d’Ercole M M (2005) Income Distribution and Poverty in OECD Countries in the Second Half of the 1990s, OECD Social, Employment and Migration Working Papers No 22.
EC4 PoPulation with low living standards
Definition/formulae:TheEconomicLivingStandardIndex(ELSI)isadirectmeasureofmaterialstandardofliving.Itisbasedoninformationontheextenttowhichrespondentseconomiseonconsumptionbecauseofcost;haveownershiprestrictionsbecauseofcost;havesocialparticipationrestrictionsbecauseofcost;people’sownratingoftheirstandardofliving;andpeople’sratingoftheadequacyoftheirincomestomeetday-to-dayneeds.TheELSIscalehassevenreportinglevelsforlivingstandards:level1“severehardship”,level2“significanthardship”,level3“somehardship”,level4“fairlycomfortable”,level5“comfortable”,level6“good”,level7“verygood”.Lowerlivingstandardsencompassthebottomthreecategories(levels1–3)oftheELSIscale.
TheELSImeasureisarelativelynewtoolandthereisstillmoretobeunderstoodaboutsomeofitsproperties.Itisnotafinalproductandongoingscrutinyandanalysisareexpectedtoleadtoimprovements.
SeeEC3Populationwithlowincomesforanoperationaldefinitionof“economicfamilies”.
Familyethnicityisdefinedinthisindicatorbythepresenceofanadultofaparticularethnicgroup.Thefiguresforfamiliesdefinedinthiswayarenotmutuallyexclusive.
Limitations of data:Measuresonlymaterialwellbeingnotqualityoflifegenerally.
Data source: Ministry of Social Development 2004 and revised 2000 Standard of Living Survey, unpublished analysis results produced by the Ministry of Social Development; see also Living Standards 2004 report (Ministry of Social Development (2006)) for more detail on the topic.
��6 TH E SOCIA L R E PO RT 2006 TH E SOCIA L R E PO RT 2006 ���
EC5 housing aFFordaBilitY
Definition/formulae:Theproportionofhouseholdsandtheproportionofpeoplewithinhouseholdswithhousingcostoutgoings-to-incomeratiogreaterthan30percent.
Householdincomeshavebeenequivalisedusingthe1988RevisedJensenEquivalenceScale.
Housingcostsarethesumofannualisedaccommodationexpenditurecodes(includesmortgagepayments(principalandinterest),paymentstolocalauthorities,propertyrent,rentofaprivatedwelling,boardinghouseandstudentaccommodationnotpaidwithformalfees).InthisindicatortheAccommodationSupplementiscountedasincome.
Limitations of data:Measuresofhousingaffordabilitydonotshedlightontheissuesofhousingquality,suitabilityorsustainability,nordotheyexplainwhyaffordabilityproblemsmayexist,ortheextenttowhichinadequatehousingisoccupiedtoavoidaffordabilityproblems.Furthermore,marginally-housedfamiliesareoftenhiddenfromofficialstatisticsandthereforearenotcountedamongthosewithanaffordabilityproblem.
Householdethnicityisdefinedinthisindicatorbythepresenceofanadultofaparticularethnicgroup.Thefiguresforhouseholdsdefinedinthiswayarenotmutuallyexclusive.
Data source: Derived from the Household Economic Survey by the Ministry of Social Development.
EC6 household Crowding
Definition/formulae:TheCanadianNationalOccupancystandardsetsthebedroomrequirementsofahouseholdaccordingtothefollowingcompositionalcriteria:
• thereshouldbenomorethantwopeopleperbedroom
• parentsorcouplesshareabedroom
• childrenunderfiveyears,eitherofthesameoroftheoppositesex,mayreasonablyshareabedroom
• childrenunder18yearsofthesamesexmayreasonablyshareabedroom
• achildaged5–17yearsshouldnotshareabedroomwithoneunderfiveoftheoppositesex
• singleadults18yearsandoverandanyunpairedchildrenrequireaseparatebedroom.
Limitations of data:ThereisnocontemporaryofficialstatisticorindexofhouseholdcrowdinginNewZealand.Therearemanyframeworksormodelsusedinmanycountriesforanalysingtheincidenceofcrowding.Itisunlikelyanysinglemeasureofcrowdingcouldadequatelysummarisesuchacomplexandmulti-facetedissueascrowding.
Thereisnodefinitiveevidencecrowdingleadstonegativesocialoutcomes,butthereareassociationsbetweenlivingincrowdedcircumstancesandnegativeoutcomes.Themechanismsbywhichtheseoutcomesresultarenotclear.
TheCanadianCrowdingIndexisnotanobjectiveindexofcrowding.Theextenttowhichhouseholdmemberswillperceivethemselvesaslivingincrowdedcircumstancesisdependentonmanyfactorsincludingsocialandculturalexpectations.Furthermore,itcannotbeassumedhouseholdsrequiringoneormoreadditionalbedrooms(basedontheCanadianindex)willsuffernegativesocialoutcomes.
TheCanadianCrowdingIndexisusedhereasitisbothsensitivetohouseholdsizeandcomposition.Themeasuresetsabedroomrequirementforhouseholdsbasedonprecisecriteria.
Data sources: Statistics New Zealand (1998) New Zealand Now – Housing, pp 56–63; Statistics New Zealand, unpublished data from the 2001 Census. Ministry of Social Policy (2001) Definitions of Crowding and the Effects of Crowding on Health: A Literature Review, Research Series Report 1, p 4.
��6 TH E SOCIA L R E PO RT 2006 TH E SOCIA L R E PO RT 2006 ���
Civil and Political Rights
CP1 voter turnout
Definition/formulae:Thetotalnumberofvotescastisdividedbytheestimatednumberofpeoplewhowouldhavebeeneligibletovote(voting-agepopulation)onelectionday,andexpressedasapercentage.Tobeeligibletovote,apersonmustbeatleast18yearsoldandmeetresidentialandcertainothercriteria.
Limitations of data:Thevoting-agepopulationisbasedonpopulationestimatesthataresubjecttorevision.The1984figureisbasedontheestimateddefactopopulationaged18yearsandover,asat30June1984.
Data sources: Electoral Commission (2005) www.electionresults.govt.nz Statistics New Zealand, estimated de facto population by age. Department of Internal Affairs (2006) Local Authority Election Statistics 2004. Inter-Parliamentary Union(2006a), PARLINE Database, Last election.
CP2 rePresentation oF woMen in governMent
Definition/formulae:TheproportionofelectedMembersofParliamentandlocalgovernmentbodieswhoarewomen.
Data sources: Electoral Commission (2002) The New Zealand Electoral Compendium, 3rd edition. Department of Internal Affairs (2006) Local Authority Election Statistics 2004. Inter-Parliamentary Union (2006b) Women in National Parliaments, Situation as of 28 February 2006.
CP3 PerCeived disCriMination
Definition/formulae:Theproportionofpeopleaged18yearsandoverwhoperceivedselectedgroupsasbeingthetargetsofdiscrimination(iesubjectto“somediscrimination”or“agreatdealofdiscrimination”).
Limitations of data:Surveysonperceiveddiscriminationdonotmeasureactuallevelsofdiscriminationagainstgroups.
Themarginoferrorfora50percentfigureatthe“95percentconfidencelevel”is3.6percent.
Data source: Human Rights Commission Omnibus Results (Feb 2006).
CP4 PerCeived CorruPtion
Definition/formulae:ThedegreeofcorruptionperceivedtoexistamongNewZealandpoliticiansandpublicofficialsaccordingtosurveysofbusinesspeople,academicsandriskanalystsisusedbyTransparencyInternationaltoconstructtheCorruptionPerceptionsIndex.Corruptionisdefinedasthe“abuseofpublicofficeforprivategain”.Scoresrangefrom0(highlycorrupt)to10(highlyclean).
Theindexisbasedonathree-yearrollingaverageofpooledsurveyresults.TheCorruptionPerceptionsIndex2004wasbasedonsurveydataprovidedbetween2002and2004andwasdrawnfrom18differentpollsandsurveysfrom12independentinstitutions.TheNewZealanddatawasdrawnfromninesurveysandtheoverallscoreof9.6waswithinaconfidencerangeof9.4–9.6.
Limitations of data:TheCorruptionPerceptionsIndexscoreisasubjectivemeasure;thereisnohardempiricaldataonlevelsofcorruptionthatcanbeusedforcross-countrycomparison.Itwasnotdesignedtoprovidecomparisonsovertime,sinceeachyearthesurveysincludedintheindexvary.Theindexisarelativemeasure:NewZealand’srankingdependsnotonlyonperceptionsofcorruptioninNewZealandbutalsoonperceptionsofcorruptionintheothercountriessurveyed.Ifcomparisonswithearlieryearsaremade,theyshouldbebasedonacountry’sscore,notitsrank.
Data source: Transparency International Corruption Perceptions Index 2005.
��� TH E SOCIA L R E PO RT 2006 TH E SOCIA L R E PO RT 2006 ���
Cultural Identity
CI1 loCal Content PrograMMing on new Zealand television
Definition/formulae:ThehoursoflocalcontentbroadcastonTVOne,TV2,TV3,PrimeTelevisionandMäoriTelevisioninprime-time,expressedasapercentageofthetotalprime-timeschedule.NewZealandprogrammingincludesfirstrunsandrepeatsacrossallfivechannels.
Limitations of data:Thenumberoflocalcontenthoursbroadcastonotherfree-to-airorpaychannelsisnotincludedinthedatapresentedhere.Upuntil2002thehoursdataintableCl1.1wasmeasuredover24hours;from2003onwardsitwasmeasuredover18hours(6amtomidnight).
Data sources: NZ On Air (2006) Local Content, New Zealand Television, 2005, NZ On Air (1999) Local Content and Diversity: Television in Ten Countries, NZ On Air: Wellington.
CI2 Ma-
ori language sPeaKers
Definition/formulae:MäorilanguagespeakersasaproportionoftheMäoriethnicgroup.MäorilanguagespeakersaredefinedasthoseabletoholdaconversationabouteverydaythingsinMäori.
Limitations of data:Thedatareliesonself-reportingratherthanmeasuringtheactualleveloffluencyinthepopulation.MoredetailedinformationontheleveloffluencyamongMäorilanguagespeakersisavailablefromanationwidesurveydonein1995.Thisdataisnotdirectlycomparablewiththecensusdatabecausedifferentdefinitionswereused.
Data sources: Statistics New Zealand (2002b) New Zealand Census of Population and Dwellings: Ma-ori. Te Puni Ko-kiri (2001) Provisional results of the 2001 Survey of the Health of the Ma-ori Language.
CI3 language retention
Definition/formulae:Theproportionofpeoplewhocanspeakthe“firstlanguage”(excludingEnglish)oftheirethnicgroup,forethnicgroups(otherthanMäori)withanestablishedresidentpopulationinNewZealand,asrecordedinthe2001Census.Theabilitytospeakalanguageisdefinedasbeingabletoholdaneverydayconversationinthatlanguage.Firstlanguagereferstoanindigenouslanguageassociatedwithagivenethnicityratherthanthefirstlanguageofanindividual.
SeveralcriteriawereusedtoidentifyethnicgroupswithanestablishedresidentpopulationinNewZealand.Theseincludedtotalpopulationsize,yearssincethegroup’sarrivalinNewZealandandtheagedistributionandbirthplace(overseasandwithinNewZealand)ofgroupmembers.Thesevariablesprovideameasureoftheinfluenceoftimeandofthedemographiccharacteristicsofthegroups.Eachvariablewasappliedindependentlytoalargelistofethnicgroupsfromwhich15wereselectedunderthebroadcategoriesofPacificpeoples,AsianandEuropean.Tobeselected,agroupneededtohave:aNewZealandresidentpopulationofover2,000people;abroadagedistributiontoinvestigatetheimpactofageonlanguageretention;andsufficientnumbersborninNewZealandtomakemeaningfulcomparisonswithoverseas-bornresidents.
Limitations of data:Whileadirectlinkcanusuallybemadebetweenalanguageandanethnicgroup,thisisnotalwaysthecase.Someethnicitiesareassociatedwithseverallanguagesandonelanguagecanspanseveralethnicities.WhileEnglishisanofficiallanguageofsomegroupsselectedinthesetables,the2001CensusdoesnotdistinguishbetweendifferentvarietiesoftheEnglishlanguage.Englishhasthereforebeenexcludedasafirstlanguagewithinthesetables.Becauseboththecensusvariablesethnicgroupandlanguagespokenallowmorethanoneresponse,theremaybesomeindividualswhoappearinmorethanoneethnicgroupcategory.
Data source: Statistics New Zealand (2004a) Concerning Language.
��� TH E SOCIA L R E PO RT 2006 TH E SOCIA L R E PO RT 2006 ���
Leisure and Recreation
l1 satisFaCtion with leisure tiMe
Definition/formulae:Theproportionofpeopleaged15andoverwhoare“satisfied”or“verysatisfied”withtheirleisuretime,accordingtotheQuality of Life in New Zealand’s Largest Cities Survey 2004.
Limitations of data:FormoreinformationseePW5Satisfactionwithwork-lifebalance.
Data source: Auckland City Council et al (2005) Quality of Life in New Zealand’s Largest Cities. For more information see PW5 Satisfaction with work-life balance.
l2 PartiCiPation in sPort and aCtive leisure
Definition/formulae:Theproportionofadults(15yearsandover)whowerephysicallyactiveasdefinedbytheSport and Recreation Continuous Monitoring Survey 2005.
Beingphysicallyactivemeanspeopletookpartinatleast2.5hoursofphysicalactivityanddidfiveormoresessions(halfanhourormore)inthesevendaysbeforebeinginterviewed.Physicallyactivepeopleareeither“sufficientlyactive”or“highlyactive”.Highlyactivemeansdoingsomevigorousphysicalactivityduringtheweekinadditiontotherequirementsforbeingratedasphysicallyactive.Sufficientlyactivepeoplemeetthebasiccriteriaforbeingphysicallyactive.Theothercategoriesofphysicalactivitymeasuredinthesurveyare“sedentary”,definedasdoingnophysicalactivityperweek,and“insufficientlyactive”,definedasdoinglessthan2.5hoursperweekordoingfewerthanfivesessionsperweek.
Theregionsusedintheindicatoraredefinedasfollows:
• Auckland region includes the following councils: RodneyDistrict,NorthShoreCity,WaitakereCity,AucklandCity,ManukauCity,PapakuraDistrict,FranklinDistrict
• North includes:FarNorthDistrict,WhangareiDistrict,KaiparaDistrict,Thames-CoromandelDistrict,HaurakiDistrict,WaikatoDistrict,Matamata-PiakoDistrict,HamiltonCity,WaipaDistrict,OtorohangaDistrict,SouthWaikatoDistrict,WaitomoDistrict,TaupoDistrict,WesternBayofPlentyDistrict,TaurangaDistrict,RotoruaDistrict,WhakataneDistrict,KawerauDistrict,OpotikiDistrict,GisborneDistrict,WairoaDistrict,RuapehuDistrict
• Central includes:HastingsDistrict,NapierCity,CentralHawke’sBayDistrict,NewPlymouthDistrict,StratfordDistrict,SouthTaranakiDistrict,WanganuiDistrict,RangitikeiDistrict,ManawatuDistrict,PalmerstonNorthCity,TararuaDistrict,HorowhenuaDistrict,KapitiCoastDistrict,PoriruaCity,UpperHuttCity,LowerHuttCity,WellingtonCity,MastertonDistrict,CartertonDistrict,SouthWairarapaDistrict
• South covers:thewholeoftheSouthIsland,excludingtheChathamIslands.
Limitations of data:Thesamplingerrorsassociatedwiththecontinuousmonitoringsurveymeantheethnicitydataneedstobetreatedwithcaution.
Data source: Overcoming Obstacles to Action: Report commissioned by Sport and Recreation New Zealand giving results of Continuous Monitoring Survey (2006).
l3 PartiCiPation in Cultural and arts aCtivities
Definition/formulae:Theproportionofthepopulationaged15yearsandoverwhoexperiencedaculturalactivityasmeasuredinthe2002 Cultural Experiences Survey.Respondentswereaskedtoreportonactivitiestheyexperiencedovereithera12-monthperiod(forgoodsandservicesaccessedorexperiencedrelativelyinfrequently)orafour-weekrecallperiod(foractivitiesexperiencedonamoreregularbasis).Thesurveywasundertakenasasupplementtothe2002March-quarterHousehold Labour Force Survey.
Limitations of data:Thiswasanadhocsurvey,andisnotcomparablewiththeindicatorinThe Social Report 2001.Thefocusofthissurveywasonexperience/consumption;itdidnotincludeparticipationsuchasactingorperforming.
Data source: Statistics New Zealand (2002a) 2002 Cultural Experiences Survey.
�60 TH E SOCIA L R E PO RT 2006 TH E SOCIA L R E PO RT 2006 �6�
Physical Environment
EN1 air QualitY
Definition/formulae:ThelevelofambientconcentrationsofPM10averagedannuallyarereportedforfivemajorurbancentresinNewZealand.Theselevelsarecomparedwiththegovernment’sPM10guidelinevalueof20mg/m3(20microgramspercubicmetre)averagedannually.PM10isparticulatematterthatislessthan10micronsindiameter.
Limitations of data:Dataisreportedonlyatspecificsitesinthefivemajorcitiesandthereforedoesnotalwaysrepresentthepollutionlevelsthatwillbeexperiencedoveranentiretownorcity.Thedata,beingsolocation-specific,cannotbecomparedwithanOECDmedian.InSeptember2005,newair-qualitystandardsbasedondailyaveragePM10concentrationswereintroduced.Regionalandunitaryauthoritiesdeclared42“airsheds”whereairqualitymay,orisknownto,exceedthestandardsforPM10.Whensufficientdataisavailable,wewillreportagainstthesestandardsalso.
SomePM10monitoringmethodscanbesubjectto“volatileloss”causinganunder-estimationofPM10levels.Anydatausedinthisreportthatmaybesubjecttovolatilelosshasbeenadjustedbyregionally-determinedfactors,orgenericfactorswhereregionalfactorswerenotavailable.
Data source: Ministry for the Environment unpublished data 2006.
EN2 drinKing water QualitY
Definition/formulae:The2000DrinkingWaterStandardsforNewZealand(DWSNZ)requiresthatallwaterleavingthetreatmentplantmustbefreeofbothfaecalcoliformbacteria(includingE. coli)andCryptosporidium.Additionally,adequatemonitoringandtheuseofaregisteredlaboratoryarerequiredtodemonstratefullcompliancewiththisstandard.Theindicatoristheproportionofthetotalpopulationwhosewatersupplycomplieswiththe2000DWSNZforE. coliandCryptosporidium.
Limitations of data:Drinkingwaterratednotfullycompliantmaybetheresultoffailingoneofthetwomicrobiologicalcriteria,offailingtoadequatelydemonstratecompliancebyusinganon-registeredlaboratory,orofnoorinadequatemonitoring.
Data source: Water Information New Zealand Database May 2006.
Safety
SS1 intentional inJurY Child MortalitY
Definition/formulae:Thenumberofchildrenunder15yearsofagewhohavediedasaresultofanintentionalinjury,per100,000childrenunder15years.
(ICD-9codesE960–E969,(upto1999);ICD-10codesX85–Y09(from2001)).
Limitations of data:Becauseofthechangesintheclassificationofethnicityindeath-registrationdatasinceSeptember1995,ethnicitydatafor1996andlateryearsisnotcomparablewithdatafrombefore1996.
Data sources: Ministry of Health Mortality and Demographic Data 2002 and 2003, New Zealand Health Information Service, Tables 3, 3a, M2; Ministry of Health Mortality and Demographic Data 1996, New Zealand Health Information Service, Table 4 p 58, Table 4a p 67; Ministry of Health Mortality and Demographic Data 1997, New Zealand Health Information Service, Table 4 p 55, Table 4a p 63; Ministry of Health Mortality and Demographic Data 1998, New Zealand Health Information Service, Table 4 p 55, Table 4a p 63; Ministry of Health Mortality and Demographic Data 1999, New Zealand Health Information Service, Table 4 p 61, Table 4a p 71, Table 5a p 78. UNICEF (2003) “A League Table of Child Maltreatment Deaths in Rich Nations”, Innocenti Report Card, No 5 Table 1(a) p 4; Statistics New Zealand, mean resident population estimates for years ended December.
�60 TH E SOCIA L R E PO RT 2006 TH E SOCIA L R E PO RT 2006 �6�
SS2 CriMinal viCtiMisation
Definition/formulae:Thenumberofindividualswhohavebeenthevictimsofoneormoreincidentsofcriminaloffendingoverthe2000yearasaproportionofthepopulationaged15yearsandover,asmeasuredbythe2001 National Survey of Crime Victims.Thesurveyincludesallbehaviourreportedbytherespondentswhichfallswithinthelegaldefinitionofcriminaloffending.ThisprovidesafullerpictureofcrimeinNewZealandthanthatcollectedfrompolicerecords.
Criminalvictimisationprevalenceratesfor1995havebeenrevisedslightly.
Limitations of data:Thesurveyincludesawiderangeofbehaviourwithvaryingdegreesofseriousness,butexcludesoffencessuchasshopliftingandtaxevasionaswellasvictimlesscrimessuchasdrugabuse.Manyofthereportedbehavioursmaynotberegardedasacrimebythevictimsandtheymaynotregardtheincidentasrequiringpoliceintervention.
Differencesinthemethodofcollectionandinthequestionnairemayaffectthecomparabilityoftheresultsfromthe2001and1996surveys.
The2001surveyhadaresponserateof62percentandthe1996surveyhadaresponserateof57percent.TheresponseratesforMäoriandPacificpeoplesweremuchlower.Thedifferencesintheresponseratesbetweenthesurveys,andthelowresponseratesamongMäoriandPacificpeoples,mayhaveimpactedonboththevalidityofcomparisonsbetweenthetwosurveysandthereliabilityofthefindingsofthe2001survey,especiallywithrespecttoMäoriandPacificpeoples.
Previousstudiessuggestsexualoffendinganddomesticabusearesubstantiallyunder-reportedincriminalvictimisationsurveys.Theresults,therefore,shouldbetreatedwithsomecaution.
Data source: Morris et al (2003) New Zealand National Survey of Crime Victims 2001, Ministry of Justice, customised tables.
SS3 PerCePtions oF saFetY
Definition/formulae:Theproportionofpeoplewhoreportedtheyfeltunsafewalkingaloneintheirneighbourhoodatnight,asmeasuredbythe2001 National Survey of Crime Victims.Peoplewhosaidtheydidnotwalkaloneatnightwereaskedhowtheythoughttheywouldfeel.
Limitations of data:People’ssubjectiveperceptionsaboutsafetyarenotalwayslinkedtotheactualriskofbecomingacrimevictim.
Data source: Morris et al (2003) New Zealand National Survey of Crime Victims 2001, Ministry of Justice.
SS4 road Casualties
Definition/formulae:Numberofdeathscausedbymotorvehiclesper100,000population.Numberofinjuredpersonsresultingfrommotorvehiclecrashesasreportedtothepolice,per100,000population.Pedestriansorcyclistskilledorinjuredbymotorvehiclesareincluded.
ThedatawasdrawnfromthefollowingInternationalClassificationofDiseasescodes:
ICD-9,810–819(1996–1999);ICD-10,V01–V89(2000).
Limitations of data:Thecollectionofethnicitydatachangedduring1995forbothmortalityandhospitalisationdata.Formortalitydata,thebasisofethnicityhaschangedfromabiologicalconcepttoaconceptofself-identification;inmid-1995hospitalisationdatarecordedmultipleethnicgroups,whereaspreviouslyonlyoneethnicgroupcouldberecorded.Consequently,acomparisonof1996ethnic-specificdatawithpreviousyearsismisleading:1996isthestartofanewtimeseriesforethnic-specificdata.
BecauseofarevisionoftheInternationalClassificationofDiseases,2000ratesarenotcomparablewithratesfor1996–1999.
Data sources: Ministry of Transport; Land Transport New Zealand; New Zealand Health Information Service; New Zealand Travel Surveys; Statistics New Zealand; International Road Traffic and Accident Database (OECD), Issued September 2005. Road casualty data comes from two main sources: injury data from the Traffic Crash Reports completed by police officers who attend the fatal and injury crashes; and mortality and hospitalisation data from the New Zealand Health Information Service (NZHIS). Ethnic-specific rates of death or hospitalisation are only available from NZHIS. The New Zealand Travel Survey 1997/1998 was based on a sample of approximately 14,000 people and the survey report compared results from a similar survey conducted in 1989/1990.
�62 TH E SOCIA L R E PO RT 2006 TH E SOCIA L R E PO RT 2006 �6�
Social Connectedness
SC1 telePhone and internet aCCess in the hoMe
Definition/formulae:Theproportionofthepopulationwithtelephoneandinternetaccessinthehome,asmeasuredbythe2000and2004NewZealandLivingStandardsSurveys.
The2000surveywasintwoparts:oneof3,060peopleaged65yearsandoverandtheotherof3,682working-ageadults(18–64years).Bothsurveysinvolvedface-to-faceinterviewswithnationwiderepresentativesamples.The2004surveywasanationallyrepresentativesampleof4,989respondentsansweringonbehalfoftheireconomicfamily.
Forfurtherdetails,seenotesforEC4Populationwithlowlivingstandards.SeeEC3Populationwithlowincomesforanoperationaldefinitionof“economicfamilies”.
Familyethnicityisdefinedinthisindicatorbythepresenceofanadultofaparticularethnicgroup.Thefiguresforfamiliesdefinedinthiswayarenotmutuallyexclusive.
Data sources: Ministry of Social Development 2004 and revised 2000 Living Standard Surveys, unpublished analysis results produced by the Ministry of Social Development. International comparison: Statistics New Zealand (2005) NZ in the OECD.
SC2 regular ContaCt with FaMilY/Friends
Definition/formulae:Theproportionofthepopulationwhohadfamilyorfriendsoverforamealatleastonceamonth,asmeasuredbythe2000and2004NewZealandLivingStandardsSurveys.
The2000surveywasintwoparts:oneof3,060peopleaged65yearsandoverandtheotherof3,682working-ageadults(18–64years).Bothsurveysinvolvedface-to-faceinterviewswithnationwiderepresentativesamples.The2004surveywasanationallyrepresentativesampleof4,989respondentsansweringonbehalfoftheireconomicfamily.
Forfurtherdetails,seenotesforEC4Populationwithlowlivingstandards.SeeEC3Populationwithlowincomesforanoperationaldefinitionof“economicfamilies”.
Familyethnicityisdefinedinthisindicatorbythepresenceofanadultofaparticularethnicgroup.Thefiguresforfamiliesdefinedinthiswayarenotmutuallyexclusive.
Data source: Ministry of Social Development 2004 and revised 2000 Living Standards Surveys, unpublished analysis results produced by the Ministry of Social Development.
SC3 trust in others
Definition/formulae:Theproportionofthepopulationwhoreportpeoplecan“almostalways”or“usually”betrusted,asreportedintheQuality of Life in New Zealand’s Largest Cities Survey 2004.
Limitations of data:FormoreinformationseePW5Satisfactionwithwork-lifebalance.
Data source: Auckland City Council et al (2005) Quality of Life in New Zealand’s Largest Cities. For more information see PW5 Satisfaction with work-life balance and United Kingdom Performance and Innovation Unit (2002).
�62 TH E SOCIA L R E PO RT 2006 TH E SOCIA L R E PO RT 2006 �6�
SC4 loneliness
Definition/formulae:Theproportionofthepopulationwhoarelonely“allofthetime”,“often”,or“someofthetime”,intheQuality of Life in New Zealand’s Largest Cities Survey 2004.
Limitations of data:FormoreinformationseePW5Satisfactionwithwork-lifebalance.
Data source: Auckland City Council et al (2005) Quality of Life in New Zealand’s Largest Cities. For more information see PW5 Satisfaction with work-life balance.
SC5 ContaCt Between Young PeoPle and their Parents
Definition/formulae:Thepercentageofsecondaryschoolstudentswhoreportedin2001thatmostweekstheygotenoughtimetospendwithMumand/orDad(orsomeonewhoactsasMumand/orDad).
Limitations of data:Estimatesfromsamplesurveysaresubjecttoerror.TheachievedsamplesizefortheYouth2000surveywas9,699students,4percentofthetotal2001NewZealandsecondaryschoolroll.
Data sources: Adolescent Health Research Group (2003a) New Zealand Youth: A Profile of their Health and Wellbeing, Auckland: University of Auckland, Table on p 46; Adolescent Health Research Group (2003a) New Zealand Youth: A Profile of their Health and Wellbeing: Regional reports (2003b).
�64 TH E SOCIA L R E PO RT 2006 TH E SOCIA L R E PO RT 2006 �6�
introduCtion
1 Durie(2001)
2 RoyalCommissiononSocialPolicy(1988),volIIp472
3 Disaggregationbyethnicityisproblematic.Definitionsofethnicityareinconsistentacrossdatasourcesandchangeovertime.Thewayinwhichwepresentthedataisconstrainedbythewayinwhichithasbeencollected
4 The“BigCities”groupcomprises12majormetropolitanterritoriallocalauthorities:Auckland,Rodney,NorthShore,Waitakere,Manukau,Tauranga,Hamilton,Wellington,Porirua,Hutt,ChristchurchandDunedin.ThegroupjointlycommissionstheQuality of Life in New Zealand’s Largest Cities Surveywhichcollectscomparableinformationonsocial,economicandenvironmentaloutcomeswithineachoftheurbanareas.In2004,thesurveywasdoneinpartnershipwiththeMinistryofSocialDevelopmentandthesurveynowprovidesanationalsampleaswellascitysamples
PeoPle
5 StatisticsNewZealand(2006e)
6 StatisticsNewZealand(2005b)
7 StatisticsNewZealand(2006a)p33
8 Thesefiguresarebasedon2004-based“medium”projections(series5),assumingmediumfertility,mediummortalityandalong-termannualnetmigrationgainof10,000
9 Thesefiguresarebasedon“medium”projections(series6),assumingmediumfertility,mediummortality,mediuminter-ethnicmobilityandmediumlong-termannualnetmigrationof-2,500forMäori(from2002),500forPacificpeoples(from2002),-5,000forEuropeans(from2005)and14,000fortheAsianpopulation(from2009).Therearenoprojectionsfortheotherethnicgroups,whichtogethermadeuplessthan1percentofthepopulationin2001
10 Thefamilydatarelatestofamilieswithinhouseholds.Inofficialstatistics,afamilyisdefinedastwoormorepeoplelivinginthesamehouseholdwhocompriseeitheracouple,
withorwithoutchildren,oroneparentandtheirchildren.Thechildrendonothavepartnersorchildrenoftheirownlivinginthesamehousehold.Peoplewhoweretemporarilyawayfromhomeoncensusnightareincludedaspartofthefamily.Thereisnodataavailableonparentsandchildrenwholiveindifferenthouseholds
11 Disabilityisdefinedasanyrestrictionorlack(resultingfromimpairment)ofabilitytoperformanactivityinthemannerorwithintherangeconsiderednormalforahumanbeing.Peoplewerenotconsideredtohaveadisabilityifanassistivedevice(suchasglasses)completelyeliminatedtheirlimitation.Aconceptoftimewasalsointroducedasafilter–thelimitationmusthavelastedfor,orbeexpectedtolastfor,atleastsixmonthsormore.SeeMinistryofHealth(2004c)p55
12 MinistryofHealth(2004c)
13 Inpart,thesefiguresreflecttheolderagedistributionofpeoplewithdisabilitiesandthatolderpeopletendtobemorepoorlyqualified,andtobeonlowincomes
health
14 Howden-ChapmanandTobias(2000)
15 MinistryofHealth(1999a)p351
16 TobiasandCheung(2003)
17 OECD(2005c)
18 2002figureshavebeenrevisedandarestillprovisional;2003dataisalsoprovisional
19 Age-standardisedratesareratesthathavebeenadjustedtotakeaccountofdifferencesintheagedistributionofthepopulationsbeingcompared
20 MinistryofHealth(2006)p14
21 MinistryofHealthandWorldHealthOrganisation(2004)
22 WorldHealthOrganisation(2004)
23 MinistryofHealth(1999a)p344
24 Datafor2003isbasedonthepopulationaged18yearsandover
25 MinistryofHealth(2005)TableA2p21
26 Howden-ChapmanandTobias(2000)p54
Endnotes
�64 TH E SOCIA L R E PO RT 2006 TH E SOCIA L R E PO RT 2006 �6�
27 OECD(2005c)
28 MinistryofHealth(2003b)p16
29 Coleetal(2000)
30 MinistryofHealth(2002)p12
31 MinistryofHealth(2004b)p14
32 MinistryofHealth(2004b)p77
33 MinistryofHealth(2004b)p36
34 Itisdifficulttoestablishtrendsononlyasmallnumberofsurveyswithlimitedcomparability
35 MinistryofHealth(2004a),Figure57p88
36 OECD(2005c)
Knowledge and sKills
37 See,forexample,Wylie(1999)
38 OECD(2005a)
39 Wylie(1999)andBoocock(1995)
40 OECD(2005a)
41 TheMäoriandnon-Mäoritotaltertiaryparticipationratesinthissectionhavebeenage-standardisedtotheestimatedtotalresidentpopulationaged15yearsandover,asat30June2005
42 OECD(2005a)
43 OECD(2005a)
44 MinistryofEducation(2001b)
45 MinistryofEducation(2001b)
46 ForthepurposesofcalculatingNewZealand’sperformancerelativetotheOECDmedian,Switzerland’sscorewasexcludedasithadthreeseparateentries–French,Italian,andGerman
47 OECD(2000)
Paid worK
48 Thisincludeswagesandotherpaymentstoemployeesandentrepreneurialincome,1999StatisticsNewZealanddata,citedinDepartmentofLabour(1999)
49 Wilson(1999)
50 OECD(2006b)p17
51 OECD(2005b)p258
52 OECD(2005b)pp238–240
eConoMiC standard oF living
53 RoyalCommissiononSocialSecurityinNewZealand(1972)
54 StatisticsNewZealand(2001c)Table1p15,Table4p17.PercapitavaluecalculatedbytheMinistryofSocialDevelopment
55 ForadescriptionoftheGinico-efficient,seeStatisticsNewZealand(1999)p118
56 ForsterMandd’ErcoleMM(2005)pp61–62(withcorrectionsforNewZealandafterpublication)
57 TakenfromFigure6p22inForsterandd’Ercole(2005)usingcorrectedNewZealanddatareleasedafterthepublicationofthesourcedocument
58 Robustdataisnotavailableforlow-incomehouseholdsbyhouseholdcharacteristics(suchasethnicity)
59 Bakeretal(2000)
60 StatisticsNewZealand(2003b)p33
61 Percentagesdonotaddto100assomepeopleidentifiedwithmorethanoneethnicgroup
62 Personswhoreceivedincomesupportinthe12monthsbeforethecensus.ExcludesthosewhoreceivedACCorNewZealandSuperannuation
Civil and PolitiCal rights
63 MinistryofForeignAffairsandTrade(1998)
64 The1988RoyalCommissiononSocialPolicyfoundthatNewZealandersfeltwellbeingwasstronglyassociatedwiththeabilitytomakechoicesandtonothavechoicesimposedonthem.RoyalCommissiononSocialPolicy(1988)
65 Forexample,seethesectiononNewZealandintheUnitedStatesStateDepartmentBureauofDemocracy,HumanRightsandLabour2003CountryReportsonHumanRightsPracticeshttp://www.state.gov/g/drl/rlshrrpt/2003/27783.htm
66 HumanRightsCommission(2006)
67 MarshandSahin-Dikmen(2002)pp40–41
68 Inter-ParliamentaryUnion,PARLINEdatabase,Lastelection
69 Inter-ParliamentaryUnion,WomeninNationalParliaments
�66 TH E SOCIA L R E PO RT 2006
70 ThesefiguresexcludeLicensingandLandTrusts
Cultural identitY
71 Durieetal(2002)andDurie(1999)
72 StatisticsNewZealand(2001b)
73 ACNielsen(2005)
74 NZOnAir(1999)p3
75 AllthosewhoidentifiedasMäoriinthecensusarecountedaspartoftheMäoriethnicgroupinthisindicator
76 “Well”or“verywell”referstobeingabletotalknaturallyandconfidentlyinMäoriaboutdomesticorcommunitysubjectswithoutmakingerrors.“Fairlywell”referstobeingabletocommunicatetheirideasinMäorimostofthetimebuttheymaymakesomegrammaticalerrors.“Notverywell”referstobeingabletogivesimpleinstructionsinMäoriandmaintainbasicquestionandanswersequences
77 Thecensusquestionisatotal-responsequestionandthehighproportionofPacificpeopleswhocanspeakMäorimayreflectthehighproportionofpeoplewhoidentifiedwithbothethnicgroupsinthelastcensus.ThisisalsothecasefortheEuropeanethnicgroup
PhYsiCal environMent
78 The1988RoyalCommissiononSocialPolicyidentified“guardianshipofthephysicalresource”asamajorpartofthe“safeprospect”aspectofsocialwellbeing
79 StatisticsNewZealand(1993)p83
80 StatisticsNewZealand(1993)
saFetY
81 Morrisetal(2003)pp222–224
82 NationalResearchCouncil(1993)
83 NationalRoadSafetyCommittee(2000)
84 Morrisetal(2003)p145
85 2005injurydataisprovisional
86 LandTransportSafetyAuthority(2000)
87 InternationalRoadTrafficandAccidentDatabase(OECD),September2005
soCial ConneCtedness
88 Spellerberg(2001)
89 DonovanandHalpern(2002)p27
90 NollandBerger-Schmitt(2000)
91 OECD(2006c)
92 StatisticsCanada(2004)andEuropeanCommission(2005)
ConClusion
93 Trendsfrom1986arebasedoncensusdataforhouseholdsrequiringadditionalbedroomsaswedonothavedatafortheproportionofthepopulationrequiringadditionalbedroomsfrom1986
94 Itisdifficulttoestablishtrendsononlyasmallnumberofsurveyswithlimitedcomparability
95 Trendsfrom1986arebasedoncensusdataforhouseholdsrequiringadditionalbedroomsaswedonothavedatafortheproportionofthepopulationrequiringadditionalbedroomsfrom1986
96 Asthesefiguresarenotage-standardised,theycannotbecomparedwiththecigarettesmokingfiguresinthebodyofthereport
97 Astheethnicityclassificationchangedin1997,ethnic-specificdatabeforeandafter1997maynotbecomparable
98 Trendsfrom1986arebasedoncensusdataforhouseholdsrequiringadditionalbedroomsaswedonothavedatafortheproportionofthepopulationrequiringadditionalbedroomsfrom1986
99 Asthesefiguresarenotage-standardised,theycannotbecomparedwiththecigarettesmokingfiguresinthebodyofthereport
100 Astheethnicityclassificationchangedin1997,ethnic-specificdatabeforeandafter1997maynotbecomparable