Embed Size (px)
Citation preview
Planning and Research, Tourism Council of Bhutan |
Bhutan Tourism Monitor 2020
1
BHUTAN TOURISM MONITOR
Publication of the Tourism Council of Bhutan
2020

Bhutan Tourism Monitor 2020
| Planning and Research, Tourism Council of Bhutan2
BHUTAN TOURISM MONITOR
2020
Planning and Research ServicesTourism Council of Bhutan
Bhutan Tourism Monitor 2020
| Planning and Research, Tourism Council of Bhutan4
TABLE OF CONTENTS
FOREWORD .................................................................................................................... 7ACKNOWLEDGEMENT .................................................................................................. 8ABBREVIATION .............................................................................................................. 9DEFINITIONS .................................................................................................................... 10ABOUT US ..................................................................................................................... 12COVID-19 AND TOURISM IN BHUTAN .......................................................................... 14
CHAPTER 1 – OVERVIEW ............................................................................................ 16Introduction .................................................................................................................. 16Objectives .................................................................................................................... 16Study Design and Methodology .................................................................................. 16Sampling Frame .......................................................................................................... 17Sampling Design ......................................................................................................... 17Sample Size Determination ......................................................................................... 17Survey Limitations ....................................................................................................... 18
CHAPTER 2 – TOURISM BHUTAN TRENDS ............................................................... 19Visitor Arrivals ............................................................................................................. 19Visitor arrivals by month Trends .................................................................................. 20Visitor Arrival by Dzongkhag ....................................................................................... 21Arrival by month by Major Source markets trend ........................................................ 22Source Market Trends ................................................................................................. 23Tourism Receipts (Earnings) ....................................................................................... 24
CHAPTER 3 – 2020 TOURISM PEFORMANCE ........................................................... 25Annual visitor arrivals .................................................................................................. 25Visitor by purpose of visit ............................................................................................ 25Arrivals by purpose by mode of transport ................................................................... 26Visitor bed-nights by purpose ...................................................................................... 26Visitor by main purpose by country (nationality) ......................................................... 27
Planning and Research, Tourism Council of Bhutan |
Bhutan Tourism Monitor 2020
5
Average Length of Stay (ALOS) by month by Purpose .......................................... 28Visitor by length of stay .......................................................................................... 28Length of stay by country ....................................................................................... 29Monthly Arrivals and Monthly Bed nights by Major markets ................................... 30Visitor arrivals by Dzongkhag ................................................................................. 30Arrivals by Dzongkhag by Gender ......................................................................... 32Visitor arrival by mode of transport by global segmentation .................................. 34Visitors by activities ................................................................................................ 34Mode of transport used while in Bhutan ................................................................. 35Visitors by country by mode of travel ..................................................................... 36Visitor by main source of information ..................................................................... 37Travel companion by Country ................................................................................ 37Travel Arrangement by countries ........................................................................... 39Types of accommodation used by Dzongkhag ...................................................... 40Expenditure ........................................................................................................... 41
Expenditure summary by main purpose ............................................................. 41Average Expenditure .......................................................................................... 42Average Expenditure by Items ............................................................................ 42Total expenditure by item .................................................................................... 42Total expenditure by item .................................................................................... 43Expenditure by country ....................................................................................... 44Visitor, visitor nights and total trip expenditure ................................................... 44ALOS, average expenditure by country .............................................................. 45Package Cost ..................................................................................................... 46Mean Expenditure by Item (Expenditure in addition to package cost) ................ 46Average expenditure per person on major items for non-package ..................... 47
Demographics ........................................................................................................ 47Sex ...................................................................................................................... 47Age by country .................................................................................................... 49Average age ....................................................................................................... 50Education qualification ........................................................................................ 50
Bhutan Tourism Monitor 2020
| Planning and Research, Tourism Council of Bhutan6
Occupation ............................................................................................................... 51Repeat / Return visits .............................................................................................. 52
Destination loyalty ....................................................................................................... 54Visitor Satisfaction ....................................................................................................... 55
STATISTICAL TABLES .................................................................................................. 57Table 1: Visitors by mode of entry by Country ............................................................. 57Table 2: Visitors by mode of exit by Country ............................................................... 59Table 3: Visitors by Main purpose of visit by country .................................................. 61Table 4: Visitors by Length of stay by country ............................................................. 64Table 5: Visitors by Main source of information by country ......................................... 65Table 6: Visitor arrival by dzongkhag .......................................................................... 66Table 7: LOS of dzongkhag visited by country-International leisure tourist only ......... 67Table 8: Travel Companion by market ......................................................................... 68Table 9: Number of visits to Bhutan by country ........................................................... 68Table 10: Mean Expenditure by Item (Expenditure in addition to package cost) in USD ....................................................... 69Table 11: Average Expenditure (in US$) per Person on Major Items (Non-package tours) .................................................................................................... 70Table 12: Highest Educational Attainment by Country Market .................................... 71Table 13: Occupation by Country Market .................................................................... 71Table 14: Proportion of Respondents Who Will Recommend Trip to Bhutan by Country Market & Who are like to return Bhutan ......................................................... 72Table 15: Likely to return ............................................................................................. 73Table 16: Total trip expenditure by item in USD million .................................................. 74Table 17: Average trip expenditure by item ................................................................. 75Table 18: Total trip expenditure by item by purpose in USD million ........................... 76Table 19: Average trip expenditure by item by purpose .............................................. 77
Planning and Research, Tourism Council of Bhutan |
Bhutan Tourism Monitor 2020
7
FOREWORD
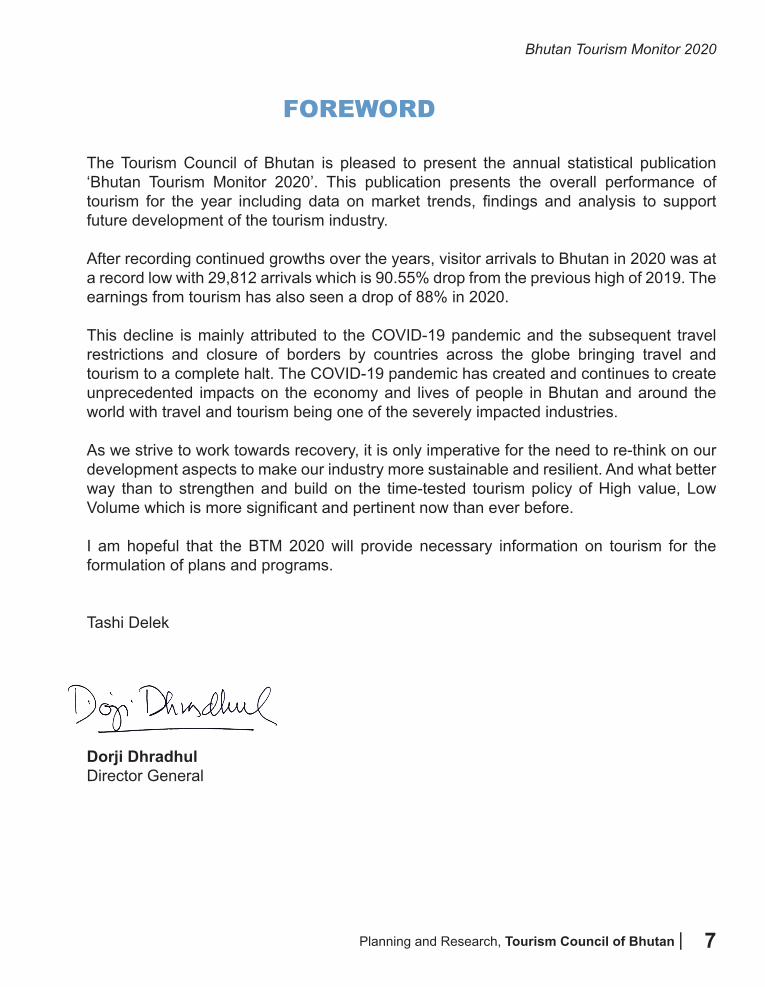
The Tourism Council of Bhutan is pleased to present the annual statistical publication ‘Bhutan Tourism Monitor 2020’. This publication presents the overall performance of tourism for the year including data on market trends, findings and analysis to support future development of the tourism industry.
After recording continued growths over the years, visitor arrivals to Bhutan in 2020 was at a record low with 29,812 arrivals which is 90.55% drop from the previous high of 2019. The earnings from tourism has also seen a drop of 88% in 2020.
This decline is mainly attributed to the COVID-19 pandemic and the subsequent travel restrictions and closure of borders by countries across the globe bringing travel and tourism to a complete halt. The COVID-19 pandemic has created and continues to create unprecedented impacts on the economy and lives of people in Bhutan and around the world with travel and tourism being one of the severely impacted industries.
As we strive to work towards recovery, it is only imperative for the need to re-think on our development aspects to make our industry more sustainable and resilient. And what better way than to strengthen and build on the time-tested tourism policy of High value, Low Volume which is more significant and pertinent now than ever before.
I am hopeful that the BTM 2020 will provide necessary information on tourism for the formulation of plans and programs.
Tashi Delek
Dorji DhradhulDirector General
Bhutan Tourism Monitor 2020
| Planning and Research, Tourism Council of Bhutan8
ACKNOWLEDGEMENT
TCB would like to thank the Enhanced Integrated Framework Trust Fund (EIF-TF) for the funding support in developing this publication and other statistical development initiatives of TCB and the Department of Trade, Ministry of Economic Affairs for their support with the E-Infrastructure for Trade and Services Development (E4T) Project.
TCB would also like to thank National Statistics Bureau for the technical support rendered for the design, operation and analysis of the VES 2020 and the Department of Immigration (DOI) for their continued support in sharing data.
Planning and Research, Tourism Council of Bhutan |
Bhutan Tourism Monitor 2020
9
ABBREVIATION
TCB Tourism Council of Bhutan
MDPR Minimum Daily Package Rate
DOI Department of Immigration
VES Visitor Exit Survey
SDF Sustainable Development Fee
ALOS Average Length of Stay
VFR Visiting Friends and Relatives
USD / US $ United States Dollars
VHS Village Home Stays
Bhutan Tourism Monitor 2020
| Planning and Research, Tourism Council of Bhutan10
DEFINITIONS
Inbound tourism: Inbound tourism comprise the activities of a non-resident visitor to the country of reference on an inbound tourism trip.
Visitor / Tourist: A visitor is a traveler taking a trip to a main destination outside his/her usual environment, for less than a year, for any main purpose (business, leisure or other personal purpose) other than to be employed by a resident entity in the country or place visited.
Non-MDPR paying / Regional visitors: Nationals of India, Bangladesh and Maldives arrivals to Bhutan for leisure, official, business and VFR.
MDPR paying / International Visitors: Nationals of all other countries (other than India, Bangladesh and Maldives) who visit Bhutan for leisure, official, business and VFR.
Leisure Arrivals: Non-resident arrivals to Bhutan for the purpose of holiday and leisure.
The leisure arrivals from MDPR paying countries pre-book their tours to Bhutan through a Bhutanese tour operator paying a Minimum Daily Package Rate (MDPR) for an all-inclusive package tour to Bhutan.
The leisure arrivals from non-MDPR paying countries (Bangladesh, India and Maldives) are levied a Sustainable Development Fee (SDF).
Business Arrivals: Non-resident arrivals to Bhutan whose main purpose for a tourism trip corresponds to the business category of purpose
Official Arrivals: Non-residents arrivals to Bhutan whose main purpose for a tourism trip corresponds to professional category of purpose
Others / VFR – Visiting Friends and Relatives: Personal guests, friends and relatives of Bhutanese and expat residents of Bhutan
Minimum Daily Package Rate (MDPR): Refers to the minimum rate paid by all leisure tourist for an all-inclusive package tour to Bhutan. This includes Sustainable Development Fee component and payment for the all-inclusive service package (accommodation, meals, guides and ground transport within Bhutan).
The current MDPR is USD 250 per person per night during the months of March, April, May,
Planning and Research, Tourism Council of Bhutan |
Bhutan Tourism Monitor 2020
11
September, October, November and USD 200 per person per night during other months of the year (December, January, February, June, July and August). For both periods the SDF is fixed at $65 per person per night.
The MDPR will not apply to countries granted exemptions by the RGOB which currently includes nationals of Bangladesh, India and Maldives. However, for this category of leisure tourist a SDF will be applied. The SDF will be determined by the RGOB based on the need to manage the pressures on our society, culture and environment.
Gross Earnings: refers to the gross convertible currency earnings from MDPR paying leisure arrivals only and includes SDF.
Sustainable Development Fee (SDF): Refers to the tourism levy on all leisure tourists per person per night and applicable throughout the year as a contribution towards sustainable development initiatives undertaken by the Government and to compensate for the negative environmental impacts associated to tourism.
Tourism Expenditure: refers to the amount paid for the acquisition of consumption goods and services, as well as valuables, for own use or to give away, for and during tourism trips. It includes expenditures by visitors themselves, as well as expenses that are paid for or reimbursed by others
Travel Group: is made up of individuals or travel parties travelling together
Bhutan Tourism Monitor 2020
| Planning and Research, Tourism Council of Bhutan12
ABOUT US
The Tourism Council of Bhutan is the apex tourism organization responsible for the development, promotion and regulation of tourism in the country.
Vision
A green, sustainable, inclusive and a high value tourism destination
Guiding Principles
i. Develop and promote forms of tourism that is consistent with our national development philosophy of Gross National Happiness.
ii. Promote High value, Low volume tourismiii. Promote tourism that does not undermine national security and does not erode our tangible and intangible cultural heritage and environment.iv. Promote inclusive and equitable growth.v. Ensure sustainable tourism development.
High value, Low volume Tourism
Targeting mindful and responsible visitors, creating good value for money experiences, high revenue and yield, quality infrastructure and tourism
products and services and Brand Bhutan.
While ensuring that the number of tourists Bhutan receives is consistent withthe absorptive carrying capacity of our natural endowment, socio-cultural values and infrastructure and does not exacerbate our vulnerabilities as a
small nation.
Planning and Research, Tourism Council of Bhutan |
Bhutan Tourism Monitor 2020
13
Mandates
1. Tourism Policy and planning2. Regulation and monitoring3. Facilitation and coordination4. Development, promotion and branding of tourism products and services5. Human resource development6. Certification and accreditation of tourism services and facilities
Connect with us
PO Box 126, GPO, Thimphu, BhutanTel: +975 2 323251 / 323252 | Fax +975 2 323695www.tourism.gov.bt | bhutan.travel
Bhutan Tourism Monitor 2020
| Planning and Research, Tourism Council of Bhutan14
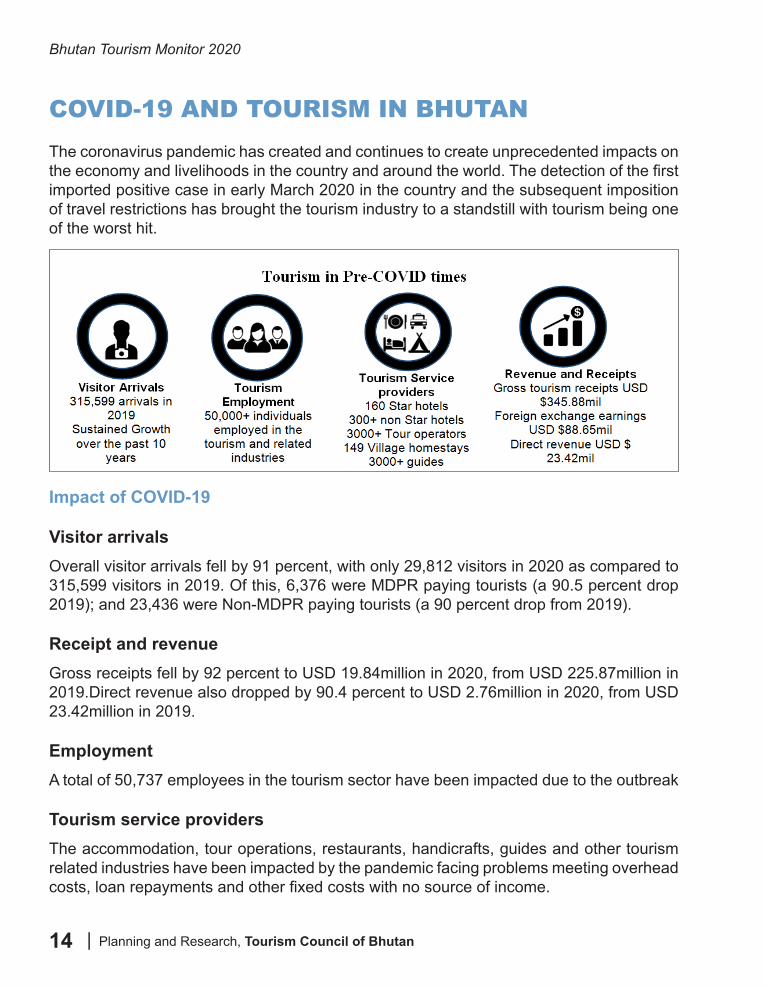
COVID-19 AND TOURISM IN BHUTANThe coronavirus pandemic has created and continues to create unprecedented impacts on the economy and livelihoods in the country and around the world. The detection of the first imported positive case in early March 2020 in the country and the subsequent imposition of travel restrictions has brought the tourism industry to a standstill with tourism being one of the worst hit.
Impact of COVID-19
Visitor arrivalsOverall visitor arrivals fell by 91 percent, with only 29,812 visitors in 2020 as compared to 315,599 visitors in 2019. Of this, 6,376 were MDPR paying tourists (a 90.5 percent drop 2019); and 23,436 were Non-MDPR paying tourists (a 90 percent drop from 2019).
Receipt and revenueGross receipts fell by 92 percent to USD 19.84million in 2020, from USD 225.87million in 2019.Direct revenue also dropped by 90.4 percent to USD 2.76million in 2020, from USD 23.42million in 2019.
EmploymentA total of 50,737 employees in the tourism sector have been impacted due to the outbreak
Tourism service providersThe accommodation, tour operations, restaurants, handicrafts, guides and other tourism related industries have been impacted by the pandemic facing problems meeting overhead costs, loan repayments and other fixed costs with no source of income.
Planning and Research, Tourism Council of Bhutan |
Bhutan Tourism Monitor 2020
15
InterventionsConsidering these unprecedented impacts, tourism was identified as one of the focus sectors for interventions. The interventions focused on addressing and mitigating the impacts of the pandemic and to work towards recovery through the implementation of programs on infrastructure and product development, training and re-skilling, survey and studies and waste management. These programs were implemented through the Economic Contingency Plan (ECP) I, ECP II and implementation of the re-prioritised Tourism Flagship Program.
Some of the major intervention areas are follows:
• Adoption of Tourism Levy Act of Bhutan 2020 and Tourism Policy of the Kingdom of Bhutan 2021.
• Rules and regulations for implementation of Tourism Levy Act of Bhutan 2020, Action plan for Tourism Policy, guidelines for reopening tourism in a safe manner, guidelines for domestic tourism management and others have been undertaken.
• Development, promotion and implementation of communication plan to maintain and promote Brand Bhutan through various local and international channels including social media, print media, television and videos.
• Digitalisation of the tourism industry has been initiated through the integration of online systems to improve transparency, efficiency and effectiveness in service delivery. The digitalisation will look into establishment of one-stop-service-center, TCB hub for system integration within and beyond TCB, enhancement of online payment system and online communication systems, among others.
• Samdrup Jongkhar and Gelephu identified as additional entry points to prepare for the reopening of the sector, and to facilitate the spread of tourists across the country. Integrated check post facilities will be set up in these locations in due course of time.
• Development of Druk Neykor connecting 108 temples in the country has been initiated. The Thimphu version comprising 16 sites (temples and neys) has been launched on December 17, 2020.
• Digitalisation of trekking routes (snowman trek) including enhancement of trek routes (for example Sinchula and Gangtey trail).
• Development of proper system of tourism statistics (BSTS) including Bhutan experimental tourism satellite account (BETSA). This includes enhancement of tourism statistics on inbound, domestic and outbound tourism (first domestic and outbound tourism survey (DOTS) conducted in 2020).
• Proposal to enhance visitor experiences post COVID-19 through diversification of tourism products such as wellness, nature, culture, and MICE has been developed.
• Training and re-skilling include training on wellness, meditation, Spa and Sowa Rigpa, hotel assessors training, cultural guides, re-skilling of handicraft craftsman, foreign language training amongst others.
Bhutan Tourism Monitor 2020
| Planning and Research, Tourism Council of Bhutan16
CHAPTER 1 – OVERVIEW
Introduction
Bhutan Tourism Monitor (BTM) is an annual statistical publication of the Tourism Council of Bhutan presenting a comprehensive analysis of the performance of the tourism industry during the calendar year. The report presents statistical insights on the visitor, first-hand feedback from the visitors and past tourism trends and analysis. TCB continuously strives to publish improved and relevant publications for its stakeholders in the travel and tourism industry and beyond to meet the data needs of these diverse groups of users.
However, the global tourism industry including tourism in Bhutan has been severely impacted by the novel coronavirus COVID-19 bringing travel and tourism to a complete standstill affecting businesses and people working in the industry. Bhutan introduced travel restrictions from 6th March 2020 after the detection of the first COVID-19 case and since then the travel restriction is in place with no visitor arrivals.
The BTM 2020 presents the data for the period covering 1st January till 6th March 2020 supplemented by the visitor exit survey administered at the entry ports during the months of January till March 2020. The report presents the detailed statistical breakdown of visitor arrivals, visitor profiles and demographics, travel patterns and interests, expenditure and tourism receipts including tourism trends, analysis and market intelligence.
Objectives
The objective of the annual statistical publication is to provide comprehensive and reliable information on the state and performance of the tourism industry for the calendar year 2020.
Study Design and Methodology
The tourism statistics in BTM 2020 is reported on a calendar year basis although the data coverage is for 1st January till 6th March 2020. There were some officials and visiting friends and relatives arrivals after 6th March 2020. The secondary data is obtained from Tashel Information Management System, a database maintained by TCB and Immigration database maintained by the Department of Immigration (DOI). The data presented in the past annual tourism monitors were also used while making trend analysis on various variables.
Planning and Research, Tourism Council of Bhutan |
Bhutan Tourism Monitor 2020
17
The primary data were collected through visitor exit survey (VES) administered at the Paro International Airport and Phuentsholing Integrated Outpost targeting all departing tourists/visitors. Primary data was collected using exit survey questionnaires comprising of both open-ended and closed-ended questions which was designed and interviewed using Computer Assisted Personal Interview (CAPI). The data cleaning, cross tabulation, table generation and data analysis were carried out in statistical software Stata SE - 15.
Sampling Frame
The sampling frame for the visitor exit survey 2020 was developed based on the 315,559 tourists who departed the country in 2019 through the two major exit points namely Paro airport by air and Phuentsholing by land.
Sampling Design
Two stage systematic cluster design was adopted for the Visitors Exit Survey of Bhutan 2020 to provide estimates on international tourists related indicators at national level. Two stages were identified for sampling wherein first stage included 12 weeks selection using systematic random sampling from week 1 up to week 52 with a sampling interval of 4 and a random start of any number from 1 to 52 to capture the seasonality in the data; and in the second stage the required numbers of tourists were selected using systematic random sampling in each sampled week.
Sample Size Determination
In order to estimate the required sample size, a criterion variable was decided upon which the estimation was based. It was decided that estimation of the required sample size be based on the mean of length of stay in the country (regional and international tourists).
The required sample size was estimated using the number of tourist arrivals in 2019 on the mean length of stay in the country.
The formula for sample size is as follow:
Bhutan Tourism Monitor 2020
| Planning and Research, Tourism Council of Bhutan18
where:
n is the parameter to be calculated and is the sample size in terms of number of tourists to be selected;z is the statistic that defines the level of confidence desired (95% confidence interval);s is the variance length of stay by visitors;f is the sample design effect, assumed to be 2.0;k is a multiplier to account for the anticipated rate of non-response; p is the proportion of the total population accounted for by the target population and upon which the parameter, r, is based (r pertains to the variable length of stay);e is the acceptable margin of error in estimating p.
Based on the above formula, the total sample size was estimated at 5,202 individuals (non-resident tourists) at the national level.
Survey Limitations
The VES 2020 covered only January till March 2020 and the statistical tables / charts and analysis relating to VES 2020 covers data collected for these months only.
Planning and Research, Tourism Council of Bhutan |
Bhutan Tourism Monitor 2020
19
CHAPTER 2 – TOURISM BHUTAN TRENDS
This chapter presents the tourism trends and analysis of key variables of tourism in Bhutan over the years.
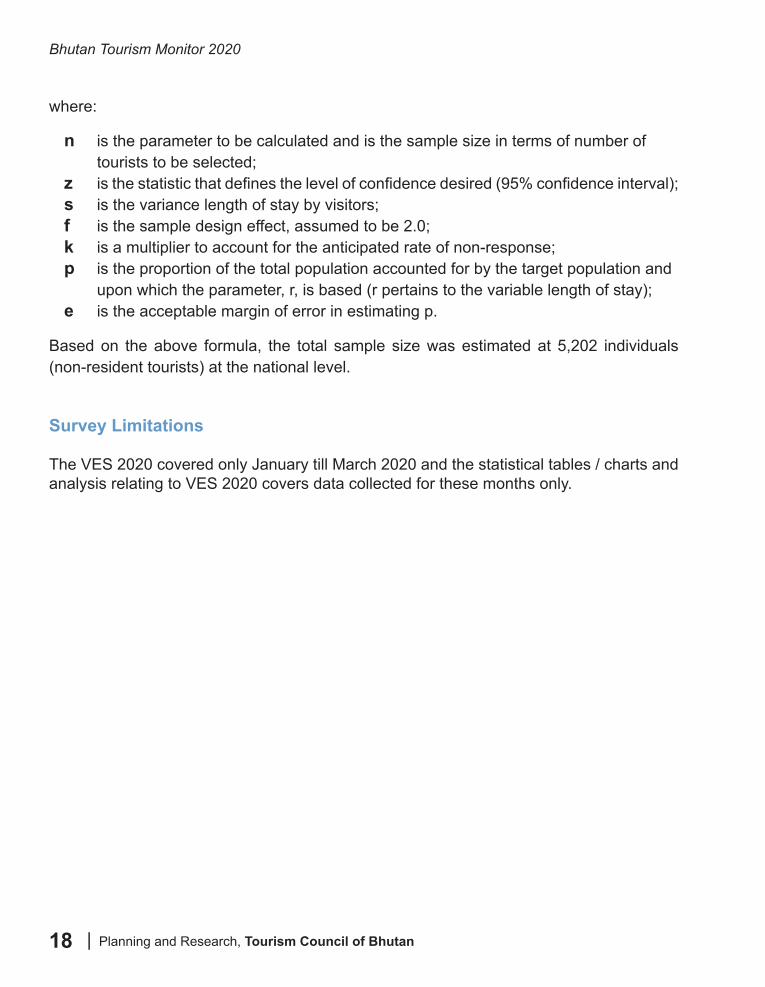
Visitor Arrivals
Bhutan recorded a total of 29,812 visitors in 2020 which is -90.55% drop compared to previous high of 315,599 in 2019 mainly on account of the coronavirus pandemic.
Year 2012 2013 2014 2015 2016 2017 2018 2019 2020Number of Visitor 105,407 116,209 133,480 155,121 209,570 254,704 274,097 315,599 29,812
% Change 10.25 14.86 16.21 35.10 21.54 7.61 15.14 -90.55
Table 2: Visitor Arrival Trends
(Source: TCB & DOI)
Bhutan Tourism Monitor 2020 -------------------------------------------------------------------------------------------------------------------------------
--------------------------------------------------------------------------------------------------------------------- Planning and Research, Tourism Council of Bhutan 14
CHAPTER 2 – TOURISM BHUTAN TRENDS This chapter presents the tourism trends and analysis of key variables of tourism in Bhutan over the years. Visitor Arrivals
Chart 1: Visitor Arrival Growth Trends
(Source: TCB & DOI)
Table 2: Visitor Arrival Trends
Year 2012 2013 2014 2015 2016 2017 2018 2019 2020 Number of Visitor
105,407 116,209 133,480 155,121 209,570 254,704 274,097 315,599 29,812
% Change 10.25 14.86 16.21 35.10 21.54 7.61 15.14 -90.55 (Source: TCB & DOI)
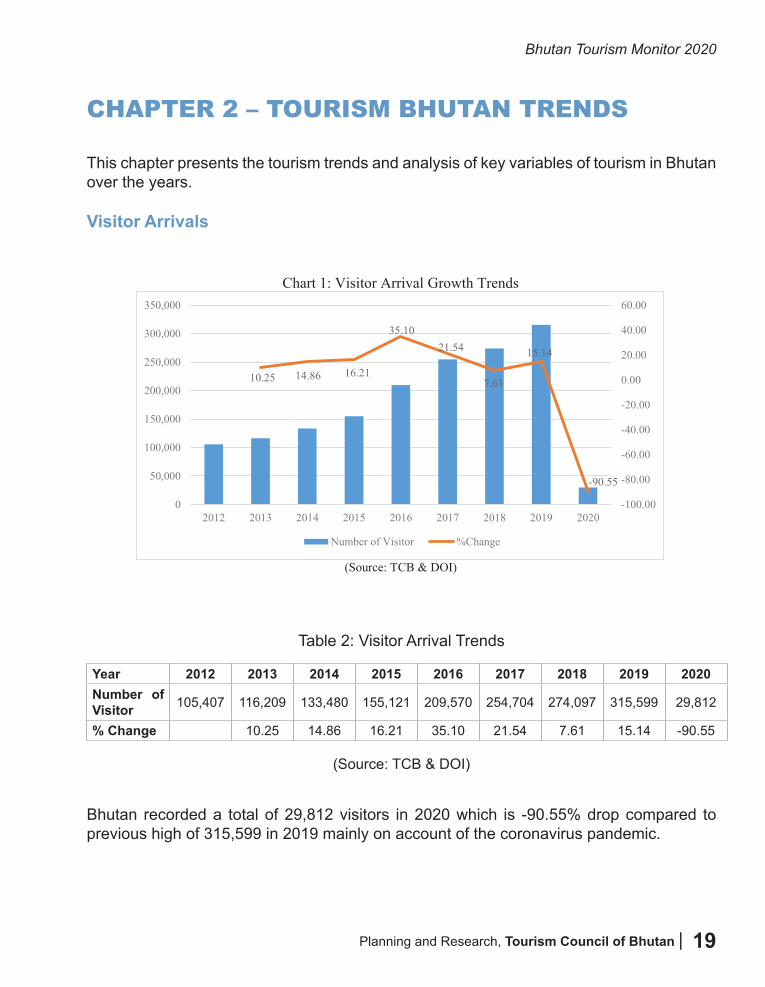
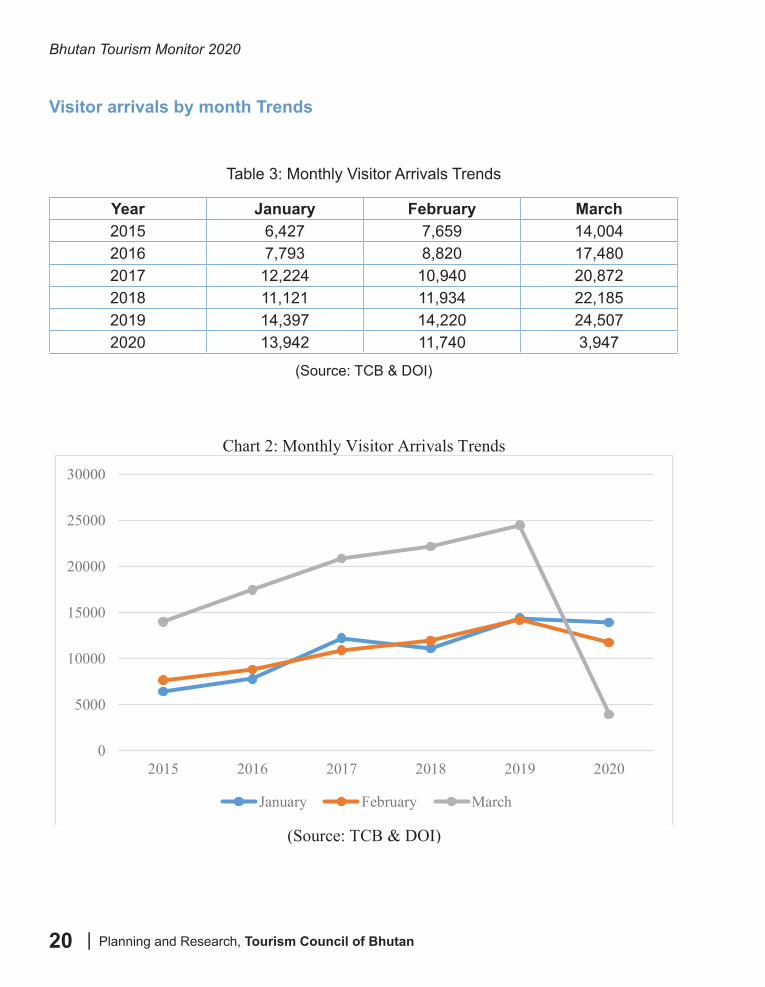
Bhutan recorded a total of 29,812 visitors in 2020 which is -90.55% drop compared to previous high of 315,599 in 2019 mainly on account of the coronavirus pandemic. Visitor arrivals by month Trends
Table 3: Monthly Visitor Arrivals Trends Year January February March 2015 6,427 7,659 14,004 2016 7,793 8,820 17,480 2017 12,224 10,940 20,872 2018 11,121 11,934 22,185 2019 14,397 14,220 24,507 2020 13,942 11,740 3,947
(Source: TCB & DOI)
10.25 14.86 16.21
35.1021.54
7.61
15.14
-90.55
-100.00
-80.00
-60.00
-40.00
-20.00
0.00
20.00
40.00
60.00
0
50,000
100,000
150,000
200,000
250,000
300,000
350,000
2012 2013 2014 2015 2016 2017 2018 2019 2020
Number of Visitor %Change
Bhutan Tourism Monitor 2020
| Planning and Research, Tourism Council of Bhutan20
Visitor arrivals by month Trends
Table 3: Monthly Visitor Arrivals Trends
(Source: TCB & DOI)
Year January February March2015 6,427 7,659 14,0042016 7,793 8,820 17,4802017 12,224 10,940 20,8722018 11,121 11,934 22,1852019 14,397 14,220 24,5072020 13,942 11,740 3,947
Bhutan Tourism Monitor 2020 -------------------------------------------------------------------------------------------------------------------------------
--------------------------------------------------------------------------------------------------------------------- Planning and Research, Tourism Council of Bhutan 15
Chart 2: Monthly Visitor Arrivals Trends
(Source: TCB & DOI)
Visitor Arrival by Dzongkhag
Table 4: Visitor arrivals and Visitor nights by Dzongkhag Trends Dzongkhag Visitors %Change Visitor Nights %Change
2020 2019 2020 2019 Paro 5,394 60,706 -91.11 11,138 138,900 -91.98
Thimphu 5,172 58,593 -91.17 8,090 104,307 -92.24 Punakha 4,863 53,904 -90.98 7,218 77,443 -90.68 Wangdue Phodrang
1,632 20,529 -92.05 2,219 30,090 -92.63
Bumthang 955 11,950 -92.01 2,077 30,580 -93.21 Haa 490 5,751 -91.48 550 7,233 -92.40
Trongsa 448 5,364 -91.65 516 5,934 -91.30 Chukha 320 2,490 -87.15 375 2,768 -86.45 Mongar 261 2,593 -89.93 509 3,808 -86.63
Trashigang 223 2,648 -91.58 379 5,616 -93.25 Samdrup Jongkhar
190 1,721 -88.96 242 1,981 -87.78
Trashi Yangtse 97 1,031 -90.59 114 1,411 -91.92 Gasa 31 813 -96.19 41 4,605 -99.11
Lhuentse 58 761 -92.38 72 1,215 -94.07 Zhemgang 58 346 -83.24 211 915 -76.94
Sarpang 64 263 -75.67 70 396 -82.32 Pema Gatshel 32 96 -66.67 102 175 -41.71
Tsirang 6 74 -91.89 8 107 -92.52 Dagana 2 30 -93.33 5 67 -92.54 Total 20,296 229,663 33,936 417,551
(Source: TCB | Includes only MDPR paying visitors whose purpose of visit is holiday / leisure and recreation and incentive travels)
0
5000
10000
15000
20000
25000
30000
2015 2016 2017 2018 2019 2020
January February March
Planning and Research, Tourism Council of Bhutan |
Bhutan Tourism Monitor 2020
21
Visitor Arrival by Dzongkhag
Bhutan Tourism Monitor 2020 -------------------------------------------------------------------------------------------------------------------------------
--------------------------------------------------------------------------------------------------------------------- Planning and Research, Tourism Council of Bhutan 15
Chart 2: Monthly Visitor Arrivals Trends
(Source: TCB & DOI)
Visitor Arrival by Dzongkhag
Table 4: Visitor arrivals and Visitor nights by Dzongkhag Trends Dzongkhag Visitors %Change Visitor Nights %Change
2020 2019 2020 2019 Paro 5,394 60,706 -91.11 11,138 138,900 -91.98
Thimphu 5,172 58,593 -91.17 8,090 104,307 -92.24 Punakha 4,863 53,904 -90.98 7,218 77,443 -90.68 Wangdue Phodrang
1,632 20,529 -92.05 2,219 30,090 -92.63
Bumthang 955 11,950 -92.01 2,077 30,580 -93.21 Haa 490 5,751 -91.48 550 7,233 -92.40
Trongsa 448 5,364 -91.65 516 5,934 -91.30 Chukha 320 2,490 -87.15 375 2,768 -86.45 Mongar 261 2,593 -89.93 509 3,808 -86.63
Trashigang 223 2,648 -91.58 379 5,616 -93.25 Samdrup Jongkhar
190 1,721 -88.96 242 1,981 -87.78
Trashi Yangtse 97 1,031 -90.59 114 1,411 -91.92 Gasa 31 813 -96.19 41 4,605 -99.11
Lhuentse 58 761 -92.38 72 1,215 -94.07 Zhemgang 58 346 -83.24 211 915 -76.94
Sarpang 64 263 -75.67 70 396 -82.32 Pema Gatshel 32 96 -66.67 102 175 -41.71
Tsirang 6 74 -91.89 8 107 -92.52 Dagana 2 30 -93.33 5 67 -92.54 Total 20,296 229,663 33,936 417,551
(Source: TCB | Includes only MDPR paying visitors whose purpose of visit is holiday / leisure and recreation and incentive travels)
0
5000
10000
15000
20000
25000
30000
2015 2016 2017 2018 2019 2020
January February March
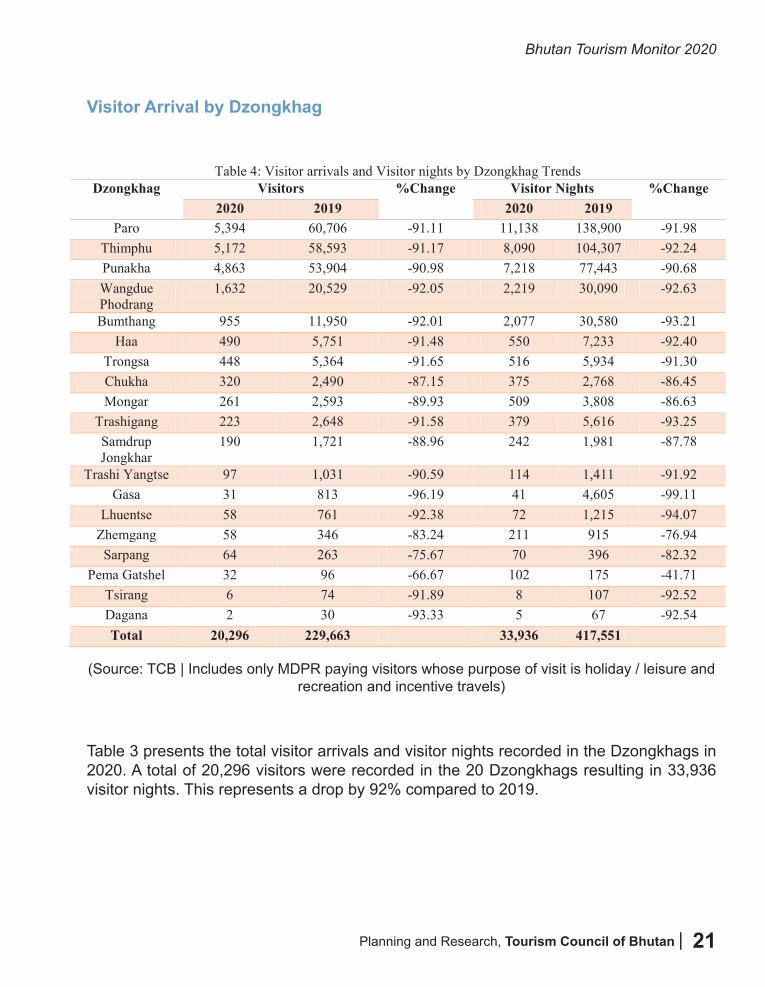
Table 3 presents the total visitor arrivals and visitor nights recorded in the Dzongkhags in 2020. A total of 20,296 visitors were recorded in the 20 Dzongkhags resulting in 33,936 visitor nights. This represents a drop by 92% compared to 2019.
(Source: TCB | Includes only MDPR paying visitors whose purpose of visit is holiday / leisure and recreation and incentive travels)
Bhutan Tourism Monitor 2020
| Planning and Research, Tourism Council of Bhutan22
Arrival by month by Major Source markets trend
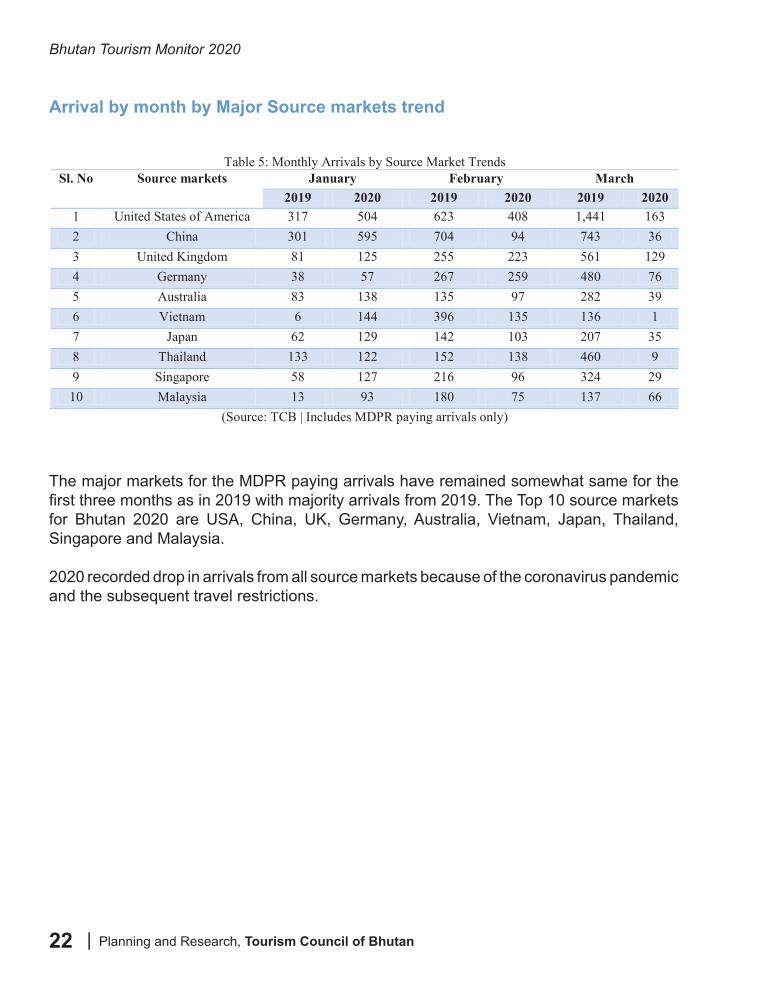
The major markets for the MDPR paying arrivals have remained somewhat same for the first three months as in 2019 with majority arrivals from 2019. The Top 10 source markets for Bhutan 2020 are USA, China, UK, Germany, Australia, Vietnam, Japan, Thailand, Singapore and Malaysia.
2020 recorded drop in arrivals from all source markets because of the coronavirus pandemic and the subsequent travel restrictions.
Bhutan Tourism Monitor 2020 -------------------------------------------------------------------------------------------------------------------------------
--------------------------------------------------------------------------------------------------------------------- Planning and Research, Tourism Council of Bhutan 16
Table 3 presents the total visitor arrivals and visitor nights recorded in the Dzongkhags in 2020. A total of 20,296 visitors were recorded in the 20 Dzongkhags resulting in 33,936 visitor nights. This represents a drop by 92% compared to 2019. Arrival by month by Major Source markets trend
Table 5: Monthly Arrivals by Source Market Trends
Sl. No Source markets January February March 2019 2020 2019 2020 2019 2020
1 United States of America 317 504 623 408 1,441 163 2 China 301 595 704 94 743 36 3 United Kingdom 81 125 255 223 561 129 4 Germany 38 57 267 259 480 76 5 Australia 83 138 135 97 282 39 6 Vietnam 6 144 396 135 136 1 7 Japan 62 129 142 103 207 35 8 Thailand 133 122 152 138 460 9 9 Singapore 58 127 216 96 324 29 10 Malaysia 13 93 180 75 137 66
(Source: TCB | Includes MDPR paying arrivals only)
The major markets for the MDPR paying arrivals have remained somewhat same for the first three months as in 2019 with majority arrivals from 2019. The Top 10 source markets for Bhutan 2020 are USA, China, UK, Germany, Australia, Vietnam, Japan, Thailand, Singapore and Malaysia. 2020 recorded drop in arrivals from all source markets because of the coronavirus pandemic and the subsequent travel restrictions.
Planning and Research, Tourism Council of Bhutan |
Bhutan Tourism Monitor 2020
23
Bhu
tan
Tour
ism
Mon
itor 2
020
----
----
----
----
----
----
----
----
----
----
----
----
----
----
----
----
----
----
----
----
----
----
----
----
----
----
----
----
----
----
----
---
----
----
----
----
----
----
----
----
----
----
----
----
----
----
----
----
----
----
----
----
----
----
----
----
----
----
----
----
----
- Pl
anni
ng a
nd R
esea
rch,
Tou
rism
Cou
ncil
of B
huta
n
17
So
urce
Mar
ket T
rend
s Ta
ble
6: L
eisu
re A
rriv
als b
y So
urce
Mar
ket T
rend
s SL
. N
o So
urce
mar
kets
/Yea
r 20
10
2011
20
12
2013
20
14
2015
20
16
2017
20
18
2019
20
20
%C
hang
e fr
om 2
019
1 U
nite
d St
ates
of A
mer
ica
5,18
9 6,
226
6,00
7 6,
927
7,29
1 7,
137
7,29
2 9,
220
1056
1 10
602
1086
-8
9.76
2
Chi
na
1,49
4 2,
896
3,76
6 4,
764
8,11
1 9,
399
9,20
8 6,
421
6878
73
53
726
-90.
13
3 U
nite
d K
ingd
om
1,77
2 2,
795
2,46
6 2,
291
2,68
0 2,
958
3,12
4 3,
246
3585
38
90
485
-87.
53
4 G
erm
any
2,25
0 2,
287
2,88
0 2,
753
2,97
1 2,
498
2,29
7 2,
970
3422
31
08
405
-86.
97
5 A
ustra
lia
1,31
8 1,
773
1,92
6 2,
043
2,03
7 1,
833
1,81
8 2,
249
2739
25
85
289
-88.
82
6 V
iet N
am
- -
85
95
181
395
1,24
7 1,
423
1961
19
10
280
-85.
34
7 Ja
pan
2,96
3 3,
943
6,96
7 4,
015
2,70
7 2,
437
4,83
3 2,
744
2674
20
71
275
-86.
72
8 Th
aila
nd
875
2,23
5 3,
573
3,49
4 12
,105
3,
778
4,17
7 4,
047
3886
30
37
275
-90.
95
9 Si
ngap
ore
785
1,34
9 1,
605
2,03
7 1,
720
2,58
7 3,
015
4,12
9 38
86
4391
25
6 -9
4.17
10
M
alay
sia
354
788
1,31
2 2,
054
2,06
7 1,
546
1,96
7 2,
956
3140
25
08
245
-90.
23
(Sou
rce:
TC
B |
Incl
udes
MD
PR p
ayin
g ar
rival
s onl
y)
C
hart
3: L
eisu
re A
rriv
als b
y So
urce
Mar
ket T
rend
s
(S
ourc
e: T
CB
| In
clud
es M
DPR
pay
ing
arriv
als o
nly
0
2,00
0
4,00
0
6,00
0
8,00
0
10,0
00
12,0
00
14,0
00
Uni
ted
Stat
es o
fA
mer
ica
Chi
naU
nite
dK
ingd
omG
erm
any
Aus
tralia
Vie
t Nam
Japa
nTh
aila
ndSi
ngap
ore
Mal
aysi
a
2010
2011
2012
2013
2014
2015
2016
2017
2018
2019
2020
Sour
ce M
arke
t Tre
nds
Bhutan Tourism Monitor 2020
| Planning and Research, Tourism Council of Bhutan24
Bhutan Tourism Monitor 2020 -------------------------------------------------------------------------------------------------------------------------------
--------------------------------------------------------------------------------------------------------------------- Planning and Research, Tourism Council of Bhutan 18
Tourism Receipts (Earnings) Table 7: Tourism Receipts
Category 2018 2019 2020 %Change Amount in USD million
Gross Amount 85.41 88.63 9.49 -89.29 Sustainable Development Fee
(SDF) 22.63 23.42 2.76 -88.21
Visa Fee 2.46 2.57 0.34 -86.77 2%TDS 1.20 1.24 0.09 -92.74
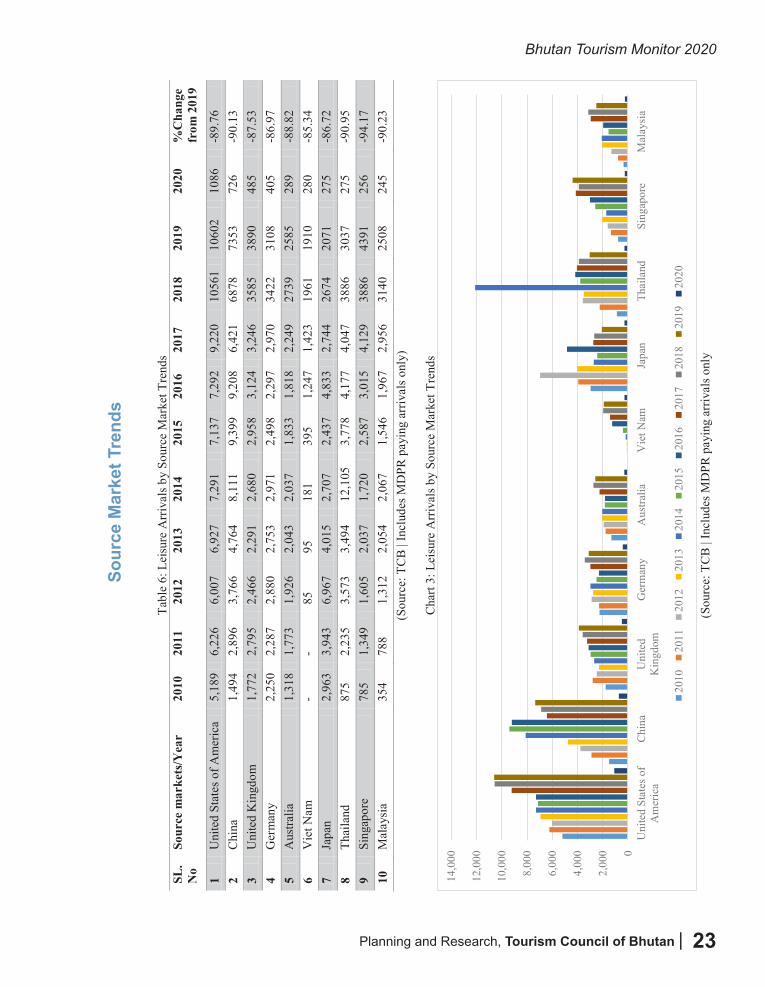
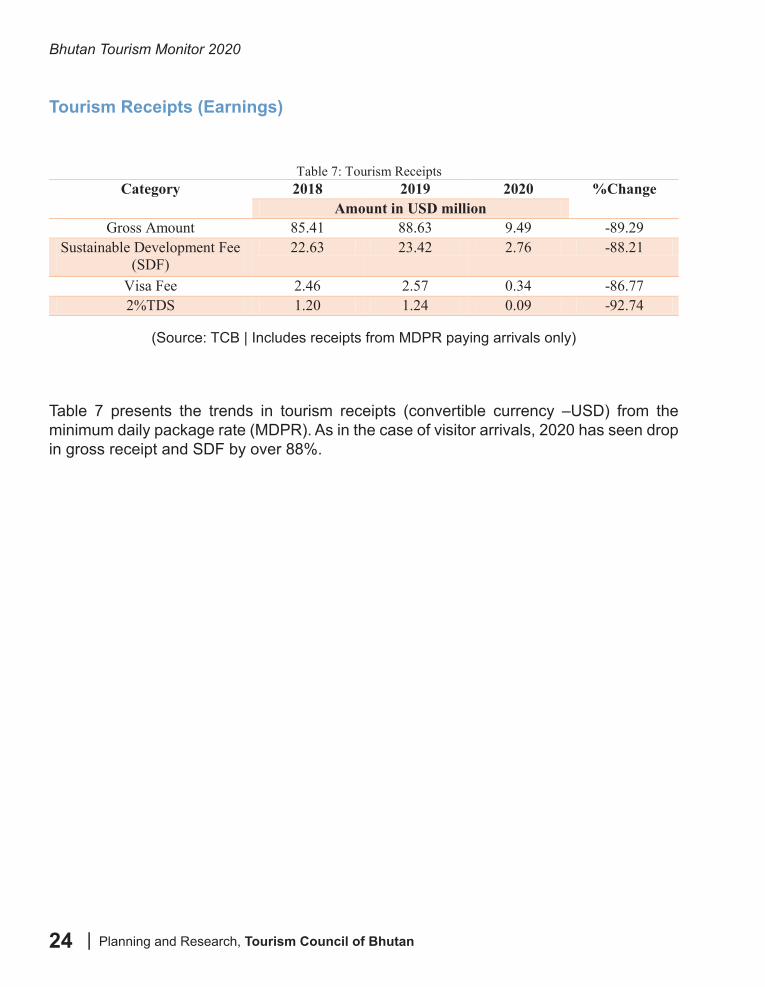
(Source: TCB | Includes receipts from MDPR paying arrivals only) Table 6 presents the trends in tourism receipts (convertible currency –USD) from the minimum daily package rate (MDPR). As in the case of visitor arrivals, 2020 has seen drop in gross receipt and SDF by over 88%.
Tourism Receipts (Earnings)
Table 7 presents the trends in tourism receipts (convertible currency –USD) from the minimum daily package rate (MDPR). As in the case of visitor arrivals, 2020 has seen drop in gross receipt and SDF by over 88%.
(Source: TCB | Includes receipts from MDPR paying arrivals only)
Planning and Research, Tourism Council of Bhutan |
Bhutan Tourism Monitor 2020
25
This chapter presents the analysis of tourism performance in 2020. The coronavirus pandemic has impacted the overall tourism performance in 2020 and the data presented here pertains to visitor arrivals prior to the introduction of travel restrictions. Statistics relating to visitor arrivals, profiles and demographics, visitation, activities and expenditure relating to inbound arrivals are presented.
Annual visitor arrivals
Bhutan recorded a total of 29,812 visitor arrivals in 2020 which is a drop of -90.55% compared to 2019. The drop is mainly due to the coronavirus pandemic as a result of which the international travel and tourism came to a complete halt. Of the total 23,436 were arrivals from non-MDPR paying countries while 6,376 were arrivals from MDPR paying countries visiting Bhutan for leisure, official, business and other purposes. It represents a drop of -90.35% and -91.29% respectively in comparison to 2019.
CHAPTER 3 – 2020 TOURISM PEFORMANCEBhutan Tourism Monitor 2020
-------------------------------------------------------------------------------------------------------------------------------
--------------------------------------------------------------------------------------------------------------------- Planning and Research, Tourism Council of Bhutan 19
CHAPTER 3 – 2020 TOURISM PEFORMANCE This chapter presents the analysis of tourism performance in 2020. The coronavirus pandemic has impacted the overall tourism performance in 2020 and the data presented here pertains to visitor arrivals prior to the introduction of travel restrictions. Statistics relating to visitor arrivals, profiles and demographics, visitation, activities and expenditure relating to inbound arrivals are presented. Annual visitor arrivals Bhutan recorded a total of 29,812 visitor arrivals in 2020 which is a drop of -90.55% compared to 2019. The drop is mainly due to the coronavirus pandemic as a result of which the international travel and tourism came to a complete halt. Of the total 23,436 were arrivals from non-MDPR paying countries while 6,376 were arrivals from MDPR paying countries visiting Bhutan for leisure, official, business and other purposes. It represents a drop of -90.35% and -91.29% respectively in comparison to 2019.
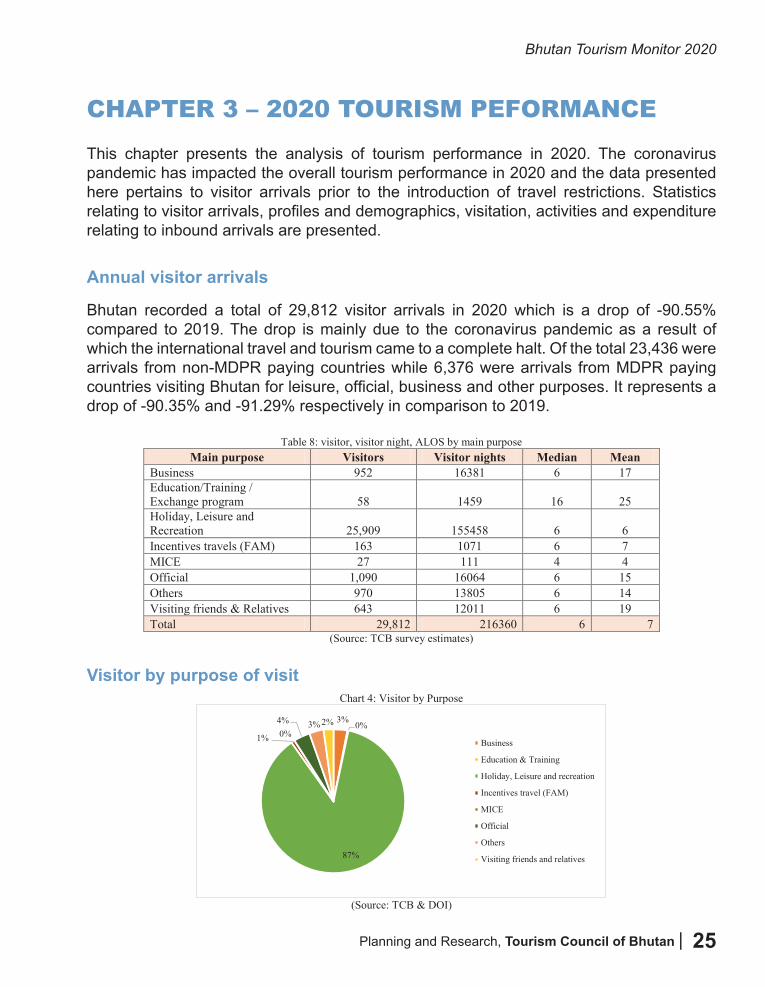
Table 8: visitor, visitor night, ALOS by main purpose Main purpose Visitors Visitor nights Median Mean
Business 952 16381 6 17 Education/Training / Exchange program 58 1459 16 25 Holiday, Leisure and Recreation 25,909 155458 6 6 Incentives travels (FAM) 163 1071 6 7 MICE 27 111 4 4 Official 1,090 16064 6 15 Others 970 13805 6 14 Visiting friends & Relatives 643 12011 6 19 Total 29,812 216360 6 7
(Source: TCB survey estimates) Visitor by purpose of visit
Chart 4: Visitor by Purpose
(Source: TCB & DOI)
3% 0%
87%
1% 0%4% 3% 2%
Business
Education & Training
Holiday, Leisure and recreation
Incentives travel (FAM)
MICE
Official
Others
Visiting friends and relatives
Bhutan Tourism Monitor 2020 -------------------------------------------------------------------------------------------------------------------------------
--------------------------------------------------------------------------------------------------------------------- Planning and Research, Tourism Council of Bhutan 19
CHAPTER 3 – 2020 TOURISM PEFORMANCE This chapter presents the analysis of tourism performance in 2020. The coronavirus pandemic has impacted the overall tourism performance in 2020 and the data presented here pertains to visitor arrivals prior to the introduction of travel restrictions. Statistics relating to visitor arrivals, profiles and demographics, visitation, activities and expenditure relating to inbound arrivals are presented. Annual visitor arrivals Bhutan recorded a total of 29,812 visitor arrivals in 2020 which is a drop of -90.55% compared to 2019. The drop is mainly due to the coronavirus pandemic as a result of which the international travel and tourism came to a complete halt. Of the total 23,436 were arrivals from non-MDPR paying countries while 6,376 were arrivals from MDPR paying countries visiting Bhutan for leisure, official, business and other purposes. It represents a drop of -90.35% and -91.29% respectively in comparison to 2019.
Table 8: visitor, visitor night, ALOS by main purpose Main purpose Visitors Visitor nights Median Mean
Business 952 16381 6 17 Education/Training / Exchange program 58 1459 16 25 Holiday, Leisure and Recreation 25,909 155458 6 6 Incentives travels (FAM) 163 1071 6 7 MICE 27 111 4 4 Official 1,090 16064 6 15 Others 970 13805 6 14 Visiting friends & Relatives 643 12011 6 19 Total 29,812 216360 6 7
(Source: TCB survey estimates) Visitor by purpose of visit
Chart 4: Visitor by Purpose
(Source: TCB & DOI)
3% 0%
87%
1% 0%4% 3% 2%
Business
Education & Training
Holiday, Leisure and recreation
Incentives travel (FAM)
MICE
Official
Others
Visiting friends and relatives
Visitor by purpose of visit
Bhutan Tourism Monitor 2020
| Planning and Research, Tourism Council of Bhutan26
Arrivals by purpose by mode of transport
Visitor bed-nights by purpose
Bhutan Tourism Monitor 2020 -------------------------------------------------------------------------------------------------------------------------------
--------------------------------------------------------------------------------------------------------------------- Planning and Research, Tourism Council of Bhutan 20
Arrivals by purpose by mode of transport
Table 9: Visitor Arrivals by Mode of Transport by Purpose Purpose Air Land Total Business 594 358 952
Education / Training / Exchange program
56 2 58
Holiday, Leisure and Recreation 9,274 16,635 25,909 Incentives travel (FAM) 159 4 163
MICE 16 11 27 Official 928 162 1,090 Others 28 942 970
Visiting friends and relatives 164 479 643 Total 11,219 18,593 29,812
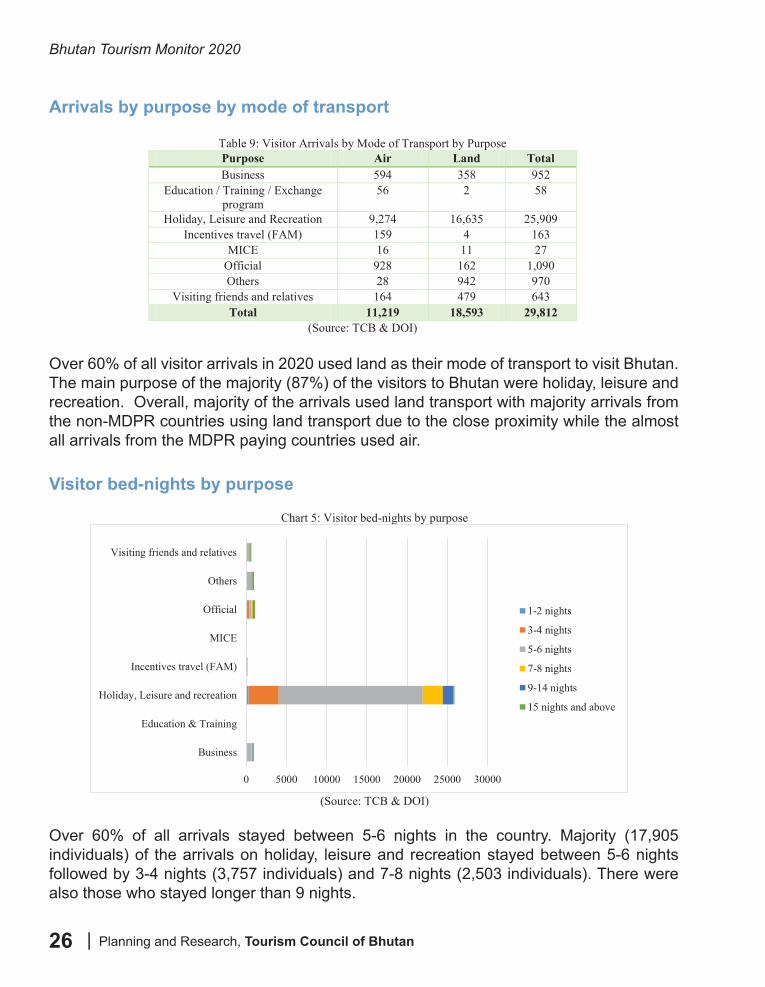
(Source: TCB & DOI) Over 60% of all visitor arrivals in 2020 used land as their mode of transport to visit Bhutan. The main purpose of the majority (87%) of the visitors to Bhutan were holiday, leisure and recreation. Overall, majority of the arrivals used land transport with majority arrivals from the non-MDPR countries using land transport due to the close proximity while the almost all arrivals from the MDPR paying countries used air. Visitor bed-nights by purpose
Chart 5: Visitor bed-nights by purpose
(Source: TCB & DOI)
Over 60% of all arrivals stayed between 5-6 nights in the country. Majority (17,905 individuals) of the arrivals on holiday, leisure and recreation stayed between 5-6 nights followed by 3-4 nights (3,757 individuals) and 7-8 nights (2,503 individuals). There were also those who stayed longer than 9 nights.
0 5000 10000 15000 20000 25000 30000
Business
Education & Training
Holiday, Leisure and recreation
Incentives travel (FAM)
MICE
Official
Others
Visiting friends and relatives
1-2 nights
3-4 nights
5-6 nights
7-8 nights
9-14 nights
15 nights and above
Bhutan Tourism Monitor 2020 -------------------------------------------------------------------------------------------------------------------------------
--------------------------------------------------------------------------------------------------------------------- Planning and Research, Tourism Council of Bhutan 20
Arrivals by purpose by mode of transport
Table 9: Visitor Arrivals by Mode of Transport by Purpose Purpose Air Land Total Business 594 358 952
Education / Training / Exchange program
56 2 58
Holiday, Leisure and Recreation 9,274 16,635 25,909 Incentives travel (FAM) 159 4 163
MICE 16 11 27 Official 928 162 1,090 Others 28 942 970
Visiting friends and relatives 164 479 643 Total 11,219 18,593 29,812
(Source: TCB & DOI) Over 60% of all visitor arrivals in 2020 used land as their mode of transport to visit Bhutan. The main purpose of the majority (87%) of the visitors to Bhutan were holiday, leisure and recreation. Overall, majority of the arrivals used land transport with majority arrivals from the non-MDPR countries using land transport due to the close proximity while the almost all arrivals from the MDPR paying countries used air. Visitor bed-nights by purpose
Chart 5: Visitor bed-nights by purpose
(Source: TCB & DOI)
Over 60% of all arrivals stayed between 5-6 nights in the country. Majority (17,905 individuals) of the arrivals on holiday, leisure and recreation stayed between 5-6 nights followed by 3-4 nights (3,757 individuals) and 7-8 nights (2,503 individuals). There were also those who stayed longer than 9 nights.
0 5000 10000 15000 20000 25000 30000
Business
Education & Training
Holiday, Leisure and recreation
Incentives travel (FAM)
MICE
Official
Others
Visiting friends and relatives
1-2 nights
3-4 nights
5-6 nights
7-8 nights
9-14 nights
15 nights and above
Over 60% of all visitor arrivals in 2020 used land as their mode of transport to visit Bhutan. The main purpose of the majority (87%) of the visitors to Bhutan were holiday, leisure and recreation. Overall, majority of the arrivals used land transport with majority arrivals from the non-MDPR countries using land transport due to the close proximity while the almost all arrivals from the MDPR paying countries used air.
Over 60% of all arrivals stayed between 5-6 nights in the country. Majority (17,905 individuals) of the arrivals on holiday, leisure and recreation stayed between 5-6 nights followed by 3-4 nights (3,757 individuals) and 7-8 nights (2,503 individuals). There were also those who stayed longer than 9 nights.
Planning and Research, Tourism Council of Bhutan |
Bhutan Tourism Monitor 2020
27
Bhutan Tourism Monitor 2020 -------------------------------------------------------------------------------------------------------------------------------
--------------------------------------------------------------------------------------------------------------------- Planning and Research, Tourism Council of Bhutan 21
Table 10: Visitor bed-nights by purpose visitor 1-2
nights 3-4
nights 5-6
nights 7-8
nights 9-14
nights 15 nights
and above Total
Business 58 122 474 98 68 132 952 Education / Training /
Exchange program 0 0 2 12 0 44 58
Holiday, Leisure and Recreation
295 3,757 17,905 2,503 1,335 114 25,909
Incentives travel (FAM) 1 43 67 31 15 6 163 MICE 5 11 11 0 0 0 27
Official 91 284 265 176 128 146 1,090 Others 12 6 659 10 70 213 970
Visiting friends and relatives
3 23 318 59 87 153 643
Total 465 4,246 19,701 2,889 1,703 808 29,812 (Source: TCB & DOI)
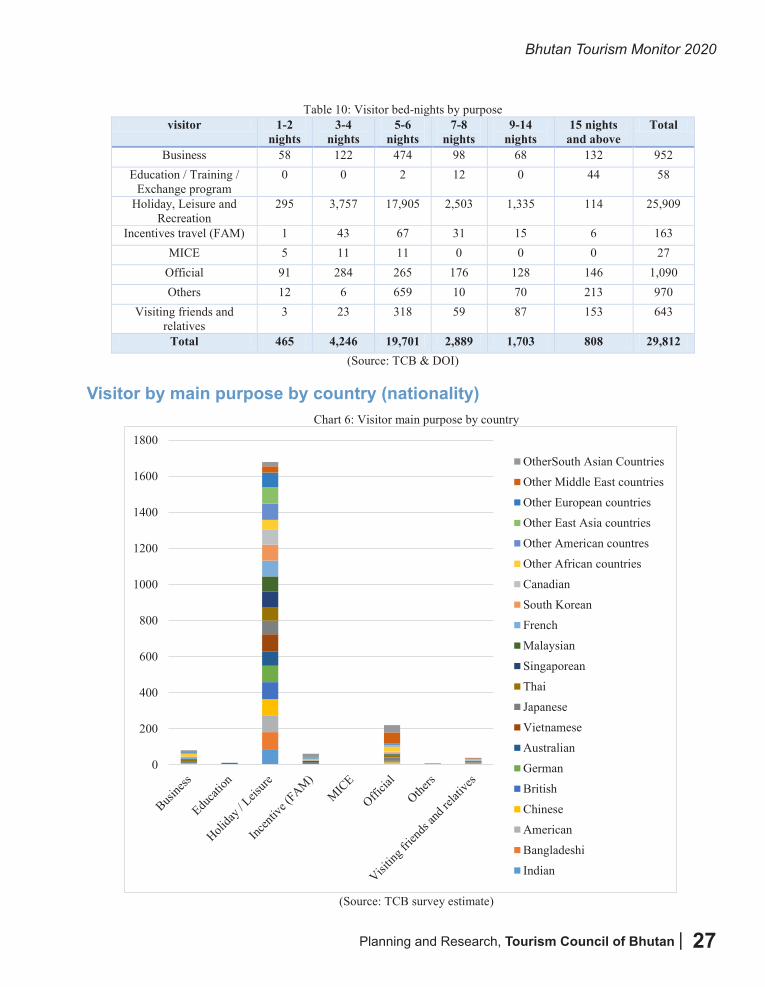
Visitor by main purpose by country (nationality)
Chart 6: Visitor main purpose by country
(Source: TCB survey estimate)
0
200
400
600
800
1000
1200
1400
1600
1800
OtherSouth Asian Countries
Other Middle East countries
Other European countries
Other East Asia countries
Other American countres
Other African countries
Canadian
South Korean
French
Malaysian
Singaporean
Thai
Japanese
Vietnamese
Australian
German
British
Chinese
American
Bangladeshi
Indian
Bhutan Tourism Monitor 2020 -------------------------------------------------------------------------------------------------------------------------------
--------------------------------------------------------------------------------------------------------------------- Planning and Research, Tourism Council of Bhutan 21
Table 10: Visitor bed-nights by purpose visitor 1-2
nights 3-4
nights 5-6
nights 7-8
nights 9-14
nights 15 nights
and above Total
Business 58 122 474 98 68 132 952 Education / Training /
Exchange program 0 0 2 12 0 44 58
Holiday, Leisure and Recreation
295 3,757 17,905 2,503 1,335 114 25,909
Incentives travel (FAM) 1 43 67 31 15 6 163 MICE 5 11 11 0 0 0 27
Official 91 284 265 176 128 146 1,090 Others 12 6 659 10 70 213 970
Visiting friends and relatives
3 23 318 59 87 153 643
Total 465 4,246 19,701 2,889 1,703 808 29,812 (Source: TCB & DOI)
Visitor by main purpose by country (nationality)
Chart 6: Visitor main purpose by country
(Source: TCB survey estimate)
0
200
400
600
800
1000
1200
1400
1600
1800
OtherSouth Asian Countries
Other Middle East countries
Other European countries
Other East Asia countries
Other American countres
Other African countries
Canadian
South Korean
French
Malaysian
Singaporean
Thai
Japanese
Vietnamese
Australian
German
British
Chinese
American
Bangladeshi
Indian
Visitor by main purpose by country (nationality)
Bhutan Tourism Monitor 2020
| Planning and Research, Tourism Council of Bhutan28
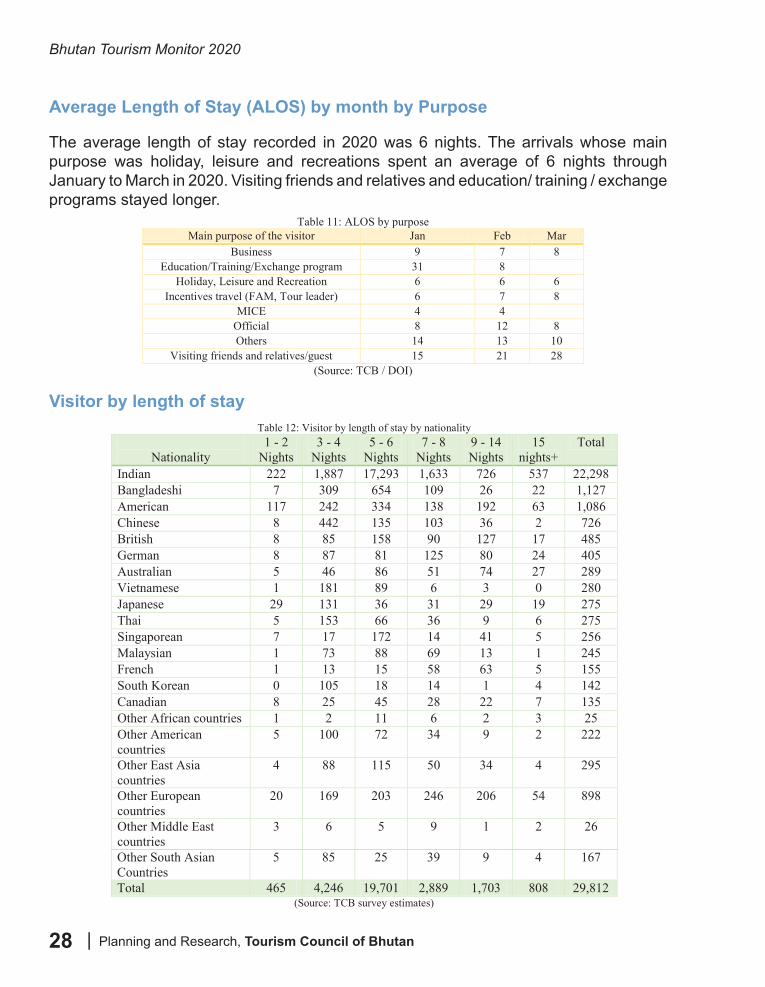
Average Length of Stay (ALOS) by month by Purpose
Visitor by length of stay
The average length of stay recorded in 2020 was 6 nights. The arrivals whose main purpose was holiday, leisure and recreations spent an average of 6 nights through January to March in 2020. Visiting friends and relatives and education/ training / exchange programs stayed longer.
Bhutan Tourism Monitor 2020 -------------------------------------------------------------------------------------------------------------------------------
--------------------------------------------------------------------------------------------------------------------- Planning and Research, Tourism Council of Bhutan 22
Average Length of Stay (ALOS) by month by Purpose The average length of stay recorded in 2020 was 6 nights. The arrivals whose main purpose was holiday, leisure and recreations spent an average of 6 nights through January to March in 2020. Visiting friends and relatives and education/ training / exchange programs stayed longer.
Table 11: ALOS by purpose Main purpose of the visitor Jan Feb Mar
Business 9 7 8 Education/Training/Exchange program 31 8
Holiday, Leisure and Recreation 6 6 6 Incentives travel (FAM, Tour leader) 6 7 8
MICE 4 4 Official 8 12 8 Others 14 13 10
Visiting friends and relatives/guest 15 21 28 (Source: TCB / DOI)
Visitor by length of stay Table 12: Visitor by length of stay by nationality
Nationality
1 - 2 Nights
3 - 4 Nights
5 - 6 Nights
7 - 8 Nights
9 - 14 Nights
15 nights+
Total
Indian 222 1,887 17,293 1,633 726 537 22,298 Bangladeshi 7 309 654 109 26 22 1,127 American 117 242 334 138 192 63 1,086 Chinese 8 442 135 103 36 2 726 British 8 85 158 90 127 17 485 German 8 87 81 125 80 24 405 Australian 5 46 86 51 74 27 289 Vietnamese 1 181 89 6 3 0 280 Japanese 29 131 36 31 29 19 275 Thai 5 153 66 36 9 6 275 Singaporean 7 17 172 14 41 5 256 Malaysian 1 73 88 69 13 1 245 French 1 13 15 58 63 5 155 South Korean 0 105 18 14 1 4 142 Canadian 8 25 45 28 22 7 135 Other African countries 1 2 11 6 2 3 25 Other American countries
5 100 72 34 9 2 222
Other East Asia countries
4 88 115 50 34 4 295
Other European countries
20 169 203 246 206 54 898
Other Middle East countries
3 6 5 9 1 2 26 Bhutan Tourism Monitor 2020
-------------------------------------------------------------------------------------------------------------------------------
--------------------------------------------------------------------------------------------------------------------- Planning and Research, Tourism Council of Bhutan 23
Other South Asian Countries
5 85 25 39 9 4 167
Total 465 4,246 19,701 2,889 1,703 808 29,812 (Source: TCB survey estimates)
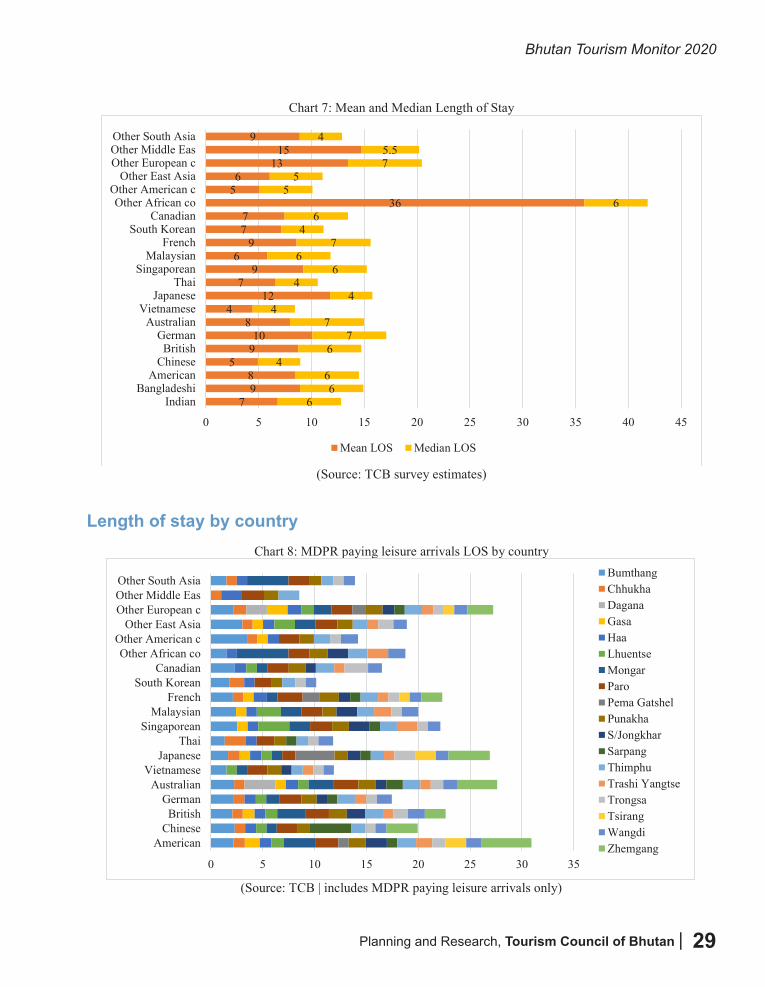
Chart 7: Mean and Median Length of Stay
(Source: TCB survey estimates)
Length of stay by country Chart 8: MDPR paying leisure arrivals LOS by country
(Source: TCB | includes MDPR paying leisure arrivals only)
798
5910
84
127
96
977
3656
1315
9
66
64
67
74
44
66
74
66
55
75.5
4
0 5 10 15 20 25 30 35 40 45
IndianBangladeshi
AmericanChinese
BritishGerman
AustralianVietnamese
JapaneseThai
SingaporeanMalaysian
FrenchSouth Korean
CanadianOther African co
Other American cOther East Asia
Other European cOther Middle EasOther South Asia
Mean LOS Median LOS
0 5 10 15 20 25 30 35
AmericanChineseBritish
GermanAustralian
VietnameseJapanese
ThaiSingaporean
MalaysianFrench
South KoreanCanadian
Other African coOther American c
Other East AsiaOther European cOther Middle EasOther South Asia
BumthangChhukhaDaganaGasaHaaLhuentseMongarParoPema GatshelPunakhaS/JongkharSarpangThimphuTrashi YangtseTrongsaTsirangWangdiZhemgang
Bhutan Tourism Monitor 2020 -------------------------------------------------------------------------------------------------------------------------------
--------------------------------------------------------------------------------------------------------------------- Planning and Research, Tourism Council of Bhutan 22
Average Length of Stay (ALOS) by month by Purpose The average length of stay recorded in 2020 was 6 nights. The arrivals whose main purpose was holiday, leisure and recreations spent an average of 6 nights through January to March in 2020. Visiting friends and relatives and education/ training / exchange programs stayed longer.
Table 11: ALOS by purpose Main purpose of the visitor Jan Feb Mar
Business 9 7 8 Education/Training/Exchange program 31 8
Holiday, Leisure and Recreation 6 6 6 Incentives travel (FAM, Tour leader) 6 7 8
MICE 4 4 Official 8 12 8 Others 14 13 10
Visiting friends and relatives/guest 15 21 28 (Source: TCB / DOI)
Visitor by length of stay Table 12: Visitor by length of stay by nationality
Nationality
1 - 2 Nights
3 - 4 Nights
5 - 6 Nights
7 - 8 Nights
9 - 14 Nights
15 nights+
Total
Indian 222 1,887 17,293 1,633 726 537 22,298 Bangladeshi 7 309 654 109 26 22 1,127 American 117 242 334 138 192 63 1,086 Chinese 8 442 135 103 36 2 726 British 8 85 158 90 127 17 485 German 8 87 81 125 80 24 405 Australian 5 46 86 51 74 27 289 Vietnamese 1 181 89 6 3 0 280 Japanese 29 131 36 31 29 19 275 Thai 5 153 66 36 9 6 275 Singaporean 7 17 172 14 41 5 256 Malaysian 1 73 88 69 13 1 245 French 1 13 15 58 63 5 155 South Korean 0 105 18 14 1 4 142 Canadian 8 25 45 28 22 7 135 Other African countries 1 2 11 6 2 3 25 Other American countries
5 100 72 34 9 2 222
Other East Asia countries
4 88 115 50 34 4 295
Other European countries
20 169 203 246 206 54 898
Other Middle East countries
3 6 5 9 1 2 26
Planning and Research, Tourism Council of Bhutan |
Bhutan Tourism Monitor 2020
29
Bhutan Tourism Monitor 2020 -------------------------------------------------------------------------------------------------------------------------------
--------------------------------------------------------------------------------------------------------------------- Planning and Research, Tourism Council of Bhutan 23
Other South Asian Countries
5 85 25 39 9 4 167
Total 465 4,246 19,701 2,889 1,703 808 29,812 (Source: TCB survey estimates)
Chart 7: Mean and Median Length of Stay
(Source: TCB survey estimates)
Length of stay by country Chart 8: MDPR paying leisure arrivals LOS by country
(Source: TCB | includes MDPR paying leisure arrivals only)
798
5910
84
127
96
977
3656
1315
9
66
64
67
74
44
66
74
66
55
75.5
4
0 5 10 15 20 25 30 35 40 45
IndianBangladeshi
AmericanChinese
BritishGerman
AustralianVietnamese
JapaneseThai
SingaporeanMalaysian
FrenchSouth Korean
CanadianOther African co
Other American cOther East Asia
Other European cOther Middle EasOther South Asia
Mean LOS Median LOS
0 5 10 15 20 25 30 35
AmericanChineseBritish
GermanAustralian
VietnameseJapanese
ThaiSingaporean
MalaysianFrench
South KoreanCanadian
Other African coOther American c
Other East AsiaOther European cOther Middle EasOther South Asia
BumthangChhukhaDaganaGasaHaaLhuentseMongarParoPema GatshelPunakhaS/JongkharSarpangThimphuTrashi YangtseTrongsaTsirangWangdiZhemgang
Bhutan Tourism Monitor 2020 -------------------------------------------------------------------------------------------------------------------------------
--------------------------------------------------------------------------------------------------------------------- Planning and Research, Tourism Council of Bhutan 23
Other South Asian Countries
5 85 25 39 9 4 167
Total 465 4,246 19,701 2,889 1,703 808 29,812 (Source: TCB survey estimates)
Chart 7: Mean and Median Length of Stay
(Source: TCB survey estimates)
Length of stay by country Chart 8: MDPR paying leisure arrivals LOS by country
(Source: TCB | includes MDPR paying leisure arrivals only)
798
5910
84
127
96
977
3656
1315
9
66
64
67
74
44
66
74
66
55
75.5
4
0 5 10 15 20 25 30 35 40 45
IndianBangladeshi
AmericanChinese
BritishGerman
AustralianVietnamese
JapaneseThai
SingaporeanMalaysian
FrenchSouth Korean
CanadianOther African co
Other American cOther East Asia
Other European cOther Middle EasOther South Asia
Mean LOS Median LOS
0 5 10 15 20 25 30 35
AmericanChineseBritish
GermanAustralian
VietnameseJapanese
ThaiSingaporean
MalaysianFrench
South KoreanCanadian
Other African coOther American c
Other East AsiaOther European cOther Middle EasOther South Asia
BumthangChhukhaDaganaGasaHaaLhuentseMongarParoPema GatshelPunakhaS/JongkharSarpangThimphuTrashi YangtseTrongsaTsirangWangdiZhemgang
Length of stay by country
Bhutan Tourism Monitor 2020
| Planning and Research, Tourism Council of Bhutan30
Monthly Arrivals and Monthly Bed nights by Major markets
Visitor arrivals by Dzongkhag
Bhutan Tourism Monitor 2020 -------------------------------------------------------------------------------------------------------------------------------
--------------------------------------------------------------------------------------------------------------------- Planning and Research, Tourism Council of Bhutan 24
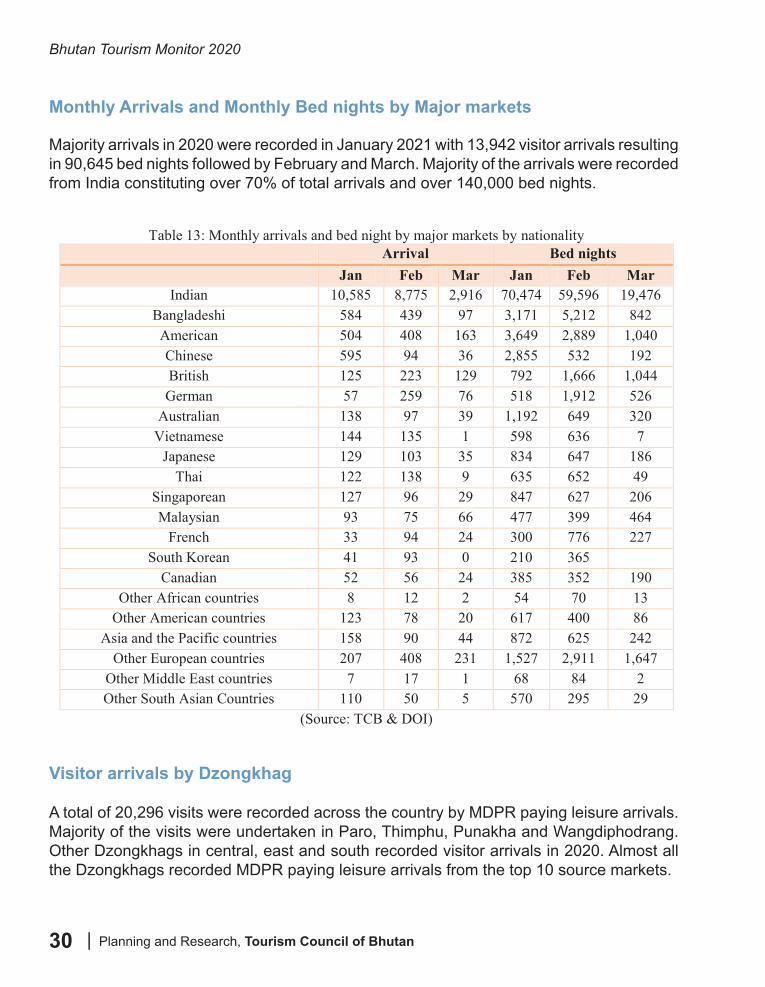
Monthly Arrivals and Monthly Bed nights by Major markets Majority arrivals in 2020 were recorded in January 2021 with 13,942 visitor arrivals resulting in 90,645 bed nights followed by February and March. Majority of the arrivals were recorded from India constituting over 70% of total arrivals and over 140,000 bed nights.
Table 13: Monthly arrivals and bed night by major markets by nationality Arrival Bed nights Jan Feb Mar Jan Feb Mar
Indian 10,585 8,775 2,916 70,474 59,596 19,476 Bangladeshi 584 439 97 3,171 5,212 842 American 504 408 163 3,649 2,889 1,040 Chinese 595 94 36 2,855 532 192 British 125 223 129 792 1,666 1,044 German 57 259 76 518 1,912 526
Australian 138 97 39 1,192 649 320 Vietnamese 144 135 1 598 636 7
Japanese 129 103 35 834 647 186 Thai 122 138 9 635 652 49
Singaporean 127 96 29 847 627 206 Malaysian 93 75 66 477 399 464
French 33 94 24 300 776 227 South Korean 41 93 0 210 365
Canadian 52 56 24 385 352 190 Other African countries 8 12 2 54 70 13
Other American countries 123 78 20 617 400 86 Asia and the Pacific countries 158 90 44 872 625 242
Other European countries 207 408 231 1,527 2,911 1,647 Other Middle East countries 7 17 1 68 84 2 Other South Asian Countries 110 50 5 570 295 29
(Source: TCB & DOI)
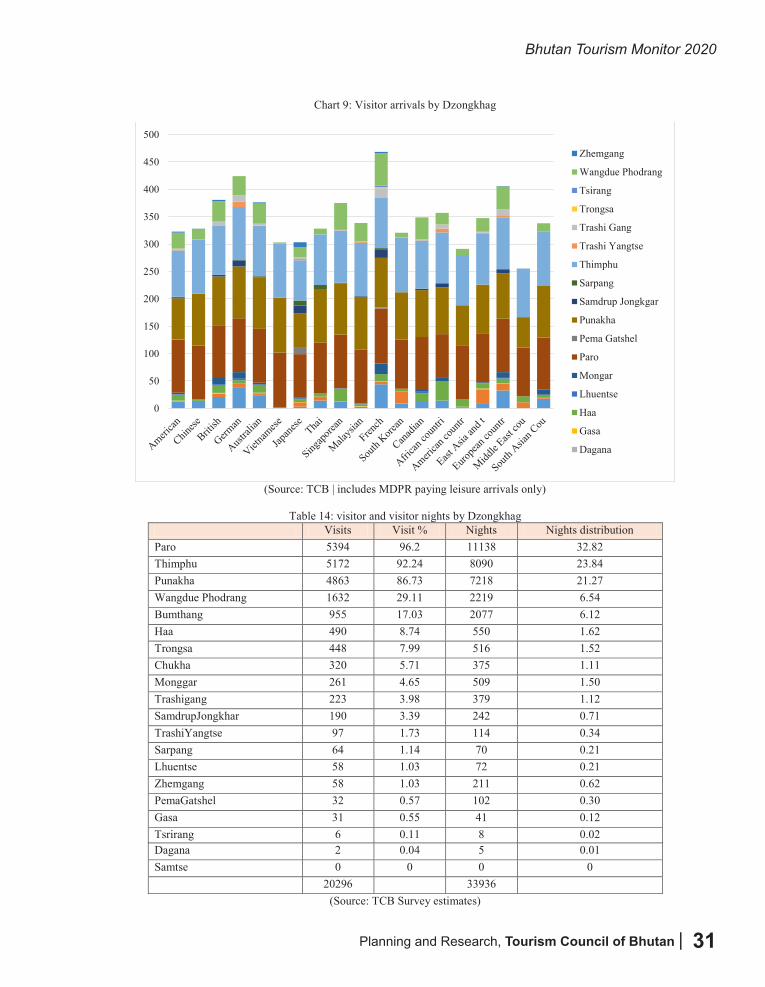
Visitor arrivals by Dzongkhag A total of 20,296 visits were recorded across the country by MDPR paying leisure arrivals. Majority of the visits were undertaken in Paro, Thimphu, Punakha and Wangdiphodrang. Other Dzongkhags in central, east and south recorded visitor arrivals in 2020. Almost all the Dzongkhags recorded MDPR paying leisure arrivals from the top 10 source markets.
Majority arrivals in 2020 were recorded in January 2021 with 13,942 visitor arrivals resulting in 90,645 bed nights followed by February and March. Majority of the arrivals were recorded from India constituting over 70% of total arrivals and over 140,000 bed nights.
A total of 20,296 visits were recorded across the country by MDPR paying leisure arrivals. Majority of the visits were undertaken in Paro, Thimphu, Punakha and Wangdiphodrang. Other Dzongkhags in central, east and south recorded visitor arrivals in 2020. Almost all the Dzongkhags recorded MDPR paying leisure arrivals from the top 10 source markets.
Planning and Research, Tourism Council of Bhutan |
Bhutan Tourism Monitor 2020
31
Bhutan Tourism Monitor 2020 -------------------------------------------------------------------------------------------------------------------------------
--------------------------------------------------------------------------------------------------------------------- Planning and Research, Tourism Council of Bhutan 26
Dagana 2 0.04 5 0.01 Samtse 0 0 0 0 20296 33936
(Source: TCB Survey estimates)
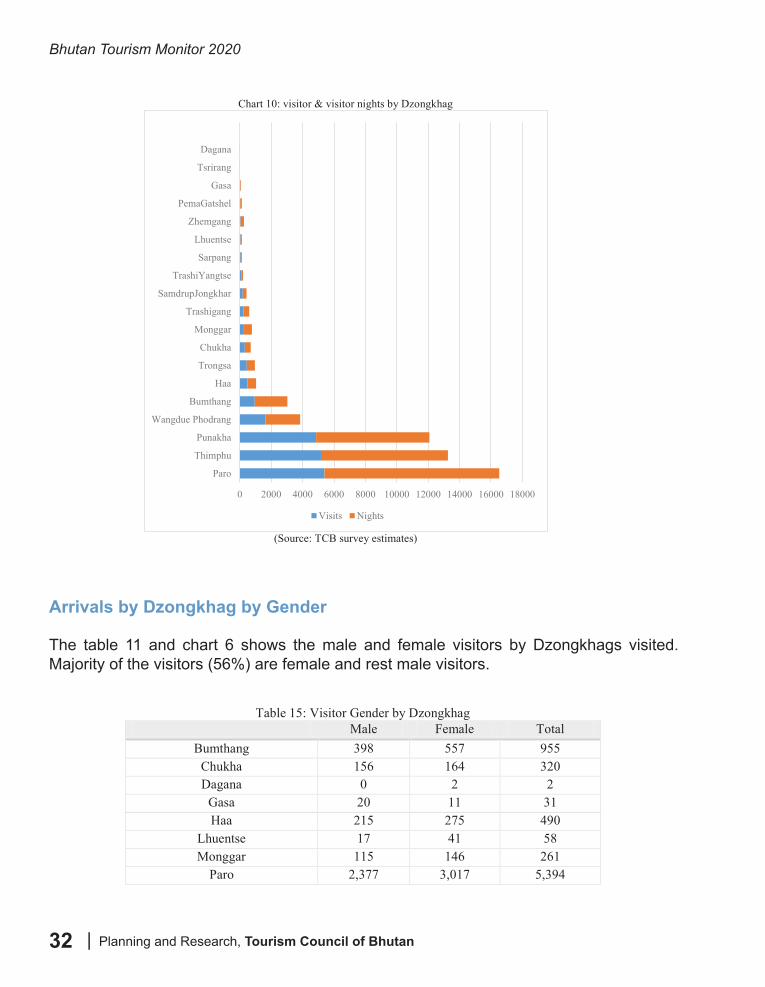
Chart 10: visitor & visitor nights by Dzongkhag
(Source: TCB survey estimates)
Arrivals by Dzongkhag by Gender The table 11 and chart 6 shows the male and female visitors by Dzongkhags visited. Majority of the visitors (56%) are female and rest male visitors.
Table 15: Visitor Gender by Dzongkhag Male Female Total
Bumthang 398 557 955 Chukha 156 164 320 Dagana 0 2 2
Gasa 20 11 31
0 2000 4000 6000 8000 10000 12000 14000 16000 18000
Paro
Thimphu
Punakha
Wangdue Phodrang
Bumthang
Haa
Trongsa
Chukha
Monggar
Trashigang
SamdrupJongkhar
TrashiYangtse
Sarpang
Lhuentse
Zhemgang
PemaGatshel
Gasa
Tsrirang
Dagana
Visits Nights
Bhutan Tourism Monitor 2020 -------------------------------------------------------------------------------------------------------------------------------
--------------------------------------------------------------------------------------------------------------------- Planning and Research, Tourism Council of Bhutan 25
Chart 9: Visitor arrivals by Dzongkhag
(Source: TCB | includes MDPR paying leisure arrivals only)
Table 14: visitor and visitor nights by Dzongkhag
Visits Visit % Nights Nights distribution Paro 5394 96.2 11138 32.82 Thimphu 5172 92.24 8090 23.84 Punakha 4863 86.73 7218 21.27 Wangdue Phodrang 1632 29.11 2219 6.54 Bumthang 955 17.03 2077 6.12 Haa 490 8.74 550 1.62 Trongsa 448 7.99 516 1.52 Chukha 320 5.71 375 1.11 Monggar 261 4.65 509 1.50 Trashigang 223 3.98 379 1.12 SamdrupJongkhar 190 3.39 242 0.71 TrashiYangtse 97 1.73 114 0.34 Sarpang 64 1.14 70 0.21 Lhuentse 58 1.03 72 0.21 Zhemgang 58 1.03 211 0.62 PemaGatshel 32 0.57 102 0.30 Gasa 31 0.55 41 0.12 Tsrirang 6 0.11 8 0.02
0
50
100
150
200
250
300
350
400
450
500
Zhemgang
Wangdue Phodrang
Tsirang
Trongsa
Trashi Gang
Trashi Yangtse
Thimphu
Sarpang
Samdrup Jongkgar
Punakha
Pema Gatshel
Paro
Mongar
Lhuentse
Haa
Gasa
Dagana
Bhutan Tourism Monitor 2020
| Planning and Research, Tourism Council of Bhutan32
Bhutan Tourism Monitor 2020 -------------------------------------------------------------------------------------------------------------------------------
--------------------------------------------------------------------------------------------------------------------- Planning and Research, Tourism Council of Bhutan 26
Dagana 2 0.04 5 0.01 Samtse 0 0 0 0 20296 33936
(Source: TCB Survey estimates)
Chart 10: visitor & visitor nights by Dzongkhag
(Source: TCB survey estimates)
Arrivals by Dzongkhag by Gender The table 11 and chart 6 shows the male and female visitors by Dzongkhags visited. Majority of the visitors (56%) are female and rest male visitors.
Table 15: Visitor Gender by Dzongkhag Male Female Total
Bumthang 398 557 955 Chukha 156 164 320 Dagana 0 2 2
Gasa 20 11 31
0 2000 4000 6000 8000 10000 12000 14000 16000 18000
Paro
Thimphu
Punakha
Wangdue Phodrang
Bumthang
Haa
Trongsa
Chukha
Monggar
Trashigang
SamdrupJongkhar
TrashiYangtse
Sarpang
Lhuentse
Zhemgang
PemaGatshel
Gasa
Tsrirang
Dagana
Visits Nights
Arrivals by Dzongkhag by Gender
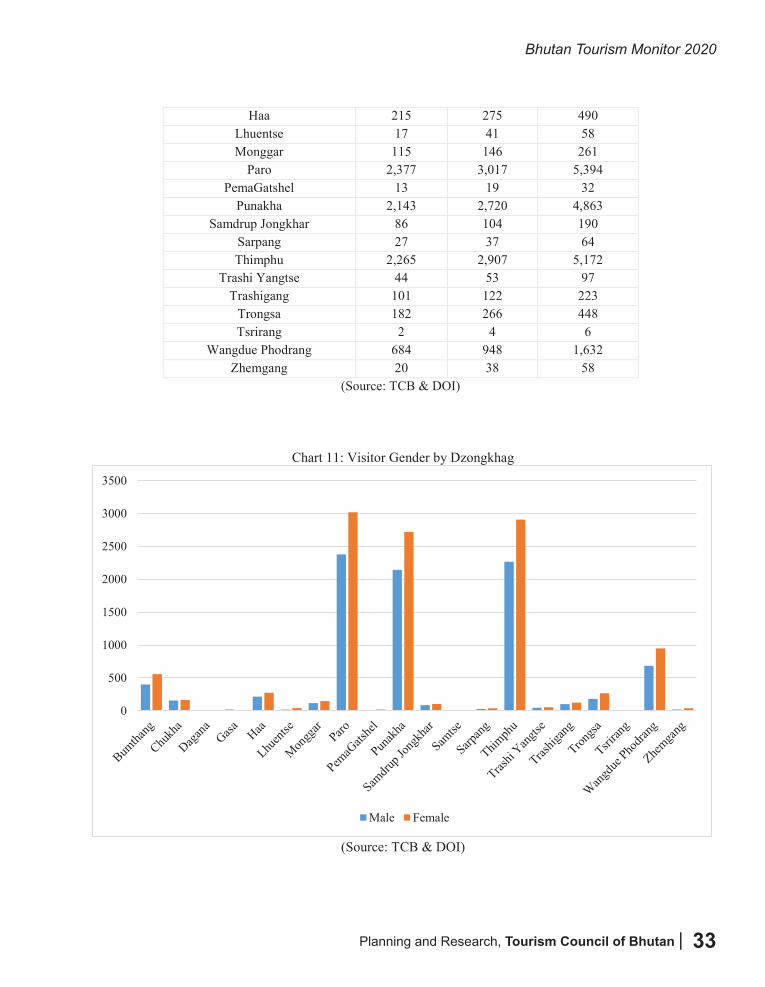
The table 11 and chart 6 shows the male and female visitors by Dzongkhags visited. Majority of the visitors (56%) are female and rest male visitors.
Bhutan Tourism Monitor 2020 -------------------------------------------------------------------------------------------------------------------------------
--------------------------------------------------------------------------------------------------------------------- Planning and Research, Tourism Council of Bhutan 27
Haa 215 275 490 Lhuentse 17 41 58 Monggar 115 146 261
Paro 2,377 3,017 5,394 PemaGatshel 13 19 32
Punakha 2,143 2,720 4,863 Samdrup Jongkhar 86 104 190
Sarpang 27 37 64 Thimphu 2,265 2,907 5,172
Trashi Yangtse 44 53 97 Trashigang 101 122 223
Trongsa 182 266 448 Tsrirang 2 4 6
Wangdue Phodrang 684 948 1,632 Zhemgang 20 38 58
(Source: TCB & DOI)
Chart 11: Visitor Gender by Dzongkhag
(Source: TCB & DOI)
Visitor arrival by mode of transport by global segmentation Majority of the arrivals from South Asia used land transport to visit Bhutan while visitors from other regions used air as their mode of transport.
0
500
1000
1500
2000
2500
3000
3500
Male Female
Bhutan Tourism Monitor 2020 -------------------------------------------------------------------------------------------------------------------------------
--------------------------------------------------------------------------------------------------------------------- Planning and Research, Tourism Council of Bhutan 26
Dagana 2 0.04 5 0.01 Samtse 0 0 0 0 20296 33936
(Source: TCB Survey estimates)
Chart 10: visitor & visitor nights by Dzongkhag
(Source: TCB survey estimates)
Arrivals by Dzongkhag by Gender The table 11 and chart 6 shows the male and female visitors by Dzongkhags visited. Majority of the visitors (56%) are female and rest male visitors.
Table 15: Visitor Gender by Dzongkhag Male Female Total
Bumthang 398 557 955 Chukha 156 164 320 Dagana 0 2 2
Gasa 20 11 31
0 2000 4000 6000 8000 10000 12000 14000 16000 18000
Paro
Thimphu
Punakha
Wangdue Phodrang
Bumthang
Haa
Trongsa
Chukha
Monggar
Trashigang
SamdrupJongkhar
TrashiYangtse
Sarpang
Lhuentse
Zhemgang
PemaGatshel
Gasa
Tsrirang
Dagana
Visits Nights
Planning and Research, Tourism Council of Bhutan |
Bhutan Tourism Monitor 2020
33
Bhutan Tourism Monitor 2020 -------------------------------------------------------------------------------------------------------------------------------
--------------------------------------------------------------------------------------------------------------------- Planning and Research, Tourism Council of Bhutan 27
Haa 215 275 490 Lhuentse 17 41 58 Monggar 115 146 261
Paro 2,377 3,017 5,394 PemaGatshel 13 19 32
Punakha 2,143 2,720 4,863 Samdrup Jongkhar 86 104 190
Sarpang 27 37 64 Thimphu 2,265 2,907 5,172
Trashi Yangtse 44 53 97 Trashigang 101 122 223
Trongsa 182 266 448 Tsrirang 2 4 6
Wangdue Phodrang 684 948 1,632 Zhemgang 20 38 58
(Source: TCB & DOI)
Chart 11: Visitor Gender by Dzongkhag
(Source: TCB & DOI)
Visitor arrival by mode of transport by global segmentation Majority of the arrivals from South Asia used land transport to visit Bhutan while visitors from other regions used air as their mode of transport.
0
500
1000
1500
2000
2500
3000
3500
Male Female
Bhutan Tourism Monitor 2020 -------------------------------------------------------------------------------------------------------------------------------
--------------------------------------------------------------------------------------------------------------------- Planning and Research, Tourism Council of Bhutan 27
Haa 215 275 490 Lhuentse 17 41 58 Monggar 115 146 261
Paro 2,377 3,017 5,394 PemaGatshel 13 19 32
Punakha 2,143 2,720 4,863 Samdrup Jongkhar 86 104 190
Sarpang 27 37 64 Thimphu 2,265 2,907 5,172
Trashi Yangtse 44 53 97 Trashigang 101 122 223
Trongsa 182 266 448 Tsrirang 2 4 6
Wangdue Phodrang 684 948 1,632 Zhemgang 20 38 58
(Source: TCB & DOI)
Chart 11: Visitor Gender by Dzongkhag
(Source: TCB & DOI)
Visitor arrival by mode of transport by global segmentation Majority of the arrivals from South Asia used land transport to visit Bhutan while visitors from other regions used air as their mode of transport.
0
500
1000
1500
2000
2500
3000
3500
Male Female
Bhutan Tourism Monitor 2020
| Planning and Research, Tourism Council of Bhutan34
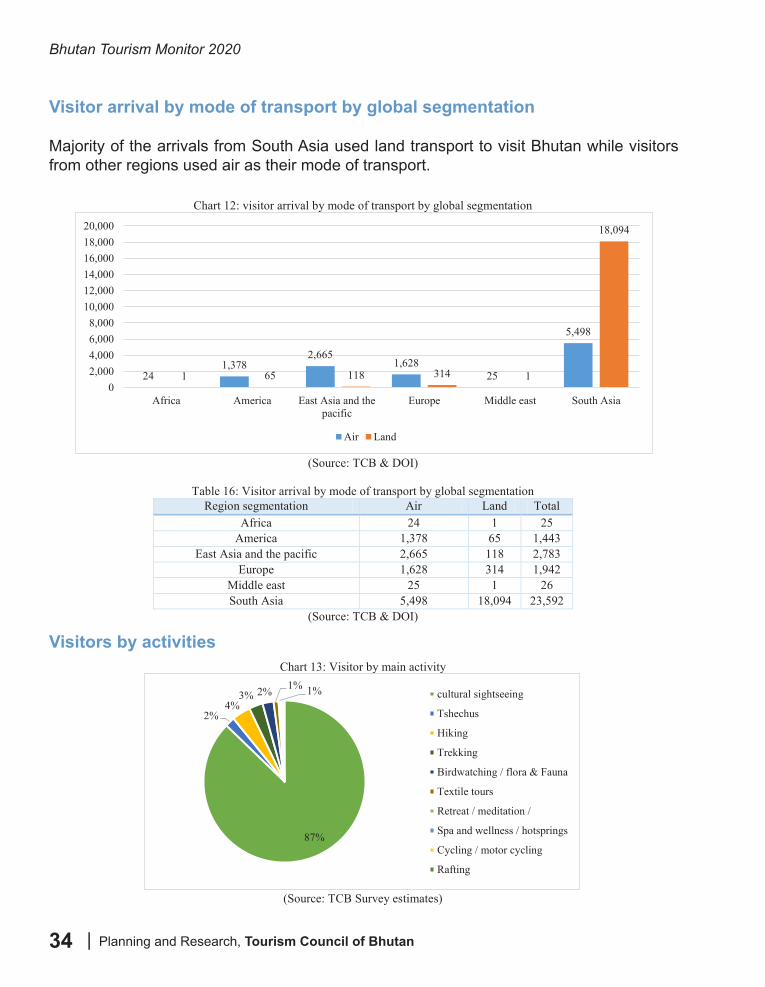
Majority of the arrivals from South Asia used land transport to visit Bhutan while visitors from other regions used air as their mode of transport.
Visitor arrival by mode of transport by global segmentation
Bhutan Tourism Monitor 2020 -------------------------------------------------------------------------------------------------------------------------------
--------------------------------------------------------------------------------------------------------------------- Planning and Research, Tourism Council of Bhutan 28
Chart 12: visitor arrival by mode of transport by global segmentation
(Source: TCB & DOI)
Table 16: Visitor arrival by mode of transport by global segmentation
Region segmentation Air Land Total Africa 24 1 25
America 1,378 65 1,443 East Asia and the pacific 2,665 118 2,783
Europe 1,628 314 1,942 Middle east 25 1 26 South Asia 5,498 18,094 23,592
(Source: TCB & DOI) Visitors by activities
Chart 13: Visitor by main activity
(Source: TCB Survey estimates)
About 87% of all visitor arrivals to Bhutan has undertaken some form of cultural sightseeing activity during their stay in Bhutan highlighting the importance and significance of the Bhutanese culture and tradition for tourism. There were fairly good number of visitors who undertook other
241,378
2,6651,628
25
5,498
1 65 118 314 1
18,094
02,0004,0006,0008,000
10,00012,00014,00016,00018,00020,000
Africa America East Asia and thepacific
Europe Middle east South Asia
Air Land
87%
2%4%
3% 2% 1% 1% cultural sightseeing
Tshechus
Hiking
Trekking
Birdwatching / flora & Fauna
Textile tours
Retreat / meditation /
Spa and wellness / hotsprings
Cycling / motor cycling
Rafting
Visitors by activities
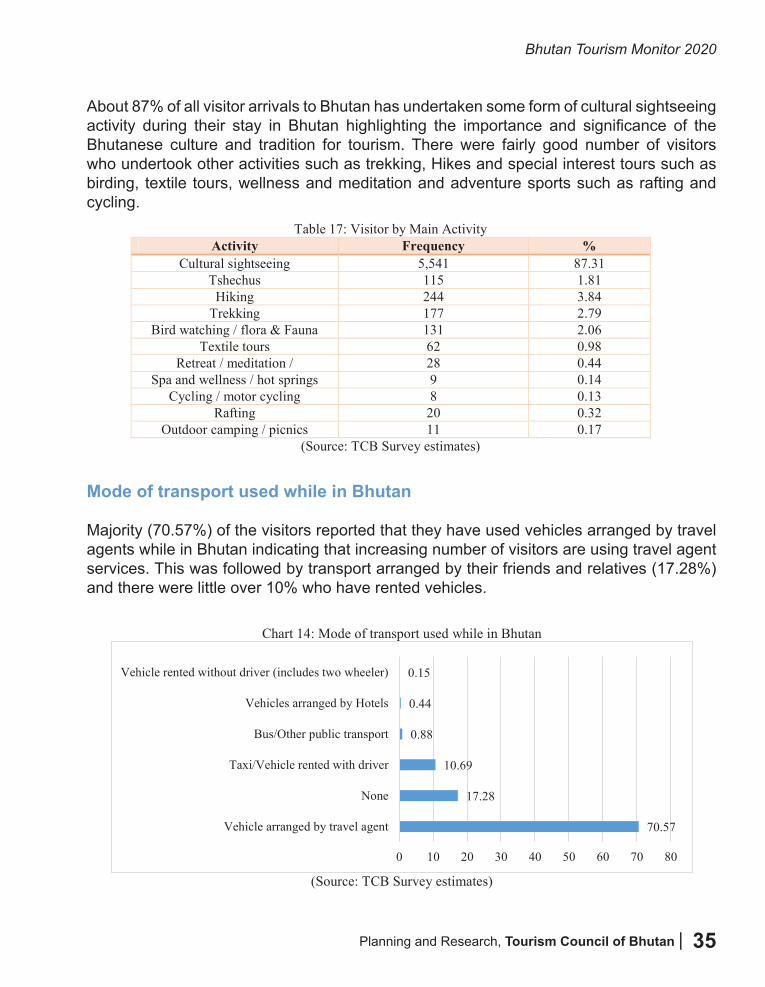
Planning and Research, Tourism Council of Bhutan |
Bhutan Tourism Monitor 2020
35
About 87% of all visitor arrivals to Bhutan has undertaken some form of cultural sightseeing activity during their stay in Bhutan highlighting the importance and significance of the Bhutanese culture and tradition for tourism. There were fairly good number of visitors who undertook other activities such as trekking, Hikes and special interest tours such as birding, textile tours, wellness and meditation and adventure sports such as rafting and cycling.
Mode of transport used while in Bhutan
Majority (70.57%) of the visitors reported that they have used vehicles arranged by travel agents while in Bhutan indicating that increasing number of visitors are using travel agent services. This was followed by transport arranged by their friends and relatives (17.28%) and there were little over 10% who have rented vehicles.
Bhutan Tourism Monitor 2020 -------------------------------------------------------------------------------------------------------------------------------
--------------------------------------------------------------------------------------------------------------------- Planning and Research, Tourism Council of Bhutan 29
activities such as trekking, Hikes and special interest tours such as birding, textile tours, wellness and meditation and adventure sports such as rafting and cycling.
Table 17: Visitor by Main Activity Activity Frequency %
Cultural sightseeing 5,541 87.31 Tshechus 115 1.81
Hiking 244 3.84 Trekking 177 2.79
Bird watching / flora & Fauna 131 2.06 Textile tours 62 0.98
Retreat / meditation / 28 0.44 Spa and wellness / hot springs 9 0.14
Cycling / motor cycling 8 0.13 Rafting 20 0.32
Outdoor camping / picnics 11 0.17 (Source: TCB Survey estimates)
Mode of transport used while in Bhutan Majority (70.57%) of the visitors reported that they have used vehicles arranged by travel agents while in Bhutan indicating that increasing number of visitors are using travel agent services. This was followed by transport arranged by their friends and relatives (17.28%) and there were little over 10% who have rented vehicles.
Chart 14: Mode of transport used while in Bhutan
(Source: TCB Survey estimates)
70.57
17.28
10.69
0.88
0.44
0.15
0 10 20 30 40 50 60 70 80
Vehicle arranged by travel agent
None
Taxi/Vehicle rented with driver
Bus/Other public transport
Vehicles arranged by Hotels
Vehicle rented without driver (includes two wheeler)
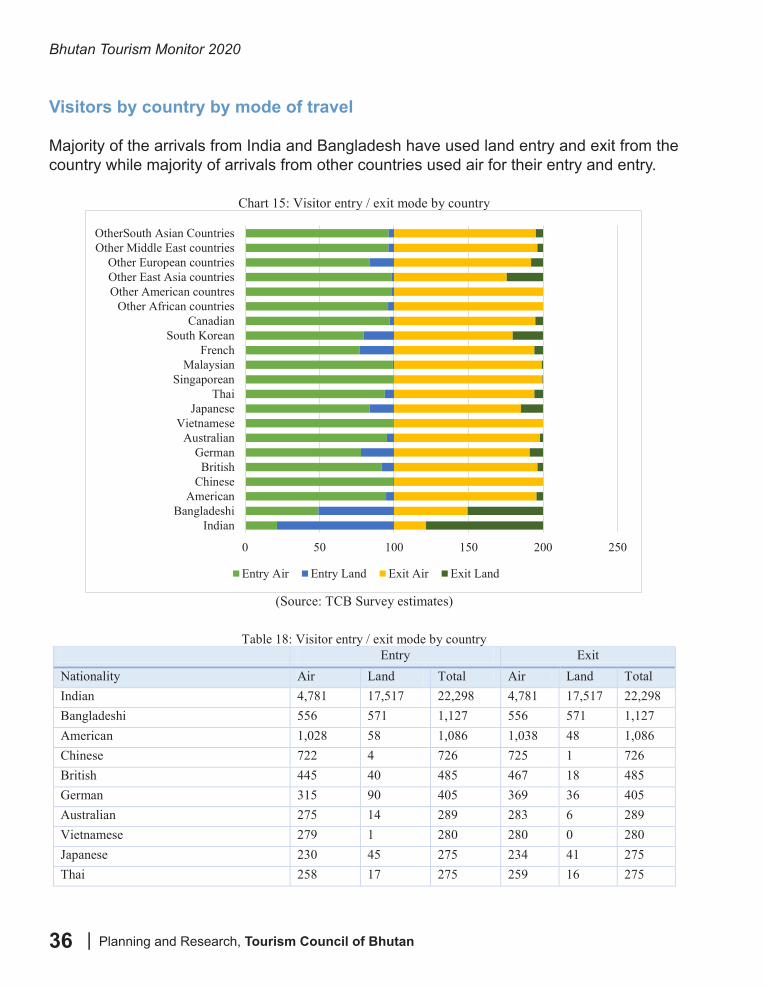
Bhutan Tourism Monitor 2020
| Planning and Research, Tourism Council of Bhutan36
Visitors by country by mode of travel
Majority of the arrivals from India and Bangladesh have used land entry and exit from the country while majority of arrivals from other countries used air for their entry and entry.
Bhutan Tourism Monitor 2020 -------------------------------------------------------------------------------------------------------------------------------
--------------------------------------------------------------------------------------------------------------------- Planning and Research, Tourism Council of Bhutan 30
Visitors by country by mode of travel Majority of the arrivals from India and Bangladesh have used land entry and exit from the country while majority of arrivals from other countries used air for their entry and entry.
Chart 15: Visitor entry / exit mode by country
(Source: TCB Survey estimates)
Table 18: Visitor entry / exit mode by country
Entry Exit Nationality Air Land Total Air Land Total Indian 4,781 17,517 22,298 4,781 17,517 22,298 Bangladeshi 556 571 1,127 556 571 1,127 American 1,028 58 1,086 1,038 48 1,086 Chinese 722 4 726 725 1 726 British 445 40 485 467 18 485 German 315 90 405 369 36 405 Australian 275 14 289 283 6 289 Vietnamese 279 1 280 280 0 280 Japanese 230 45 275 234 41 275 Thai 258 17 275 259 16 275 Singaporean 255 1 256 255 1 256 Malaysian 243 2 245 243 2 245 French 119 36 155 146 9 155 South Korean 113 29 142 113 29 142
0 50 100 150 200 250
IndianBangladeshi
AmericanChineseBritish
GermanAustralian
VietnameseJapanese
ThaiSingaporean
MalaysianFrench
South KoreanCanadian
Other African countriesOther American countresOther East Asia countriesOther European countries
Other Middle East countriesOtherSouth Asian Countries
Entry Air Entry Land Exit Air Exit Land
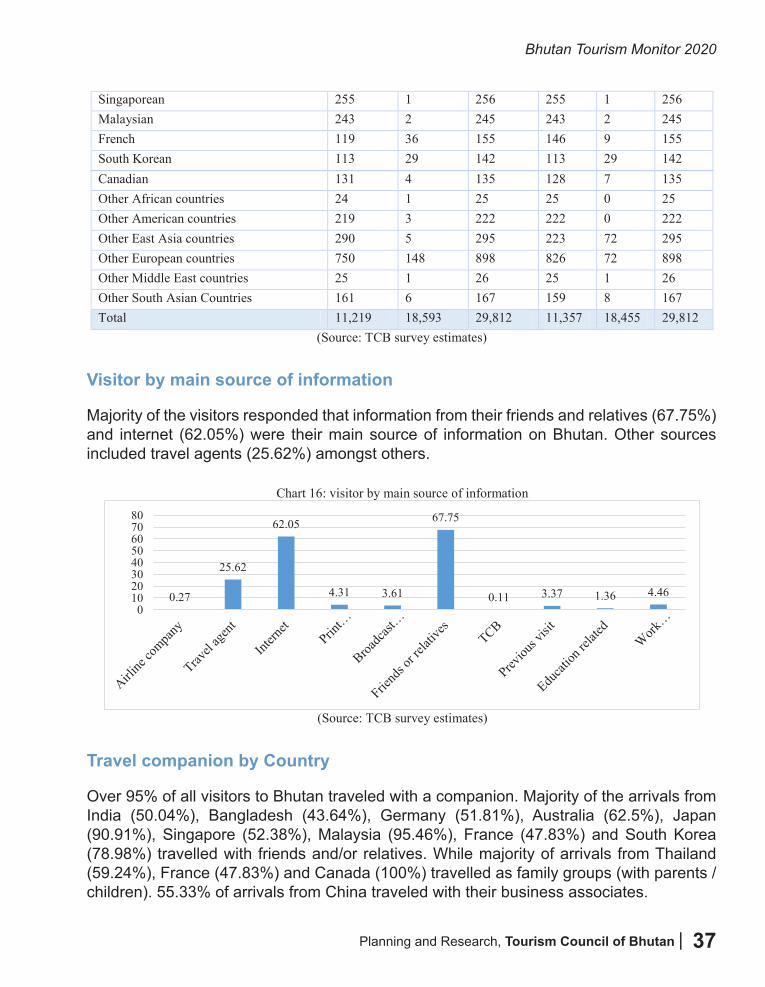
Planning and Research, Tourism Council of Bhutan |
Bhutan Tourism Monitor 2020
37
Bhutan Tourism Monitor 2020 -------------------------------------------------------------------------------------------------------------------------------
--------------------------------------------------------------------------------------------------------------------- Planning and Research, Tourism Council of Bhutan 31
Canadian 131 4 135 128 7 135 Other African countries 24 1 25 25 0 25 Other American countries 219 3 222 222 0 222 Other East Asia countries 290 5 295 223 72 295 Other European countries 750 148 898 826 72 898 Other Middle East countries 25 1 26 25 1 26 Other South Asian Countries 161 6 167 159 8 167 Total 11,219 18,593 29,812 11,357 18,455 29,812
(Source: TCB survey estimates) Visitor by main source of information Majority of the visitors responded that information from their friends and relatives (67.75%) and internet (62.05%) were their main source of information on Bhutan. Other sources included travel agents (25.62%) amongst others.
Chart 16: visitor by main source of information
(Source: TCB survey estimates)
Travel companion by Country Over 95% of all visitors to Bhutan traveled with a companion. Majority of the arrivals from India (50.04%), Bangladesh (43.64%), Germany (51.81%), Australia (62.5%), Japan (90.91%), Singapore (52.38%), Malaysia (95.46%), France (47.83%) and South Korea (78.98%) travelled with friends and/or relatives. While majority of arrivals from Thailand (59.24%), France (47.83%) and Canada (100%) travelled as family groups (with parents / children). 55.33% of arrivals from China traveled with their business associates.
0.27
25.62
62.05
4.31 3.61
67.75
0.11 3.37 1.36 4.460
1020304050607080
Bhutan Tourism Monitor 2020 -------------------------------------------------------------------------------------------------------------------------------
--------------------------------------------------------------------------------------------------------------------- Planning and Research, Tourism Council of Bhutan 30
Visitors by country by mode of travel Majority of the arrivals from India and Bangladesh have used land entry and exit from the country while majority of arrivals from other countries used air for their entry and entry.
Chart 15: Visitor entry / exit mode by country
(Source: TCB Survey estimates)
Table 18: Visitor entry / exit mode by country
Entry Exit Nationality Air Land Total Air Land Total Indian 4,781 17,517 22,298 4,781 17,517 22,298 Bangladeshi 556 571 1,127 556 571 1,127 American 1,028 58 1,086 1,038 48 1,086 Chinese 722 4 726 725 1 726 British 445 40 485 467 18 485 German 315 90 405 369 36 405 Australian 275 14 289 283 6 289 Vietnamese 279 1 280 280 0 280 Japanese 230 45 275 234 41 275 Thai 258 17 275 259 16 275 Singaporean 255 1 256 255 1 256 Malaysian 243 2 245 243 2 245 French 119 36 155 146 9 155 South Korean 113 29 142 113 29 142
0 50 100 150 200 250
IndianBangladeshi
AmericanChineseBritish
GermanAustralian
VietnameseJapanese
ThaiSingaporean
MalaysianFrench
South KoreanCanadian
Other African countriesOther American countresOther East Asia countriesOther European countries
Other Middle East countriesOtherSouth Asian Countries
Entry Air Entry Land Exit Air Exit Land
Visitor by main source of information
Majority of the visitors responded that information from their friends and relatives (67.75%) and internet (62.05%) were their main source of information on Bhutan. Other sources included travel agents (25.62%) amongst others.
Travel companion by Country
Over 95% of all visitors to Bhutan traveled with a companion. Majority of the arrivals from India (50.04%), Bangladesh (43.64%), Germany (51.81%), Australia (62.5%), Japan (90.91%), Singapore (52.38%), Malaysia (95.46%), France (47.83%) and South Korea (78.98%) travelled with friends and/or relatives. While majority of arrivals from Thailand (59.24%), France (47.83%) and Canada (100%) travelled as family groups (with parents / children). 55.33% of arrivals from China traveled with their business associates.
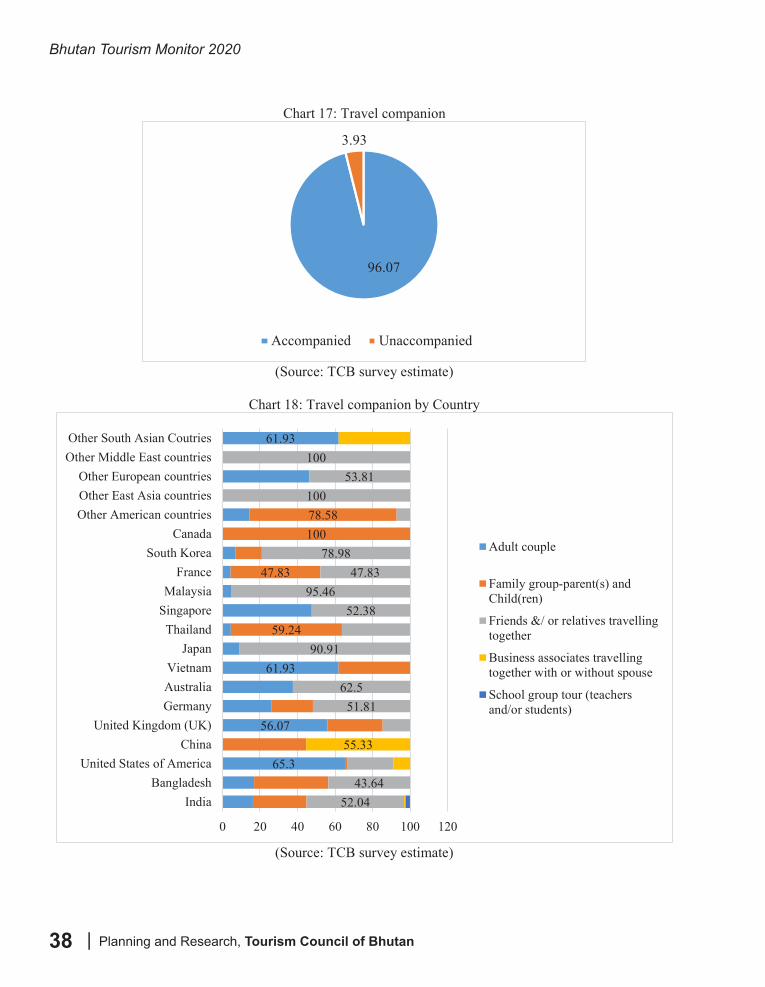
Bhutan Tourism Monitor 2020
| Planning and Research, Tourism Council of Bhutan38
Bhutan Tourism Monitor 2020 -------------------------------------------------------------------------------------------------------------------------------
--------------------------------------------------------------------------------------------------------------------- Planning and Research, Tourism Council of Bhutan 32
Chart 17: Travel companion
(Source: TCB survey estimate)
Chart 18: Travel companion by Country
(Source: TCB survey estimate)
96.07
3.93
Accompanied Unaccompanied
65.3
56.07
61.93
61.93
59.24
47.83
10078.58
52.0443.64
51.8162.5
90.91
52.3895.46
47.8378.98
10053.81
100
55.33
0 20 40 60 80 100 120
IndiaBangladesh
United States of AmericaChina
United Kingdom (UK)GermanyAustraliaVietnam
JapanThailand
SingaporeMalaysia
FranceSouth Korea
CanadaOther American countriesOther East Asia countriesOther European countries
Other Middle East countriesOther South Asian Coutries
Adult couple
Family group-parent(s) andChild(ren)
Friends &/ or relatives travellingtogether
Business associates travellingtogether with or without spouse
School group tour (teachersand/or students)
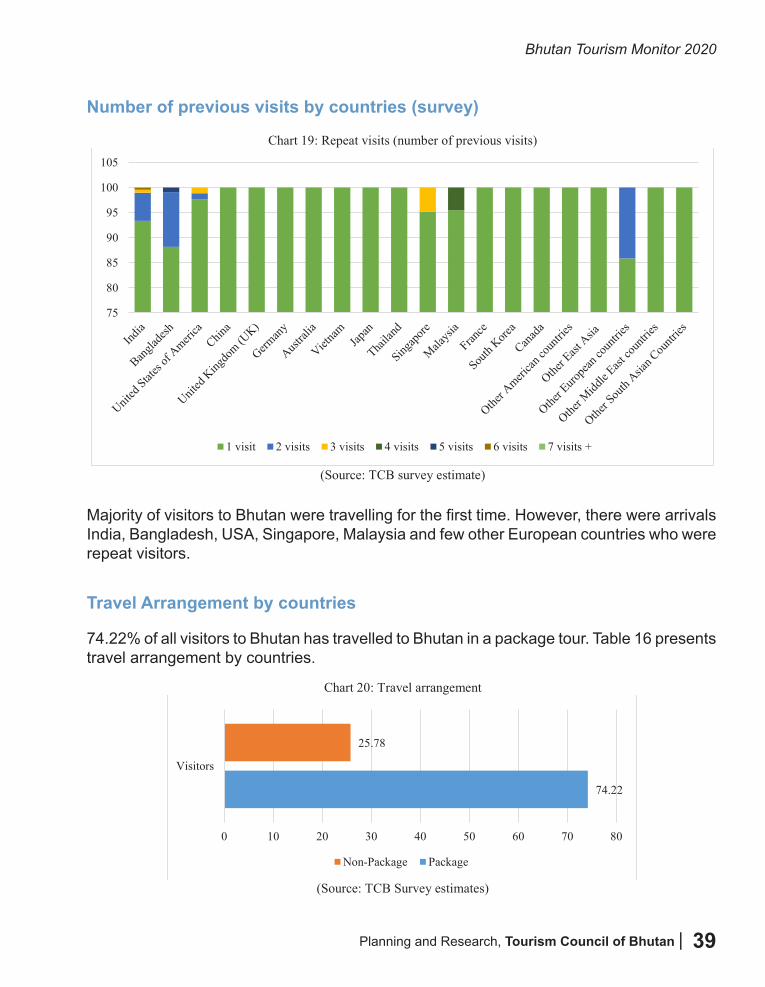
Planning and Research, Tourism Council of Bhutan |
Bhutan Tourism Monitor 2020
39
Number of previous visits by countries (survey)
Bhutan Tourism Monitor 2020 -------------------------------------------------------------------------------------------------------------------------------
--------------------------------------------------------------------------------------------------------------------- Planning and Research, Tourism Council of Bhutan 33
Number of previous visits by countries (survey)
Chart 19: Repeat visits (number of previous visits)
(Source: TCB survey estimate)
Majority of visitors to Bhutan were travelling for the first time. However, there were arrivals India, Bangladesh, USA, Singapore, Malaysia and few other European countries who were repeat visitors. Travel Arrangement by countries 74.22% of all visitors to Bhutan has travelled to Bhutan in a package tour. Table 16 presents travel arrangement by countries.
Chart 20: Travel arrangement
(Source: TCB Survey estimates)
75
80
85
90
95
100
105
1 visit 2 visits 3 visits 4 visits 5 visits 6 visits 7 visits +
74.22
25.78
0 10 20 30 40 50 60 70 80
Visitors
Non-Package Package
Majority of visitors to Bhutan were travelling for the first time. However, there were arrivals India, Bangladesh, USA, Singapore, Malaysia and few other European countries who were repeat visitors.
Travel Arrangement by countries
74.22% of all visitors to Bhutan has travelled to Bhutan in a package tour. Table 16 presents travel arrangement by countries.
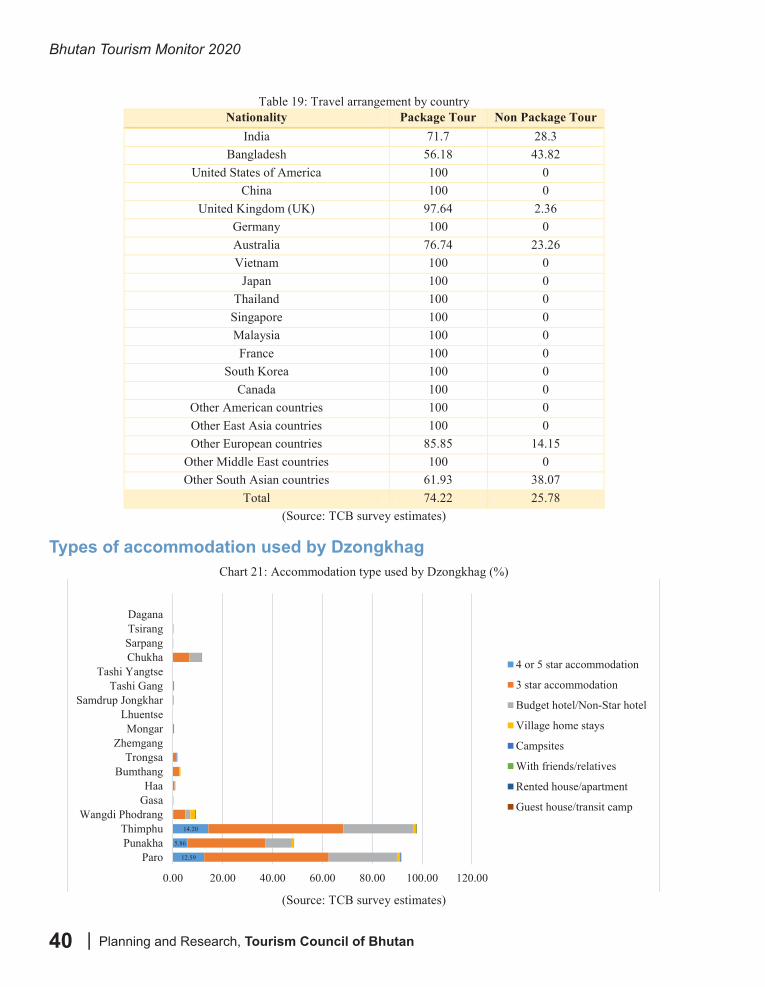
Bhutan Tourism Monitor 2020
| Planning and Research, Tourism Council of Bhutan40
Bhutan Tourism Monitor 2020 -------------------------------------------------------------------------------------------------------------------------------
--------------------------------------------------------------------------------------------------------------------- Planning and Research, Tourism Council of Bhutan 34
Table 19: Travel arrangement by country Nationality Package Tour Non Package Tour
India 71.7 28.3 Bangladesh 56.18 43.82
United States of America 100 0 China 100 0
United Kingdom (UK) 97.64 2.36 Germany 100 0 Australia 76.74 23.26 Vietnam 100 0
Japan 100 0 Thailand 100 0
Singapore 100 0 Malaysia 100 0 France 100 0
South Korea 100 0 Canada 100 0
Other American countries 100 0 Other East Asia countries 100 0 Other European countries 85.85 14.15
Other Middle East countries 100 0 Other South Asian countries 61.93 38.07
Total 74.22 25.78 (Source: TCB survey estimates)
Types of accommodation used by Dzongkhag Chart 21: Accommodation type used by Dzongkhag (%)
(Source: TCB survey estimates)
12.59
5.86
14.20
0.00 20.00 40.00 60.00 80.00 100.00 120.00
ParoPunakhaThimphu
Wangdi PhodrangGasaHaa
BumthangTrongsa
ZhemgangMongar
LhuentseSamdrup Jongkhar
Tashi GangTashi Yangtse
ChukhaSarpangTsirangDagana
4 or 5 star accommodation
3 star accommodation
Budget hotel/Non-Star hotel
Village home stays
Campsites
With friends/relatives
Rented house/apartment
Guest house/transit camp
Types of accommodation used by Dzongkhag
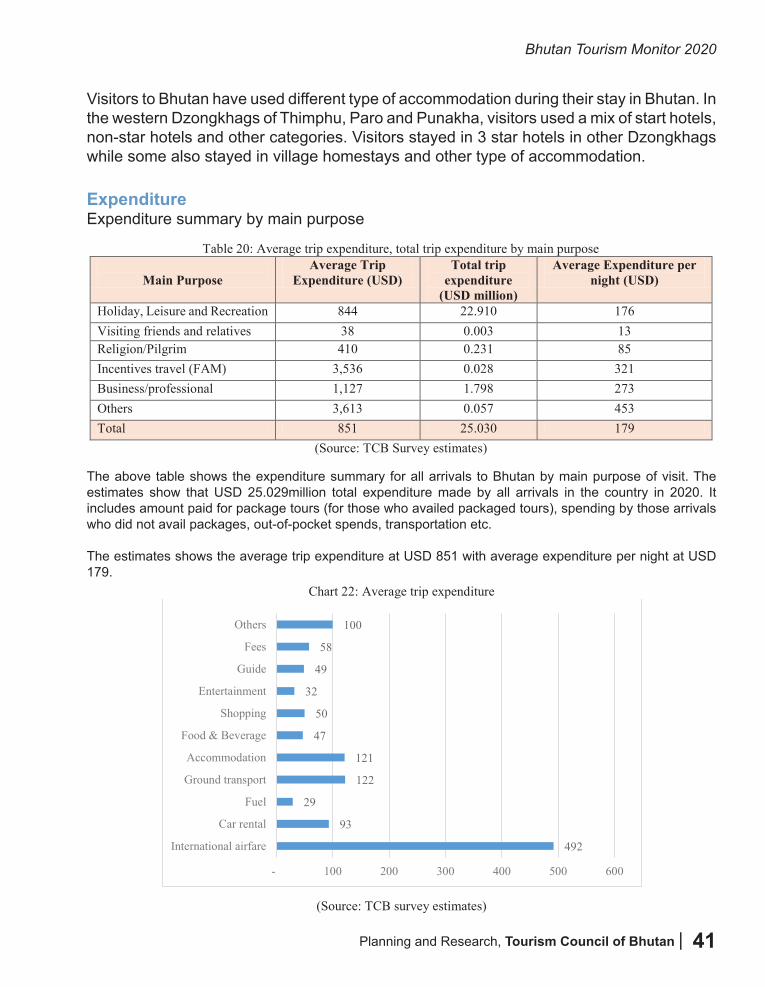
Planning and Research, Tourism Council of Bhutan |
Bhutan Tourism Monitor 2020
41
Visitors to Bhutan have used different type of accommodation during their stay in Bhutan. In the western Dzongkhags of Thimphu, Paro and Punakha, visitors used a mix of start hotels, non-star hotels and other categories. Visitors stayed in 3 star hotels in other Dzongkhags while some also stayed in village homestays and other type of accommodation.
ExpenditureExpenditure summary by main purpose
Bhutan Tourism Monitor 2020 -------------------------------------------------------------------------------------------------------------------------------
--------------------------------------------------------------------------------------------------------------------- Planning and Research, Tourism Council of Bhutan 35
Visitors to Bhutan have used different type of accommodation during their stay in Bhutan. In the western Dzongkhags of Thimphu, Paro and Punakha, visitors used a mix of start hotels, non-star hotels and other categories. Visitors stayed in 3 star hotels in other Dzongkhags while some also stayed in village homestays and other type of accommodation. Expenditure Expenditure summary by main purpose
Table 20: Average trip expenditure, total trip expenditure by main purpose
Main Purpose
Average Trip Expenditure (USD)
Total trip expenditure
(USD million)
Average Expenditure per night (USD)
Holiday, Leisure and Recreation 844 22.910 176 Visiting friends and relatives 38 0.003 13 Religion/Pilgrim 410 0.231 85 Incentives travel (FAM) 3,536 0.028 321 Business/professional 1,127 1.798 273 Others 3,613 0.057 453 Total 851 25.030 179
(Source: TCB Survey estimates)
The above table shows the expenditure summary for all arrivals to Bhutan by main purpose of visit. The estimates show that USD 25.029million total expenditure made by all arrivals in the country in 2020. It includes amount paid for package tours (for those who availed packaged tours), spending by those arrivals who did not avail packages, out-of-pocket spends, transportation etc. The estimates shows the average trip expenditure at USD 851 with average expenditure per night at USD 179. Average Expenditure
Chart 22: Average trip expenditure
(Source: TCB survey estimates)
492
93
29
122
121
47
50
32
49
58
100
- 100 200 300 400 500 600
International airfare
Car rental
Fuel
Ground transport
Accommodation
Food & Beverage
Shopping
Entertainment
Guide
Fees
Others
The above table shows the expenditure summary for all arrivals to Bhutan by main purpose of visit. The estimates show that USD 25.029million total expenditure made by all arrivals in the country in 2020. It includes amount paid for package tours (for those who availed packaged tours), spending by those arrivals who did not avail packages, out-of-pocket spends, transportation etc.
The estimates shows the average trip expenditure at USD 851 with average expenditure per night at USD 179.
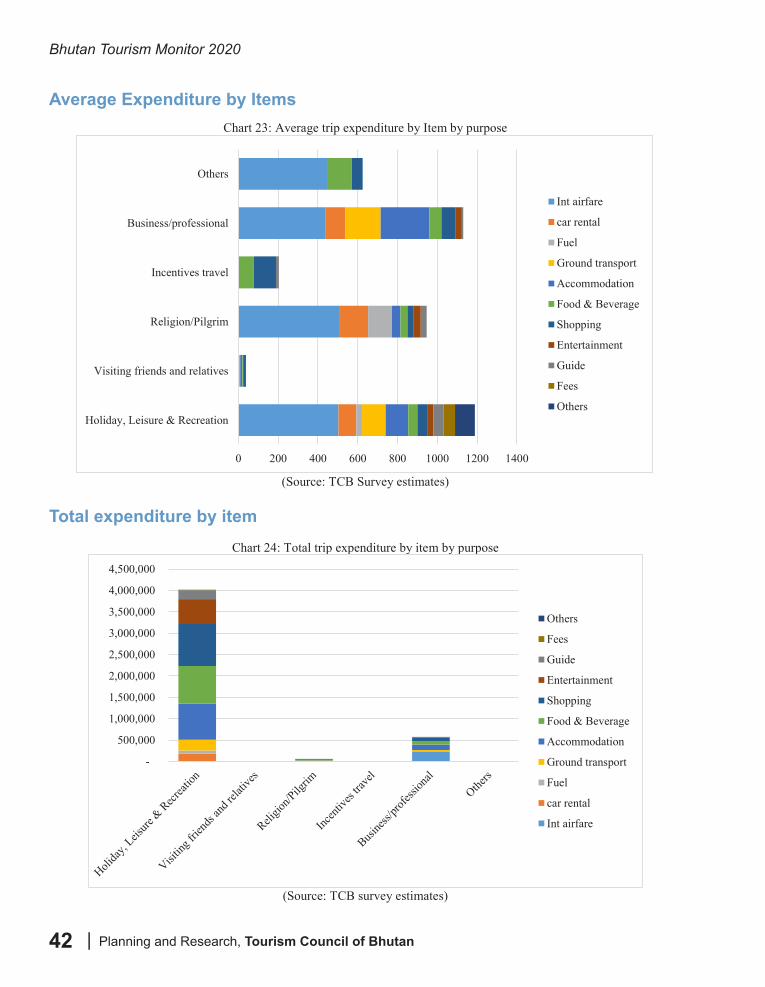
Bhutan Tourism Monitor 2020
| Planning and Research, Tourism Council of Bhutan42
Average Expenditure by Items
Total expenditure by item
Bhutan Tourism Monitor 2020 -------------------------------------------------------------------------------------------------------------------------------
--------------------------------------------------------------------------------------------------------------------- Planning and Research, Tourism Council of Bhutan 36
Average Expenditure by Items
Chart 23: Average trip expenditure by Item by purpose
(Source: TCB Survey estimates)
Total expenditure by item
Chart 24: Total trip expenditure by item by purpose
(Source: TCB survey estimates)
0 200 400 600 800 1000 1200 1400
Holiday, Leisure & Recreation
Visiting friends and relatives
Religion/Pilgrim
Incentives travel
Business/professional
Others
Int airfare
car rental
Fuel
Ground transport
Accommodation
Food & Beverage
Shopping
Entertainment
Guide
Fees
Others
-
500,000
1,000,000
1,500,000
2,000,000
2,500,000
3,000,000
3,500,000
4,000,000
4,500,000
Others
Fees
Guide
Entertainment
Shopping
Food & Beverage
Accommodation
Ground transport
Fuel
car rental
Int airfare
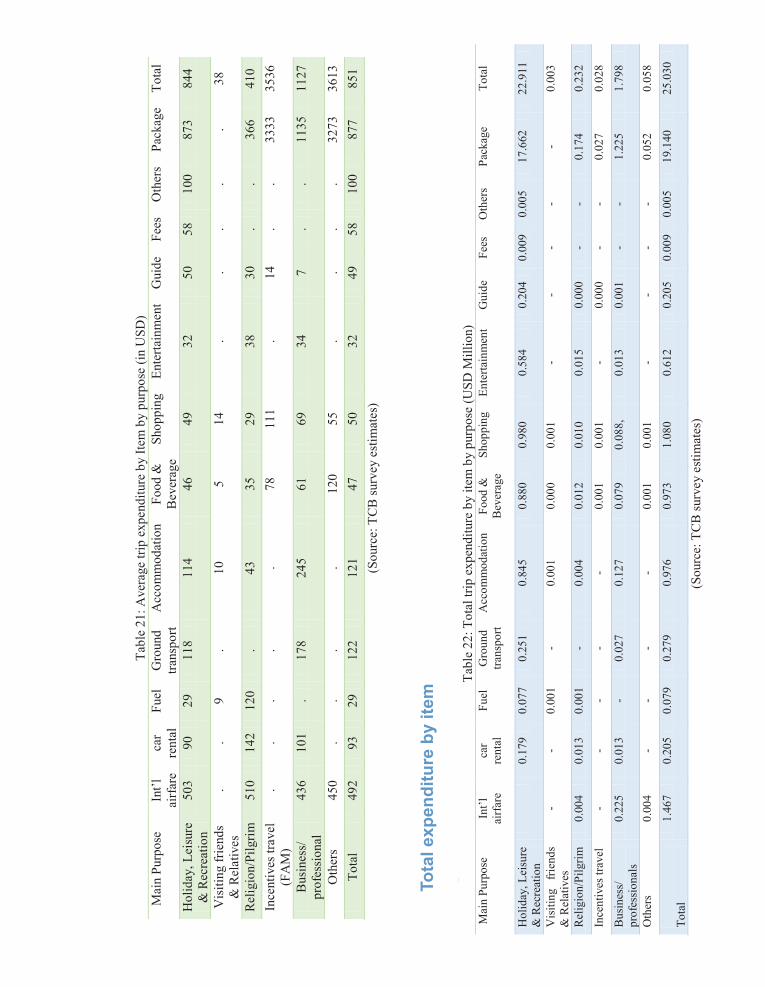
Planning and Research, Tourism Council of Bhutan |
Bhutan Tourism Monitor 2020
43
Bhu
tan
Tour
ism
Mon
itor 2
020
----
----
----
----
----
----
----
----
----
----
----
----
----
----
----
----
----
----
----
----
----
----
----
----
----
----
----
----
----
----
----
---
----
----
----
----
----
----
----
----
----
----
----
----
----
----
----
----
----
----
----
----
----
----
----
----
----
----
----
----
----
- Pl
anni
ng a
nd R
esea
rch,
Tou
rism
Cou
ncil
of B
huta
n
37
Tabl
e 21
: Ave
rage
trip
exp
endi
ture
by
Item
by
purp
ose
(in U
SD)
Mai
n Pu
rpos
e
Int’l
ai
rfar
e ca
r re
ntal
Fu
el
Gro
und
trans
port
Acc
omm
odat
ion
Food
&
Bev
erag
e Sh
oppi
ng
Ente
rtain
men
t G
uide
Fe
es
Oth
ers
Pack
age
Tota
l
Hol
iday
, Lei
sure
&
Rec
reat
ion
503
90
29
118
114
46
49
32
50
58
100
873
844
Vis
iting
frie
nds
& R
elat
ives
.
. 9
. 10
5
14
. .
. .
. 38
Rel
igio
n/Pi
lgrim
51
0 14
2 12
0 .
43
35
29
38
30
. .
366
410
Ince
ntiv
es tr
avel
(F
AM
) .
. .
. .
78
111
. 14
.
. 33
33
3536
Bus
ines
s/
prof
essi
onal
43
6 10
1 .
178
245
61
69
34
7 .
. 11
35
1127
Oth
ers
450
. .
. .
120
55
. .
. .
3273
36
13
Tota
l 49
2 93
29
12
2 12
1 47
50
32
49
58
10
0 87
7 85
1 (S
ourc
e: T
CB
surv
ey e
stim
ates
) To
tal e
xpen
ditu
re b
y ite
m
Tabl
e 22
: Tot
al tr
ip e
xpen
ditu
re b
y ite
m b
y pu
rpos
e (U
SD M
illio
n)
Mai
n Pu
rpos
e In
t’l
airfa
re
car
rent
al
Fuel
G
roun
d tra
nspo
rt A
ccom
mod
atio
n Fo
od &
B
ever
age
Shop
ping
En
terta
inm
ent
Gui
de
Fees
O
ther
s Pa
ckag
e To
tal
Hol
iday
, Lei
sure
&
Rec
reat
ion
0.
179
0.07
7 0.
251
0.84
5 0.
880
0.98
0 0.
584
0.20
4 0.
009
0.00
5 17
.662
22
.911
Vis
iting
fri
ends
&
Rel
ativ
es
- -
0.00
1 -
0.00
1 0.
000
0.00
1 -
- -
- -
0.00
3
Rel
igio
n/Pi
lgrim
0.
004
0.01
3 0.
001
- 0.
004
0.01
2 0.
010
0.01
5 0.
000
- -
0.17
4 0.
232
Ince
ntiv
es tr
avel
-
- -
- -
0.00
1 0.
001
- 0.
000
- -
0.02
7 0.
028
Bus
ines
s/
prof
essi
onal
s 0.
225
0.01
3 -
0.02
7 0.
127
0.07
9 0.
088,
0.
013
0.00
1 -
- 1.
225
1.79
8
Oth
ers
0.00
4 -
- -
- 0.
001
0.00
1 -
- -
- 0.
052
0.05
8
Tota
l 1.
467
0.20
5 0.
079
0.27
9 0.
976
0.97
3 1.
080
0.61
2 0.
205
0.00
9 0.
005
19.1
40
25.0
30
(Sou
rce:
TC
B su
rvey
est
imat
es)
Tota
l exp
endi
ture
by
item
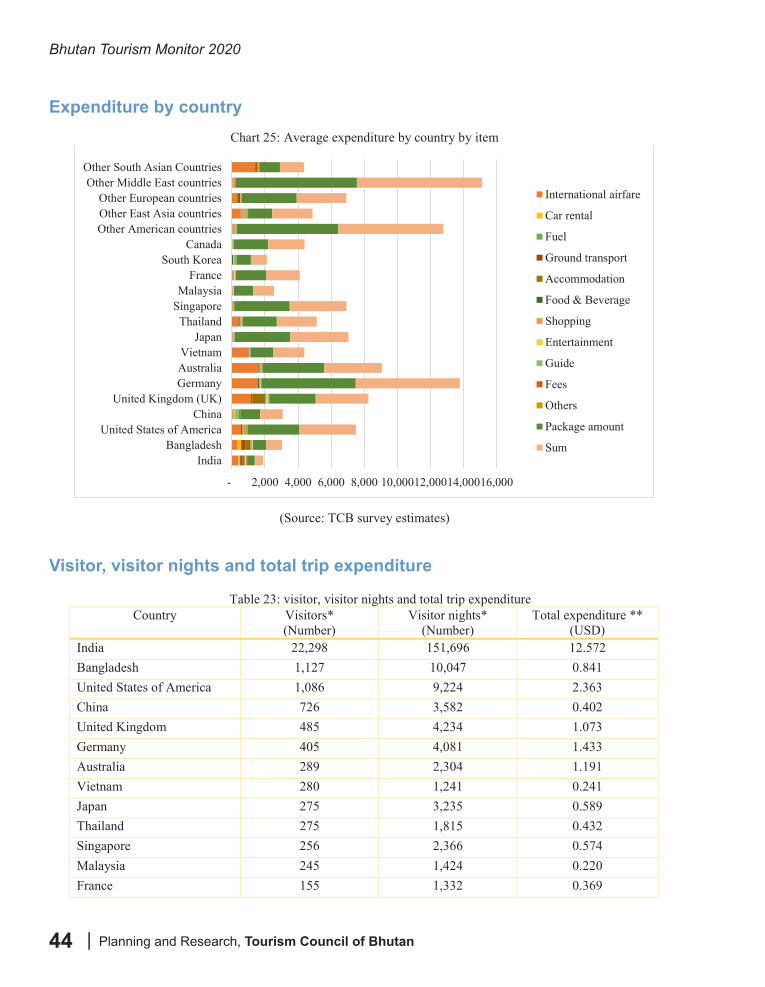
Bhutan Tourism Monitor 2020
| Planning and Research, Tourism Council of Bhutan44
Expenditure by country
Visitor, visitor nights and total trip expenditure
Bhutan Tourism Monitor 2020 -------------------------------------------------------------------------------------------------------------------------------
--------------------------------------------------------------------------------------------------------------------- Planning and Research, Tourism Council of Bhutan 38
Expenditure by country Chart 25: Average expenditure by country by item
(Source: TCB survey estimates)
Visitor, visitor nights and total trip expenditure
Table 23: visitor, visitor nights and total trip expenditure Country Visitors*
(Number) Visitor nights*
(Number) Total expenditure **
(USD) India 22,298 151,696 12.572 Bangladesh 1,127 10,047 0.841 United States of America 1,086 9,224 2.363 China 726 3,582 0.402 United Kingdom 485 4,234 1.073 Germany 405 4,081 1.433 Australia 289 2,304 1.191 Vietnam 280 1,241 0.241 Japan 275 3,235 0.589 Thailand 275 1,815 0.432 Singapore 256 2,366 0.574 Malaysia 245 1,424 0.220 France 155 1,332 0.369 South Korea 142 1,013 0.110 Canada 135 1,006 0.193 Other African countries 25 896 Other American countries 222 1,132 0.810
- 2,000 4,000 6,000 8,000 10,000 12,000 14,000 16,000
IndiaBangladesh
United States of AmericaChina
United Kingdom (UK)GermanyAustraliaVietnam
JapanThailand
SingaporeMalaysia
FranceSouth Korea
CanadaOther American countriesOther East Asia countriesOther European countries
Other Middle East countriesOther South Asian Countries
International airfare
Car rental
Fuel
Ground transport
Accommodation
Food & Beverage
Shopping
Entertainment
Guide
Fees
Others
Package amount
Sum
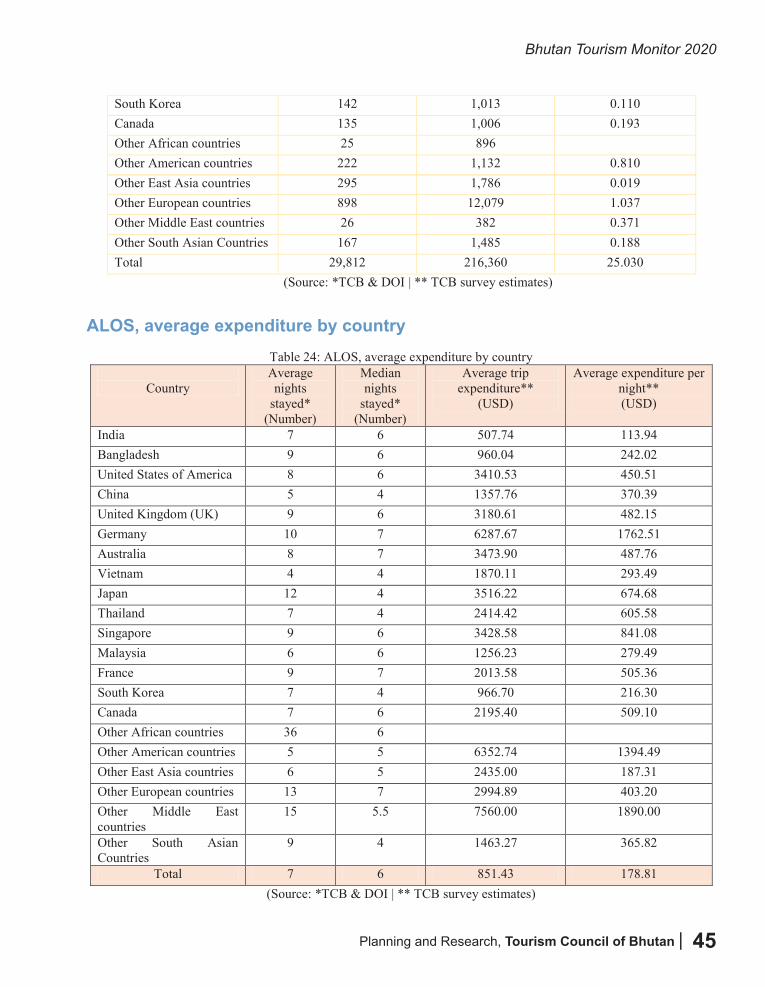
Planning and Research, Tourism Council of Bhutan |
Bhutan Tourism Monitor 2020
45
Bhutan Tourism Monitor 2020 -------------------------------------------------------------------------------------------------------------------------------
--------------------------------------------------------------------------------------------------------------------- Planning and Research, Tourism Council of Bhutan 39
Other East Asia countries 295 1,786 0.019 Other European countries 898 12,079 1.037 Other Middle East countries 26 382 0.371 Other South Asian Countries 167 1,485 0.188 Total 29,812 216,360 25.030
(Source: *TCB & DOI | ** TCB survey estimates) ALOS, average expenditure by country
Table 24: ALOS, average expenditure by country
Country
Average nights
stayed* (Number)
Median nights
stayed* (Number)
Average trip expenditure**
(USD)
Average expenditure per night** (USD)
India 7 6 507.74 113.94 Bangladesh 9 6 960.04 242.02 United States of America 8 6 3410.53 450.51 China 5 4 1357.76 370.39 United Kingdom (UK) 9 6 3180.61 482.15 Germany 10 7 6287.67 1762.51 Australia 8 7 3473.90 487.76 Vietnam 4 4 1870.11 293.49 Japan 12 4 3516.22 674.68 Thailand 7 4 2414.42 605.58 Singapore 9 6 3428.58 841.08 Malaysia 6 6 1256.23 279.49 France 9 7 2013.58 505.36 South Korea 7 4 966.70 216.30 Canada 7 6 2195.40 509.10 Other African countries 36 6 Other American countries 5 5 6352.74 1394.49 Other East Asia countries 6 5 2435.00 187.31 Other European countries 13 7 2994.89 403.20 Other Middle East countries
15 5.5 7560.00 1890.00
Other South Asian Countries
9 4 1463.27 365.82
Total 7 6 851.43 178.81 (Source: *TCB & DOI | ** TCB survey estimates)
Package Cost For the visitors who have availed package tours to Bhutan, the mean package cost is USD 877 per person and the median package is USD 425. The following chart presents the average package cost by country.
Bhutan Tourism Monitor 2020 -------------------------------------------------------------------------------------------------------------------------------
--------------------------------------------------------------------------------------------------------------------- Planning and Research, Tourism Council of Bhutan 38
Expenditure by country Chart 25: Average expenditure by country by item
(Source: TCB survey estimates)
Visitor, visitor nights and total trip expenditure
Table 23: visitor, visitor nights and total trip expenditure Country Visitors*
(Number) Visitor nights*
(Number) Total expenditure **
(USD) India 22,298 151,696 12.572 Bangladesh 1,127 10,047 0.841 United States of America 1,086 9,224 2.363 China 726 3,582 0.402 United Kingdom 485 4,234 1.073 Germany 405 4,081 1.433 Australia 289 2,304 1.191 Vietnam 280 1,241 0.241 Japan 275 3,235 0.589 Thailand 275 1,815 0.432 Singapore 256 2,366 0.574 Malaysia 245 1,424 0.220 France 155 1,332 0.369 South Korea 142 1,013 0.110 Canada 135 1,006 0.193 Other African countries 25 896 Other American countries 222 1,132 0.810
- 2,000 4,000 6,000 8,000 10,000 12,000 14,000 16,000
IndiaBangladesh
United States of AmericaChina
United Kingdom (UK)GermanyAustraliaVietnam
JapanThailand
SingaporeMalaysia
FranceSouth Korea
CanadaOther American countriesOther East Asia countriesOther European countries
Other Middle East countriesOther South Asian Countries
International airfare
Car rental
Fuel
Ground transport
Accommodation
Food & Beverage
Shopping
Entertainment
Guide
Fees
Others
Package amount
Sum
ALOS, average expenditure by country
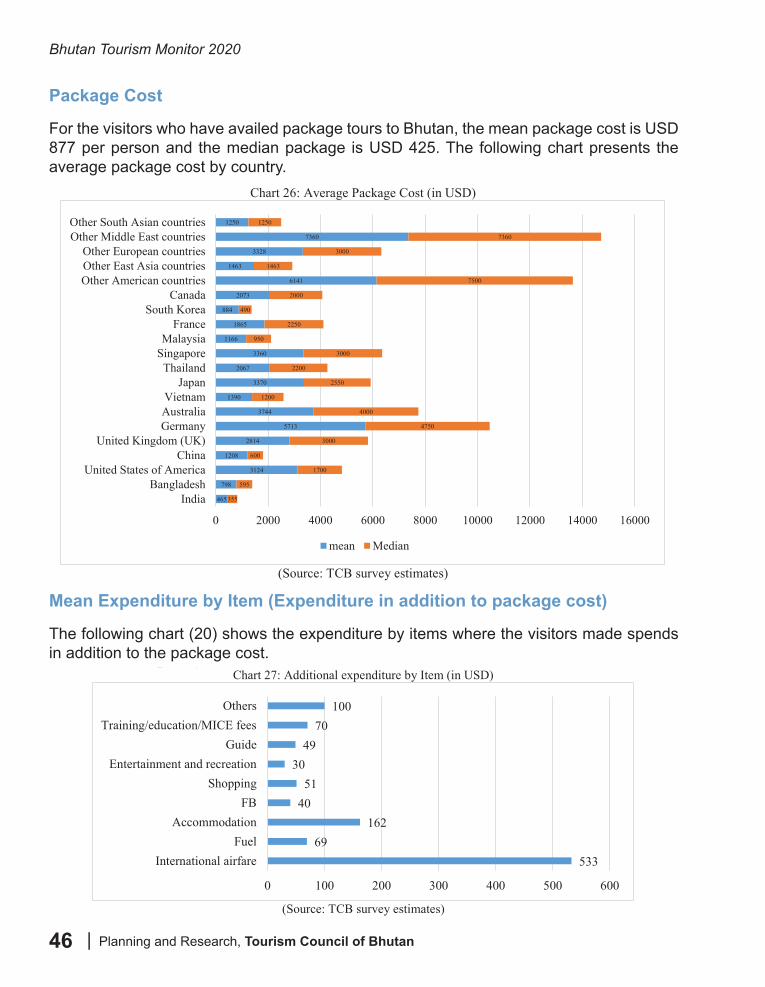
Bhutan Tourism Monitor 2020
| Planning and Research, Tourism Council of Bhutan46
Package Cost
For the visitors who have availed package tours to Bhutan, the mean package cost is USD 877 per person and the median package is USD 425. The following chart presents the average package cost by country.
Mean Expenditure by Item (Expenditure in addition to package cost)
The following chart (20) shows the expenditure by items where the visitors made spends in addition to the package cost.
Bhutan Tourism Monitor 2020 -------------------------------------------------------------------------------------------------------------------------------
--------------------------------------------------------------------------------------------------------------------- Planning and Research, Tourism Council of Bhutan 40
Chart 26: Average Package Cost (in USD)
(Source: TCB survey estimates)
Mean Expenditure by Item (Expenditure in addition to package cost) The following chart (20) shows the expenditure by items where the visitors made spends in addition to the package cost.
Chart 27: Additional expenditure by Item (in USD)
(Source: TCB survey estimates)
Average expenditure per person on major items for non-package For those arrivals who did not avail package tours (mainly visitors on official, business and others purpose), major expenditure were made on international airfare followed by accommodation and ground transport amongst others.
465
798
3124
1208
2814
5713
3744
1390
3370
2067
3360
1166
1865
884
2073
6141
1463
3328
7360
1250
355
595
1700
600
3000
4750
4000
1200
2550
2200
3000
950
2250
490
2000
7500
1463
3000
7360
1250
0 2000 4000 6000 8000 10000 12000 14000 16000
IndiaBangladesh
United States of AmericaChina
United Kingdom (UK)GermanyAustraliaVietnam
JapanThailand
SingaporeMalaysia
FranceSouth Korea
CanadaOther American countriesOther East Asia countriesOther European countries
Other Middle East countriesOther South Asian countries
mean Median
53369
1624051
3049
70100
0 100 200 300 400 500 600
International airfareFuel
AccommodationFB
ShoppingEntertainment and recreation
GuideTraining/education/MICE fees
Others
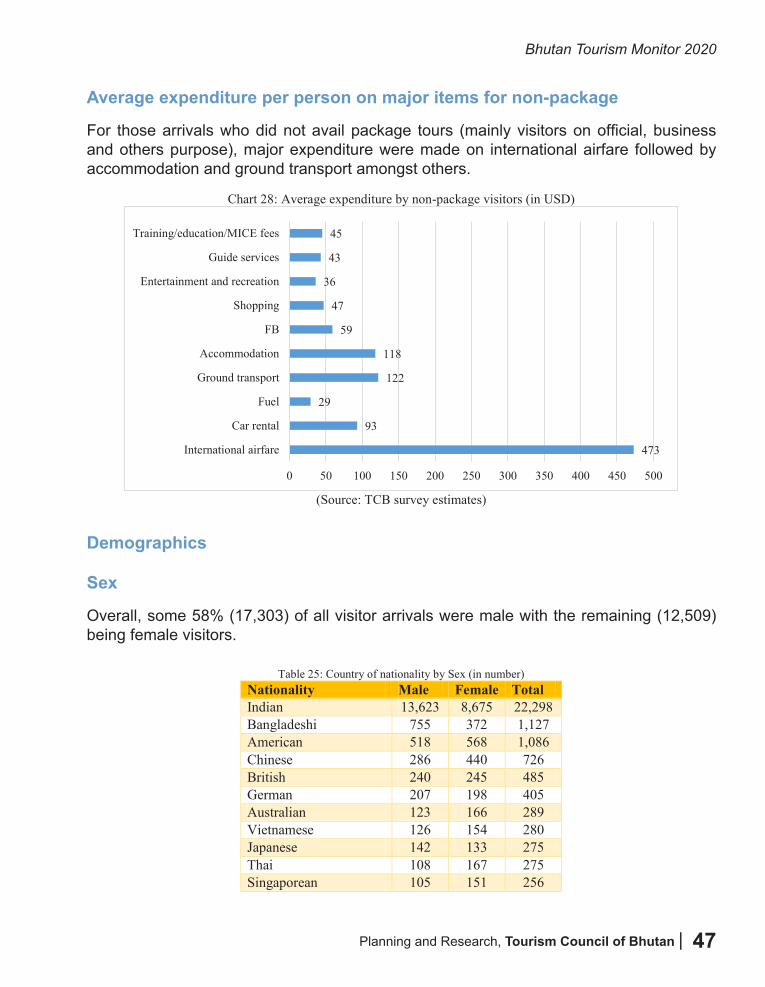
Planning and Research, Tourism Council of Bhutan |
Bhutan Tourism Monitor 2020
47
Average expenditure per person on major items for non-package
For those arrivals who did not avail package tours (mainly visitors on official, business and others purpose), major expenditure were made on international airfare followed by accommodation and ground transport amongst others.
Bhutan Tourism Monitor 2020 -------------------------------------------------------------------------------------------------------------------------------
--------------------------------------------------------------------------------------------------------------------- Planning and Research, Tourism Council of Bhutan 41
Chart 28: Average expenditure by non-package visitors (in USD)
(Source: TCB survey estimates)
Demographics Sex Overall, some 58% (17,303) of all visitor arrivals were male with the remaining (12,509) being female visitors.
Table 25: Country of nationality by Sex (in number) Nationality Male Female Total Indian 13,623 8,675 22,298 Bangladeshi 755 372 1,127 American 518 568 1,086 Chinese 286 440 726 British 240 245 485 German 207 198 405 Australian 123 166 289 Vietnamese 126 154 280 Japanese 142 133 275 Thai 108 167 275 Singaporean 105 151 256 Malaysian 89 156 245 French 79 76 155 South Korean 62 80 142 Canadian 58 77 135 Other African countries 10 15 25 Other American countries
82 140 222
473
93
29
122
118
59
47
36
43
45
0 50 100 150 200 250 300 350 400 450 500
International airfare
Car rental
Fuel
Ground transport
Accommodation
FB
Shopping
Entertainment and recreation
Guide services
Training/education/MICE fees Bhutan Tourism Monitor 2020 -------------------------------------------------------------------------------------------------------------------------------
--------------------------------------------------------------------------------------------------------------------- Planning and Research, Tourism Council of Bhutan 41
Chart 28: Average expenditure by non-package visitors (in USD)
(Source: TCB survey estimates)
Demographics Sex Overall, some 58% (17,303) of all visitor arrivals were male with the remaining (12,509) being female visitors.
Table 25: Country of nationality by Sex (in number) Nationality Male Female Total Indian 13,623 8,675 22,298 Bangladeshi 755 372 1,127 American 518 568 1,086 Chinese 286 440 726 British 240 245 485 German 207 198 405 Australian 123 166 289 Vietnamese 126 154 280 Japanese 142 133 275 Thai 108 167 275 Singaporean 105 151 256 Malaysian 89 156 245 French 79 76 155 South Korean 62 80 142 Canadian 58 77 135 Other African countries 10 15 25 Other American countries
82 140 222
473
93
29
122
118
59
47
36
43
45
0 50 100 150 200 250 300 350 400 450 500
International airfare
Car rental
Fuel
Ground transport
Accommodation
FB
Shopping
Entertainment and recreation
Guide services
Training/education/MICE fees
Demographics
Sex
Overall, some 58% (17,303) of all visitor arrivals were male with the remaining (12,509) being female visitors.
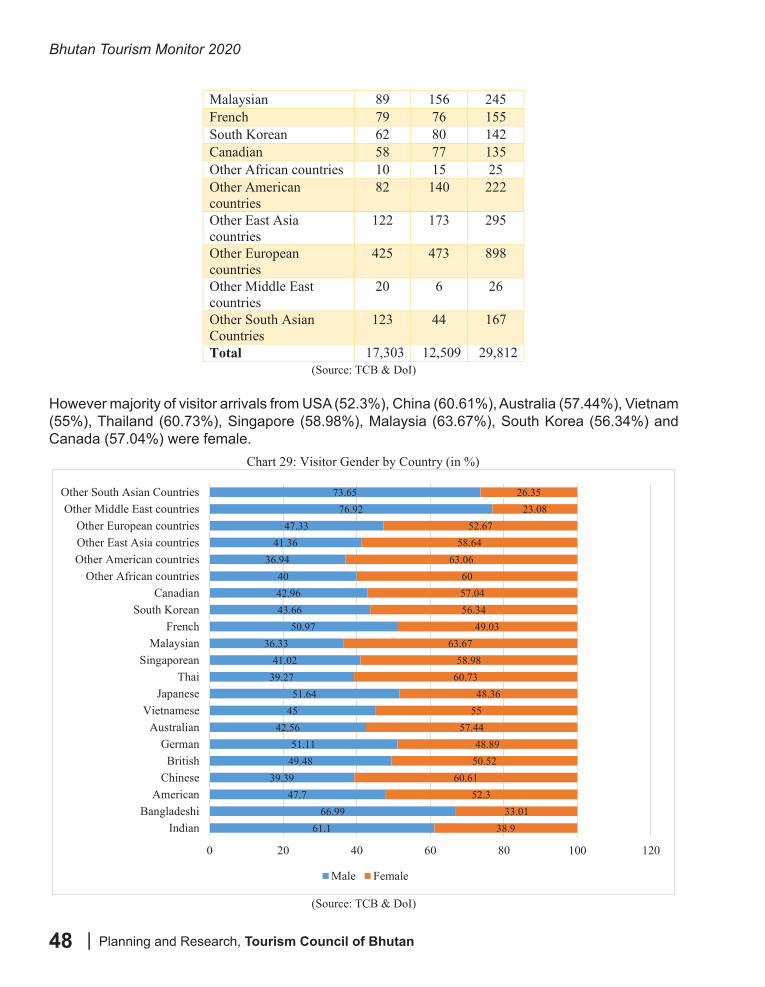
Bhutan Tourism Monitor 2020
| Planning and Research, Tourism Council of Bhutan48
Bhutan Tourism Monitor 2020 -------------------------------------------------------------------------------------------------------------------------------
--------------------------------------------------------------------------------------------------------------------- Planning and Research, Tourism Council of Bhutan 41
Chart 28: Average expenditure by non-package visitors (in USD)
(Source: TCB survey estimates)
Demographics Sex Overall, some 58% (17,303) of all visitor arrivals were male with the remaining (12,509) being female visitors.
Table 25: Country of nationality by Sex (in number) Nationality Male Female Total Indian 13,623 8,675 22,298 Bangladeshi 755 372 1,127 American 518 568 1,086 Chinese 286 440 726 British 240 245 485 German 207 198 405 Australian 123 166 289 Vietnamese 126 154 280 Japanese 142 133 275 Thai 108 167 275 Singaporean 105 151 256 Malaysian 89 156 245 French 79 76 155 South Korean 62 80 142 Canadian 58 77 135 Other African countries 10 15 25 Other American countries
82 140 222
473
93
29
122
118
59
47
36
43
45
0 50 100 150 200 250 300 350 400 450 500
International airfare
Car rental
Fuel
Ground transport
Accommodation
FB
Shopping
Entertainment and recreation
Guide services
Training/education/MICE fees
Bhutan Tourism Monitor 2020 -------------------------------------------------------------------------------------------------------------------------------
--------------------------------------------------------------------------------------------------------------------- Planning and Research, Tourism Council of Bhutan 42
Other East Asia countries
122 173 295
Other European countries
425 473 898
Other Middle East countries
20 6 26
Other South Asian Countries
123 44 167
Total 17,303 12,509 29,812 (Source: TCB survey estimates)
However majority of visitor arrivals from USA (52.3%), China (60.61%), Australia (57.44%), Vietnam (55%), Thailand (60.73%), Singapore (58.98%), Malaysia (63.67%), South Korea (56.34%) and Canada (57.04%) were female.
Chart 29: Visitor Gender by Country (in %)
(Source: TCB survey estimates)
61.166.99
47.739.39
49.4851.11
42.564551.64
39.2741.02
36.3350.97
43.6642.9640
36.9441.36
47.3376.92
73.65
38.933.01
52.360.61
50.5248.89
57.4455
48.3660.7358.98
63.6749.03
56.3457.0460
63.0658.64
52.6723.08
26.35
0 20 40 60 80 100 120
IndianBangladeshi
AmericanChineseBritish
GermanAustralian
VietnameseJapanese
ThaiSingaporean
MalaysianFrench
South KoreanCanadian
Other African countriesOther American countriesOther East Asia countriesOther European countries
Other Middle East countriesOther South Asian Countries
Male Female
However majority of visitor arrivals from USA (52.3%), China (60.61%), Australia (57.44%), Vietnam (55%), Thailand (60.73%), Singapore (58.98%), Malaysia (63.67%), South Korea (56.34%) and Canada (57.04%) were female.
Bhutan Tourism Monitor 2020 -------------------------------------------------------------------------------------------------------------------------------
--------------------------------------------------------------------------------------------------------------------- Planning and Research, Tourism Council of Bhutan 42
Other East Asia countries
122 173 295
Other European countries
425 473 898
Other Middle East countries
20 6 26
Other South Asian Countries
123 44 167
Total 17,303 12,509 29,812 (Source: TCB survey estimates)
However majority of visitor arrivals from USA (52.3%), China (60.61%), Australia (57.44%), Vietnam (55%), Thailand (60.73%), Singapore (58.98%), Malaysia (63.67%), South Korea (56.34%) and Canada (57.04%) were female.
Chart 29: Visitor Gender by Country (in %)
(Source: TCB survey estimates)
61.166.99
47.739.39
49.4851.11
42.564551.64
39.2741.02
36.3350.97
43.6642.9640
36.9441.36
47.3376.92
73.65
38.933.01
52.360.61
50.5248.89
57.4455
48.3660.7358.98
63.6749.03
56.3457.0460
63.0658.64
52.6723.08
26.35
0 20 40 60 80 100 120
IndianBangladeshi
AmericanChineseBritish
GermanAustralian
VietnameseJapanese
ThaiSingaporean
MalaysianFrench
South KoreanCanadian
Other African countriesOther American countriesOther East Asia countriesOther European countries
Other Middle East countriesOther South Asian Countries
Male Female
(Source: TCB & DoI)
(Source: TCB & DoI)
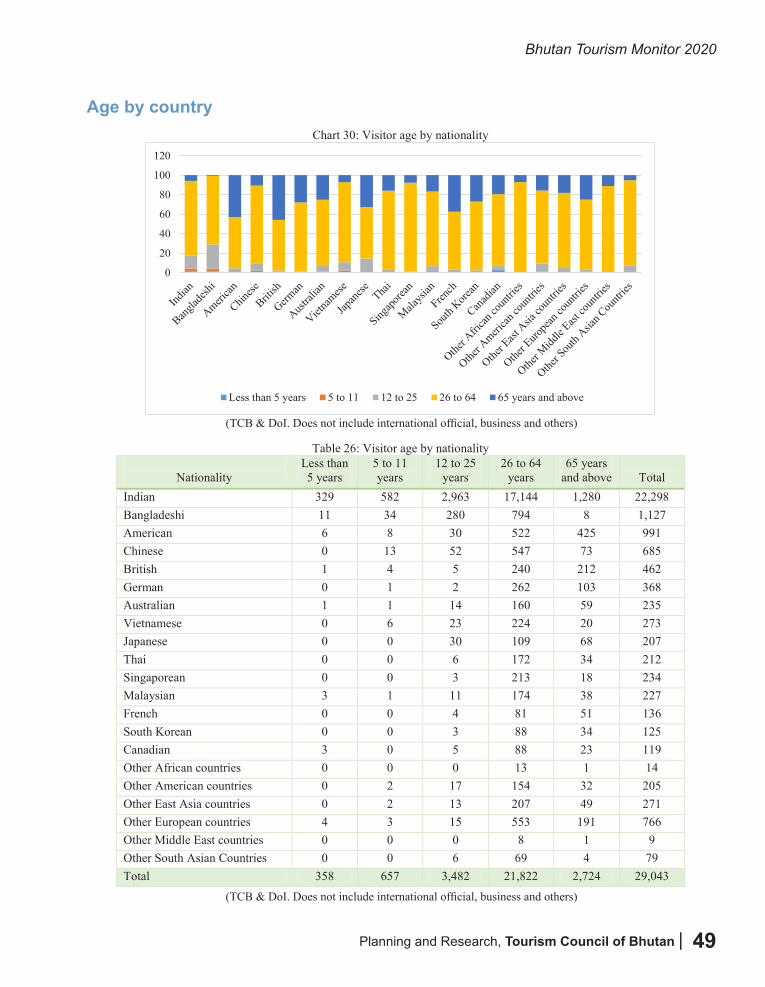
Planning and Research, Tourism Council of Bhutan |
Bhutan Tourism Monitor 2020
49
Bhutan Tourism Monitor 2020 -------------------------------------------------------------------------------------------------------------------------------
--------------------------------------------------------------------------------------------------------------------- Planning and Research, Tourism Council of Bhutan 43
Age by country Chart 30: Visitor age by nationality
(Source: TCB survey estimates)
Table 26: Visitor age by nationality
Nationality Less than 5 years
5 to 11 years
12 to 25 years
26 to 64 years
65 years and above
Total
Indian 329 582 2,963 17,144 1,280 22,298 Bangladeshi 11 34 280 794 8 1,127 American 6 8 30 522 425 991 Chinese 0 13 52 547 73 685 British 1 4 5 240 212 462 German 0 1 2 262 103 368 Australian 1 1 14 160 59 235 Vietnamese 0 6 23 224 20 273 Japanese 0 0 30 109 68 207 Thai 0 0 6 172 34 212 Singaporean 0 0 3 213 18 234 Malaysian 3 1 11 174 38 227 French 0 0 4 81 51 136 South Korean 0 0 3 88 34 125 Canadian 3 0 5 88 23 119 Other African countries 0 0 0 13 1 14 Other American countries 0 2 17 154 32 205 Other East Asia countries 0 2 13 207 49 271 Other European countries 4 3 15 553 191 766 Other Middle East countries 0 0 0 8 1 9 Other South Asian Countries 0 0 6 69 4 79 Total 358 657 3,482 21,822 2,724 29,043
(Source: TCB survey estimates)
0
20
40
60
80
100
120
Less than 5 years 5 to 11 12 to 25 26 to 64 65 years and above
Age by country
(TCB & DoI. Does not include international official, business and others)
(TCB & DoI. Does not include international official, business and others)
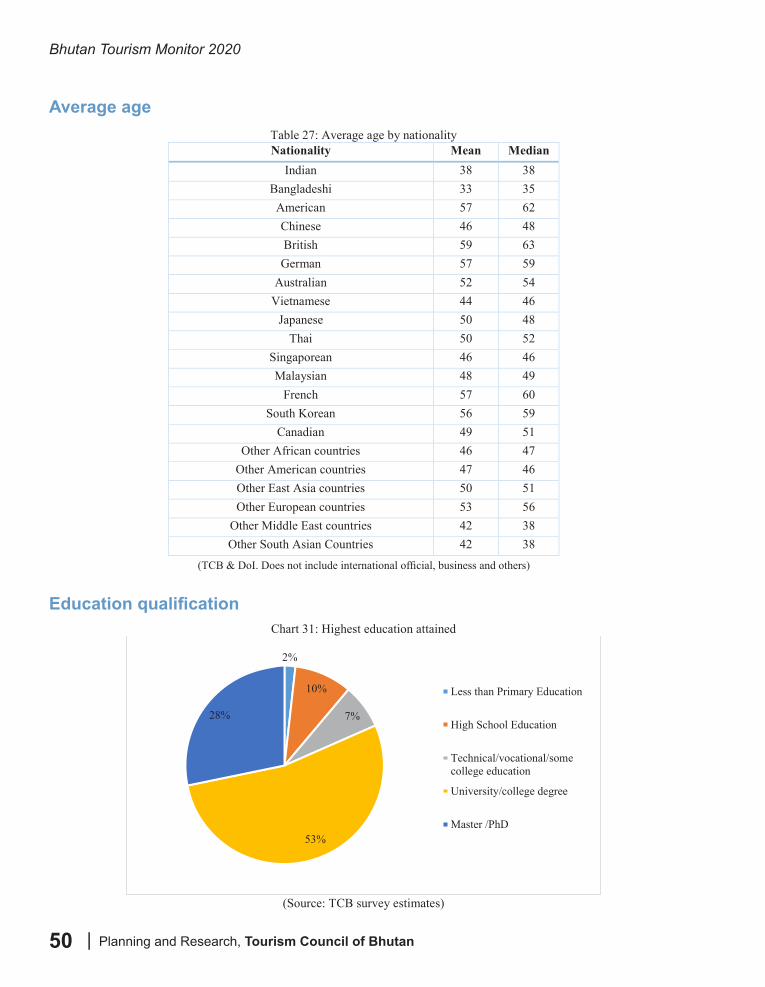
Bhutan Tourism Monitor 2020
| Planning and Research, Tourism Council of Bhutan50
Average age
Education qualification
Bhutan Tourism Monitor 2020 -------------------------------------------------------------------------------------------------------------------------------
--------------------------------------------------------------------------------------------------------------------- Planning and Research, Tourism Council of Bhutan 44
Average age Table 27: Average age by nationality Nationality Mean Median
Indian 38 38 Bangladeshi 33 35 American 57 62 Chinese 46 48 British 59 63 German 57 59
Australian 52 54 Vietnamese 44 46
Japanese 50 48 Thai 50 52
Singaporean 46 46 Malaysian 48 49
French 57 60 South Korean 56 59
Canadian 49 51 Other African countries 46 47
Other American countries 47 46 Other East Asia countries 50 51 Other European countries 53 56
Other Middle East countries 42 38 Other South Asian Countries 42 38
(Source: TCB Survey estimate) Education qualification
Chart 31: Highest education attained
(Source: TCB survey estimates)
2%
10%
7%
53%
28%
Less than Primary Education
High School Education
Technical/vocational/somecollege education
University/college degree
Master /PhD
(TCB & DoI. Does not include international official, business and others)
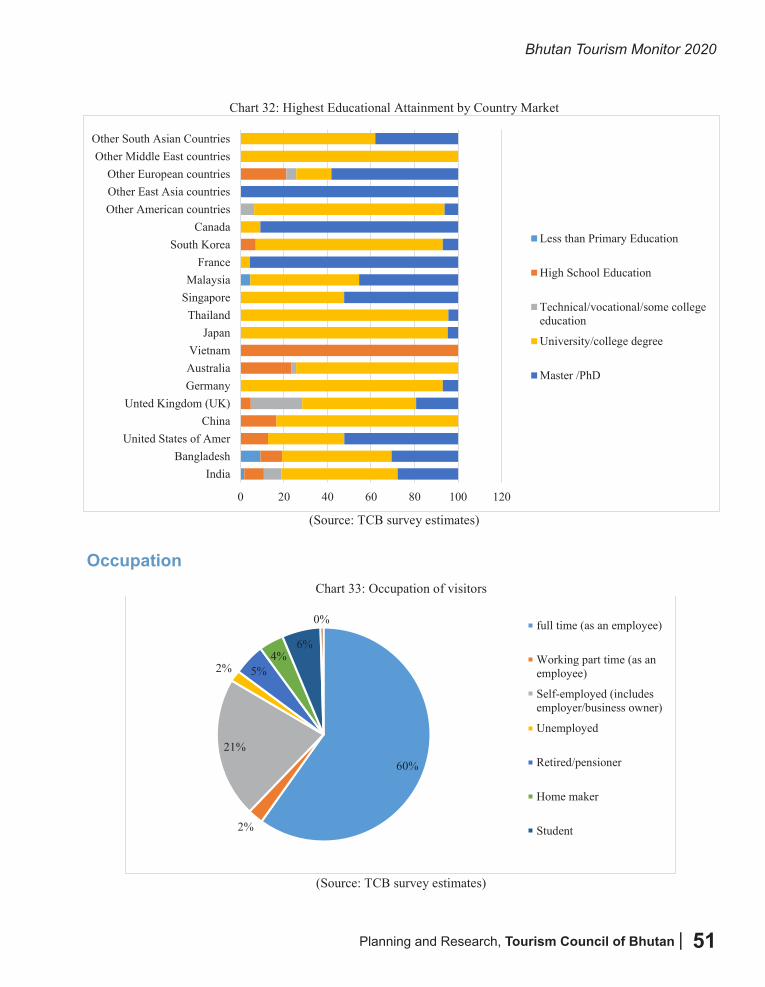
Planning and Research, Tourism Council of Bhutan |
Bhutan Tourism Monitor 2020
51
Bhutan Tourism Monitor 2020 -------------------------------------------------------------------------------------------------------------------------------
--------------------------------------------------------------------------------------------------------------------- Planning and Research, Tourism Council of Bhutan 45
Chart 32: Highest Educational Attainment by Country Market
(Source: TCB survey estimates)
Occupation
Chart 33: Occupation of visitors
(Source: TCB survey estimates)
0 20 40 60 80 100 120
IndiaBangladesh
United States of AmerChina
Unted Kingdom (UK)GermanyAustraliaVietnam
JapanThailand
SingaporeMalaysia
FranceSouth Korea
CanadaOther American countriesOther East Asia countriesOther European countries
Other Middle East countriesOther South Asian Countries
Less than Primary Education
High School Education
Technical/vocational/some collegeeducation
University/college degree
Master /PhD
60%
2%
21%
2% 5%4%
6%
0% full time (as an employee)
Working part time (as anemployee)
Self-employed (includesemployer/business owner)
Unemployed
Retired/pensioner
Home maker
Student
Occupation
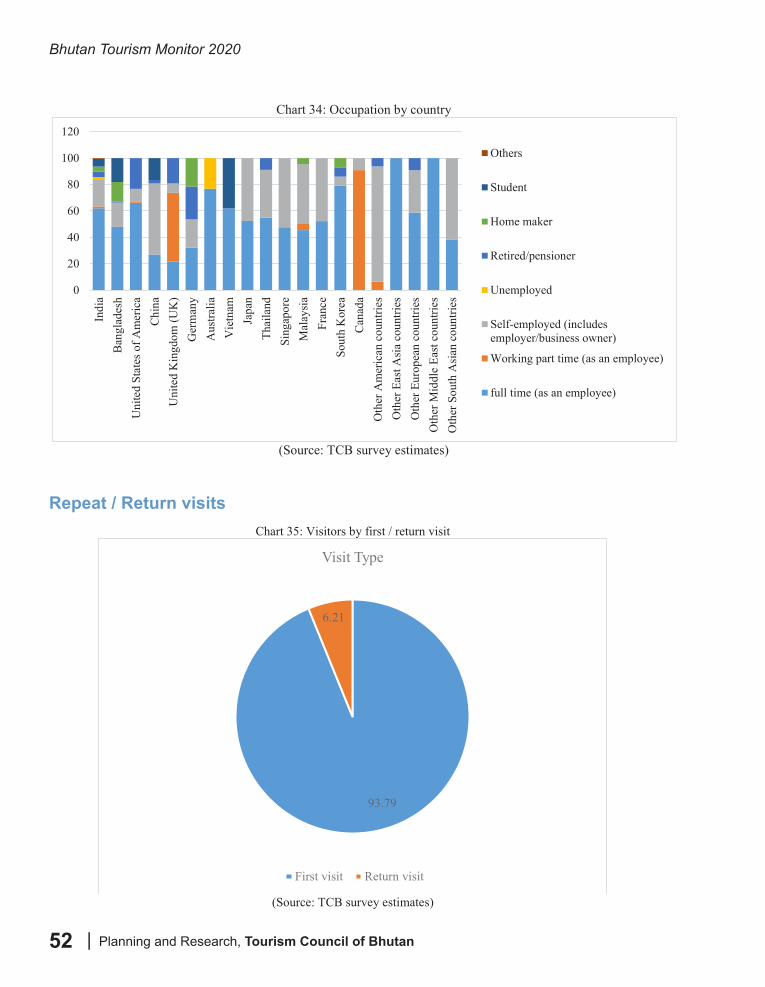
Bhutan Tourism Monitor 2020
| Planning and Research, Tourism Council of Bhutan52
Repeat / Return visits
Bhutan Tourism Monitor 2020 -------------------------------------------------------------------------------------------------------------------------------
--------------------------------------------------------------------------------------------------------------------- Planning and Research, Tourism Council of Bhutan 46
Chart 34: Occupation by country
(Source: TCB survey estimates)
Repeat / Return visits
Chart 35: Visitors by first / return visit
(Source: TCB survey estimates)
0
20
40
60
80
100
120
Indi
aB
angl
ades
hU
nite
d St
ates
of A
mer
ica
Chi
naU
nite
d K
ingd
om (U
K)
Ger
man
yA
ustra
liaV
ietn
amJa
pan
Thai
land
Sing
apor
eM
alay
sia
Fran
ceSo
uth
Kor
eaC
anad
aO
ther
Am
eric
an c
ount
ries
Oth
er E
ast A
sia
coun
tries
Oth
er E
urop
ean
coun
tries
Oth
er M
iddl
e Ea
st c
ount
ries
Oth
er S
outh
Asi
an c
ount
ries
Others
Student
Home maker
Retired/pensioner
Unemployed
Self-employed (includesemployer/business owner)
Working part time (as an employee)
full time (as an employee)
93.79
6.21
Visit Type
First visit Return visit
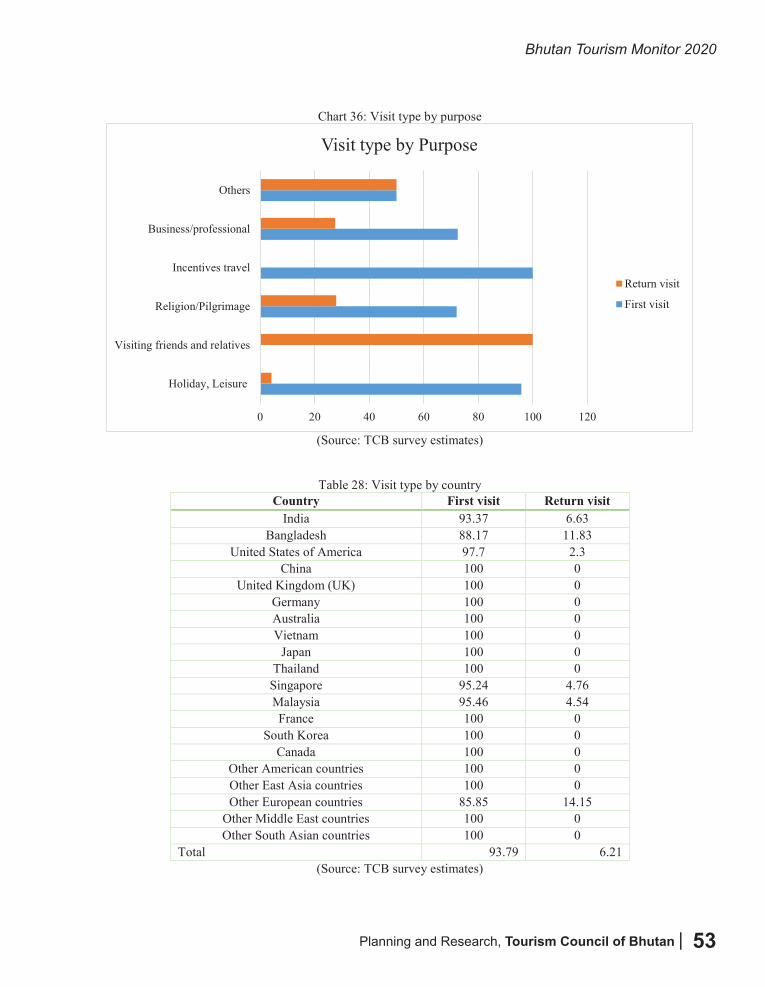
Planning and Research, Tourism Council of Bhutan |
Bhutan Tourism Monitor 2020
53
Bhutan Tourism Monitor 2020 -------------------------------------------------------------------------------------------------------------------------------
--------------------------------------------------------------------------------------------------------------------- Planning and Research, Tourism Council of Bhutan 47
Chart 36: Visit type by purpose
(Source: TCB survey estimates)
Table 28: Visit type by country Country First visit Return visit
India 93.37 6.63 Bangladesh 88.17 11.83
United States of America 97.7 2.3 China 100 0
United Kingdom (UK) 100 0 Germany 100 0 Australia 100 0 Vietnam 100 0
Japan 100 0 Thailand 100 0
Singapore 95.24 4.76 Malaysia 95.46 4.54 France 100 0
South Korea 100 0 Canada 100 0
Other American countries 100 0 Other East Asia countries 100 0 Other European countries 85.85 14.15
Other Middle East countries 100 0 Other South Asian countries 100 0
Total 93.79 6.21 (Source: TCB survey estimates)
0 20 40 60 80 100 120
Holiday, Leisure
Visiting friends and relatives
Religion/Pilgrimage
Incentives travel
Business/professional
Others
Visit type by Purpose
Return visit
First visit
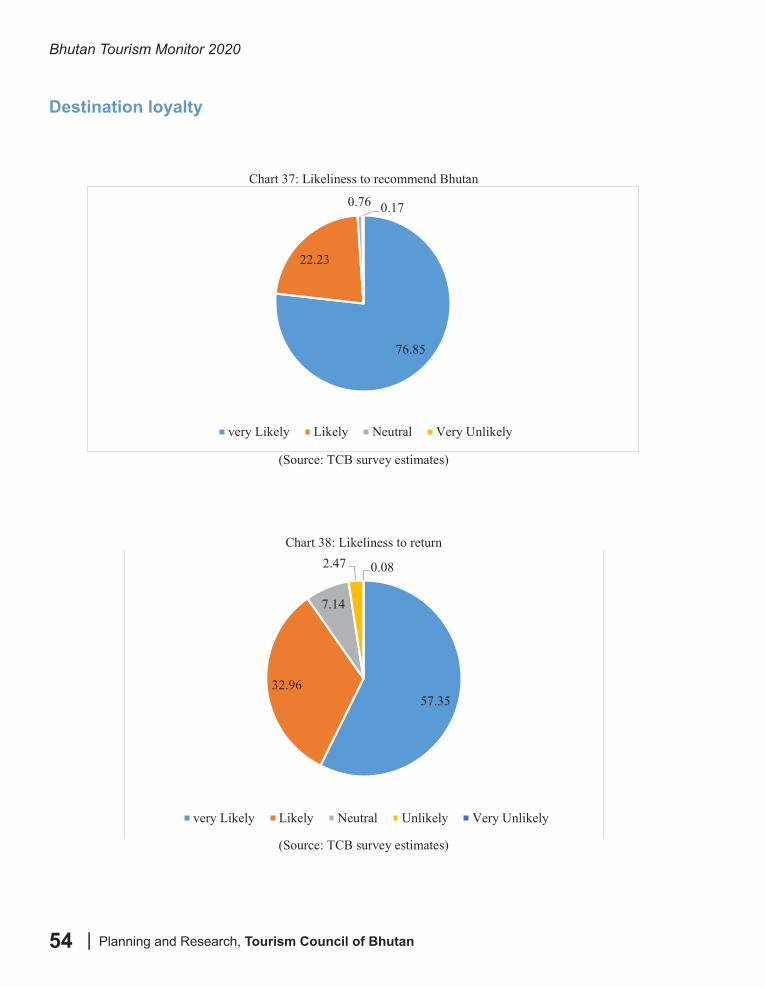
Bhutan Tourism Monitor 2020
| Planning and Research, Tourism Council of Bhutan54
Bhutan Tourism Monitor 2020 -------------------------------------------------------------------------------------------------------------------------------
--------------------------------------------------------------------------------------------------------------------- Planning and Research, Tourism Council of Bhutan 48
Destination loyalty
Chart 37: Likeliness to recommend Bhutan
(Source: TCB survey estimates)
Chart 38: Likeliness to return
(Source: TCB survey estimates)
76.85
22.23
0.76 0.17
very Likely Likely Neutral Very Unlikely
57.3532.96
7.14
2.47 0.08
very Likely Likely Neutral Unlikely Very Unlikely
Destination loyalty
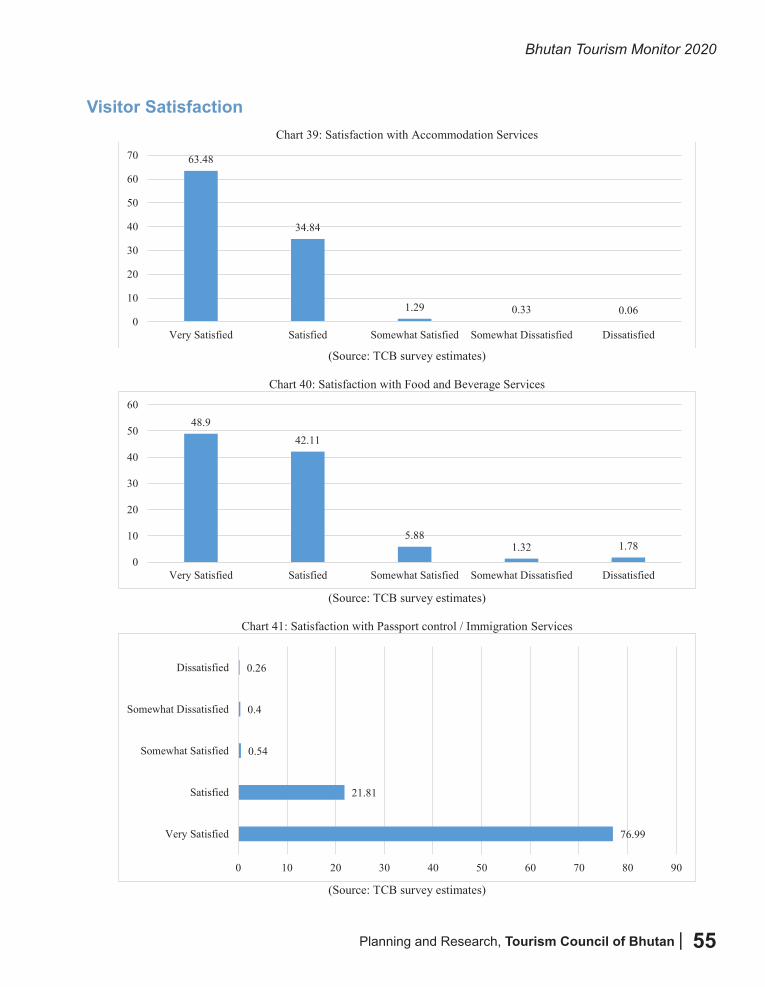
Planning and Research, Tourism Council of Bhutan |
Bhutan Tourism Monitor 2020
55
Visitor Satisfaction
Bhutan Tourism Monitor 2020 -------------------------------------------------------------------------------------------------------------------------------
--------------------------------------------------------------------------------------------------------------------- Planning and Research, Tourism Council of Bhutan 49
Visitor Satisfaction Chart 39: Satisfaction with Accommodation Services
(Source: TCB survey estimates)
Chart 40: Satisfaction with Food and Beverage Services
(Source: TCB survey estimates)
Chart 41: Satisfaction with Passport control / Immigration Services
(Source: TCB survey estimates)
63.48
34.84
1.29 0.33 0.060
10
20
30
40
50
60
70
Very Satisfied Satisfied Somewhat Satisfied Somewhat Dissatisfied Dissatisfied
48.942.11
5.881.32 1.78
0
10
20
30
40
50
60
Very Satisfied Satisfied Somewhat Satisfied Somewhat Dissatisfied Dissatisfied
76.99
21.81
0.54
0.4
0.26
0 10 20 30 40 50 60 70 80 90
Very Satisfied
Satisfied
Somewhat Satisfied
Somewhat Dissatisfied
Dissatisfied
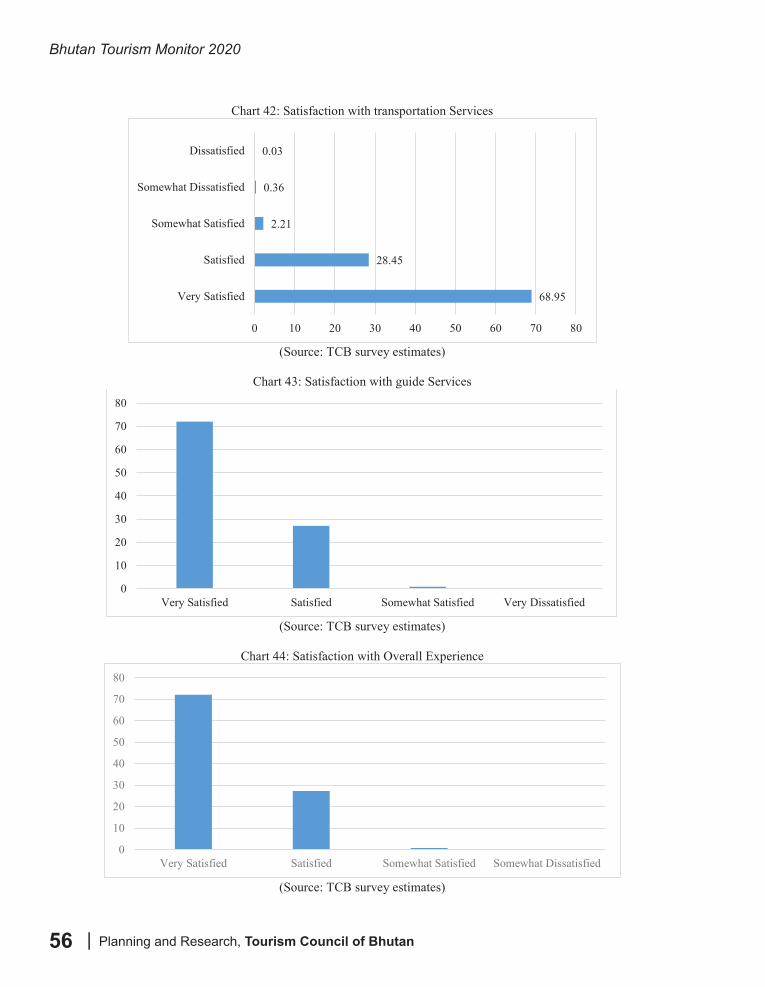
Bhutan Tourism Monitor 2020
| Planning and Research, Tourism Council of Bhutan56
Bhutan Tourism Monitor 2020 -------------------------------------------------------------------------------------------------------------------------------
--------------------------------------------------------------------------------------------------------------------- Planning and Research, Tourism Council of Bhutan 50
Chart 42: Satisfaction with transportation Services
(Source: TCB survey estimates)
Chart 43: Satisfaction with guide Services
(Source: TCB survey estimates)
Chart 44: Satisfaction with Overall Experience
(Source: TCB survey estimates)
68.95
28.45
2.21
0.36
0.03
0 10 20 30 40 50 60 70 80
Very Satisfied
Satisfied
Somewhat Satisfied
Somewhat Dissatisfied
Dissatisfied
0
10
20
30
40
50
60
70
80
Very Satisfied Satisfied Somewhat Satisfied Very Dissatisfied
0
10
20
30
40
50
60
70
80
Very Satisfied Satisfied Somewhat Satisfied Somewhat Dissatisfied
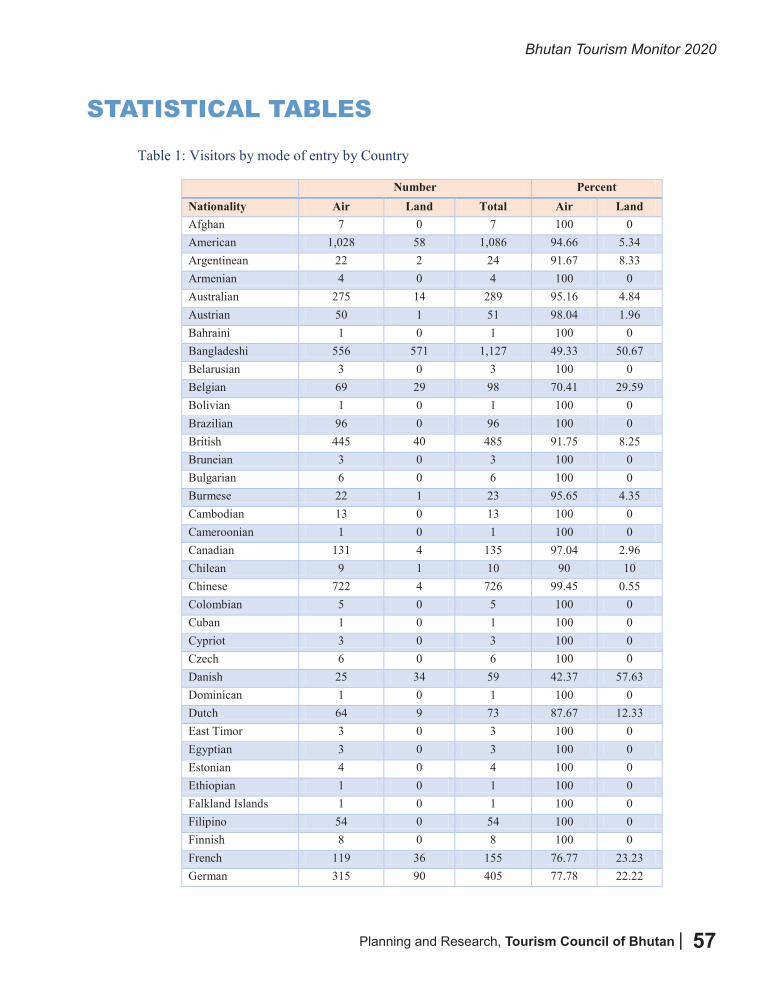
Planning and Research, Tourism Council of Bhutan |
Bhutan Tourism Monitor 2020
57
STATISTICAL TABLES
Bhutan Tourism Monitor 2020 -------------------------------------------------------------------------------------------------------------------------------
--------------------------------------------------------------------------------------------------------------------- Planning and Research, Tourism Council of Bhutan 51
STATISTICAL TABLES Table 1: Visitors by mode of entry by Country
Number Percent Nationality Air Land Total Air Land Afghan 7 0 7 100 0 American 1,028 58 1,086 94.66 5.34 Argentinean 22 2 24 91.67 8.33 Armenian 4 0 4 100 0 Australian 275 14 289 95.16 4.84 Austrian 50 1 51 98.04 1.96 Bahraini 1 0 1 100 0 Bangladeshi 556 571 1,127 49.33 50.67 Belarusian 3 0 3 100 0 Belgian 69 29 98 70.41 29.59 Bolivian 1 0 1 100 0 Brazilian 96 0 96 100 0 British 445 40 485 91.75 8.25 Bruneian 3 0 3 100 0 Bulgarian 6 0 6 100 0 Burmese 22 1 23 95.65 4.35 Cambodian 13 0 13 100 0 Cameroonian 1 0 1 100 0 Canadian 131 4 135 97.04 2.96 Chilean 9 1 10 90 10 Chinese 722 4 726 99.45 0.55 Colombian 5 0 5 100 0 Cuban 1 0 1 100 0 Cypriot 3 0 3 100 0 Czech 6 0 6 100 0 Danish 25 34 59 42.37 57.63 Dominican 1 0 1 100 0 Dutch 64 9 73 87.67 12.33 East Timor 3 0 3 100 0 Egyptian 3 0 3 100 0 Estonian 4 0 4 100 0 Ethiopian 1 0 1 100 0 Falkland Islands 1 0 1 100 0 Filipino 54 0 54 100 0 Finnish 8 0 8 100 0 French 119 36 155 76.77 23.23 German 315 90 405 77.78 22.22
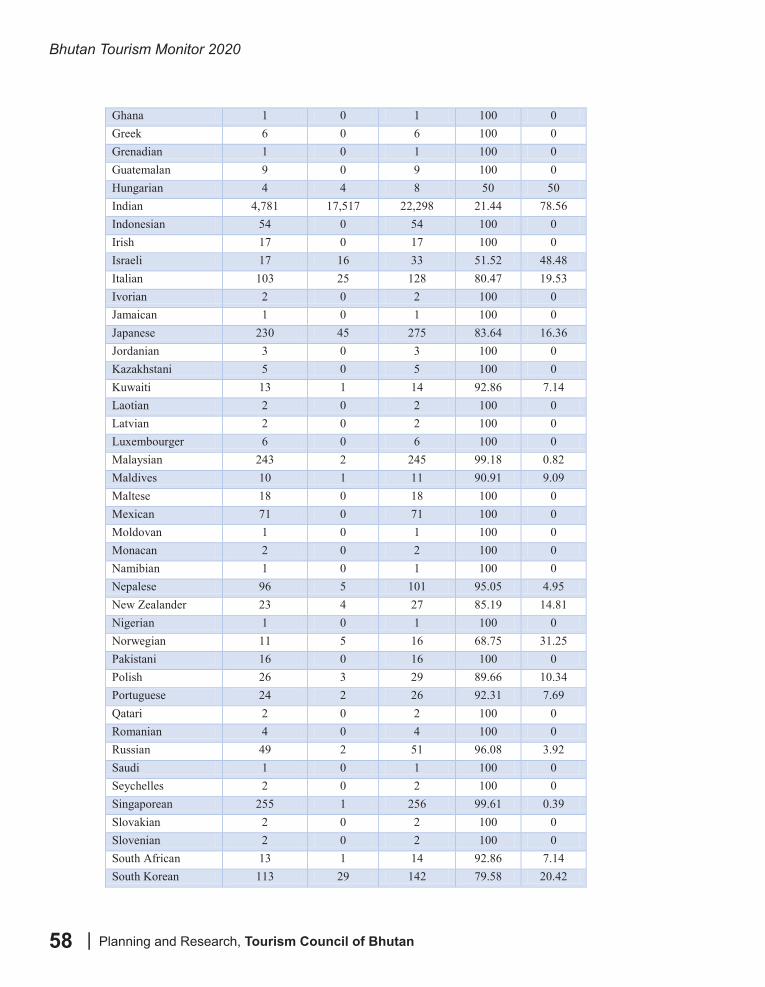
Bhutan Tourism Monitor 2020
| Planning and Research, Tourism Council of Bhutan58
Bhutan Tourism Monitor 2020 -------------------------------------------------------------------------------------------------------------------------------
--------------------------------------------------------------------------------------------------------------------- Planning and Research, Tourism Council of Bhutan 52
Ghana 1 0 1 100 0 Greek 6 0 6 100 0 Grenadian 1 0 1 100 0 Guatemalan 9 0 9 100 0 Hungarian 4 4 8 50 50 Indian 4,781 17,517 22,298 21.44 78.56 Indonesian 54 0 54 100 0 Irish 17 0 17 100 0 Israeli 17 16 33 51.52 48.48 Italian 103 25 128 80.47 19.53 Ivorian 2 0 2 100 0 Jamaican 1 0 1 100 0 Japanese 230 45 275 83.64 16.36 Jordanian 3 0 3 100 0 Kazakhstani 5 0 5 100 0 Kuwaiti 13 1 14 92.86 7.14 Laotian 2 0 2 100 0 Latvian 2 0 2 100 0 Luxembourger 6 0 6 100 0 Malaysian 243 2 245 99.18 0.82 Maldives 10 1 11 90.91 9.09 Maltese 18 0 18 100 0 Mexican 71 0 71 100 0 Moldovan 1 0 1 100 0 Monacan 2 0 2 100 0 Namibian 1 0 1 100 0 Nepalese 96 5 101 95.05 4.95 New Zealander 23 4 27 85.19 14.81 Nigerian 1 0 1 100 0 Norwegian 11 5 16 68.75 31.25 Pakistani 16 0 16 100 0 Polish 26 3 29 89.66 10.34 Portuguese 24 2 26 92.31 7.69 Qatari 2 0 2 100 0 Romanian 4 0 4 100 0 Russian 49 2 51 96.08 3.92 Saudi 1 0 1 100 0 Seychelles 2 0 2 100 0 Singaporean 255 1 256 99.61 0.39 Slovakian 2 0 2 100 0 Slovenian 2 0 2 100 0 South African 13 1 14 92.86 7.14 South Korean 113 29 142 79.58 20.42
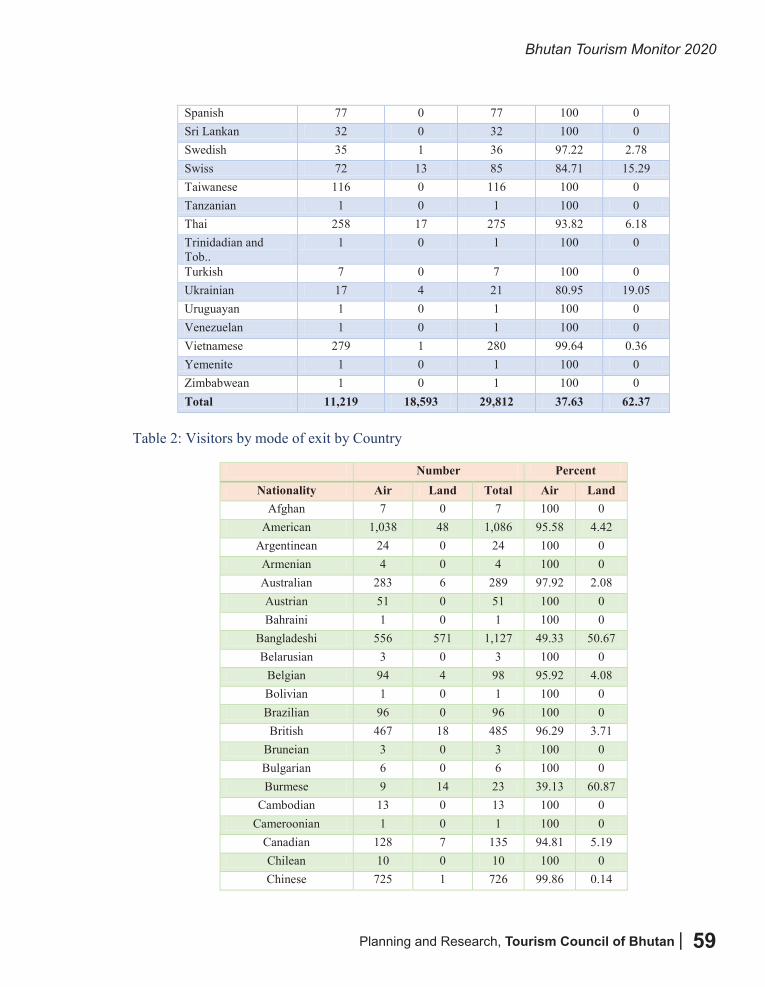
Planning and Research, Tourism Council of Bhutan |
Bhutan Tourism Monitor 2020
59
Bhutan Tourism Monitor 2020 -------------------------------------------------------------------------------------------------------------------------------
--------------------------------------------------------------------------------------------------------------------- Planning and Research, Tourism Council of Bhutan 53
Spanish 77 0 77 100 0 Sri Lankan 32 0 32 100 0 Swedish 35 1 36 97.22 2.78 Swiss 72 13 85 84.71 15.29 Taiwanese 116 0 116 100 0 Tanzanian 1 0 1 100 0 Thai 258 17 275 93.82 6.18 Trinidadian and Tob..
1 0 1 100 0
Turkish 7 0 7 100 0 Ukrainian 17 4 21 80.95 19.05 Uruguayan 1 0 1 100 0 Venezuelan 1 0 1 100 0 Vietnamese 279 1 280 99.64 0.36 Yemenite 1 0 1 100 0 Zimbabwean 1 0 1 100 0 Total 11,219 18,593 29,812 37.63 62.37
Table 2: Visitors by mode of exit by Country
Number Percent Nationality Air Land Total Air Land
Afghan 7 0 7 100 0 American 1,038 48 1,086 95.58 4.42
Argentinean 24 0 24 100 0 Armenian 4 0 4 100 0 Australian 283 6 289 97.92 2.08 Austrian 51 0 51 100 0 Bahraini 1 0 1 100 0
Bangladeshi 556 571 1,127 49.33 50.67 Belarusian 3 0 3 100 0
Belgian 94 4 98 95.92 4.08 Bolivian 1 0 1 100 0 Brazilian 96 0 96 100 0 British 467 18 485 96.29 3.71
Bruneian 3 0 3 100 0 Bulgarian 6 0 6 100 0 Burmese 9 14 23 39.13 60.87
Cambodian 13 0 13 100 0 Cameroonian 1 0 1 100 0
Canadian 128 7 135 94.81 5.19 Chilean 10 0 10 100 0 Chinese 725 1 726 99.86 0.14
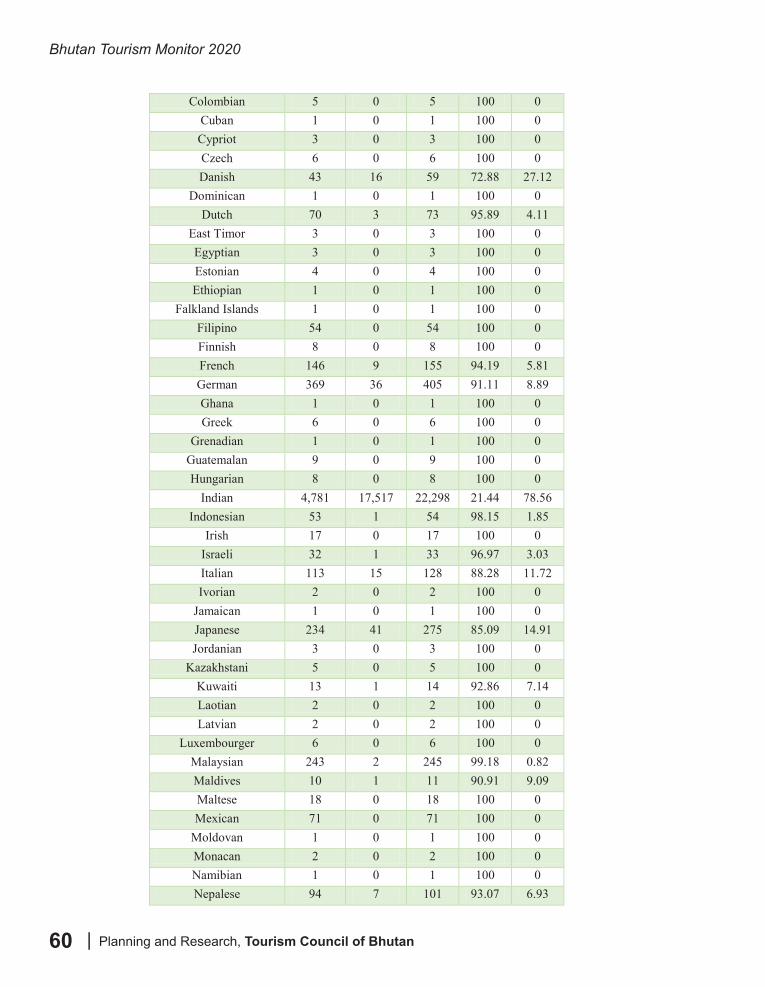
Bhutan Tourism Monitor 2020
| Planning and Research, Tourism Council of Bhutan60
Bhutan Tourism Monitor 2020 -------------------------------------------------------------------------------------------------------------------------------
--------------------------------------------------------------------------------------------------------------------- Planning and Research, Tourism Council of Bhutan 54
Colombian 5 0 5 100 0 Cuban 1 0 1 100 0 Cypriot 3 0 3 100 0 Czech 6 0 6 100 0 Danish 43 16 59 72.88 27.12
Dominican 1 0 1 100 0 Dutch 70 3 73 95.89 4.11
East Timor 3 0 3 100 0 Egyptian 3 0 3 100 0 Estonian 4 0 4 100 0 Ethiopian 1 0 1 100 0
Falkland Islands 1 0 1 100 0 Filipino 54 0 54 100 0 Finnish 8 0 8 100 0 French 146 9 155 94.19 5.81 German 369 36 405 91.11 8.89 Ghana 1 0 1 100 0 Greek 6 0 6 100 0
Grenadian 1 0 1 100 0 Guatemalan 9 0 9 100 0 Hungarian 8 0 8 100 0
Indian 4,781 17,517 22,298 21.44 78.56 Indonesian 53 1 54 98.15 1.85
Irish 17 0 17 100 0 Israeli 32 1 33 96.97 3.03 Italian 113 15 128 88.28 11.72 Ivorian 2 0 2 100 0
Jamaican 1 0 1 100 0 Japanese 234 41 275 85.09 14.91 Jordanian 3 0 3 100 0
Kazakhstani 5 0 5 100 0 Kuwaiti 13 1 14 92.86 7.14 Laotian 2 0 2 100 0 Latvian 2 0 2 100 0
Luxembourger 6 0 6 100 0 Malaysian 243 2 245 99.18 0.82 Maldives 10 1 11 90.91 9.09 Maltese 18 0 18 100 0 Mexican 71 0 71 100 0
Moldovan 1 0 1 100 0 Monacan 2 0 2 100 0 Namibian 1 0 1 100 0 Nepalese 94 7 101 93.07 6.93
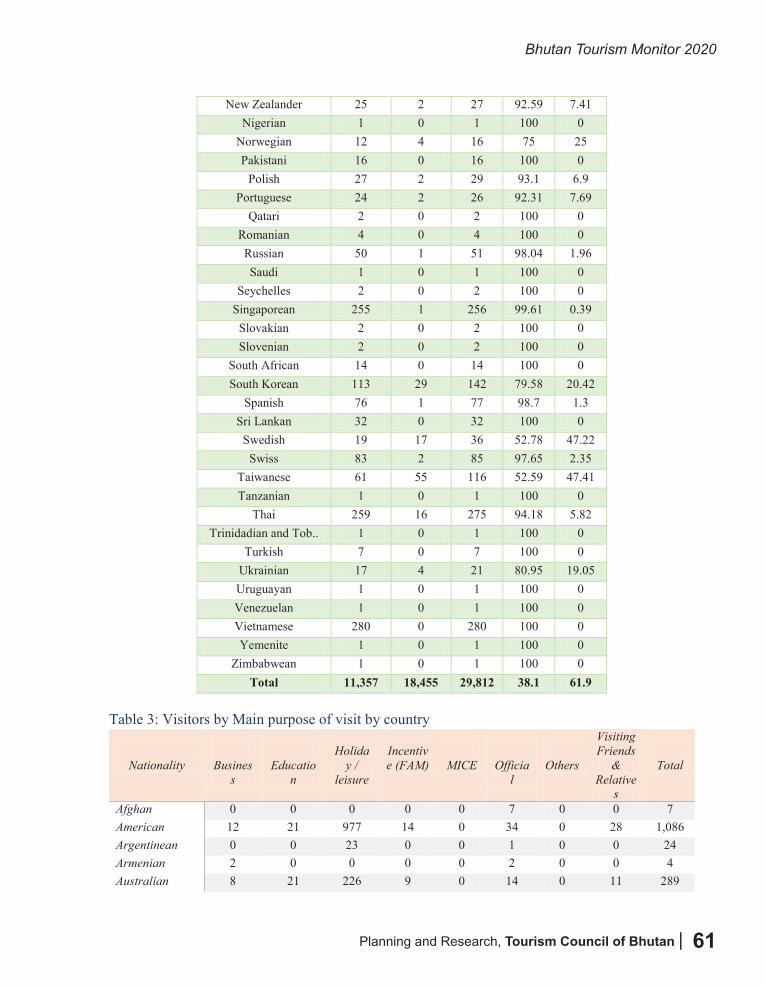
Planning and Research, Tourism Council of Bhutan |
Bhutan Tourism Monitor 2020
61
Bhutan Tourism Monitor 2020 -------------------------------------------------------------------------------------------------------------------------------
--------------------------------------------------------------------------------------------------------------------- Planning and Research, Tourism Council of Bhutan 55
New Zealander 25 2 27 92.59 7.41 Nigerian 1 0 1 100 0
Norwegian 12 4 16 75 25 Pakistani 16 0 16 100 0
Polish 27 2 29 93.1 6.9 Portuguese 24 2 26 92.31 7.69
Qatari 2 0 2 100 0 Romanian 4 0 4 100 0 Russian 50 1 51 98.04 1.96 Saudi 1 0 1 100 0
Seychelles 2 0 2 100 0 Singaporean 255 1 256 99.61 0.39
Slovakian 2 0 2 100 0 Slovenian 2 0 2 100 0
South African 14 0 14 100 0 South Korean 113 29 142 79.58 20.42
Spanish 76 1 77 98.7 1.3 Sri Lankan 32 0 32 100 0
Swedish 19 17 36 52.78 47.22 Swiss 83 2 85 97.65 2.35
Taiwanese 61 55 116 52.59 47.41 Tanzanian 1 0 1 100 0
Thai 259 16 275 94.18 5.82 Trinidadian and Tob.. 1 0 1 100 0
Turkish 7 0 7 100 0 Ukrainian 17 4 21 80.95 19.05 Uruguayan 1 0 1 100 0 Venezuelan 1 0 1 100 0 Vietnamese 280 0 280 100 0 Yemenite 1 0 1 100 0
Zimbabwean 1 0 1 100 0 Total 11,357 18,455 29,812 38.1 61.9
Table 3: Visitors by Main purpose of visit by country
Nationality
Business
Education
Holida
y / leisure
Incentive (FAM)
MICE
Official
Others
Visiting Friends
& Relative
s
Total
Afghan 0 0 0 0 0 7 0 0 7 American 12 21 977 14 0 34 0 28 1,086 Argentinean 0 0 23 0 0 1 0 0 24 Armenian 2 0 0 0 0 2 0 0 4 Australian 8 21 226 9 0 14 0 11 289
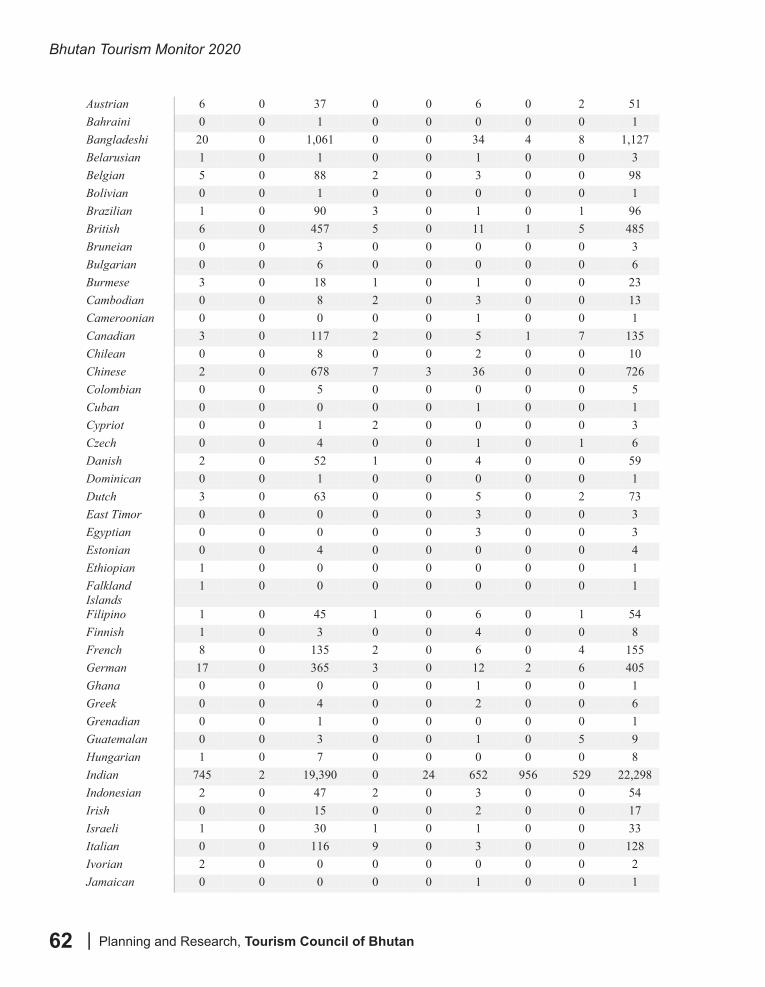
Bhutan Tourism Monitor 2020
| Planning and Research, Tourism Council of Bhutan62
Bhutan Tourism Monitor 2020 -------------------------------------------------------------------------------------------------------------------------------
--------------------------------------------------------------------------------------------------------------------- Planning and Research, Tourism Council of Bhutan 56
Austrian 6 0 37 0 0 6 0 2 51 Bahraini 0 0 1 0 0 0 0 0 1 Bangladeshi 20 0 1,061 0 0 34 4 8 1,127 Belarusian 1 0 1 0 0 1 0 0 3 Belgian 5 0 88 2 0 3 0 0 98 Bolivian 0 0 1 0 0 0 0 0 1 Brazilian 1 0 90 3 0 1 0 1 96 British 6 0 457 5 0 11 1 5 485 Bruneian 0 0 3 0 0 0 0 0 3 Bulgarian 0 0 6 0 0 0 0 0 6 Burmese 3 0 18 1 0 1 0 0 23 Cambodian 0 0 8 2 0 3 0 0 13 Cameroonian 0 0 0 0 0 1 0 0 1 Canadian 3 0 117 2 0 5 1 7 135 Chilean 0 0 8 0 0 2 0 0 10 Chinese 2 0 678 7 3 36 0 0 726 Colombian 0 0 5 0 0 0 0 0 5 Cuban 0 0 0 0 0 1 0 0 1 Cypriot 0 0 1 2 0 0 0 0 3 Czech 0 0 4 0 0 1 0 1 6 Danish 2 0 52 1 0 4 0 0 59 Dominican 0 0 1 0 0 0 0 0 1 Dutch 3 0 63 0 0 5 0 2 73 East Timor 0 0 0 0 0 3 0 0 3 Egyptian 0 0 0 0 0 3 0 0 3 Estonian 0 0 4 0 0 0 0 0 4 Ethiopian 1 0 0 0 0 0 0 0 1 Falkland Islands
1 0 0 0 0 0 0 0 1
Filipino 1 0 45 1 0 6 0 1 54 Finnish 1 0 3 0 0 4 0 0 8 French 8 0 135 2 0 6 0 4 155 German 17 0 365 3 0 12 2 6 405 Ghana 0 0 0 0 0 1 0 0 1 Greek 0 0 4 0 0 2 0 0 6 Grenadian 0 0 1 0 0 0 0 0 1 Guatemalan 0 0 3 0 0 1 0 5 9 Hungarian 1 0 7 0 0 0 0 0 8 Indian 745 2 19,390 0 24 652 956 529 22,298 Indonesian 2 0 47 2 0 3 0 0 54 Irish 0 0 15 0 0 2 0 0 17 Israeli 1 0 30 1 0 1 0 0 33 Italian 0 0 116 9 0 3 0 0 128 Ivorian 2 0 0 0 0 0 0 0 2 Jamaican 0 0 0 0 0 1 0 0 1
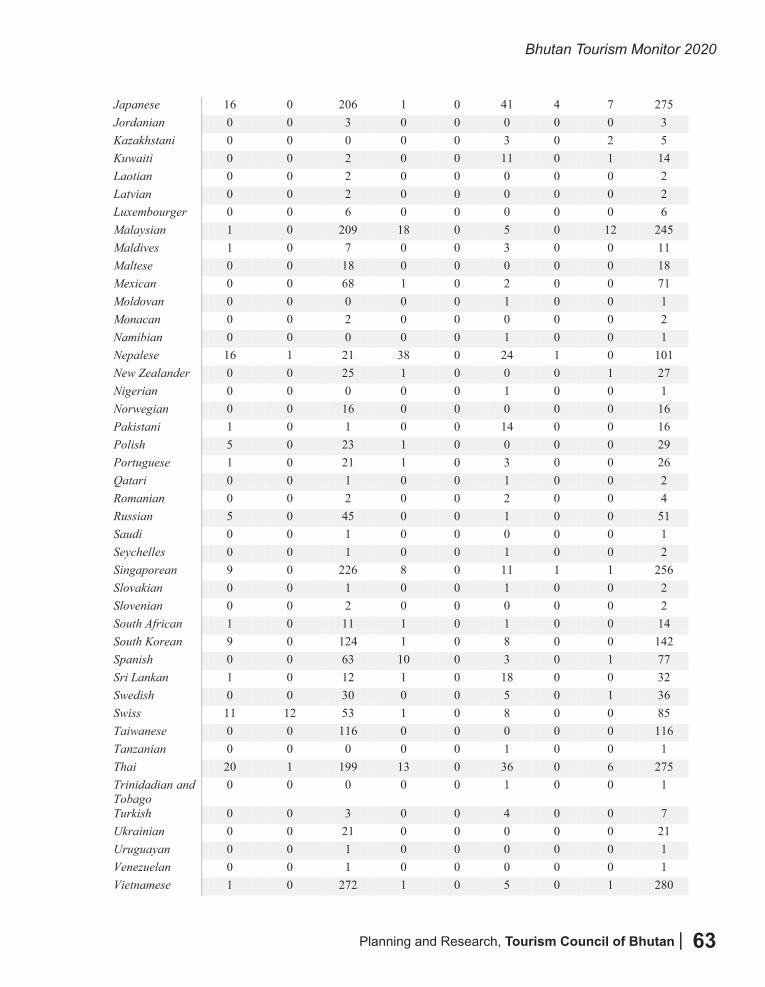
Planning and Research, Tourism Council of Bhutan |
Bhutan Tourism Monitor 2020
63
Bhutan Tourism Monitor 2020 -------------------------------------------------------------------------------------------------------------------------------
--------------------------------------------------------------------------------------------------------------------- Planning and Research, Tourism Council of Bhutan 57
Japanese 16 0 206 1 0 41 4 7 275 Jordanian 0 0 3 0 0 0 0 0 3 Kazakhstani 0 0 0 0 0 3 0 2 5 Kuwaiti 0 0 2 0 0 11 0 1 14 Laotian 0 0 2 0 0 0 0 0 2 Latvian 0 0 2 0 0 0 0 0 2 Luxembourger 0 0 6 0 0 0 0 0 6 Malaysian 1 0 209 18 0 5 0 12 245 Maldives 1 0 7 0 0 3 0 0 11 Maltese 0 0 18 0 0 0 0 0 18 Mexican 0 0 68 1 0 2 0 0 71 Moldovan 0 0 0 0 0 1 0 0 1 Monacan 0 0 2 0 0 0 0 0 2 Namibian 0 0 0 0 0 1 0 0 1 Nepalese 16 1 21 38 0 24 1 0 101 New Zealander 0 0 25 1 0 0 0 1 27 Nigerian 0 0 0 0 0 1 0 0 1 Norwegian 0 0 16 0 0 0 0 0 16 Pakistani 1 0 1 0 0 14 0 0 16 Polish 5 0 23 1 0 0 0 0 29 Portuguese 1 0 21 1 0 3 0 0 26 Qatari 0 0 1 0 0 1 0 0 2 Romanian 0 0 2 0 0 2 0 0 4 Russian 5 0 45 0 0 1 0 0 51 Saudi 0 0 1 0 0 0 0 0 1 Seychelles 0 0 1 0 0 1 0 0 2 Singaporean 9 0 226 8 0 11 1 1 256 Slovakian 0 0 1 0 0 1 0 0 2 Slovenian 0 0 2 0 0 0 0 0 2 South African 1 0 11 1 0 1 0 0 14 South Korean 9 0 124 1 0 8 0 0 142 Spanish 0 0 63 10 0 3 0 1 77 Sri Lankan 1 0 12 1 0 18 0 0 32 Swedish 0 0 30 0 0 5 0 1 36 Swiss 11 12 53 1 0 8 0 0 85 Taiwanese 0 0 116 0 0 0 0 0 116 Tanzanian 0 0 0 0 0 1 0 0 1 Thai 20 1 199 13 0 36 0 6 275 Trinidadian and Tobago
0 0 0 0 0 1 0 0 1
Turkish 0 0 3 0 0 4 0 0 7 Ukrainian 0 0 21 0 0 0 0 0 21 Uruguayan 0 0 1 0 0 0 0 0 1 Venezuelan 0 0 1 0 0 0 0 0 1 Vietnamese 1 0 272 1 0 5 0 1 280
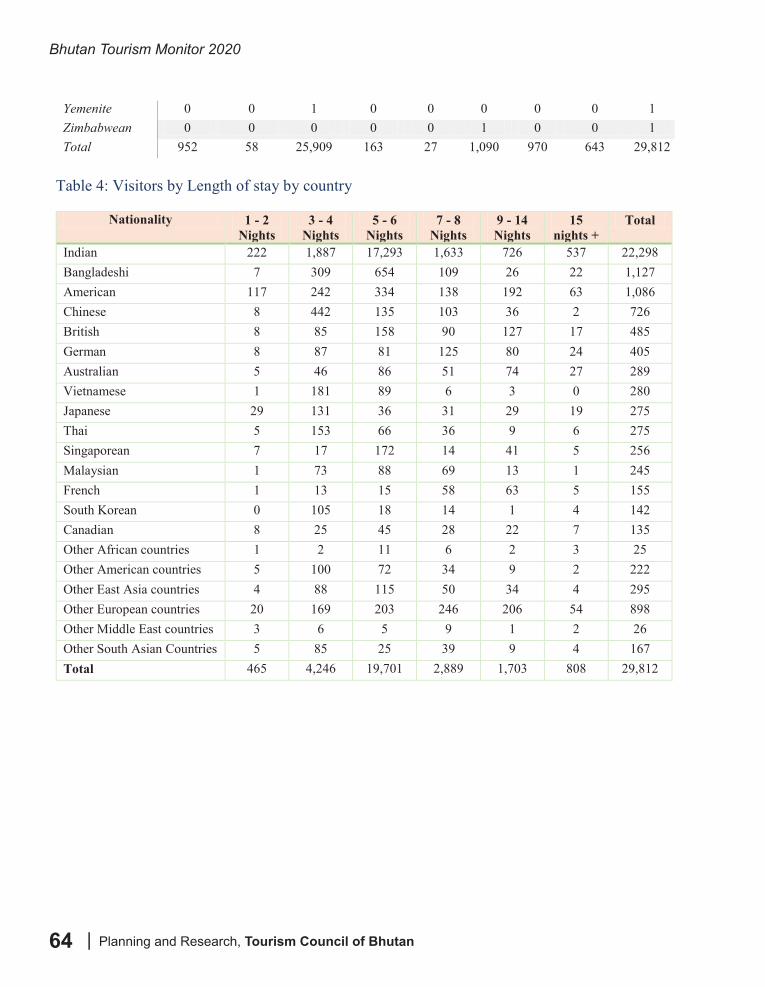
Bhutan Tourism Monitor 2020
| Planning and Research, Tourism Council of Bhutan64
Bhutan Tourism Monitor 2020 -------------------------------------------------------------------------------------------------------------------------------
--------------------------------------------------------------------------------------------------------------------- Planning and Research, Tourism Council of Bhutan 58
Yemenite 0 0 1 0 0 0 0 0 1 Zimbabwean 0 0 0 0 0 1 0 0 1 Total 952 58 25,909 163 27 1,090 970 643 29,812
Table 4: Visitors by Length of stay by country
nationality 1 - 2 Nights
3 - 4 Nights
5 - 6 Nights
7 - 8 Nights
9 - 14 Nights
15 nights +
Total
Indian 222 1,887 17,293 1,633 726 537 22,298 Bangladeshi 7 309 654 109 26 22 1,127 American 117 242 334 138 192 63 1,086 Chinese 8 442 135 103 36 2 726 British 8 85 158 90 127 17 485 German 8 87 81 125 80 24 405 Australian 5 46 86 51 74 27 289 Vietnamese 1 181 89 6 3 0 280 Japanese 29 131 36 31 29 19 275 Thai 5 153 66 36 9 6 275 Singaporean 7 17 172 14 41 5 256 Malaysian 1 73 88 69 13 1 245 French 1 13 15 58 63 5 155 South Korean 0 105 18 14 1 4 142 Canadian 8 25 45 28 22 7 135 Other African countries 1 2 11 6 2 3 25 Other American countries 5 100 72 34 9 2 222 Other East Asia countries 4 88 115 50 34 4 295 Other European countries 20 169 203 246 206 54 898 Other Middle East countries 3 6 5 9 1 2 26 Other South Asian Countries 5 85 25 39 9 4 167 Total 465 4,246 19,701 2,889 1,703 808 29,812
Nationality
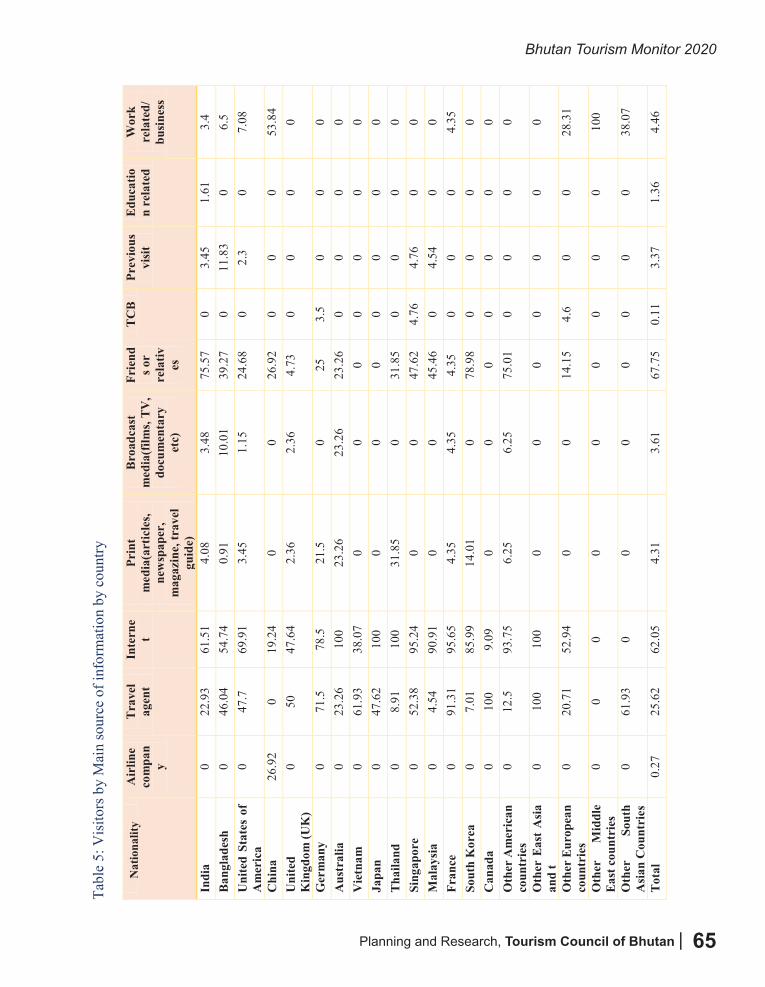
Planning and Research, Tourism Council of Bhutan |
Bhutan Tourism Monitor 2020
65
Bhu
tan
Tour
ism
Mon
itor 2
020
----
----
----
----
----
----
----
----
----
----
----
----
----
----
----
----
----
----
----
----
----
----
----
----
----
----
----
----
----
----
----
---
----
----
----
----
----
----
----
----
----
----
----
----
----
----
----
----
----
----
----
----
----
----
----
----
----
----
----
----
----
- Pl
anni
ng a
nd R
esea
rch,
Tou
rism
Cou
ncil
of B
huta
n
59
Ta
ble
5: V
isito
rs b
y M
ain
sour
ce o
f inf
orm
atio
n by
cou
ntry
natio
nalit
y A
irlin
e co
mpa
ny
Tra
vel
agen
t In
tern
et
Prin
t m
edia
(art
icle
s, ne
wsp
aper
, m
agaz
ine,
trav
el
guid
e)
Bro
adca
st
med
ia(f
ilms,
TV
, do
cum
enta
ry
etc)
Frie
nds o
r re
lativ
es
TC
B
Prev
ious
vi
sit
Edu
catio
n re
late
d W
ork
rela
ted/
bu
sine
ss
Indi
a 0
22.9
3 61
.51
4.08
3.
48
75.5
7 0
3.45
1.
61
3.4
Ban
glad
esh
0 46
.04
54.7
4 0.
91
10.0
1 39
.27
0 11
.83
0 6.
5 U
nite
d St
ates
of
Am
eric
a 0
47.7
69
.91
3.45
1.
15
24.6
8 0
2.3
0 7.
08
Chi
na
26.9
2 0
19.2
4 0
0 26
.92
0 0
0 53
.84
Uni
ted
Kin
gdom
(UK
) 0
50
47.6
4 2.
36
2.36
4.
73
0 0
0 0
Ger
man
y 0
71.5
78
.5
21.5
0
25
3.5
0 0
0 A
ustr
alia
0
23.2
6 10
0 23
.26
23.2
6 23
.26
0 0
0 0
Vie
tnam
0
61.9
3 38
.07
0 0
0 0
0 0
0 Ja
pan
0 47
.62
100
0 0
0 0
0 0
0 T
haila
nd
0 8.
91
100
31.8
5 0
31.8
5 0
0 0
0 Si
ngap
ore
0 52
.38
95.2
4 0
0 47
.62
4.76
4.
76
0 0
Mal
aysi
a 0
4.54
90
.91
0 0
45.4
6 0
4.54
0
0 Fr
ance
0
91.3
1 95
.65
4.35
4.
35
4.35
0
0 0
4.35
So
uth
Kor
ea
0 7.
01
85.9
9 14
.01
0 78
.98
0 0
0 0
Can
ada
0 10
0 9.
09
0 0
0 0
0 0
0 O
ther
Am
eric
an
coun
trie
s 0
12.5
93
.75
6.25
6.
25
75.0
1 0
0 0
0
Oth
er E
ast
Asi
a an
d t
0 10
0 10
0 0
0 0
0 0
0 0
Oth
er E
urop
ean
coun
trie
s 0
20.7
1 52
.94
0 0
14.1
5 4.
6 0
0 28
.31
Oth
er
Mid
dle
Eas
t cou
ntri
es
0 0
0 0
0 0
0 0
0 10
0
Oth
er
Sout
h A
sian
Cou
ntri
es
0 61
.93
0 0
0 0
0 0
0 38
.07
Tot
al
0.27
25
.62
62.0
5 4.
31
3.61
67
.75
0.11
3.
37
1.36
4.
46
Nat
iona
lity
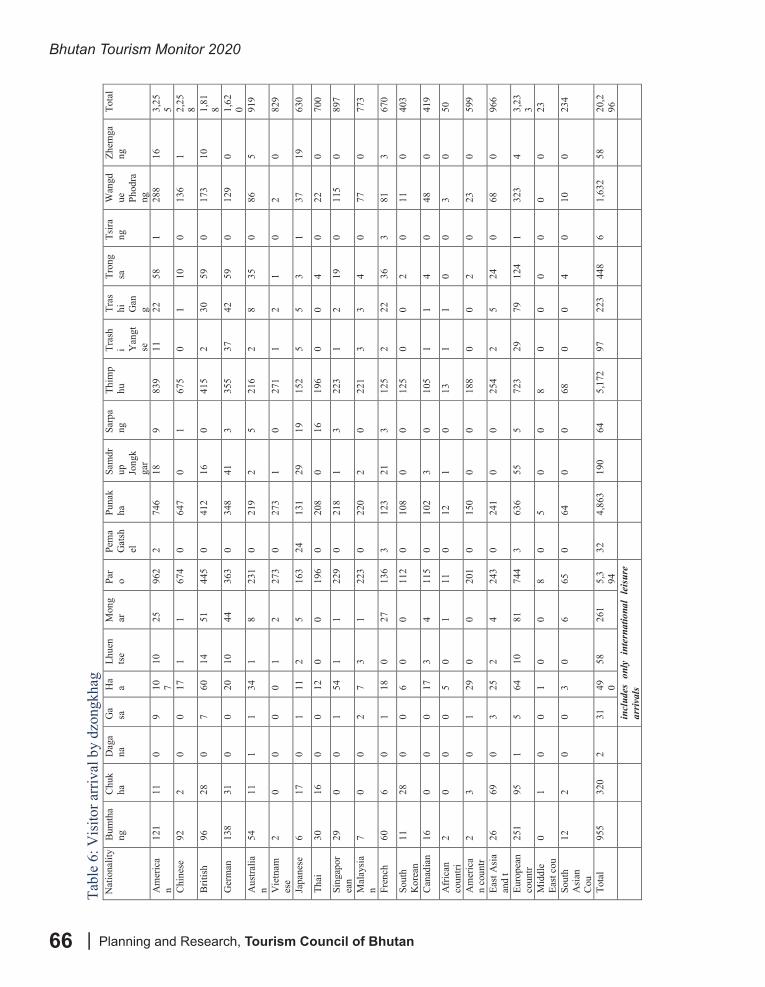
Bhutan Tourism Monitor 2020
| Planning and Research, Tourism Council of Bhutan66
Bhu
tan
Tour
ism
Mon
itor 2
020
----
----
----
----
----
----
----
----
----
----
----
----
----
----
----
----
----
----
----
----
----
----
----
----
----
----
----
----
----
----
----
---
----
----
----
----
----
----
----
----
----
----
----
----
----
----
----
----
----
----
----
----
----
----
----
----
----
----
----
----
----
- Pl
anni
ng a
nd R
esea
rch,
Tou
rism
Cou
ncil
of B
huta
n
60
Ta
ble
6: V
isito
r arr
ival
by
dzon
gkha
g na
tiona
lity
Bum
tha
ng
Chu
kha
D
aga
na
Ga
sa
Ha
a Lh
uen
tse
Mon
gar
Pa
ro
Pem
a G
atsh
el
Puna
kha
Sa
mdr
up
Jong
kga
r
Sarp
ang
Th
imp
hu
Tras
hi Y
angt
se
Tras
hi
Gan
g
Tron
gsa
Ts
irang
W
angd
ue
Phod
rang
Zhem
gang
To
tal
Am
eric
an
121
11
0 9
10 7 10
25
96
2 2
746
18
9 83
9 11
22
58
1
288
16
3,25
5 C
hine
se
92
2 0
0 17
1
1 67
4 0
647
0 1
675
0 1
10
0 13
6 1
2,25
8 B
ritis
h 96
28
0
7 60
14
51
44
5 0
412
16
0 41
5 2
30
59
0 17
3 10
1,
818
Ger
man
13
8 31
0
0 20
10
44
36
3 0
348
41
3 35
5 37
42
59
0
129
0 1,
620
Aus
tralia
n 54
11
1
1 34
1
8 23
1 0
219
2 5
216
2 8
35
0 86
5
919
Vie
tnam
ese
2 0
0 0
0 1
2 27
3 0
273
1 0
271
1 2
1 0
2 0
829
Japa
nese
6
17
0 1
11
2 5
163
24
131
29
19
152
5 5
3 1
37
19
630
Thai
30
16
0
0 12
0
0 19
6 0
208
0 16
19
6 0
0 4
0 22
0
700
Sing
apor
ean
29
0 0
1 54
1
1 22
9 0
218
1 3
223
1 2
19
0 11
5 0
897
Mal
aysi
an
7 0
0 2
7 3
1 22
3 0
220
2 0
221
3 3
4 0
77
0 77
3
Fren
ch
60
6 0
1 18
0
27
136
3 12
3 21
3
125
2 22
36
3
81
3 67
0
Sout
h K
orea
n 11
28
0
0 6
0 0
112
0 10
8 0
0 12
5 0
0 2
0 11
0
403
Can
adia
n 16
0
0 0
17
3 4
115
0 10
2 3
0 10
5 1
1 4
0 48
0
419
Afr
ican
co
untri
2
0 0
0 5
0 1
11
0 12
1
0 13
1
1 0
0 3
0 50
Am
eric
an
coun
tr 2
3 0
1 29
0
0 20
1 0
150
0 0
188
0 0
2 0
23
0 59
9
East
Asi
a an
d t
26
69
0 3
25
2 4
243
0 24
1 0
0 25
4 2
5 24
0
68
0 96
6
Euro
pean
co
untr
251
95
1 5
64
10
81
744
3 63
6 55
5
723
29
79
124
1 32
3 4
3,23
3 M
iddl
e Ea
st co
u 0
1 0
0 1
0 0
8 0
5 0
0 8
0 0
0 0
0 0
23
Sout
h A
sian
C
ou
12
2 0
0 3
0 6
65
0 64
0
0 68
0
0 4
0 10
0
234
Tota
l 95
5 32
0 2
31
49 0 58
26
1 5,
394
32
4,
863
190
64
5,17
2 97
22
3 44
8 6
1,63
2 58
20
,296
in
clud
es o
nly
inte
rnat
iona
l le
isur
e ar
rival
s
Nat
iona
lity
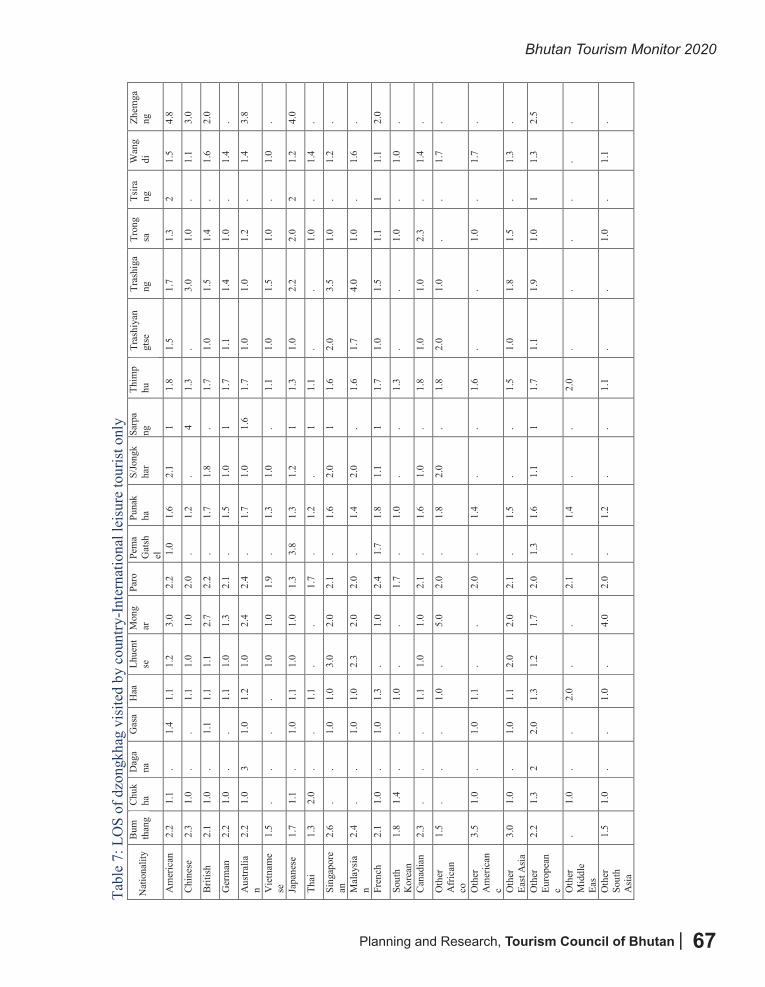
Planning and Research, Tourism Council of Bhutan |
Bhutan Tourism Monitor 2020
67
Bhu
tan
Tour
ism
Mon
itor 2
020
----
----
----
----
----
----
----
----
----
----
----
----
----
----
----
----
----
----
----
----
----
----
----
----
----
----
----
----
----
----
----
---
----
----
----
----
----
----
----
----
----
----
----
----
----
----
----
----
----
----
----
----
----
----
----
----
----
----
----
----
----
- Pl
anni
ng a
nd R
esea
rch,
Tou
rism
Cou
ncil
of B
huta
n
61
Ta
ble
7: L
OS
of d
zong
khag
vis
ited
by c
ount
ry-I
nter
natio
nal l
eisu
re to
uris
t onl
y
bum
ch
u da
gana
ga
sa
haa
lhue
ntse
m
ong
ar
paro
pe
ma
gats
hel
puna
kha
s/
jong
kha
r sa
rpa
ng
thim
phu
Tr
ashi
yan
gtse
Tr
ashi
gang
Tr
ong
sa
Tsira
ng
Wan
gdi
Zh
emga
ng
Am
eric
an
2.2
1.1
. 1.
4 1.
1 1.
2 3.
0 2.
2 1.
0 1.
6 2.
1 1
1.8
1.5
1.7
1.3
2 1.
5 4.
8
Chi
nese
2.
3 1.
0 .
. 1.
1 1.
0 1.
0 2.
0 .
1.2
. 4
1.3
. 3.
0 1.
0 .
1.1
3.0
Brit
ish
2.1
1.0
. 1.
1 1.
1 1.
1 2.
7 2.
2 .
1.7
1.8
. 1.
7 1.
0 1.
5 1.
4 .
1.6
2.0
Ger
man
2.
2 1.
0 .
. 1.
1 1.
0 1.
3 2.
1 .
1.5
1.0
1 1.
7 1.
1 1.
4 1.
0 .
1.4
.
Aus
tralia
n 2.
2 1.
0 3
1.0
1.2
1.0
2.4
2.4
. 1.
7 1.
0 1.
6 1.
7 1.
0 1.
0 1.
2 .
1.4
3.8
Vie
tnam
ese
1.
5 .
. .
. 1.
0 1.
0 1.
9 .
1.3
1.0
. 1.
1 1.
0 1.
5 1.
0 .
1.0
.
Japa
nese
1.
7 1.
1 .
1.0
1.1
1.0
1.0
1.3
3.8
1.3
1.2
1 1.
3 1.
0 2.
2 2.
0 2
1.2
4.0
Thai
1.
3 2.
0 .
. 1.
1 .
. 1.
7 .
1.2
. 1
1.1
. .
1.0
. 1.
4 .
Sing
apor
ean
2.
6 .
. 1.
0 1.
0 3.
0 2.
0 2.
1 .
1.6
2.0
1 1.
6 2.
0 3.
5 1.
0 .
1.2
.
Mal
aysi
an
2.4
. .
1.0
1.0
2.3
2.0
2.0
. 1.
4 2.
0 .
1.6
1.7
4.0
1.0
. 1.
6 .
Fren
ch
2.1
1.0
. 1.
0 1.
3 .
1.0
2.4
1.7
1.8
1.1
1 1.
7 1.
0 1.
5 1.
1 1
1.1
2.0
Sout
h K
orea
n 1.
8 1.
4 .
. 1.
0 .
. 1.
7 .
1.0
. .
1.3
. .
1.0
. 1.
0 .
Can
adia
n 2.
3 .
. .
1.1
1.0
1.0
2.1
. 1.
6 1.
0 .
1.8
1.0
1.0
2.3
. 1.
4 .
Oth
er
Afr
ican
co
1.5
. .
. 1.
0 .
5.0
2.0
. 1.
8 2.
0 .
1.8
2.0
1.0
. .
1.7
.
Oth
er
Am
eric
an
c
3.5
1.0
. 1.
0 1.
1 .
. 2.
0 .
1.4
. .
1.6
. .
1.0
. 1.
7 .
Oth
er
East
Asi
a 3.
0 1.
0 .
1.0
1.1
2.0
2.0
2.1
. 1.
5 .
. 1.
5 1.
0 1.
8 1.
5 .
1.3
.
Oth
er
Euro
pean
c
2.2
1.3
2 2.
0 1.
3 1.
2 1.
7 2.
0 1.
3 1.
6 1.
1 1
1.7
1.1
1.9
1.0
1 1.
3 2.
5
Oth
er
Mid
dle
Eas
. 1.
0 .
. 2.
0 .
. 2.
1 .
1.4
. .
2.0
. .
. .
. .
Oth
er
Sout
h A
sia
1.5
1.0
. .
1.0
. 4.
0 2.
0 .
1.2
. .
1.1
. .
1.0
. 1.
1 .
Bum
than
gN
atio
nalit
yC
huk
haD
aga
naG
asa
Haa
Lhue
ntse
Mon
gar
Paro
Pem
aG
atsh
el
Puna
kha
S/Jo
ngk
har
Sarp
ang
Thim
phu
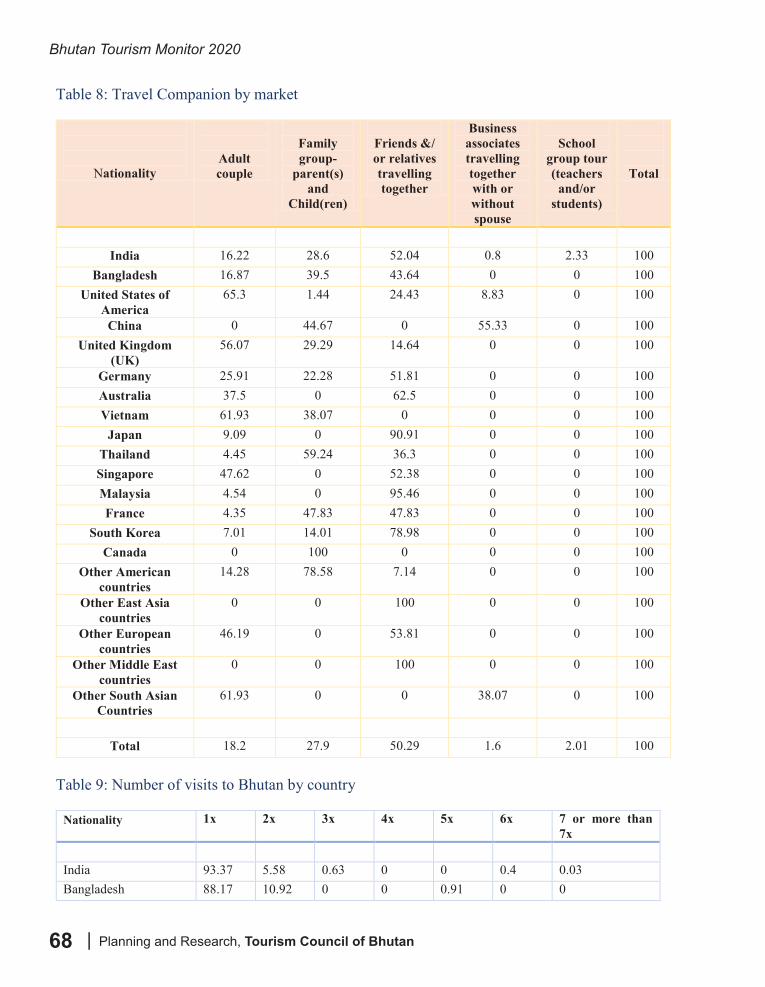
Bhutan Tourism Monitor 2020
| Planning and Research, Tourism Council of Bhutan68
Bhutan Tourism Monitor 2020 -------------------------------------------------------------------------------------------------------------------------------
--------------------------------------------------------------------------------------------------------------------- Planning and Research, Tourism Council of Bhutan 62
Table 8: Travel Companion by market
Nationality
Adult couple
Family group-
parent(s) and
Child(ren)
Friends &/ or relatives travelling together
Business associates travelling together with or without spouse
School
group tour (teachers
and/or students)
Total
India 16.22 28.6 52.04 0.8 2.33 100
Bangladesh 16.87 39.5 43.64 0 0 100 United States of
America 65.3 1.44 24.43 8.83 0 100
China 0 44.67 0 55.33 0 100 United Kingdom
(UK) 56.07 29.29 14.64 0 0 100
Germany 25.91 22.28 51.81 0 0 100 Australia 37.5 0 62.5 0 0 100 Vietnam 61.93 38.07 0 0 0 100
Japan 9.09 0 90.91 0 0 100 Thailand 4.45 59.24 36.3 0 0 100 Singapore 47.62 0 52.38 0 0 100 Malaysia 4.54 0 95.46 0 0 100 France 4.35 47.83 47.83 0 0 100
South Korea 7.01 14.01 78.98 0 0 100 Canada 0 100 0 0 0 100
Other American countries
14.28 78.58 7.14 0 0 100
Other East Asia countries
0 0 100 0 0 100
Other European countries
46.19 0 53.81 0 0 100
Other Middle East countries
0 0 100 0 0 100
Other South Asian Countries
61.93 0 0 38.07 0 100
Total 18.2 27.9 50.29 1.6 2.01 100
Table 9: Number of visits to Bhutan by country
nationality 1x 2x 3x 4x 5x 6x 7 or more than 7x
India 93.37 5.58 0.63 0 0 0.4 0.03 Bangladesh 88.17 10.92 0 0 0.91 0 0
Nationality
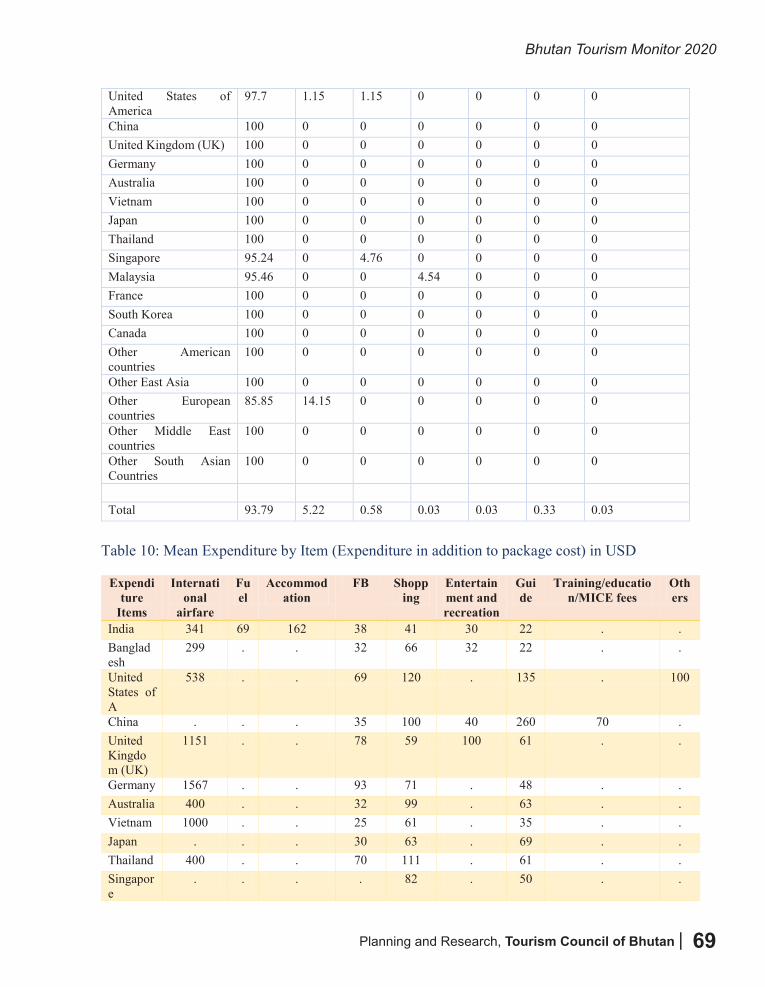
Planning and Research, Tourism Council of Bhutan |
Bhutan Tourism Monitor 2020
69
Bhutan Tourism Monitor 2020 -------------------------------------------------------------------------------------------------------------------------------
--------------------------------------------------------------------------------------------------------------------- Planning and Research, Tourism Council of Bhutan 63
United States of America
97.7 1.15 1.15 0 0 0 0
China 100 0 0 0 0 0 0 United Kingdom (UK) 100 0 0 0 0 0 0 Germany 100 0 0 0 0 0 0 Australia 100 0 0 0 0 0 0 Vietnam 100 0 0 0 0 0 0 Japan 100 0 0 0 0 0 0 Thailand 100 0 0 0 0 0 0 Singapore 95.24 0 4.76 0 0 0 0 Malaysia 95.46 0 0 4.54 0 0 0 France 100 0 0 0 0 0 0 South Korea 100 0 0 0 0 0 0 Canada 100 0 0 0 0 0 0 Other American countries
100 0 0 0 0 0 0
Other East Asia 100 0 0 0 0 0 0 Other European countries
85.85 14.15 0 0 0 0 0
Other Middle East countries
100 0 0 0 0 0 0
Other South Asian Countries
100 0 0 0 0 0 0
Total 93.79 5.22 0.58 0.03 0.03 0.33 0.03
Table 10: Mean Expenditure by Item (Expenditure in addition to package cost) in USD
Expenditure
Items
International
airfare
Fuel
Accommodation
FB Shopping
Entertainment and recreation
Guide
Training/education/MICE fees
Others
India 341 69 162 38 41 30 22 . . Bangladesh
299 . . 32 66 32 22 . .
United States of A
538 . . 69 120 . 135 . 100
China . . . 35 100 40 260 70 . United Kingdom (UK)
1151 . . 78 59 100 61 . .
Germany 1567 . . 93 71 . 48 . . Australia 400 . . 32 99 . 63 . . Vietnam 1000 . . 25 61 . 35 . . Japan . . . 30 63 . 69 . . Thailand 400 . . 70 111 . 61 . . Singapore
. . . . 82 . 50 . .
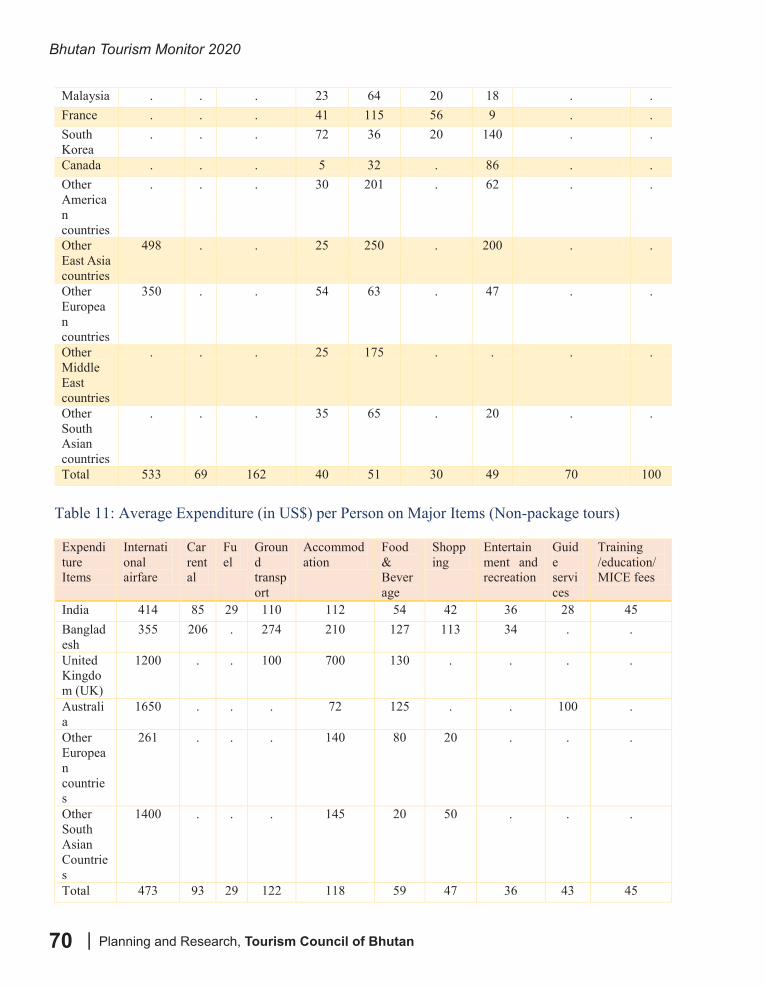
Bhutan Tourism Monitor 2020
| Planning and Research, Tourism Council of Bhutan70
Bhutan Tourism Monitor 2020 -------------------------------------------------------------------------------------------------------------------------------
--------------------------------------------------------------------------------------------------------------------- Planning and Research, Tourism Council of Bhutan 64
Malaysia . . . 23 64 20 18 . . France . . . 41 115 56 9 . . South Korea
. . . 72 36 20 140 . .
Canada . . . 5 32 . 86 . . Other American countries
. . . 30 201 . 62 . .
Other East Asia countries
498 . . 25 250 . 200 . .
Other European countries
350 . . 54 63 . 47 . .
Other Middle East countries
. . . 25 175 . . . .
Other South Asian countries
. . . 35 65 . 20 . .
Total 533 69 162 40 51 30 49 70 100 Table 11: Average Expenditure (in US$) per Person on Major Items (Non-package tours)
Expenditure Items
International airfare
Car rental
Fuel
Ground transport
Accommodation
Food & Beverage
Shopping
Entertainment and recreation
Guide services
Training /education/MICE fees
India 414 85 29 110 112 54 42 36 28 45 Bangladesh
355 206 . 274 210 127 113 34 . .
United Kingdom (UK)
1200 . . 100 700 130 . . . .
Australia
1650 . . . 72 125 . . 100 .
Other European countries
261 . . . 140 80 20 . . .
Other South Asian Countries
1400 . . . 145 20 50 . . .
Total 473 93 29 122 118 59 47 36 43 45
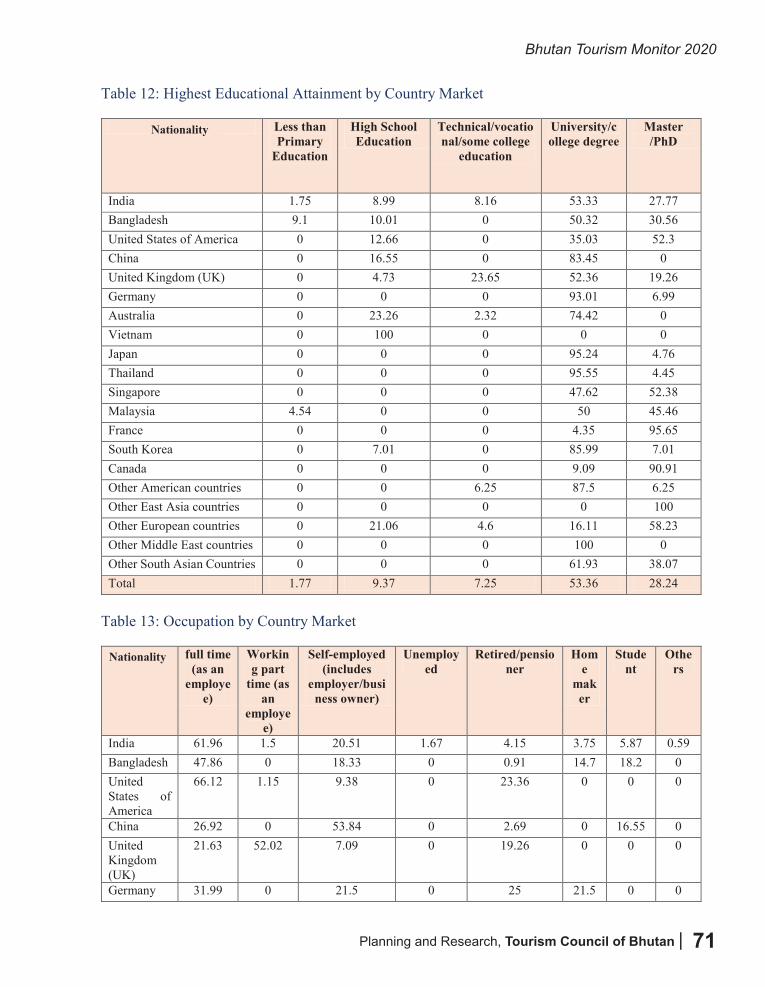
Planning and Research, Tourism Council of Bhutan |
Bhutan Tourism Monitor 2020
71
Bhutan Tourism Monitor 2020 -------------------------------------------------------------------------------------------------------------------------------
--------------------------------------------------------------------------------------------------------------------- Planning and Research, Tourism Council of Bhutan 65
Table 12: Highest Educational Attainment by Country Market
nationality Less than Primary
Education
High School Education
Technical/vocational/some college
education
University/college degree
Master /PhD
India 1.75 8.99 8.16 53.33 27.77 Bangladesh 9.1 10.01 0 50.32 30.56 United States of America 0 12.66 0 35.03 52.3 China 0 16.55 0 83.45 0 United Kingdom (UK) 0 4.73 23.65 52.36 19.26 Germany 0 0 0 93.01 6.99 Australia 0 23.26 2.32 74.42 0 Vietnam 0 100 0 0 0 Japan 0 0 0 95.24 4.76 Thailand 0 0 0 95.55 4.45 Singapore 0 0 0 47.62 52.38 Malaysia 4.54 0 0 50 45.46 France 0 0 0 4.35 95.65 South Korea 0 7.01 0 85.99 7.01 Canada 0 0 0 9.09 90.91 Other American countries 0 0 6.25 87.5 6.25 Other East Asia countries 0 0 0 0 100 Other European countries 0 21.06 4.6 16.11 58.23 Other Middle East countries 0 0 0 100 0 Other South Asian Countries 0 0 0 61.93 38.07 Total 1.77 9.37 7.25 53.36 28.24
Table 13: Occupation by Country Market
nationality full time (as an
employee)
Working part
time (as an
employee)
Self-employed (includes
employer/business owner)
Unemployed
Retired/pensioner
Home
maker
Student
Others
India 61.96 1.5 20.51 1.67 4.15 3.75 5.87 0.59 Bangladesh 47.86 0 18.33 0 0.91 14.7 18.2 0 United States of America
66.12 1.15 9.38 0 23.36 0 0 0
China 26.92 0 53.84 0 2.69 0 16.55 0 United Kingdom (UK)
21.63 52.02 7.09 0 19.26 0 0 0
Germany 31.99 0 21.5 0 25 21.5 0 0
Nationality
Nationality
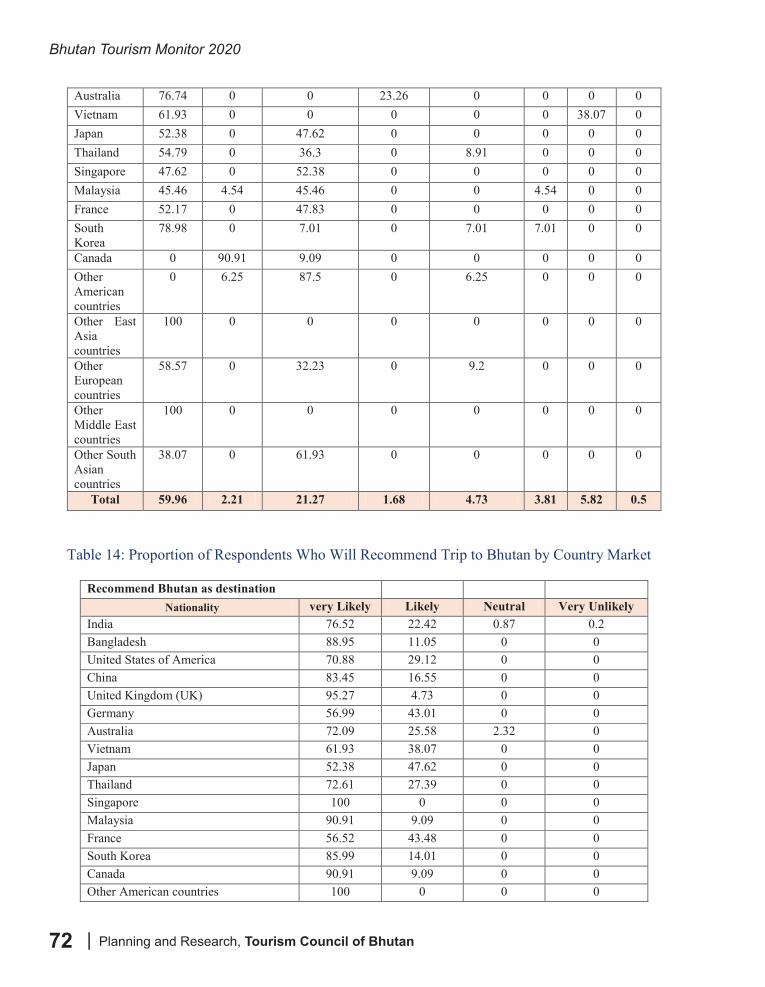
Bhutan Tourism Monitor 2020
| Planning and Research, Tourism Council of Bhutan72
Bhutan Tourism Monitor 2020 -------------------------------------------------------------------------------------------------------------------------------
--------------------------------------------------------------------------------------------------------------------- Planning and Research, Tourism Council of Bhutan 66
Australia 76.74 0 0 23.26 0 0 0 0 Vietnam 61.93 0 0 0 0 0 38.07 0 Japan 52.38 0 47.62 0 0 0 0 0 Thailand 54.79 0 36.3 0 8.91 0 0 0 Singapore 47.62 0 52.38 0 0 0 0 0 Malaysia 45.46 4.54 45.46 0 0 4.54 0 0 France 52.17 0 47.83 0 0 0 0 0 South Korea
78.98 0 7.01 0 7.01 7.01 0 0
Canada 0 90.91 9.09 0 0 0 0 0 Other American countries
0 6.25 87.5 0 6.25 0 0 0
Other East Asia countries
100 0 0 0 0 0 0 0
Other European countries
58.57 0 32.23 0 9.2 0 0 0
Other Middle East countries
100 0 0 0 0 0 0 0
Other South Asian countries
38.07 0 61.93 0 0 0 0 0
Total 59.96 2.21 21.27 1.68 4.73 3.81 5.82 0.5 Table 14: Proportion of Respondents Who Will Recommend Trip to Bhutan by Country Market & Who are like to return Bhutan
Recommend Bhutan as destination nationality very Likely Likely Neutral Very Unlikely
India 76.52 22.42 0.87 0.2 Bangladesh 88.95 11.05 0 0 United States of America 70.88 29.12 0 0 China 83.45 16.55 0 0 United Kingdom (UK) 95.27 4.73 0 0 Germany 56.99 43.01 0 0 Australia 72.09 25.58 2.32 0 Vietnam 61.93 38.07 0 0 Japan 52.38 47.62 0 0 Thailand 72.61 27.39 0 0 Singapore 100 0 0 0 Malaysia 90.91 9.09 0 0 France 56.52 43.48 0 0 South Korea 85.99 14.01 0 0 Canada 90.91 9.09 0 0 Other American countries 100 0 0 0
Nationality
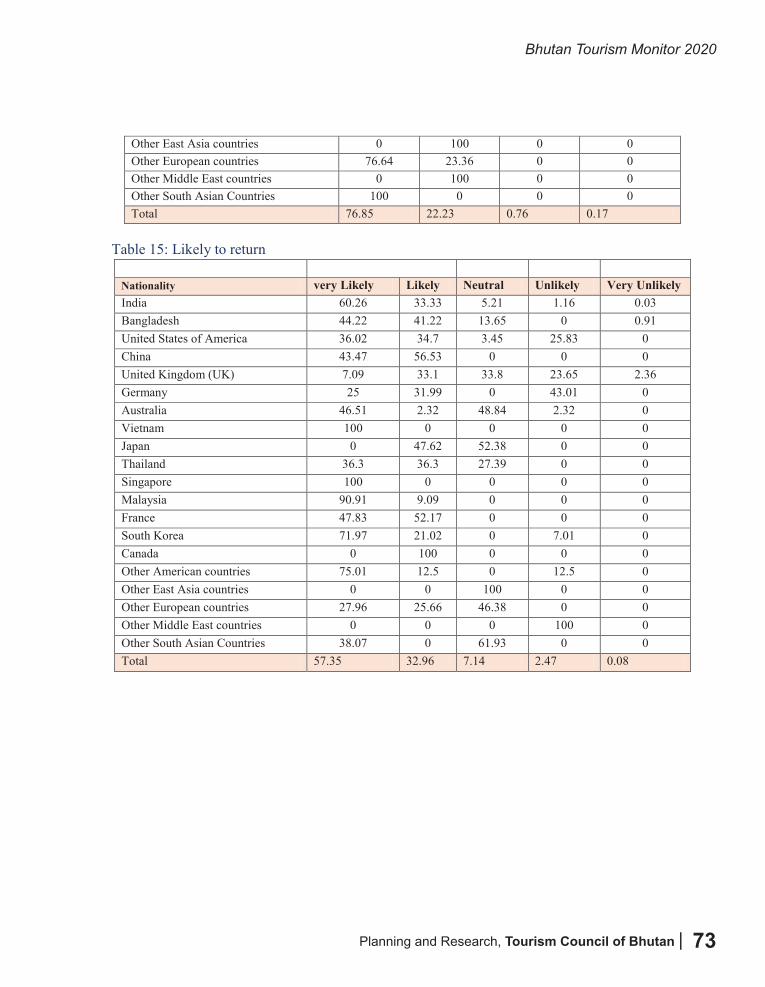
Planning and Research, Tourism Council of Bhutan |
Bhutan Tourism Monitor 2020
73
Bhutan Tourism Monitor 2020 -------------------------------------------------------------------------------------------------------------------------------
--------------------------------------------------------------------------------------------------------------------- Planning and Research, Tourism Council of Bhutan 67
Other East Asia countries 0 100 0 0 Other European countries 76.64 23.36 0 0 Other Middle East countries 0 100 0 0 Other South Asian Countries 100 0 0 0 Total 76.85 22.23 0.76 0.17
Table 15: Likely to return
nationality very Likely Likely Neutral Unlikely Very Unlikely India 60.26 33.33 5.21 1.16 0.03 Bangladesh 44.22 41.22 13.65 0 0.91 United States of America 36.02 34.7 3.45 25.83 0 China 43.47 56.53 0 0 0 United Kingdom (UK) 7.09 33.1 33.8 23.65 2.36 Germany 25 31.99 0 43.01 0 Australia 46.51 2.32 48.84 2.32 0 Vietnam 100 0 0 0 0 Japan 0 47.62 52.38 0 0 Thailand 36.3 36.3 27.39 0 0 Singapore 100 0 0 0 0 Malaysia 90.91 9.09 0 0 0 France 47.83 52.17 0 0 0 South Korea 71.97 21.02 0 7.01 0 Canada 0 100 0 0 0 Other American countries 75.01 12.5 0 12.5 0 Other East Asia countries 0 0 100 0 0 Other European countries 27.96 25.66 46.38 0 0 Other Middle East countries 0 0 0 100 0 Other South Asian Countries 38.07 0 61.93 0 0 Total 57.35 32.96 7.14 2.47 0.08
Nationality
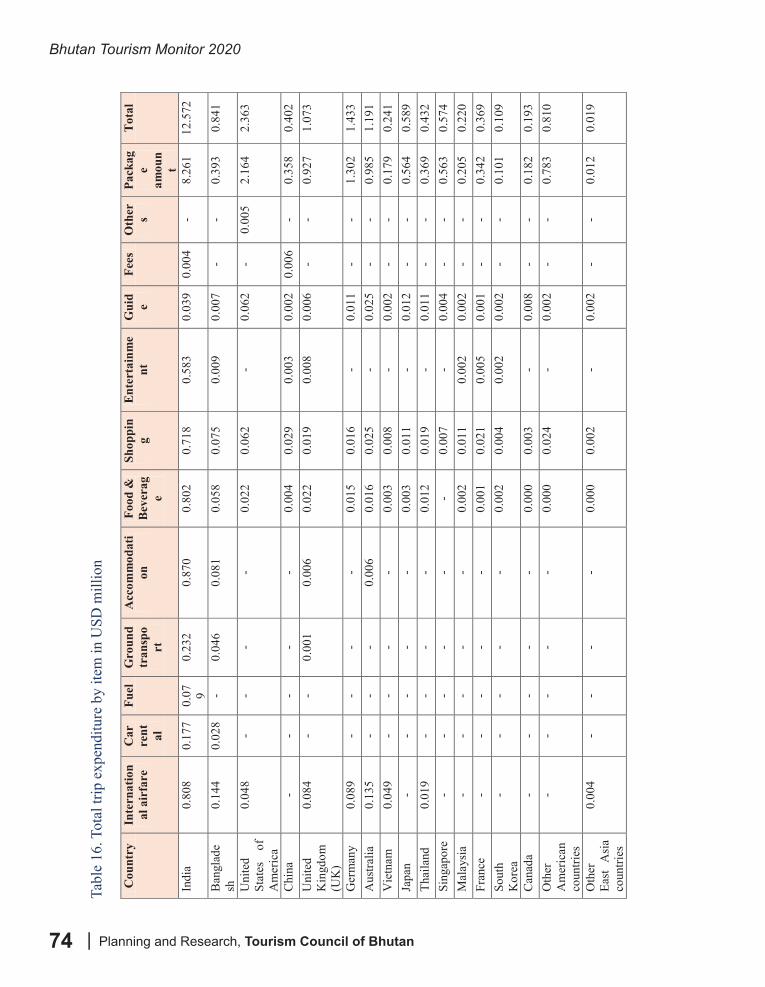
Bhutan Tourism Monitor 2020
| Planning and Research, Tourism Council of Bhutan74
Bhu
tan
Tour
ism
Mon
itor 2
020
----
----
----
----
----
----
----
----
----
----
----
----
----
----
----
----
----
----
----
----
----
----
----
----
----
----
----
----
----
----
----
---
----
----
----
----
----
----
----
----
----
----
----
----
----
----
----
----
----
----
----
----
----
----
----
----
----
----
----
----
----
- Pl
anni
ng a
nd R
esea
rch,
Tou
rism
Cou
ncil
of B
huta
n
68
Ta
ble
16: T
otal
trip
exp
endi
ture
by
item
Cou
ntry
In
tern
atio
nal
air
fare
C
ar
rent al
Fuel
G
roun
d tr
ansp
ort
Acc
omm
odat
ion
Fo
od &
B
ever
age
Shop
pin
g E
nter
tain
me
nt
Gui
de
Fees
O
ther s
Pack
age
amou
nt
Tot
al
Indi
a 0.
808
0.17
7 0.
07 9 0.
232
0.87
0 0.
802
0.71
8 0.
583
0.03
9 0.
004
- 8.
261
12.5
72
Ban
glad
esh
0.
144
0.02
8 -
0.04
6 0.
081
0.05
8 0.
075
0.00
9 0.
007
- -
0.39
3 0.
841
Uni
ted
Stat
es
of
Am
eric
a
0.04
8 -
- -
- 0.
022
0.06
2 -
0.06
2 -
0.00
5 2.
164
2.36
3
Chi
na
- -
- -
- 0.
004
0.02
9 0.
003
0.00
2 0.
006
- 0.
358
0.40
2 U
nite
d K
ingd
om
(UK
)
0.08
4 -
- 0.
001
0.00
6 0.
022
0.01
9 0.
008
0.00
6 -
- 0.
927
1.07
3
Ger
man
y 0.
089
- -
- -
0.01
5 0.
016
- 0.
011
- -
1.30
2 1.
433
Aus
tralia
0.
135
- -
- 0.
006
0.01
6 0.
025
- 0.
025
- -
0.98
5 1.
191
Vie
tnam
0.
049
- -
- -
0.00
3 0.
008
- 0.
002
- -
0.17
9 0.
241
Japa
n -
- -
- -
0.00
3 0.
011
- 0.
012
- -
0.56
4 0.
589
Thai
land
0.
019
- -
- -
0.01
2 0.
019
- 0.
011
- -
0.36
9 0.
432
Sing
apor
e -
- -
- -
- 0.
007
- 0.
004
- -
0.56
3 0.
574
Mal
aysi
a -
- -
- -
0.00
2 0.
011
0.00
2 0.
002
- -
0.20
5 0.
220
Fran
ce
- -
- -
- 0.
001
0.02
1 0.
005
0.00
1 -
- 0.
342
0.36
9 So
uth
Kor
ea
- -
- -
- 0.
002
0.00
4 0.
002
0.00
2 -
- 0.
101
0.10
9
Can
ada
- -
- -
- 0.
000
0.00
3 -
0.00
8 -
- 0.
182
0.19
3 O
ther
A
mer
ican
co
untri
es
- -
- -
- 0.
000
0.02
4 -
0.00
2 -
- 0.
783
0.81
0
Oth
er
East
Asi
a co
untri
es
0.00
4 -
- -
- 0.
000
0.00
2 -
0.00
2 -
- 0.
012
0.01
9
Tabl
e 16
. Tot
al tr
ip e
xpen
ditu
re b
y ite
m in
USD
mill
ion
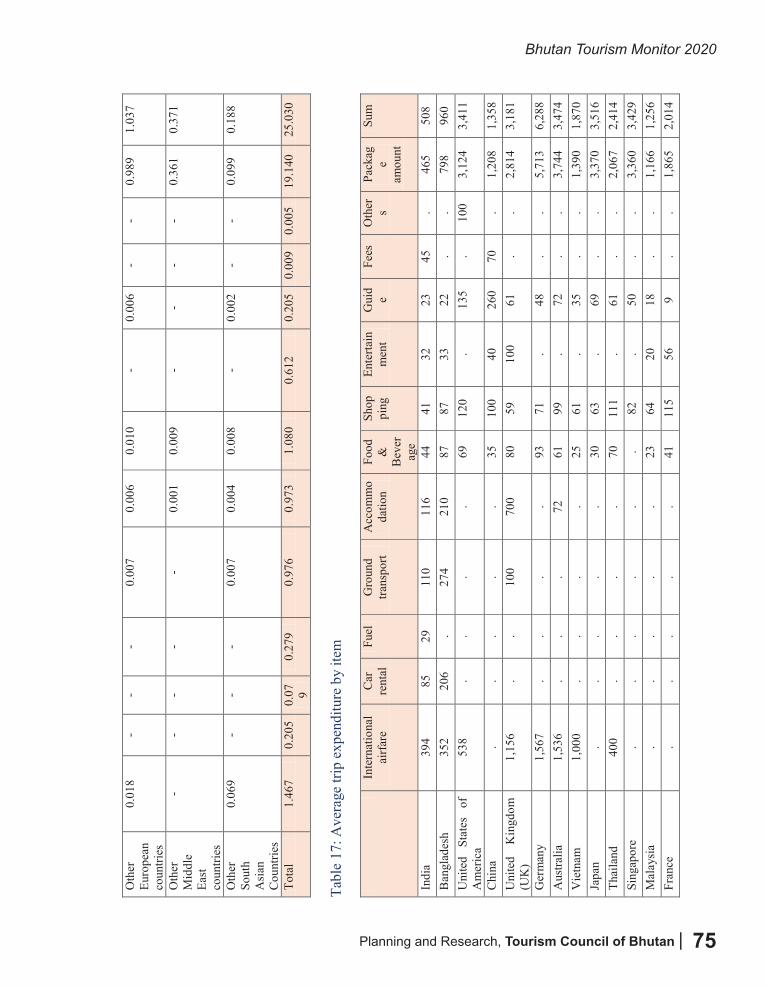
Planning and Research, Tourism Council of Bhutan |
Bhutan Tourism Monitor 2020
75
Bhu
tan
Tour
ism
Mon
itor 2
020
----
----
----
----
----
----
----
----
----
----
----
----
----
----
----
----
----
----
----
----
----
----
----
----
----
----
----
----
----
----
----
---
----
----
----
----
----
----
----
----
----
----
----
----
----
----
----
----
----
----
----
----
----
----
----
----
----
----
----
----
----
- Pl
anni
ng a
nd R
esea
rch,
Tou
rism
Cou
ncil
of B
huta
n
69
O
ther
Eu
rope
an
coun
tries
0.01
8 -
- -
0.00
7 0.
006
0.01
0 -
0.00
6 -
- 0.
989
1.03
7
Oth
er
Mid
dle
East
co
untri
es
- -
- -
- 0.
001
0.00
9 -
- -
- 0.
361
0.37
1
Oth
er
Sout
h A
sian
C
ount
ries
0.06
9 -
- -
0.00
7 0.
004
0.00
8 -
0.00
2 -
- 0.
099
0.18
8
Tota
l 1.
467
0.20
5 0.
07 9 0.
279
0.97
6 0.
973
1.08
0 0.
612
0.20
5 0.
009
0.00
5 19
.140
25
.030
Tabl
e 17
: Ave
rage
trip
exp
endi
ture
by
item
In
tern
atio
nal
airf
are
Car
re
ntal
Fu
el
Gro
und
trans
port
Acc
omm
oda
tion
Food
&
B
ever
age
Shop
ping
En
terta
inm
ent
Gui
de
Fees
O
ther s
Pack
age
amou
nt
Sum
Indi
a 39
4 85
29
11
0 11
6 44
41
32
23
45
.
465
508
Ban
glad
esh
352
206
. 27
4 21
0 87
87
33
22
.
. 79
8 96
0 U
nite
d St
ates
of
A
mer
ica
538
. .
. .
69
120
. 13
5 .
100
3,12
4 3,
411
Chi
na
. .
. .
. 35
10
0 40
26
0 70
.
1,20
8 1,
358
Uni
ted
Kin
gdom
(U
K)
1,15
6 .
. 10
0 70
0 80
59
10
0 61
.
. 2,
814
3,18
1
Ger
man
y 1,
567
. .
. .
93
71
. 48
.
. 5,
713
6,28
8 A
ustra
lia
1,53
6 .
. .
72
61
99
. 72
.
. 3,
744
3,47
4 V
ietn
am
1,00
0 .
. .
. 25
61
.
35
. .
1,39
0 1,
870
Japa
n .
. .
. .
30
63
. 69
.
. 3,
370
3,51
6 Th
aila
nd
400
. .
. .
70
111
. 61
.
. 2,
067
2,41
4 Si
ngap
ore
. .
. .
. .
82
. 50
.
. 3,
360
3,42
9 M
alay
sia
. .
. .
. 23
64
20
18
.
. 1,
166
1,25
6 Fr
ance
.
. .
. .
41
115
56
9 .
. 1,
865
2,01
4
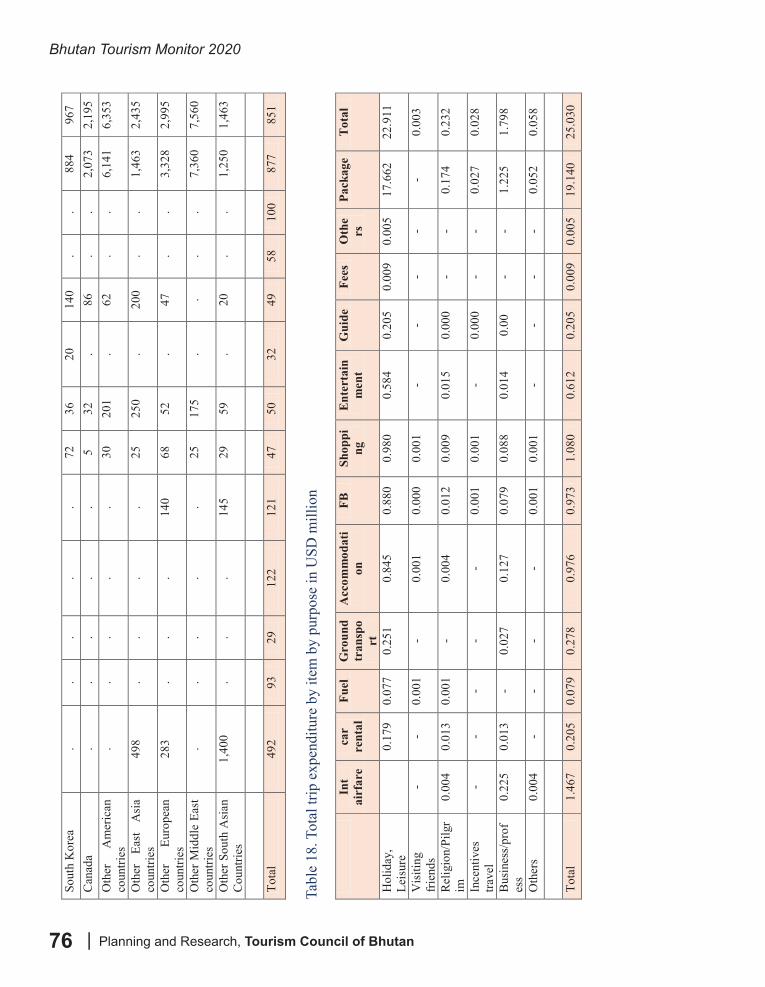
Bhutan Tourism Monitor 2020
| Planning and Research, Tourism Council of Bhutan76
Bhu
tan
Tour
ism
Mon
itor 2
020
----
----
----
----
----
----
----
----
----
----
----
----
----
----
----
----
----
----
----
----
----
----
----
----
----
----
----
----
----
----
----
---
----
----
----
----
----
----
----
----
----
----
----
----
----
----
----
----
----
----
----
----
----
----
----
----
----
----
----
----
----
- Pl
anni
ng a
nd R
esea
rch,
Tou
rism
Cou
ncil
of B
huta
n
70
So
uth
Kor
ea
. .
. .
. 72
36
20
14
0 .
. 88
4 96
7 C
anad
a .
. .
. .
5 32
.
86
. .
2,07
3 2,
195
Oth
er
Am
eric
an
coun
tries
.
. .
. .
30
201
. 62
.
. 6,
141
6,35
3
Oth
er
East
A
sia
coun
tries
49
8 .
. .
. 25
25
0 .
200
. .
1,46
3 2,
435
Oth
er
Euro
pean
co
untri
es
283
. .
. 14
0 68
52
.
47
. .
3,32
8 2,
995
Oth
er M
iddl
e Ea
st
coun
tries
.
. .
. .
25
175
. .
. .
7,36
0 7,
560
Oth
er S
outh
Asi
an
Cou
ntrie
s 1,
400
. .
. 14
5 29
59
.
20
. .
1,25
0 1,
463
Tota
l 49
2 93
29
12
2 12
1 47
50
32
49
58
10
0 87
7 85
1
Tabl
e 18
: Tot
al tr
ip e
xpen
ditu
re b
y ite
m b
y pu
rpos
e
Int
airf
are
car
rent
al
Fuel
G
roun
d tr
ansp
ort
Acc
omm
odat
ion
FB
Sh
oppi
ng
Ent
erta
inm
ent
Gui
de
Fees
O
the
rs
Pack
age
Tot
al
Hol
iday
, Le
isur
e
0.17
9 0.
077
0.25
1 0.
845
0.88
0 0.
980
0.58
4 0.
205
0.00
9 0.
005
17.6
62
22.9
11
Vis
iting
fr
iend
s -
- 0.
001
- 0.
001
0.00
0 0.
001
- -
- -
- 0.
003
Rel
igio
n/Pi
lgr
im
0.00
4 0.
013
0.00
1 -
0.00
4 0.
012
0.00
9 0.
015
0.00
0 -
- 0.
174
0.23
2
Ince
ntiv
es
trave
l -
- -
- -
0.00
1 0.
001
- 0.
000
- -
0.02
7 0.
028
Bus
ines
s/pr
ofes
s 0.
225
0.01
3 -
0.02
7 0.
127
0.07
9 0.
088
0.01
4 0.
00
- -
1.22
5 1.
798
Oth
ers
0.00
4 -
- -
- 0.
001
0.00
1 -
- -
- 0.
052
0.05
8
To
tal
1.46
7 0.
205
0.07
9 0.
278
0.97
6 0.
973
1.08
0 0.
612
0.20
5 0.
009
0.00
5 19
.140
25
.030
Tabl
e 18
. Tot
al tr
ip e
xpen
ditu
re b
y ite
m b
y pu
rpos
e in
USD
mill
ion
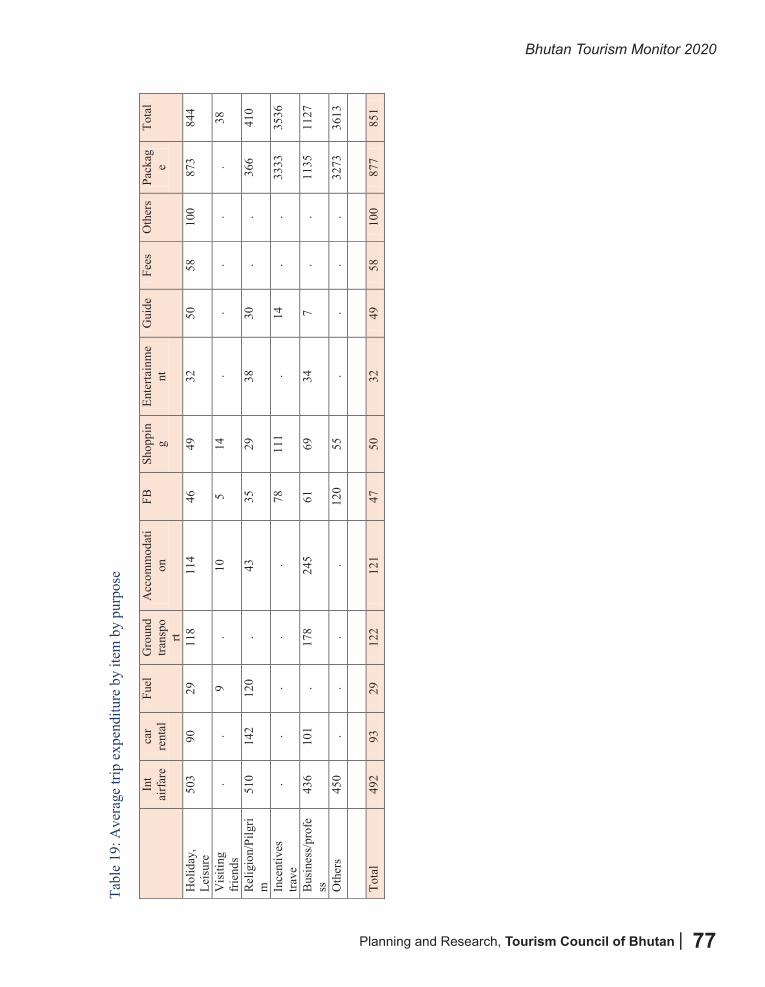
Planning and Research, Tourism Council of Bhutan |
Bhutan Tourism Monitor 2020
77
Bhu
tan
Tour
ism
Mon
itor 2
020
----
----
----
----
----
----
----
----
----
----
----
----
----
----
----
----
----
----
----
----
----
----
----
----
----
----
----
----
----
----
----
---
----
----
----
----
----
----
----
----
----
----
----
----
----
----
----
----
----
----
----
----
----
----
----
----
----
----
----
----
----
- Pl
anni
ng a
nd R
esea
rch,
Tou
rism
Cou
ncil
of B
huta
n
71
Ta
ble
19: A
vera
ge tr
ip e
xpen
ditu
re b
y ite
m b
y pu
rpos
e
Int
airf
are
car
rent
al
Fuel
G
roun
d tra
nspo
rt
Acc
omm
odat
ion
FB
Sh
oppi
ng
Ente
rtain
me
nt
Gui
de
Fees
O
ther
s Pa
ckag
e To
tal
Hol
iday
, Le
isur
e 50
3 90
29
11
8 11
4 46
49
32
50
58
10
0 87
3 84
4
Vis
iting
fr
iend
s .
. 9
. 10
5
14
. .
. .
. 38
Rel
igio
n/Pi
lgri
m
510
142
120
. 43
35
29
38
30
.
. 36
6 41
0
Ince
ntiv
es
trave
.
. .
. .
78
111
. 14
.
. 33
33
3536
Bus
ines
s/pr
ofe
ss
436
101
. 17
8 24
5 61
69
34
7
. .
1135
11
27
Oth
ers
450
. .
. .
120
55
. .
. .
3273
36
13
Tota
l 49
2 93
29
12
2 12
1 47
50
32
49
58
10
0 87
7 85
1 Ta
ble
20: T
ype
of a
ccom
mod
atio
n us
ed b
y C
ount
ry
Dzo
ngkh
ag
Cat
egor
y In
dia
B
angl
ade
sh
US
A
Chi
na
Sing
apo
re
U K
Thai
lan
d G
erm
any
Aus
tral
ia
Jap
an
Mal
ays
ia
Vie
tna
m
Fra
nce
Can
ada
Sp ain
Oth
er
Afr
ican
co
unt
ries
Oth
er
Am
eric
an
coun
trie
s
Oth
er
East
Asi
a an
d th
e Pa
cif
ic
coun
trie
s
Oth
er
Euro
pean
co
unt
ries
Oth
er
Mid
dle
Ea
st co
unt
ries
Tot
al
Paro
4
or 5
sta
r ac
com
mo
datio
n
7.1
2 12
.00
34.
48
40.
00
50.0
0 37
.50
42
.86
0.00
0.
00
42.
86
66.6
7 25
.00
40.
00
20.0
0 50
.00
28
.57
100.
00
36.8
4 0.
00
0.00
12
.59
3 sta
r ac
com
mo
datio
n
47.
19
76.0
0 62
.07
20
.00
42
.86
62.
50
57.1
4 10
0.0
0 10
0.0
0 57
.14
33
.33
75.0
0 40
.00
80
.00
50.
00
71.4
3 0.
00
52.6
3 0.
00
50.0
0 49
.93
Bud
get
hote
l/Non
-Sta
r hot
el
35.
39
0.00
0.
00
0.0
0 0.
00
0.0
0 0.
00
0.00
0.
00
0.0
0 0.
00
0.00
0.
00
0.00
0.
00
0.00
0.
00
0.00
0.
00
0.00
27
.67
Bhutan Tourism Monitor 2020
| Planning and Research, Tourism Council of Bhutan78
Tourism Council of Bhutan
P.O.Box 126, GPO
Thimphu, Bhutan
Tel: +975 - 2 - 323251 / 323252
Fax: +975 - 2 - 343695
Email: [email protected]
Web: www.bhutan.travel | www.tourism.gov.bt
ISBN 978-99936-834-4-5
tourismbhutantourismbhutandestinationbhutantourismbhutan


![NAME OF THE PROJECT: [DEVELOPMENT OF TOURISM …...NAME OF THE PROJECT: [DEVELOPMENT OF TOURISM RELATED INFRASTRUCTURE] Letter of Invitation The [Tourism Council of Bhutan] has a budget](https://img.pdfslide.us/doc/110x75/5e9be2731b419f124916b9be/name-of-the-project-development-of-tourism-name-of-the-project-development.jpg)