Embed Size (px)
Citation preview
Bhutan Tourism Monitor 2017
1
BHUTAN TOURISM MONITOR
2017
Publication of the Tourism Council of Bhutan
Bhutan Tourism Monitor 2017
2
Publication of the Tourism Council of Bhutan
Tourism Council of Bhutan
---------------------------------
BHUTAN TOURISM MONITOR 2017
Publication of the Tourism Council of Bhutan
Bhutan Tourism Monitor 2017
3
FOREWORD
The Tourism Council of Bhutan is pleased to present the Bhutan Tourism Monitor (BTM) 2017 – an annual statistical publication. This important report presents the performance of the tourism industry in the year 2017, market trends over the years, and various other analysis on the key aspects that provide significant market intelligence and insights about the industry. Tourism research and statistical development is a priority area for the Tourism Council of Bhutan (TCB) to guide policy for sustainable tourism development in Bhutan. The report also seeks to provide the tourism industry with objective information, findings and analyses to meet varied needs to support policy, marketing and commercial decisions relating to the sector. Bhutan’s tourism industry continued to grow in 2017 contributing significantly towards socio-economic development through revenue and foreign currency generation and employment creation amongst others. A total of 254,704 foreign individuals visited Bhutan in 2017 which is an increase of 21.5% over 2016. International arrivals grew by 13.8% to 71,417 over 2016 while arrivals from the regional market grew by 25%. A total of 62,272 international leisure arrivals alone was recorded in 2017 which represents a growth of 14.1% over the previous year and this is the highest number till date. Arrivals from South Korea increased significantly to 6,048 in 2017 compared to 1,035 in 2016 registering a growth rate of 484 % on account of the Bhutan –Korea friendship offer. Bhutan continues to be an attractive tourism destination which is evident from the growing popularity resulting in increase in arrivals annually. Bhutan also continues to gain impetus in the international community as a sustainable tourism destination as evidenced from the Earth Award won by Bhutan during the Sustainable Tourism Top 100 Awards Ceremony at International Tourismus-Borse (ITB) Berlin 2018. Despite the growth we still face the problem of seasonality and unbalanced regional spread. Towards this end, the Royal Government has introduced the wavier of Sustainable Development Fee (SDF) for tourist visiting the six eastern districts for a period of 3 years. As a destination with emphasis on sustainability at the core of its development agenda, it is important that appropriate interventions are put in place to further sustainable growth with emphasis on regional spread and in making Bhutan a year round tourism destination. To this end, it is only imperative that we continue to make concerted efforts to develop and promote sustainable tourism in Bhutan for greater benefits. For this, emphasis will be placed on better visitor management to enhance visitor experiences and spread tourism benefits to wider sections of the population through innovation, service excellence, strong and a diversified product portfolio. I would like to extend my deep appreciation to all stakeholders for your continued support and contribution to tourism in Bhutan. Tashi Delek Chhimmy Pem Director
Bhutan Tourism Monitor 2017
4
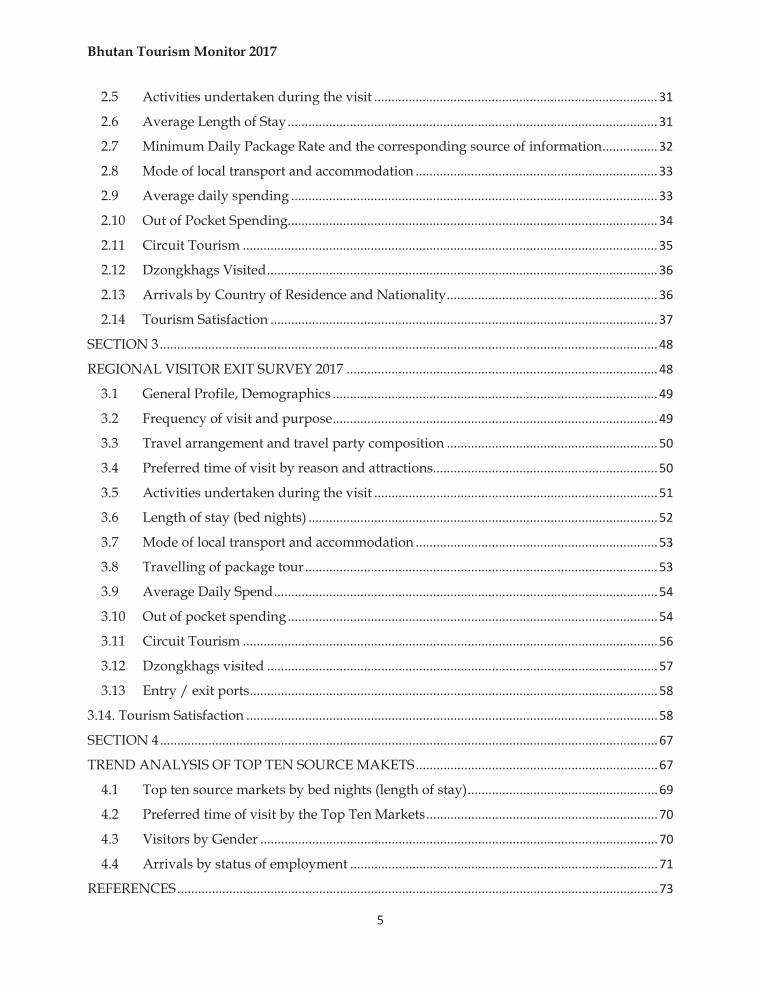
TABLE OF CONTENTS
I EXECUTIVE SUMMARY .................................................................................................................. 7
II INTRODUCTION .............................................................................................................................. 8
III STUDY DESIGN AND METHODOLOGY ................................................................................. 9
SECTION 1 ................................................................................................................................................ 10
ANNUAL TOURISM STATISTICS ....................................................................................................... 10
PART 1: ANNUAL VISITOR ARRIVALS STATISTICS ................................................................. 11
1.1 2017 visitor arrivals and five years trends ........................................................................ 11
1.2 Categories of visitor arrivals by purpose of visit and mode of transportation used .. 11
1.3 Visitor arrivals by month and category and mode of transportation ................................. 12
1.4 Major Source Markets ................................................................................................................ 13
PART II: INTERNATIONAL LEISURE ARRIVALS ................................................................... 15
2.1 International leisure arrivals .............................................................................................. 15
2.2 Major International Source Markets .................................................................................. 15
2.2.1 Top ten major source international markets over the past decade ........................... 16
2.3 Global Segmentation of source markets ........................................................................... 17
2.4 Major international source market by months ................................................................. 17
2.5 Popular Festivals .................................................................................................................. 19
2.6 Trekkers by Route ................................................................................................................ 21
2.7 Spread of Tourism Impact .................................................................................................. 22
2.8 Average length of stay ......................................................................................................... 23
2.9 Arrivals by Activity ............................................................................................................. 24
2.10 Arrivals by Gender and Age .............................................................................................. 24
2.11 Tourism Earnings from International Leisure tourists (in USD Million) ..................... 25
PART III REGIONAL ARRIVAL STATISTICS ................................................................................ 26
SECTION 2 ................................................................................................................................................ 27
INTERNATIONAL VISITOR SURVEY 2017 ....................................................................................... 27
2.1 Demographic, socio-economic and educational characteristics of the respondents ...... 28
2.2 Frequency of visits to Bhutan by purpose ............................................................................ 29
2.4 Preferred time of visit by reason and attractions................................................................. 30
Bhutan Tourism Monitor 2017
5
2.5 Activities undertaken during the visit .................................................................................. 31
2.6 Average Length of Stay ........................................................................................................... 31
2.7 Minimum Daily Package Rate and the corresponding source of information ................ 32
2.8 Mode of local transport and accommodation ...................................................................... 33
2.9 Average daily spending .......................................................................................................... 33
2.10 Out of Pocket Spending........................................................................................................... 34
2.11 Circuit Tourism ........................................................................................................................ 35
2.12 Dzongkhags Visited ................................................................................................................. 36
2.13 Arrivals by Country of Residence and Nationality ............................................................. 36
2.14 Tourism Satisfaction ................................................................................................................ 37
SECTION 3 ................................................................................................................................................ 48
REGIONAL VISITOR EXIT SURVEY 2017 .......................................................................................... 48
3.1 General Profile, Demographics .............................................................................................. 49
3.2 Frequency of visit and purpose .............................................................................................. 49
3.3 Travel arrangement and travel party composition ............................................................. 50
3.4 Preferred time of visit by reason and attractions................................................................. 50
3.5 Activities undertaken during the visit .................................................................................. 51
3.6 Length of stay (bed nights) ..................................................................................................... 52
3.7 Mode of local transport and accommodation ...................................................................... 53
3.8 Travelling of package tour ...................................................................................................... 53
3.9 Average Daily Spend ............................................................................................................... 54
3.10 Out of pocket spending ........................................................................................................... 54
3.11 Circuit Tourism ........................................................................................................................ 56
3.12 Dzongkhags visited ................................................................................................................. 57
3.13 Entry / exit ports ...................................................................................................................... 58
3.14. Tourism Satisfaction ....................................................................................................................... 58
SECTION 4 ................................................................................................................................................ 67
TREND ANALYSIS OF TOP TEN SOURCE MAKETS ...................................................................... 67
4.1 Top ten source markets by bed nights (length of stay) ....................................................... 69
4.2 Preferred time of visit by the Top Ten Markets ................................................................... 70
4.3 Visitors by Gender ................................................................................................................... 70
4.4 Arrivals by status of employment ......................................................................................... 71
REFERENCES ........................................................................................................................................... 73
Bhutan Tourism Monitor 2017
6
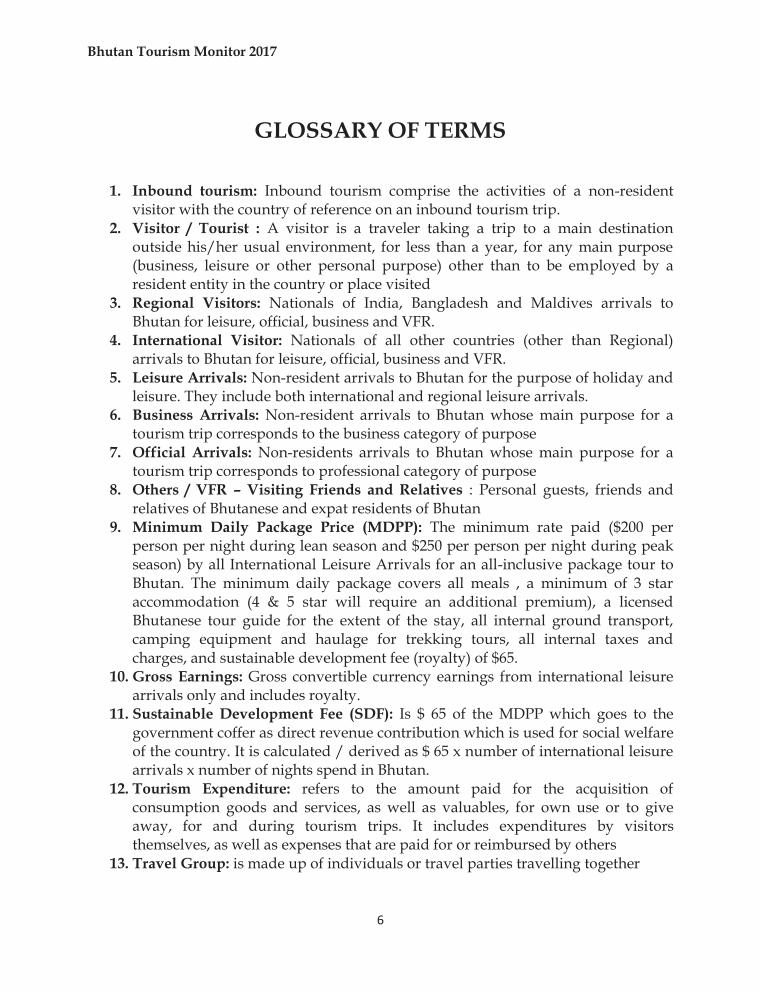
GLOSSARY OF TERMS
1. Inbound tourism: Inbound tourism comprise the activities of a non-resident visitor with the country of reference on an inbound tourism trip.
2. Visitor / Tourist : A visitor is a traveler taking a trip to a main destination outside his/her usual environment, for less than a year, for any main purpose (business, leisure or other personal purpose) other than to be employed by a resident entity in the country or place visited
3. Regional Visitors: Nationals of India, Bangladesh and Maldives arrivals to Bhutan for leisure, official, business and VFR.
4. International Visitor: Nationals of all other countries (other than Regional) arrivals to Bhutan for leisure, official, business and VFR.
5. Leisure Arrivals: Non-resident arrivals to Bhutan for the purpose of holiday and leisure. They include both international and regional leisure arrivals.
6. Business Arrivals: Non-resident arrivals to Bhutan whose main purpose for a tourism trip corresponds to the business category of purpose
7. Official Arrivals: Non-residents arrivals to Bhutan whose main purpose for a tourism trip corresponds to professional category of purpose
8. Others / VFR – Visiting Friends and Relatives : Personal guests, friends and relatives of Bhutanese and expat residents of Bhutan
9. Minimum Daily Package Price (MDPP): The minimum rate paid ($200 per person per night during lean season and $250 per person per night during peak season) by all International Leisure Arrivals for an all-inclusive package tour to Bhutan. The minimum daily package covers all meals , a minimum of 3 star accommodation (4 & 5 star will require an additional premium), a licensed Bhutanese tour guide for the extent of the stay, all internal ground transport, camping equipment and haulage for trekking tours, all internal taxes and charges, and sustainable development fee (royalty) of $65.
10. Gross Earnings: Gross convertible currency earnings from international leisure arrivals only and includes royalty.
11. Sustainable Development Fee (SDF): Is $ 65 of the MDPP which goes to the government coffer as direct revenue contribution which is used for social welfare of the country. It is calculated / derived as $ 65 x number of international leisure arrivals x number of nights spend in Bhutan.
12. Tourism Expenditure: refers to the amount paid for the acquisition of consumption goods and services, as well as valuables, for own use or to give away, for and during tourism trips. It includes expenditures by visitors themselves, as well as expenses that are paid for or reimbursed by others
13. Travel Group: is made up of individuals or travel parties travelling together
Bhutan Tourism Monitor 2017
7
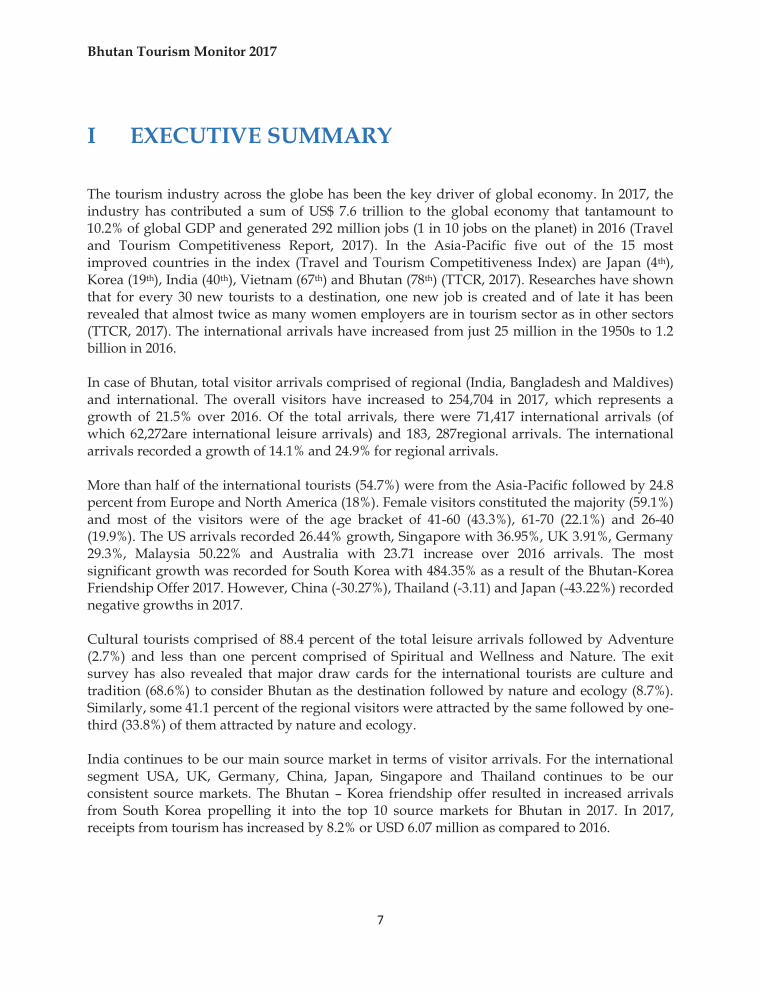
I EXECUTIVE SUMMARY The tourism industry across the globe has been the key driver of global economy. In 2017, the industry has contributed a sum of US$ 7.6 trillion to the global economy that tantamount to 10.2% of global GDP and generated 292 million jobs (1 in 10 jobs on the planet) in 2016 (Travel and Tourism Competitiveness Report, 2017). In the Asia-Pacific five out of the 15 most improved countries in the index (Travel and Tourism Competitiveness Index) are Japan (4th), Korea (19th), India (40th), Vietnam (67th) and Bhutan (78th) (TTCR, 2017). Researches have shown that for every 30 new tourists to a destination, one new job is created and of late it has been revealed that almost twice as many women employers are in tourism sector as in other sectors (TTCR, 2017). The international arrivals have increased from just 25 million in the 1950s to 1.2 billion in 2016. In case of Bhutan, total visitor arrivals comprised of regional (India, Bangladesh and Maldives) and international. The overall visitors have increased to 254,704 in 2017, which represents a growth of 21.5% over 2016. Of the total arrivals, there were 71,417 international arrivals (of which 62,272are international leisure arrivals) and 183, 287regional arrivals. The international arrivals recorded a growth of 14.1% and 24.9% for regional arrivals. More than half of the international tourists (54.7%) were from the Asia-Pacific followed by 24.8 percent from Europe and North America (18%). Female visitors constituted the majority (59.1%) and most of the visitors were of the age bracket of 41-60 (43.3%), 61-70 (22.1%) and 26-40 (19.9%). The US arrivals recorded 26.44% growth, Singapore with 36.95%, UK 3.91%, Germany 29.3%, Malaysia 50.22% and Australia with 23.71 increase over 2016 arrivals. The most significant growth was recorded for South Korea with 484.35% as a result of the Bhutan-Korea Friendship Offer 2017. However, China (-30.27%), Thailand (-3.11) and Japan (-43.22%) recorded negative growths in 2017. Cultural tourists comprised of 88.4 percent of the total leisure arrivals followed by Adventure (2.7%) and less than one percent comprised of Spiritual and Wellness and Nature. The exit survey has also revealed that major draw cards for the international tourists are culture and tradition (68.6%) to consider Bhutan as the destination followed by nature and ecology (8.7%). Similarly, some 41.1 percent of the regional visitors were attracted by the same followed by one-third (33.8%) of them attracted by nature and ecology. India continues to be our main source market in terms of visitor arrivals. For the international segment USA, UK, Germany, China, Japan, Singapore and Thailand continues to be our consistent source markets. The Bhutan – Korea friendship offer resulted in increased arrivals from South Korea propelling it into the top 10 source markets for Bhutan in 2017. In 2017, receipts from tourism has increased by 8.2% or USD 6.07 million as compared to 2016.
Bhutan Tourism Monitor 2017
8
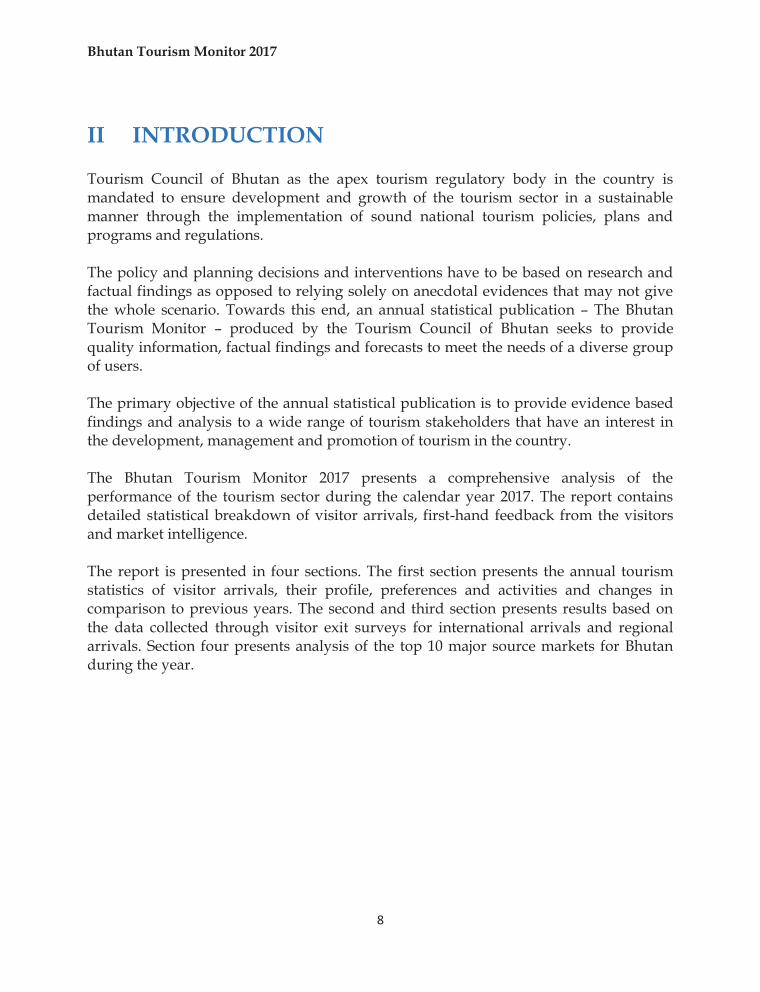
II INTRODUCTION Tourism Council of Bhutan as the apex tourism regulatory body in the country is mandated to ensure development and growth of the tourism sector in a sustainable manner through the implementation of sound national tourism policies, plans and programs and regulations. The policy and planning decisions and interventions have to be based on research and factual findings as opposed to relying solely on anecdotal evidences that may not give the whole scenario. Towards this end, an annual statistical publication – The Bhutan Tourism Monitor – produced by the Tourism Council of Bhutan seeks to provide quality information, factual findings and forecasts to meet the needs of a diverse group of users. The primary objective of the annual statistical publication is to provide evidence based findings and analysis to a wide range of tourism stakeholders that have an interest in the development, management and promotion of tourism in the country. The Bhutan Tourism Monitor 2017 presents a comprehensive analysis of the performance of the tourism sector during the calendar year 2017. The report contains detailed statistical breakdown of visitor arrivals, first-hand feedback from the visitors and market intelligence. The report is presented in four sections. The first section presents the annual tourism statistics of visitor arrivals, their profile, preferences and activities and changes in comparison to previous years. The second and third section presents results based on the data collected through visitor exit surveys for international arrivals and regional arrivals. Section four presents analysis of the top 10 major source markets for Bhutan during the year.
Bhutan Tourism Monitor 2017
9
III STUDY DESIGN AND METHODOLOGY A multi-stage sampling method was adopted. Four regions (Paro, Phuentsholing, Gelephu and SamdrupJongkhar) were identified for data collection. The first stage is stratified sampling of those four regions. The selection of the PSU (Primary Sampling Unit) from those four regions is done by applying PPS (Probability Proportional to Size) method of sampling. Then a sub-sampling applying the Circular Systematic Sampling (CSS) is being carried out. A total of 3,064 visitors were interviewed at random across four exit sectors viz. Paro, Phuntsholing, Gelegphu and SamdrupJongkhar. Analysis in the report is based on two data sources. Section 1of this report is based on secondary data obtained from Tashel Information Management System, a database maintained by Tourism Council of Bhutan (TCB) and Immigration database. Data presented in the past annual tourism monitor reports of Bhutan were also used while making trend analysis on various variables. Analysis of Section II and III is based on primary data collected through visitor exit survey with focus on international and regional tourists. Primary data was collected using separate exit survey questionnaires for international and regional tourists comprising of both open-ended and closed-ended questions. Administered exit surveys were used as the primary survey tool as they provide richer data than un-administered or online surveys. Further it also yields higher response rates, with departing visitors generally more willing to participate in one-to-one interviews over other survey methodologies. The data analysis was carried out in SPSS version 22.0 after importing from the two different data entry interfaces developed in CSPro 6.2 for both the international and the regional visitors. Separate interface was developed for regional and international exit surveys.
Bhutan Tourism Monitor 2017
10
SECTION 1
ANNUAL TOURISM STATISTICS
Bhutan Tourism Monitor 2017
11
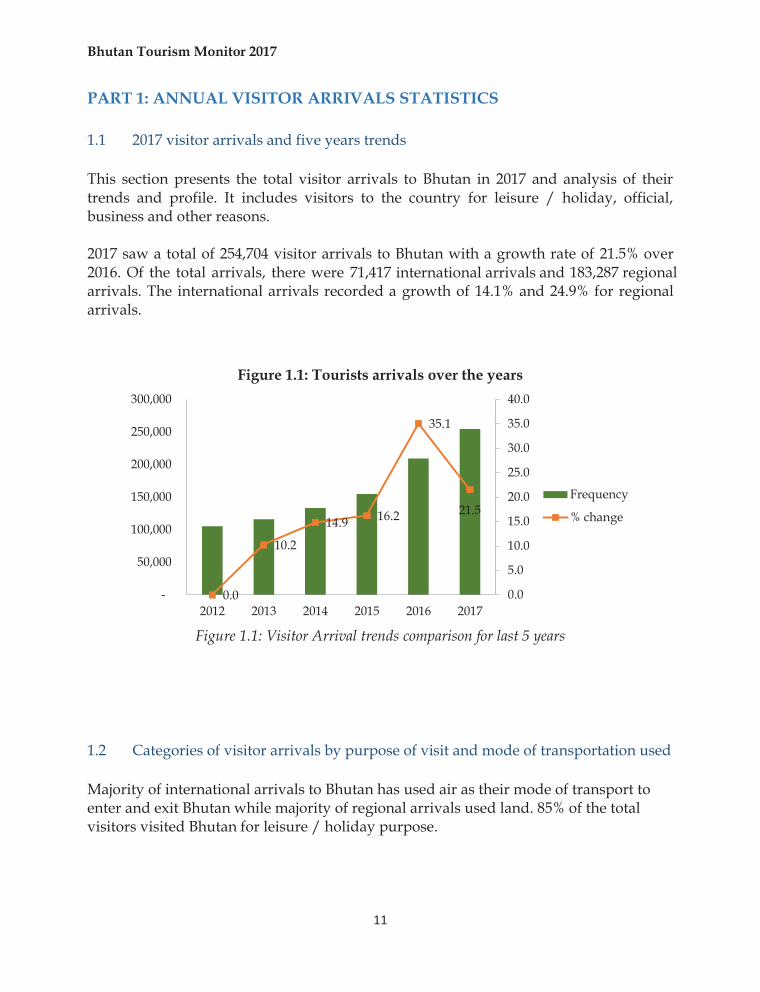
PART 1: ANNUAL VISITOR ARRIVALS STATISTICS 1.1 2017 visitor arrivals and five years trends This section presents the total visitor arrivals to Bhutan in 2017 and analysis of their trends and profile. It includes visitors to the country for leisure / holiday, official, business and other reasons. 2017 saw a total of 254,704 visitor arrivals to Bhutan with a growth rate of 21.5% over 2016. Of the total arrivals, there were 71,417 international arrivals and 183,287 regional arrivals. The international arrivals recorded a growth of 14.1% and 24.9% for regional arrivals.
Figure 1.1: Visitor Arrival trends comparison for last 5 years
1.2 Categories of visitor arrivals by purpose of visit and mode of transportation used Majority of international arrivals to Bhutan has used air as their mode of transport to enter and exit Bhutan while majority of regional arrivals used land. 85% of the total visitors visited Bhutan for leisure / holiday purpose.
0.0
10.2
14.9 16.2
35.1
21.5
0.0
5.0
10.0
15.0
20.0
25.0
30.0
35.0
40.0
-
50,000
100,000
150,000
200,000
250,000
300,000
2012 2013 2014 2015 2016 2017
Figure 1.1: Tourists arrivals over the years
Frequency
% change
Bhutan Tourism Monitor 2017
12
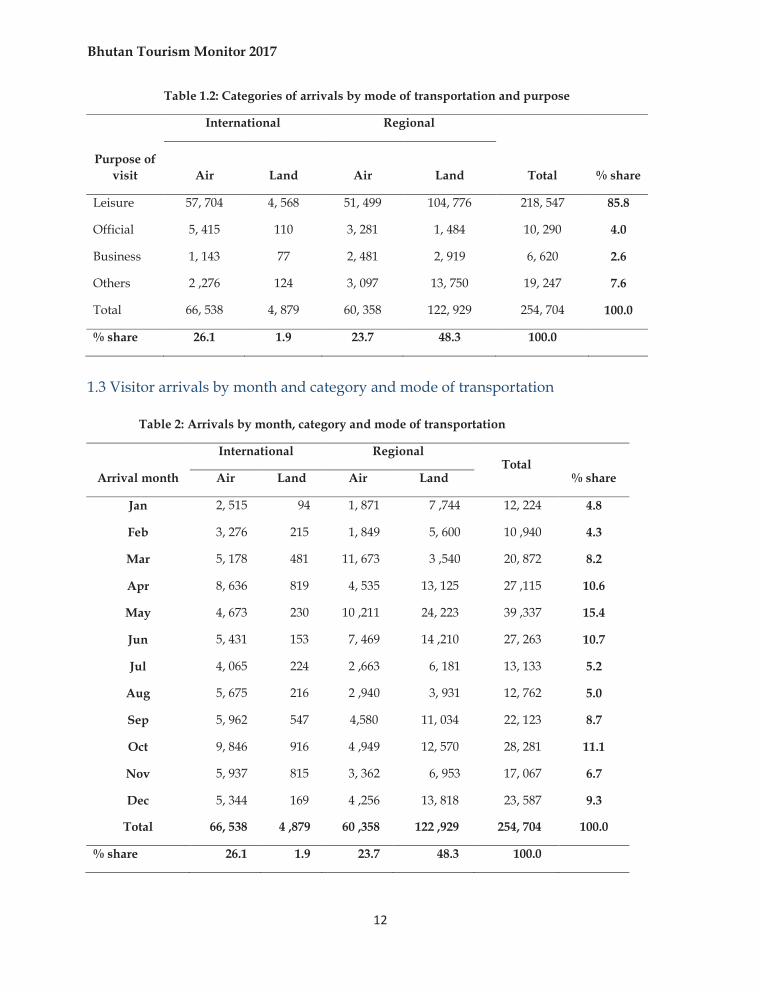
Table 1.2: Categories of arrivals by mode of transportation and purpose
Purpose of visit
International Regional
Total
% share Air Land Air Land
Leisure 57, 704 4, 568 51, 499 104, 776 218, 547 85.8
Official 5, 415 110 3, 281 1, 484 10, 290 4.0
Business 1, 143 77 2, 481 2, 919 6, 620 2.6
Others 2 ,276 124 3, 097 13, 750 19, 247 7.6
Total 66, 538 4, 879 60, 358 122, 929 254, 704 100.0
% share 26.1 1.9 23.7 48.3 100.0
1.3 Visitor arrivals by month and category and mode of transportation
Table 2: Arrivals by month, category and mode of transportation
Arrival month
International Regional Total
% share Air Land Air Land
Jan 2, 515 94 1, 871 7 ,744 12, 224 4.8
Feb 3, 276 215 1, 849 5, 600 10 ,940 4.3
Mar 5, 178 481 11, 673 3 ,540 20, 872 8.2
Apr 8, 636 819 4, 535 13, 125 27 ,115 10.6
May 4, 673 230 10 ,211 24, 223 39 ,337 15.4
Jun 5, 431 153 7, 469 14 ,210 27, 263 10.7
Jul 4, 065 224 2 ,663 6, 181 13, 133 5.2
Aug 5, 675 216 2 ,940 3, 931 12, 762 5.0
Sep 5, 962 547 4,580 11, 034 22, 123 8.7
Oct 9, 846 916 4 ,949 12, 570 28, 281 11.1
Nov 5, 937 815 3, 362 6, 953 17, 067 6.7
Dec 5, 344 169 4 ,256 13, 818 23, 587 9.3
Total 66, 538 4 ,879 60 ,358 122 ,929 254, 704 100.0
% share 26.1 1.9 23.7 48.3 100.0
Bhutan Tourism Monitor 2017
13
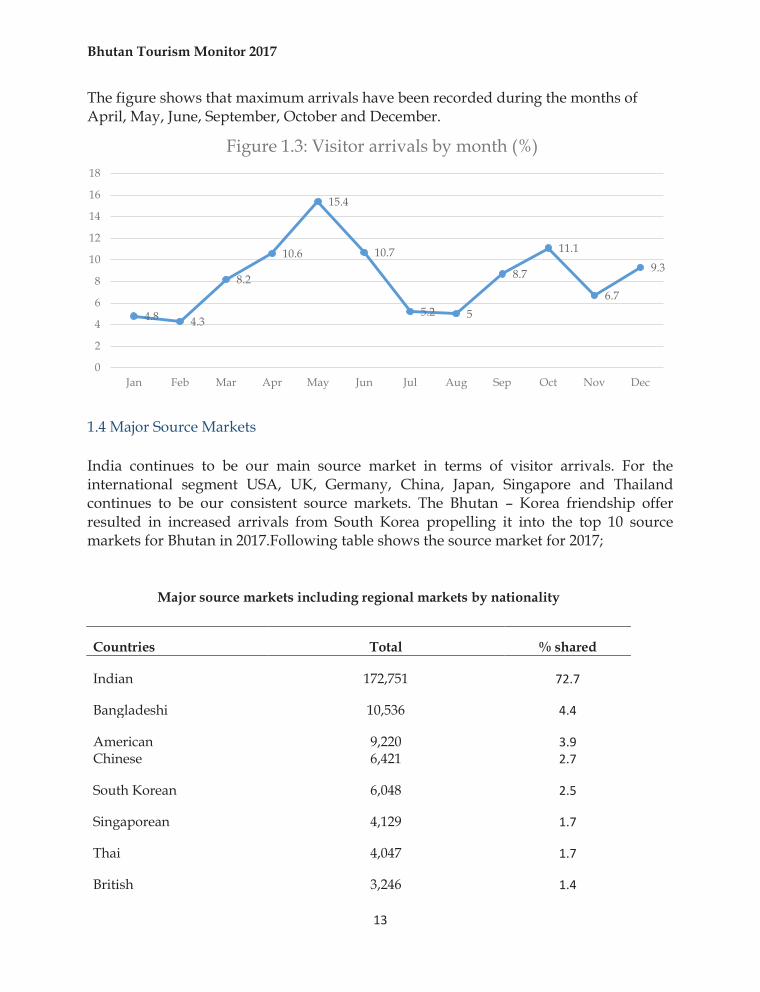
The figure shows that maximum arrivals have been recorded during the months of April, May, June, September, October and December.
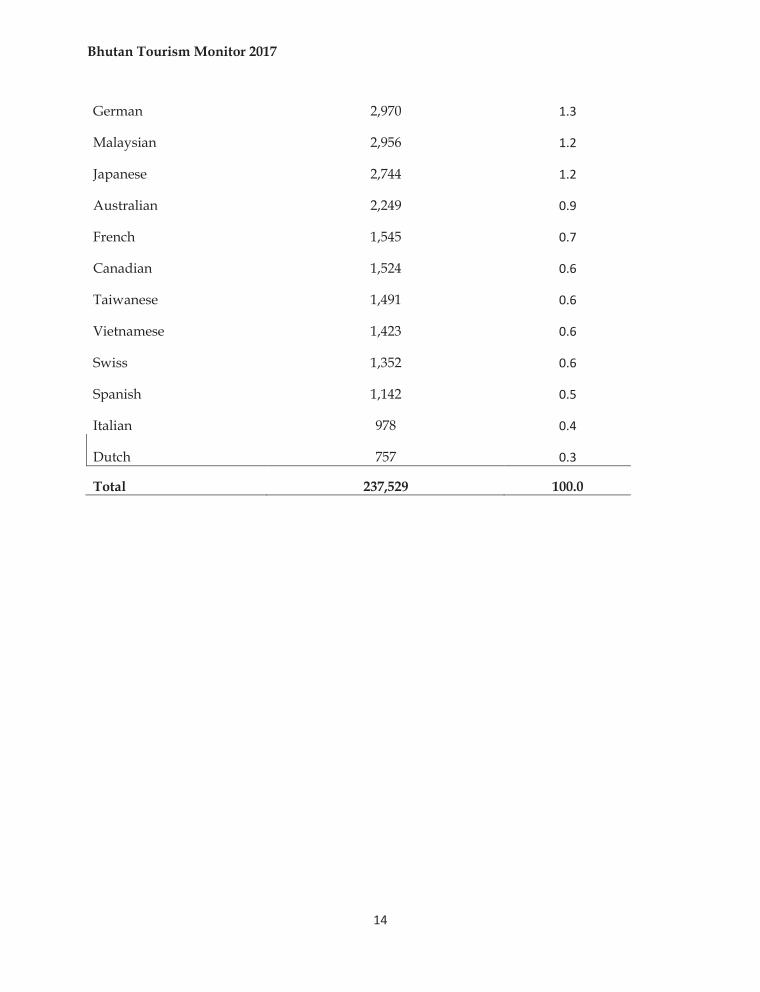
1.4 Major Source Markets India continues to be our main source market in terms of visitor arrivals. For the international segment USA, UK, Germany, China, Japan, Singapore and Thailand continues to be our consistent source markets. The Bhutan – Korea friendship offer resulted in increased arrivals from South Korea propelling it into the top 10 source markets for Bhutan in 2017.Following table shows the source market for 2017;
Major source markets including regional markets by nationality
Countries Total % shared
Indian 172,751 72.7
Bangladeshi 10,536 4.4
American 9,220 3.9 Chinese 6,421 2.7
South Korean 6,048 2.5
Singaporean 4,129 1.7
Thai 4,047 1.7
British 3,246 1.4
4.8 4.3
8.2
10.6
15.4
10.7
5.2 5
8.7
11.1
6.7
9.3
0
2
4
6
8
10
12
14
16
18
Jan Feb Mar Apr May Jun Jul Aug Sep Oct Nov Dec
Figure 1.3: Visitor arrivals by month (%)
Bhutan Tourism Monitor 2017
14
German 2,970 1.3
Malaysian 2,956 1.2
Japanese 2,744 1.2
Australian 2,249 0.9
French 1,545 0.7
Canadian 1,524 0.6
Taiwanese 1,491 0.6
Vietnamese 1,423 0.6
Swiss 1,352 0.6
Spanish 1,142 0.5
Italian 978 0.4
Dutch 757 0.3
Total 237,529 100.0
Bhutan Tourism Monitor 2017
15
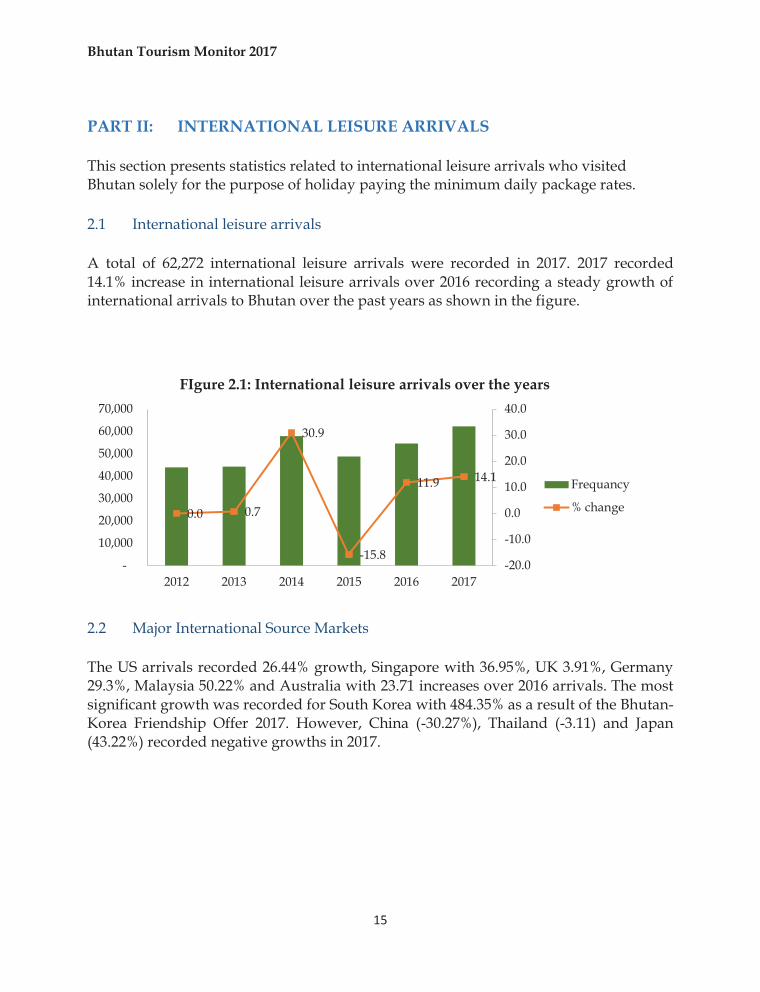
PART II: INTERNATIONAL LEISURE ARRIVALS This section presents statistics related to international leisure arrivals who visited Bhutan solely for the purpose of holiday paying the minimum daily package rates. 2.1 International leisure arrivals A total of 62,272 international leisure arrivals were recorded in 2017. 2017 recorded 14.1% increase in international leisure arrivals over 2016 recording a steady growth of international arrivals to Bhutan over the past years as shown in the figure.
2.2 Major International Source Markets The US arrivals recorded 26.44% growth, Singapore with 36.95%, UK 3.91%, Germany 29.3%, Malaysia 50.22% and Australia with 23.71 increases over 2016 arrivals. The most significant growth was recorded for South Korea with 484.35% as a result of the Bhutan-Korea Friendship Offer 2017. However, China (-30.27%), Thailand (-3.11) and Japan (43.22%) recorded negative growths in 2017.
0.0 0.7
30.9
-15.8
11.9 14.1
-20.0
-10.0
0.0
10.0
20.0
30.0
40.0
-
10,000
20,000
30,000
40,000
50,000
60,000
70,000
2012 2013 2014 2015 2016 2017
FIgure 2.1: International leisure arrivals over the years
Frequancy
% change
Bhutan Tourism Monitor 2017
16
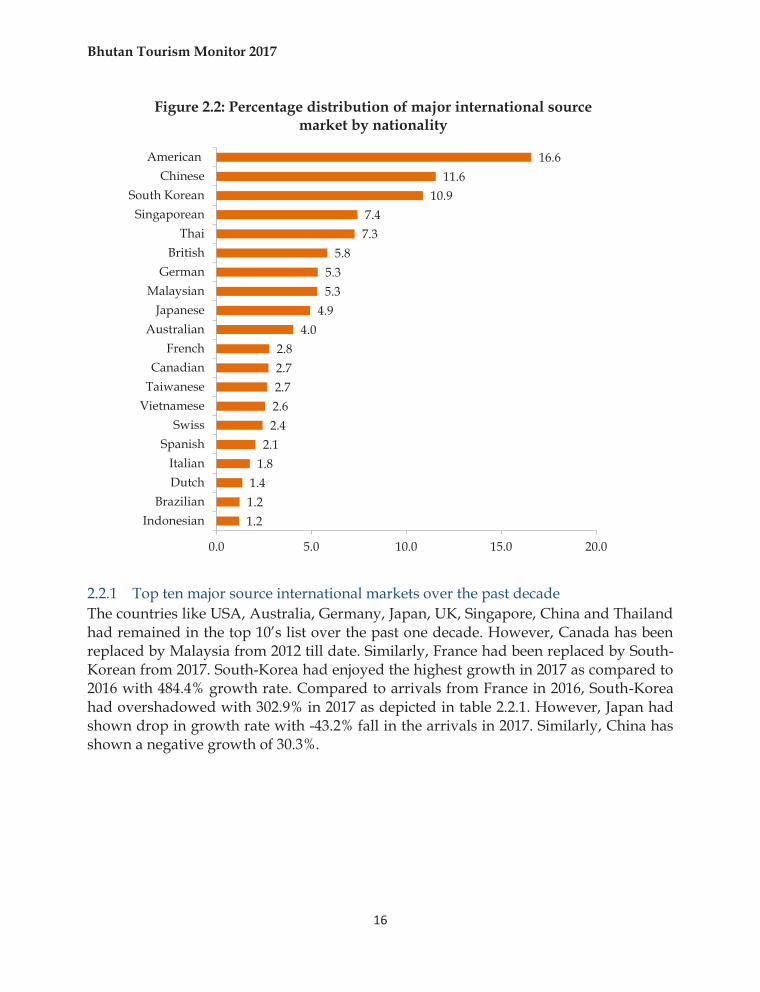
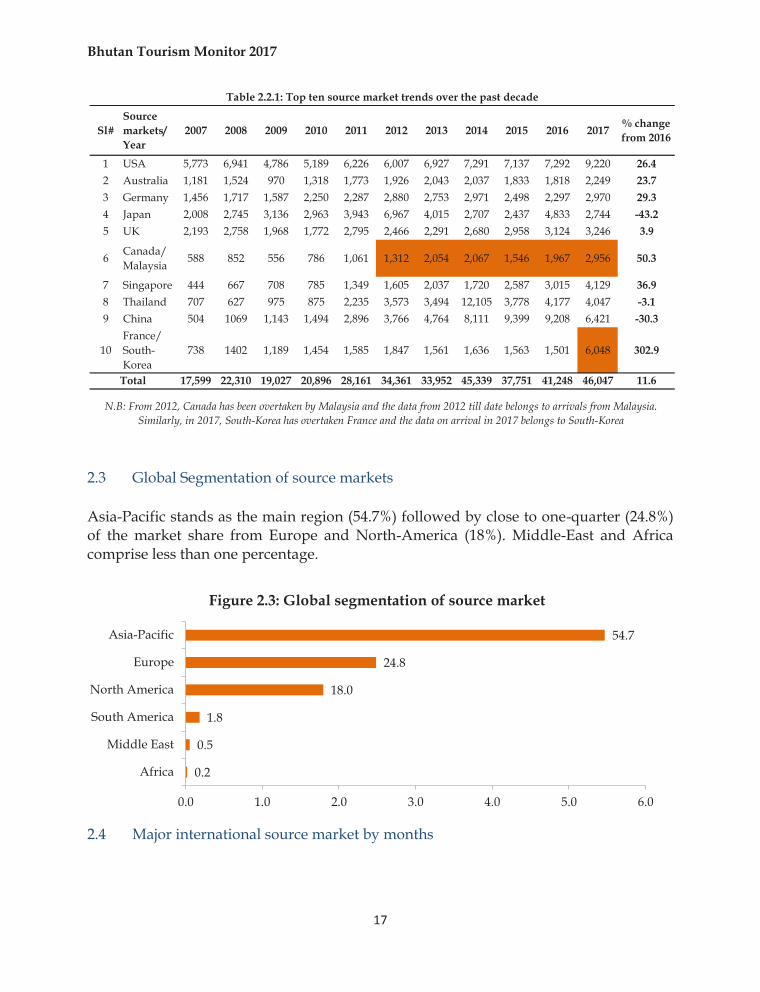
2.2.1 Top ten major source international markets over the past decade The countries like USA, Australia, Germany, Japan, UK, Singapore, China and Thailand had remained in the top 10’s list over the past one decade. However, Canada has been replaced by Malaysia from 2012 till date. Similarly, France had been replaced by South-Korean from 2017. South-Korea had enjoyed the highest growth in 2017 as compared to 2016 with 484.4% growth rate. Compared to arrivals from France in 2016, South-Korea had overshadowed with 302.9% in 2017 as depicted in table 2.2.1. However, Japan had shown drop in growth rate with -43.2% fall in the arrivals in 2017. Similarly, China has shown a negative growth of 30.3%.
1.21.21.4
1.82.1
2.42.62.72.72.8
4.04.9
5.35.3
5.87.37.4
10.911.6
16.6
0.0 5.0 10.0 15.0 20.0
IndonesianBrazilian
DutchItalian
SpanishSwiss
VietnameseTaiwaneseCanadian
FrenchAustralian
JapaneseMalaysian
GermanBritish
ThaiSingaporean
South KoreanChinese
American
Figure 2.2: Percentage distribution of major international source market by nationality
Bhutan Tourism Monitor 2017
17
2.3 Global Segmentation of source markets Asia-Pacific stands as the main region (54.7%) followed by close to one-quarter (24.8%) of the market share from Europe and North-America (18%). Middle-East and Africa comprise less than one percentage.
2.4 Major international source market by months
Sl#Source markets/Year
2007 2008 2009 2010 2011 2012 2013 2014 2015 2016 2017 % change from 2016
1 USA 5,773 6,941 4,786 5,189 6,226 6,007 6,927 7,291 7,137 7,292 9,220 26.42 Australia 1,181 1,524 970 1,318 1,773 1,926 2,043 2,037 1,833 1,818 2,249 23.73 Germany 1,456 1,717 1,587 2,250 2,287 2,880 2,753 2,971 2,498 2,297 2,970 29.34 Japan 2,008 2,745 3,136 2,963 3,943 6,967 4,015 2,707 2,437 4,833 2,744 -43.25 UK 2,193 2,758 1,968 1,772 2,795 2,466 2,291 2,680 2,958 3,124 3,246 3.9
6 Canada/Malaysia 588 852 556 786 1,061 1,312 2,054 2,067 1,546 1,967 2,956 50.3
7 Singapore 444 667 708 785 1,349 1,605 2,037 1,720 2,587 3,015 4,129 36.98 Thailand 707 627 975 875 2,235 3,573 3,494 12,105 3,778 4,177 4,047 -3.19 China 504 1069 1,143 1,494 2,896 3,766 4,764 8,111 9,399 9,208 6,421 -30.3
10France/ South-Korea
738 1402 1,189 1,454 1,585 1,847 1,561 1,636 1,563 1,501 6,048 302.9
17,599 22,310 19,027 20,896 28,161 34,361 33,952 45,339 37,751 41,248 46,047 11.6
Table 2.2.1: Top ten source market trends over the past decade
Total
N.B: From 2012, Canada has been overtaken by Malaysia and the data from 2012 till date belongs to arrivals from Malaysia. Similarly, in 2017, South-Korea has overtaken France and the data on arrival in 2017 belongs to South-Korea
0.2
0.5
1.8
18.0
24.8
54.7
0.0 1.0 2.0 3.0 4.0 5.0 6.0
Africa
Middle East
South America
North America
Europe
Asia-Pacific
Figure 2.3: Global segmentation of source market
Bhutan Tourism Monitor 2017
18
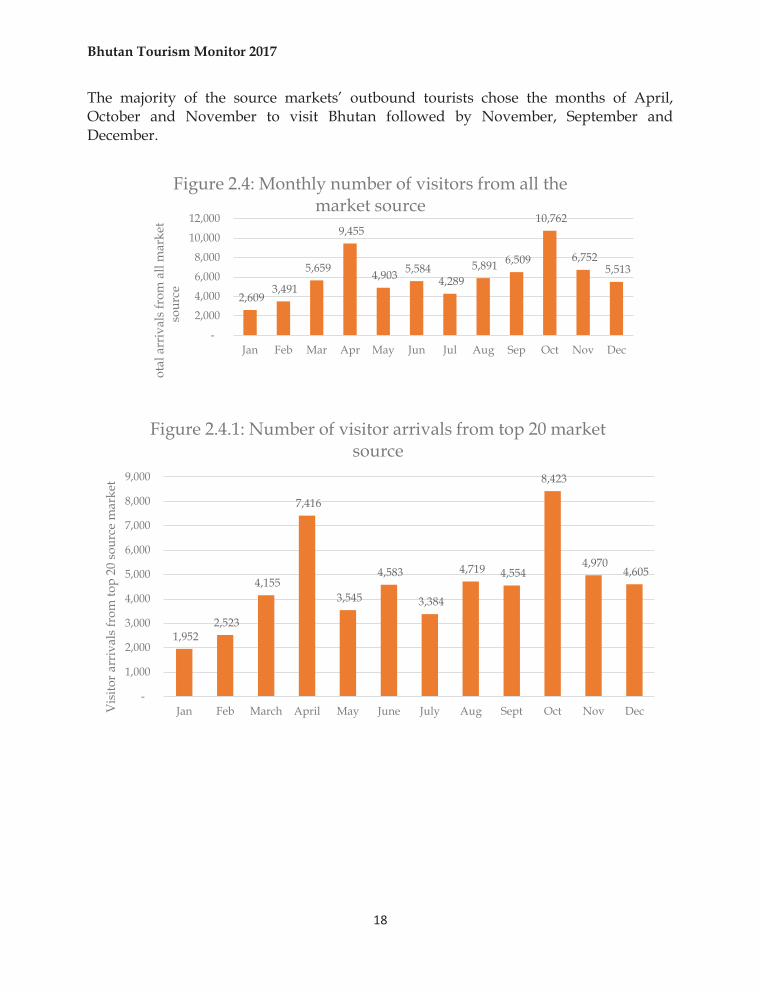
The majority of the source markets’ outbound tourists chose the months of April, October and November to visit Bhutan followed by November, September and December.
1,952 2,523
4,155
7,416
3,545
4,583
3,384
4,719 4,554
8,423
4,970 4,605
-
1,000
2,000
3,000
4,000
5,000
6,000
7,000
8,000
9,000
Jan Feb March April May June July Aug Sept Oct Nov DecVis
itor a
rriv
als f
rom
top
20 s
ourc
e m
arke
t
Figure 2.4.1: Number of visitor arrivals from top 20 market source
2,609 3,491
5,659
9,455
4,903 5,584 4,289
5,891 6,509
10,762
6,752 5,513
-
2,000
4,000
6,000
8,000
10,000
12,000
Jan Feb Mar Apr May Jun Jul Aug Sep Oct Nov Dec
Tota
l arr
ival
s fro
m a
ll m
arke
t so
urce
Figure 2.4: Monthly number of visitors from all the market source
Bhutan Tourism Monitor 2017
19
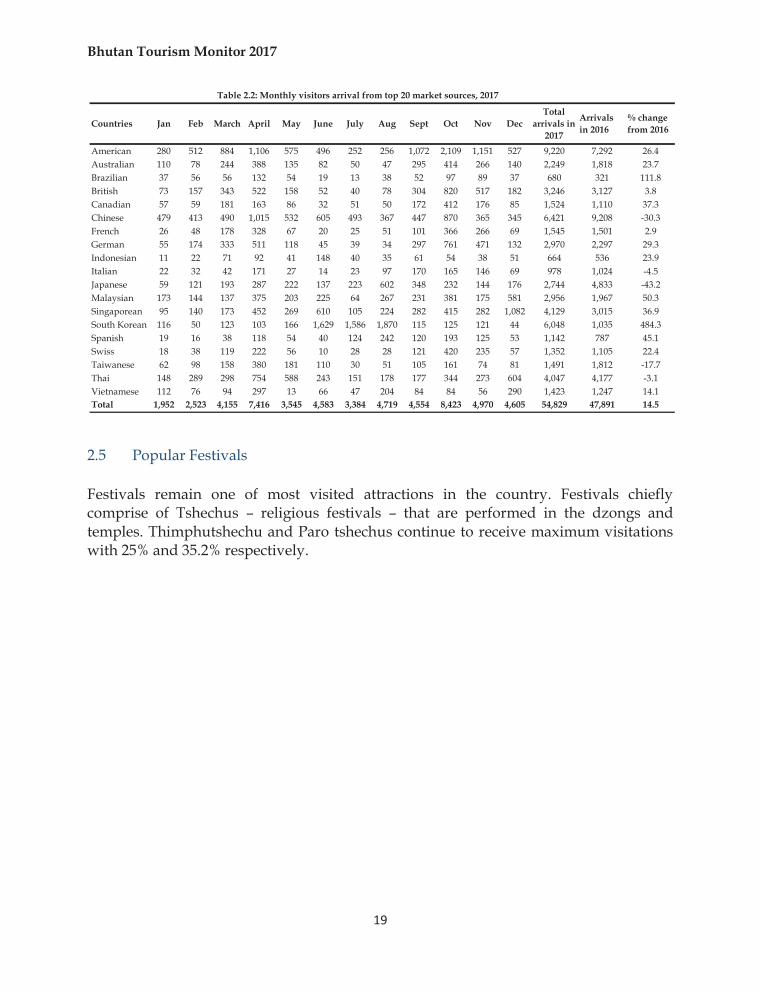
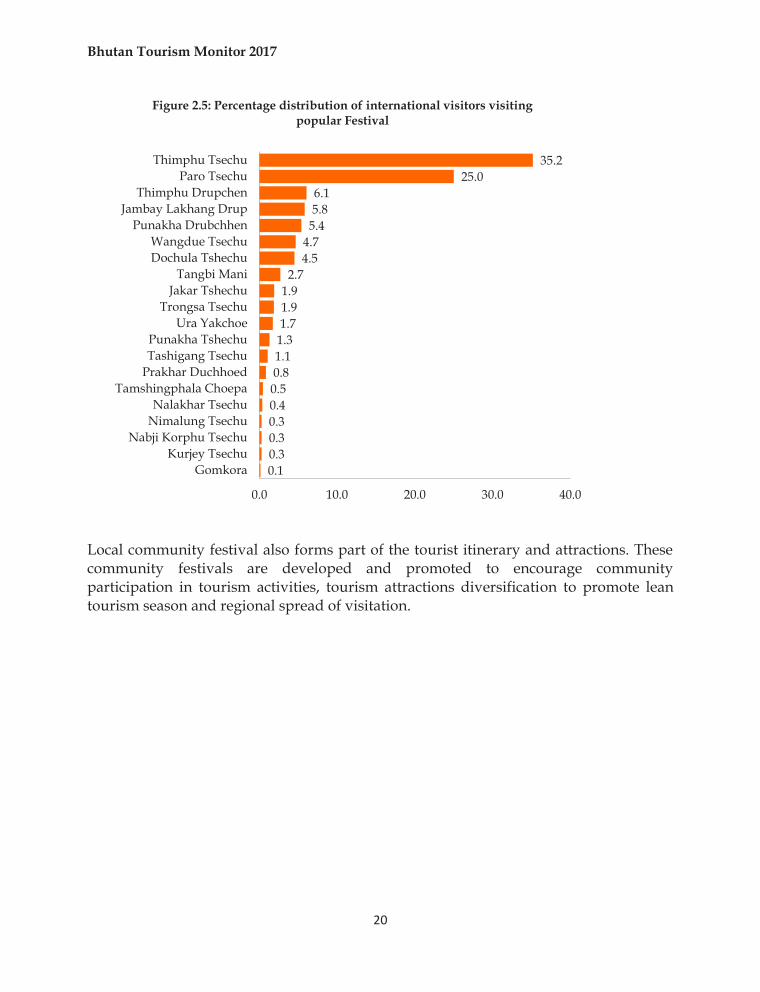
2.5 Popular Festivals Festivals remain one of most visited attractions in the country. Festivals chiefly comprise of Tshechus – religious festivals – that are performed in the dzongs and temples. Thimphutshechu and Paro tshechus continue to receive maximum visitations with 25% and 35.2% respectively.
Countries Jan Feb March April May June July Aug Sept Oct Nov DecTotal
arrivals in 2017
Arrivals in 2016
% change from 2016
American 280 512 884 1,106 575 496 252 256 1,072 2,109 1,151 527 9,220 7,292 26.4Australian 110 78 244 388 135 82 50 47 295 414 266 140 2,249 1,818 23.7Brazilian 37 56 56 132 54 19 13 38 52 97 89 37 680 321 111.8British 73 157 343 522 158 52 40 78 304 820 517 182 3,246 3,127 3.8Canadian 57 59 181 163 86 32 51 50 172 412 176 85 1,524 1,110 37.3Chinese 479 413 490 1,015 532 605 493 367 447 870 365 345 6,421 9,208 -30.3French 26 48 178 328 67 20 25 51 101 366 266 69 1,545 1,501 2.9German 55 174 333 511 118 45 39 34 297 761 471 132 2,970 2,297 29.3Indonesian 11 22 71 92 41 148 40 35 61 54 38 51 664 536 23.9Italian 22 32 42 171 27 14 23 97 170 165 146 69 978 1,024 -4.5Japanese 59 121 193 287 222 137 223 602 348 232 144 176 2,744 4,833 -43.2Malaysian 173 144 137 375 203 225 64 267 231 381 175 581 2,956 1,967 50.3Singaporean 95 140 173 452 269 610 105 224 282 415 282 1,082 4,129 3,015 36.9South Korean 116 50 123 103 166 1,629 1,586 1,870 115 125 121 44 6,048 1,035 484.3Spanish 19 16 38 118 54 40 124 242 120 193 125 53 1,142 787 45.1Swiss 18 38 119 222 56 10 28 28 121 420 235 57 1,352 1,105 22.4Taiwanese 62 98 158 380 181 110 30 51 105 161 74 81 1,491 1,812 -17.7Thai 148 289 298 754 588 243 151 178 177 344 273 604 4,047 4,177 -3.1Vietnamese 112 76 94 297 13 66 47 204 84 84 56 290 1,423 1,247 14.1Total 1,952 2,523 4,155 7,416 3,545 4,583 3,384 4,719 4,554 8,423 4,970 4,605 54,829 47,891 14.5
Table 2.2: Monthly visitors arrival from top 20 market sources, 2017
Bhutan Tourism Monitor 2017
20
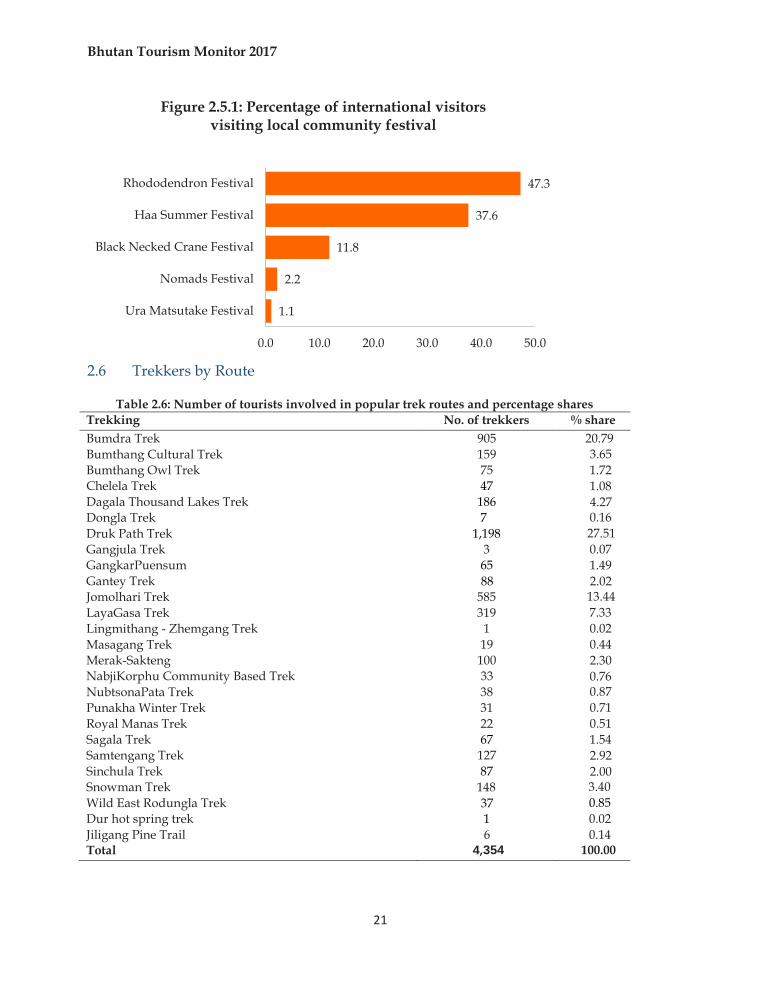
Local community festival also forms part of the tourist itinerary and attractions. These community festivals are developed and promoted to encourage community participation in tourism activities, tourism attractions diversification to promote lean tourism season and regional spread of visitation.
0.10.30.30.30.40.50.81.11.31.71.91.92.7
4.54.75.45.86.1
25.035.2
0.0 10.0 20.0 30.0 40.0
GomkoraKurjey Tsechu
Nabji Korphu TsechuNimalung TsechuNalakhar Tsechu
Tamshingphala ChoepaPrakhar DuchhoedTashigang TsechuPunakha Tshechu
Ura YakchoeTrongsa Tsechu
Jakar TshechuTangbi Mani
Dochula TshechuWangdue Tsechu
Punakha DrubchhenJambay Lakhang Drup
Thimphu DrupchenParo Tsechu
Thimphu Tsechu
Figure 2.5: Percentage distribution of international visitors visiting popular Festival
Bhutan Tourism Monitor 2017
21
2.6 Trekkers by Route
Table 2.6: Number of tourists involved in popular trek routes and percentage shares
Trekking No. of trekkers % share Bumdra Trek 905 20.79 Bumthang Cultural Trek 159 3.65 Bumthang Owl Trek 75 1.72 Chelela Trek 47 1.08 Dagala Thousand Lakes Trek 186 4.27 Dongla Trek 7 0.16 Druk Path Trek 1,198 27.51 Gangjula Trek 3 0.07 GangkarPuensum 65 1.49 Gantey Trek 88 2.02 Jomolhari Trek 585 13.44 LayaGasa Trek 319 7.33 Lingmithang - Zhemgang Trek 1 0.02 Masagang Trek 19 0.44 Merak-Sakteng 100 2.30 NabjiKorphu Community Based Trek 33 0.76 NubtsonaPata Trek 38 0.87 Punakha Winter Trek 31 0.71 Royal Manas Trek 22 0.51 Sagala Trek 67 1.54 Samtengang Trek 127 2.92 Sinchula Trek 87 2.00 Snowman Trek 148 3.40 Wild East Rodungla Trek 37 0.85 Dur hot spring trek 1 0.02 Jiligang Pine Trail 6 0.14 Total 4,354 100.00
1.1
2.2
11.8
37.6
47.3
0.0 10.0 20.0 30.0 40.0 50.0
Ura Matsutake Festival
Nomads Festival
Black Necked Crane Festival
Haa Summer Festival
Rhododendron Festival
Figure 2.5.1: Percentage of international visitors visiting local community festival
Bhutan Tourism Monitor 2017
22
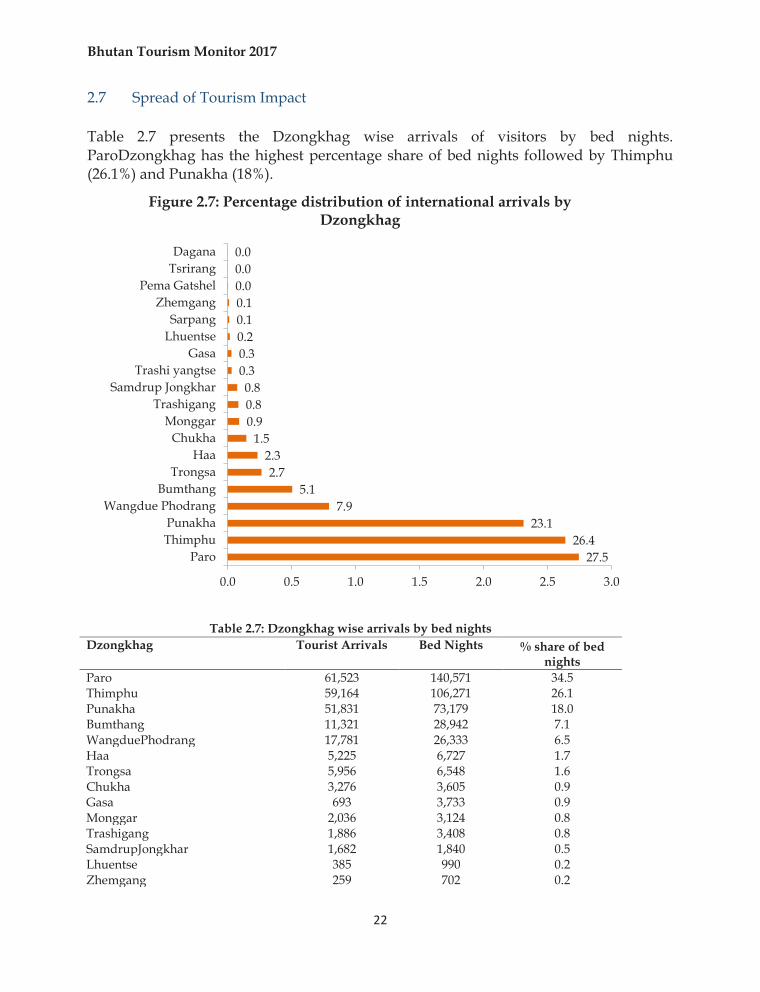
2.7 Spread of Tourism Impact Table 2.7 presents the Dzongkhag wise arrivals of visitors by bed nights. ParoDzongkhag has the highest percentage share of bed nights followed by Thimphu (26.1%) and Punakha (18%).
Table 2.7: Dzongkhag wise arrivals by bed nights Dzongkhag Tourist Arrivals Bed Nights % share of bed
nights Paro 61,523 140,571 34.5 Thimphu 59,164 106,271 26.1 Punakha 51,831 73,179 18.0 Bumthang 11,321 28,942 7.1 WangduePhodrang 17,781 26,333 6.5 Haa 5,225 6,727 1.7 Trongsa 5,956 6,548 1.6 Chukha 3,276 3,605 0.9 Gasa 693 3,733 0.9 Monggar 2,036 3,124 0.8 Trashigang 1,886 3,408 0.8 SamdrupJongkhar 1,682 1,840 0.5 Lhuentse 385 990 0.2 Zhemgang 259 702 0.2
27.526.4
23.17.9
5.12.7
2.31.5
0.90.80.8
0.30.30.20.10.10.00.00.0
0.0 0.5 1.0 1.5 2.0 2.5 3.0
ParoThimphuPunakha
Wangdue PhodrangBumthang
TrongsaHaa
ChukhaMonggar
TrashigangSamdrup Jongkhar
Trashi yangtseGasa
LhuentseSarpang
ZhemgangPema Gatshel
TsrirangDagana
Figure 2.7: Percentage distribution of international arrivals by Dzongkhag
Bhutan Tourism Monitor 2017
23
Trashiyangtse 705 894 0.2 Sarpang 284 403 0.1 PemaGatshel 71 199 0.0 Tsirang 27 33 0.0 Dagana 10 15 0.0 Total 224,115 407,517 100.0 2.8 Average length of stay Tourists have spent 6.6 days in Bhutan on an average (national average). However, going by major source markets, the average length of stay measured in number of days, vary from country to country. Swiss visitors have stayed in Bhutan almost 11dayson an average, which comprises the highest followed by French visitors with an average length of stay of 9.3 days. Dutch and German visitors have spent almost an equal number of days (9).
Table 2.7.1: Percentage distribution of major international source market by nationality
Source markets Total arrivals Bed Nights % of total bed
nights Avg. length of
stay (days) America 9,220 68,629 18.8 7.4 China 6,421 35,120 9.6 5.5 South-Korean 6,048 30,482 8.4 5.0 Singapore 4,129 25,917 7.1 6.3 Thailand 4,047 17,678 4.8 4.4 Britain 3,246 25,879 7.1 8.0 Germany 2,970 26,638 7.3 9.0 Malaysia 2,956 16,287 4.5 5.5 Japan 2,744 12,074 3.3 4.4 Australia 2,249 18,738 5.1 8.3 France 1,545 14,354 3.9 9.3 Canada 1,524 11,974 3.3 7.9 Taiwan 1,491 9,799 2.7 6.6 Vietnam 1,423 7,285 2.0 5.1 Swiss 1,352 14,197 3.9 10.5 Spain 1,142 7,412 2.0 6.5 Italy 978 7,490 2.1 7.7 The Netherland 757 6,876 1.9 9.1 Brazil 680 3,968 1.1 5.8 Indonesia 664 3,755 1.0 5.7 Total 55,586 364,552 100.0 6.6
Bhutan Tourism Monitor 2017
24
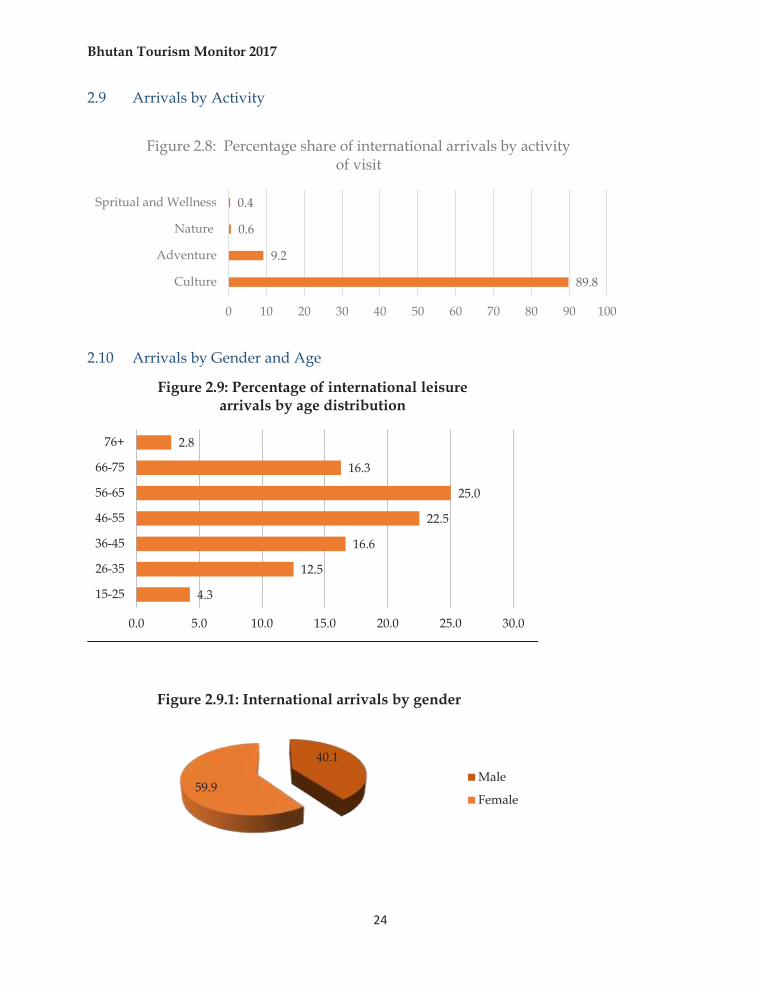
2.9 Arrivals by Activity
2.10 Arrivals by Gender and Age
89.8
9.2
0.6
0.4
0 10 20 30 40 50 60 70 80 90 100
Culture
Adventure
Nature
Spritual and Wellness
Figure 2.8: Percentage share of international arrivals by activity of visit
4.3
12.5
16.6
22.5
25.0
16.3
2.8
0.0 5.0 10.0 15.0 20.0 25.0 30.0
15-25
26-35
36-45
46-55
56-65
66-75
76+
Figure 2.9: Percentage of international leisure arrivals by age distribution
40.1
59.9
Figure 2.9.1: International arrivals by gender
Male
Female
Bhutan Tourism Monitor 2017
25
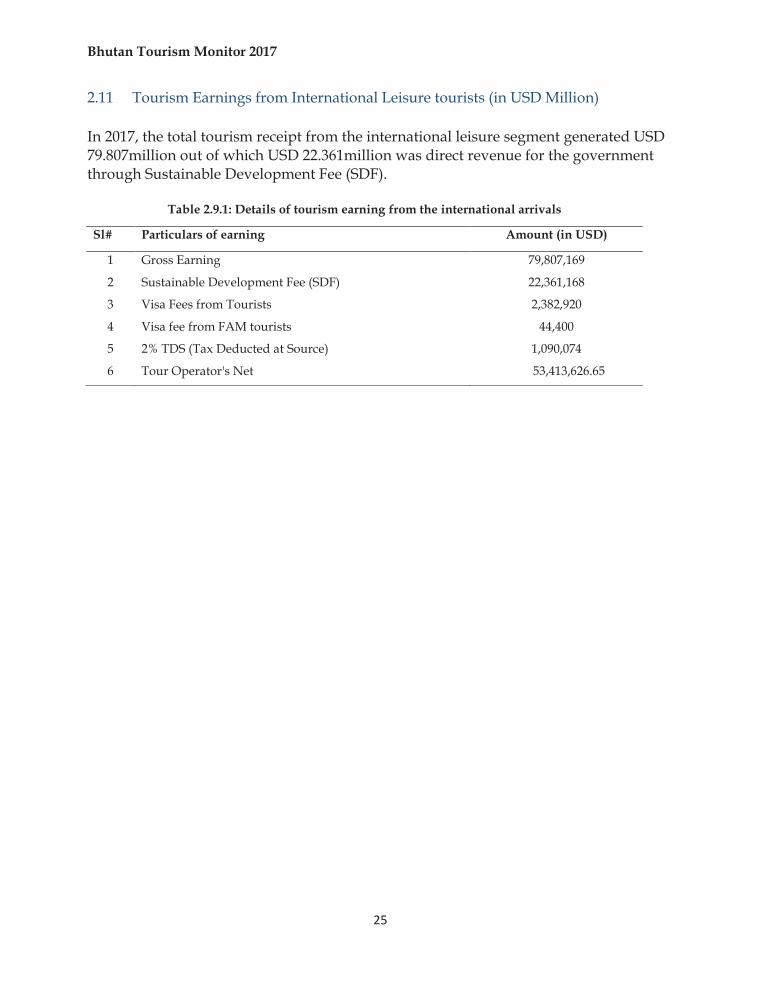
2.11 Tourism Earnings from International Leisure tourists (in USD Million) In 2017, the total tourism receipt from the international leisure segment generated USD 79.807million out of which USD 22.361million was direct revenue for the government through Sustainable Development Fee (SDF).
Table 2.9.1: Details of tourism earning from the international arrivals
Sl# Particulars of earning Amount (in USD)
1 Gross Earning 79,807,169
2 Sustainable Development Fee (SDF) 22,361,168
3 Visa Fees from Tourists 2,382,920
4 Visa fee from FAM tourists 44,400
5 2% TDS (Tax Deducted at Source) 1,090,074
6 Tour Operator's Net 53,413,626.65
Bhutan Tourism Monitor 2017
26
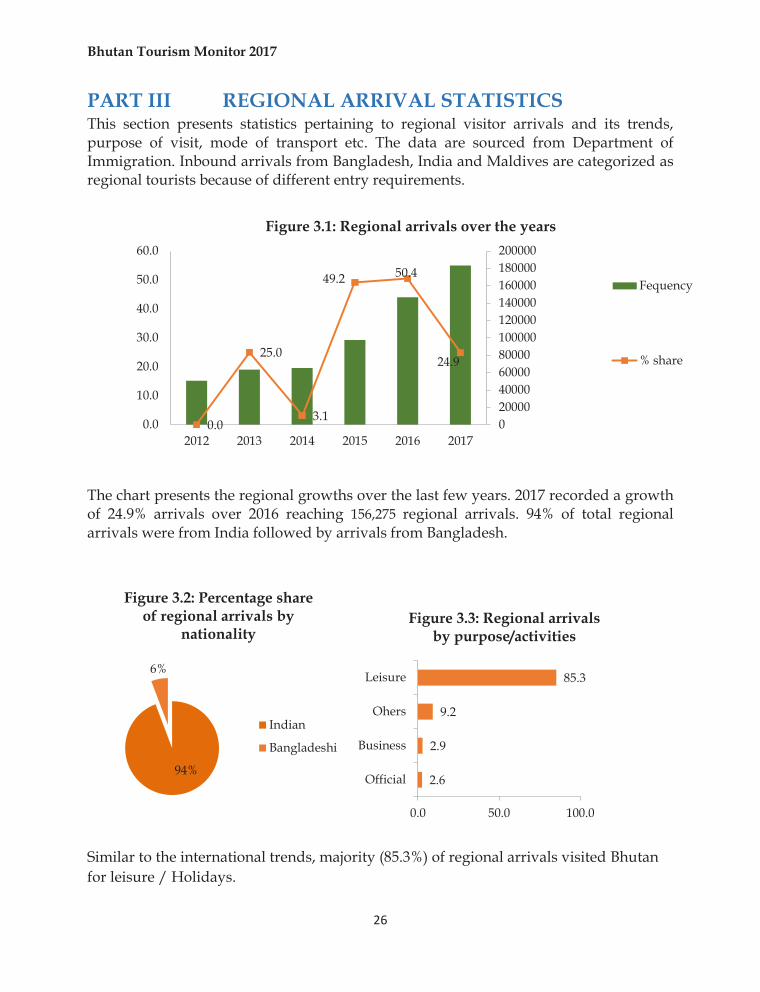
PART III REGIONAL ARRIVAL STATISTICS This section presents statistics pertaining to regional visitor arrivals and its trends, purpose of visit, mode of transport etc. The data are sourced from Department of Immigration. Inbound arrivals from Bangladesh, India and Maldives are categorized as regional tourists because of different entry requirements.
The chart presents the regional growths over the last few years. 2017 recorded a growth of 24.9% arrivals over 2016 reaching 156,275 regional arrivals. 94% of total regional arrivals were from India followed by arrivals from Bangladesh.
Similar to the international trends, majority (85.3%) of regional arrivals visited Bhutan for leisure / Holidays.
0.0
25.0
3.1
49.2 50.4
24.9
020000400006000080000100000120000140000160000180000200000
0.0
10.0
20.0
30.0
40.0
50.0
60.0
2012 2013 2014 2015 2016 2017
Figure 3.1: Regional arrivals over the years
Fequency
% share
94%
6%
Figure 3.2: Percentage share of regional arrivals by
nationality
Indian
Bangladeshi
2.6
2.9
9.2
85.3
0.0 50.0 100.0
Official
Business
Ohers
Leisure
Figure 3.3: Regional arrivals by purpose/activities
Bhutan Tourism Monitor 2017
27
SECTION 2
INTERNATIONAL VISITOR SURVEY 2017
Bhutan Tourism Monitor 2017
28
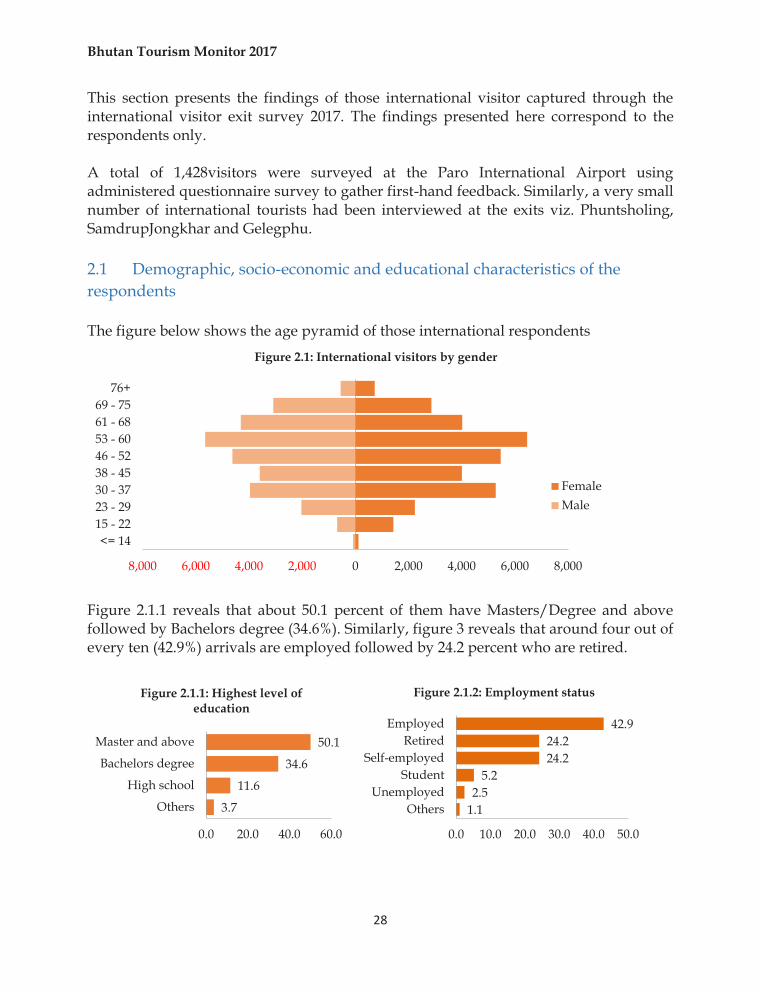
This section presents the findings of those international visitor captured through the international visitor exit survey 2017. The findings presented here correspond to the respondents only. A total of 1,428visitors were surveyed at the Paro International Airport using administered questionnaire survey to gather first-hand feedback. Similarly, a very small number of international tourists had been interviewed at the exits viz. Phuntsholing, SamdrupJongkhar and Gelegphu. 2.1 Demographic, socio-economic and educational characteristics of the respondents The figure below shows the age pyramid of those international respondents
Figure 2.1.1 reveals that about 50.1 percent of them have Masters/Degree and above followed by Bachelors degree (34.6%). Similarly, figure 3 reveals that around four out of every ten (42.9%) arrivals are employed followed by 24.2 percent who are retired.
8,000 6,000 4,000 2,000 0 2,000 4,000 6,000 8,000
<= 1415 - 2223 - 2930 - 3738 - 4546 - 5253 - 6061 - 6869 - 75
76+
Figure 2.1: International visitors by gender
FemaleMale
3.7
11.6
34.6
50.1
0.0 20.0 40.0 60.0
Others
High school
Bachelors degree
Master and above
Figure 2.1.1: Highest level of education
1.12.5
5.224.224.2
42.9
0.0 10.0 20.0 30.0 40.0 50.0
OthersUnemployed
StudentSelf-employed
RetiredEmployed
Figure 2.1.2: Employment status
Bhutan Tourism Monitor 2017
29
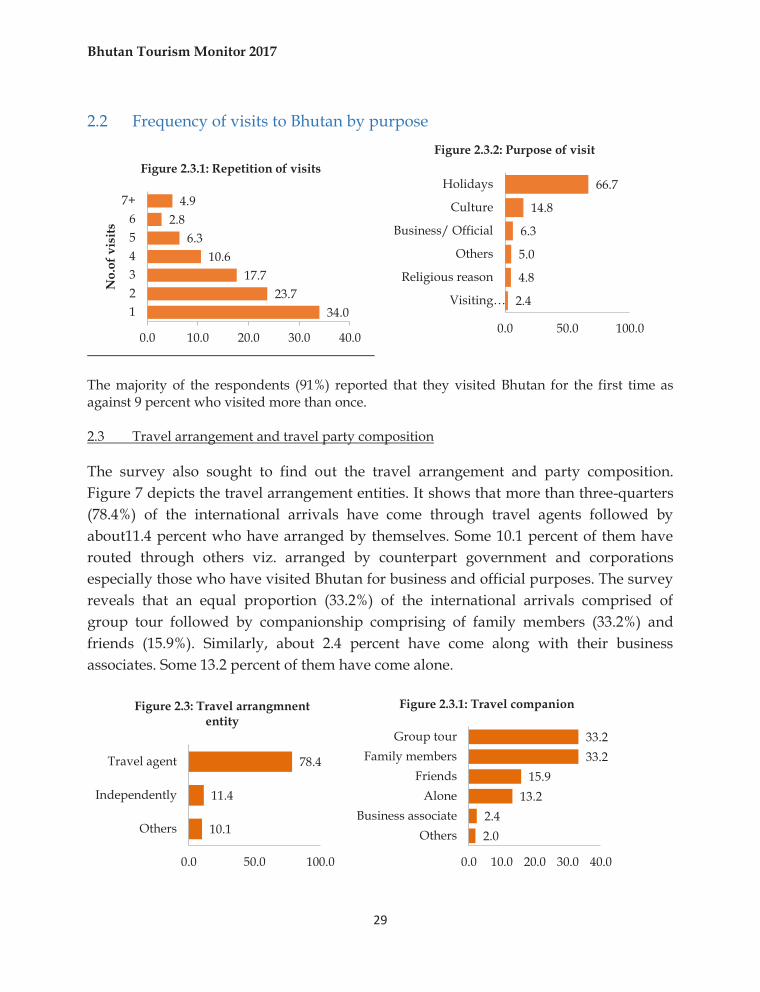
2.2 Frequency of visits to Bhutan by purpose
The majority of the respondents (91%) reported that they visited Bhutan for the first time as against 9 percent who visited more than once. 2.3 Travel arrangement and travel party composition The survey also sought to find out the travel arrangement and party composition. Figure 7 depicts the travel arrangement entities. It shows that more than three-quarters (78.4%) of the international arrivals have come through travel agents followed by about11.4 percent who have arranged by themselves. Some 10.1 percent of them have routed through others viz. arranged by counterpart government and corporations especially those who have visited Bhutan for business and official purposes. The survey reveals that an equal proportion (33.2%) of the international arrivals comprised of group tour followed by companionship comprising of family members (33.2%) and friends (15.9%). Similarly, about 2.4 percent have come along with their business associates. Some 13.2 percent of them have come alone.
34.023.7
17.710.6
6.32.8
4.9
0.0 10.0 20.0 30.0 40.0
123456
7+
No.
of v
isits
Figure 2.3.1: Repetition of visits
2.4
4.8
5.0
6.3
14.8
66.7
0.0 50.0 100.0
Visiting…
Religious reason
Others
Business/ Official
Culture
Holidays
Figure 2.3.2: Purpose of visit
10.1
11.4
78.4
0.0 50.0 100.0
Others
Independently
Travel agent
Figure 2.3: Travel arrangmnent entity
2.02.4
13.215.9
33.233.2
0.0 10.0 20.0 30.0 40.0
OthersBusiness associate
AloneFriends
Family membersGroup tour
Figure 2.3.1: Travel companion
Bhutan Tourism Monitor 2017
30
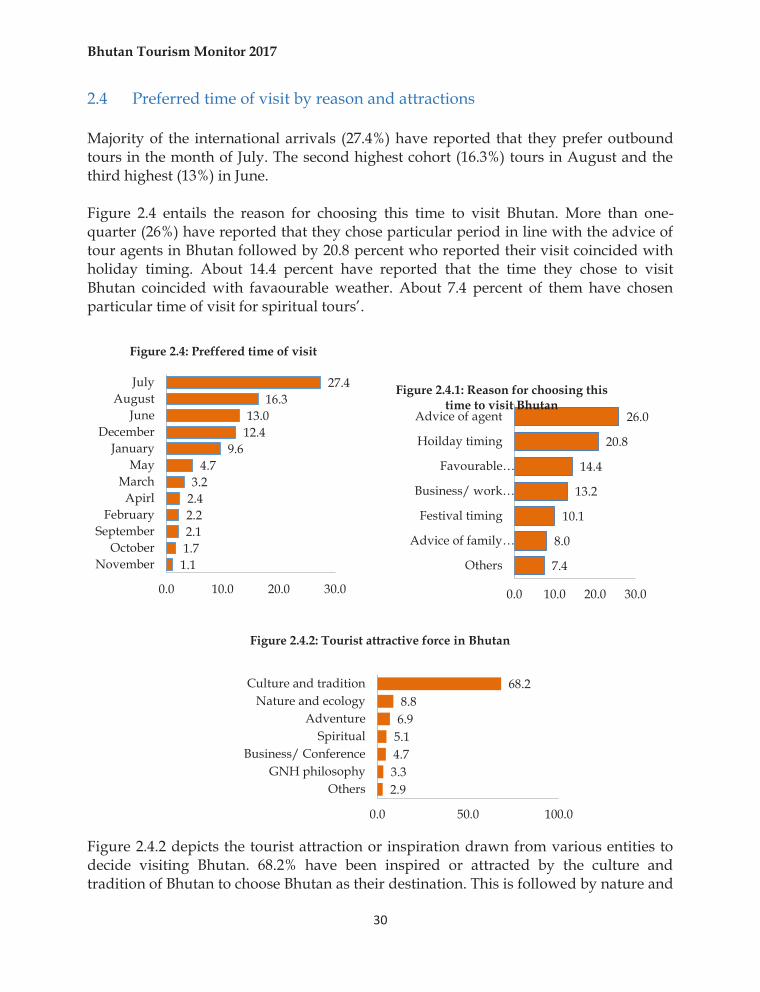
2.4 Preferred time of visit by reason and attractions Majority of the international arrivals (27.4%) have reported that they prefer outbound tours in the month of July. The second highest cohort (16.3%) tours in August and the third highest (13%) in June. Figure 2.4 entails the reason for choosing this time to visit Bhutan. More than one-quarter (26%) have reported that they chose particular period in line with the advice of tour agents in Bhutan followed by 20.8 percent who reported their visit coincided with holiday timing. About 14.4 percent have reported that the time they chose to visit Bhutan coincided with favaourable weather. About 7.4 percent of them have chosen particular time of visit for spiritual tours’.
Figure 2.4.2 depicts the tourist attraction or inspiration drawn from various entities to decide visiting Bhutan. 68.2% have been inspired or attracted by the culture and tradition of Bhutan to choose Bhutan as their destination. This is followed by nature and
1.11.72.12.22.43.2
4.79.6
12.413.0
16.327.4
0.0 10.0 20.0 30.0
NovemberOctober
SeptemberFebruary
ApirlMarch
MayJanuary
DecemberJune
AugustJuly
Figure 2.4: Preffered time of visit
7.4
8.0
10.1
13.2
14.4
20.8
26.0
0.0 10.0 20.0 30.0
Others
Advice of family…
Festival timing
Business/ work…
Favourable…
Hoilday timing
Advice of agent
Figure 2.4.1: Reason for choosing this time to visit Bhutan
2.93.34.75.16.98.8
68.2
0.0 50.0 100.0
OthersGNH philosophy
Business/ ConferenceSpiritual
AdventureNature and ecology
Culture and tradition
Figure 2.4.2: Tourist attractive force in Bhutan
Bhutan Tourism Monitor 2017
31
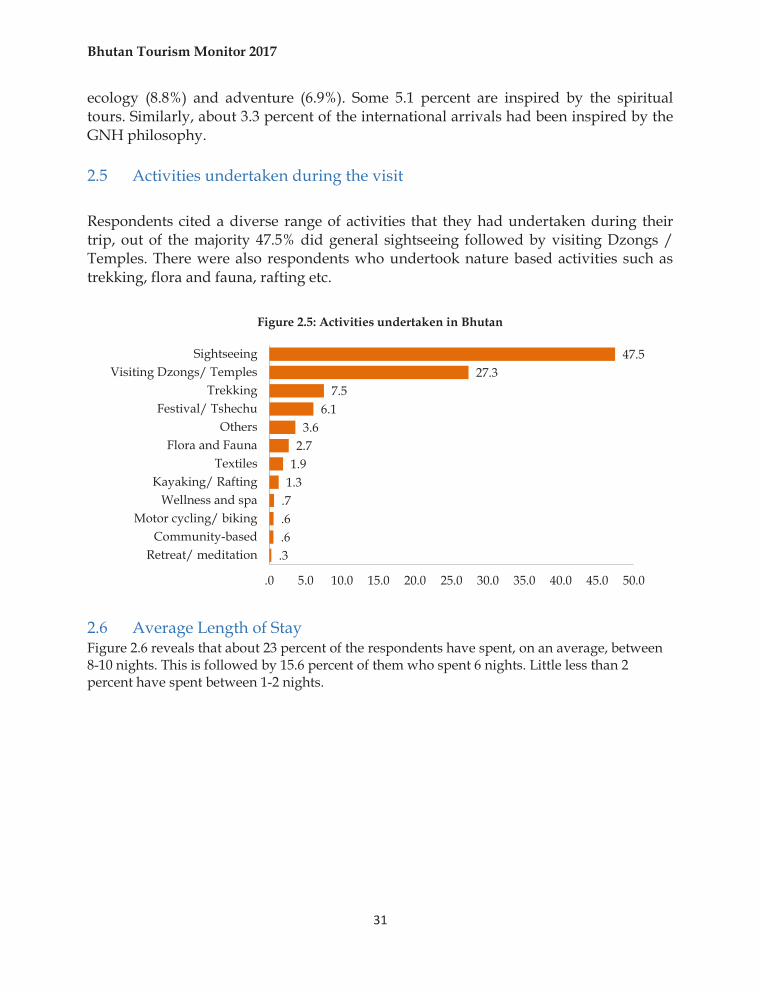
ecology (8.8%) and adventure (6.9%). Some 5.1 percent are inspired by the spiritual tours. Similarly, about 3.3 percent of the international arrivals had been inspired by the GNH philosophy. 2.5 Activities undertaken during the visit Respondents cited a diverse range of activities that they had undertaken during their trip, out of the majority 47.5% did general sightseeing followed by visiting Dzongs / Temples. There were also respondents who undertook nature based activities such as trekking, flora and fauna, rafting etc.
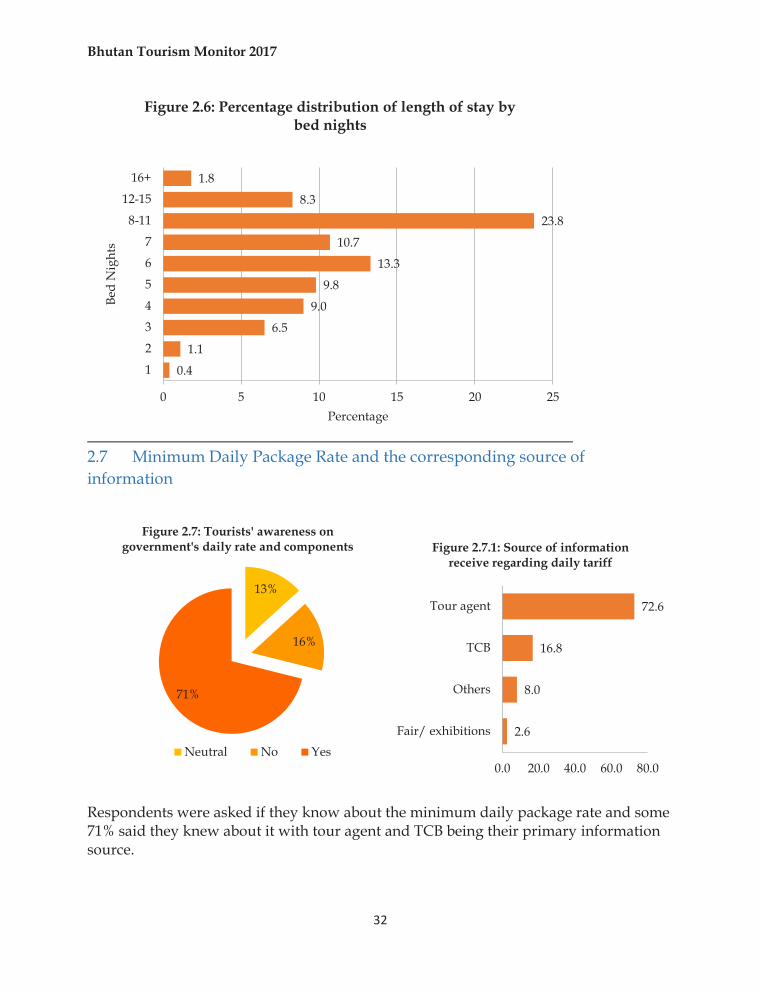
2.6 Average Length of Stay Figure 2.6 reveals that about 23 percent of the respondents have spent, on an average, between 8-10 nights. This is followed by 15.6 percent of them who spent 6 nights. Little less than 2 percent have spent between 1-2 nights.
.3.6.6.71.31.92.7
3.66.1
7.527.3
47.5
.0 5.0 10.0 15.0 20.0 25.0 30.0 35.0 40.0 45.0 50.0
Retreat/ meditationCommunity-based
Motor cycling/ bikingWellness and spa
Kayaking/ RaftingTextiles
Flora and FaunaOthers
Festival/ TshechuTrekking
Visiting Dzongs/ TemplesSightseeing
Figure 2.5: Activities undertaken in Bhutan
Bhutan Tourism Monitor 2017
32
2.7 Minimum Daily Package Rate and the corresponding source of information
Respondents were asked if they know about the minimum daily package rate and some 71% said they knew about it with tour agent and TCB being their primary information source.
0.4
1.1
6.5
9.0
9.8
13.3
10.7
23.8
8.3
1.8
0 5 10 15 20 25
1
2
3
4
5
6
7
8-11
12-15
16+
Percentage
Bed
Nig
hts
Figure 2.6: Percentage distribution of length of stay by bed nights
13%
16%
71%
Figure 2.7: Tourists' awareness on government's daily rate and components
Neutral No Yes2.6
8.0
16.8
72.6
0.0 20.0 40.0 60.0 80.0
Fair/ exhibitions
Others
TCB
Tour agent
Figure 2.7.1: Source of information receive regarding daily tariff
Bhutan Tourism Monitor 2017
33
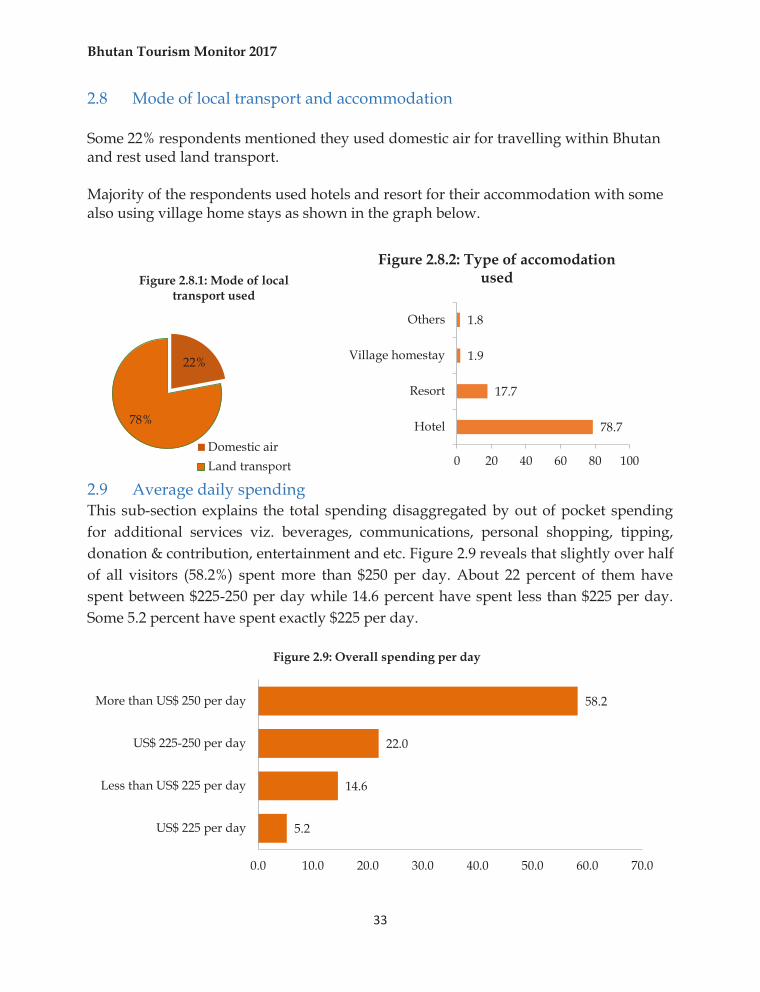
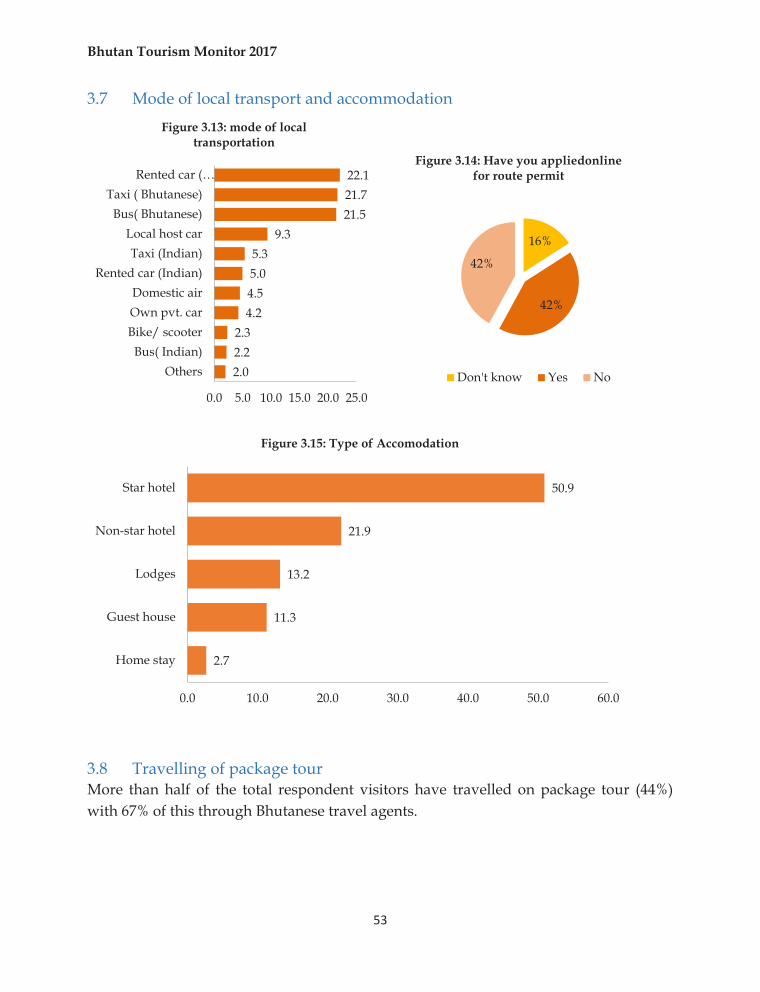
2.8 Mode of local transport and accommodation Some 22% respondents mentioned they used domestic air for travelling within Bhutan and rest used land transport. Majority of the respondents used hotels and resort for their accommodation with some also using village home stays as shown in the graph below.
2.9 Average daily spending This sub-section explains the total spending disaggregated by out of pocket spending for additional services viz. beverages, communications, personal shopping, tipping, donation & contribution, entertainment and etc. Figure 2.9 reveals that slightly over half of all visitors (58.2%) spent more than $250 per day. About 22 percent of them have spent between $225-250 per day while 14.6 percent have spent less than $225 per day. Some 5.2 percent have spent exactly $225 per day.
22%
78%
Figure 2.8.1: Mode of local transport used
Domestic airLand transport
78.7
17.7
1.9
1.8
0 20 40 60 80 100
Hotel
Resort
Village homestay
Others
Figure 2.8.2: Type of accomodation used
5.2
14.6
22.0
58.2
0.0 10.0 20.0 30.0 40.0 50.0 60.0 70.0
US$ 225 per day
Less than US$ 225 per day
US$ 225-250 per day
More than US$ 250 per day
Figure 2.9: Overall spending per day
Bhutan Tourism Monitor 2017
34
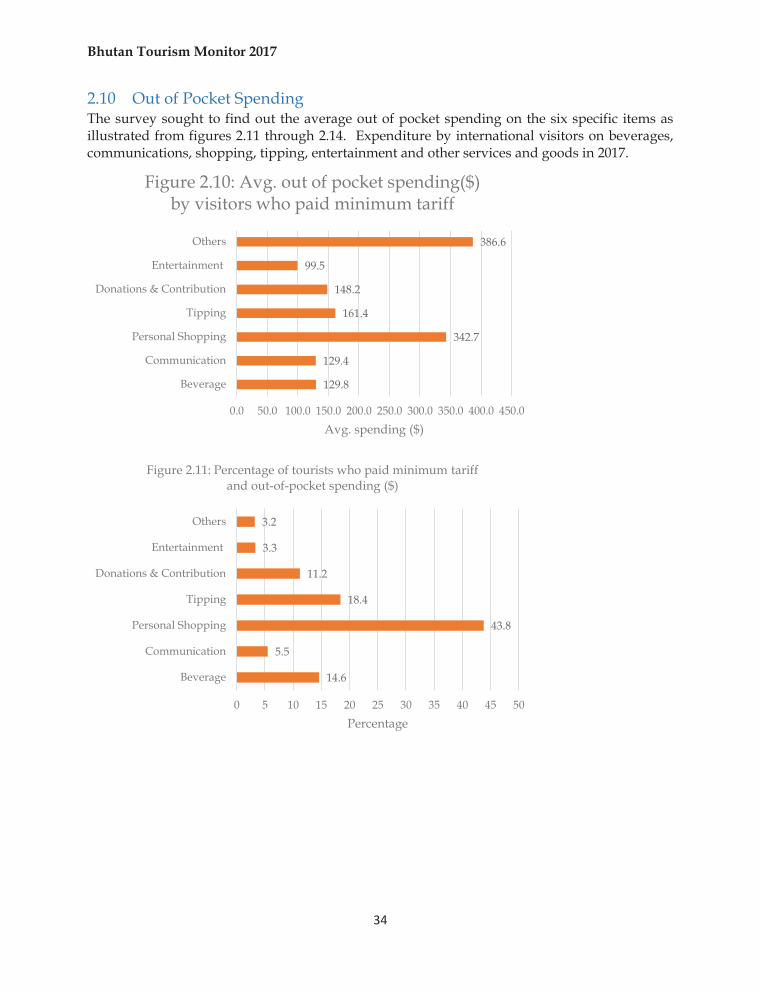
2.10 Out of Pocket Spending The survey sought to find out the average out of pocket spending on the six specific items as illustrated from figures 2.11 through 2.14. Expenditure by international visitors on beverages, communications, shopping, tipping, entertainment and other services and goods in 2017.
129.8
129.4
342.7
161.4
148.2
99.5
386.6
0.0 50.0 100.0 150.0 200.0 250.0 300.0 350.0 400.0 450.0
Beverage
Communication
Personal Shopping
Tipping
Donations & Contribution
Entertainment
Others
Avg. spending ($)
Figure 2.10: Avg. out of pocket spending($) by visitors who paid minimum tariff
14.6
5.5
43.8
18.4
11.2
3.3
3.2
0 5 10 15 20 25 30 35 40 45 50
Beverage
Communication
Personal Shopping
Tipping
Donations & Contribution
Entertainment
Others
Percentage
Figure 2.11: Percentage of tourists who paid minimum tariff and out-of-pocket spending ($)
Bhutan Tourism Monitor 2017
35
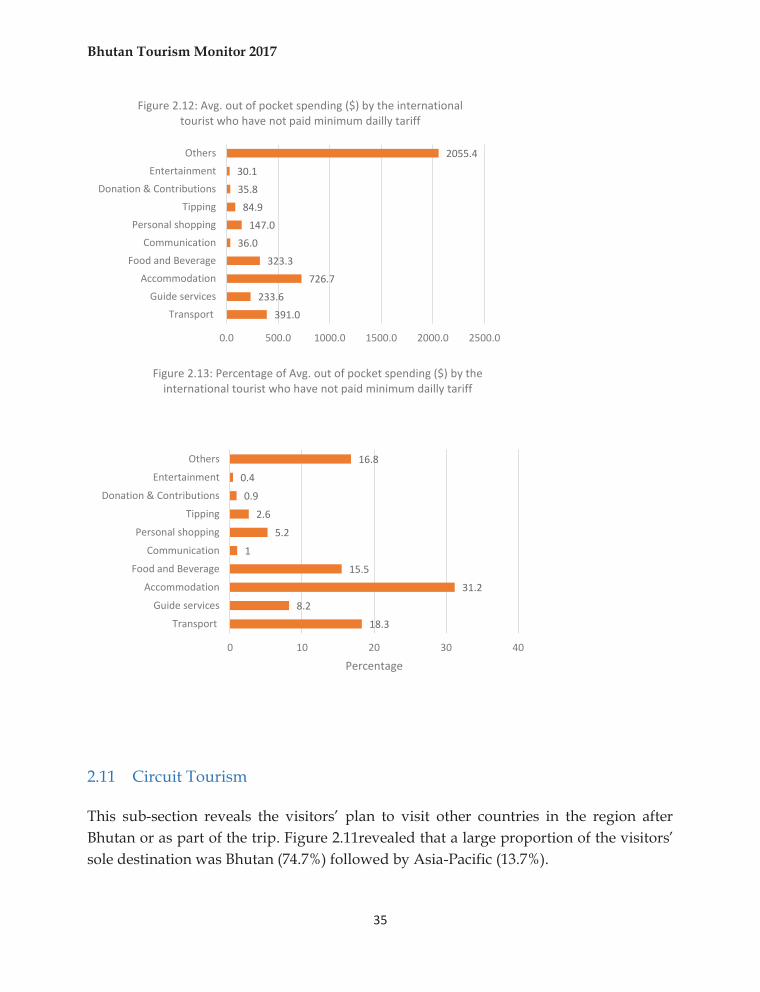
2.11 Circuit Tourism This sub-section reveals the visitors’ plan to visit other countries in the region after Bhutan or as part of the trip. Figure 2.11revealed that a large proportion of the visitors’ sole destination was Bhutan (74.7%) followed by Asia-Pacific (13.7%).
391.0233.6
726.7323.3
36.0147.0
84.935.830.1
2055.4
0.0 500.0 1000.0 1500.0 2000.0 2500.0
TransportGuide services
AccommodationFood and Beverage
CommunicationPersonal shopping
TippingDonation & Contributions
EntertainmentOthers
Figure 2.12: Avg. out of pocket spending ($) by the international tourist who have not paid minimum dailly tariff
18.38.2
31.215.5
15.2
2.60.9
0.416.8
0 10 20 30 40
TransportGuide services
AccommodationFood and Beverage
CommunicationPersonal shopping
TippingDonation & Contributions
EntertainmentOthers
Percentage
Figure 2.13: Percentage of Avg. out of pocket spending ($) by the international tourist who have not paid minimum dailly tariff
Bhutan Tourism Monitor 2017
36
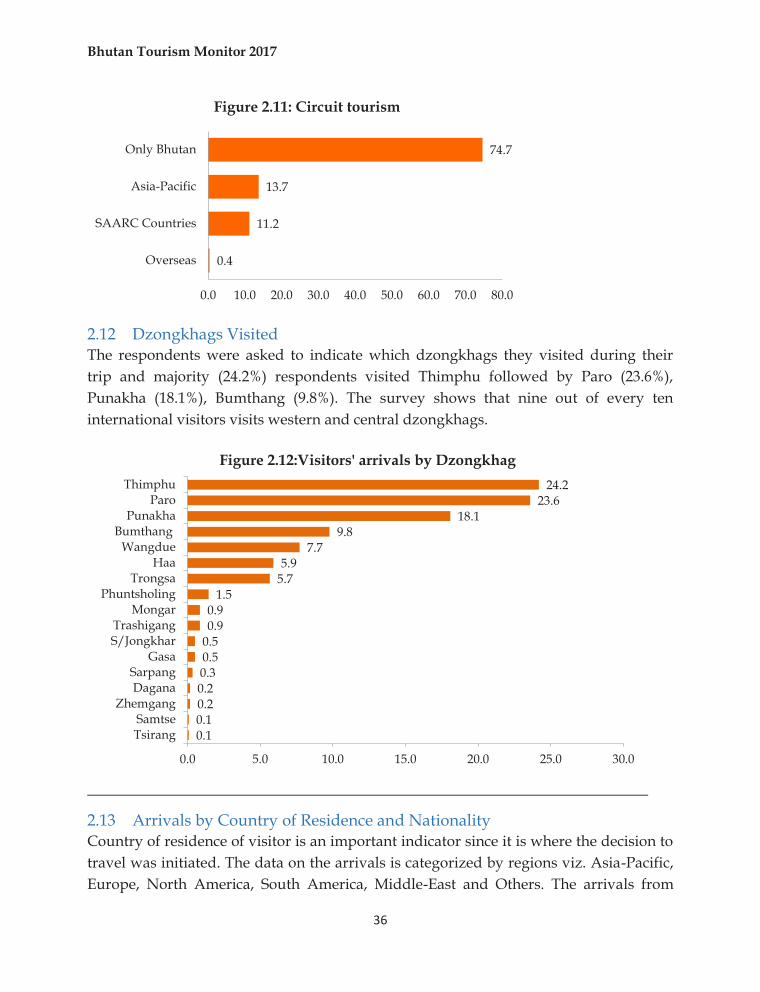
2.12 Dzongkhags Visited The respondents were asked to indicate which dzongkhags they visited during their trip and majority (24.2%) respondents visited Thimphu followed by Paro (23.6%), Punakha (18.1%), Bumthang (9.8%). The survey shows that nine out of every ten international visitors visits western and central dzongkhags.
2.13 Arrivals by Country of Residence and Nationality Country of residence of visitor is an important indicator since it is where the decision to travel was initiated. The data on the arrivals is categorized by regions viz. Asia-Pacific, Europe, North America, South America, Middle-East and Others. The arrivals from
0.4
11.2
13.7
74.7
0.0 10.0 20.0 30.0 40.0 50.0 60.0 70.0 80.0
Overseas
SAARC Countries
Asia-Pacific
Only Bhutan
Figure 2.11: Circuit tourism
0.10.10.20.20.30.50.50.90.9
1.55.75.9
7.79.8
18.123.6
24.2
0.0 5.0 10.0 15.0 20.0 25.0 30.0
TsirangSamtse
ZhemgangDaganaSarpang
GasaS/JongkharTrashigang
MongarPhuntsholing
TrongsaHaa
WangdueBumthang
PunakhaParo
Thimphu
Figure 2.12:Visitors' arrivals by Dzongkhag
Bhutan Tourism Monitor 2017
37
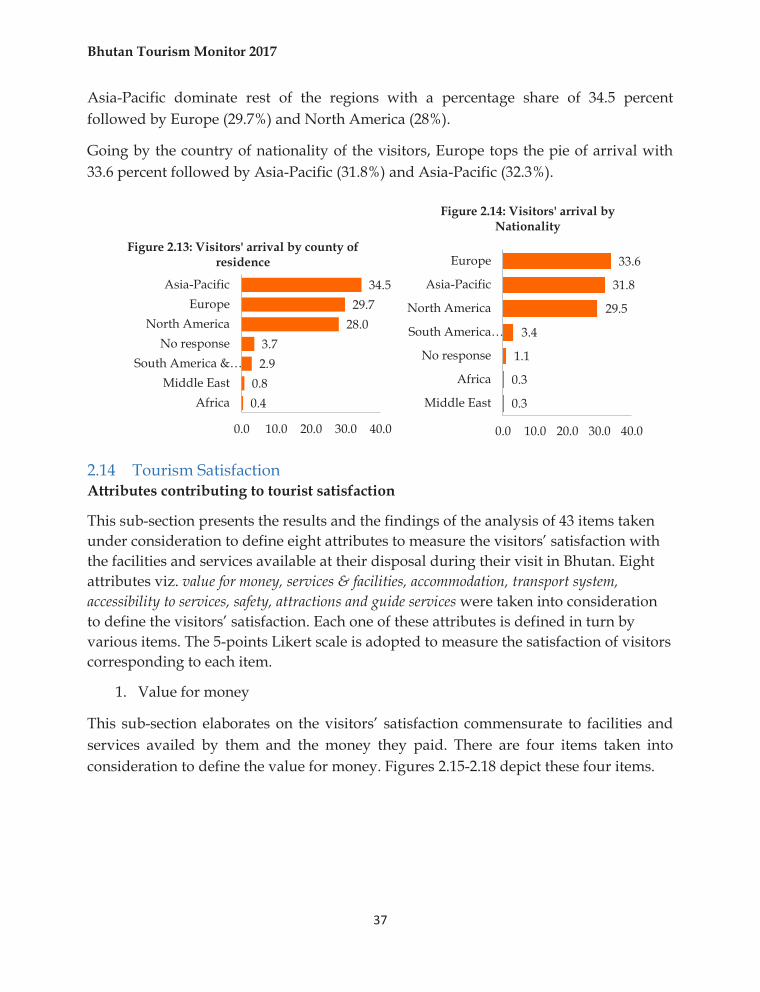
Asia-Pacific dominate rest of the regions with a percentage share of 34.5 percent followed by Europe (29.7%) and North America (28%).
Going by the country of nationality of the visitors, Europe tops the pie of arrival with 33.6 percent followed by Asia-Pacific (31.8%) and Asia-Pacific (32.3%).
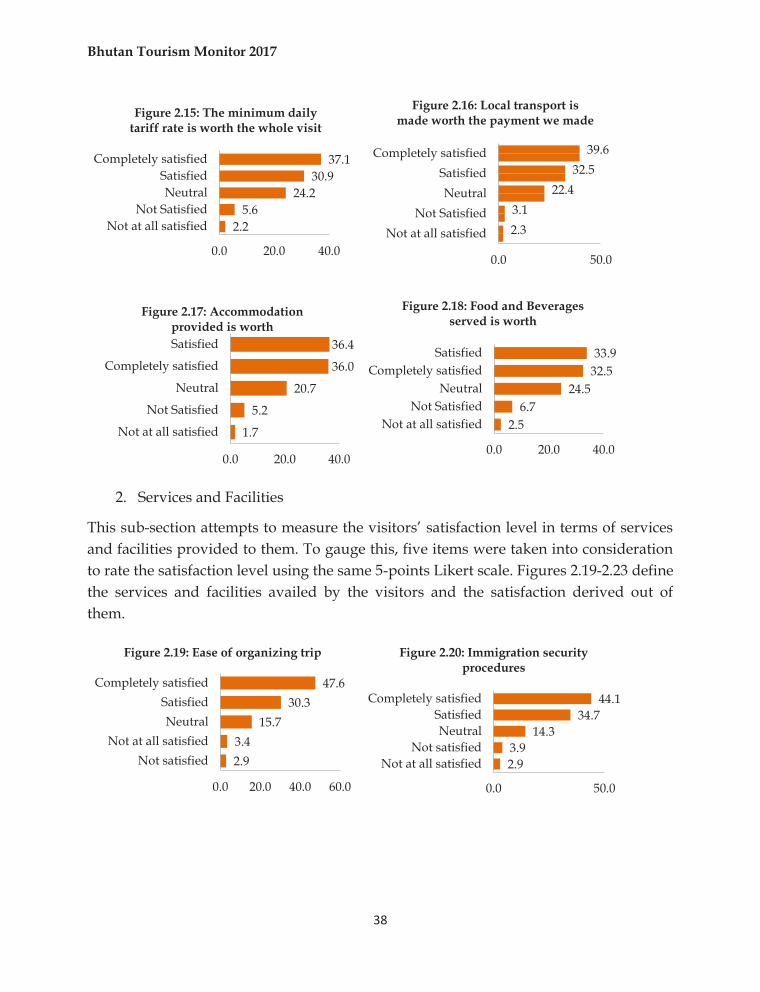
2.14 Tourism Satisfaction Attributes contributing to tourist satisfaction
This sub-section presents the results and the findings of the analysis of 43 items taken under consideration to define eight attributes to measure the visitors’ satisfaction with the facilities and services available at their disposal during their visit in Bhutan. Eight attributes viz. value for money, services & facilities, accommodation, transport system, accessibility to services, safety, attractions and guide services were taken into consideration to define the visitors’ satisfaction. Each one of these attributes is defined in turn by various items. The 5-points Likert scale is adopted to measure the satisfaction of visitors corresponding to each item.
1. Value for money
This sub-section elaborates on the visitors’ satisfaction commensurate to facilities and services availed by them and the money they paid. There are four items taken into consideration to define the value for money. Figures 2.15-2.18 depict these four items.
0.40.8
2.93.7
28.029.7
34.5
0.0 10.0 20.0 30.0 40.0
AfricaMiddle East
South America &…No response
North AmericaEurope
Asia-Pacific
Figure 2.13: Visitors' arrival by county of residence
0.3
0.3
1.1
3.4
29.5
31.8
33.6
0.0 10.0 20.0 30.0 40.0
Middle East
Africa
No response
South America…
North America
Asia-Pacific
Europe
Figure 2.14: Visitors' arrival by Nationality
Bhutan Tourism Monitor 2017
38
2. Services and Facilities
This sub-section attempts to measure the visitors’ satisfaction level in terms of services and facilities provided to them. To gauge this, five items were taken into consideration to rate the satisfaction level using the same 5-points Likert scale. Figures 2.19-2.23 define the services and facilities availed by the visitors and the satisfaction derived out of them.
2.25.6
24.230.9
37.1
0.0 20.0 40.0
Not at all satisfiedNot Satisfied
NeutralSatisfied
Completely satisfied
Figure 2.15: The minimum daily tariff rate is worth the whole visit
2.33.1
22.432.5
39.6
0.0 50.0
Not at all satisfiedNot Satisfied
NeutralSatisfied
Completely satisfied
Figure 2.16: Local transport is made worth the payment we made
1.7
5.2
20.7
36.0
36.4
0.0 20.0 40.0
Not at all satisfied
Not Satisfied
Neutral
Completely satisfied
Satisfied
Figure 2.17: Accommodation provided is worth
2.56.7
24.532.533.9
0.0 20.0 40.0
Not at all satisfiedNot Satisfied
NeutralCompletely satisfied
Satisfied
Figure 2.18: Food and Beverages served is worth
2.93.4
15.730.3
47.6
0.0 20.0 40.0 60.0
Not satisfiedNot at all satisfied
NeutralSatisfied
Completely satisfied
Figure 2.19: Ease of organizing trip
2.93.9
14.334.7
44.1
0.0 50.0
Not at all satisfiedNot satisfied
NeutralSatisfied
Completely satisfied
Figure 2.20: Immigration security procedures
Bhutan Tourism Monitor 2017
39
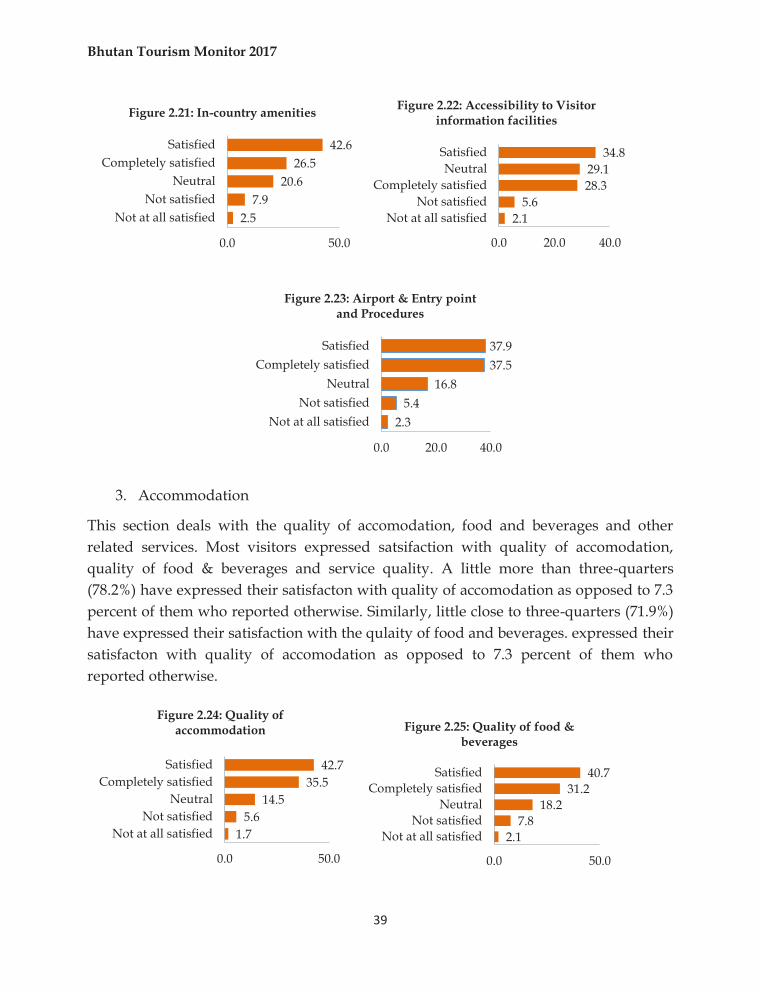
3. Accommodation
This section deals with the quality of accomodation, food and beverages and other related services. Most visitors expressed satsifaction with quality of accomodation, quality of food & beverages and service quality. A little more than three-quarters (78.2%) have expressed their satisfacton with quality of accomodation as opposed to 7.3 percent of them who reported otherwise. Similarly, little close to three-quarters (71.9%) have expressed their satisfaction with the qulaity of food and beverages. expressed their satisfacton with quality of accomodation as opposed to 7.3 percent of them who reported otherwise.
2.57.9
20.626.5
42.6
0.0 50.0
Not at all satisfiedNot satisfied
NeutralCompletely satisfied
Satisfied
Figure 2.21: In-country amenities
2.15.6
28.329.1
34.8
0.0 20.0 40.0
Not at all satisfiedNot satisfied
Completely satisfiedNeutral
Satisfied
Figure 2.22: Accessibility to Visitor information facilities
2.35.4
16.837.537.9
0.0 20.0 40.0
Not at all satisfiedNot satisfied
NeutralCompletely satisfied
Satisfied
Figure 2.23: Airport & Entry point and Procedures
1.75.6
14.535.5
42.7
0.0 50.0
Not at all satisfiedNot satisfied
NeutralCompletely satisfied
Satisfied
Figure 2.24: Quality of accommodation
2.17.8
18.231.2
40.7
0.0 50.0
Not at all satisfiedNot satisfied
NeutralCompletely satisfied
Satisfied
Figure 2.25: Quality of food & beverages
Bhutan Tourism Monitor 2017
40
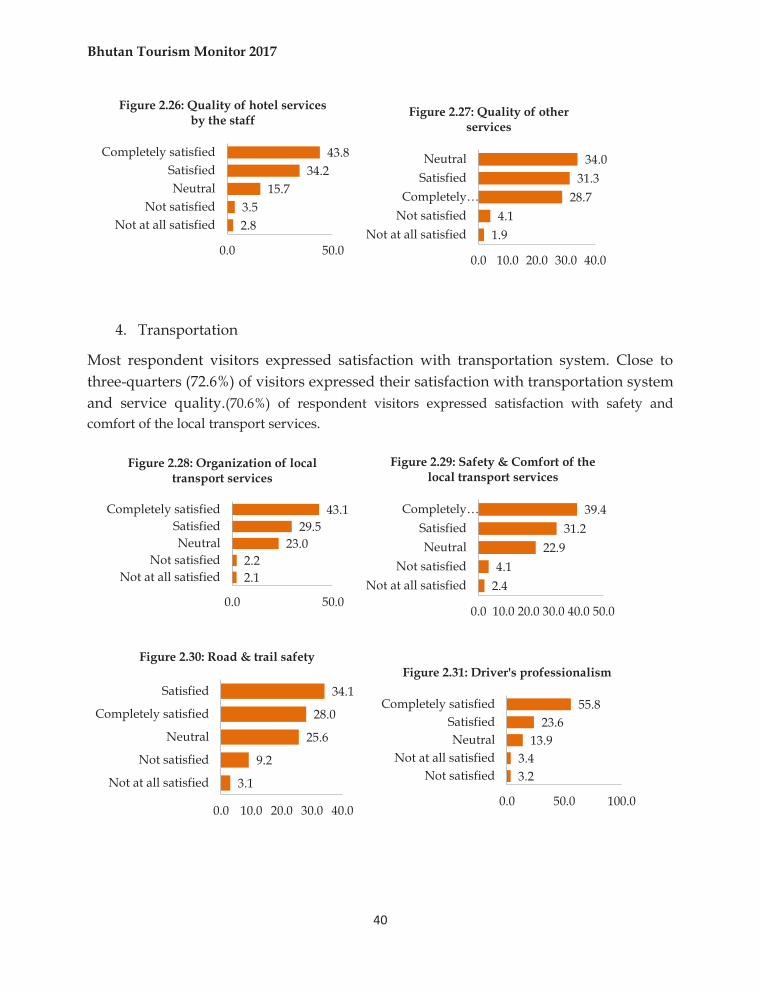
4. Transportation
Most respondent visitors expressed satisfaction with transportation system. Close to three-quarters (72.6%) of visitors expressed their satisfaction with transportation system and service quality.(70.6%) of respondent visitors expressed satisfaction with safety and comfort of the local transport services.
2.83.5
15.734.2
43.8
0.0 50.0
Not at all satisfiedNot satisfied
NeutralSatisfied
Completely satisfied
Figure 2.26: Quality of hotel services by the staff
1.94.1
28.731.3
34.0
0.0 10.0 20.0 30.0 40.0
Not at all satisfiedNot satisfiedCompletely…
SatisfiedNeutral
Figure 2.27: Quality of other services
2.12.2
23.029.5
43.1
0.0 50.0
Not at all satisfiedNot satisfied
NeutralSatisfied
Completely satisfied
Figure 2.28: Organization of local transport services
2.44.1
22.931.2
39.4
0.0 10.0 20.0 30.0 40.0 50.0
Not at all satisfiedNot satisfied
NeutralSatisfied
Completely…
Figure 2.29: Safety & Comfort of the local transport services
3.1
9.2
25.6
28.0
34.1
0.0 10.0 20.0 30.0 40.0
Not at all satisfied
Not satisfied
Neutral
Completely satisfied
Satisfied
Figure 2.30: Road & trail safety
3.23.4
13.923.6
55.8
0.0 50.0 100.0
Not satisfiedNot at all satisfied
NeutralSatisfied
Completely satisfied
Figure 2.31: Driver's professionalism
Bhutan Tourism Monitor 2017
41
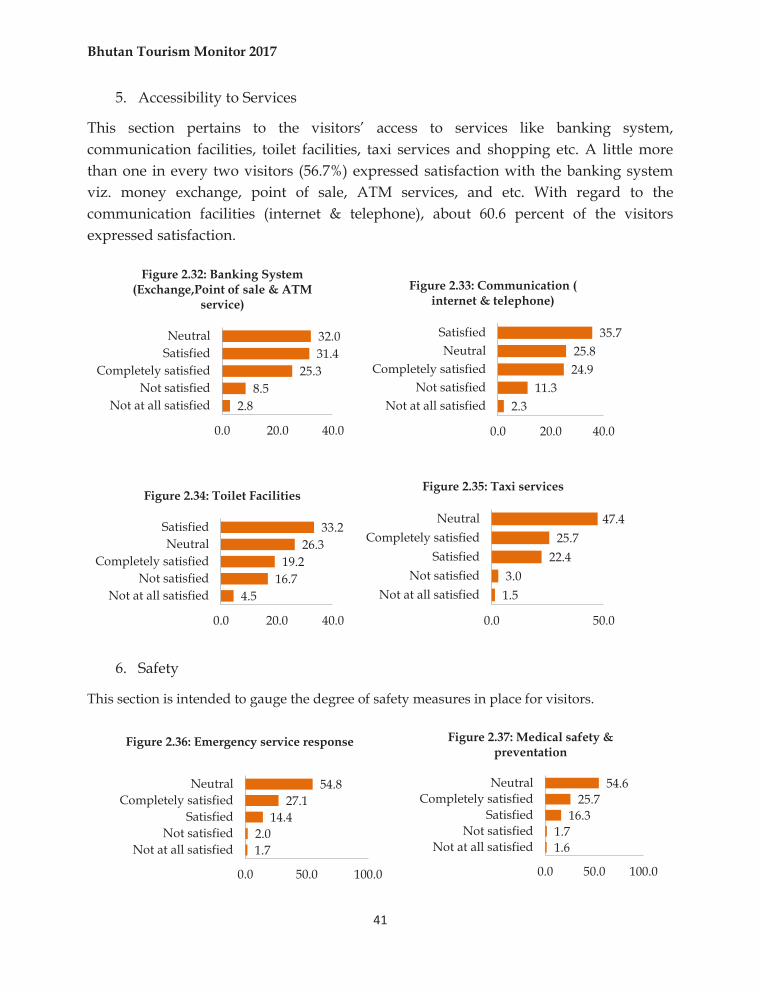
5. Accessibility to Services
This section pertains to the visitors’ access to services like banking system, communication facilities, toilet facilities, taxi services and shopping etc. A little more than one in every two visitors (56.7%) expressed satisfaction with the banking system viz. money exchange, point of sale, ATM services, and etc. With regard to the communication facilities (internet & telephone), about 60.6 percent of the visitors expressed satisfaction.
6. Safety
This section is intended to gauge the degree of safety measures in place for visitors.
2.88.5
25.331.432.0
0.0 20.0 40.0
Not at all satisfiedNot satisfied
Completely satisfiedSatisfiedNeutral
Figure 2.32: Banking System (Exchange,Point of sale & ATM
service)
2.311.3
24.925.8
35.7
0.0 20.0 40.0
Not at all satisfiedNot satisfied
Completely satisfiedNeutral
Satisfied
Figure 2.33: Communication ( internet & telephone)
4.516.7
19.226.3
33.2
0.0 20.0 40.0
Not at all satisfiedNot satisfied
Completely satisfiedNeutral
Satisfied
Figure 2.34: Toilet Facilities
1.53.0
22.425.7
47.4
0.0 50.0
Not at all satisfiedNot satisfied
SatisfiedCompletely satisfied
Neutral
Figure 2.35: Taxi services
1.72.0
14.427.1
54.8
0.0 50.0 100.0
Not at all satisfiedNot satisfied
SatisfiedCompletely satisfied
Neutral
Figure 2.36: Emergency service response
1.61.7
16.325.7
54.6
0.0 50.0 100.0
Not at all satisfiedNot satisfied
SatisfiedCompletely satisfied
Neutral
Figure 2.37: Medical safety & preventation
Bhutan Tourism Monitor 2017
42
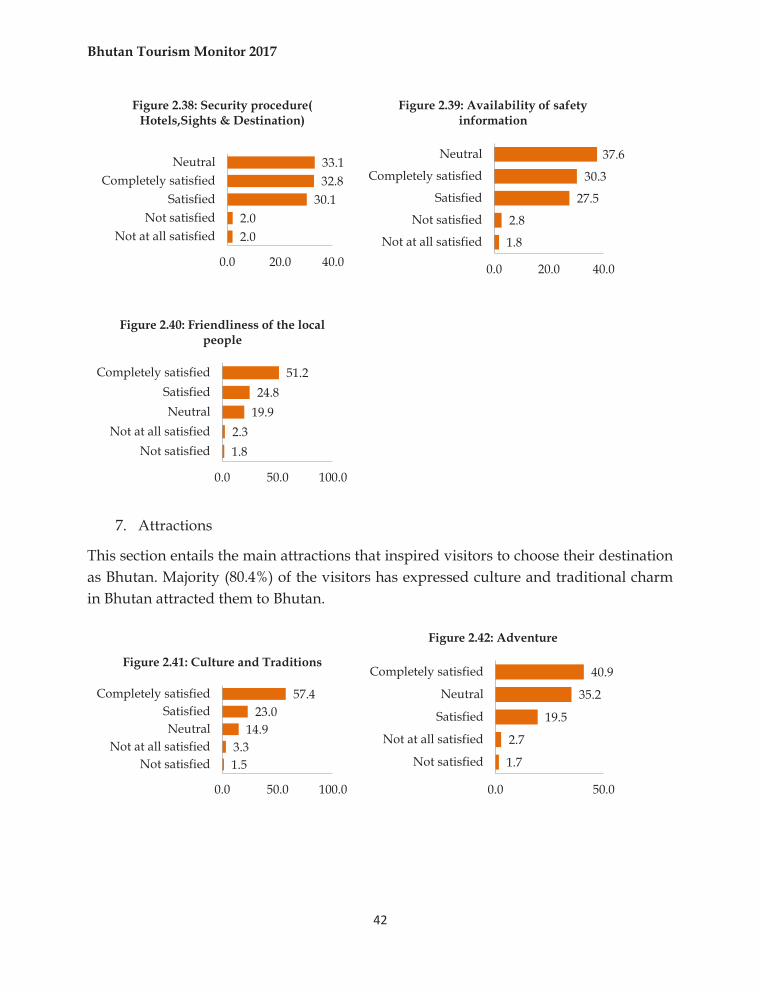
7. Attractions
This section entails the main attractions that inspired visitors to choose their destination as Bhutan. Majority (80.4%) of the visitors has expressed culture and traditional charm in Bhutan attracted them to Bhutan.
2.02.0
30.132.833.1
0.0 20.0 40.0
Not at all satisfiedNot satisfied
SatisfiedCompletely satisfied
Neutral
Figure 2.38: Security procedure( Hotels,Sights & Destination)
1.8
2.8
27.5
30.3
37.6
0.0 20.0 40.0
Not at all satisfied
Not satisfied
Satisfied
Completely satisfied
Neutral
Figure 2.39: Availability of safety information
1.82.3
19.924.8
51.2
0.0 50.0 100.0
Not satisfiedNot at all satisfied
NeutralSatisfied
Completely satisfied
Figure 2.40: Friendliness of the local people
1.53.3
14.923.0
57.4
0.0 50.0 100.0
Not satisfiedNot at all satisfied
NeutralSatisfied
Completely satisfied
Figure 2.41: Culture and Traditions
1.7
2.7
19.5
35.2
40.9
0.0 50.0
Not satisfied
Not at all satisfied
Satisfied
Neutral
Completely satisfied
Figure 2.42: Adventure
Bhutan Tourism Monitor 2017
43
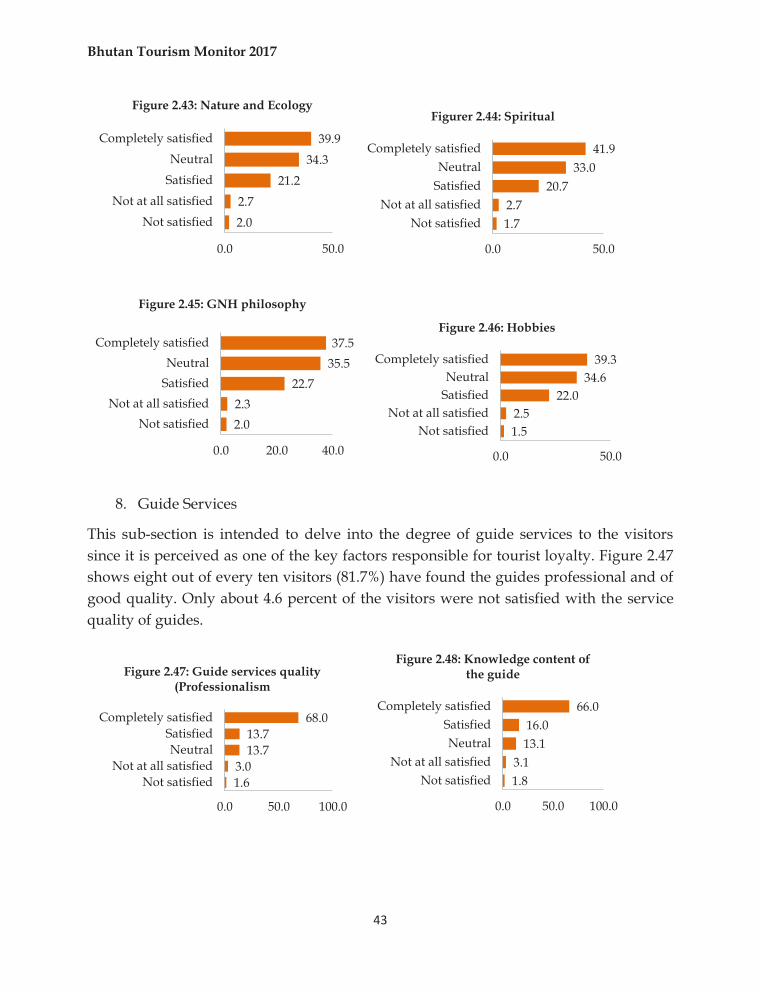
8. Guide Services
This sub-section is intended to delve into the degree of guide services to the visitors since it is perceived as one of the key factors responsible for tourist loyalty. Figure 2.47 shows eight out of every ten visitors (81.7%) have found the guides professional and of good quality. Only about 4.6 percent of the visitors were not satisfied with the service quality of guides.
2.02.7
21.234.3
39.9
0.0 50.0
Not satisfiedNot at all satisfied
SatisfiedNeutral
Completely satisfied
Figure 2.43: Nature and Ecology
1.72.7
20.733.0
41.9
0.0 50.0
Not satisfiedNot at all satisfied
SatisfiedNeutral
Completely satisfied
Figurer 2.44: Spiritual
2.02.3
22.735.537.5
0.0 20.0 40.0
Not satisfiedNot at all satisfied
SatisfiedNeutral
Completely satisfied
Figure 2.45: GNH philosophy
1.52.5
22.034.6
39.3
0.0 50.0
Not satisfiedNot at all satisfied
SatisfiedNeutral
Completely satisfied
Figure 2.46: Hobbies
1.63.0
13.713.7
68.0
0.0 50.0 100.0
Not satisfiedNot at all satisfied
NeutralSatisfied
Completely satisfied
Figure 2.47: Guide services quality (Professionalism
1.83.1
13.116.0
66.0
0.0 50.0 100.0
Not satisfiedNot at all satisfied
NeutralSatisfied
Completely satisfied
Figure 2.48: Knowledge content of the guide
Bhutan Tourism Monitor 2017
44
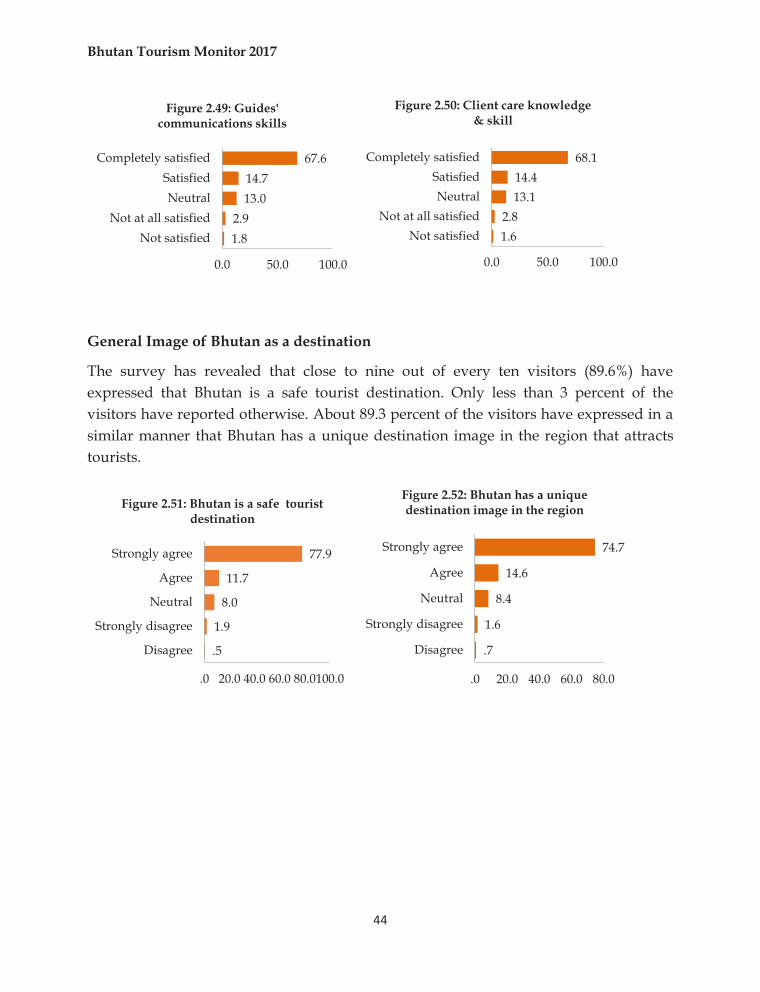
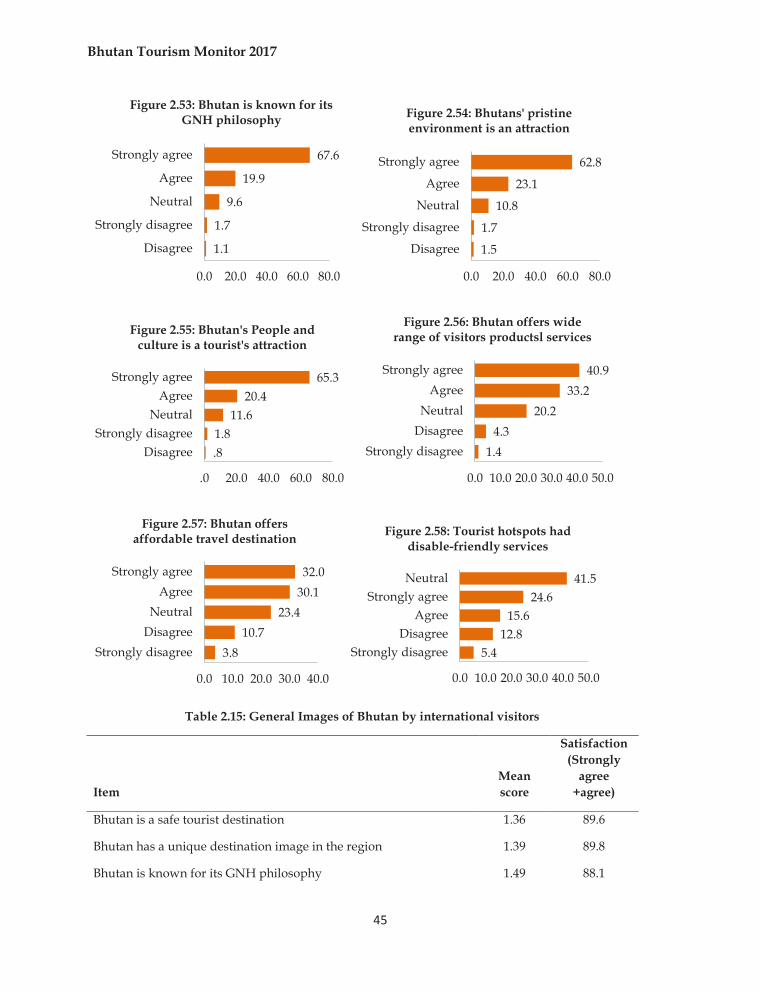
General Image of Bhutan as a destination
The survey has revealed that close to nine out of every ten visitors (89.6%) have expressed that Bhutan is a safe tourist destination. Only less than 3 percent of the visitors have reported otherwise. About 89.3 percent of the visitors have expressed in a similar manner that Bhutan has a unique destination image in the region that attracts tourists.
1.82.9
13.014.7
67.6
0.0 50.0 100.0
Not satisfiedNot at all satisfied
NeutralSatisfied
Completely satisfied
Figure 2.49: Guides' communications skills
1.62.8
13.114.4
68.1
0.0 50.0 100.0
Not satisfiedNot at all satisfied
NeutralSatisfied
Completely satisfied
Figure 2.50: Client care knowledge & skill
.5
1.9
8.0
11.7
77.9
.0 20.0 40.0 60.0 80.0100.0
Disagree
Strongly disagree
Neutral
Agree
Strongly agree
Figure 2.51: Bhutan is a safe tourist destination
.7
1.6
8.4
14.6
74.7
.0 20.0 40.0 60.0 80.0
Disagree
Strongly disagree
Neutral
Agree
Strongly agree
Figure 2.52: Bhutan has a unique destination image in the region
Bhutan Tourism Monitor 2017
45
Table 2.15: General Images of Bhutan by international visitors
Item Mean score
Satisfaction (Strongly
agree +agree)
Bhutan is a safe tourist destination 1.36 89.6
Bhutan has a unique destination image in the region 1.39 89.8
Bhutan is known for its GNH philosophy 1.49 88.1
1.1
1.7
9.6
19.9
67.6
0.0 20.0 40.0 60.0 80.0
Disagree
Strongly disagree
Neutral
Agree
Strongly agree
Figure 2.53: Bhutan is known for its GNH philosophy
1.5
1.7
10.8
23.1
62.8
0.0 20.0 40.0 60.0 80.0
Disagree
Strongly disagree
Neutral
Agree
Strongly agree
Figure 2.54: Bhutans' pristine environment is an attraction
.81.8
11.620.4
65.3
.0 20.0 40.0 60.0 80.0
DisagreeStrongly disagree
NeutralAgree
Strongly agree
Figure 2.55: Bhutan's People and culture is a tourist's attraction
1.44.3
20.233.2
40.9
0.0 10.0 20.0 30.0 40.0 50.0
Strongly disagreeDisagreeNeutral
AgreeStrongly agree
Figure 2.56: Bhutan offers wide range of visitors productsl services
3.810.7
23.430.132.0
0.0 10.0 20.0 30.0 40.0
Strongly disagreeDisagreeNeutral
AgreeStrongly agree
Figure 2.57: Bhutan offers affordable travel destination
5.412.8
15.624.6
41.5
0.0 10.0 20.0 30.0 40.0 50.0
Strongly disagreeDisagree
AgreeStrongly agree
Neutral
Figure 2.58: Tourist hotspots had disable-friendly services
Bhutan Tourism Monitor 2017
46
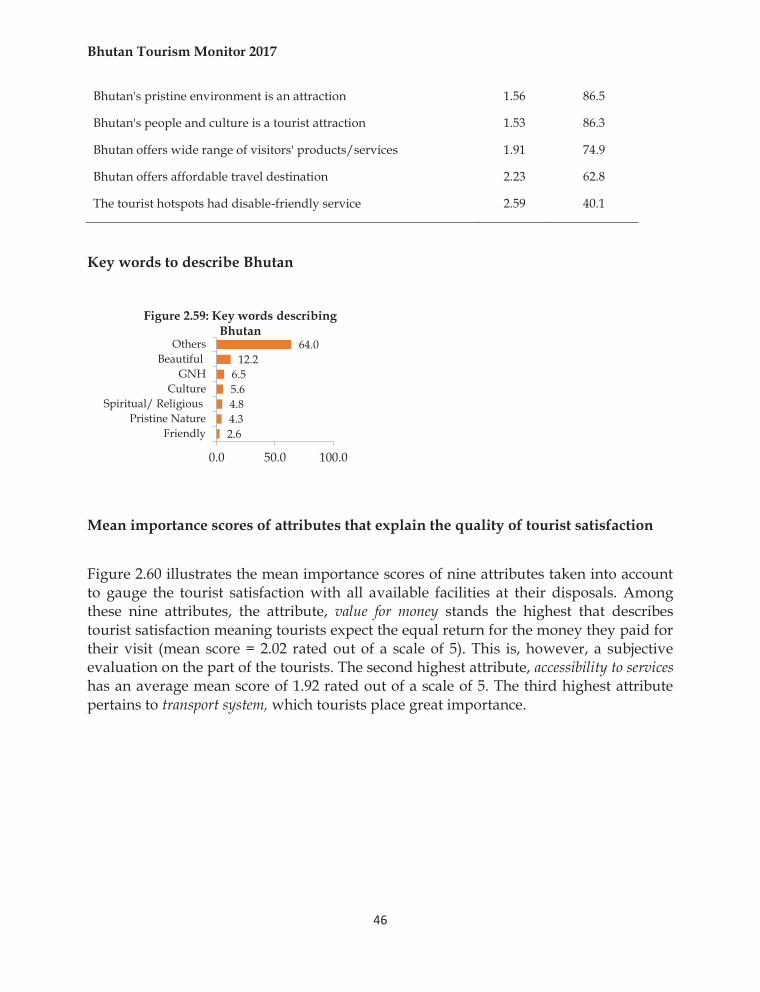
Bhutan's pristine environment is an attraction 1.56 86.5
Bhutan's people and culture is a tourist attraction 1.53 86.3
Bhutan offers wide range of visitors' products/services 1.91 74.9
Bhutan offers affordable travel destination 2.23 62.8
The tourist hotspots had disable-friendly service 2.59 40.1
Key words to describe Bhutan
Mean importance scores of attributes that explain the quality of tourist satisfaction
Figure 2.60 illustrates the mean importance scores of nine attributes taken into account to gauge the tourist satisfaction with all available facilities at their disposals. Among these nine attributes, the attribute, value for money stands the highest that describes tourist satisfaction meaning tourists expect the equal return for the money they paid for their visit (mean score = 2.02 rated out of a scale of 5). This is, however, a subjective evaluation on the part of the tourists. The second highest attribute, accessibility to services has an average mean score of 1.92 rated out of a scale of 5. The third highest attribute pertains to transport system, which tourists place great importance.
2.64.34.85.66.5
12.264.0
0.0 50.0 100.0
Friendly Pristine Nature
Spiritual/ ReligiousCulture
GNHBeautiful
Others
Figure 2.59: Key words describing Bhutan
Bhutan Tourism Monitor 2017
47
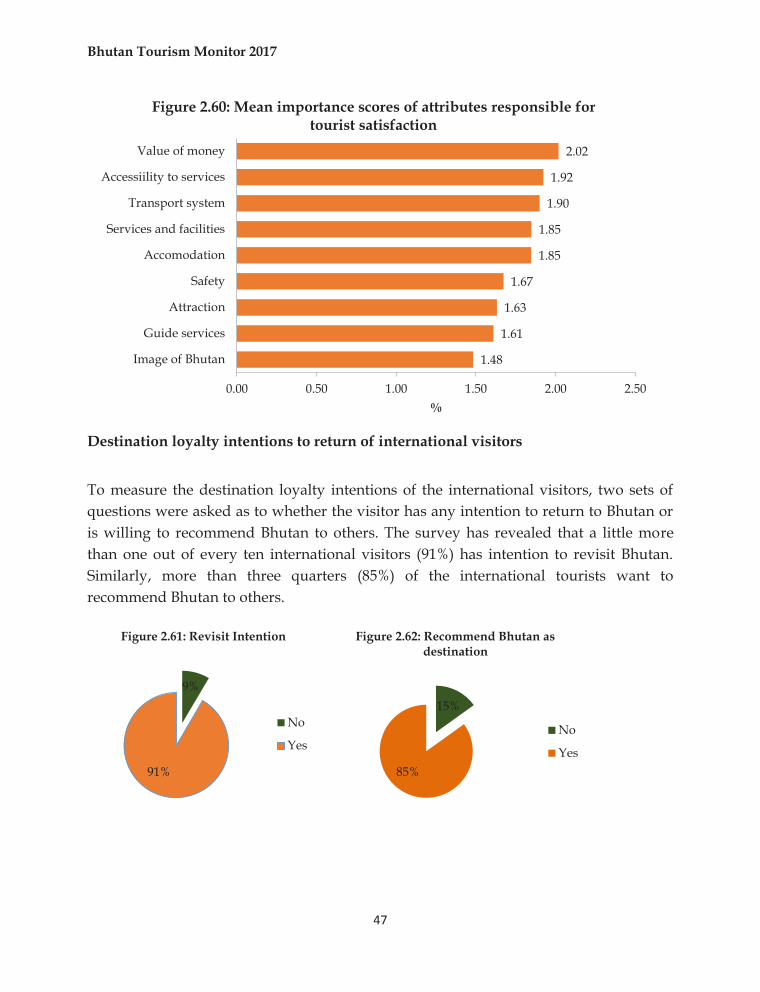
Destination loyalty intentions to return of international visitors
To measure the destination loyalty intentions of the international visitors, two sets of questions were asked as to whether the visitor has any intention to return to Bhutan or is willing to recommend Bhutan to others. The survey has revealed that a little more than one out of every ten international visitors (91%) has intention to revisit Bhutan. Similarly, more than three quarters (85%) of the international tourists want to recommend Bhutan to others.
1.48
1.61
1.63
1.67
1.85
1.85
1.90
1.92
2.02
0.00 0.50 1.00 1.50 2.00 2.50
Image of Bhutan
Guide services
Attraction
Safety
Accomodation
Services and facilities
Transport system
Accessiility to services
Value of money
%
Figure 2.60: Mean importance scores of attributes responsible for tourist satisfaction
9%
91%
Figure 2.61: Revisit Intention
No
Yes
15%
85%
Figure 2.62: Recommend Bhutan as destination
No
Yes
Bhutan Tourism Monitor 2017
48
SECTION 3
REGIONAL VISITOR EXIT SURVEY 2017
Bhutan Tourism Monitor 2017
49
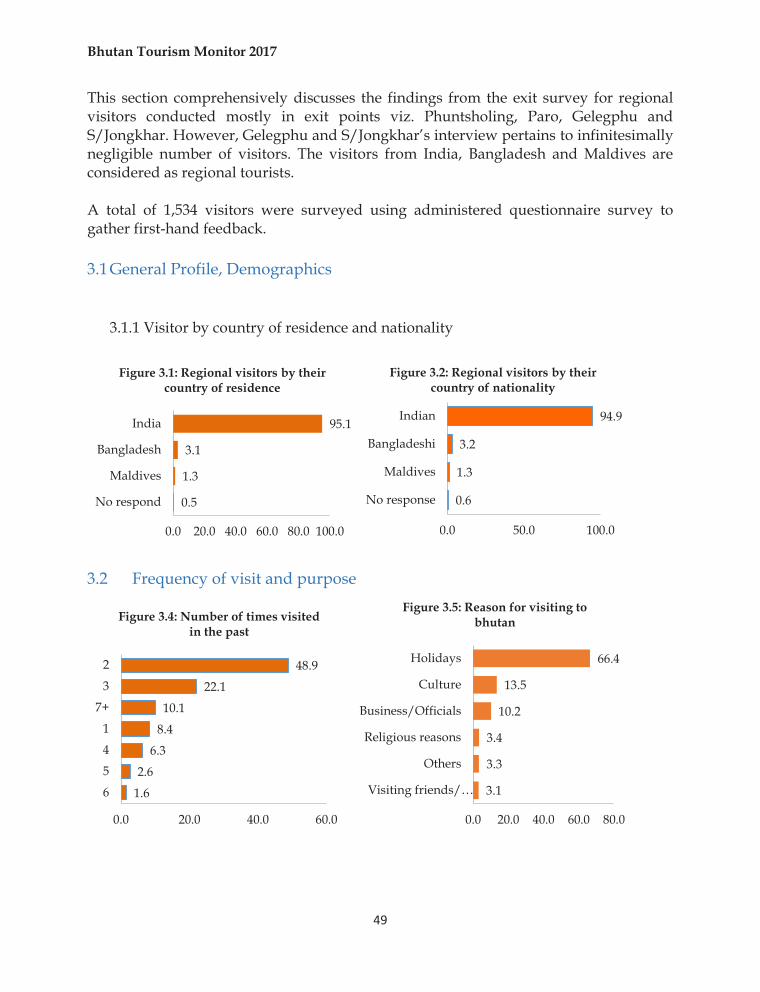
This section comprehensively discusses the findings from the exit survey for regional visitors conducted mostly in exit points viz. Phuntsholing, Paro, Gelegphu and S/Jongkhar. However, Gelegphu and S/Jongkhar’s interview pertains to infinitesimally negligible number of visitors. The visitors from India, Bangladesh and Maldives are considered as regional tourists. A total of 1,534 visitors were surveyed using administered questionnaire survey to gather first-hand feedback. 3.1 General Profile, Demographics
3.1.1 Visitor by country of residence and nationality
3.2 Frequency of visit and purpose
0.5
1.3
3.1
95.1
0.0 20.0 40.0 60.0 80.0 100.0
No respond
Maldives
Bangladesh
India
Figure 3.1: Regional visitors by their country of residence
0.6
1.3
3.2
94.9
0.0 50.0 100.0
No response
Maldives
Bangladeshi
Indian
Figure 3.2: Regional visitors by their country of nationality
1.6
2.6
6.3
8.4
10.1
22.1
48.9
0.0 20.0 40.0 60.0
6
5
4
1
7+
3
2
Figure 3.4: Number of times visited in the past
3.1
3.3
3.4
10.2
13.5
66.4
0.0 20.0 40.0 60.0 80.0
Visiting friends/…
Others
Religious reasons
Business/Officials
Culture
Holidays
Figure 3.5: Reason for visiting to bhutan
Bhutan Tourism Monitor 2017
50
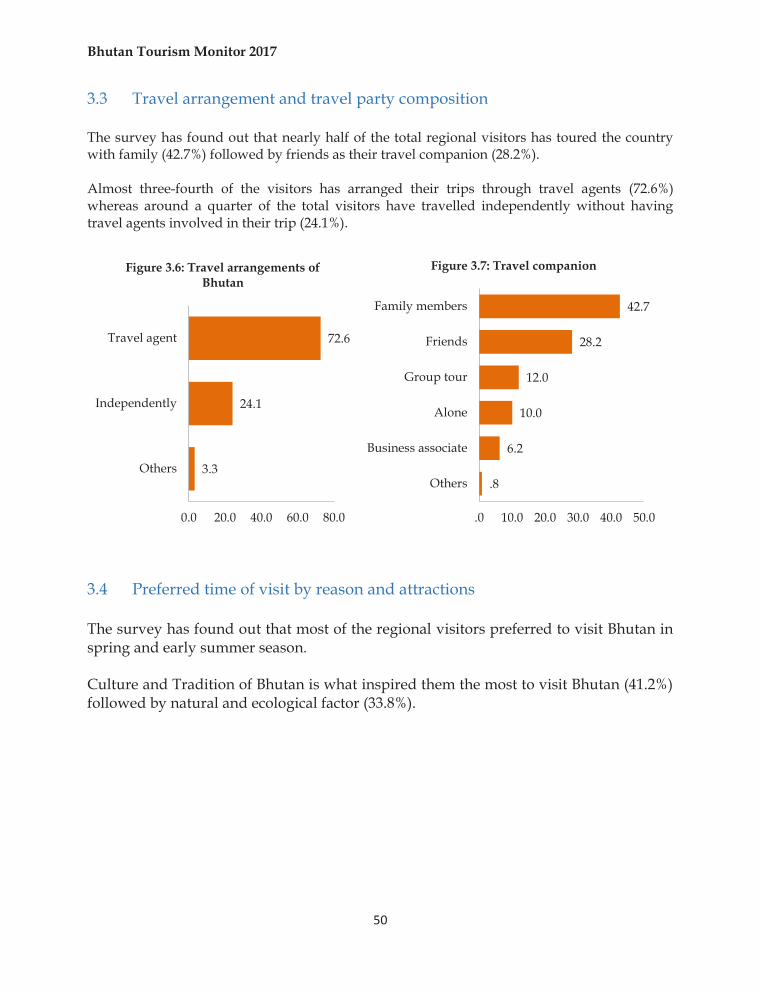
3.3 Travel arrangement and travel party composition The survey has found out that nearly half of the total regional visitors has toured the country with family (42.7%) followed by friends as their travel companion (28.2%). Almost three-fourth of the visitors has arranged their trips through travel agents (72.6%) whereas around a quarter of the total visitors have travelled independently without having travel agents involved in their trip (24.1%).
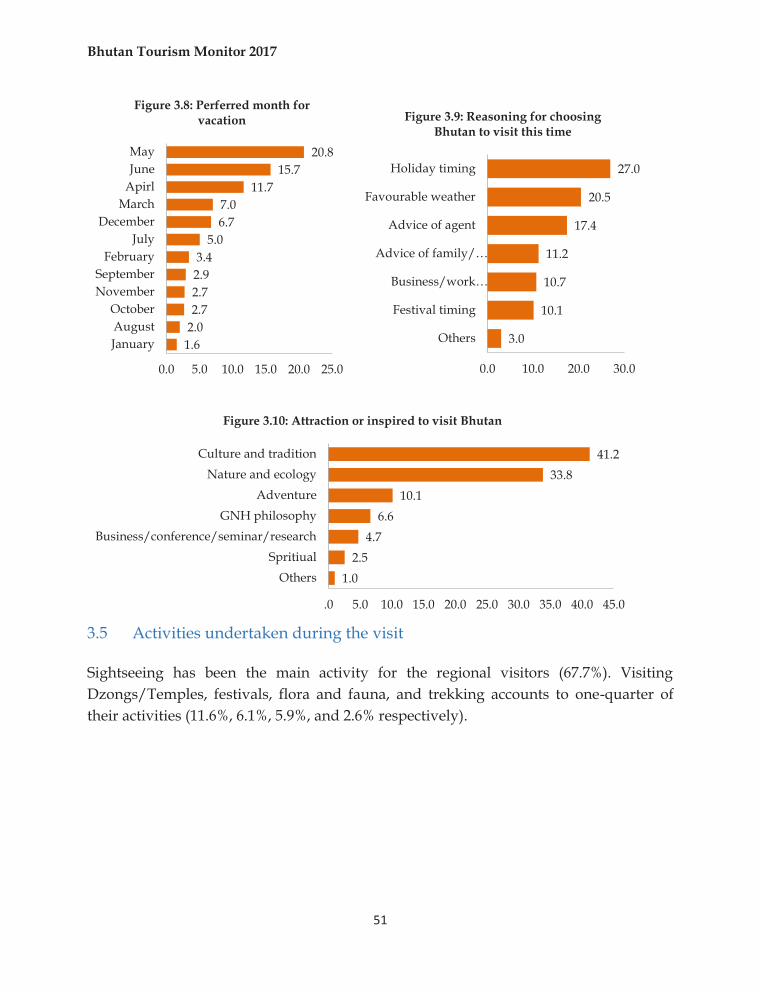
3.4 Preferred time of visit by reason and attractions The survey has found out that most of the regional visitors preferred to visit Bhutan in spring and early summer season. Culture and Tradition of Bhutan is what inspired them the most to visit Bhutan (41.2%) followed by natural and ecological factor (33.8%).
3.3
24.1
72.6
0.0 20.0 40.0 60.0 80.0
Others
Independently
Travel agent
Figure 3.6: Travel arrangements of Bhutan
.8
6.2
10.0
12.0
28.2
42.7
.0 10.0 20.0 30.0 40.0 50.0
Others
Business associate
Alone
Group tour
Friends
Family members
Figure 3.7: Travel companion
Bhutan Tourism Monitor 2017
51
3.5 Activities undertaken during the visit Sightseeing has been the main activity for the regional visitors (67.7%). Visiting Dzongs/Temples, festivals, flora and fauna, and trekking accounts to one-quarter of their activities (11.6%, 6.1%, 5.9%, and 2.6% respectively).
1.62.02.72.72.93.4
5.06.77.0
11.715.7
20.8
0.0 5.0 10.0 15.0 20.0 25.0
JanuaryAugustOctober
NovemberSeptember
FebruaryJuly
DecemberMarch
ApirlJuneMay
Figure 3.8: Perferred month for vacation
3.0
10.1
10.7
11.2
17.4
20.5
27.0
0.0 10.0 20.0 30.0
Others
Festival timing
Business/work…
Advice of family/…
Advice of agent
Favourable weather
Holiday timing
Figure 3.9: Reasoning for choosing Bhutan to visit this time
1.02.5
4.76.6
10.133.8
41.2
.0 5.0 10.0 15.0 20.0 25.0 30.0 35.0 40.0 45.0
OthersSpritiual
Business/conference/seminar/researchGNH philosophy
AdventureNature and ecology
Culture and tradition
Figure 3.10: Attraction or inspired to visit Bhutan
Bhutan Tourism Monitor 2017
52
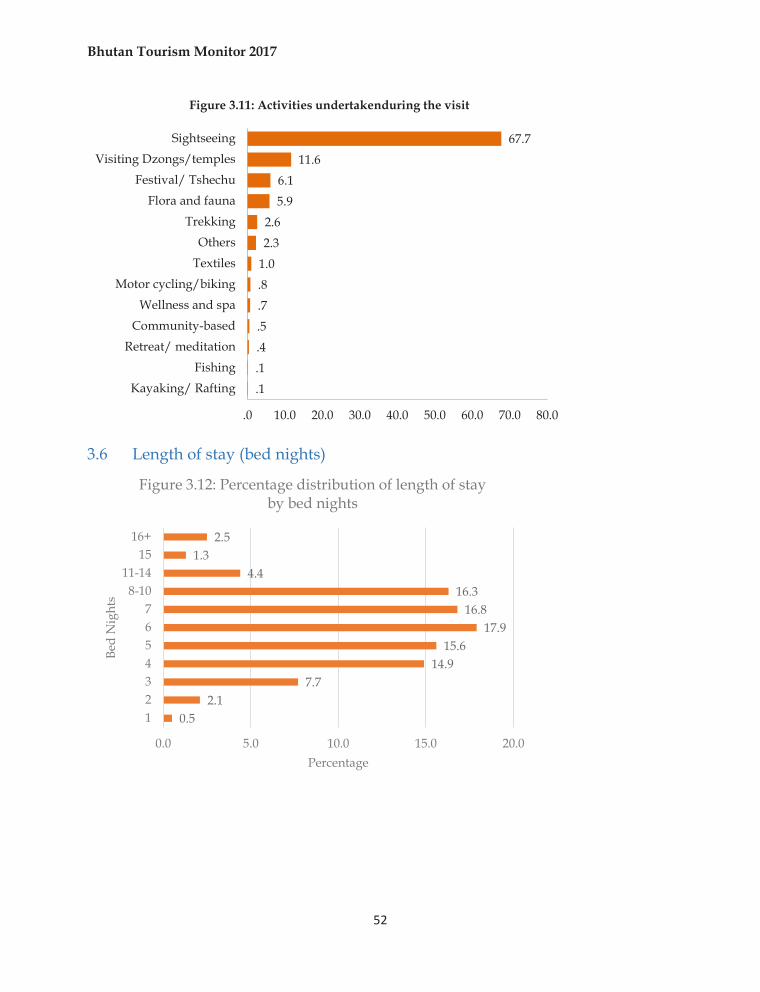
3.6 Length of stay (bed nights)
.1
.1.4.5.7.81.02.32.6
5.96.1
11.667.7
.0 10.0 20.0 30.0 40.0 50.0 60.0 70.0 80.0
Kayaking/ RaftingFishing
Retreat/ meditationCommunity-based
Wellness and spaMotor cycling/biking
TextilesOthers
TrekkingFlora and fauna
Festival/ TshechuVisiting Dzongs/temples
Sightseeing
Figure 3.11: Activities undertakenduring the visit
0.52.1
7.714.9
15.617.9
16.816.3
4.41.3
2.5
0.0 5.0 10.0 15.0 20.0
1234567
8-1011-14
1516+
Percentage
Bed
Nig
hts
Figure 3.12: Percentage distribution of length of stay by bed nights
Bhutan Tourism Monitor 2017
53
3.7 Mode of local transport and accommodation
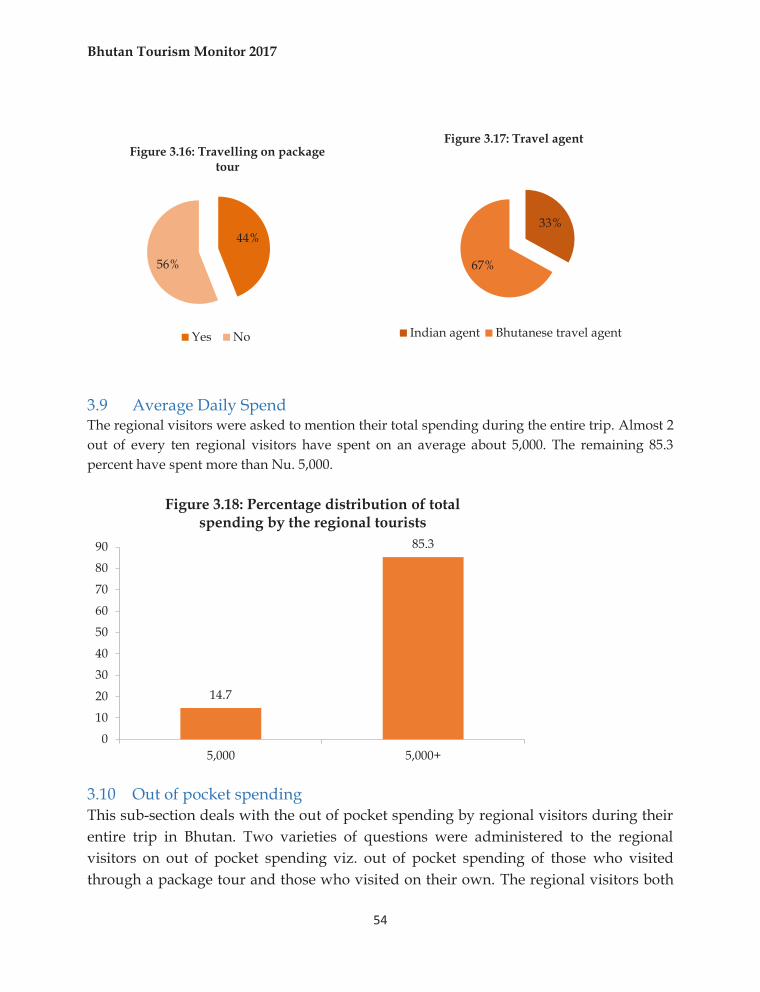
3.8 Travelling of package tour More than half of the total respondent visitors have travelled on package tour (44%) with 67% of this through Bhutanese travel agents.
2.02.22.3
4.24.55.05.3
9.321.521.722.1
0.0 5.0 10.0 15.0 20.0 25.0
OthersBus( Indian)
Bike/ scooterOwn pvt. carDomestic air
Rented car (Indian)Taxi (Indian)
Local host carBus( Bhutanese)
Taxi ( Bhutanese)Rented car (…
Figure 3.13: mode of local transportation
16%
42%
42%
Figure 3.14: Have you appliedonline for route permit
Don't know Yes No
2.7
11.3
13.2
21.9
50.9
0.0 10.0 20.0 30.0 40.0 50.0 60.0
Home stay
Guest house
Lodges
Non-star hotel
Star hotel
Figure 3.15: Type of Accomodation
Bhutan Tourism Monitor 2017
54
3.9 Average Daily Spend The regional visitors were asked to mention their total spending during the entire trip. Almost 2 out of every ten regional visitors have spent on an average about 5,000. The remaining 85.3 percent have spent more than Nu. 5,000.
3.10 Out of pocket spending This sub-section deals with the out of pocket spending by regional visitors during their entire trip in Bhutan. Two varieties of questions were administered to the regional visitors on out of pocket spending viz. out of pocket spending of those who visited through a package tour and those who visited on their own. The regional visitors both
44%
56%
Figure 3.16: Travelling on package tour
Yes No
33%
67%
Figure 3.17: Travel agent
Indian agent Bhutanese travel agent
14.7
85.3
0
10
20
30
40
50
60
70
80
90
5,000 5,000+
Figure 3.18: Percentage distribution of total spending by the regional tourists
Bhutan Tourism Monitor 2017
55
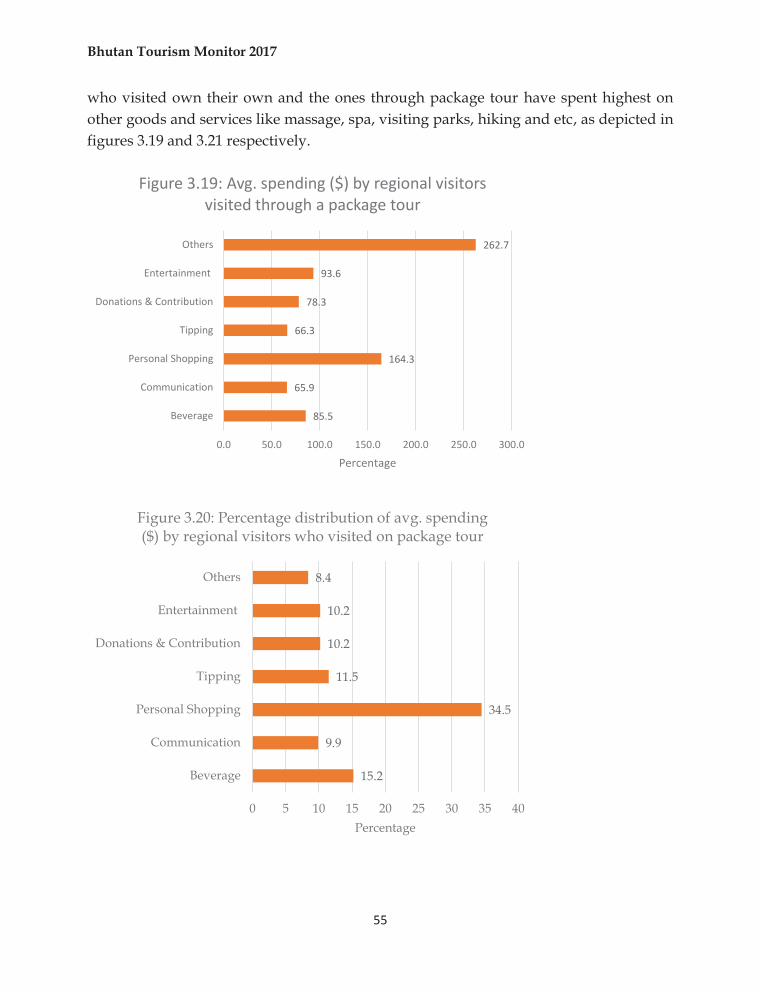
who visited own their own and the ones through package tour have spent highest on other goods and services like massage, spa, visiting parks, hiking and etc, as depicted in figures 3.19 and 3.21 respectively.
85.5
65.9
164.3
66.3
78.3
93.6
262.7
0.0 50.0 100.0 150.0 200.0 250.0 300.0
Beverage
Communication
Personal Shopping
Tipping
Donations & Contribution
Entertainment
Others
Percentage
Figure 3.19: Avg. spending ($) by regional visitors visited through a package tour
15.2
9.9
34.5
11.5
10.2
10.2
8.4
0 5 10 15 20 25 30 35 40
Beverage
Communication
Personal Shopping
Tipping
Donations & Contribution
Entertainment
Others
Percentage
Figure 3.20: Percentage distribution of avg. spending ($) by regional visitors who visited on package tour
Bhutan Tourism Monitor 2017
56
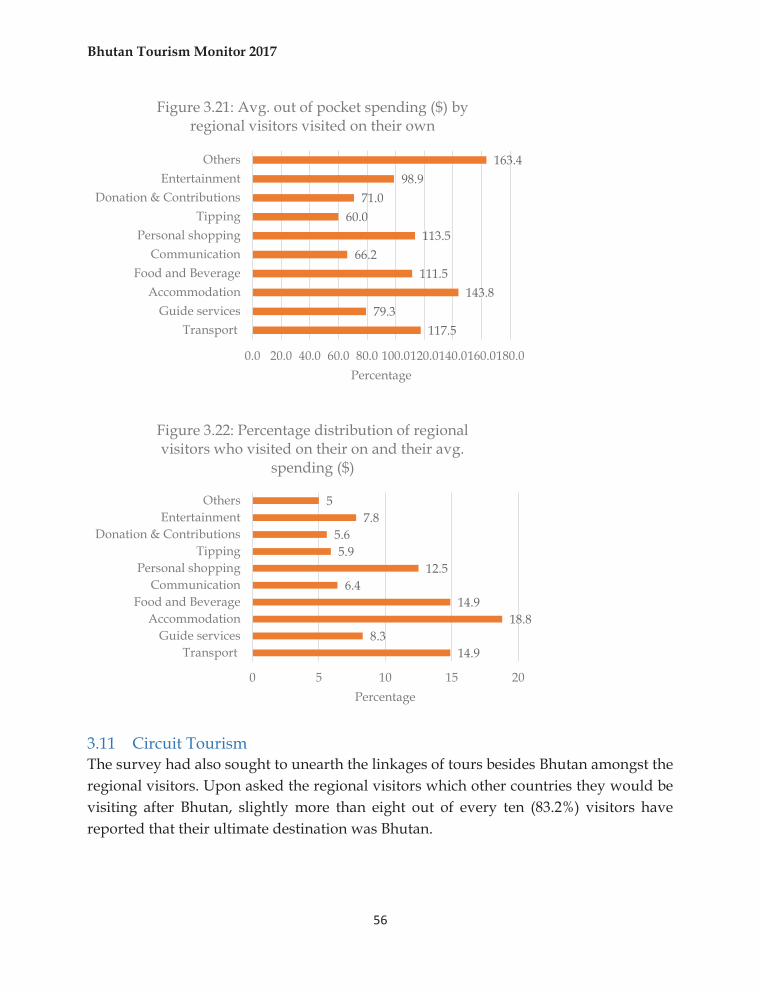
3.11 Circuit Tourism The survey had also sought to unearth the linkages of tours besides Bhutan amongst the regional visitors. Upon asked the regional visitors which other countries they would be visiting after Bhutan, slightly more than eight out of every ten (83.2%) visitors have reported that their ultimate destination was Bhutan.
117.579.3
143.8111.5
66.2113.5
60.071.0
98.9163.4
0.0 20.0 40.0 60.0 80.0 100.0120.0140.0160.0180.0
TransportGuide services
AccommodationFood and Beverage
CommunicationPersonal shopping
TippingDonation & Contributions
EntertainmentOthers
Percentage
Figure 3.21: Avg. out of pocket spending ($) by regional visitors visited on their own
14.98.3
18.814.9
6.412.5
5.95.6
7.85
0 5 10 15 20
TransportGuide services
AccommodationFood and Beverage
CommunicationPersonal shopping
TippingDonation & Contributions
EntertainmentOthers
Percentage
Figure 3.22: Percentage distribution of regional visitors who visited on their on and their avg.
spending ($)
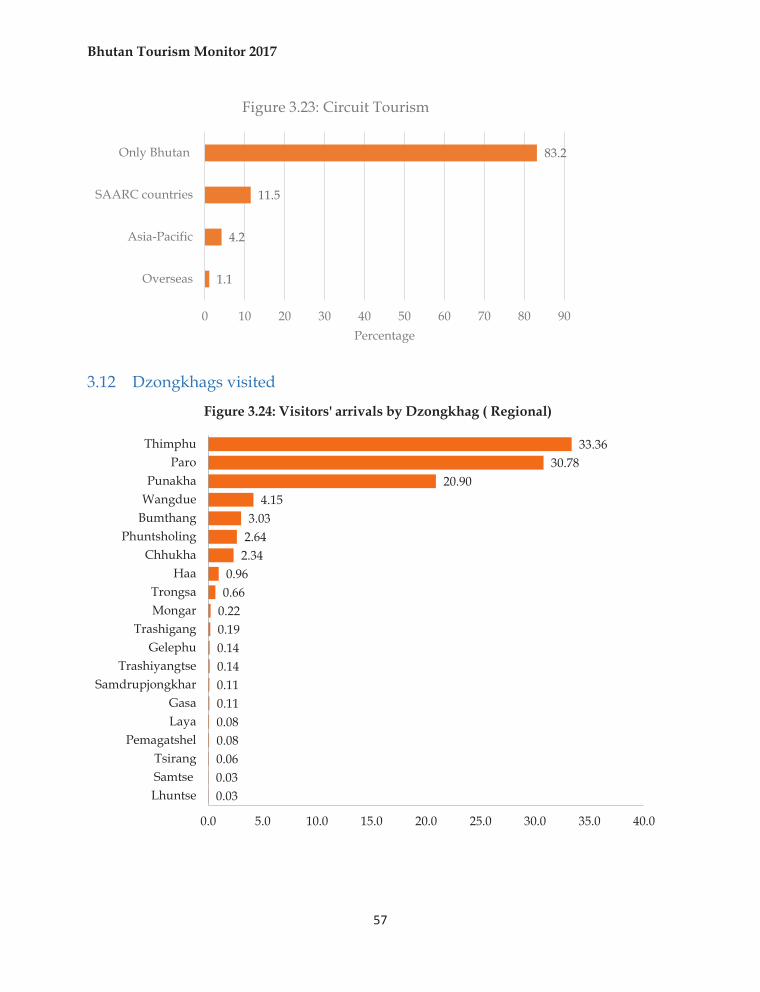
Bhutan Tourism Monitor 2017
57
3.12 Dzongkhags visited
1.1
4.2
11.5
83.2
0 10 20 30 40 50 60 70 80 90
Overseas
Asia-Pacific
SAARC countries
Only Bhutan
Percentage
Figure 3.23: Circuit Tourism
0.030.030.060.080.080.110.110.140.140.190.220.660.96
2.342.643.03
4.1520.90
30.7833.36
0.0 5.0 10.0 15.0 20.0 25.0 30.0 35.0 40.0
LhuntseSamtseTsirang
PemagatshelLayaGasa
SamdrupjongkharTrashiyangtse
GelephuTrashigang
MongarTrongsa
HaaChhukha
PhuntsholingBumthangWangduePunakha
ParoThimphu
Figure 3.24: Visitors' arrivals by Dzongkhag ( Regional)
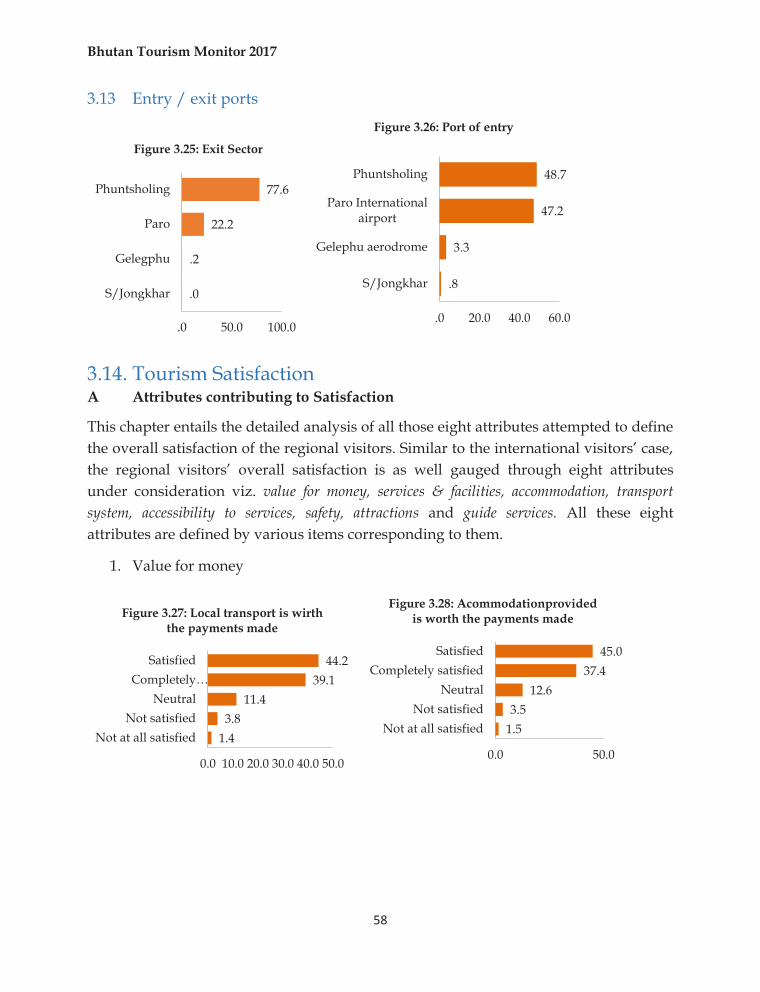
Bhutan Tourism Monitor 2017
58
3.13 Entry / exit ports
3.14. Tourism Satisfaction A Attributes contributing to Satisfaction
This chapter entails the detailed analysis of all those eight attributes attempted to define the overall satisfaction of the regional visitors. Similar to the international visitors’ case, the regional visitors’ overall satisfaction is as well gauged through eight attributes under consideration viz. value for money, services & facilities, accommodation, transport system, accessibility to services, safety, attractions and guide services. All these eight attributes are defined by various items corresponding to them.
1. Value for money
.0
.2
22.2
77.6
.0 50.0 100.0
S/Jongkhar
Gelegphu
Paro
Phuntsholing
Figure 3.25: Exit Sector
.8
3.3
47.2
48.7
.0 20.0 40.0 60.0
S/Jongkhar
Gelephu aerodrome
Paro Internationalairport
Phuntsholing
Figure 3.26: Port of entry
1.43.8
11.439.1
44.2
0.0 10.0 20.0 30.0 40.0 50.0
Not at all satisfiedNot satisfied
NeutralCompletely…
Satisfied
Figure 3.27: Local transport is wirth the payments made
1.53.5
12.637.4
45.0
0.0 50.0
Not at all satisfiedNot satisfied
NeutralCompletely satisfied
Satisfied
Figure 3.28: Acommodationprovided is worth the payments made
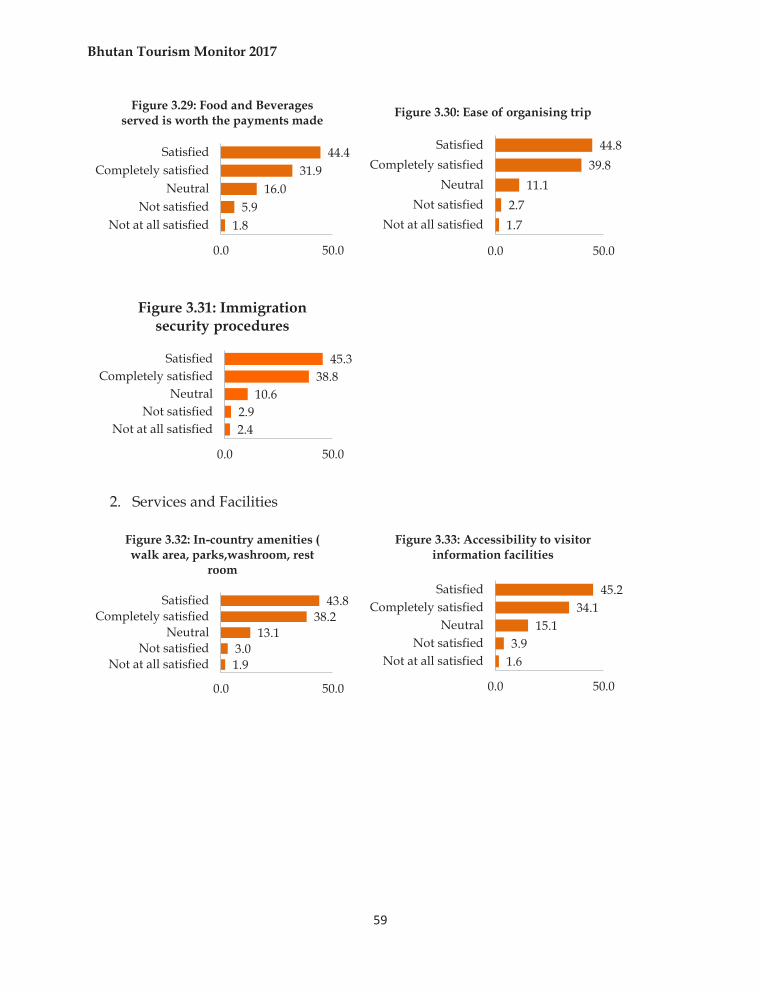
Bhutan Tourism Monitor 2017
59
2. Services and Facilities
1.85.9
16.031.9
44.4
0.0 50.0
Not at all satisfiedNot satisfied
NeutralCompletely satisfied
Satisfied
Figure 3.29: Food and Beverages served is worth the payments made
1.72.7
11.139.8
44.8
0.0 50.0
Not at all satisfiedNot satisfied
NeutralCompletely satisfied
Satisfied
Figure 3.30: Ease of organising trip
2.42.9
10.638.8
45.3
0.0 50.0
Not at all satisfiedNot satisfied
NeutralCompletely satisfied
Satisfied
Figure 3.31: Immigration security procedures
1.93.0
13.138.2
43.8
0.0 50.0
Not at all satisfiedNot satisfied
NeutralCompletely satisfied
Satisfied
Figure 3.32: In-country amenities ( walk area, parks,washroom, rest
room
1.63.9
15.134.1
45.2
0.0 50.0
Not at all satisfiedNot satisfied
NeutralCompletely satisfied
Satisfied
Figure 3.33: Accessibility to visitor information facilities
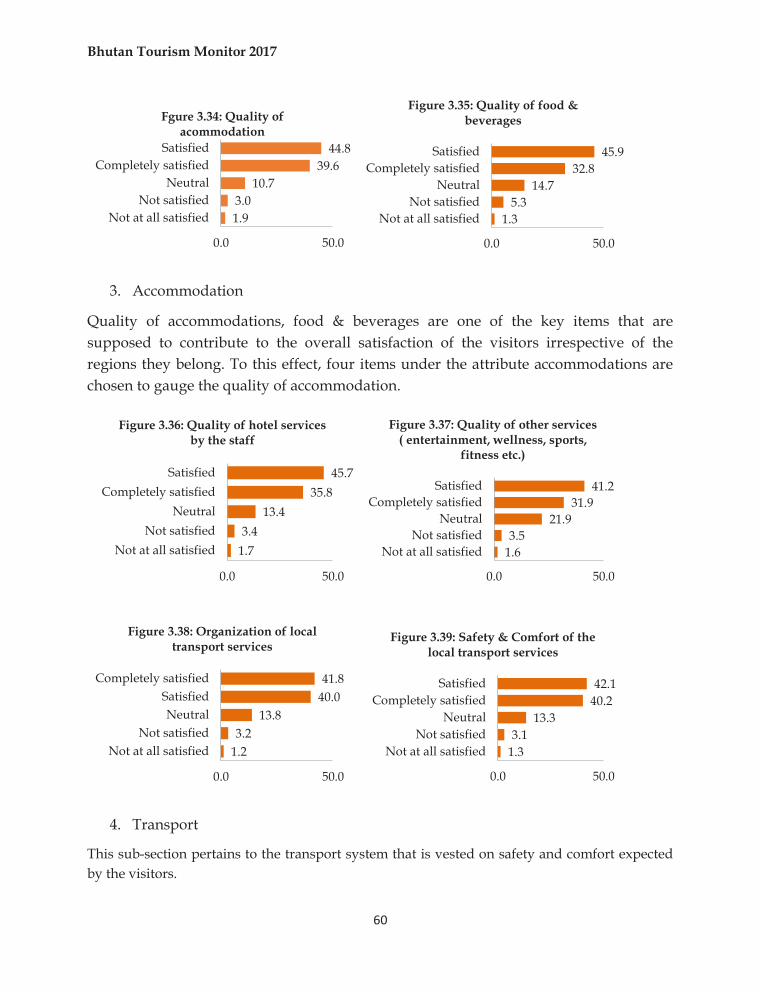
Bhutan Tourism Monitor 2017
60
3. Accommodation
Quality of accommodations, food & beverages are one of the key items that are supposed to contribute to the overall satisfaction of the visitors irrespective of the regions they belong. To this effect, four items under the attribute accommodations are chosen to gauge the quality of accommodation.
4. Transport
This sub-section pertains to the transport system that is vested on safety and comfort expected by the visitors.
1.93.0
10.739.6
44.8
0.0 50.0
Not at all satisfiedNot satisfied
NeutralCompletely satisfied
Satisfied
Fgure 3.34: Quality of acommodation
1.35.3
14.732.8
45.9
0.0 50.0
Not at all satisfiedNot satisfied
NeutralCompletely satisfied
Satisfied
Figure 3.35: Quality of food & beverages
1.73.4
13.435.8
45.7
0.0 50.0
Not at all satisfiedNot satisfied
NeutralCompletely satisfied
Satisfied
Figure 3.36: Quality of hotel services by the staff
1.63.5
21.931.9
41.2
0.0 50.0
Not at all satisfiedNot satisfied
NeutralCompletely satisfied
Satisfied
Figure 3.37: Quality of other services ( entertainment, wellness, sports,
fitness etc.)
1.23.2
13.840.041.8
0.0 50.0
Not at all satisfiedNot satisfied
NeutralSatisfied
Completely satisfied
Figure 3.38: Organization of local transport services
1.33.1
13.340.242.1
0.0 50.0
Not at all satisfiedNot satisfied
NeutralCompletely satisfied
Satisfied
Figure 3.39: Safety & Comfort of the local transport services
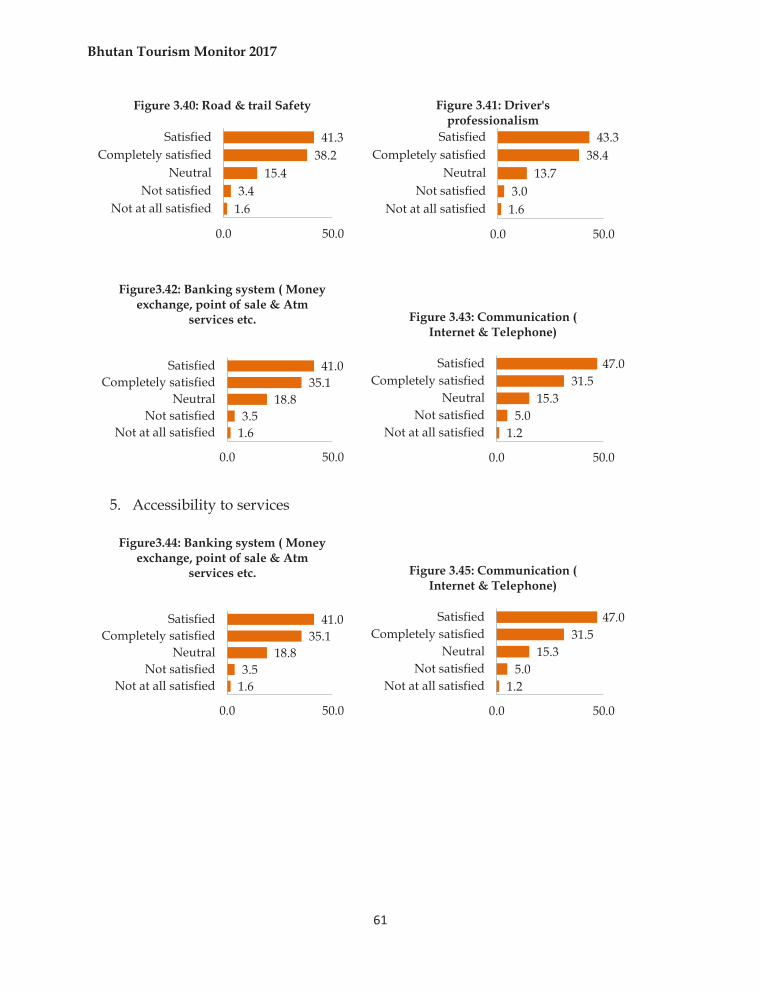
Bhutan Tourism Monitor 2017
61
5. Accessibility to services
1.63.4
15.438.2
41.3
0.0 50.0
Not at all satisfiedNot satisfied
NeutralCompletely satisfied
Satisfied
Figure 3.40: Road & trail Safety
1.63.0
13.738.4
43.3
0.0 50.0
Not at all satisfiedNot satisfied
NeutralCompletely satisfied
Satisfied
Figure 3.41: Driver's professionalism
1.63.5
18.835.1
41.0
0.0 50.0
Not at all satisfiedNot satisfied
NeutralCompletely satisfied
Satisfied
Figure3.42: Banking system ( Money exchange, point of sale & Atm
services etc.
1.25.0
15.331.5
47.0
0.0 50.0
Not at all satisfiedNot satisfied
NeutralCompletely satisfied
Satisfied
Figure 3.43: Communication ( Internet & Telephone)
1.63.5
18.835.1
41.0
0.0 50.0
Not at all satisfiedNot satisfied
NeutralCompletely satisfied
Satisfied
Figure3.44: Banking system ( Money exchange, point of sale & Atm
services etc.
1.25.0
15.331.5
47.0
0.0 50.0
Not at all satisfiedNot satisfied
NeutralCompletely satisfied
Satisfied
Figure 3.45: Communication ( Internet & Telephone)
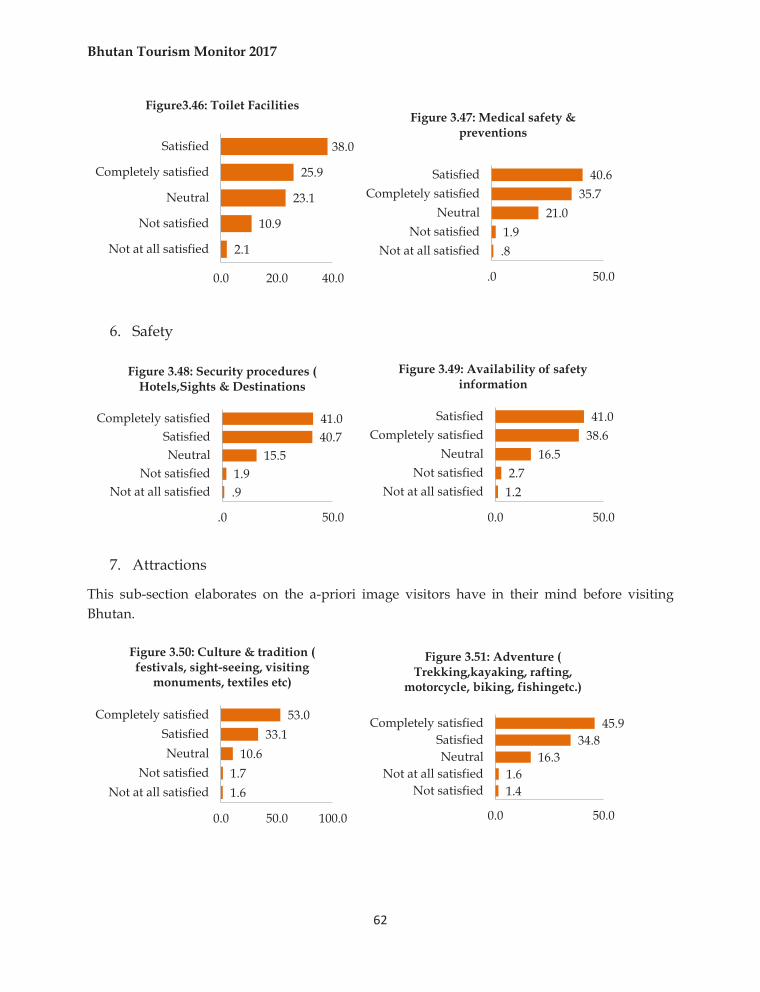
Bhutan Tourism Monitor 2017
62
6. Safety
7. Attractions
This sub-section elaborates on the a-priori image visitors have in their mind before visiting Bhutan.
2.1
10.9
23.1
25.9
38.0
0.0 20.0 40.0
Not at all satisfied
Not satisfied
Neutral
Completely satisfied
Satisfied
Figure3.46: Toilet Facilities
.81.9
21.035.7
40.6
.0 50.0
Not at all satisfiedNot satisfied
NeutralCompletely satisfied
Satisfied
Figure 3.47: Medical safety & preventions
.91.9
15.540.741.0
.0 50.0
Not at all satisfiedNot satisfied
NeutralSatisfied
Completely satisfied
Figure 3.48: Security procedures ( Hotels,Sights & Destinations
1.22.7
16.538.641.0
0.0 50.0
Not at all satisfiedNot satisfied
NeutralCompletely satisfied
Satisfied
Figure 3.49: Availability of safety information
1.61.7
10.633.1
53.0
0.0 50.0 100.0
Not at all satisfiedNot satisfied
NeutralSatisfied
Completely satisfied
Figure 3.50: Culture & tradition ( festivals, sight-seeing, visiting
monuments, textiles etc)
1.41.6
16.334.8
45.9
0.0 50.0
Not satisfiedNot at all satisfied
NeutralSatisfied
Completely satisfied
Figure 3.51: Adventure ( Trekking,kayaking, rafting,
motorcycle, biking, fishingetc.)
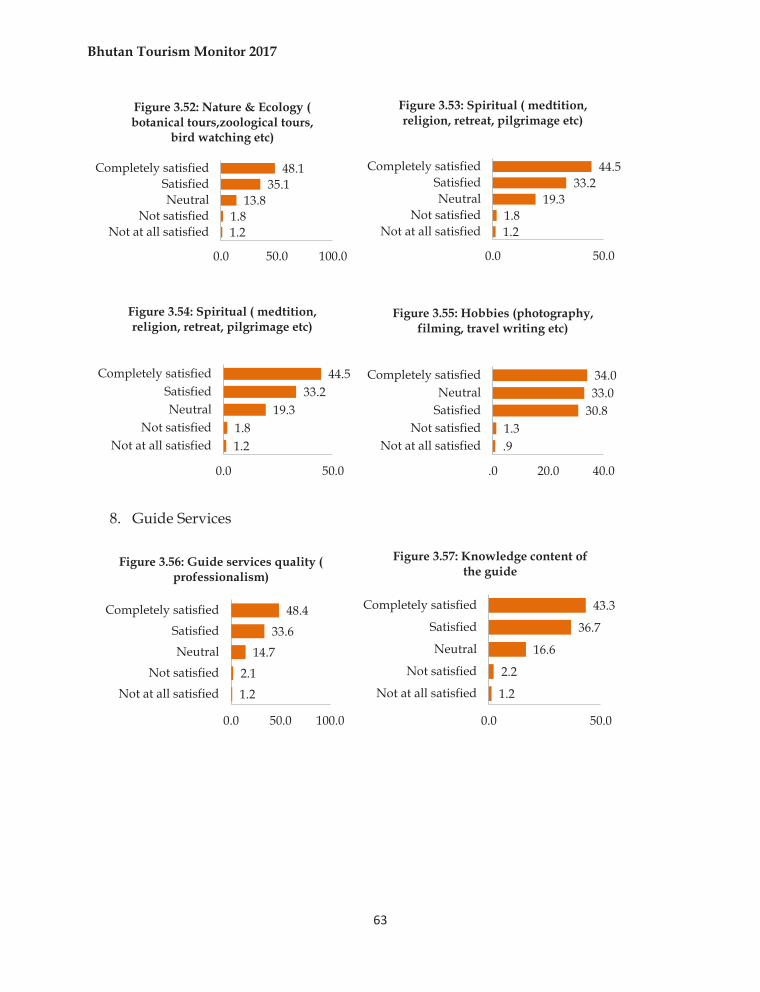
Bhutan Tourism Monitor 2017
63
8. Guide Services
1.21.8
13.835.1
48.1
0.0 50.0 100.0
Not at all satisfiedNot satisfied
NeutralSatisfied
Completely satisfied
Figure 3.52: Nature & Ecology ( botanical tours,zoological tours,
bird watching etc)
1.21.8
19.333.2
44.5
0.0 50.0
Not at all satisfiedNot satisfied
NeutralSatisfied
Completely satisfied
Figure 3.53: Spiritual ( medtition, religion, retreat, pilgrimage etc)
1.21.8
19.333.2
44.5
0.0 50.0
Not at all satisfiedNot satisfied
NeutralSatisfied
Completely satisfied
Figure 3.54: Spiritual ( medtition, religion, retreat, pilgrimage etc)
.91.3
30.833.034.0
.0 20.0 40.0
Not at all satisfiedNot satisfied
SatisfiedNeutral
Completely satisfied
Figure 3.55: Hobbies (photography, filming, travel writing etc)
1.22.1
14.733.6
48.4
0.0 50.0 100.0
Not at all satisfiedNot satisfied
NeutralSatisfied
Completely satisfied
Figure 3.56: Guide services quality ( professionalism)
1.2
2.2
16.6
36.7
43.3
0.0 50.0
Not at all satisfied
Not satisfied
Neutral
Satisfied
Completely satisfied
Figure 3.57: Knowledge content of the guide
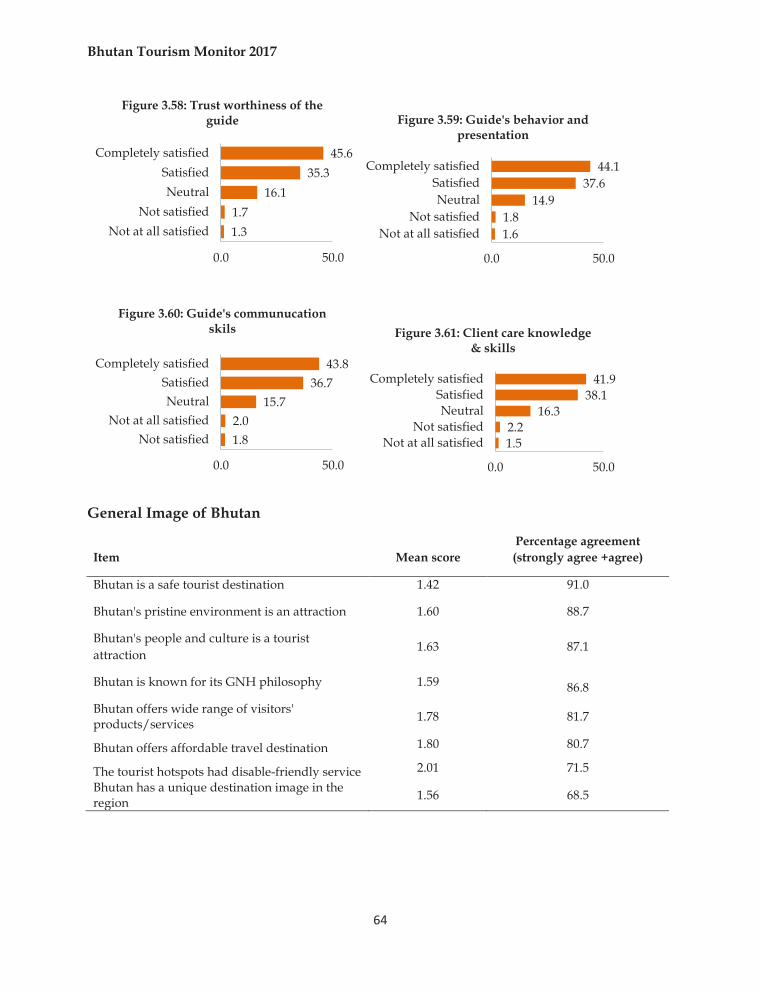
Bhutan Tourism Monitor 2017
64
General Image of Bhutan
Item Mean score Percentage agreement (strongly agree +agree)
Bhutan is a safe tourist destination 1.42 91.0
Bhutan's pristine environment is an attraction 1.60 88.7
Bhutan's people and culture is a tourist attraction
1.63 87.1
Bhutan is known for its GNH philosophy 1.59 86.8
Bhutan offers wide range of visitors' products/services 1.78 81.7
Bhutan offers affordable travel destination 1.80 80.7
The tourist hotspots had disable-friendly service 2.01 71.5 Bhutan has a unique destination image in the region 1.56 68.5
1.31.7
16.135.3
45.6
0.0 50.0
Not at all satisfiedNot satisfied
NeutralSatisfied
Completely satisfied
Figure 3.58: Trust worthiness of the guide
1.61.8
14.937.6
44.1
0.0 50.0
Not at all satisfiedNot satisfied
NeutralSatisfied
Completely satisfied
Figure 3.59: Guide's behavior and presentation
1.82.0
15.736.7
43.8
0.0 50.0
Not satisfiedNot at all satisfied
NeutralSatisfied
Completely satisfied
Figure 3.60: Guide's communucation skils
1.52.2
16.338.1
41.9
0.0 50.0
Not at all satisfiedNot satisfied
NeutralSatisfied
Completely satisfied
Figure 3.61: Client care knowledge & skills
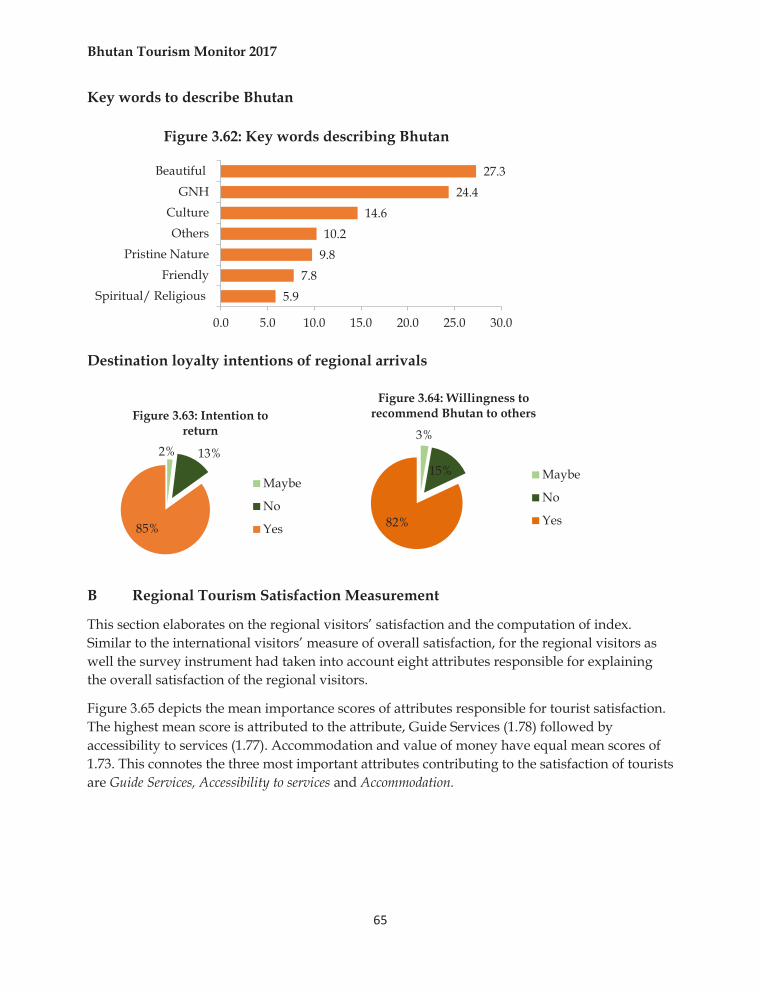
Bhutan Tourism Monitor 2017
65
Key words to describe Bhutan
Destination loyalty intentions of regional arrivals
B Regional Tourism Satisfaction Measurement
This section elaborates on the regional visitors’ satisfaction and the computation of index. Similar to the international visitors’ measure of overall satisfaction, for the regional visitors as well the survey instrument had taken into account eight attributes responsible for explaining the overall satisfaction of the regional visitors.
Figure 3.65 depicts the mean importance scores of attributes responsible for tourist satisfaction. The highest mean score is attributed to the attribute, Guide Services (1.78) followed by accessibility to services (1.77). Accommodation and value of money have equal mean scores of 1.73. This connotes the three most important attributes contributing to the satisfaction of tourists are Guide Services, Accessibility to services and Accommodation.
5.97.8
9.810.2
14.624.4
27.3
0.0 5.0 10.0 15.0 20.0 25.0 30.0
Spiritual/ ReligiousFriendly
Pristine NatureOthers
CultureGNH
Beautiful
Figure 3.62: Key words describing Bhutan
2% 13%
85%
Figure 3.63: Intention to return
Maybe
No
Yes
3%
15%
82%
Figure 3.64: Willingness to recommend Bhutan to others
Maybe
No
Yes
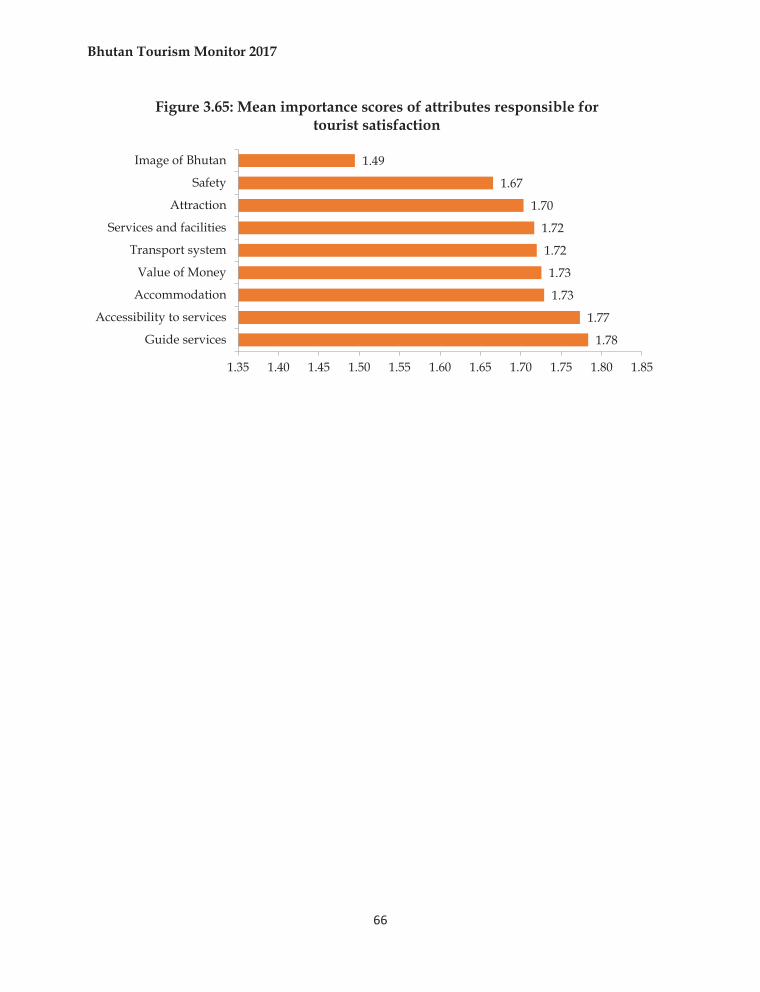
Bhutan Tourism Monitor 2017
66
1.78
1.77
1.73
1.73
1.72
1.72
1.70
1.67
1.49
1.35 1.40 1.45 1.50 1.55 1.60 1.65 1.70 1.75 1.80 1.85
Guide services
Accessibility to services
Accommodation
Value of Money
Transport system
Services and facilities
Attraction
Safety
Image of Bhutan
Figure 3.65: Mean importance scores of attributes responsible for tourist satisfaction
Bhutan Tourism Monitor 2017
67
SECTION 4
TREND ANALYSIS OF TOP TEN SOURCE MAKETS
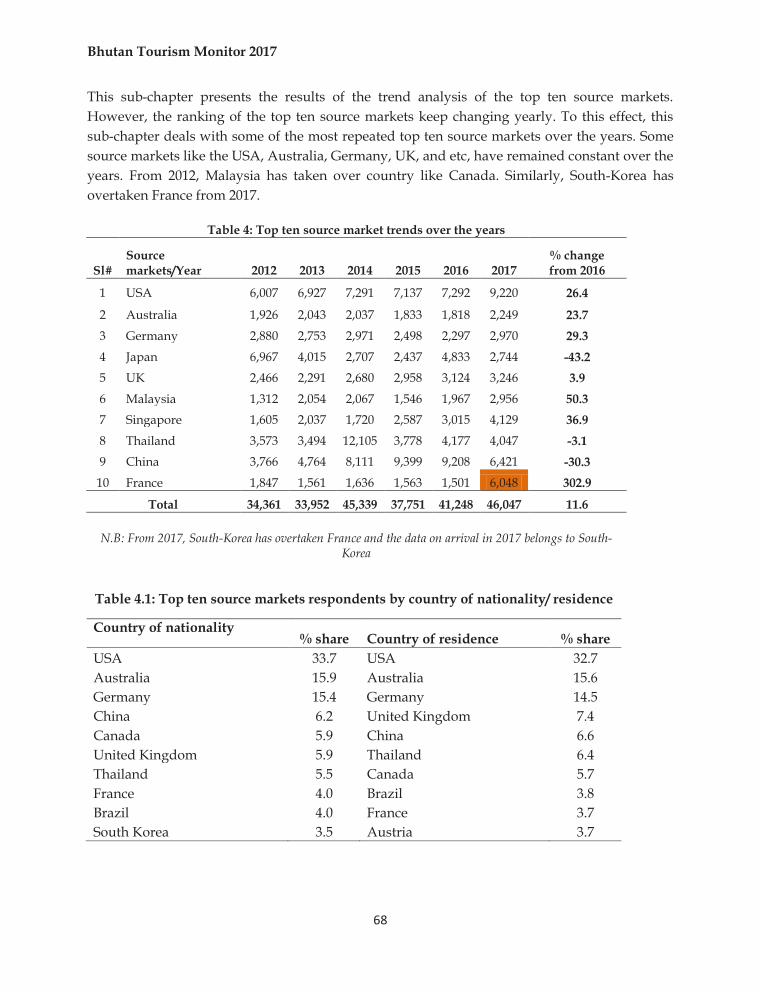
Bhutan Tourism Monitor 2017
68
This sub-chapter presents the results of the trend analysis of the top ten source markets. However, the ranking of the top ten source markets keep changing yearly. To this effect, this sub-chapter deals with some of the most repeated top ten source markets over the years. Some source markets like the USA, Australia, Germany, UK, and etc, have remained constant over the years. From 2012, Malaysia has taken over country like Canada. Similarly, South-Korea has overtaken France from 2017.
Table 4: Top ten source market trends over the years
Sl# Source markets/Year 2012 2013 2014 2015 2016 2017
% change from 2016
1 USA 6,007 6,927 7,291 7,137 7,292 9,220 26.4
2 Australia 1,926 2,043 2,037 1,833 1,818 2,249 23.7 3 Germany 2,880 2,753 2,971 2,498 2,297 2,970 29.3 4 Japan 6,967 4,015 2,707 2,437 4,833 2,744 -43.2 5 UK 2,466 2,291 2,680 2,958 3,124 3,246 3.9 6 Malaysia 1,312 2,054 2,067 1,546 1,967 2,956 50.3 7 Singapore 1,605 2,037 1,720 2,587 3,015 4,129 36.9 8 Thailand 3,573 3,494 12,105 3,778 4,177 4,047 -3.1 9 China 3,766 4,764 8,111 9,399 9,208 6,421 -30.3 10 France 1,847 1,561 1,636 1,563 1,501 6,048 302.9
Total 34,361 33,952 45,339 37,751 41,248 46,047 11.6
N.B: From 2017, South-Korea has overtaken France and the data on arrival in 2017 belongs to South-Korea
Table 4.1: Top ten source markets respondents by country of nationality/ residence
Country of nationality % share Country of residence % share
USA 33.7 USA 32.7 Australia 15.9 Australia 15.6 Germany 15.4 Germany 14.5 China 6.2 United Kingdom 7.4 Canada 5.9 China 6.6 United Kingdom 5.9 Thailand 6.4 Thailand 5.5 Canada 5.7 France 4.0 Brazil 3.8 Brazil 4.0 France 3.7 South Korea 3.5 Austria 3.7
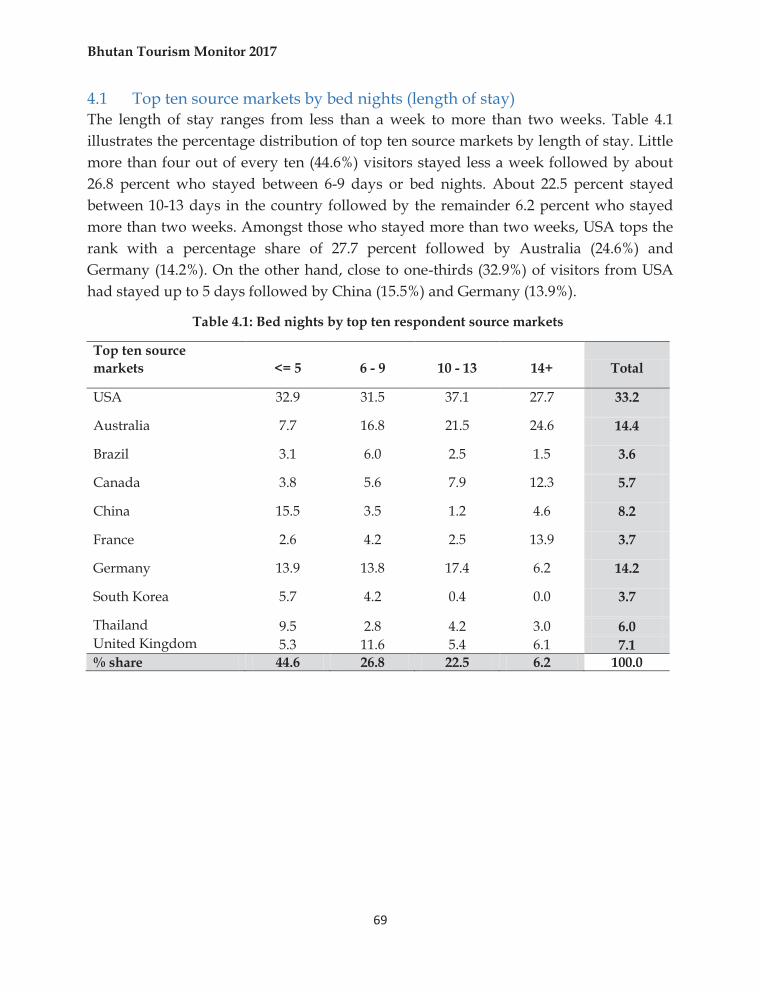
Bhutan Tourism Monitor 2017
69
4.1 Top ten source markets by bed nights (length of stay) The length of stay ranges from less than a week to more than two weeks. Table 4.1 illustrates the percentage distribution of top ten source markets by length of stay. Little more than four out of every ten (44.6%) visitors stayed less a week followed by about 26.8 percent who stayed between 6-9 days or bed nights. About 22.5 percent stayed between 10-13 days in the country followed by the remainder 6.2 percent who stayed more than two weeks. Amongst those who stayed more than two weeks, USA tops the rank with a percentage share of 27.7 percent followed by Australia (24.6%) and Germany (14.2%). On the other hand, close to one-thirds (32.9%) of visitors from USA had stayed up to 5 days followed by China (15.5%) and Germany (13.9%).
Table 4.1: Bed nights by top ten respondent source markets
Top ten source markets <= 5 6 - 9 10 - 13 14+ Total
USA 32.9 31.5 37.1 27.7 33.2
Australia 7.7 16.8 21.5 24.6 14.4
Brazil 3.1 6.0 2.5 1.5 3.6
Canada 3.8 5.6 7.9 12.3 5.7
China 15.5 3.5 1.2 4.6 8.2
France 2.6 4.2 2.5 13.9 3.7
Germany 13.9 13.8 17.4 6.2 14.2
South Korea 5.7 4.2 0.4 0.0 3.7
Thailand 9.5 2.8 4.2 3.0 6.0 United Kingdom 5.3 11.6 5.4 6.1 7.1 % share 44.6 26.8 22.5 6.2 100.0
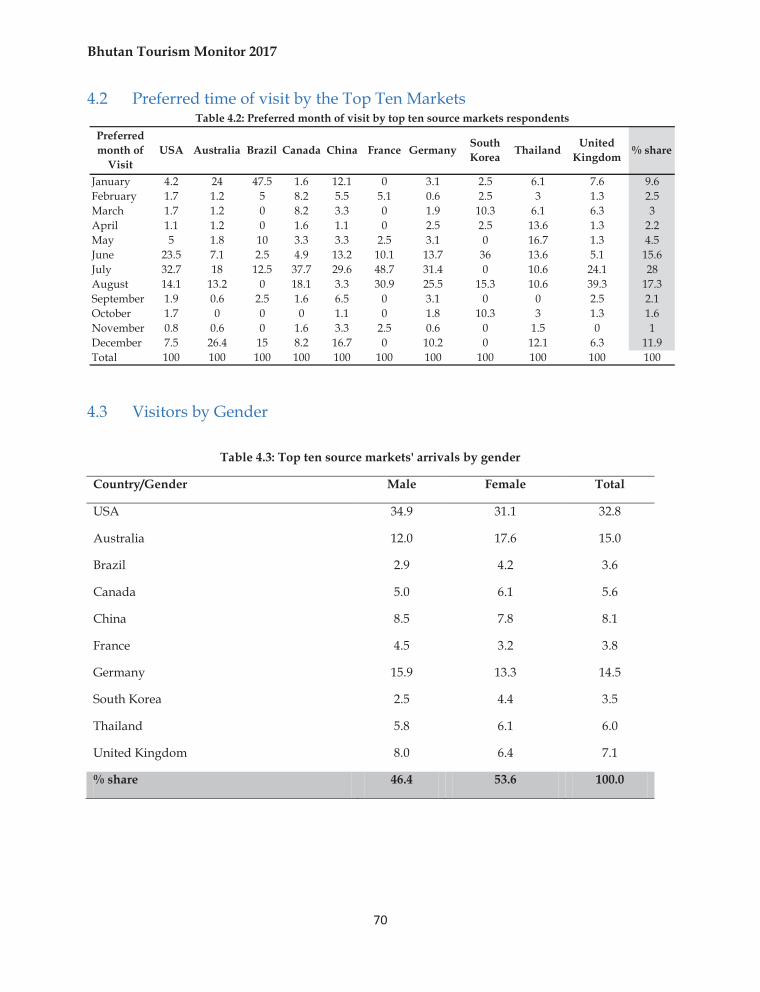
Bhutan Tourism Monitor 2017
70
4.2 Preferred time of visit by the Top Ten Markets
4.3 Visitors by Gender
Table 4.3: Top ten source markets' arrivals by gender
Country/Gender Male Female Total
USA 34.9 31.1 32.8
Australia 12.0 17.6 15.0
Brazil 2.9 4.2 3.6
Canada 5.0 6.1 5.6
China 8.5 7.8 8.1
France 4.5 3.2 3.8
Germany 15.9 13.3 14.5
South Korea 2.5 4.4 3.5
Thailand 5.8 6.1 6.0
United Kingdom 8.0 6.4 7.1
% share 46.4 53.6 100.0
January 4.2 24 47.5 1.6 12.1 0 3.1 2.5 6.1 7.6 9.6February 1.7 1.2 5 8.2 5.5 5.1 0.6 2.5 3 1.3 2.5March 1.7 1.2 0 8.2 3.3 0 1.9 10.3 6.1 6.3 3April 1.1 1.2 0 1.6 1.1 0 2.5 2.5 13.6 1.3 2.2May 5 1.8 10 3.3 3.3 2.5 3.1 0 16.7 1.3 4.5June 23.5 7.1 2.5 4.9 13.2 10.1 13.7 36 13.6 5.1 15.6July 32.7 18 12.5 37.7 29.6 48.7 31.4 0 10.6 24.1 28August 14.1 13.2 0 18.1 3.3 30.9 25.5 15.3 10.6 39.3 17.3September 1.9 0.6 2.5 1.6 6.5 0 3.1 0 0 2.5 2.1October 1.7 0 0 0 1.1 0 1.8 10.3 3 1.3 1.6November 0.8 0.6 0 1.6 3.3 2.5 0.6 0 1.5 0 1December 7.5 26.4 15 8.2 16.7 0 10.2 0 12.1 6.3 11.9Total 100 100 100 100 100 100 100 100 100 100 100
Thailand United Kingdom % share
Table 4.2: Preferred month of visit by top ten source markets respondentsPreferred month of
VisitUSA Australia Brazil Canada China France Germany South
Korea
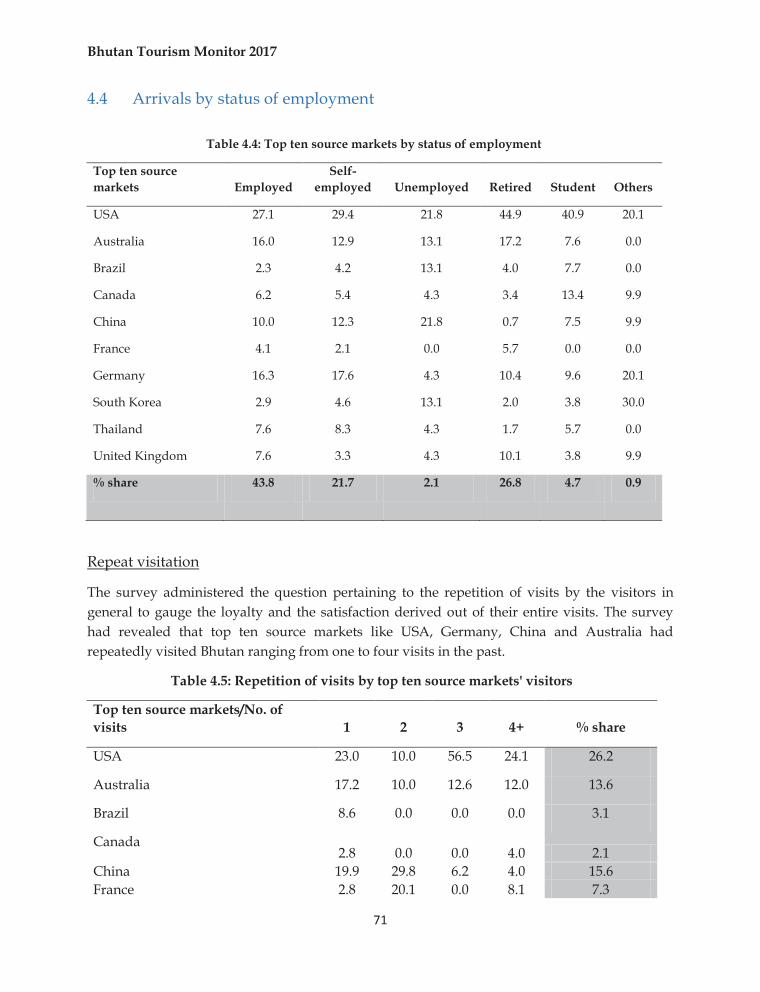
Bhutan Tourism Monitor 2017
71
4.4 Arrivals by status of employment
Table 4.4: Top ten source markets by status of employment
Top ten source markets Employed
Self-employed Unemployed Retired Student Others
USA 27.1 29.4 21.8 44.9 40.9 20.1
Australia 16.0 12.9 13.1 17.2 7.6 0.0
Brazil 2.3 4.2 13.1 4.0 7.7 0.0
Canada 6.2 5.4 4.3 3.4 13.4 9.9
China 10.0 12.3 21.8 0.7 7.5 9.9
France 4.1 2.1 0.0 5.7 0.0 0.0
Germany 16.3 17.6 4.3 10.4 9.6 20.1
South Korea 2.9 4.6 13.1 2.0 3.8 30.0
Thailand 7.6 8.3 4.3 1.7 5.7 0.0
United Kingdom 7.6 3.3 4.3 10.1 3.8 9.9
% share 43.8 21.7 2.1 26.8 4.7 0.9
Repeat visitation
The survey administered the question pertaining to the repetition of visits by the visitors in general to gauge the loyalty and the satisfaction derived out of their entire visits. The survey had revealed that top ten source markets like USA, Germany, China and Australia had repeatedly visited Bhutan ranging from one to four visits in the past.
Table 4.5: Repetition of visits by top ten source markets' visitors
Top ten source markets/No. of visits 1 2 3 4+ % share
USA 23.0 10.0 56.5 24.1 26.2
Australia 17.2 10.0 12.6 12.0 13.6
Brazil 8.6 0.0 0.0 0.0 3.1
Canada 2.8 0.0 0.0 4.0 2.1
China 19.9 29.8 6.2 4.0 15.6 France 2.8 20.1 0.0 8.1 7.3
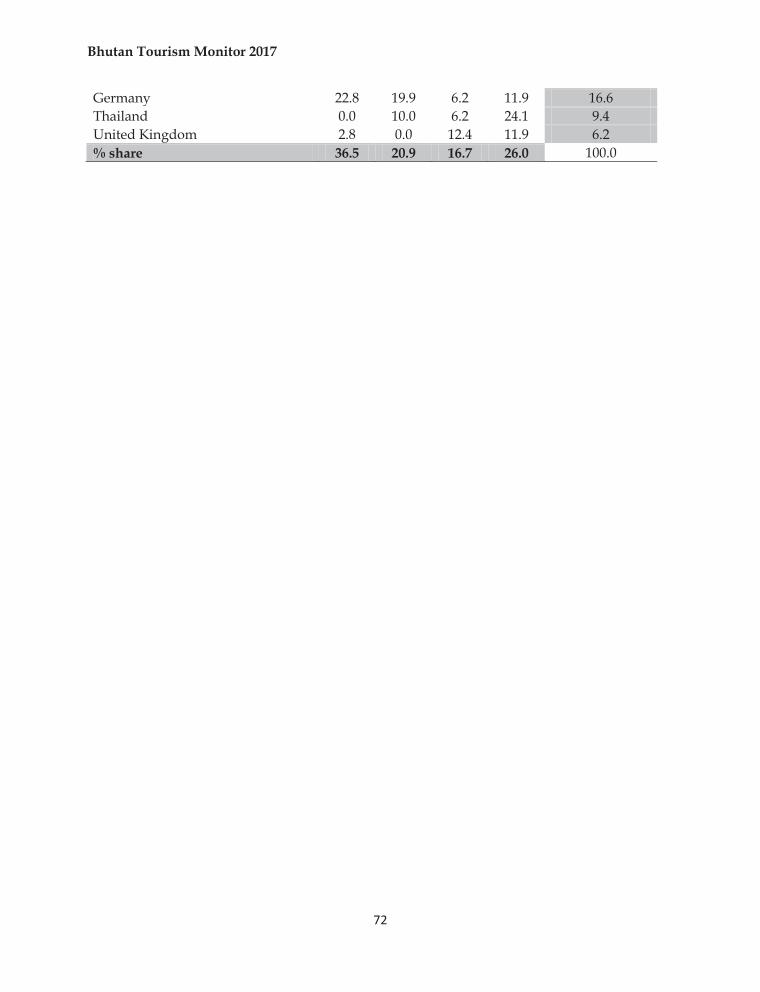
Bhutan Tourism Monitor 2017
72
Germany 22.8 19.9 6.2 11.9 16.6 Thailand 0.0 10.0 6.2 24.1 9.4 United Kingdom 2.8 0.0 12.4 11.9 6.2 % share 36.5 20.9 16.7 26.0 100.0
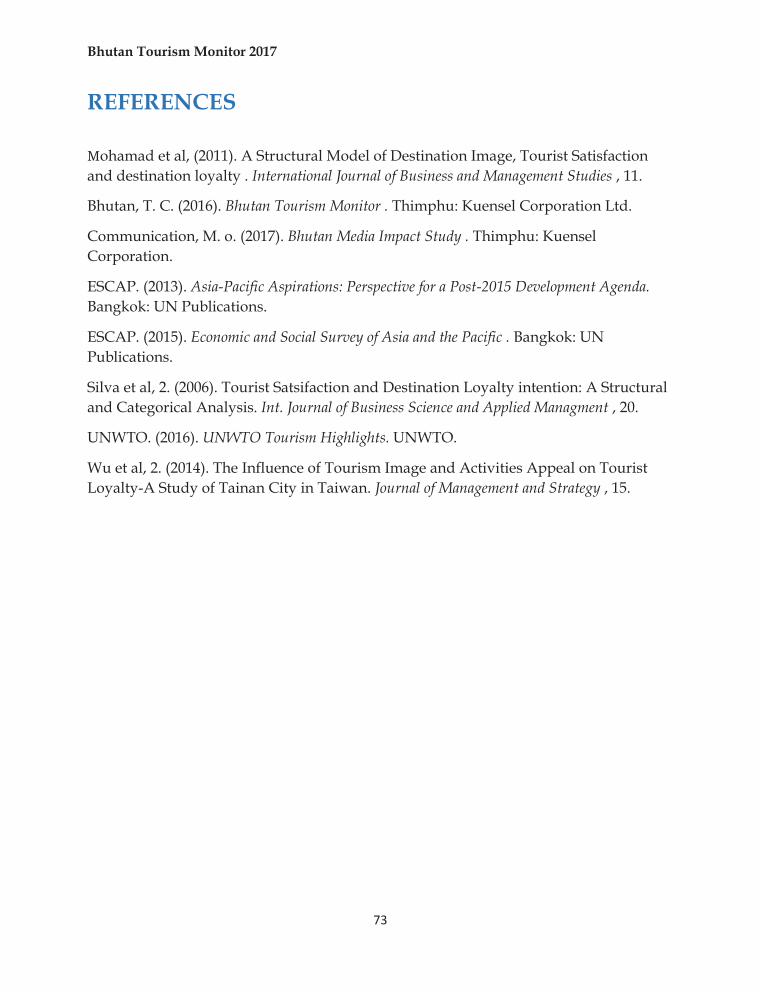
Bhutan Tourism Monitor 2017
73
REFERENCES
Mohamad et al, (2011). A Structural Model of Destination Image, Tourist Satisfaction and destination loyalty . International Journal of Business and Management Studies , 11.
Bhutan, T. C. (2016). Bhutan Tourism Monitor . Thimphu: Kuensel Corporation Ltd.
Communication, M. o. (2017). Bhutan Media Impact Study . Thimphu: Kuensel Corporation.
ESCAP. (2013). Asia-Pacific Aspirations: Perspective for a Post-2015 Development Agenda. Bangkok: UN Publications.
ESCAP. (2015). Economic and Social Survey of Asia and the Pacific . Bangkok: UN Publications.
Silva et al, 2. (2006). Tourist Satsifaction and Destination Loyalty intention: A Structural and Categorical Analysis. Int. Journal of Business Science and Applied Managment , 20.
UNWTO. (2016). UNWTO Tourism Highlights. UNWTO.
Wu et al, 2. (2014). The Influence of Tourism Image and Activities Appeal on Tourist Loyalty-A Study of Tainan City in Taiwan. Journal of Management and Strategy , 15.

Bhutan Tourism Monitor 2017
74
Tourism Council of Bhutan
P.O Box 126, GPO
Thimphu Bhutan
Tel: +975-2-32325/323252
Fax: +975-2-343695
Email: [email protected]
Facebook.com/destinationbhutan
twitter@toursimbhutan
www.tourism.gov.bt/ www.bhutan.travel


![NAME OF THE PROJECT: [DEVELOPMENT OF TOURISM …...NAME OF THE PROJECT: [DEVELOPMENT OF TOURISM RELATED INFRASTRUCTURE] Letter of Invitation The [Tourism Council of Bhutan] has a budget](https://img.pdfslide.us/doc/110x75/5e9be2731b419f124916b9be/name-of-the-project-development-of-tourism-name-of-the-project-development.jpg)